High Genetic Diversity and Low Differentiation in Michelia shiluensis, an Endangered Magnolia Species in South China
by
 ,
,
Yanwen Deng
1,2 ,
,
Tingting Liu
1,2, 
Yuqing Xie
1,2,
Yaqing Wei
3,4,
Zicai Xie
2,
Youhai Shi
3,4,* and
Xiaomei Deng
1,2,* 1
Guangdong Key Laboratory for Innovative Development and Utilization of Forest Plant Germplasm, Guangzhou 510642, China
2
College of Forestry and Landscape Architecture, South China Agricultural University, Guangzhou 510642, China
3
Key Laboratory of Germplasm Resources Biology of Tropical Special Ornamental Plants of Hainan Province, Haikou 570228, China
4
College of Forestry, Hainan University, Haikou 570228, China
*
Authors to whom correspondence should be addressed.
Forests 2020, 11(4), 469; https://doi.org/10.3390/f11040469
Submission received: 26 March 2020
/
Revised: 17 April 2020
/
Accepted: 17 April 2020
/
Published: 21 April 2020
(This article belongs to the Special Issue Genetic and Phenotypic Variation in Tree Crops Biodiversity)
Abstract
:Research Highlights: This study is the first to examine the genetic diversity of Michelia shiluensis (Magnoliaceae). High genetic diversity and low differentiation were detected in this species. Based on these results, we discuss feasible protection measures to provide a basis for the conservation and utilization of M. shiluensis. Background and Objectives: Michelia shiluensis is distributed in Hainan and Guangdong province, China. Due to human disturbance, the population has decreased sharply, and there is thus an urgent need to evaluate genetic variation within this species in order to identify an optimal conservation strategy. Materials and Methods: In this study, we used eight nuclear single sequence repeat (nSSR) markers and two chloroplast DNA (cpDNA) markers to assess the genetic diversity, population structure, and dynamics of 78 samples collected from six populations. Results: The results showed that the average observed heterozygosity (Ho), expected heterozygosity (He), and percentage of polymorphic loci (PPL) from nSSR markers in each population of M. shiluensis were 0.686, 0.718, and 97.92%, respectively. For cpDNA markers, the overall haplotype diversity (Hd) was 0.674, and the nucleotide diversity was 0.220. Analysis of markers showed that the genetic variation between populations was much lower based on nSSR than on cpDNA (10.18% and 77.56%, respectively, based on an analysis of molecular variance (AMOVA)). Analysis of the population structure based on the two markers shows that one of the populations (DL) is very different from the other five. Conclusions: High genetic diversity and low population differentiation of M. shiluensis might be the result of rich ancestral genetic variation. The current decline in population may therefore be due to human disturbance rather than to inbreeding or genetic drift. Management and conservation strategies should focus on maintaining the genetic diversity in situ, and on the cultivation of seedlings ex-situ for transplanting back to their original habitat.
1. Introduction
Habitat destruction and environmental pollution caused by human disturbance [1] have limited the distribution and thus promoted the spatial isolation of many wildlife species, threatening their reproduction and development [2,3]. In addition to human disturbance, genetic factors can also represent threats to wild species [4]; such processes as mating systems, genetic drift, gene flow, evolution, and life history greatly affect the genetic diversity and spatial structure of plant populations [5,6,7,8,9]. Under the combined effects of human and genetic factors, the gene flow in natural populations is reduced in the short term, resulting in increased genetic differentiation among populations and genetic drift effects within populations, which together reduce genetic variation [10,11]. Over extended temporal scales, low genetic variation coupled with high differentiation put species at risk of extinction by reducing their evolutionary potential [12]. In order to maintain the adaptability and long-term survival ability of species [13,14,15], it is necessary to understand the genetic diversity and population structure across a given species’ distribution area [16], and thereby develop scientifically grounded conservation strategies [17].
Michelia shiluensis (Magnoliaceae) is an evergreen tree that has been placed on the Red List of Magnoliaceae, which identifies magnolia species that are at risk of extinction throughout the world [18]. This tree is scattered throughout Hainan [19] and southern Guangdong provinces [20], and is characterized by a straight tree shape, bright leaves, elegant and aromatic flowers, and dense wood structure [21,22]. As a desirable ornamental garden plant and an important timber tree species, the wild resources of M. shiluensis have been severely misappropriated and plundered. In addition, the development of scenic tourism in recent years has caused damage to habitats, and thus seriously threatened the natural survival and reproduction of M. shiluensis [23]. Therefore, there is an urgent need to understand the genetic diversity and population structure of M. shiluensis in order to plan conservation actions on its behalf.
Molecular markers have been widely used to study magnolia species. Simple sequence repeat (SSR) markers, also known as microsatellite DNA, are widely distributed throughout the nuclear genome [24]. These markers can display high polymorphism and reproducibility [25], reflect gene flow from seed and pollen [26], and depict fine genetic structure [27]. Unlike the bi-parentally inherited nuclear genome, the chloroplast genome is inherited exclusively from the maternal line in most angiosperms [28,29], and is therefore widely used as a marker for inferring species phylogeography, origin, and historical dynamics [30,31,32]. The combined analysis of the two markers can be used to comprehensively assess the importance of each population and provide a theoretical basis for conservation strategies [33].
In this study, we used eight pairs of nuclear single sequence repeat (nSSR) loci and two cpDNA gene spacers to study the genetic diversity and population structure of 78 M. shiluensis individuals from six populations. The purpose of this study was to: (1) identify genetic diversity at both population and species levels, (2) explore the correlation between genetic diversity and population size, (3) determine the level of population differentiation and dynamics, and (4) discuss possible effective strategies for protection. This research will help the development of conservation and breeding plans for M. shiluensis.
2. Materials and Methods
2.1. Plant Material and DNA Extraction
Based on a previous investigation and information from the National Plant Specimen Resource Center (NPSRC), we identified seven possible wild populations for sampling: one located in Guangdong province (YC(YangChun E’HuangZhang Nature Reserve), and the other six in Hainan province (DL (DiaoLuoShan Nature Reserve), BS (BaiSha County), YG (YingGeLing Nature Reserve), WZ (WuZhiShan Nature Reserve), CJ (ChangJiang County), and WN (WanNing County)). However, we failed to locate any individuals from the WN population. Thus, we sampled 78 individuals out of six populations (DL, BS, YG, WZ, CJ, and YC) from two provinces (Table S1). It should be noted that we were unable to locate seedlings from any of the populations except for DL. Therefore, we sampled all individuals from the BS, YG, WZ, CJ, and YC populations, and randomly collected samples from DL (at least 15 m between each individual). Leaves from each individual were placed into Ziploc bags sealed with silica gel, then brought back to our laboratory and stored at 4 ℃ until DNA extraction.
Total genomic DNA was extracted from dried leaves following the supplied protocol in the Plant Genomic DNA Kit (DP305, TianGen Biotech Co., LTD, Beijing, China). The NanoDropTM 2000 Spectrophotometers (Thermo Scientific, Waltham, MA, USA) were used to test the concentration of extracted DNA solution, and the DNA work solution was prepared at an approximate concentration of 10 ng/μL.
2.2. Primers and Fragment Amplification
In total, 117 nSSR primer pairs were chosen from previous studies on Magnoliaceae; all were screened using eight samples from six populations. Screening revealed 16 pairs of primers that were able to amplify specific bands from selected samples. Among these, eight pairs showed high peak fluorescence signals and rich polymorphism in genotyping results. A total of 10 pairs of universal cpDNA primers were selected for screening; only two displayed rich polymorphisms in sequencing results. All primers (Table S2) were manufactured by Tsingke (Tsingke Biotech Co., Beijing, China).
Two PCR procedures were conducted for nSSR amplification, following the method of Schuelke (2000) [34]. The final volume used in the first PCR cycle was 10 μL; this contained 1 μL of genomic DNA (about 10 ng), 5 μL of 2X Es Taq Master Mix (Cwbiotech, Beijing, China), 1 μL each of forward and reverse primers, and ddH2O filled in the remainder. In the second PCR cycle, 5 μL of PCR product from the first cycle was used as a template in the final 30 μL volume, which contained 15 μL of 2X Es Taq Master Mix (Cwbiotech, Beijing, China), 3 μL fluorescent dye primer, and ddH2O filling in the remainder.
The DNA amplification protocol for nSSR was as follows: 5 min at 94 ℃ for denaturation, followed by cycles of 30 s at 94 ℃, 30 s at specific Ta (Table S2), and 30 s at 72 ℃, with a final extension step of 72 ℃ for 7 min. Twenty cycles were conducted for the first PCR procedure, and 35 for the second. The SSR-PCR products were run on the ABI 3730 DNA Analyzer (Biosystems, Foster City, CA, USA), using GS-500 as an internal size standard. Allele size was assessed using GeneMarker 2.2.0 [35]. For cpDNA amplification, cycling parameters were set as follows: initial denaturation at 94 °C for 3 min, followed by 35 cycles of denaturation at 94 °C for 1 min, annealing for 35 s at 56 ℃, extension at 72 °C for 1 min, and a final extension at 72 °C for 5 min. Products of cpDNA amplification were sequenced on the ABI 3730 xl DNA Analyzer (Biosystems, Foster City, CA, USA).
2.3. Data Analysis
2.3.1. nSSR Analysis
Genetic diversity parameters were generated using GeneAlEx 6.5.2 [36]. These were: the number of observed alleles (Na), number of effective alleles (Ne), the observed (Ho) and expected (He) heterozygosity, the Shannon diversity index (I), the percentage of polymorphic loci (PPL), and the private alleles (Np). A Mantel test was also carried out in GenAlEx 6.5.2 [36]. PowerMarker v3.25 [37] was used to calculate polymorphism information content (PIC) and linkage disequilibrium (LD). Population genetic structure analysis using mixed models and allele-dependent frequency models was conducted using STRUCTURE 2.3.4 [38]. The parameters in STRUCTURE were set as follows: K = 1–6, Number of Interaction = 10, Burn-in period = 1,000,000, Markov chain Monte Carlo (MCMC) = 200,000. The results from STRUCTURE were compressed and uploaded to Structure Harvester online service; from this, we obtained the most likely K value (ΔK) and L value (K) using Evanno’s method [39]. Optional clustering was summarized using CLUMPP v1.1.2 [40]. The neighbor-joining (NJ) tree clustering algorithm was conducted using Mega 7 [41] and edited on iTOL [42]. Additionally, gene flow between populations (Nm), F-statistics for inbreeding coefficient (FIS), global inbreeding coefficient (FIT), and the coefficient of genetic differentiation (FST) were generated using Popgene 32 [43]. Arelquin v3.5 [44] was used to calculate the pairwise FST for each population and for analysis of molecular variance (AMOVA).
2.3.2. cpDNA Analysis
Sequencing results were checked; misidentified results were manually corrected using BioEdit 7.0.5.3 [45]. Calculation of haplotype diversity (Hd) and nucleotide diversity (Pi), derivation of polymorphic loci, and a mismatch analysis were performed using DnaSP 6.12.03 [46]. The haplotype network was visualized using TCS 1.21 [47]. Sequence alignment shearing and Maximum Likelihood (ML) mapping were performed using MEGA 7 [41] with Michelia odora as an outgroup. We used PERMUT 1.2.1 [48] to calculate HS, HT, GST, and NST, along with their P values. Arlequin 3.5.2.2 [44] was used to calculate the pairwise FST, AMOVA, and neutrality tests. A Mantel test was conducted using GenAlEx 6.502 [36].
3. Results
3.1. Genetic Diversity and Population Structure from nSSR Markers
A total of 115 alleles were detected at the eight loci (Table S3). The Na at each locus ranged from 7 to 21, with an average of 14.375 per loci. The average I was 1.506; the lowest was 0.820 (WS18) and the highest was 1.767 (LT116). The PIC values ranged from 0.531 to 0.909, with an average of 0.809 per locus. The Ho values ranged from 0.482 (WS18) to 0.780 (MA3-7), with an average value of 0.686. Four of the eight loci displayed higher He than Ho, with the highest at LT116 (0.797) and the lowest at WS18 (0.445), and an average of 0.718. There was no evidence of significant LD. The average estimated FIS, FIT, FST, and Nm were 0.042, 0.176, 0.139, and 1.546, respectively (Table S4).
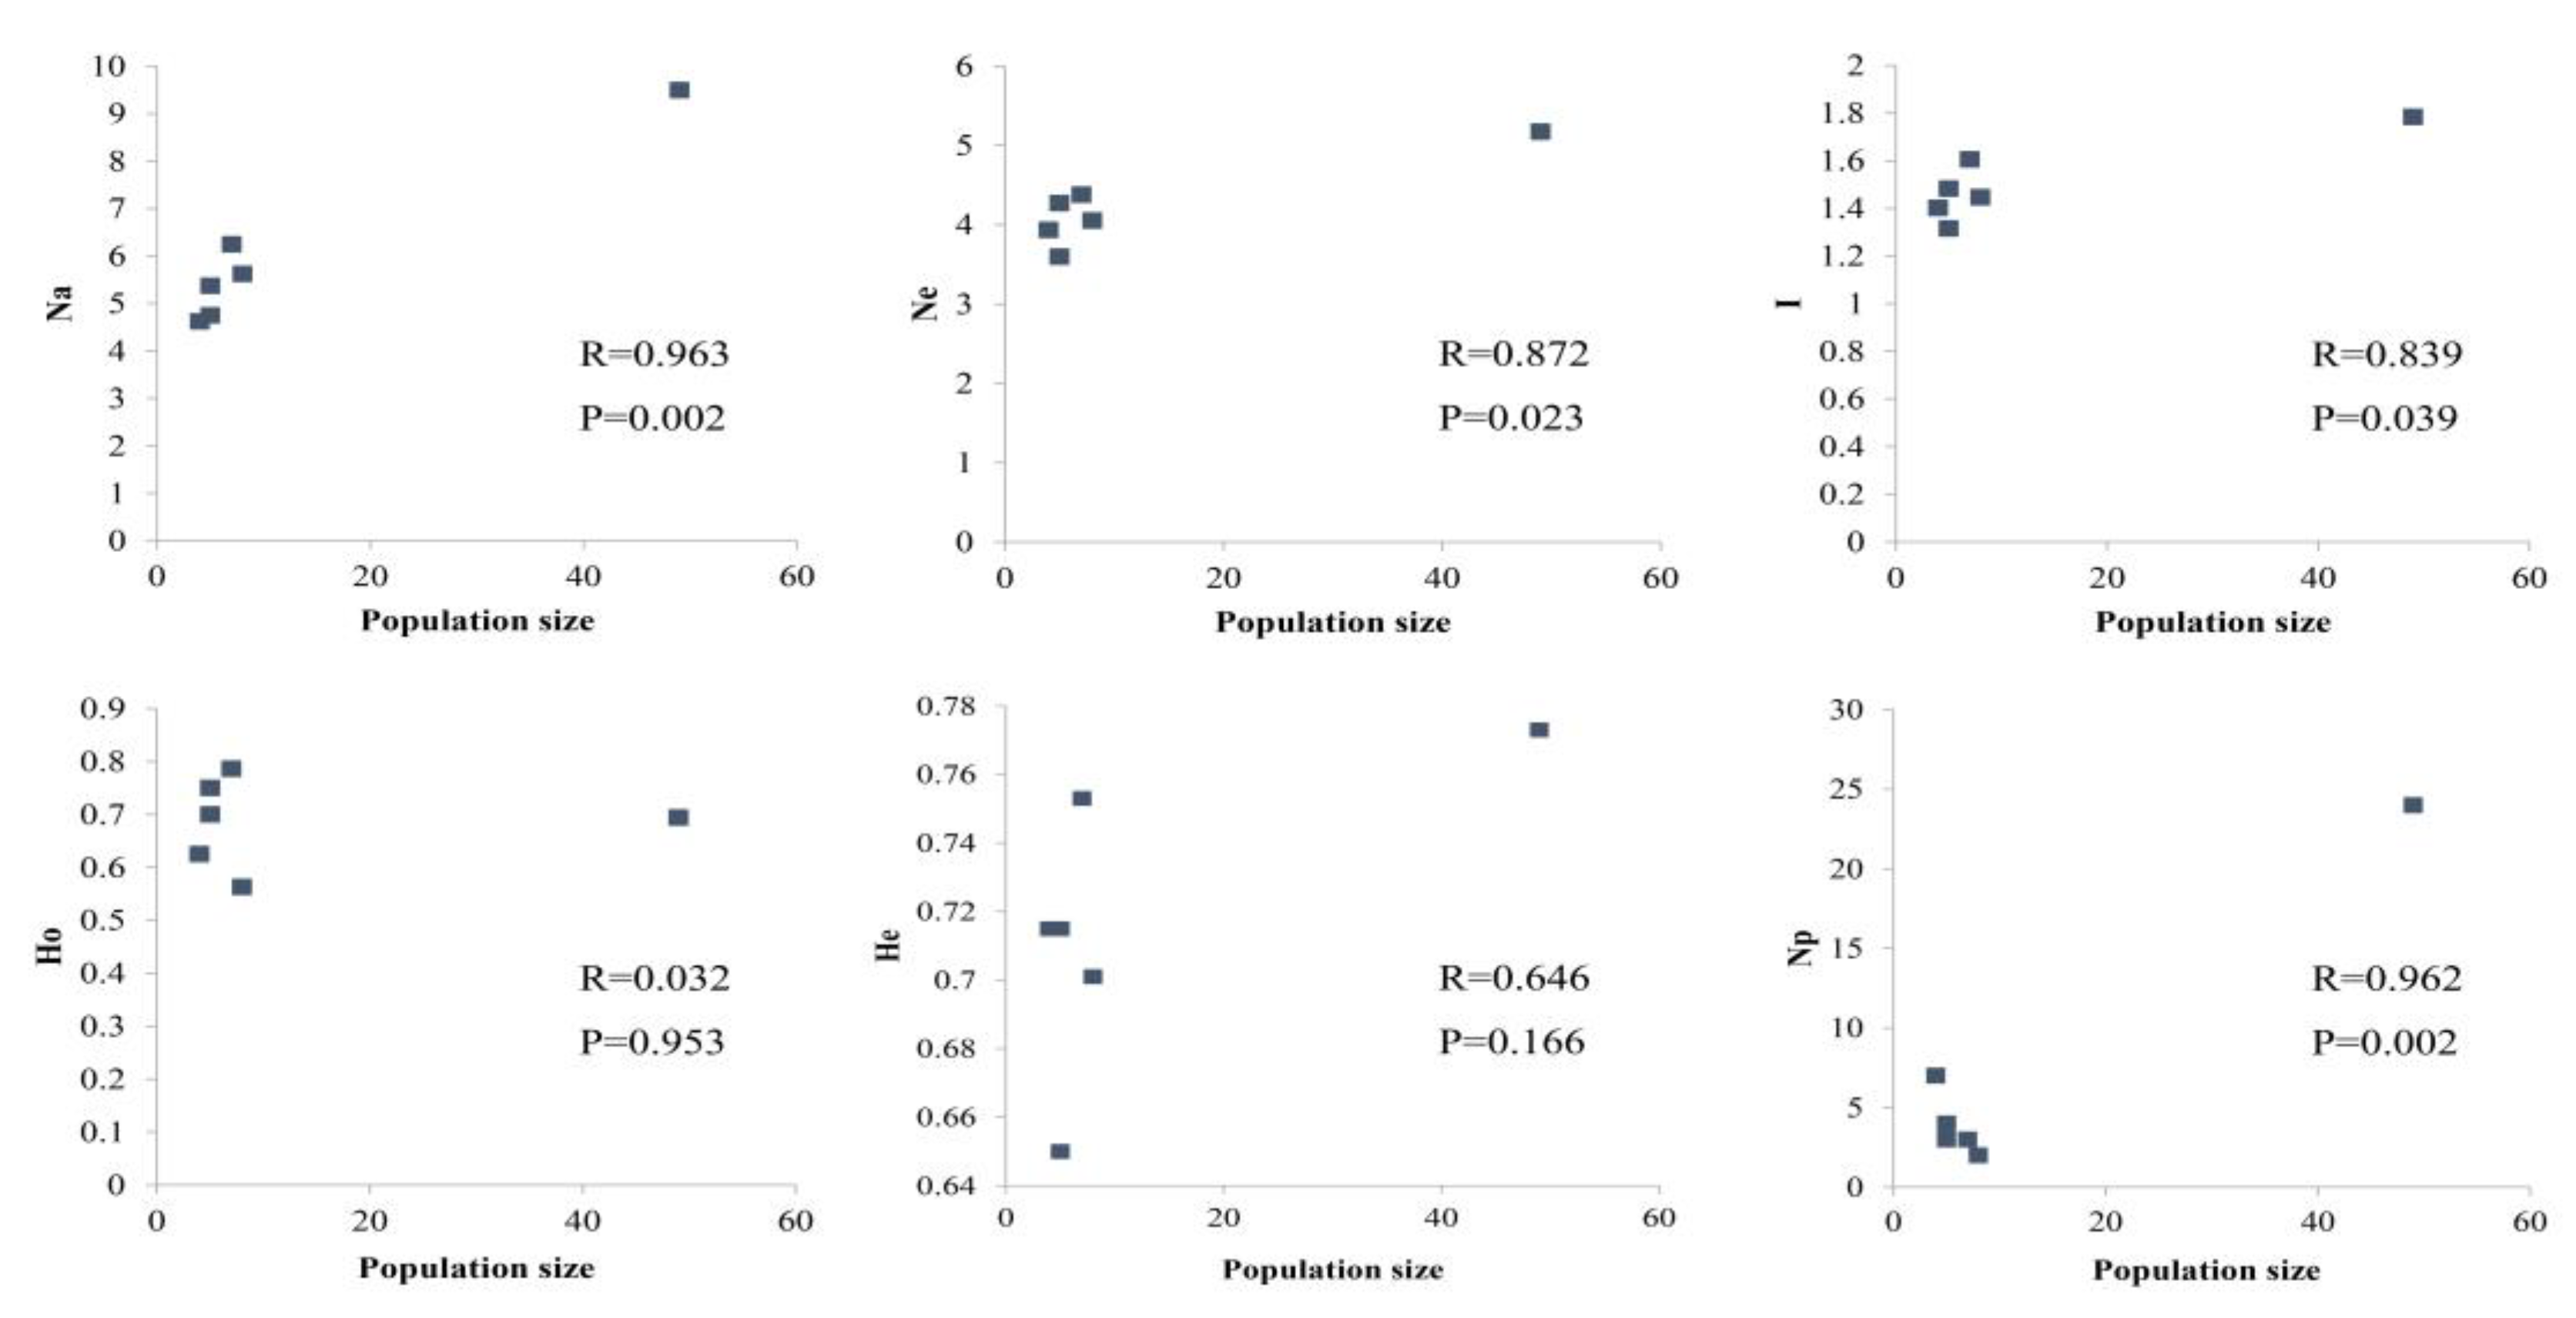
At the population level, the average Na, Ne, I, Ho, and He were 6.021 (4.625–9.500), 4.236 (3.598–5.174), 1.506 (1.316–1.784), 0.686 (0.563–0.786), and 0.718 (0.650–0.773), respectively (Table 1). The PPL in each population ranged from 87.50% to 100%, with an average of 97.92%. The PPL of the WZ accession was 87.50, whereas those of all other populations were 100. All populations contained private alleles, with 24 found in DL, followed by seven in YC, four in YG, three each in BS and WZ, and two in CJ. The inbreeding coefficient (FIS) for CJ was 0.207; those for all of the other populations were less than 0.1. This result indicates that intense breeding had occurred within the CJ population. An examination of the correlation between population genetic diversity parameters and population size showed that Na, Ne, I, and Np were significantly related to the population size; however, Ho and He were not related (Figure 1). At the species level, Na, Ne, I, Ho, He were 14.375, 7.019, 2.120, 0.689, and 0.825, respectively. These parameters show high genetic diversity in M. shiluensis at both the species and population levels.
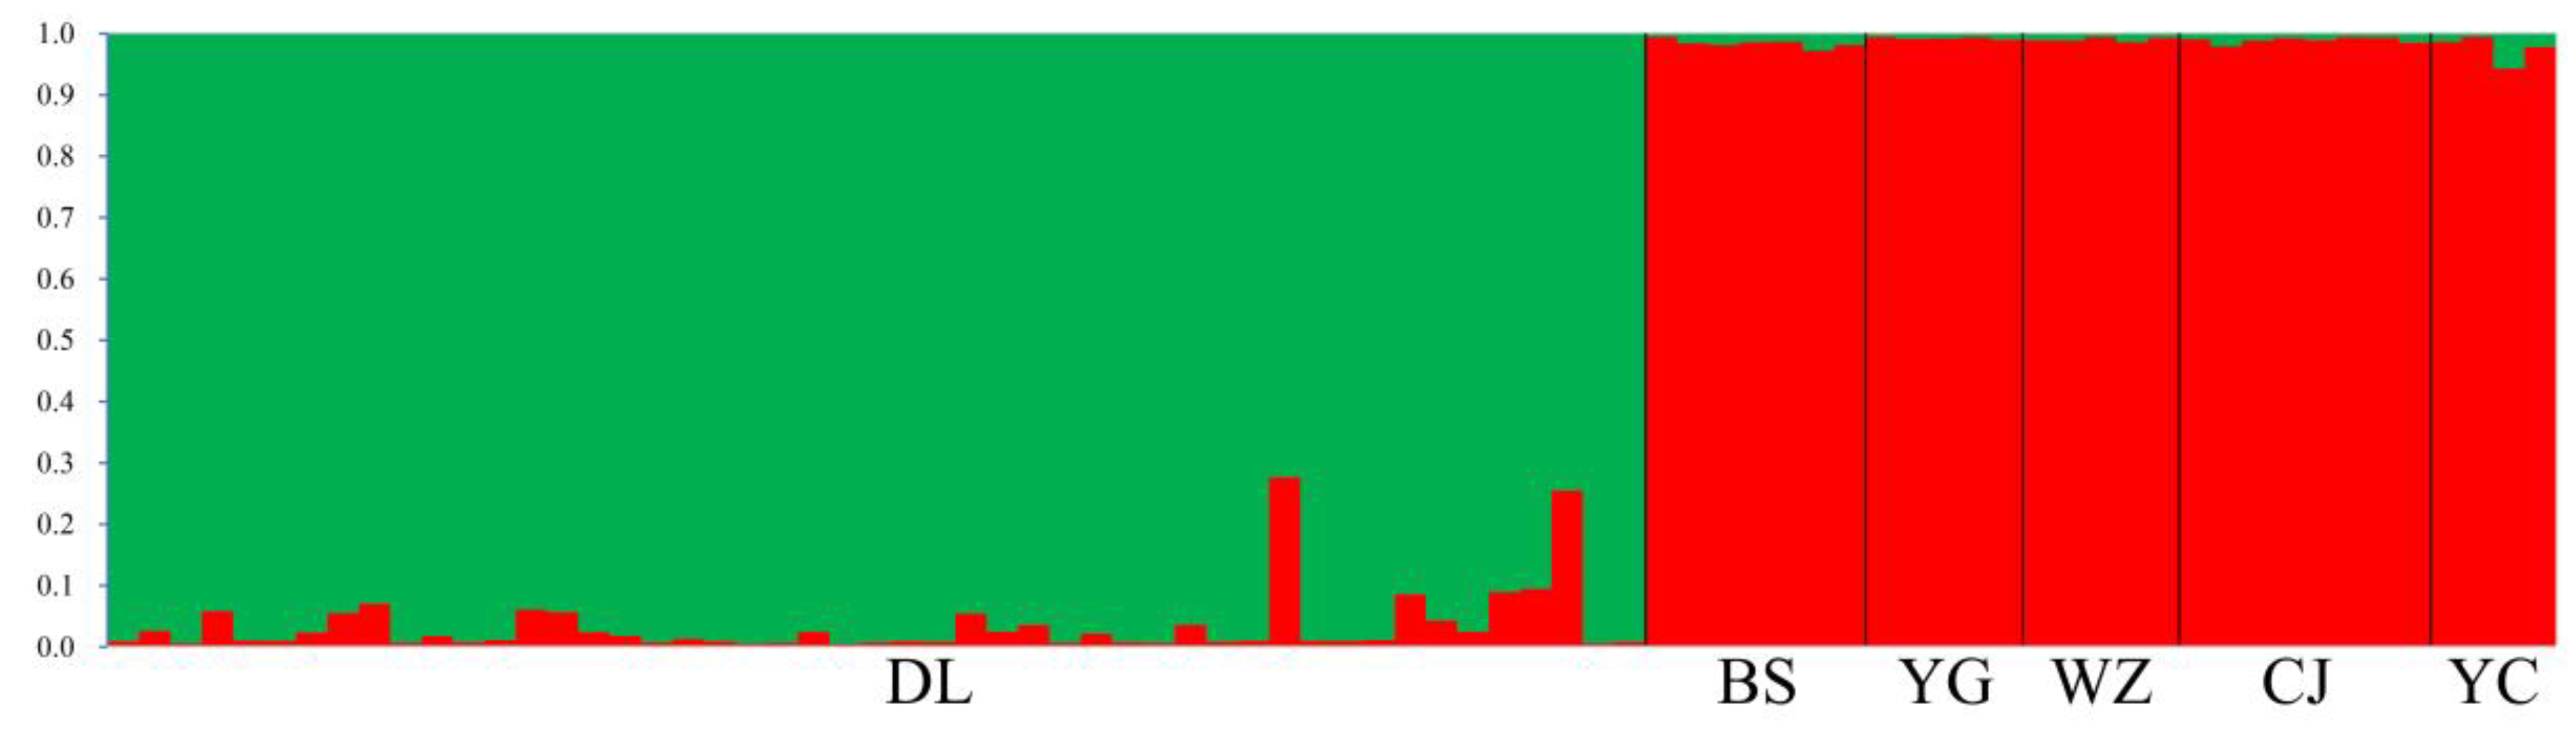
Analysis of nSSR genetic structure shows a △ K of 167.38 for K = 2. The results show that all 78 individuals comprised two clusters (Figure 2), which separate individuals from DL from the other populations; there was evidence of minor genetic mixing between DL and other populations.
The AMOVA analysis of the M. shiluensis populations revealed a high proportion of variance within the population (89.92%, p < 0.001), and a lower proportion of variance across populations (10.18%, p < 0.001; Table 2).
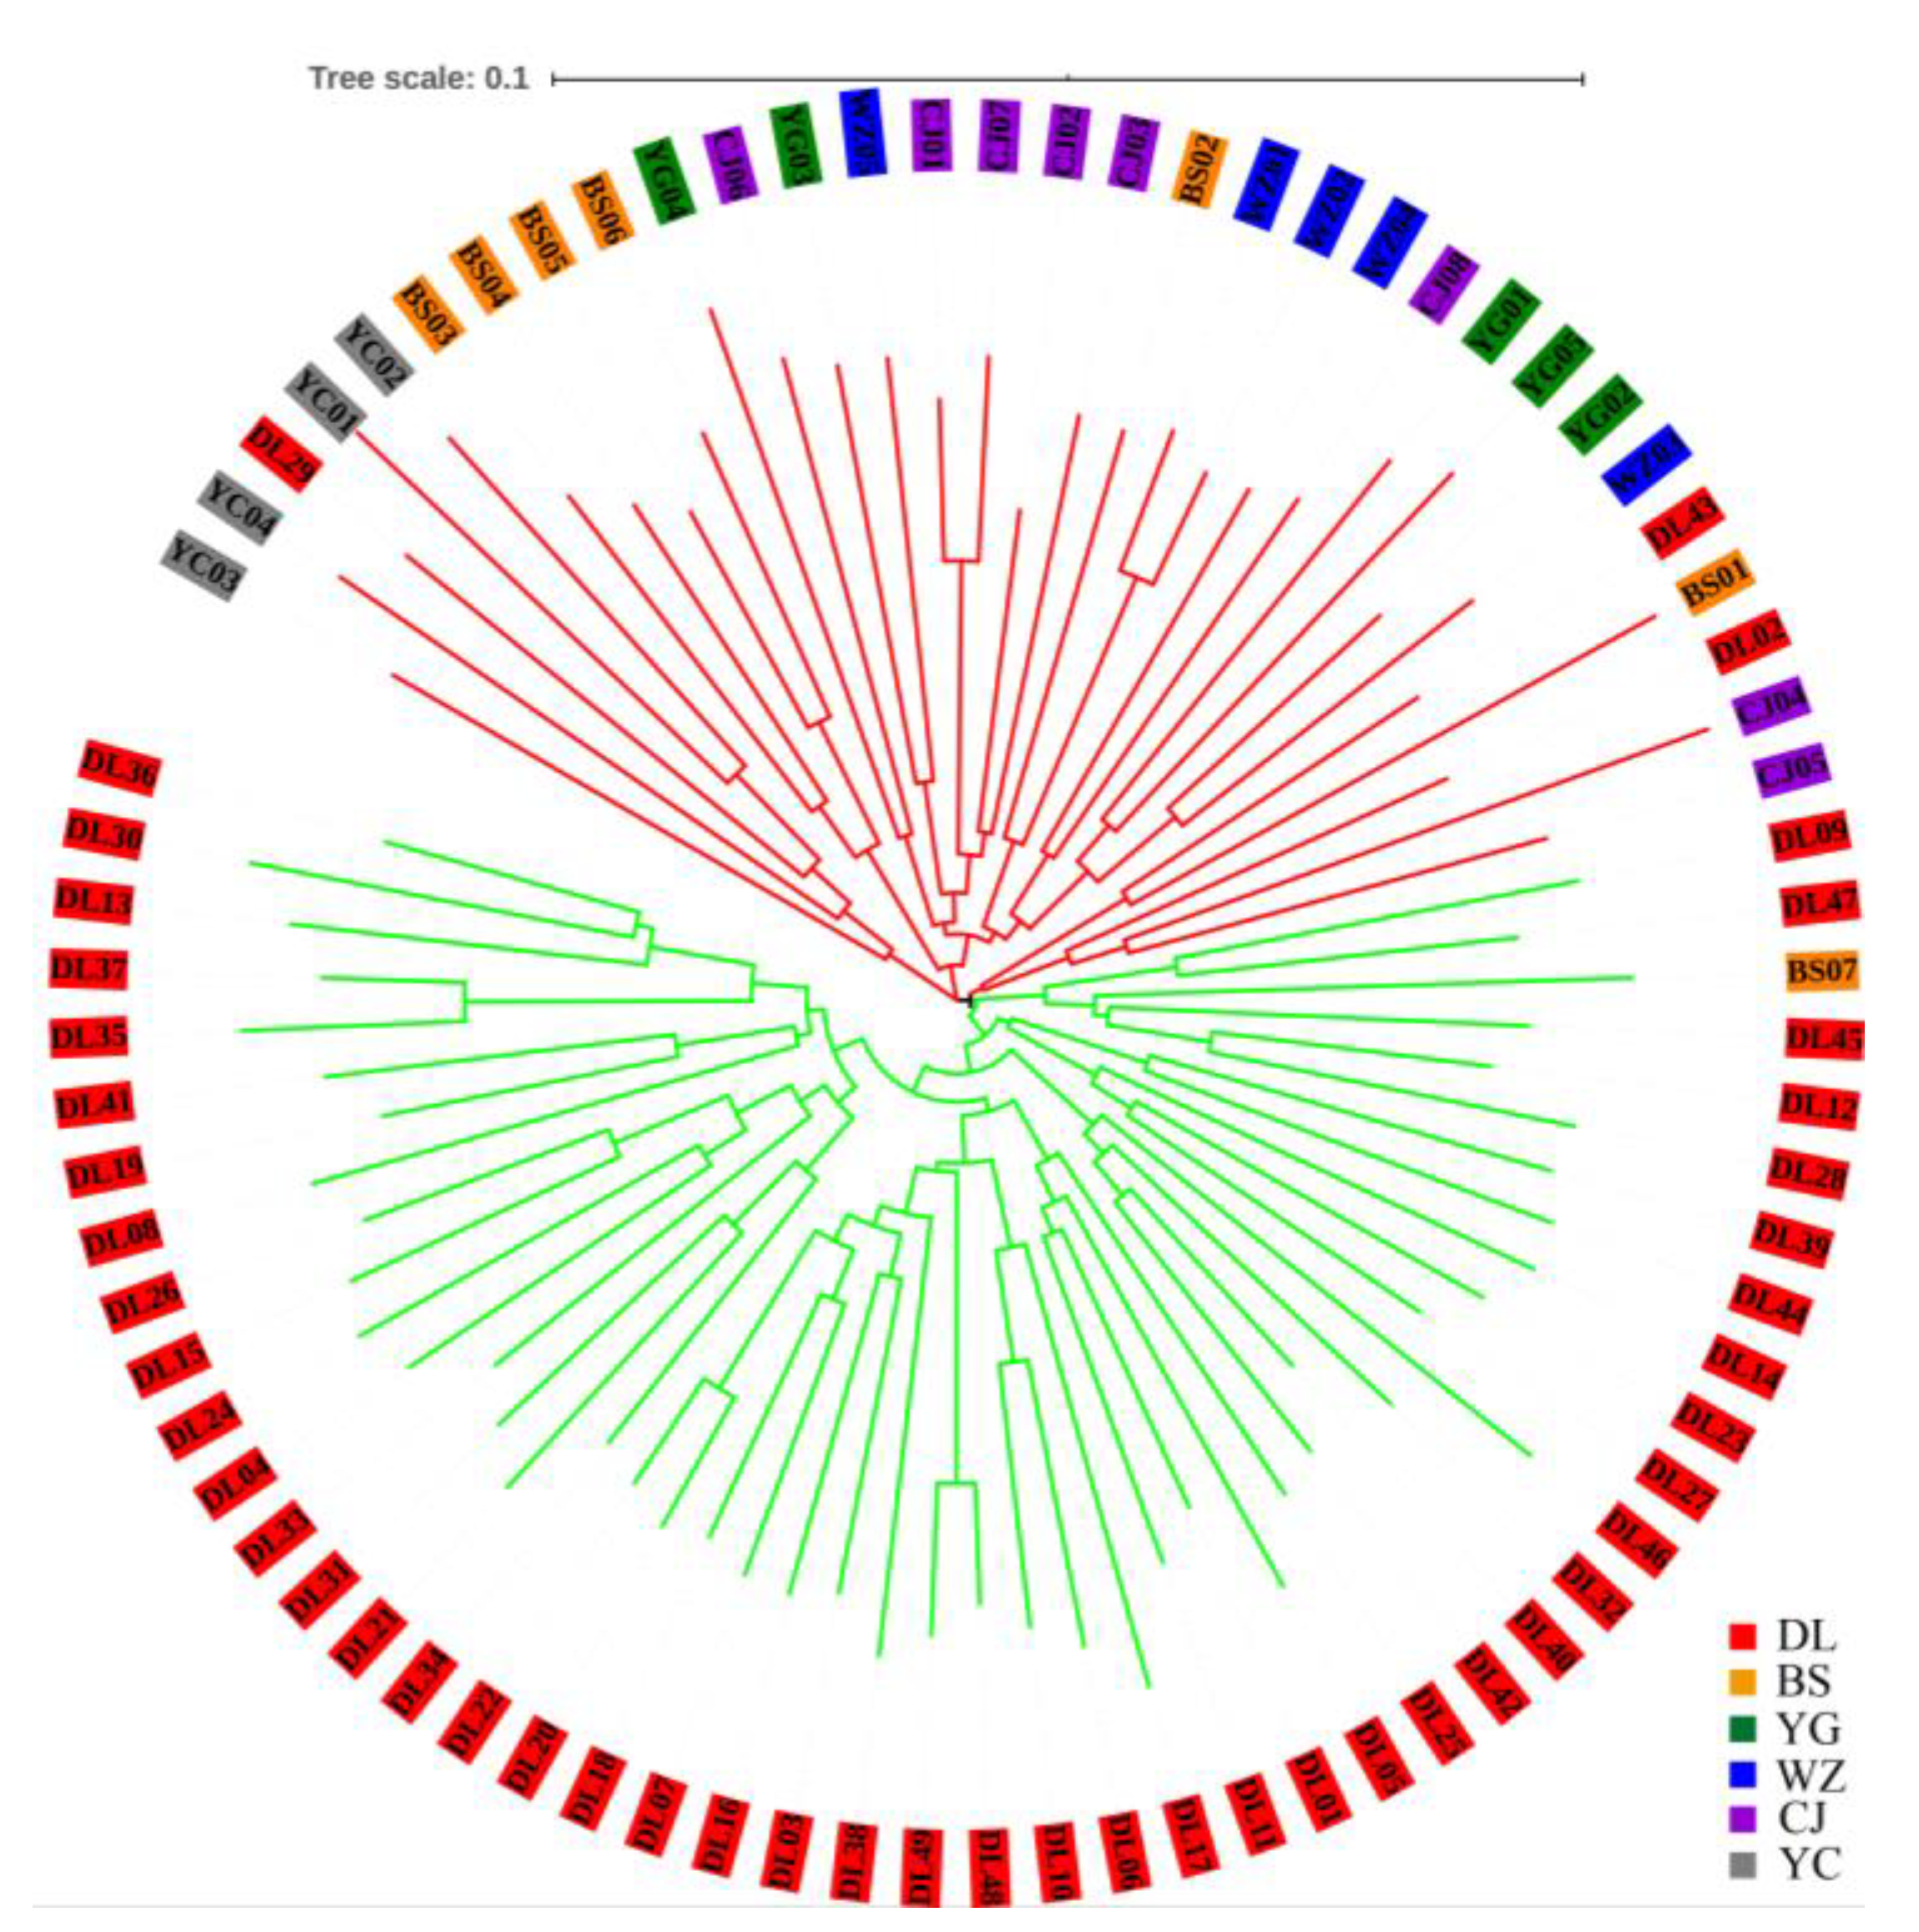
The tree diagram obtained by the NJ clustering method shows that the 78 individuals from six accessions were divided into two clusters (Figure 3). Forty-six individuals from DL and one from BS comprise the green cluster, and three individuals from DL and the remaining individuals comprise the red cluster. This result is very similar to that obtained through STRUCTURE analysis.
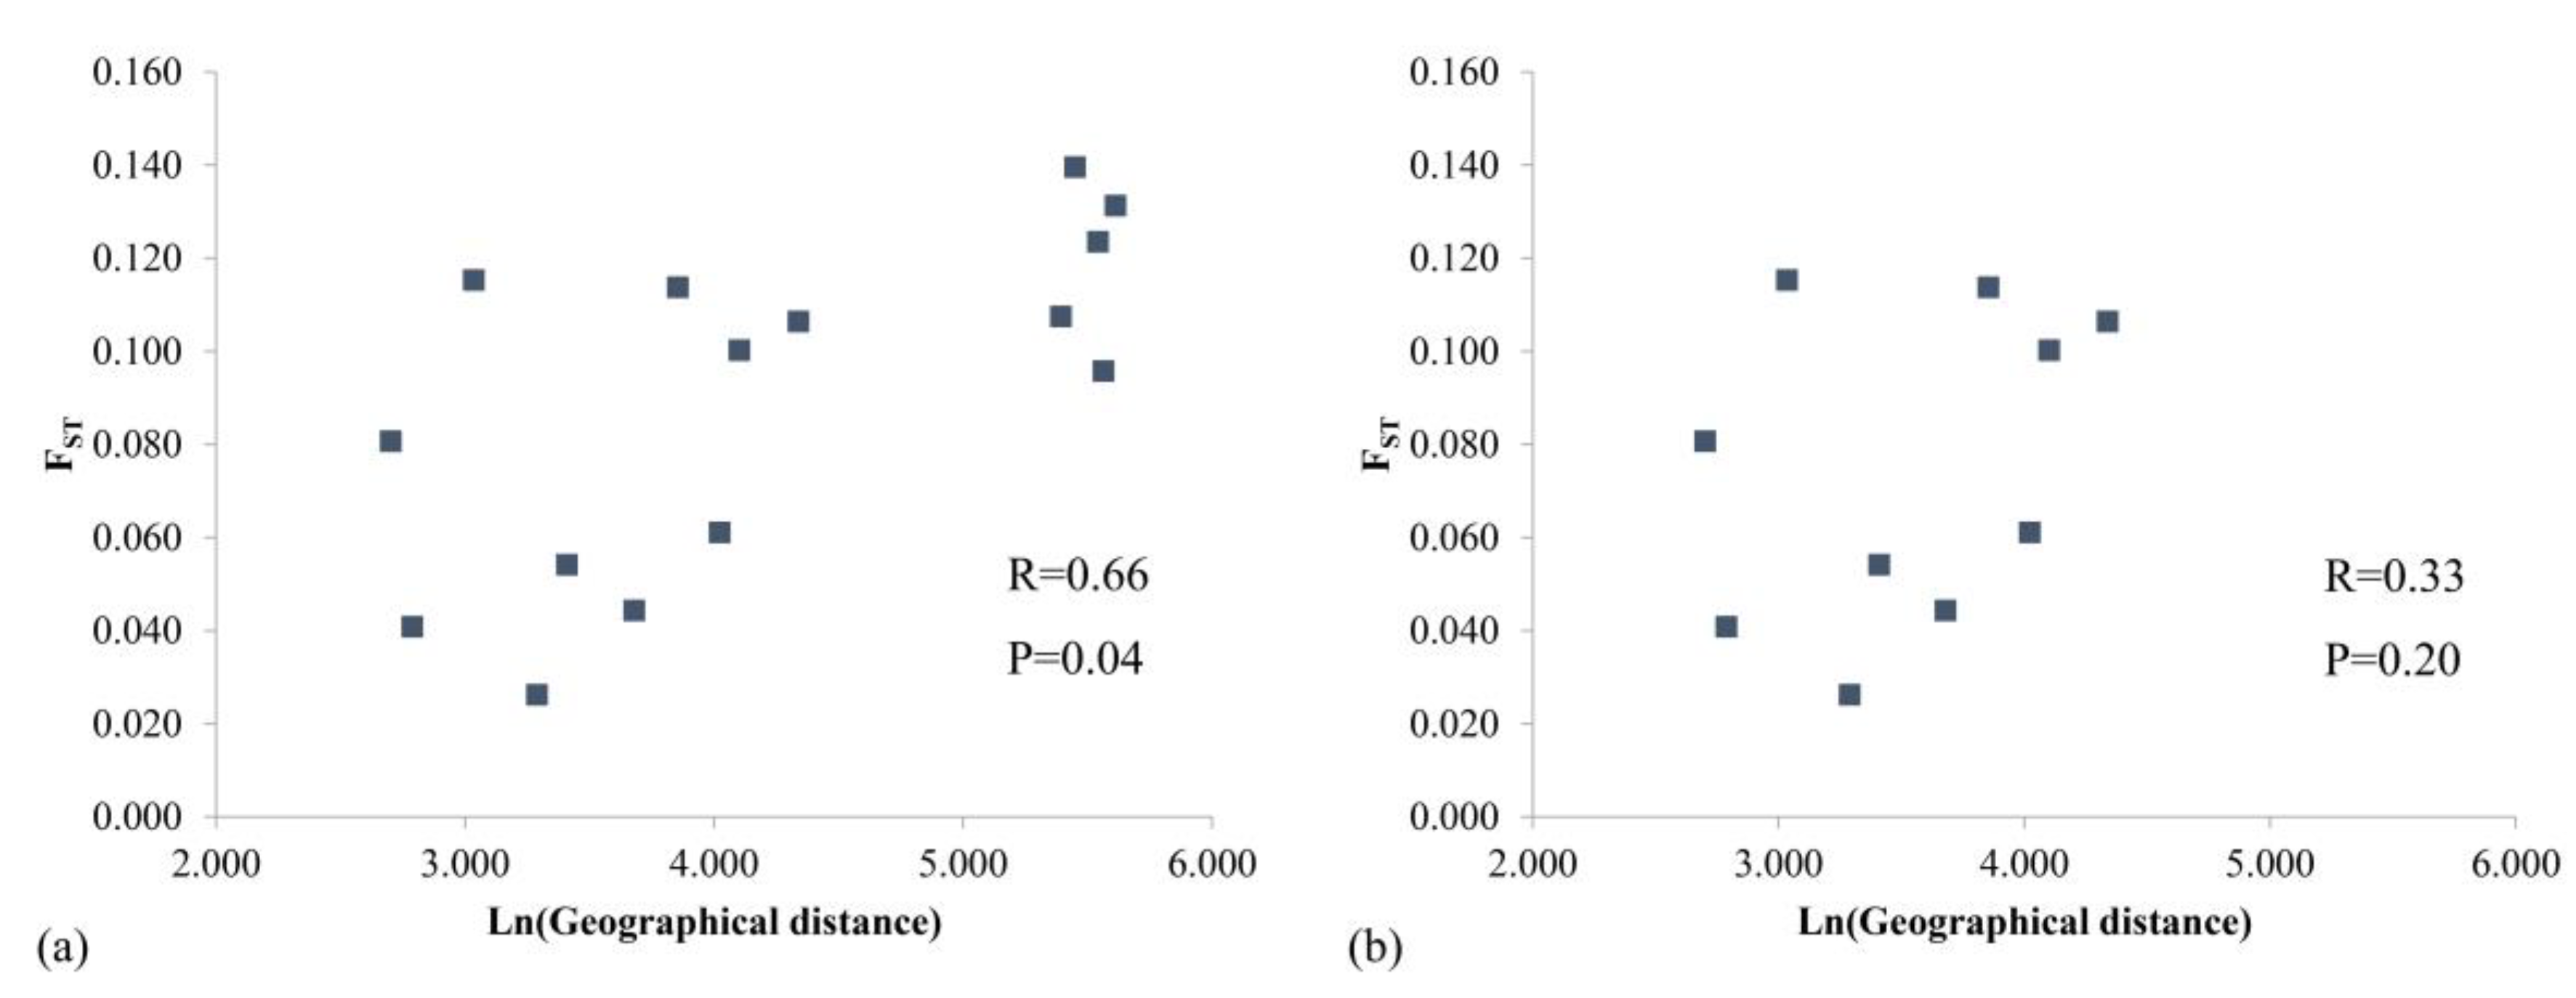
The Mantel test (Figure 4) confirmed that genetic distance and geographic distance were significantly correlated (P = 0.04, R = 0.66), indicating that an increase in geographic distance leads to increased genetic differentiation among populations. However, this correlation becomes insignificant upon removal of the YC population, which is located far from the main distribution area (P = 0.20, R = 0.33).
3.2. Genetic Diversity and Population Structure from cpDNA Marker
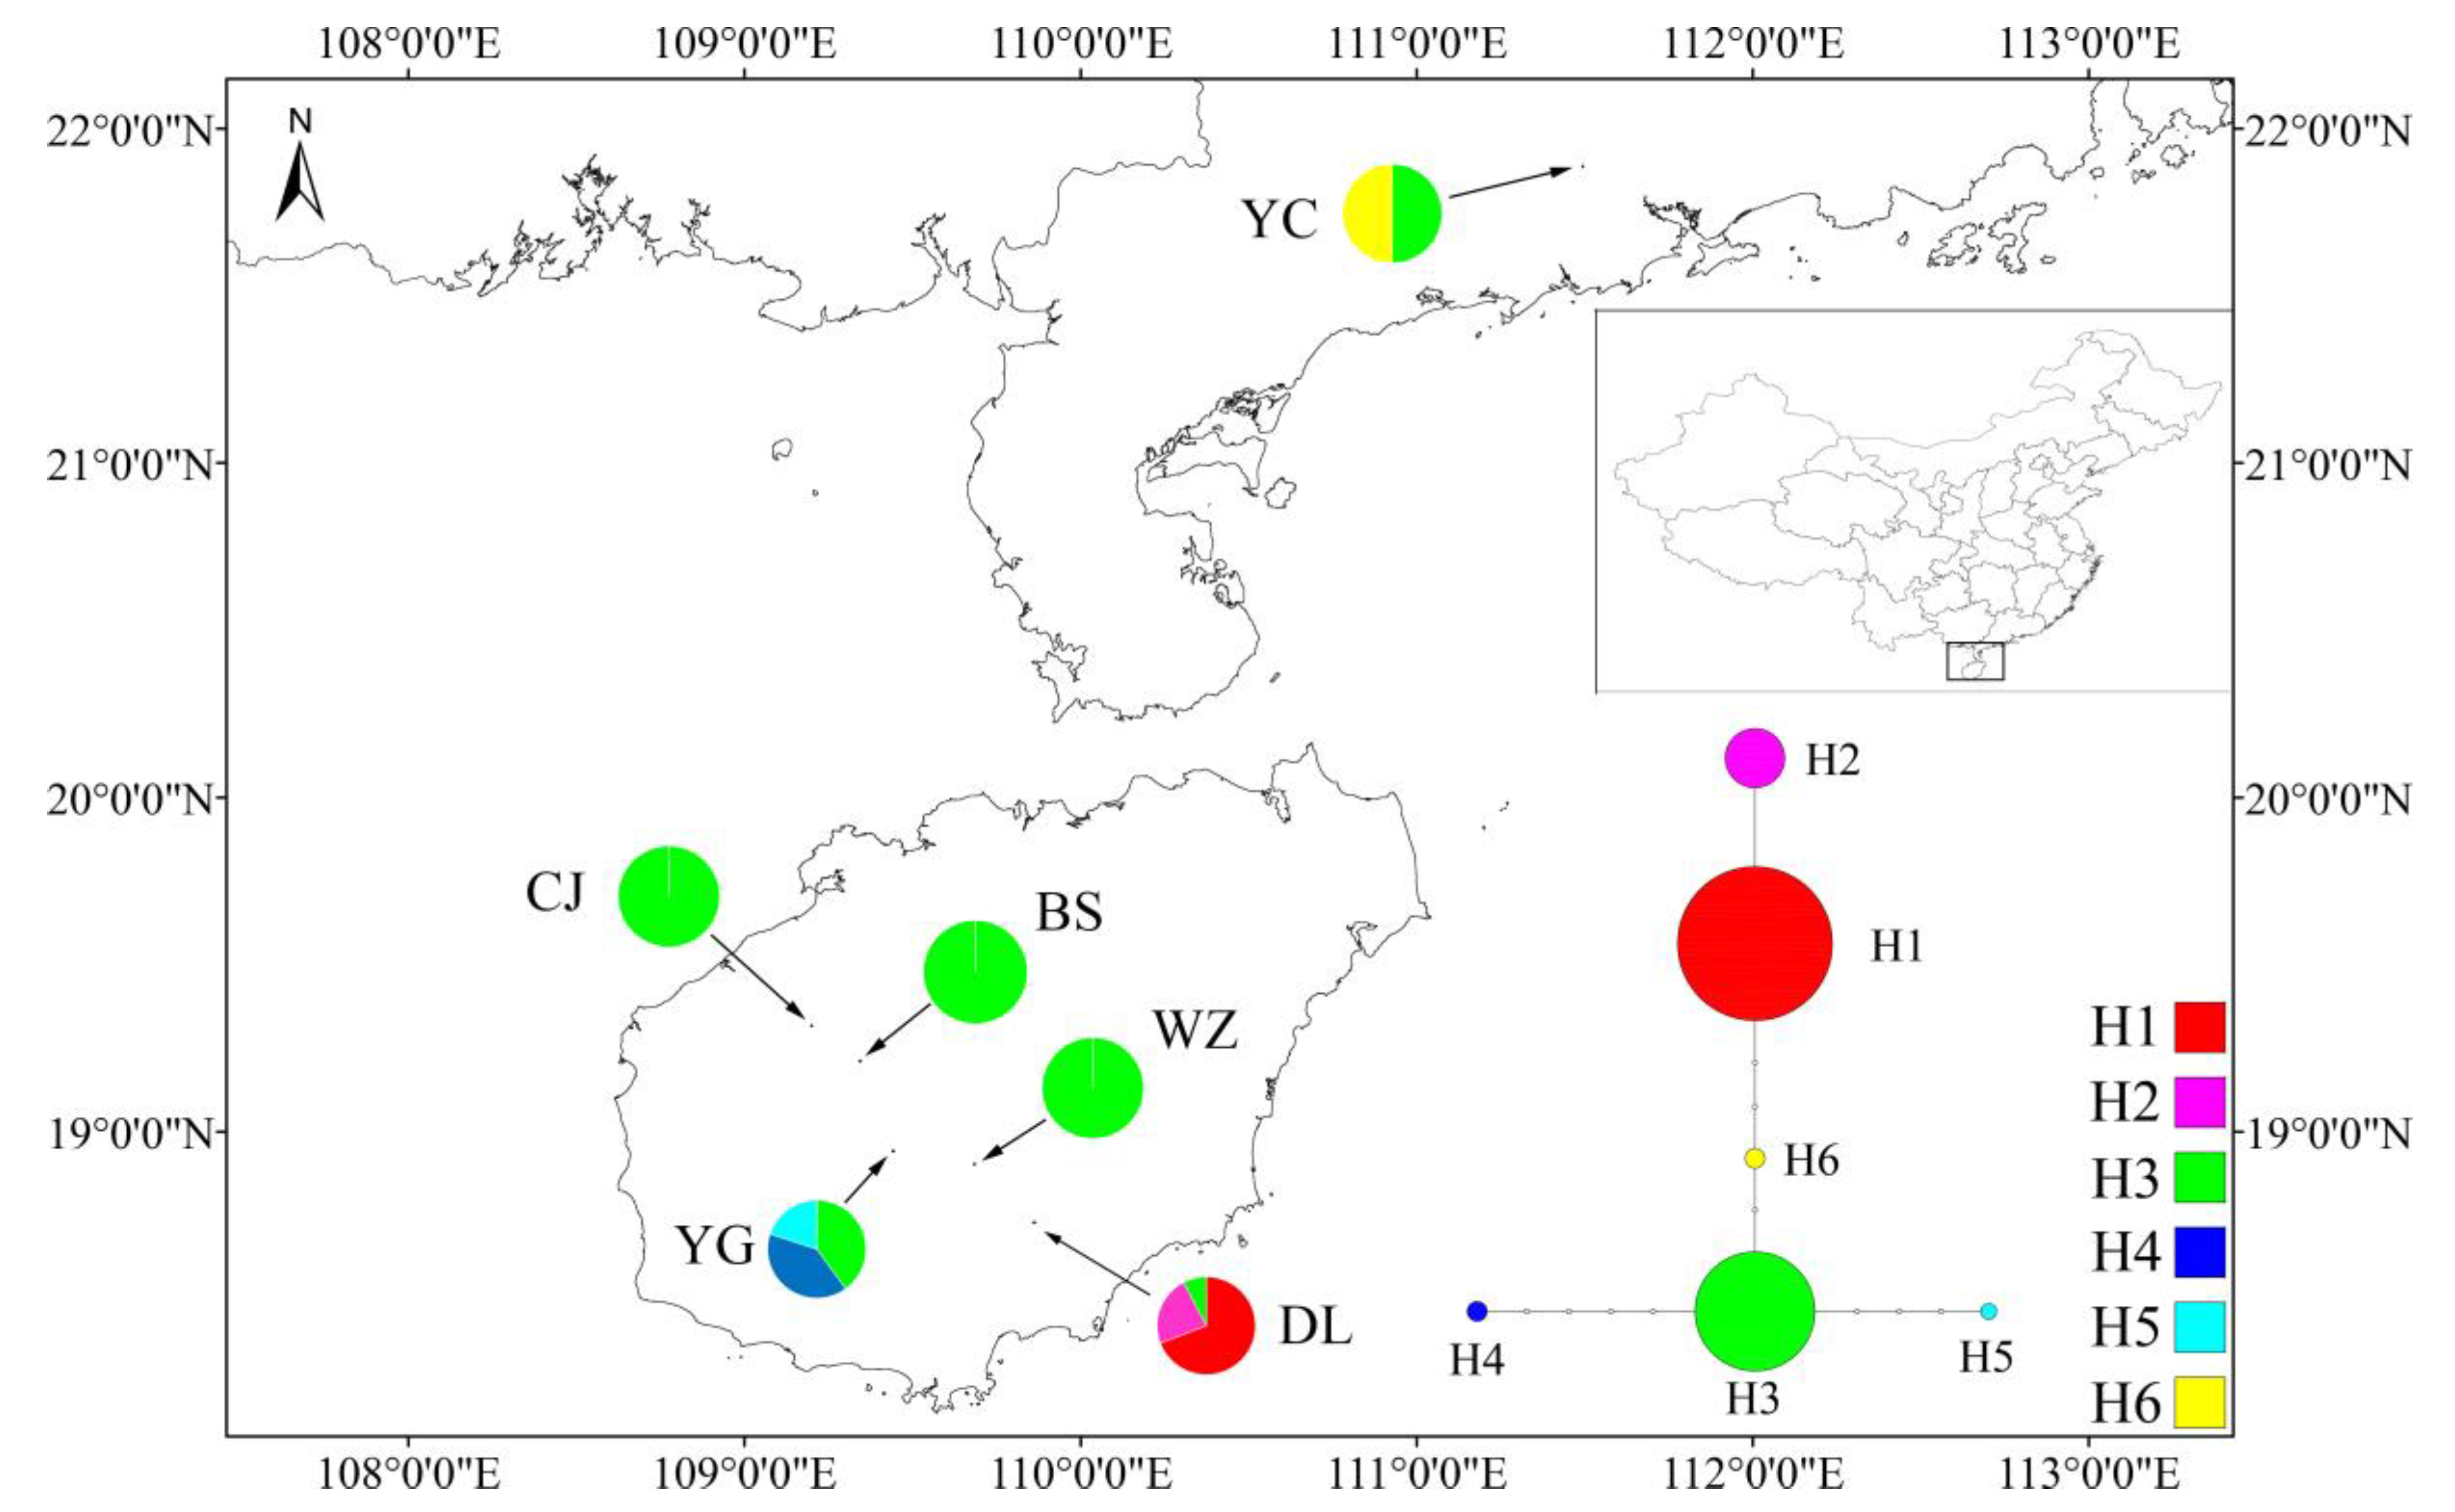
The aligned sequences consist of 1142 bp from two chloroplast DNA regions: trnH-psbA (400 bp) and trnK59-matK (742 bp). A total of 12 nucleic acid substitutions were observed within the region, and a total of six haplotypes were identified (Table S5). Haplotype diversity is highest in YG, followed by YC and DL; the lowest was found in BS, WZ, and CJ. Haplotype diversity ranges from 0 to 0.800, with an average of 0.674, reflecting the degree of difference among the haplotypes in each population. The YG accession shows moderate nucleotide diversity (0.00333), while DL (0.00074) and YC (0.00117) both show lower diversity. Haplotype and nucleotide diversity are both zero in three populations (BS, WZ, and CJ), which reflects the absence of variation between individuals within each of these populations (Table 3).
The haplotype H3 was shared among all populations (Figure 5), and the remaining haplotypes were private in populations. The haplotype H3 was central in the haplotype network, and can mutate into any of the other five haplotypes through base substitution. Haplotypes H1 and H2 were exclusive to DL; H4 and H5 were exclusive to YG; and H6 was exclusive to YC. Based on its widespread distribution in all populations, we surmise that H3 may represent the ancestral haplotype of M. shiluensis.
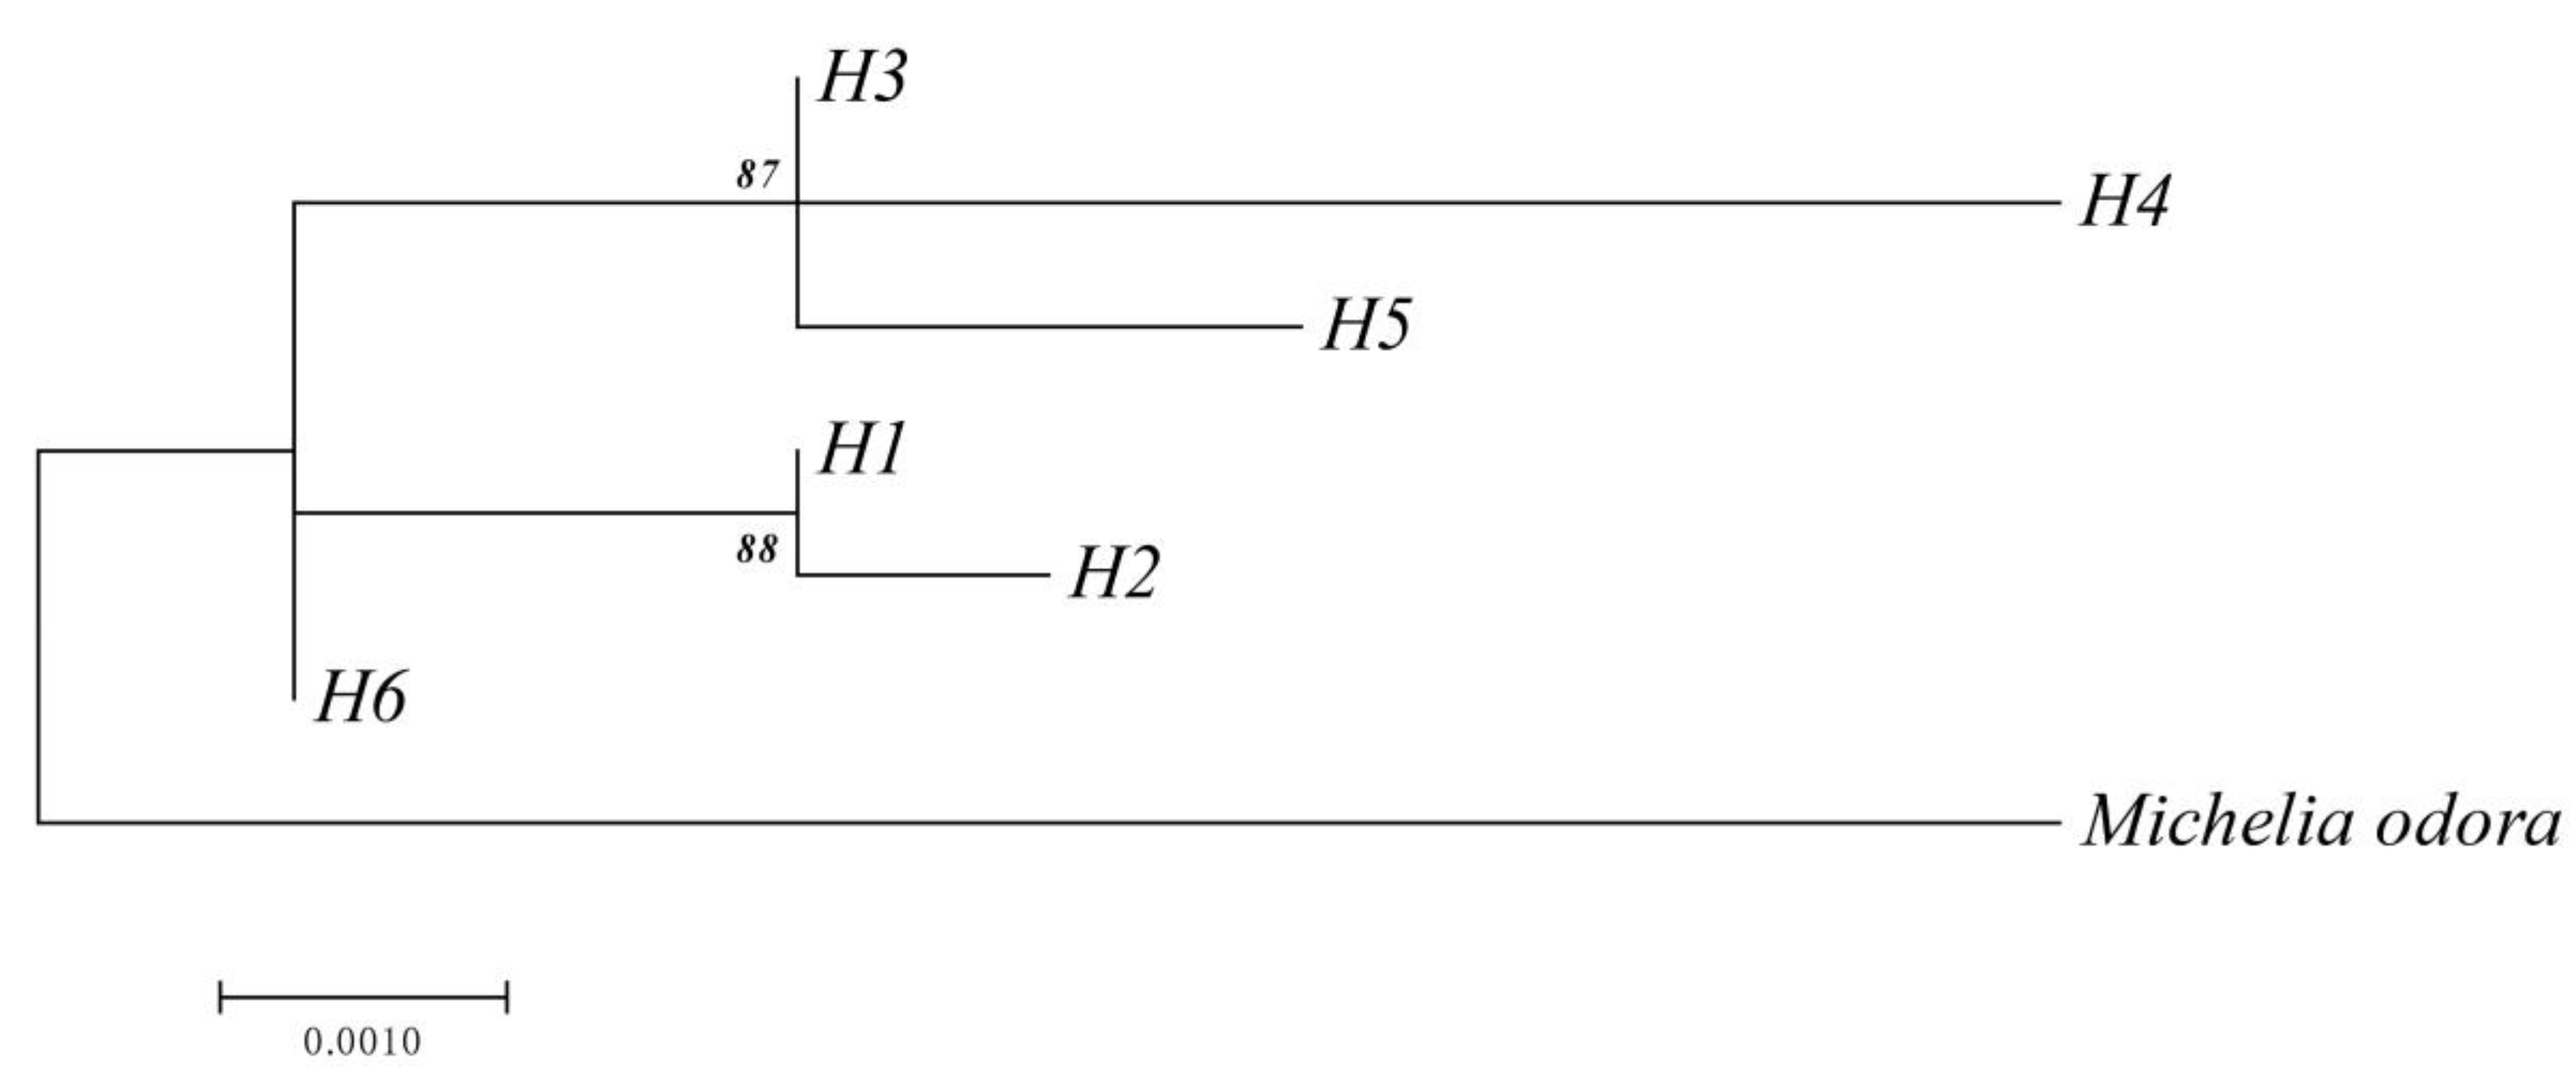
The analysis of the ML tree (Figure 6) shows that the haplotypes H3, H4, and H5 comprised one cluster; H1 and H2 comprised another cluster; and H6 comprised a third cluster.
Total genetic diversity (HT = 0.856) was higher than that within each population (HS = 0.137). The permutation test revealed a higher value for NST (0.728) than GST (0.534), with P < 0.05, indicating a clear phylogenetic structure among the populations.
AMOVA results (Table 2) show that chloroplast DNA diversity of all groups was 77.56% among populations and 22.44% within populations.
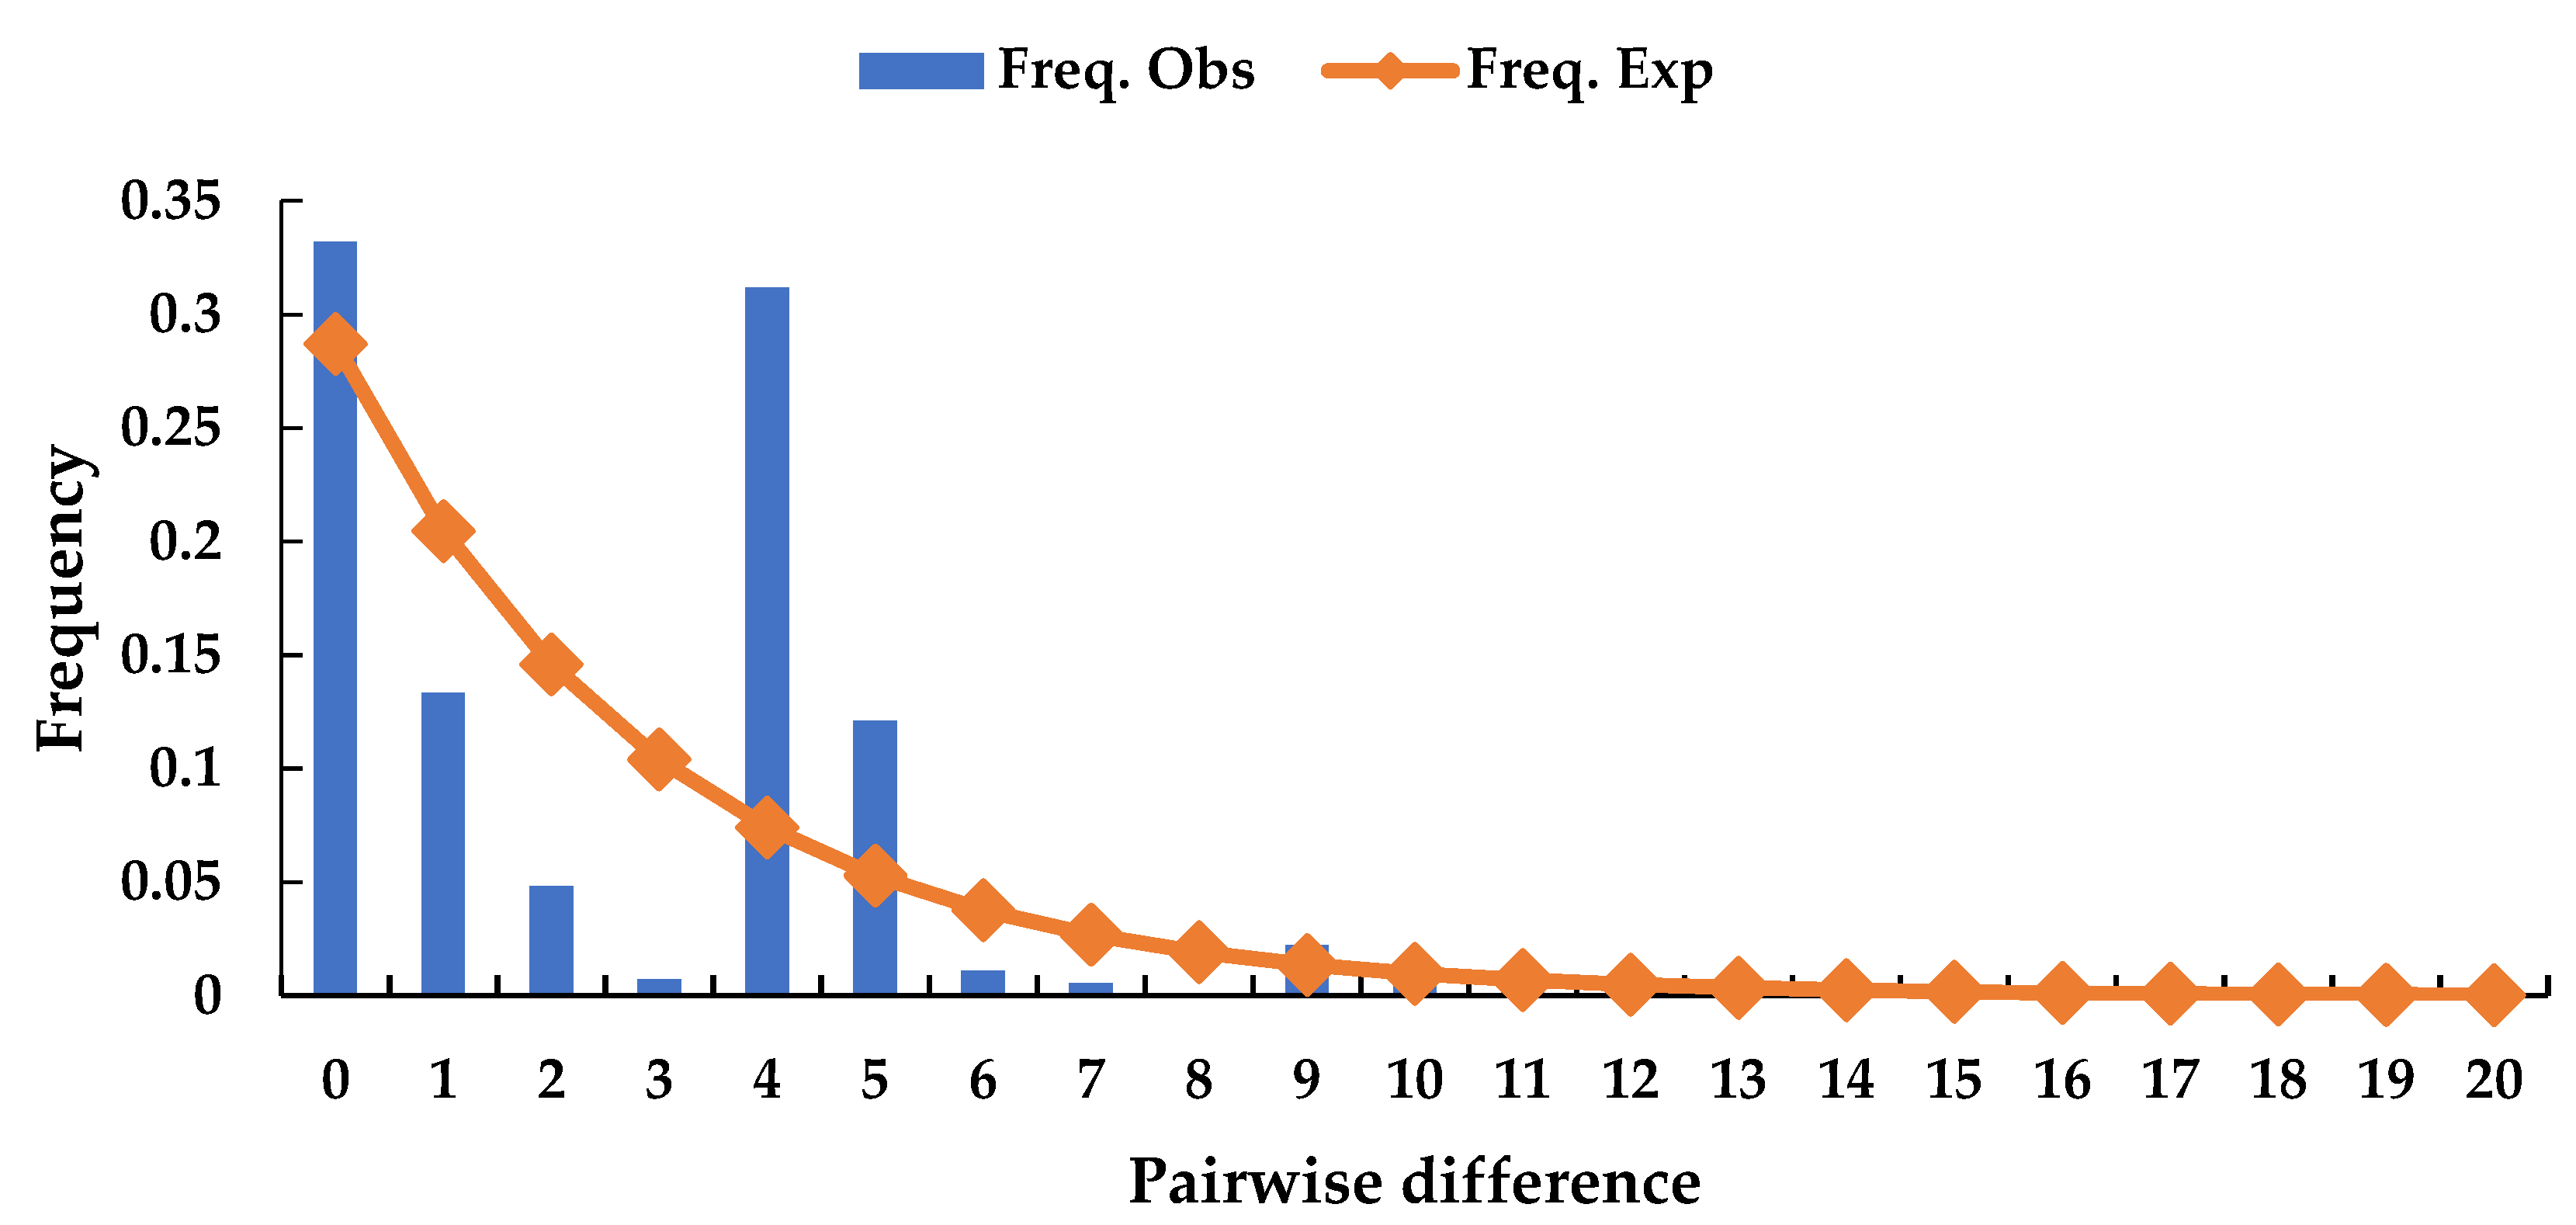
The neutrality test (Table 4) shows that both Tajima’s D and Fu’s FS were positive, but not significant (P = 0.525 and 0.904, respectively). This result indicates that chloroplast DNA diversity was less affected by selection than nuclear DNA diversity. The analysis of the mismatch distribution using multimodal plots (Figure 7) shows that a recent expansion in population was not supported, indicating that the population may be in dynamic equilibrium. The values of SSR and HRag were 0.059 (P = 0.25) and 0.190 (P = 0.41), respectively.
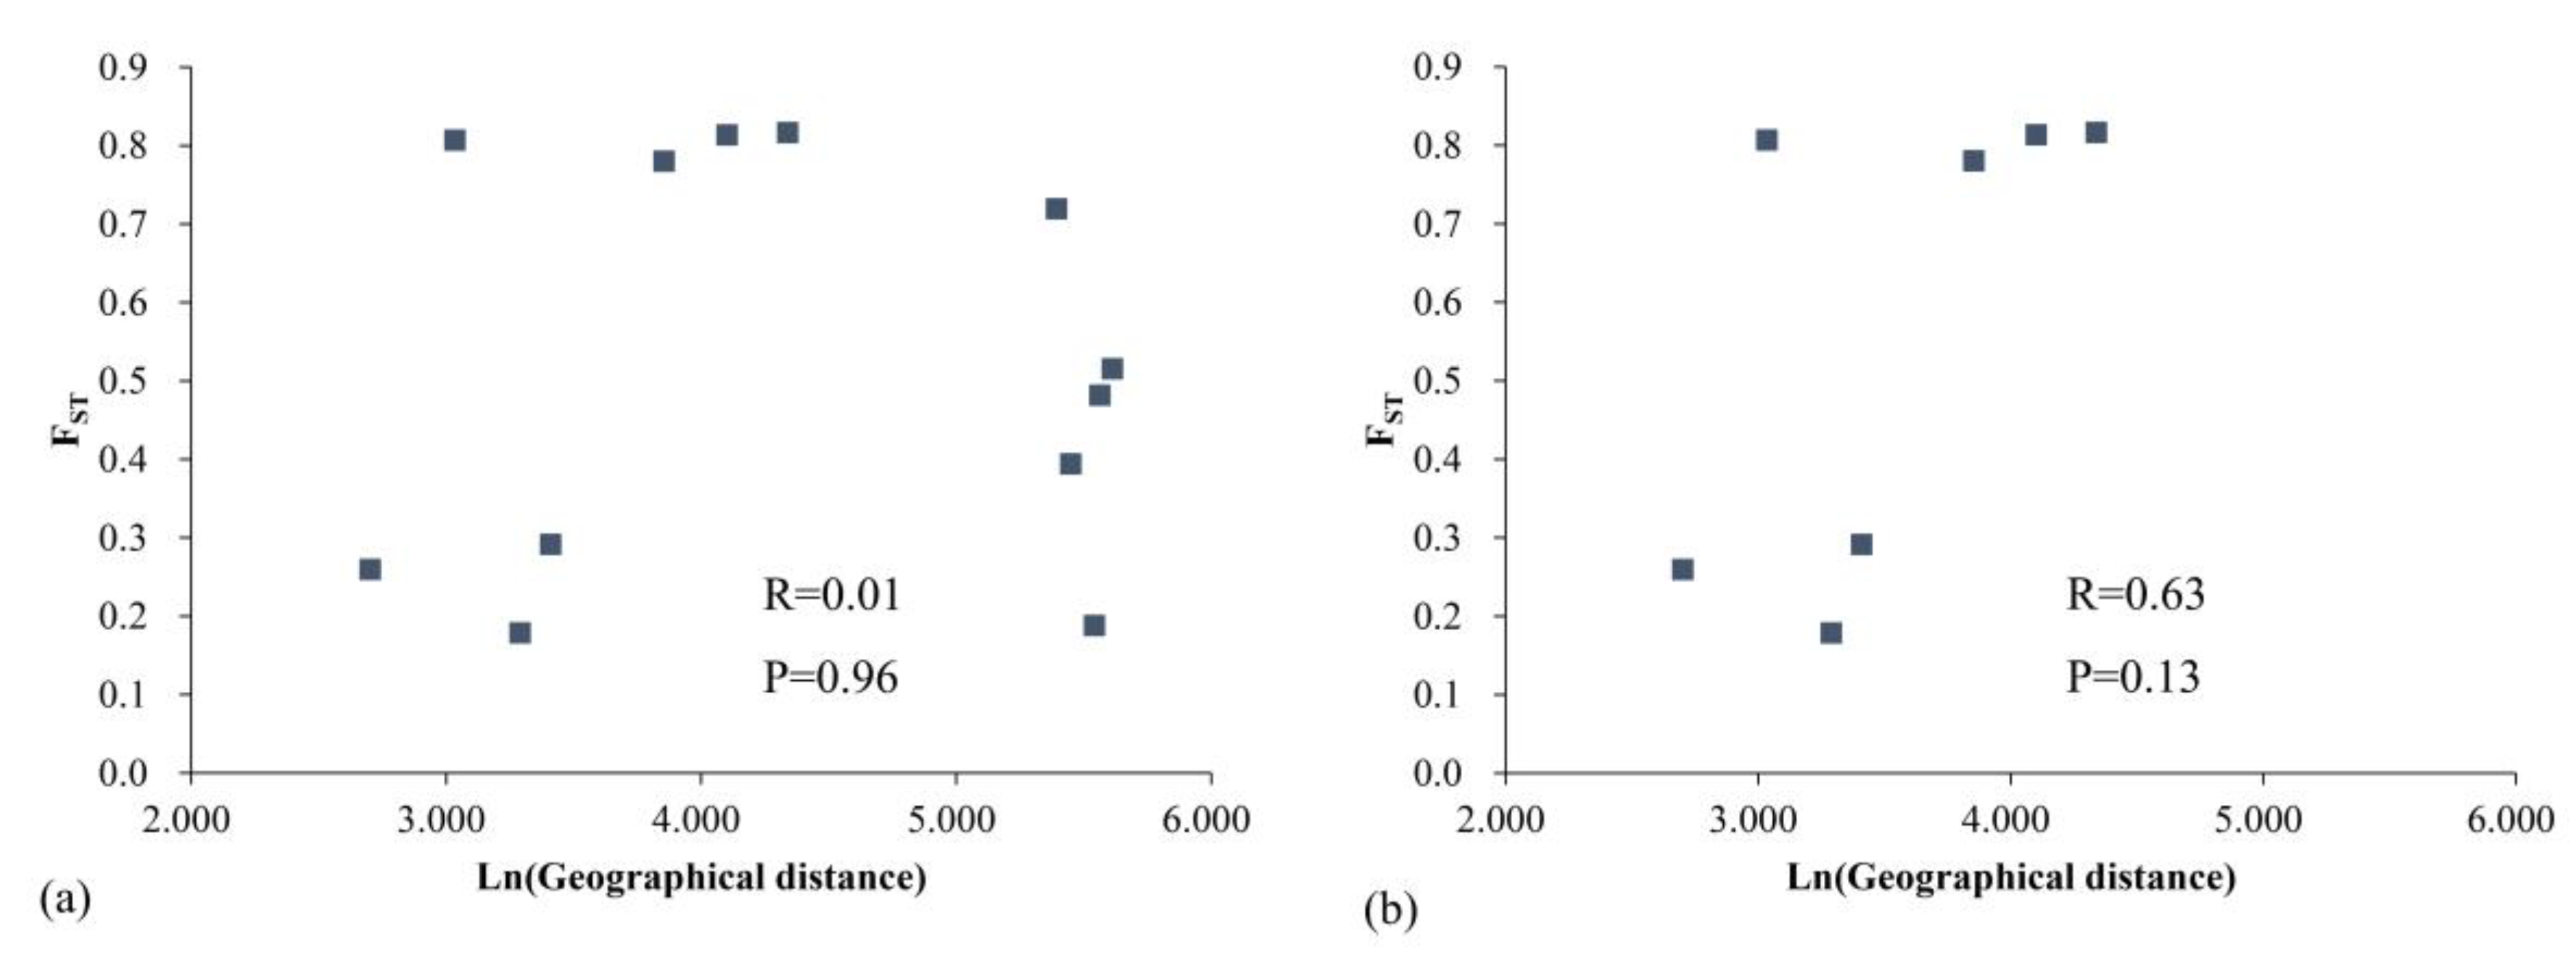
The results of the correlation between geographic distance and genetic distance (Mantel test; Figure 8) show no significant correlation between the genetic distance and geographic distance of the M. shiluensis population at the cpDNA level (R = 0.01, P = 0.96), regardless of whether YC is removed (R = 0.63, P = 0.13).
4. Discussion
4.1. High Level of Genetic Diversity
The level of genetic diversity plays an important role in the adaptive evolution and long-term survival of species and populations [13,14,15]. Generally, higher genetic diversity is found in widely distributed species than in those with restricted ranges [49,50]. However, many studies have shown that high genetic diversity can be maintained in endangered species despite dispersed populations [17,51]. In this study, a relatively high degree of genetic variation was found in the sampled populations of M. shiluensis. The nSSR data showed the population-level He to be 0.718, which is higher than that found in Magnolia tomentosa (He = 0.675) [52], Michelia coriacea (He = 0.47) [53], or Magnolia wufengensis (He = 0.184) [54], but lower than that of Magnolia stellata (He = 0.773) [9]. It is worth noting that the He found in this study is significantly higher than that found in some narrow-ranging species (He = 0.420) and in some widely distributed species (He = 0.620) [55]. Studies have shown that genetic diversity is positively correlated with population size [56,57,58]. Surprisingly, in this study, neither Ho (P = 0.953) nor He (P = 0.166) was significantly related to the population size (Figure 1). This outcome has been found in some special cases [59,60]. However, because the population size in this study has remained relatively uniform, this result might require further consideration. The cpDNA data show that the overall nucleotide diversity was relatively low (0.00220), but the haplotype diversity (Hd) was 0.674 (Table 3); this is higher than that of both M. stellata (Hd = 0.527) [9] and Michelia maudiae (Hd = 0.44) [27], but lower than that of Michelia formosana (Hd = 0.953) [61]. High haplotype diversity further indicates that M. shiluensis is highly genetically diverse and is not greatly affected by genetic drift [9]. The lower nucleotide diversity may be due to highly conserved sequences and low substitution rates within Magnoliaceae [62].
Although the six sampled M. shiluensis groups formed a single large population comprising several smaller subpopulations [63], the genetic diversity in each subpopulation was relatively high. The reasons for high genetic diversity may be as follows: first, we speculate that gene exchange between M. shiluensis populations has historically been frequent, and thus, the existing population inherited rich ancestral genetic variation [64]; second, M. shiluensis is a perennial plant, and therefore, the recent sharp decline of individuals has not increased the chance of inbreeding, which reduces genetic diversity [65]; third, plants of the Michelia genus tend to cross-pollinate, which can reduce the loss of genetic diversity through large gene flows [55,66,67].
4.2. Lack of Genetic Differentiation between Populations
The results of molecular analysis of variance (AMOVA; Table 2) showed that genetic variation among the M. shiluensis populations was 10.18% based on nSSR markers, while that based on cpDNA markers was 77.56%. This inconsistency may be related to the differential focus of the markers or high levels of gene flow [68]. Comparative analysis between bi-parental markers and maternally inherited markers can provide comprehensive insights into population dynamics because cpDNA mutations reflect past changes, while nSSR mutations can provide inferences for recent population events [69]. Thus, differences in genetic patterns and rates of evolution often produce large contrasts between nuclear and organelle genetic diversities under conditions of genetic differentiation [28].
According to Wright [70], if Nm is less than 1, genetic drift and differentiation may occur. In this study, Nm reached 1.546 (Table S3), thus, it is very likely that the M. shiluensis population has not yet undergone either genetic drift or any apparent degree of genetic differentiation. From the perspective of M. shiluensis haplotype distribution (Figure 5), haplotype H3 is distributed in all populations, which greatly reduces the level of differentiation between populations. In addition, the characteristic red seeds of Magnoliaceae are easily seen and eaten by birds [71]. As a result, the seeds can be widely dispersed via long-distance bird flight, thereby increasing the range of gene flow. Based on the above reasons, we can infer that a large amount of gene flow may be the reason for the current low level of genetic differentiation and indistinct geographic structure in the M. shiluensis population [72].
Generally, the level of genetic differentiation between populations increases with increasing geographic distance [73]. However, the two markers showed a different pattern when applied to geographically isolated M. shiluensis accessions (Figure 4, Figure 8). The results of nSSR showed that the genetic distance increased significantly with the increase in geographic distance (P = 0.04); however, removal of the YC population eliminated significance (P = 0.20). The YC population is far from the main distribution area and isolated by a strait (Figure 5). We speculate that the latter was the source of the significant difference we found. Results based on cpDNA showed no correlation between genetic and geographic distances regardless of whether YC is removed (P=0.96, 0.13). The result of the Mantel test may be due to the fact that, in the primary distribution range of M. shiluensis on Hainan Island [23], the maximum distance between groups of less than 80 km is insufficient to limit the range of bird activity; the resulting pattern is consistent with a lack of geographical isolation [9]. In addition to bird-mediated seed dispersal, gravity is another agent of dispersal, which results in a spatially-restricted genetic structure [9].
4.3. Demographic History and Population Structure
Population genetic structure reflects the genetic relationships within and between populations. From the haplotype network diagram, we can infer that M. shiluensis is likely to have originated in central Hainan. Colonization in DL fostered the formation of the haplotypes H1 and H2, while haplotypes H4 and H5 were formed after colonization in YG. Based on the large number of individuals and the relatively complete age structure in the DL population, we conclude that H1 and H2 form dominant haplotypes; however, as the number of individuals remaining in YG is small, it is impossible to determine which one of these haplotypes is dominant. Results of nSSR analysis confirm the genetic distinctiveness between DL and other Hainan groups, but suggest that the YG population may be very similar to BS, WZ, and CJ. The large number of private alleles in the DL population may be an important adaptation to an atypical environment [74], or a response to climate change; this result may be related to the local adaptability this species developed in response to the low temperature conditions of the Cenozoic Era [75,76]. It is worth mentioning that M. shiluensis has also been found outside Hainan Province. Studies have shown that Hainan Island was connected to Guangxi Province 65 million years ago [77]. In this study, STRUCTURE results of the analysis of nSSR markers indicate that the YC population shares the same gene pool as BS, YG, WZ, and CJ, while the analysis of cpDNA markers indicate that all sampled populations share the H3 haplotype. Furthermore, we speculate that there may be residual M. shiluensis in the area around the border between Guangdong and Guangxi.
4.4. Implication for Conservation
One of the main goals in protecting endangered species is to maximize existing genetic variation [17], as genetic variation may largely promote adaptation to a changing environment [78,79]. As all of the sampled M. shiluensis groups showed similar levels of genetic diversity, all of these populations make important contributions to the viability and protection of the species. Strengthening in situ conservation is an ideal approach that enables existing genetic resources to continue developing in an existing suitable environment. According to our field investigation, natural reserves are well-established in the DL, WZ, YG, and YC populations. Although no natural reserves are established in BS and CJ, these populations have also received protective support from the local government. The protection of existing genetic resources is only a short-term goal; the medium-term goal is to establish a new generation to improve genetic diversity. Except for DL, the individuals in the remaining populations are mature trees with a high level of genetic diversity, which provides protective value to each individual. One strategy for propagating future generations is to collect seeds in order to cultivate young seedlings and establish breeding in an off-site location [11]. In addition, germplasm resources can be propagated by grafting, and genetically dissimilar individuals can be crossed by artificial pollination to produce highly heterozygous seedlings. Great care needs to be taken to avoid genetic contamination when transplanting seedlings back to their native land [80], as this could allow foreign genes to infiltrate the original population and potentially eliminate it due to a lack of competitiveness. Finally, future research can encompass building a niche model to explore possible habitats of M. shiluensis, further expand its distribution range, and generate more genetic variation through local adaptation.
5. Conclusions
In summary, our results from nSSR and cpDNA markers indicate that high levels of population genetic diversity and low levels of genetic differentiation still exist in the endangered plants we studied. Therefore, we infer that the fragmentation and isolation within the M. shiluensis population may be due to recent human disturbance rather than to inbreeding or genetic drift. We have proposed some protection strategies for M. shiluensis based on these data.
Supplementary Materials
Supplementary materials can be found at https://www.mdpi.com/1999-4907/11/4/469/s1, Table S1. Geographical and climatic information of sampled Michelia shiluensis populations; Table S2. Characterization of the eight SSR and two cpDNA primers used in this study; Table S3. Genetic diversity of eight SSR markers within six Michelia shiluensis populations; Table S4. F-statistics and Nm at nSSR loci in six Michelia shiluensis populations; Table S5. Variable sites of the cpDNA fragment in six Michelia shiluensis populations.
Author Contributions
Conceptualization, Y.D.; methodology, Y.D. and T.L.; software, Y.X.; validation, Y.D., T.L., Y.X., Y.W., M.G., Z.X., Y.S., and X.D.; formal analysis, T.L. and Y.X.; resources, Y.D., Y.W., Z.X., Y.S., and X.D.; writing—original draft preparation, Y.D.; writing—review and editing, Y.D.; supervision, X.D.; project administration, X.D.; funding acquisition, X.D. All authors have read and agreed to the published version of the manuscript.
Funding
This study was supported by the Forestry Public Welfare Industry Research of China (Grant Number: 201404116), the National Natural Science Foundation of China (Grant Number: 31670601), and the Forestry Science and Technology Innovation of Guangdong Province grant programs (Grant Numbers: 2014KJCX006, 2017KJCX023).
Acknowledgments
We appreciate the help from Xinsheng Qin and forest rangers in each location during sampling. We are also grateful to Ye Sun and Xinsheng Hu for their invaluable guidance during the manuscript preparation.
Conflicts of Interest
The authors declare no conflicts of interest.
References
- Tamaki, I.; Setsuko, S.; Tomaru, N. Genetic variation and differentiation in populations of a threatened tree, Magnolia stellata: Factors influencing the level of within-population genetic variation. Heredity 2008, 100, 415–423. [Google Scholar] [CrossRef] [PubMed] [Green Version]
- Zhang, Y.B.; Ma, K.P. Geographic distribution patterns and status assessment of threatened plants in China. Biodivers. Conserv. 2008, 17, 1783–1798. [Google Scholar] [CrossRef]
- Caballero, A.; Bravo, I.; Wang, J. Inbreeding load and purging: Implications for the short-term survival and the conservation management of small populations. Heredity 2017, 118, 177–185. [Google Scholar] [CrossRef] [PubMed] [Green Version]
- Lande, R. Anthropogenic, ecological and genetic factors in extinction and conservation. Popul. Ecol. 1998, 40, 259–269. [Google Scholar] [CrossRef]
- Tang, C.Q.; Yang, Y.; Ohsawa, M.; Momohara, A.; Hara, M.; Cheng, S.; Fan, S. Population structure of relict Metasequoia glyptostroboides and its habitat fragmentation and degradation in south-central China. Biol. Conserv. 2011, 144, 279–289. [Google Scholar] [CrossRef]
- Hamrick, J.L.; Godt, M.W. Effects of life history traits on genetic diversity in plant species. Philos. Trans. R. Soc. Lond. Ser. B Biol. Sci. 1996, 351, 1291–1298. [Google Scholar]
- Loveless, M.D.; Hamrick, J.L. Ecological determinants of genetic structure in plant populations. Annu. Rev. Ecol. Syst. 1984, 15, 65–95. [Google Scholar] [CrossRef]
- Schoen, D.J.; Morgan, M.T.; Bataillon, T. How does self-pollination evolve? Inferences from floral ecology and molecular genetic variation. Philos. Trans. R. Soc. Lond. B 1996, 351, 1281–1290. [Google Scholar]
- Setsuko, S.; Ishida, K.; Ueno, S.; Tsumura, Y.; Tomaru, N. Population differentiation and gene flow within a metapopulation of a threatened tree, Magnolia stellata (Magnoliaceae). Am. J. Bot. 2007, 94, 128–136. [Google Scholar] [CrossRef]
- Hanski, I.; Simberloff, D. The metapopulation approach, its history, conceptual domain, and application to conservation. In Metapopulation Biology; Elsevier: Amsterdam, The Netherlands, 1997; pp. 5–26. [Google Scholar]
- Ellstrand, N.C.; Elam, D.R. Population genetic consequences of small population size: Implications for plant conservation. Annu. Rev. Ecol. Syst. 1993, 24, 217–242. [Google Scholar] [CrossRef]
- Chen, Y.Y.; Bao, Z.X.; Qu, Y.; Li, W.; Li, Z.Z. Genetic diversity and population structure of the medicinal orchid Gastrodia elata revealed by microsatellite analysis. Biochem. Syst. Ecol. 2014, 54, 182–189. [Google Scholar] [CrossRef]
- Frankham, R. Genetics and conservation biology. C. R. Biol. 2003, 326, 22–29. [Google Scholar] [CrossRef]
- Kingston, N.; Waldren, S.; Smyth, N. Conservation genetics and ecology of Angiopteris chauliodonta Copel. (Marattiaceae), a critically endangered fern from Pitcairn Island, South Central Pacific Ocean. Biol. Conserv. 2004, 117, 309–319. [Google Scholar] [CrossRef]
- Lande, R.; Barrowdough, G. Effective population size, genetic variation, and their use in population management. In Viable Populations for Conservation; Soule, M.E., Ed.; Cambridge University Press: Cambridge, UK, 1987; p. 87. [Google Scholar]
- Godt, M.J.W.; Caplow, F.; Hamrick, J. Allozyme diversity in the federally threatened golden paintbrush, Castilleja levisecta (Scrophulariaceae). Conserv. Genet. 2005, 6, 87–99. [Google Scholar] [CrossRef]
- Luan, S.; Chiang, T.Y.; Gong, X. High genetic diversity vs. low genetic differentiation in Nouelia insignis (Asteraceae), a narrowly distributed and endemic species in China, revealed by ISSR fingerprinting. Ann. Bot. 2006, 98, 583–589. [Google Scholar] [CrossRef]
- Cicuzza, D.; Newton, A.; Oldfield, S. The Red List of Magnoliaceae; Botanic Gardens Conservation International: London, UK, 2007. [Google Scholar]
- Francisco-Ortega, J.; Wang, F.G.; Wang, Z.S.; Xing, F.W.; Liu, H.; Xu, H.; Xu, W.X.; Luo, Y.B.; Song, X.Q.; Gale, S.; et al. Endemic seed plant species from Hainan Island: A checklist. Bot. Rev. 2010, 76, 295–345. [Google Scholar] [CrossRef]
- Wang, F.; Ye, H.; Zhao, N. Studies on the spermatophytic flora of E’ huangzhang Nature Reserve in Yangchun of Guangdong Province. Guangxi Zhiwu 2003, 23, 495–504. [Google Scholar]
- Deng, Y.; Luo, Y.; He, Y.; Qin, X.; Li, C.; Deng, X. Complete chloroplast genome of Michelia shiluensis and a comparative analysis with four Magnoliaceae species. Forests 2020, 11, 267. [Google Scholar] [CrossRef] [Green Version]
- Yi, R.; Chen, Y.; Han, J.; Hu, Q.; Li, H.; Wu, H. Identification and biological characteristics of Diaporthe ueckerae causing dieback disease on Michelia shiluensis. Sci. Silvae Sin. 2018, 54, 80–88. [Google Scholar]
- Wei, Y.; Hong, F.; Yuan, L.; Kong, Y.; Shi, Y. Population distribution and age structure characteristics of Michelia shiluensis, an endangered and endemic species in Hainan Island. Chin. J. Trop. Crops 2017, 38, 2280–2284. [Google Scholar]
- Varshney, R.K.; Graner, A.; Sorrells, M.E. Genic microsatellite markers in plants: Features and applications. Trends Biotechnol. 2005, 23, 48–55. [Google Scholar] [CrossRef] [PubMed]
- Sahu, J.; Sen, P.; Choudhury, M.D.; Barooah, M.; Modi, M.K.; Talukdar, A.D. Towards an efficient computational mining approach to identify EST-SSR markers. Bioinformation 2012, 8, 201–202. [Google Scholar] [CrossRef] [PubMed] [Green Version]
- Slavov, G.T.; Howe, G.T.; Gyaourova, A.V.; Birkes, D.S.; Adams, W.T. Estimating pollen flow using SSR markers and paternity exclusion: Accounting for mistyping. Mol. Ecol. 2005, 14, 3109–3121. [Google Scholar] [CrossRef]
- Ueno, S.; Setsuko, S.; Kawahara, T.; Yoshimaru, H. Genetic diversity and differentiation of the endangered Japanese endemic tree Magnolia stellata using nuclear and chloroplast microsatellite markers. Conserv. Genet. 2005, 6, 563–574. [Google Scholar] [CrossRef]
- Birky, C.W., Jr.; Fuerst, P.; Maruyama, T. Organelle gene diversity under migration, mutation, and drift: Equilibrium expectations, approach to equilibrium, effects of heteroplasmic cells, and comparison to nuclear genes. Genetics 1989, 121, 613–627. [Google Scholar]
- Birky, C.W., Jr. Uniparental inheritance of mitochondrial and chloroplast genes: Mechanisms and evolution. Proc. Natl. Acad. Sci. USA 1995, 92, 11331–11338. [Google Scholar] [CrossRef] [Green Version]
- Petit, R.J.; Pineau, E.; Demesure, B.; Bacilieri, R.; Ducousso, A.; Kremer, A. Chloroplast DNA footprints of postglacial recolonization by oaks. Proc. Natl. Acad. Sci. USA 1997, 94, 9996–10001. [Google Scholar] [CrossRef] [Green Version]
- Forcioli, D.; Saumitou-Laprade, P.; Valero, M.; Vernet, P.; Cuguen, J. Distribution of chloroplast DNA diversity within and among populations in gynodioecious Beta vulgaris ssp. maritima (Chenopodiaceae). Mol. Ecol. 1998, 7, 1193–1204. [Google Scholar] [CrossRef]
- Caron, H.; Dumas, S.; Marque, G.; Messier, C.; Bandou, E.; Petit, R.; Kremer, A. Spatial and temporal distribution of chloroplast DNA polymorphism in a tropical tree species. Mol. Ecol. 2000, 9, 1089–1098. [Google Scholar] [CrossRef]
- Petit, R.J.; El Mousadik, A.; Pons, O. Identifying populations for conservation on the basis of genetic markers. Conserv. Biol. 1998, 12, 844–855. [Google Scholar] [CrossRef]
- Schuelke, M. An economic method for the fluorescent labeling of PCR fragments. Nat. Biotechnol. 2000, 18, 233–234. [Google Scholar] [CrossRef]
- Holland, M.M.; Parson, W. GeneMarker® HID: A reliable software tool for the analysis of forensic STR data. J. Forensic Sci. 2011, 56, 29–35. [Google Scholar] [CrossRef]
- Peakall, R.; Smouse, P.E. GENALEX 6: Genetic analysis in Excel. Population genetic software for teaching and research. Mol. Ecol. Notes 2006, 6, 288–295. [Google Scholar] [CrossRef]
- Liu, K.; Muse, S.V. PowerMarker: An integrated analysis environment for genetic marker analysis. Bioinformatics 2005, 21, 2128–2129. [Google Scholar] [CrossRef] [Green Version]
- Pritchard, J.K.; Wen, W. Documentation for STRUCTURE Software: Version 2; University of Chicago: Chicago, IL, USA, 2003. [Google Scholar]
- Earl, D.A. STRUCTURE HARVESTER: A website and program for visualizing STRUCTURE output and implementing the Evanno method. Conserv. Genet. Resour. 2012, 4, 359–361. [Google Scholar] [CrossRef]
- Jakobsson, M.; Rosenberg, N.A. CLUMPP: A cluster matching and permutation program for dealing with label switching and multimodality in analysis of population structure. Bioinformatics 2007, 23, 1801–1806. [Google Scholar] [CrossRef] [Green Version]
- Kumar, S.; Stecher, G.; Tamura, K. MEGA7: Molecular evolutionary genetics analysis version 7.0 for bigger datasets. Mol. Biol. Evol. 2016, 33, 1870–1874. [Google Scholar] [CrossRef] [Green Version]
- Letunic, I.; Bork, P. Interactive Tree of Life (iTOL) v4: Recent updates and new developments. Nucleic Acids Res. 2019, 47, W256–W259. [Google Scholar] [CrossRef] [Green Version]
- Yeh, F.; Yang, R.C.; Boyle, T.B.J.; Ye, Z.; Xiyan, J.M.; Yang, R.; Boyle, T.J. PopGene32, Microsoft Windows-Based Freeware for Population Genetic Analysis. Version 1.32; University of Alberta: Edmonton, AB, Canada, 2000. [Google Scholar]
- Schneider, S.D.; Roessli, D.; Excoffier, L. Arlequin: A software for population genetics data analysis. User Man. Ver 2000, 2, 2496–2497. [Google Scholar]
- Hall, T. BioEdit: An important software for molecular biology. GERF Bull. Biosci. 2011, 2, 60–61. [Google Scholar]
- Rozas, J.; Ferrer-Mata, A.; Sánchez-DelBarrio, J.C.; Guirao-Rico, S.; Librado, P.; Ramos-Onsins, S.E.; Sánchez-Gracia, A. DnaSP 6: DNA sequence polymorphism analysis of large data sets. Mol. Biol. Evol. 2017, 34, 3299–3302. [Google Scholar] [CrossRef]
- Clement, M.; Posada, D.C.K.A.; Crandall, K.A. TCS: A computer program to estimate gene genealogies. Mol. Ecol. 2000, 9, 1657–1659. [Google Scholar]
- Pons, O.; Petit, R. Measuring and testing genetic differentiation with ordered versus unordered alleles. Genetics 1996, 144, 1237–1245. [Google Scholar]
- Verma, S.; Rana, T.S.; Ranade, S.A. Genetic variation and clustering in Murraya paniculata complex as revealed by single primer amplification reaction methods. Curr. Sci. India 2009, 96, 1210–1216. [Google Scholar]
- George, S.; Sharma, J.; Yadon, V.L. Genetic diversity of the endangered and narrow endemic Piperia yadonii (Orchidaceae) assessed with ISSR polymorphisms. Am. J. Bot. 2009, 96, 2022–2030. [Google Scholar] [CrossRef]
- Qiao, Q.; Zhang, C.Q.; Milne, R.I. Population genetics and breeding system of Tupistra pingbianensis (Liliaceae), a naturally rare plant endemic to SW China. J. Syst. Evol. 2010, 48, 47–57. [Google Scholar] [CrossRef]
- Setsuko, S.; Ishida, K.; Tomaru, N. Size distribution and genetic structure in relation to clonal growth within a population of Magnolia tomentosa Thunb. (Magnoliaceae). Mol. Ecol. 2004, 13, 2645–2653. [Google Scholar] [CrossRef]
- Zhao, X.; Ma, Y.; Sun, W.; Wen, X.; Milne, R. High genetic diversity and low differentiation of Michelia coriacea (Magnoliaceae), a critically endangered endemic in southeast Yunnan, China. Int. J. Mol. Sci. 2012, 13, 4396–4411. [Google Scholar] [CrossRef] [Green Version]
- Wang, L.; Xiao, A.H.; Ma, L.Y.; Chen, F.J.; Sang, Z.Y.; Duan, J. Identification of Magnolia wufengensis (Magnoliaceae) cultivars using phenotypic traits, SSR and SRAP markers: Insights into breeding and conservation. Genet. Mol. Res. 2017, 16. [Google Scholar] [CrossRef]
- Nybom, H. Comparison of different nuclear DNA markers for estimating intraspecific genetic diversity in plants. Mol. Ecol. 2004, 13, 1143–1155. [Google Scholar] [CrossRef]
- Lázaro-Nogal, A.; Matesanz, S.; García-Fernández, A.; Traveset, A.; Valladares, F. Population size, center–periphery, and seed dispersers’ effects on the genetic diversity and population structure of the Mediterranean relict shrub Cneorum tricoccon. Ecol. Evol. 2017, 7, 7231–7242. [Google Scholar] [CrossRef] [Green Version]
- Hewitt, A.; Rymer, P.; Holford, P.; Morris, E.C.; Renshaw, A. Evidence for clonality, breeding system, genetic diversity and genetic structure in large and small populations of Melaleuca deanei (Myrtaceae). Aust. J. Bot. 2019, 67, 36–45. [Google Scholar] [CrossRef]
- Tamaki, I.; Setsuko, S.; Tomaru, N. Genetic diversity and structure of remnant Magnolia stellata populations affected by anthropogenic pressures and a conservation strategy for maintaining their current genetic diversity. Conserv. Genet. 2016, 17, 715–725. [Google Scholar] [CrossRef]
- Bezemer, N.; Krauss, S.L.; Roberts, D.G.; Hopper, S.D. Conservation of old individual trees and small populations is integral to maintain species’ genetic diversity of a historically fragmented woody perennial. Mol. Ecol. 2019, 28, 3339–3357. [Google Scholar] [CrossRef]
- Leimu, R.; Mutikainen, P.; Koricheva, J.; Fischer, M. How general are positive relationships between plant population size, fitness and genetic variation? J. Ecol. 2006, 94, 942–952. [Google Scholar] [CrossRef]
- Lu, S.Y.; Hong, K.H.; Liu, S.L.; Cheng, Y.P.; Wu, W.L.; Chiang, T.Y. Genetic variation and population differentiation of Michelia formosana (Magnoliaceae) based on cpDNA variation and RAPD fingerprints: Relevance to post-Pleistocene recolonization. J. Plant Res. 2002, 115, 203–216. [Google Scholar] [CrossRef]
- Azuma, H.; Thien, L.B.; Kawano, S. Molecular phylogeny of Magnolia (Magnoliaceae) inferred from cpDNA sequences and evolutionary divergence of the floral scents. J. Plant Res. 1999, 112, 291–306. [Google Scholar] [CrossRef]
- Frankham, R.; Briscoe, D.A.; Ballou, J.D. Introduction to Conservation Genetics; Cambridge University Press: Cambridge, UK, 2002. [Google Scholar]
- Yu, H.H.; Yang, Z.L.; Sun, B.; Liu, R.N. Genetic diversity and relationship of endangered plant Magnolia officinalis (Magnoliaceae) assessed with ISSR polymorphisms. Biochem. Syst. Ecol. 2011, 39, 71–78. [Google Scholar] [CrossRef]
- Young, A.G.; Merriam, H.G.; Warwick, S.I. The effects of forest fragmentation on genetic variation in Acer saccharum Marsh. (sugar maple) populations. Heredity 1993, 71, 277–289. [Google Scholar] [CrossRef] [Green Version]
- Chai, Y.; Jin, X.; Cai, M. Pollination biology of Michelia crassipes YW Law. In Proceedings of the II International Symposium on Germplasm of Ornamentals, Atlanta, GA, USA, 8–12 August 2016; International Society for Horticultural Science: Leuven, Belgium, 2017; pp. 297–304. [Google Scholar]
- Zhao, X.; Sun, W. Abnormalities in sexual development and pollinator limitation in Michelia coriacea (Magnoliaceae), a critically endangered endemic to Southeast Yunnan, China. Flora 2009, 204, 463–470. [Google Scholar] [CrossRef]
- Zhang, X.; Shen, S.; Wu, F.; Wang, Y. Inferring genetic variation and demographic history of Michelia yunnanensis Franch. (Magnoliaceae) from chloroplast DNA sequences and microsatellite markers. Front. Plant Sci. 2017, 8, 583. [Google Scholar] [CrossRef] [PubMed] [Green Version]
- Han, Q.; Higashi, H.; Mitsui, Y.; Setoguchi, H. Distinct phylogeographic structures of wild radish (Raphanus sativus L. var. raphanistroides Makino) in Japan. PLoS ONE 2015, 10, e0135132. [Google Scholar] [CrossRef] [PubMed] [Green Version]
- Wright, S. Evolution in Mendelian populations. Genetics 1931, 16, 97–159. [Google Scholar]
- Tian, K.; Zhang, G.; Cheng, X.; He, S.; Yang, Y.; Yang, Y. The habitat fragility of Manglietiastrum sinicum. Acta Bot. Yunnanica 2003, 25, 551–556. [Google Scholar]
- Allendorf, F.W. Isolation, gene flow and genetic differentiation among populations. In Genetics and Conservation: A Reference for Managing Wild Animal and Plant Populations; Schoenwald-Cox, C.M., Chambers, S.M., Thomas, W.L., Eds.; Menlo Park/Benjamin Cummings: San Francisco, CA, USA, 1983; pp. 51–65. [Google Scholar]
- Moyle, L.C. Correlates of genetic differentiation and isolation by distance in 17 congeneric Silene species. Mol. Ecol. 2006, 15, 1067–1081. [Google Scholar] [CrossRef]
- Holsinger, K.E.; Gottlieb, L.; Falk, D.A. Conservation of rare and endangered plants: Principles and prospects. In Genetics and Conservation of Rare Plants; Falk, D.A., Holsinger, K.E., Eds.; Oxford University Press: Oxford, UK, 1991; pp. 195–208. [Google Scholar]
- Kawecki, T.J.; Ebert, D. Conceptual issues in local adaptation. Ecol. Lett. 2004, 7, 1225–1241. [Google Scholar] [CrossRef] [Green Version]
- Shi, X.; Kohn, B.; Spencer, S.; Guo, X.; Li, Y.; Yang, X.; Shi, H.; Gleadow, A. Cenozoic denudation history of southern Hainan Island, South China Sea: Constraints from low temperature thermochronology. Tectonophysics 2011, 504, 100–115. [Google Scholar] [CrossRef]
- Liang, G. A study of the genesis of Hainan Island. Geol. China 2018, 45, 693–705. [Google Scholar]
- Zhou, T.H.; Dong, S.S.; Li, S.; Zhao, G.F. Genetic structure within and among populations of Saruma henryi, an endangered plant endemic to China. Biochem. Genet. 2012, 50, 146–158. [Google Scholar] [CrossRef]
- Ge, X.J.; Zhou, X.L.; Li, Z.C.; Hsu, T.W.; Schaal, B.A.; Chiang, T.Y. Low genetic diversity and significant population structuring in the relict Amentotaxus argotaenia complex (Taxaceae) based on ISSR fingerprinting. J. Plant Res. 2005, 118, 415–422. [Google Scholar] [CrossRef]
- Li, J.M.; Jin, Z.X. Genetic structure of endangered Emmenopterys henryi Oliv. based on ISSR polymorphism and implications for its conservation. Genetica 2008, 133, 227–234. [Google Scholar] [CrossRef]
Figure 1.
The correlation coefficient between population genetic diversity parameters and population size of Michelia shiluensis.
Figure 1.
The correlation coefficient between population genetic diversity parameters and population size of Michelia shiluensis.

Figure 2.
Genetic relation among six populations of Michelia shiluensis analyzed by STRUCTURE based on nuclear single sequence repeat (nSSR) markers.
Figure 2.
Genetic relation among six populations of Michelia shiluensis analyzed by STRUCTURE based on nuclear single sequence repeat (nSSR) markers.

Figure 3.
Neighbor joining (NJ) tree among individuals was constructed by MEGA 7.0 using nSSR data.

Figure 4.
Mantel test among populations of Michelia shiluensis from nSSR markers. (a) Includes YC. (b) Excludes YC.
Figure 4.
Mantel test among populations of Michelia shiluensis from nSSR markers. (a) Includes YC. (b) Excludes YC.

Figure 5.
Location of the study populations and chloroplast haplotype relationships and distribution in six accessions of Michelia shiluensis. The radius of the pie charts is proportional to the number of individual haplotypes in each population.
Figure 5.
Location of the study populations and chloroplast haplotype relationships and distribution in six accessions of Michelia shiluensis. The radius of the pie charts is proportional to the number of individual haplotypes in each population.

Figure 6.
Maximum Likelihood (ML) tree based on six haplotypes of the cpDNA fragment with Michelia odora as an outgroup. The numbers are percentage values over 1000 bootstrap replicates. Only bootstrap values over 50% are shown.
Figure 6.
Maximum Likelihood (ML) tree based on six haplotypes of the cpDNA fragment with Michelia odora as an outgroup. The numbers are percentage values over 1000 bootstrap replicates. Only bootstrap values over 50% are shown.

Figure 7.
Multimodal plots from mismatch distribution of Michelia shiluensis analyzed by DnaSP.

Figure 8.
Mantel test among six populations of Michelia shiluensis from cpDNA markers. (a) Includes YC. (b) Excludes YC.
Figure 8.
Mantel test among six populations of Michelia shiluensis from cpDNA markers. (a) Includes YC. (b) Excludes YC.


Table 1.
Genetic diversity parameters among six populations of Michelia shiluensis.
| Pop | N | Na ± SE | Ne ± SE | I ± SE | Ho ± SE | He ± SE | Np | FIS ± SE | PPL (%) |
|---|---|---|---|---|---|---|---|---|---|
| DL | 49 | 9.500 ± 1.195 | 5.174 ± 0.824 | 1.784 ± 0.137 | 0.694 ± 0.033 | 0.773 ± 0.035 | 24 | 0.093 ± 0.050 | 100.00 |
| BS | 7 | 6.250 ± 0.526 | 4.380 ± 0.470 | 1.606 ± 0.095 | 0.786 ± 0.071 | 0.753 ± 0.026 | 3 | -0.044 ± 0.092 | 100.00 |
| YG | 5 | 5.375 ± 0.596 | 4.275 ± 0.619 | 1.483 ± 0.151 | 0.750 ± 0.098 | 0.715 ± 0.058 | 4 | -0.054 ± 0.105 | 100.00 |
| WZ | 5 | 4.750 ± 0.648 | 3.598 ± 0.416 | 1.316 ± 0.197 | 0.700 ± 0.120 | 0.650 ± 0.094 | 3 | −0.080 ± 0.096 | 87.50 |
| CJ | 8 | 5.625 ± 0.885 | 4.053 ± 0.614 | 1.447 ± 0.172 | 0.563 ± 0.085 | 0.701 ± 0.054 | 2 | 0.207 ± 0.099 | 100.00 |
| YC | 4 | 4.625 ± 0.324 | 3.936 ± 0.399 | 1.402 ± 0.109 | 0.625 ± 0.082 | 0.715 ± 0.046 | 7 | 0.095 ± 0.127 | 100.00 |
| Mean | 13 | 6.021 ± 0.376 | 4.236 ± 0.233 | 1.506 ± 0.061 | 0.686 ± 0.035 | 0.718 ± 0.023 | 7.17 | 0.039 ± 0.040 | 97.92 |
| Overall | 78 | 14.375 ± 1.647 | 7.019 ± 0.971 | 2.120 ± 0.153 | 0.689 ± 0.025 | 0.825 ± 0.039 | - | 0.156 ± 0.033 | 100.00 |
Notes: DL, DiaoLuoShan Nature Reserve; BS, BaiSha County; YG, YingGeLing Nature Reserve; WZ, WuZhiShan Nature Reserve; CJ, ChangJiang County; YC, YangChun E’HuangZhang Nature Reserve; N, number of samples; Na, number of alleles; Ne, number of effective alleles; I, Shannon index; Ho, observed heterozygosity; He, expected heterozygosity; Np, number of private alleles; FIS, population inbreeding coefficient; PPL, percentage of polymorphic loci.
Table 2.
AMOVA result for six populations from nSSR markers and cpDNA haplotypes.
| Markers | Source of Variation | Degree of Freedom | Sum of Squares | Variance Component | Percentage of Variation | p Value |
|---|---|---|---|---|---|---|
| nSSR | Among populations | 5 | 47.296 | 0.353 | 10.18 | <0.01 |
| Within populations | 150 | 467.370 | 3.116 | 89.92 | <0.01 | |
| Total | 155 | 514.667 | 3.469 | 100 | ||
| cpDNA | Among populations | 5 | 66.612 | 1.437 | 77.56 | <0.01 |
| Within populations | 72 | 29.927 | 0.416 | 22.44 | <0.01 | |
| Total | 77 | 96.539 | 1.853 | 100 |
Table 3.
Distribution of cpDNA haplotypes, Hd, and Pi among six populations of Michelia shiluensis.
| Haplotype | H1 | H2 | H3 | H4 | H5 | H6 | Sum | Hd | Pi | |
|---|---|---|---|---|---|---|---|---|---|---|
| Pops | DL | 34 | 12 | 3 | 0 | 0 | 0 | 49 | 0.464 | 0.00074 |
| BS | 0 | 0 | 7 | 0 | 0 | 0 | 7 | 0 | 0 | |
| YG | 0 | 0 | 2 | 2 | 1 | 0 | 5 | 0.800 | 0.00333 | |
| WZ | 0 | 0 | 5 | 0 | 0 | 0 | 5 | 0 | 0 | |
| CJ | 0 | 0 | 8 | 0 | 0 | 0 | 8 | 0 | 0 | |
| YC | 0 | 0 | 2 | 0 | 0 | 2 | 4 | 0.667 | 0.00117 | |
| Overall | 34 | 12 | 27 | 2 | 1 | 2 | 78 | 0.674 | 0.00220 | |
Table 4.
Neutrality test and mismatch distribution from cpDNA fragments of Michelia shiluensis.
| Hap. pops | Neutrality test | Mismatch distribution | ||
|---|---|---|---|---|
| Tajima’s D(P) | Fu’s FS(P) | SSD (PSSD) | HRag (PHRag) | |
| All pops | 0.075(0.525) | 2.786(0.904) | 0.059(0.25) | 0.190(0.41) |
© 2020 by the authors. Licensee MDPI, Basel, Switzerland. This article is an open access article distributed under the terms and conditions of the Creative Commons Attribution (CC BY) license (http://creativecommons.org/licenses/by/4.0/).
Share and Cite
MDPI and ACS Style
Deng, Y.; Liu, T.; Xie, Y.; Wei, Y.; Xie, Z.; Shi, Y.; Deng, X. High Genetic Diversity and Low Differentiation in Michelia shiluensis, an Endangered Magnolia Species in South China. Forests 2020, 11, 469. https://doi.org/10.3390/f11040469
AMA Style
Deng Y, Liu T, Xie Y, Wei Y, Xie Z, Shi Y, Deng X. High Genetic Diversity and Low Differentiation in Michelia shiluensis, an Endangered Magnolia Species in South China. Forests. 2020; 11(4):469. https://doi.org/10.3390/f11040469
Chicago/Turabian StyleDeng, Yanwen, Tingting Liu, Yuqing Xie, Yaqing Wei, Zicai Xie, Youhai Shi, and Xiaomei Deng. 2020. "High Genetic Diversity and Low Differentiation in Michelia shiluensis, an Endangered Magnolia Species in South China" Forests 11, no. 4: 469. https://doi.org/10.3390/f11040469
Note that from the first issue of 2016, this journal uses article numbers instead of page numbers. See further details here.