Effects of Moisture on Diffusion in Unmodified Wood Cell Walls: A Phenomenological Polymer Science Approach
by
 , , ,
, , ,
Joseph E. Jakes
1,* ,
,
Christopher G. Hunt
1,
Samuel L. Zelinka
2,
Peter N. Ciesielski
3 and
Nayomi Z. Plaza
1 1
Forest Biopolymers Science and Engineering, USDA Forest Service, Forest Products Laboratory, One Gifford Pinchot Drive, Madison, WI 53726, USA
2
Building and Fire Sciences, USDA Forest Service, Forest Products Laboratory, One Gifford Pinchot Drive, Madison, WI 53726, USA
3
Biosciences Center, National Renewable Energy Laboratory, 15013 Denver W Pkwy, Golden, CO 80401, USA
*
Author to whom correspondence should be addressed.
Forests 2019, 10(12), 1084; https://doi.org/10.3390/f10121084
Submission received: 23 August 2019
/
Revised: 21 November 2019
/
Accepted: 24 November 2019
/
Published: 29 November 2019
(This article belongs to the Special Issue Wood-Moisture Relations)
Abstract
:Despite the importance of cell wall diffusion to nearly all aspects of wood utilization, diffusion mechanisms and the detailed effects of moisture remain poorly understood. In this perspective, we introduce and employ approaches established in polymer science to develop a phenomenological framework for understanding the effects of moisture on diffusion in unmodified wood cell walls. The premise for applying this polymer-science-based approach to wood is that wood polymers (cellulose, hemicelluloses, and lignin) behave like typical solid polymers. Therefore, the movement of chemicals through wood cell walls is a diffusion process through a solid polymer, which is in contrast to previous assertions that transport of some chemicals occurs via aqueous pathways in the cell wall layers. Diffusion in polymers depends on the interrelations between free volume in the polymer matrix, molecular motions of the polymer, diffusant dimensions, and solubility of the diffusant in the polymer matrix. Because diffusion strongly depends on whether a polymer is in a rigid glassy state or soft rubbery state, it is important to understand glass transitions in the amorphous wood polymers. Through a review and analysis of available literature, we conclude that in wood both lignin and the amorphous polysaccharides very likely have glass transitions. After developing and presenting this polymer-science-based perspective of diffusion through unmodified wood cell walls, suggested directions for future research are discussed. A key consideration is that a large difference between diffusion through wood polymers and typical polymers is the high swelling pressures that can develop in unmodified wood cell walls. This pressure likely arises from the hierarchical structure of wood and should be taken into consideration in the development of predictive models for diffusion in unmodified wood cell walls.
Keywords:
wood; cellulose; hemicelluloses; lignin; water; diffusion; polymer; plasticization; glass transition; swelling pressure
1. Introduction
Renewable wood resources are poised to play a major role in our future bioeconomy, both as a feedstock for biorefineries producing energy, chemicals, and fuels, as well as continuing to be the basis for wood-based construction materials [1,2,3]. However, achieving the full potential of lignocellulosic biomass is hindered by an incomplete understanding of many fundamental properties, including how water and other chemicals are transported through wood cell walls. Water diffusion is important for wood-drying processes [4] and because it causes dimensional instabilities that can lead to checks and cracks in wood or failures in wood-adhesive bondlines [5,6]. Diffusive transport of inorganic ions within the cell wall is important to numerous processes, including biomass pretreatments in biorefineries [7], preservative treatments of wood [8], fungal decay of wood [9,10,11,12,13], and metal fastener corrosion in wood [14,15,16]. Diffusion of organic chemicals into wood cell walls is also important for chemically modifying wood [17] and creating durable wood-adhesive bondlines [6,18]. Fungal decay also depends on diffusion of organic chemicals into, and carbohydrate oligosaccharides out of, the cell wall [19,20]. An improved understanding of wood cell wall diffusion accompanied by the development of predictive models would accelerate the efforts of researchers seeking to design and optimize wood-based products for specific uses. For instance, promoting diffusion may facilitate the breakdown of woody biomass into useful molecular components in biorefineries, whereas preventing diffusion may protect wood-based construction materials from degradation caused by fungal decay and metal fastener corrosion.
Models to understand and predict mass transport through wood cell walls are lacking for many reasons. First, wood is a notoriously complex natural material composed of numerous types of polymers organized into hierarchical structures that span length scales from the molecular level (angstrom to a few nanometers) to the cellular level (micrometers to millimeters) and up to the tree level (centimeters to meters). This multiscale structure leads to difficulties associated with obtaining experimental data that de-couple intra-cell wall and inter-cell wall transport processes. Many studies that model bulk transport through woody materials employ approximations for transport in porous media that couple transport through cell wall material and void regions [21]. Eitelberger and Hofstetter developed an insightful multiscale homogenization approach that considers wood structure at multiple length scales [22], but the approach was lacking experimental validation of assumptions made at each scale. Furthermore, the salient details of the molecular and nano structure, which are critical for understanding cell wall mass transport, remain unresolved.
Another reason is that many of the models applied to understanding mass transport in bulk wood have their origins in pulp or textile research. Although pulp is derived from wood, its chemical make-up and nanostructure are very different from unmodified wood. With regards to mass transport, the removal of lignin and hemicelluloses during pulping creates pore volumes for mass transport that are not present in unmodified wood. Therefore, proposed mechanisms for transport through pulp, such as the model proposed by Stone and Scallan [23], are not applicable to unmodified wood. Many of the models developed over the past century for inorganic ion transport through wood cell walls have their origin in textile research and imply that inorganic ions diffuse through aqueous pathways in the wood cell walls [24,25,26,27]. However, such aqueous pathways have never been observed in unmodified wood. Previous experimental observations of the “loosely” bound water in wood cell walls that was proposed to form the aqueous pathways [27,28,29] are actually now understood to be an artifact of the sample preparation used in those studies [30].
Recently, it has been proposed and demonstrated that inorganic ions, such as potassium and copper ions, diffuse through unmodified wood cell walls via interconnecting pathways of amorphous polysaccharides (amorphous cellulose and hemicelluloses) that have passed through a moisture-induced glass transition and are in their rubbery state [31,32]. From a polymer science perspective, this is the expected diffusion mechanism. Larger diffusants, such as inorganic ions, do not appreciably diffuse through glassy amorphous polymers, whereas diffusion does occur through amorphous polymers that have passed through their glass transition and are in a rubbery state [33,34,35]. This change in diffusion at the glass transition is linked to the increases in free volume and cooperative motion relaxations in the polymer as it changes from a glassy state to a rubbery one [36,37,38].
In this perspective, the polymer science approaches are expanded to construct a polymer-science-based phenomenological framework to more broadly understand mechanisms for unmodified wood cell wall diffusion and the effects of changes in moisture. Wood is considered unmodified if it is not substantially different than the wood in a living tree with regards to its tissue structure, cell wall structure, nanostructure, or molecular structure. It may be dried intentionally, such as in a kiln or chip dryer, as long as the heating during drying does not cause substantial, irreversible property changes. A more thorough description of unmodified versus modified wood is provided later in Section 3.6.
The rest of this perspective is organized into six additional sections. Section 2 introduces the necessary polymer science terminology and concepts. Section 3 describes wood as a polymeric material. Section 4 develops the phenomenological framework for understanding wood cell wall diffusion using the polymer science terminology and concepts. An overall summary of the polymer-science-based phenomenological framework is given in Section 5. In Section 6 future directions for research are discussed. Finally, Section 7 provides a literature review and supplementary discussion on the evaluation of glass transitions in wood polymers.
2. Polymer Science Terminology and Concepts
The purpose of this section is to provide the needed background to develop a polymer-science-based phenomenological framework for understanding the effects of moisture on diffusion in unmodified wood cell walls. It is intended for the reader to use this section as a reference to understand the needed polymer science terminology and concepts. Because the reader may refer back to only one term or concept at a time, some information is included in multiple locations. For the most part, the terms and concepts are defined in an order that facilitates building the conceptual framework. But in some cases they are not, and it may be necessary to read through parts of this section multiple times. Particularly useful resources for preparing this section included books by Crank [33], Crank and Park [34], Ferry [30], and Lakes [35], in addition to review papers by Frisch [36] and Masaro and Zhu [37].
2.1. Polymer
A polymer is a substance composed of molecules with relatively high molecular mass whose structures are comprised of covalently bonded repeating units. These repeating units are composed of groups of atoms covalently bonded into relatively low molecular mass molecules. A molecule can be considered to have relatively high molecular mass if the removal or addition of a few units has a negligible effect on its properties [39].
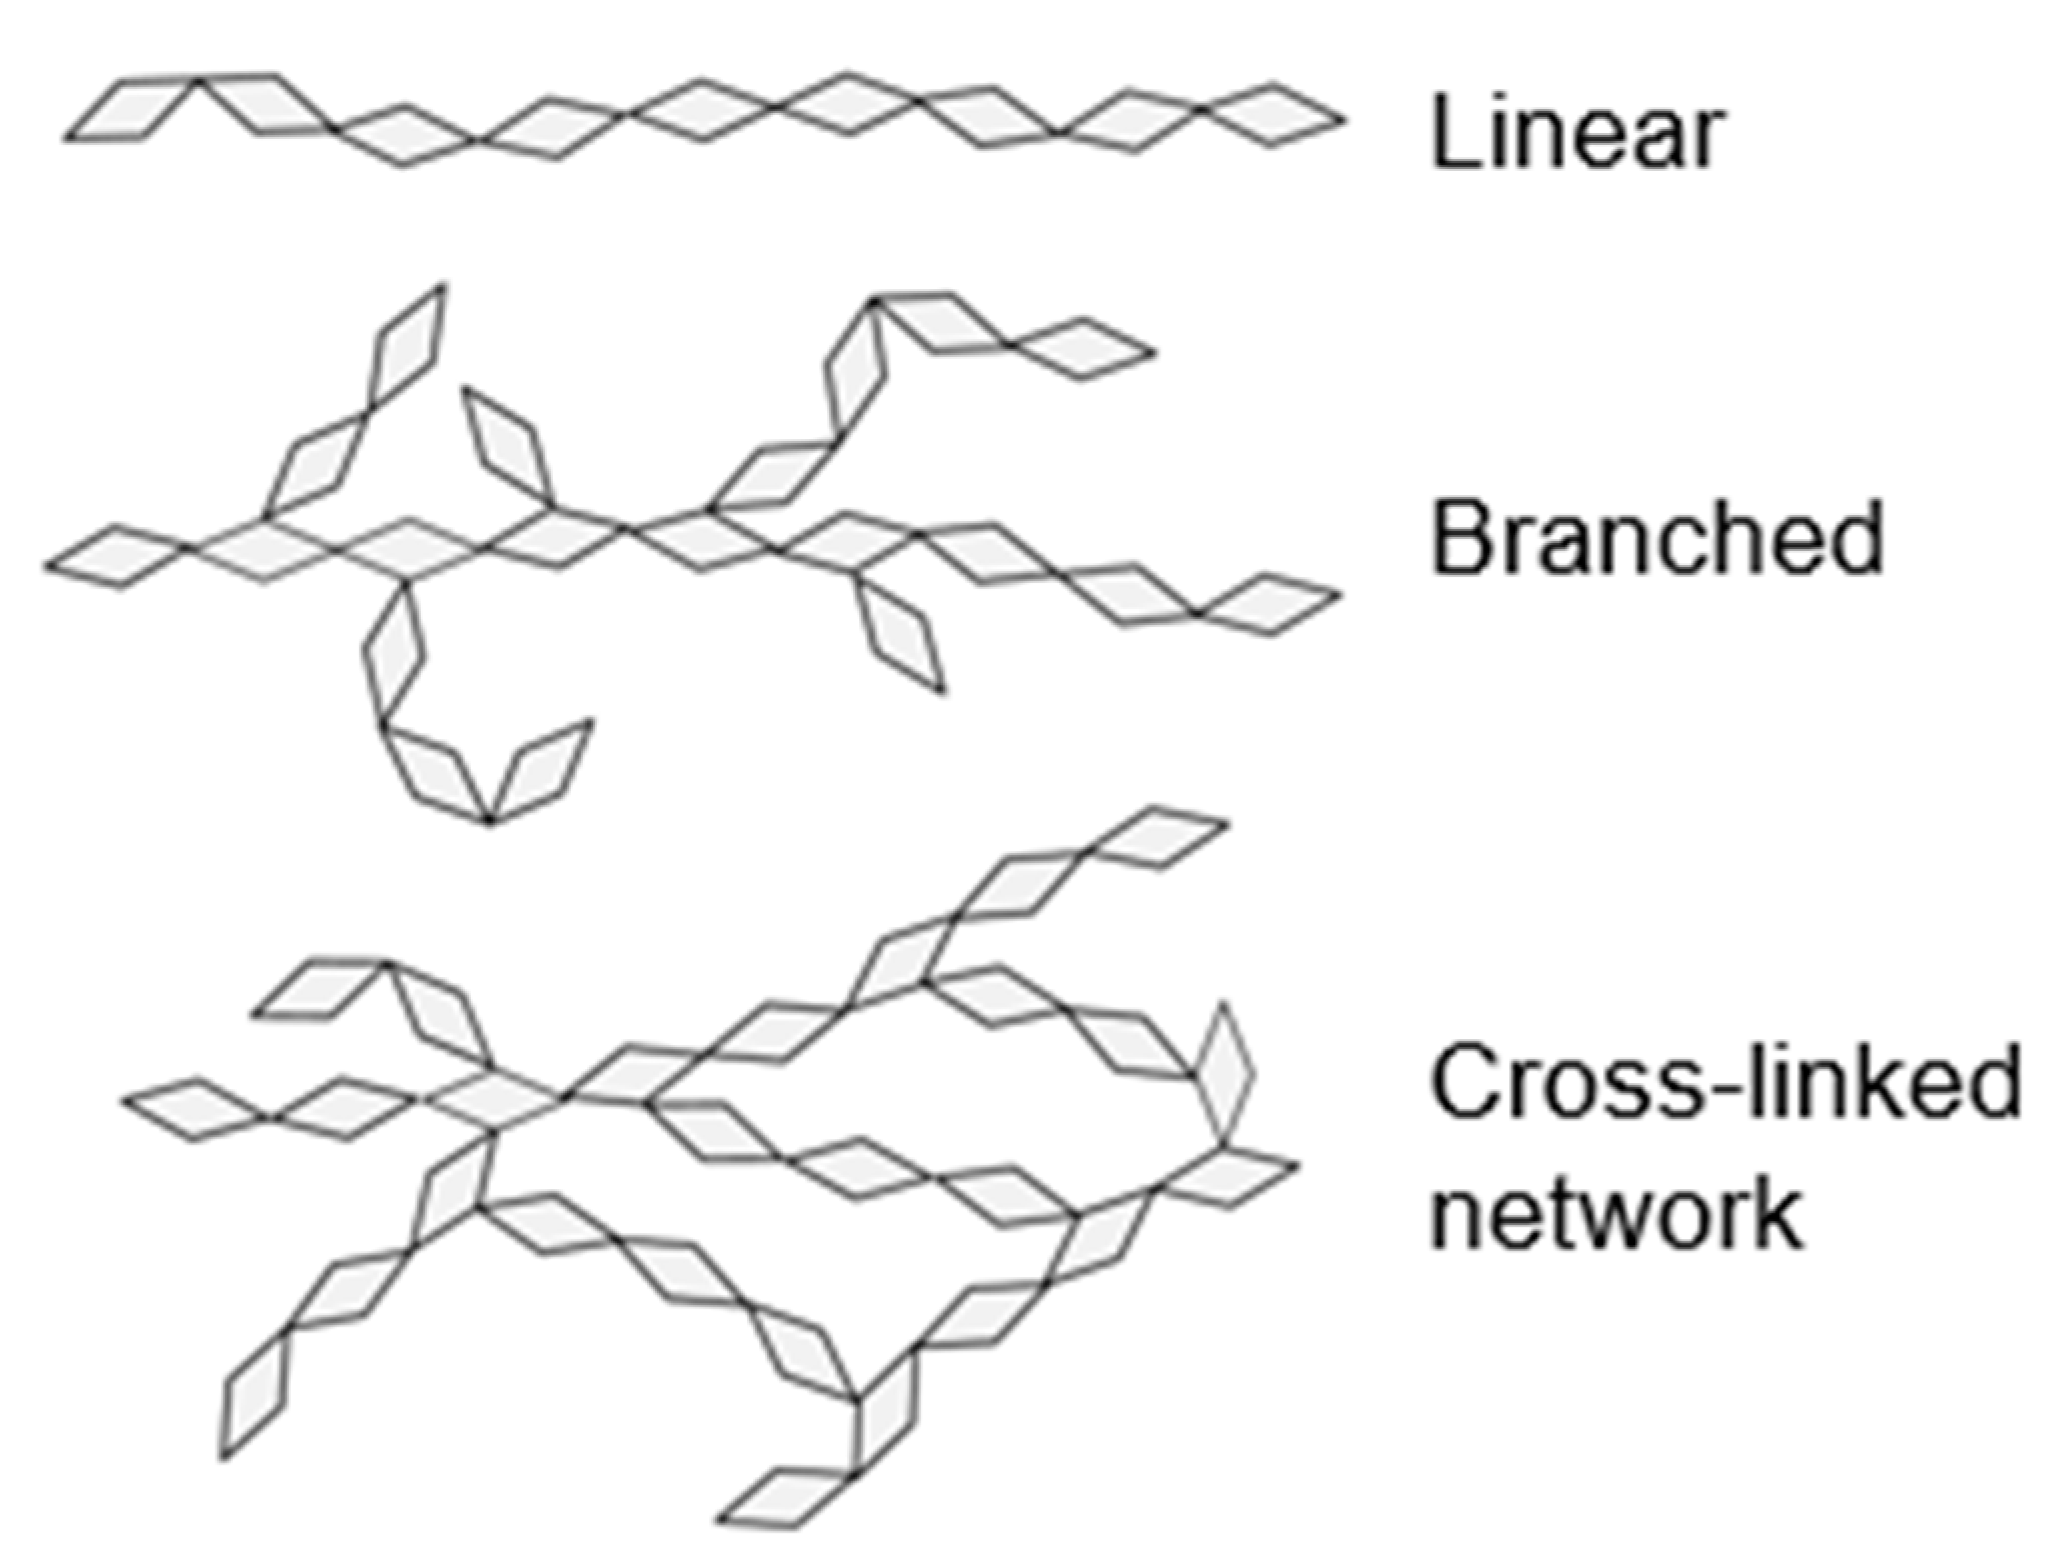
Figure 1 shows schematics of linear, branched, and cross-linked network types of polymers. Intra- and inter-polymer secondary bonds, including hydrogen bonding, ionic, polar, and Van der Waals intermolecular forces, play an integral role in determining polymer properties. Polymer chain entanglements can also affect polymer properties. In wood, the main polymers include cellulose (linear polysaccharide), hemicelluloses (branched polysaccharides), and lignin (aromatic cross-linked network polymer) [40]. All wood polymers have hydroxyl groups, and hydrogen bonding plays a major role in determining their mechanical and diffusion properties.
2.2. Free Volume
Free volume is the volume in matter not being occupied by atoms. In solid polymers, free volume generally consists of cavities with dimensions similar to the monomer and microscopic voids caused by chain packing irregularities [36]. Free volume generally increases with increases in temperature and decreases in pressure. The absorption of plasticizers, such as absorbed water in wood polymers, can also increase free volume.
2.3. Polymer Motions and Relaxation Spectra
The molecular structures of polymers are dynamic. Polymer mechanics, diffusion, and other properties are directly linked to the motions and relaxation spectra of its molecular structure. Molecular motions in polymers span a wide range of length-scales that can be grouped as follows [41]:
- Vibrational motion: Motions of individual atoms about their equilibrium positions.
- Small-scale motion: Motions of a side group or a few atoms (approximately 3–5) along a polymer backbone.
- Cooperative motion: Motions of large segments of atoms (approximately 40–50) along a polymer backbone. Glassy amorphous polymers are rigid and stiff because they lack cooperative motions. Rubbery amorphous polymers are soft and flexible because cooperative motions are active.
- Translation motion: Motions allowing polymers to flow past each other. Translational motion occurs in rubbery polymers that lack sufficient covalent cross-linking or chain entanglements to prevent the translation motion.
A wide spectrum of relaxation times are associated with these molecular motions, and in general the motions are enhanced with decreases in pressure, increases in temperature, and increases in plasticization [36,42]. For a given motion, the relaxation spectra follow Boltzmann distributions, which implies that under conditions in which a motion is not observed in any appreciable amount, the motion is still possible, but highly unlikely. This is why polymer matrix relaxations that require cooperative motions in glassy polymers, such as to accommodate perturbations in glassy polymer matrices caused by diffusant motion or swelling, take a long time.
2.4. Crystalline Polymer
Polymers with long-range order that are typically the result of regularity and symmetry in the polymer chains are referred to as crystalline. Secondary bonds, such as hydrogen bonding, hold the chains together in regular order. Crystalline polymers are often characterized by a melting temperature. In wood, groups of 18 or 24 cellulose chains form highly ordered elementary fibrils through intra- and inter-molecular hydrogen bonding [43]. These elementary fibrils are often referred to as “semi-crystalline” or “highly ordered”. An important aspect of the current discussion is that water cannot diffuse into the cores of the elementary fibrils because of strong hydrogen bonding within the highly ordered regions of the elementary fibrils [44].
2.5. Amorphous Polymer
Polymers without long-range order are termed amorphous. Amorphous polymers can be linear, branched, or cross-linked network polymers. Amorphous polymers are usually characterized by a glass transition temperature. In wood, cellulose (linear polysaccharide), hemicelluloses (branched polysaccharides), and lignin (aromatic cross-linked network polymer) are all found in an amorphous form.
2.6. Plasticizer
Plasticizers are typically low molecular-weight solvents capable of molecular dispersion within a polymer. The plasticizer must be thermodynamically compatible with the polymer to form a molecular solution and avoid phase separation. A plasticizer provides polymer segments greater mobility and quickens molecular-scale relaxations, which mechanistically is understood to occur by molecular dissolution of the plasticizer around polymer chains and increases in the free volume in the polymer. The plasticizer may also disrupt polymer–polymer secondary bonds, such as hydrogen bonds, effectively lubricating relative motions between neighboring polymers [36,42].
2.7. Water Sorption and Plasticization in Polymers with Hydrogen Bonding
In polymer assemblies with hydrogen bonding, such as lignocellulose, water can act as a plasticizer. The effect of water plasticization is the primary reason for moisture effects on diffusion in wood cell walls. Water plasticization is often more complicated than plasticization by other solvents because of the potential strong interactions between the plasticizing water molecules themselves. In amorphous polymers, various classifications can be used to describe absorbed water:
- Absorption in “holes”: Water molecules absorbed in “holes”, which are free volume elements large enough to accommodate a water molecule without perturbing the polymer molecular structure [45,46]. These water molecules may also be hydrogen bonded with hydrophilic moieties bordering the hole in the polymer network.
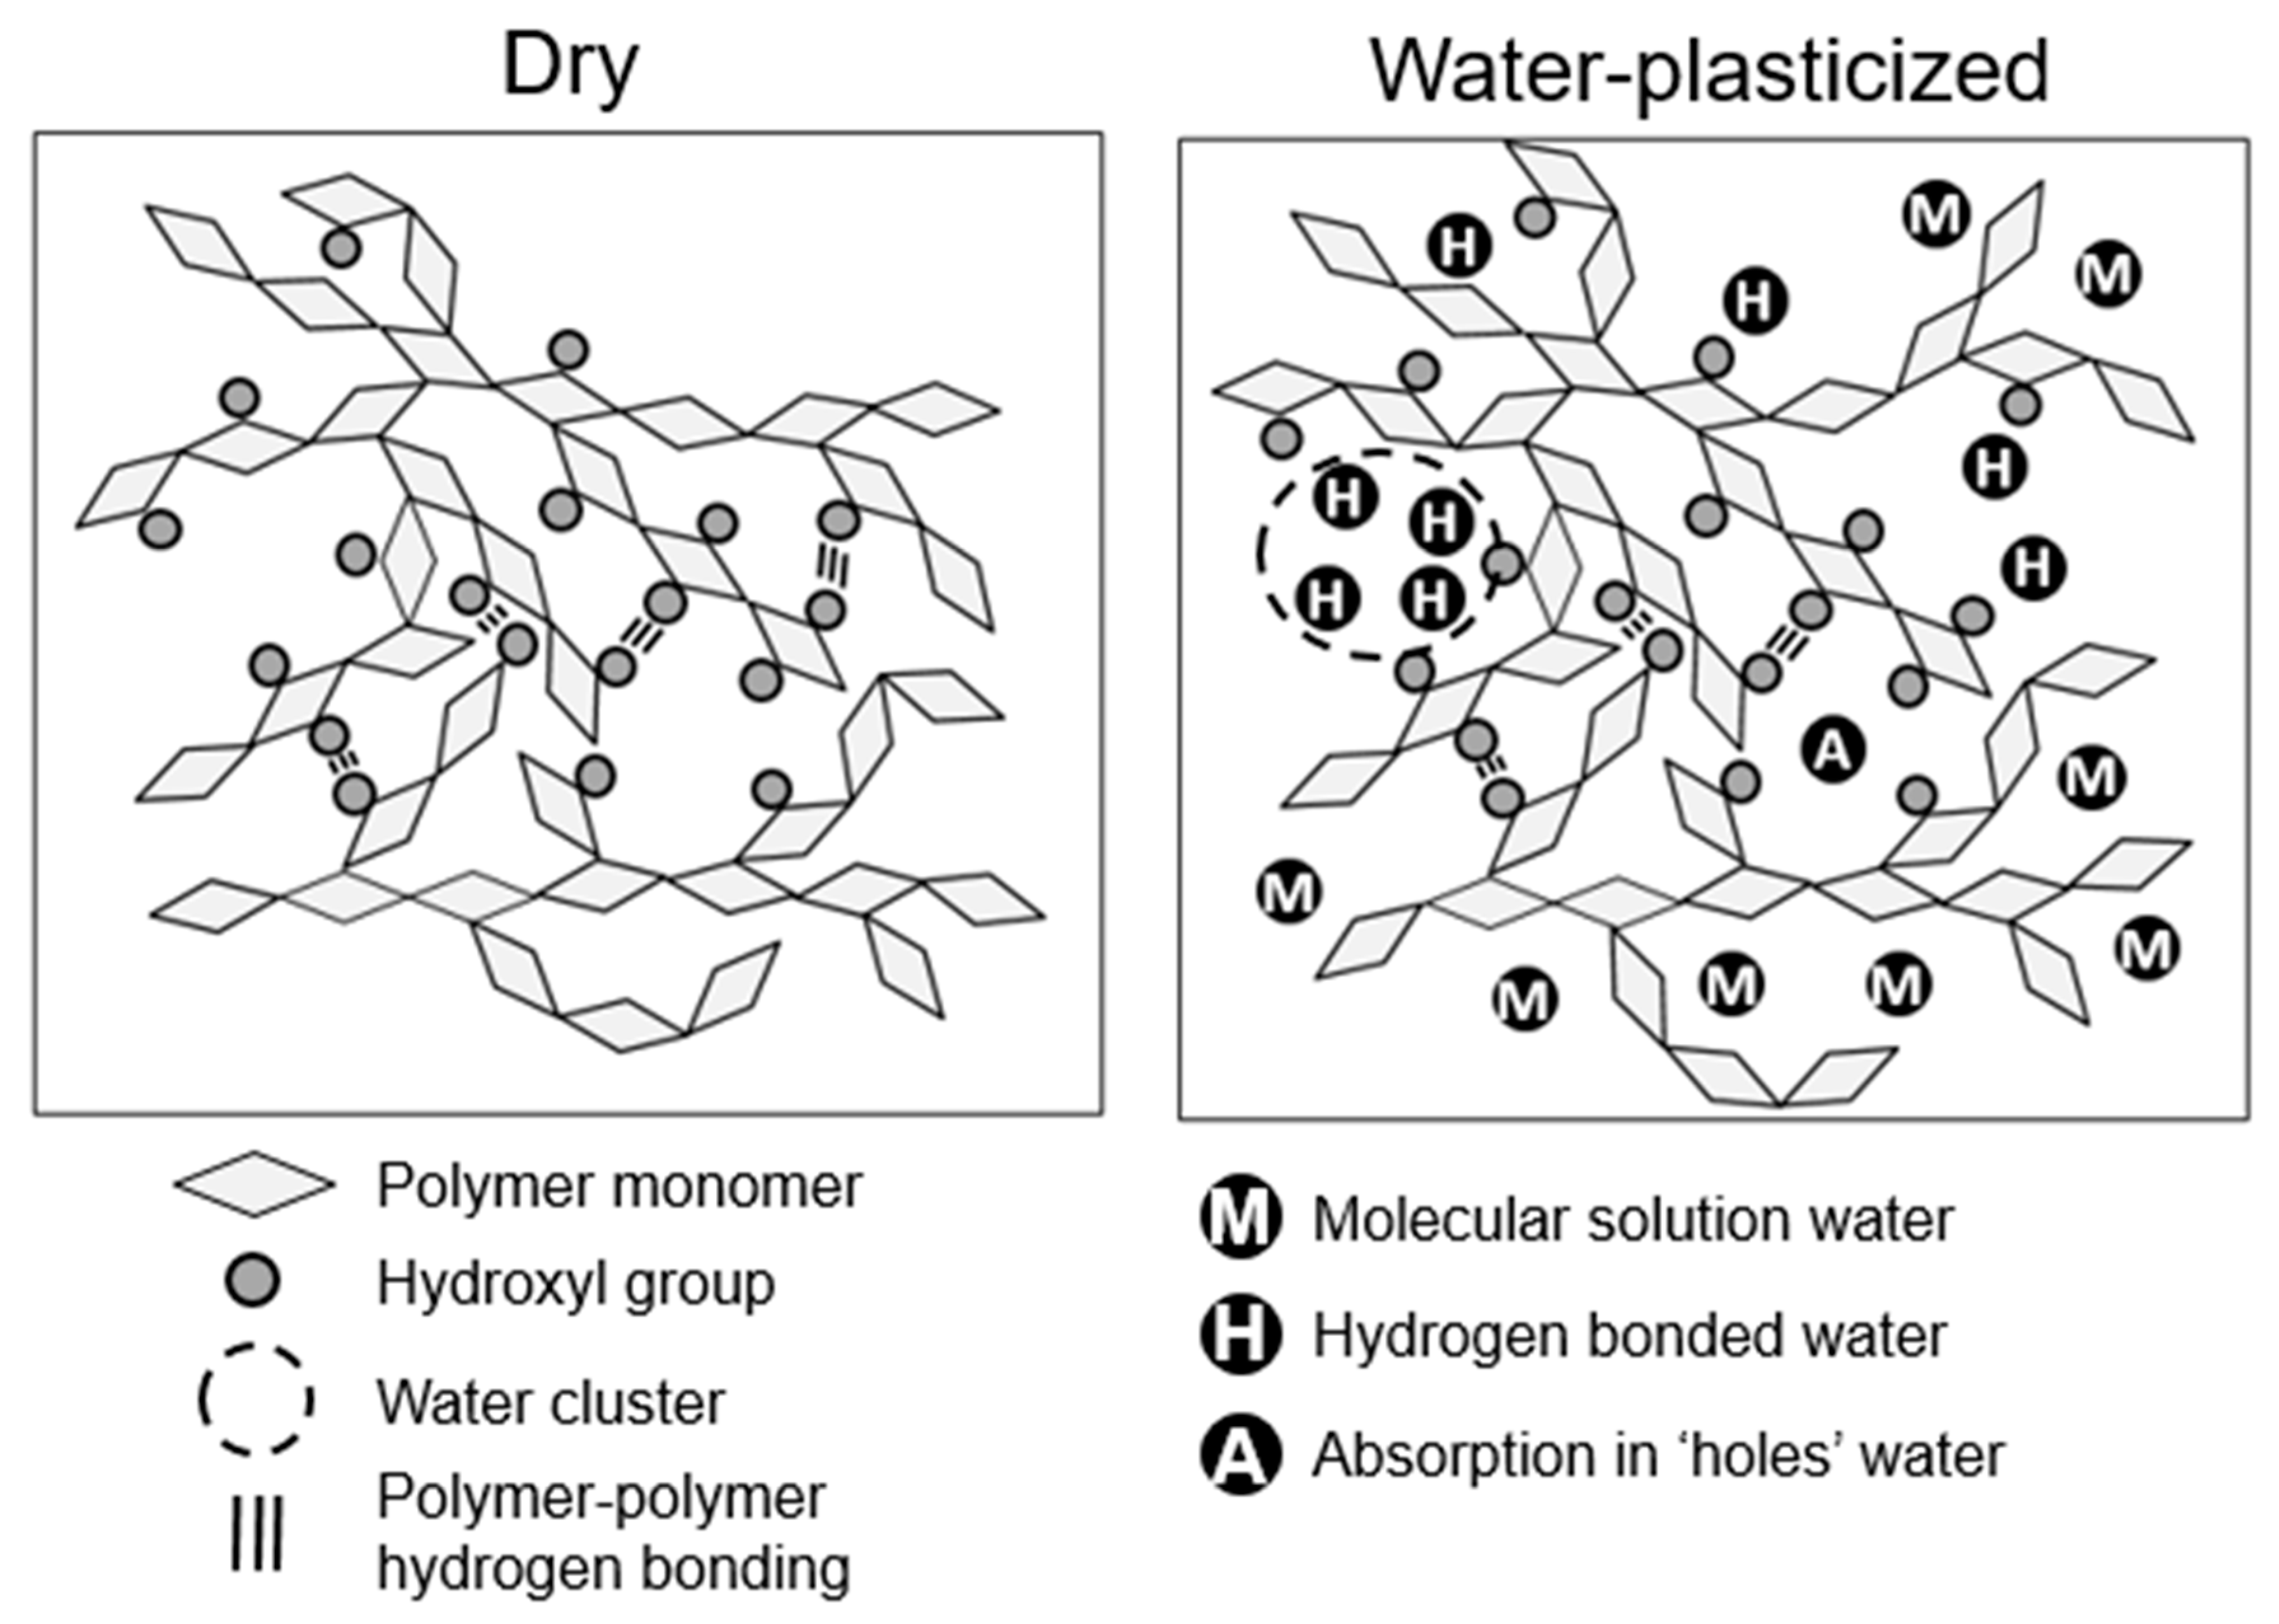
In amorphous polymers with hydrogen bonding, water plasticization typically results from a combination of water in the molecular solution and hydrogen bonded states [45,50]. Water residing in “holes” does not contribute to plasticization. Often at low moisture contents, there is a “plasticization lag”, in which the water is first absorbed into “holes”, and the water sorption and plasticization effects are not directly proportional [50,51]. Because water in clusters has fewer direct molecular-scale interactions with the polymers, it also has less of a plasticization effect than the molecular solution and hydrogen bonded water. Figure 2 shows schematics of the different types of water states in a polymer with hydrogen bonding.
2.8. Glass Transition
Glass transition is a transition in amorphous polymers associated with an abrupt change between glassy and rubbery states. The transition from glassy to rubbery states is promoted by increases in temperature, increases in plasticization, and decreases in pressure [36,42]. Large changes in available molecular motions and relaxations occur during the transition from glassy to rubbery states, most notably the activation of the cooperative motion of large segments of atoms (approximately 40–50) along a polymer backbone. The transition from glassy to rubbery states is also associated with an increase in the rate at which free volume is created with increases in temperature or plasticizer concentration.
2.9. Glassy Polymer
Amorphous polymers without sufficient energy for cooperative molecular motions are in their glassy state. Glassy polymers are typically characterized as hard and rigid. Translational motion and cooperative motion of large segments of atoms along a polymer backbone do not occur in any appreciable amount in glassy polymers. Because of the lack of cooperative motions, the molecular structure takes a long time to accommodate perturbations. In diffusion, these perturbations include expansions or contractions of the polymer matrix caused by a diffusant entering or leaving the polymer matrix. In glassy polymers, diffusion can be observed to be Fickian, Case II (non-Fickian), or anomalous (non-Fickian). The size of the diffusant and ratio of the relevant time-scales associated with molecular structure relaxations and diffusion process are largely responsible for differences in the type of observed diffusion process.
2.10. Rubbery Polymer
Amorphous polymers with sufficient energy for cooperative molecular motions are in their rubbery state. Rubbery polymers are typically characterized as soft and flexible. Cooperative motions of large segments of atoms (approximately 40–50) along a polymer backbone occur regularly in rubbery polymers. As a result, perturbations to a rubbery polymer’s structure, such as those caused by a diffusant entering or leaving the polymer matrix, are quickly accommodated. Because the time-scales associated with the molecular relaxation are much faster than typical diffusion processes, diffusion is most often Fickian in rubbery polymers [52]. Additionally, in comparison to its glassy state, diffusion is promoted because of the higher amounts of free volume in rubbery polymers. Translational motion may also occur if the polymer network is not constricted by frequent cross-linking or chain entanglements.
2.11. Glass Transitions in Polymer Blends
Polymer blends are mixtures of multiple types of polymers, such as the mixtures of cellulose, hemicelluloses, and lignin in a wood cell wall. Their glass transition(s) depend on the glass transitions of the individual polymers and their miscibility with each other [53]:
- Miscible blends exhibit a single glass transition that is usually a weight average for the individual polymers.
- Compatible blends have a glass transition for each polymer, but the glass transitions depend on the relative concentrations of the different polymers and their interactions.
- Immiscible blends exhibit the glass transitions of the individual polymers.
2.12. Glass Transitions in Reinforced Polymer Nanocomposites
Reinforced polymer nanocomposites consist of a reinforcing phase embedded in a polymer matrix, such as in wood cell walls with cellulose elementary fibrils embedded in a matrix of amorphous cellulose, hemicelluloses, and lignin. The effect of the reinforcing phase on the glass transition of the amorphous components in the matrix phase has been extensively studied and observed to increase, decrease, or not be affected [54,55]. Current glass transition theories are unable to account for this wide range of behavior.
2.13. Diffusion
Diffusion is a process resulting in matter being transported from one part of a system to another that is a consequence of random molecular motions [56]. In the presence of concentration gradients, diffusion results in the transport of matter from areas of higher concentrations to lower concentrations. Rates of diffusion depend on the state of the matter in the system, with approximate rates in gases (10 cm/min) being much higher than liquids (0.05 cm/min) and solids (0.0001 cm/min) [57]. In bulk wood, diffusion through inter-cell wall pore space filled with water or air would be expected to be much faster than diffusion into the solid cell wall material. Although diffusion in liquids and gases can generally be described by established theories, diffusion in solids is quite complex and rates can differ by 10 orders of magnitude [57].
2.14. Diffusion in Polymers
Diffusion in polymers is very complex because it depends on a variety of interrelations between free volume in the polymer matrix, molecular motions of the polymer, diffusant dimensions, and solubility of the diffusant in the polymer matrix.
- Free volume theory is often used to conceptualize whether or not a diffusant may enter or move within the molecular network of a polymer. Increases in free volume promote diffusion [36,38,58,59]. Free volume generally increases with increases in temperature, increases in plasticization, and decreases in pressure. Diffusion occurs when a free volume element of sufficient volume develops next to a diffusant residing in the polymer matrix, and the diffusant has sufficient thermal energy to overcome the activation barrier to jump in to the neighboring free volume [60]. In amorphous polymers, the transition from glassy to rubbery states is associated with increases in rates of free volume creation and size of free volume elements [36,42].
- Molecular motions in polymers are grouped based on length-scales into vibrational, small-scale, cooperative, and translational motions. Sufficient thermal energy and adjacent free volume are needed for a molecular motion to occur. After the motion occurs, free volume is created in the volume vacated by the molecular motion. The sizes of the free volumes needed and vacated by the motion depend on the length-scale of the molecular motion. For instance, free volume elements associated with small-scale motions are much smaller than those associated with cooperative motions. Diffusion may occur when a diffusant neighbors the volume vacated by a molecular motion and is small enough with sufficient thermal energy to move into the vacated volume. The rate of diffusion is related to frequency of the formation of the needed free volume elements [60]. Above the glass transition in rubbery amorphous polymers, cooperative motions become active, which means that much larger free volume elements are created in the polymer network [36,60].
- Diffusant dimensions refer to the size and shape of the diffusant. Diffusion decreases with increasing diffusant size, and for a given molecular volume flattened or elongated diffusants diffuse faster than spherical diffusants [61]. As diffusant size increases or shape becomes more spherical, larger free volume elements are needed for diffusion. Compared to the glassy state, cooperative motions active in rubbery amorphous polymers result in larger free volume elements for the movement of diffusants with larger dimensions [36,60].
- Solubility of the diffusant into a polymer matrix is important in determining whether or not a solvent diffuses into a polymer. Solubility parameters, such as Hildebrand and Hansen, are typically used to determine solubility. The Hansen solubility parameters for wood polymers have been discussed [62]. The higher the solubility, the more thermodynamically favorable it is for the diffusant to enter and swell the polymer. In fact, extent of swelling is one of the methods used to determine solubility parameters [63].
In a given diffusant–polymer system, diffusants may enter a polymer and cause swelling when the chemical activity of the diffusant source outside the polymer is sufficiently high. Under these conditions, absorption is thermodynamically favorable and releases free energy of mixing, which has contributions from the heat of mixing and entropy of mixing [64,65]. The stretching of polymer chains during swelling requires elastic energy. In general, at equilibrium the extent of polymer swelling is reached when the mixing energy and elastic energy balance [64,65]. Increases in the chemical activity of the diffusant source increases the absorbent capacity of diffusant in the polymer, and hence increases swelling. The strain on the polymer chains results in a hydrostatic pressure being formed inside the polymer during swelling [66,67]. These swelling pressures increase with the extent of swelling. Additionally, they can increase when the swelling polymer is constrained, such as next to a stiff reinforcing phase in a fiber-reinforced polymer composite [68].
Increases in temperature, increases in plasticization, and decreases in pressure promote diffusion because these changes typically result in increases in free volume, larger-scale molecular motions, and quickening of molecular motions. In amorphous polymers, a rather abrupt and substantial increase in the size and quickening of the molecular motions occurs during the transition from a glassy to rubbery state. In particular, the cooperative motions become active in the rubbery state, which means that much larger free volume elements are created in the polymer network.
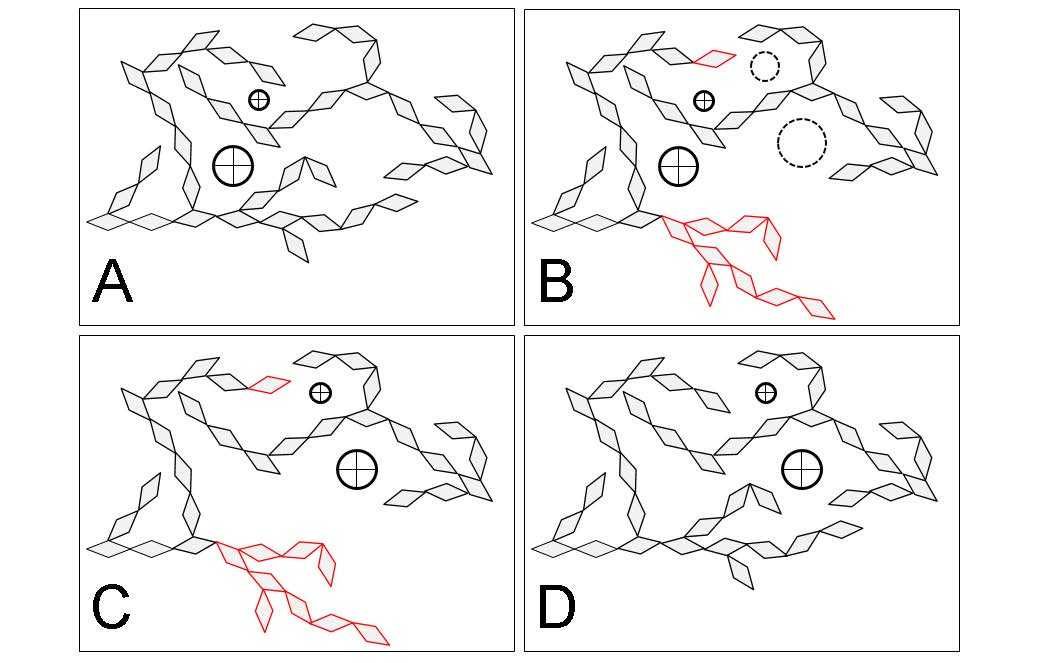
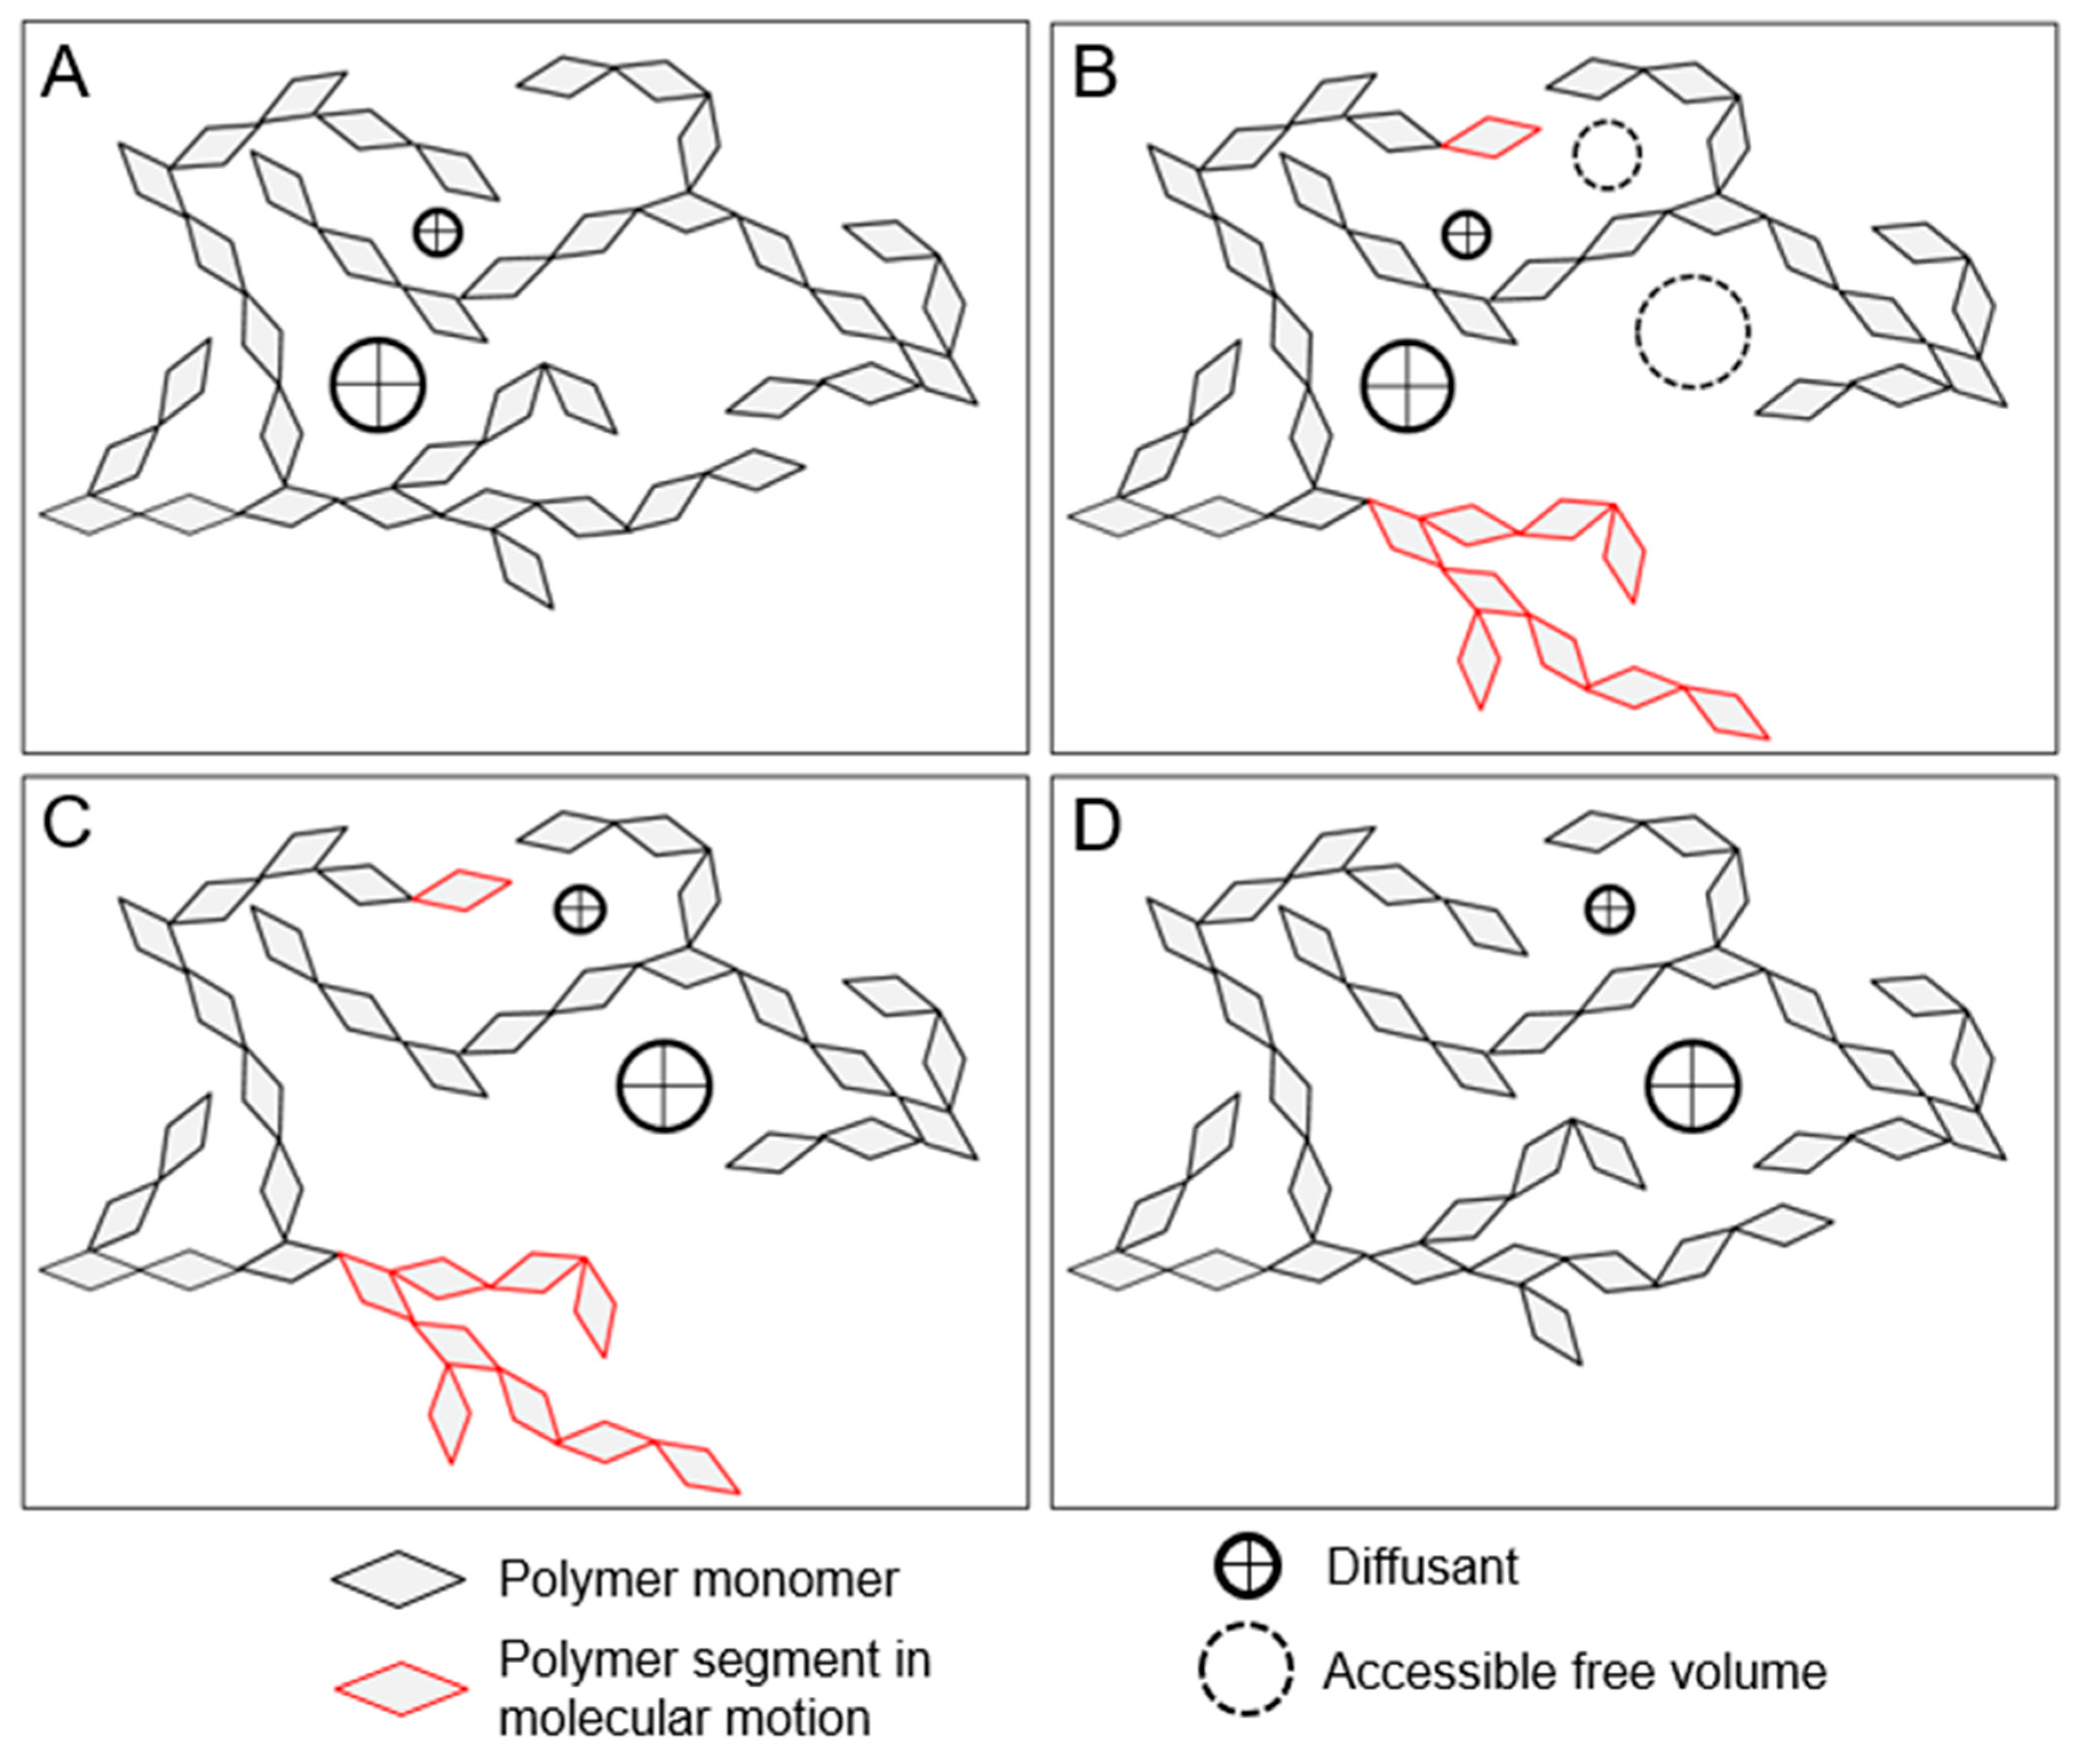
Diffusion is typically controlled by the smallest molecular motions needed for the movement of a given diffusant through a polymer matrix. Diffusion controlled by small-scale and cooperative motions is illustrated in Figure 3. Small diffusants, such as simple gases and water, depend on small-scale molecular motions [51,69]. For example, water diffusion in polyamides is directly related to motions of the amide side groups irrespective of whether the polymer is in its glassy or rubbery state [51]. In contrast, diffusion of larger diffusants, such as inorganic ions, depend on cooperative motions and only appreciably occurs in rubbery amorphous polymers [33,34]. This is because the diffusant is too large to move within the free volume formed in typical glassy polymer matrices and the larger free volume elements formed by cooperative motions in the rubbery state are needed for diffusion. Consequentially, inorganic ion diffusion in rubbery polymers is strongly coupled to the cooperative motion of polymers, which is often interpreted that the inorganic ion diffusion and polymer relaxations are being controlled by the same free volume increases in the polymer structure above the glass transition [36,37,38].
Diffusion in polymers has been observed to be Fickian, Case II (non-Fickian) and anomalous (non-Fickian) [70]. One key to predicting the type of diffusion process in polymers is understanding the ratios between the time-scales of the diffusion process and the molecular relaxations needed to accommodate the polymer matrix perturbations caused by the absorbed diffusant [46,52,56,70]. The cooperative motions, which are needed to relax the polymer matrix, are fast in rubbery polymers and very slow in glassy polymers. In general, cooperative motion relaxations in rubbery polymers occur faster than the diffusion process and diffusion is Fickian. In glassy polymers, the cooperative motion relaxations are slower and anomalous types of diffusion are often observed if the diffusion causes perturbations in the glassy polymer matrix. If the diffusion does not cause perturbations in the glassy polymer matrix, then diffusion is typically Fickian. It is likely that more than one type of diffusion occurs simultaneously in a polymer system, and the observed type is simply the most dominant under the given conditions [71].
The dimensionless diffusion Deborah number, which is defined as the ratio of a characteristic time of the relevant polymer motion to the characteristic time frame of the diffusion process, can be useful for anticipating the type of diffusion of a solvent in an amorphous polymer [72,73]. For large values, there is effectively no changes in the polymer matrix during the diffusion process and diffusion is Fickian. For small values, molecular relaxations in the polymer matrix are fast compared to the diffusion process, and again diffusion is Fickian. For diffusion Deborah numbers approximately equal to 1, the time scales are similar and anomalous diffusion is often observed.
A convenient way to differentiate the types of diffusion in sorption experiments is to utilize the relationship:
where Mt is the mass absorbed by a polymer per unit area, t is time, k is a constant, and n is a parameter related to the diffusion mechanism with typical values between 0.5 and 1 [52]. For Fickian and Case II diffusion, n is 0.5 and 1, respectively. Anomalous diffusion has n values between 0.5 and 1.
2.15. Fickian Diffusion in Polymers
Fickian diffusion is based on the Fick’s theory that rate of substance transport is directly proportional to the concentration gradient along the diffusion direction [56]. Generally, diffusion is considered Fickian if Fick’s 1st and 2nd laws are obeyed, and both the diffusion constant and boundary conditions are independent of time [46]. The value of n in Equation (1) is 0.5 for Fickian diffusion. Additional characteristics of Fickian diffusion, which includes diffusion with concentration-dependent diffusion constants, are listed in Crank [56]. In polymers, Fickian diffusion is generally observed when the diffusion process is not being influenced by the time-dependence of the cooperative motion relaxations needed to accommodate perturbations in the polymer matrix caused by diffusant motion or swelling. This occurs when the time scale of the diffusion process is slower than the time scale of the associated molecular relaxations, such as diffusion in rubbery polymers [52], or when the diffusant does not appreciably swell the polymer matrix because the diffusant size or change in concentration is too small.
2.16. Case II (Non-Fickian) Diffusion in Polymers
Case II (non-Fickian) diffusion in polymers is a special case of diffusion characterized by a sharp, well-defined solvent front moving through a polymer at a constant velocity [52]. In Equation (1), n = 1 for Case II diffusion. The front is a sharp boundary between a glassy region and swollen/rubbery region that is advancing into the glassy region. Fickian diffusion of the solvent is observed in the glassy polymer immediately ahead of the front. Case II diffusion occurs when the diffusion process is much faster than the molecular relaxation process [46,56,70].
2.17. Anomalous (Non-Fickian) Diffusion in Solid Polymers
Anomalous diffusion cannot be characterized using the simpler Fickian or Case II types of diffusion [56]. The value of n in Equation (1) is between 0.5 and 1 for anomalous diffusion. Generally, anomalous diffusion occurs in glassy polymers when the movement of diffusants depends on the time-dependent cooperative motions needed to accommodate diffusant perturbations in the polymer matrix, and therefore occurs on time scales similar to cooperative motions [46,70]. Additionally, anomalous diffusion may be caused by internal stress gradients in the swelling polymeric material and time-dependent surface concentrations [46,56]. Examples of the characteristics of anomalous diffusion are summarized in Crank [56] and Park [74].
3. Wood as a Polymeric Material
Wood is a polymeric material with a large degree of complexity arising from its multiscale structure. The complex multiscale structure of wood is one of its distinguishing features when compared to synthetic polymeric materials. In this section, we begin by describing the wood multiscale structure from cellular length-scales down to the polymer level. Then, general wood–water relationships, moisture-induced swelling pressures, glass transitions in the amorphous wood polymers, and cell wall porosity are discussed. Finally, this paper primarily aims to address diffusion through unmodified wood cell walls because unmodified wood is what is typically used for construction materials and feedstock for industrial processes, such as pulping and biorefineries. Therefore, this section ends with some general discussion of what constitutes unmodified and modified wood.
3.1. Multiscale Wood Structure
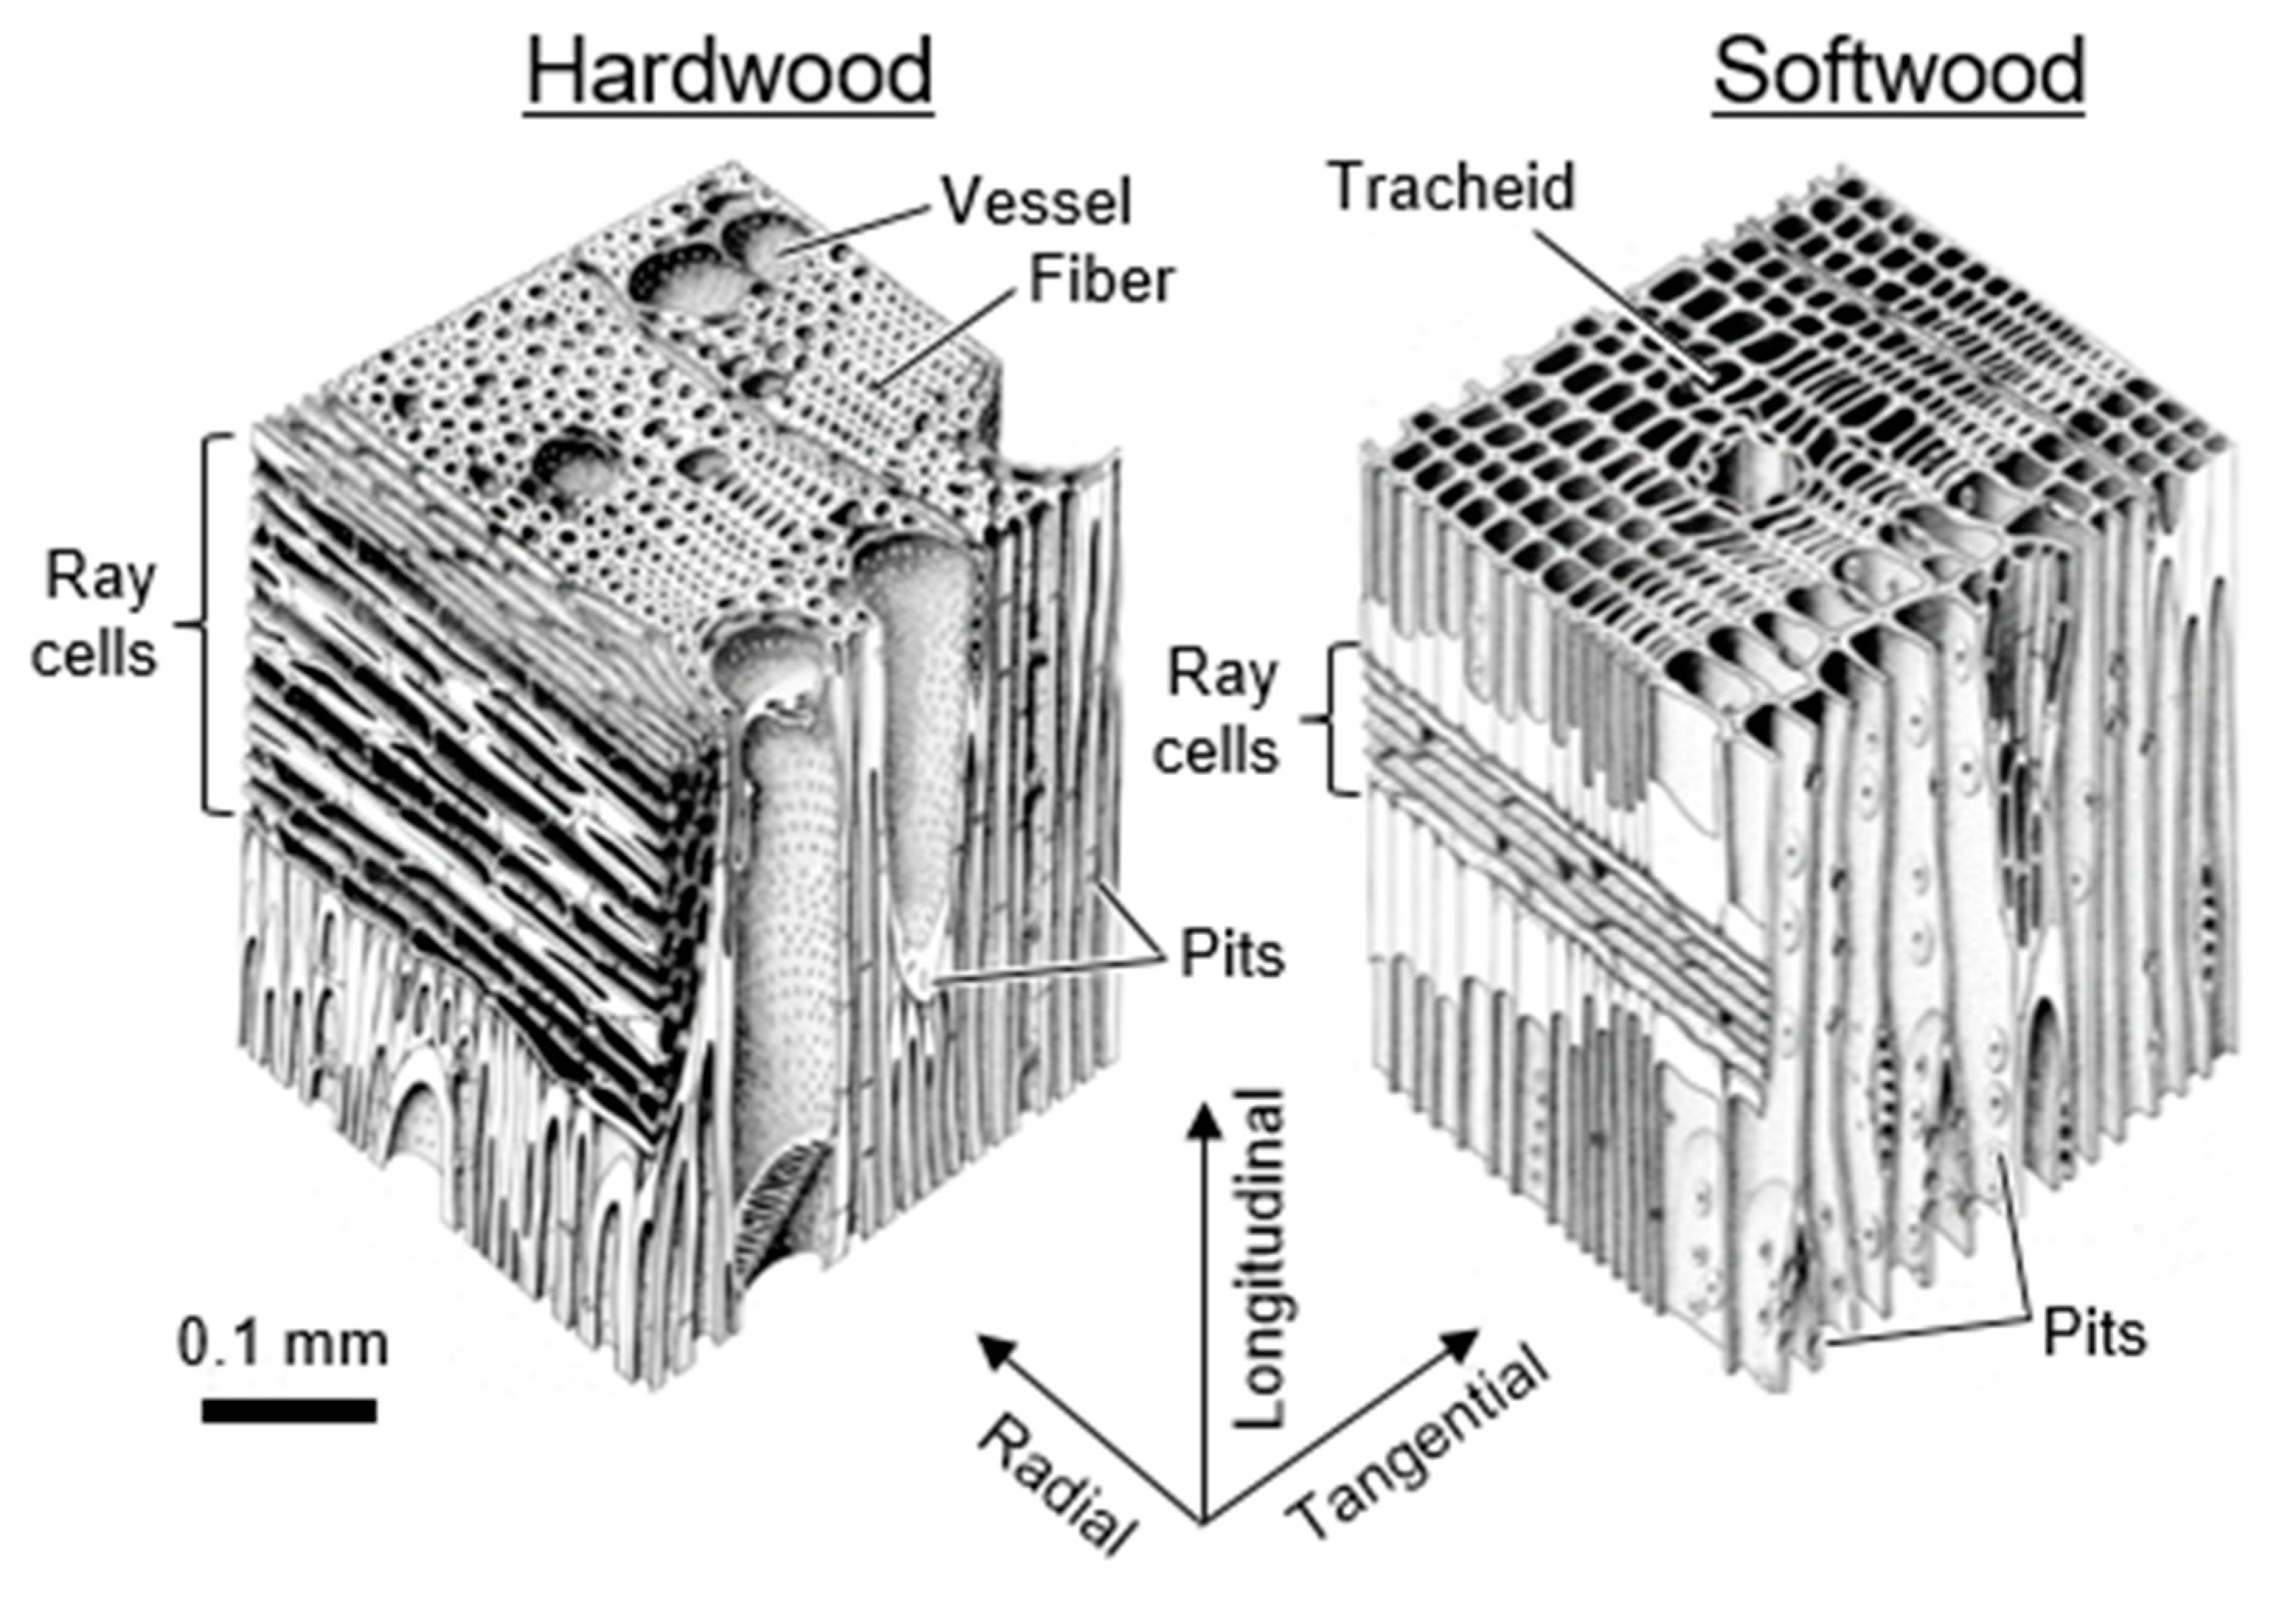
Wood is an anisotropic material composed of cells. The three primary wood orientations and typical cell types and cellular structures of softwood and hardwood are illustrated in Figure 4. At this length-scale, volumes in wood can be divided into two categories:
- Cell wall volume refers to the volumes in wood occupied by cell wall material.
- Inter-cell wall volume refers to the volumes in wood between cell wall material, including anatomical features, such as lumina, vessels, and pits.
This perspective aims to address diffusion through cell wall volumes in wood, and not inter-cell wall volumes.
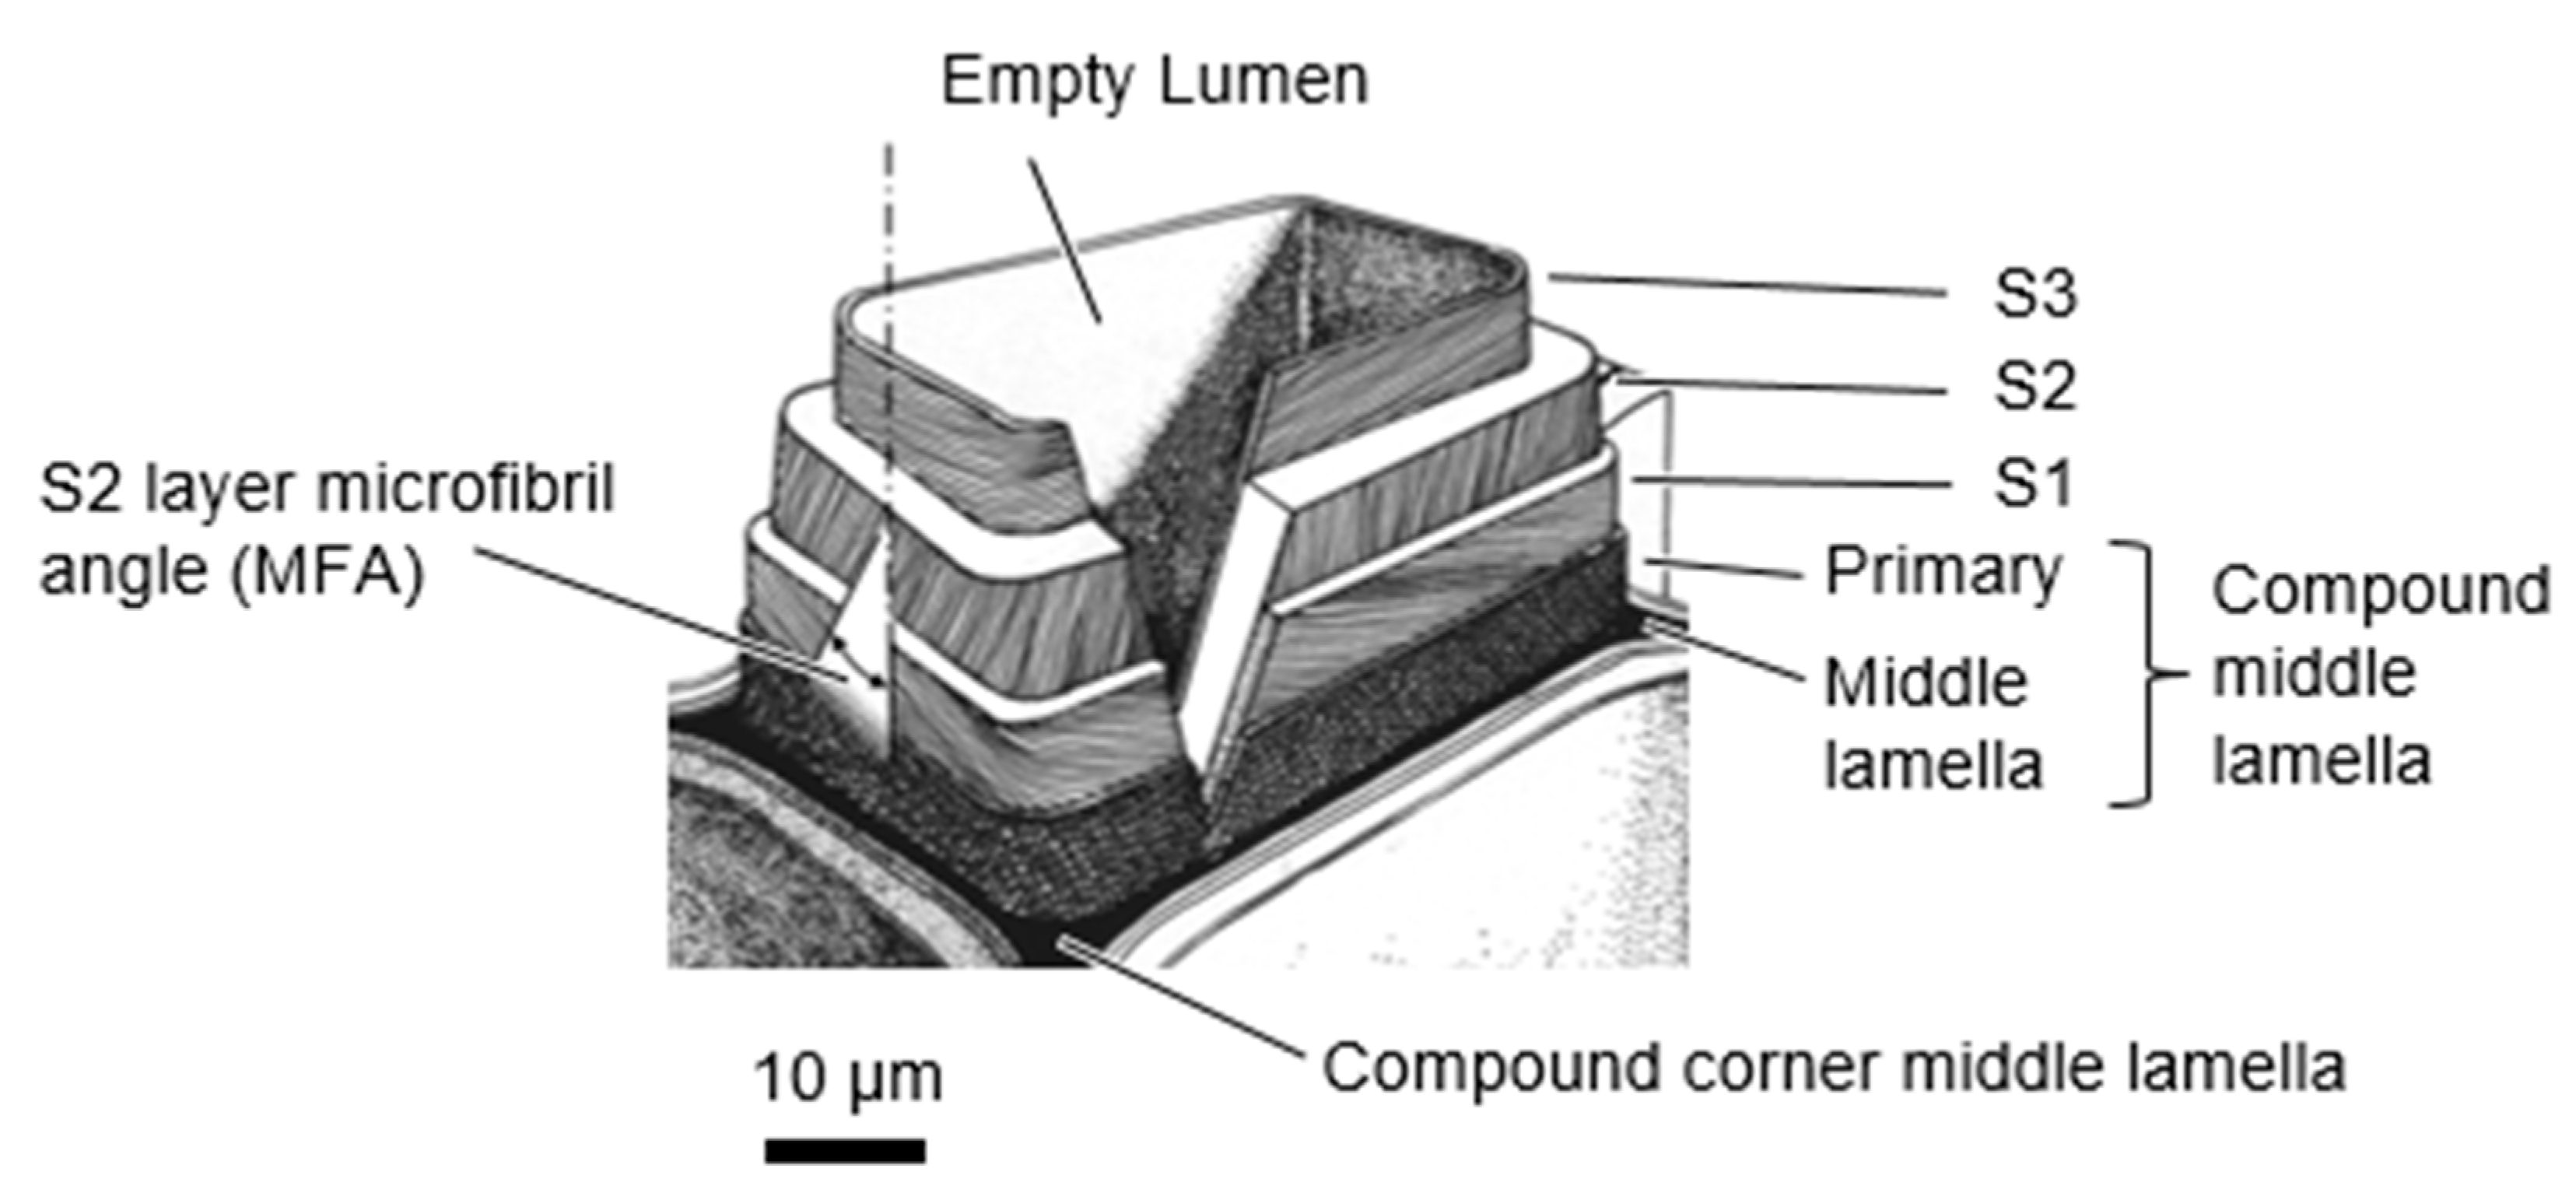
Wood cell walls are composed of multiple layers. A typical fiber or tracheid cell wall structure is shown in Figure 5. Cell walls consist of three secondary cell wall layers (S1, S2, and S3), the primary wall layer, and the middle lamella. The secondary cell walls have highly oriented cellulose elementary fibrils. The helical angle the cellulose microfibrils make with the longitudinal cell axis is called the microfibril angle (MFA). In the S2, the MFA is typically low (5–30°), whereas it is much higher in the S1 and S3, typically 50–70° and >70°, respectively [75]. The high MFA of the S1 and S3 layers makes them capable of withstanding large hoop stresses that form when the S2 swells.
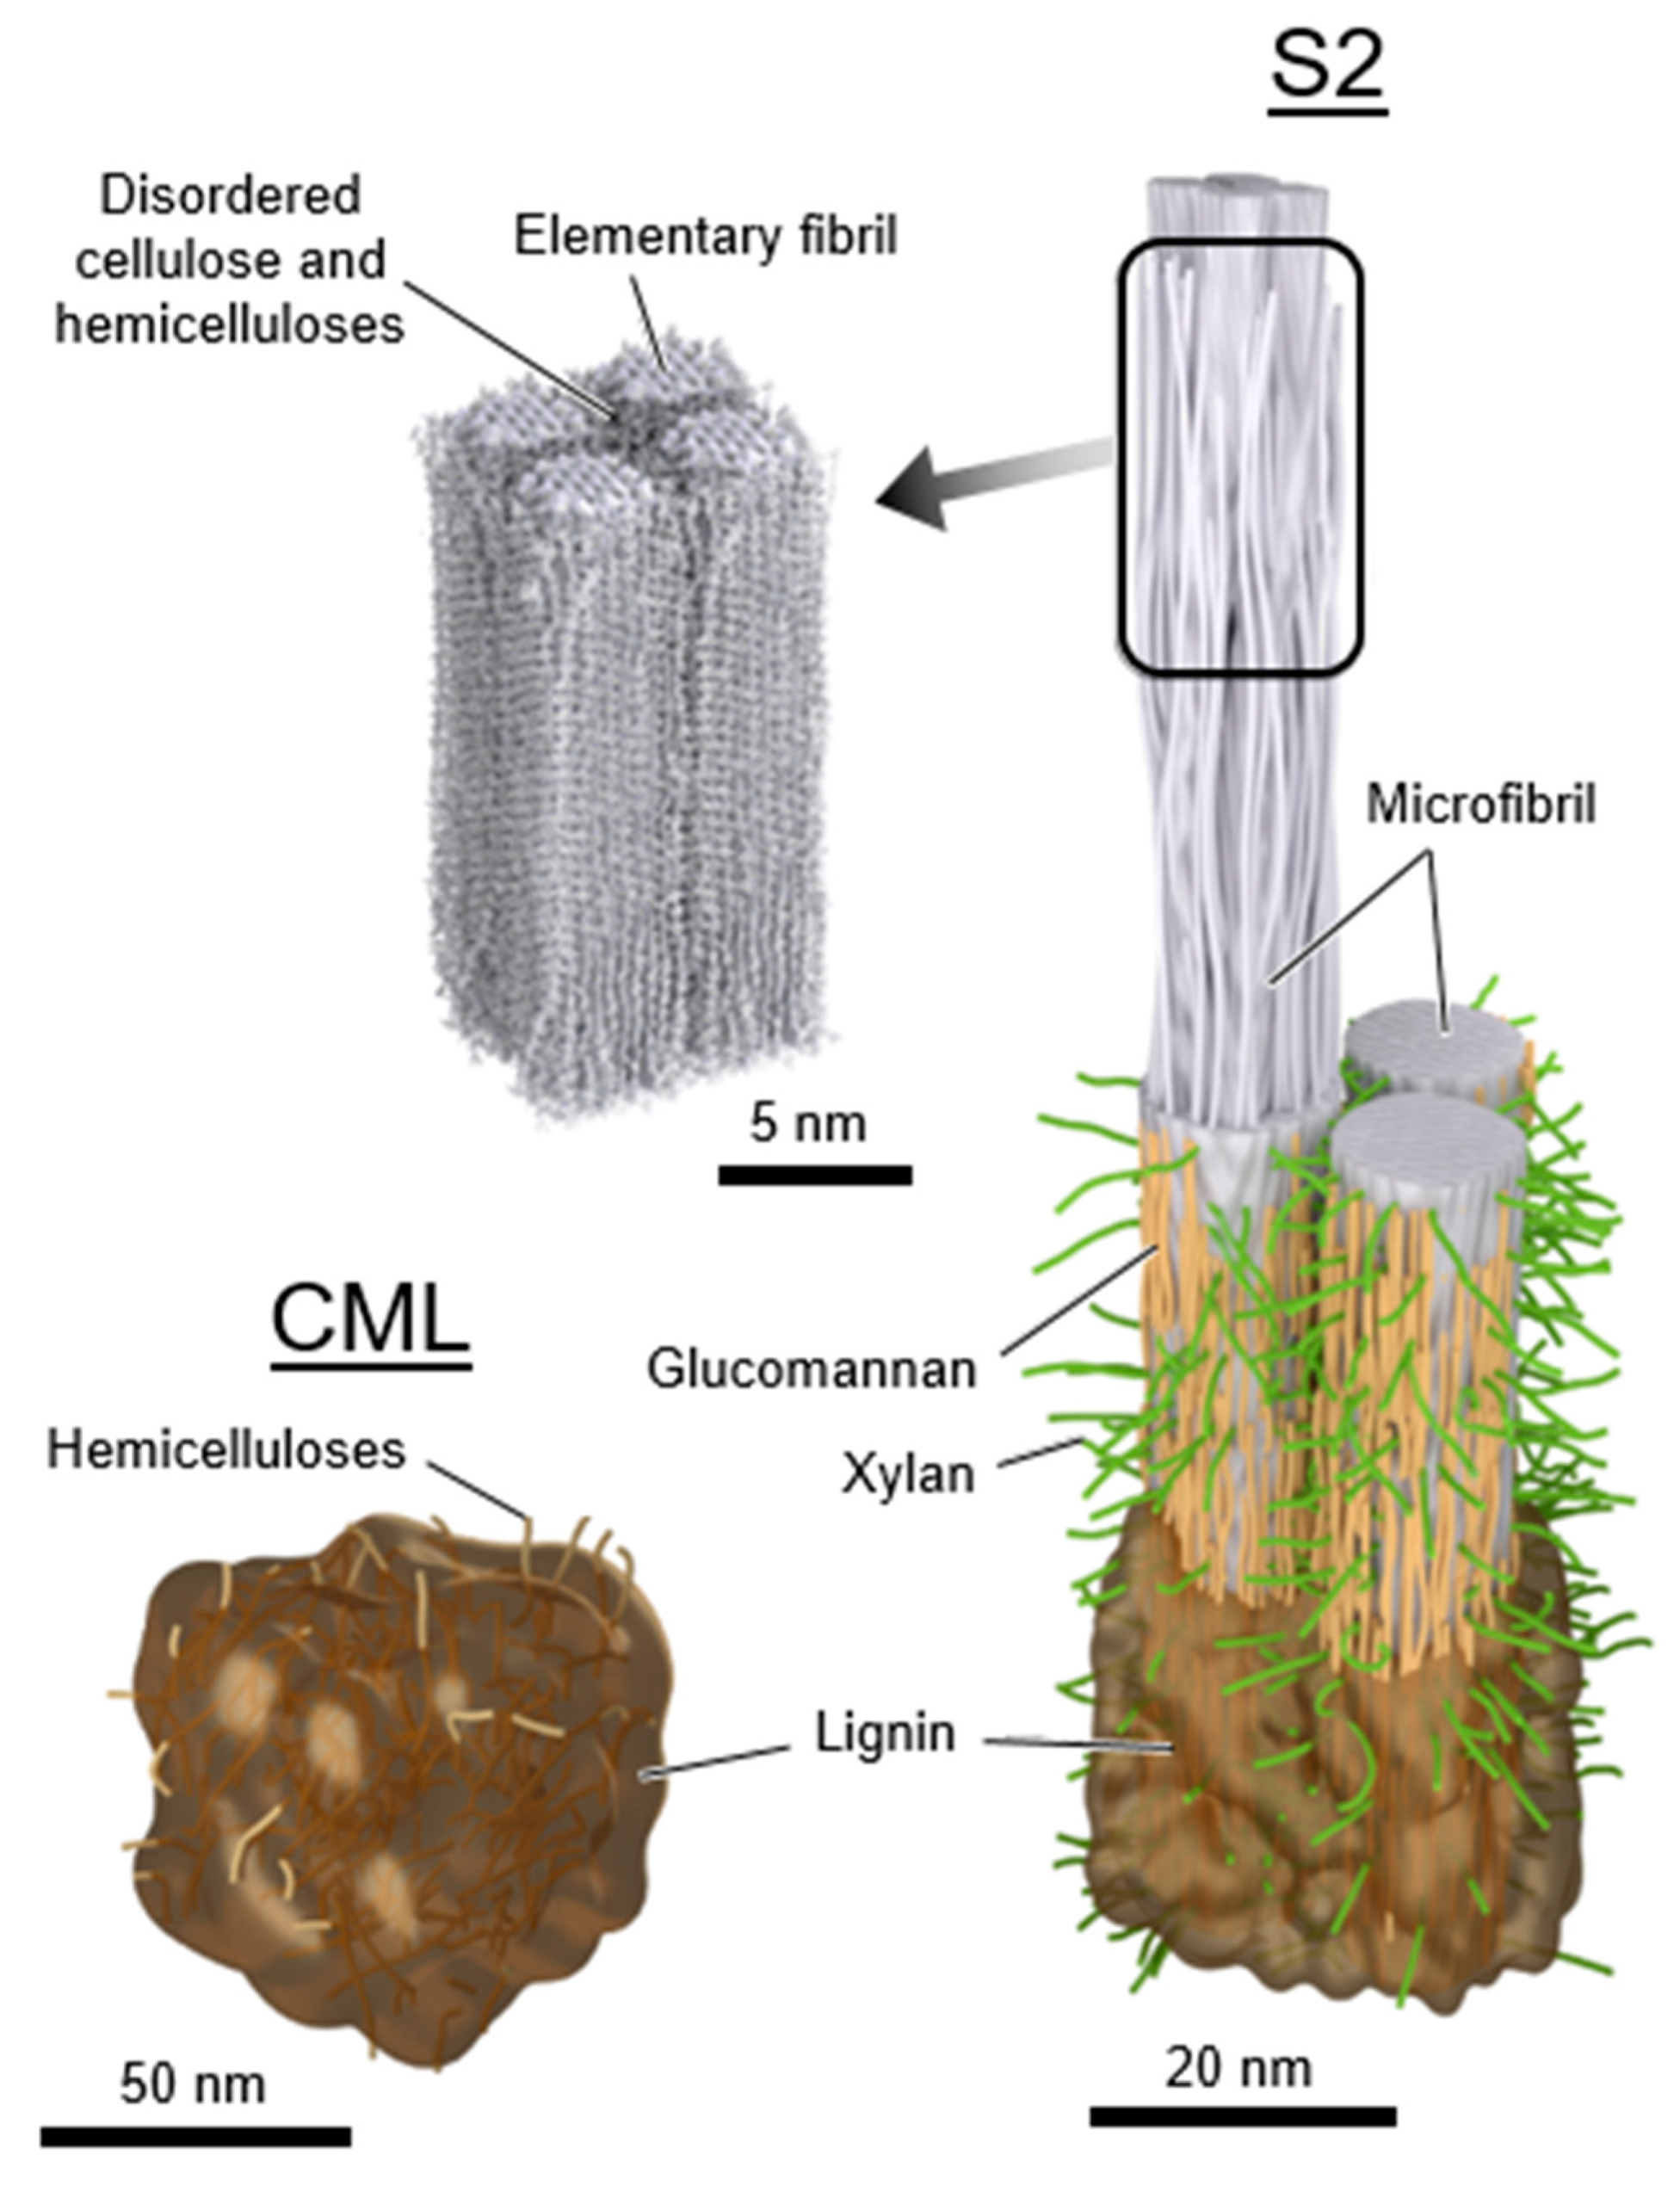
The secondary cell walls are essentially polymer nanocomposites with the cellulose elementary fibrils embedded in a matrix consisting of amorphous cellulose, hemicelluloses, and lignin. Cellulose is a linear homopolymer composed of cellobiose repeat units with a degree of polymerization of around 10,000 [40]. Hemicelluloses are a collection of branched copolymers composed of five- and six-membered ring sugars (for example, xylose, arabinose, glucose, galactose, and mannose) with typical degrees of polymerization of 100–200 [40]. Glucomannan and xylan are two common types of hemicelluloses. Lignin is an aromatic polymer network that is biosynthesized via radical coupling of the precursors p-coumaryl alcohol, coniferyl alcohol, and sinapyl alcohol [40,76]. Traditionally, lignin has been portrayed as a random, highly cross-linked amorphous polymer. However, in recent years views on lignin structure have evolved. Lignin is now also proposed to consist of folded oligolignol chains that aggregate into globules cross-linked by both covalent and secondary bonds [76]. Neighboring cells are held together by the compound middle lamella, which consists primarily of lignin with some hemicelluloses and pectin [40]. The primary wall and middle lamella are often indistinguishable and combined into a layer called the compound middle lamella, which at a corner between cells is called the compound corner middle lamella. Although preferential orientation with the cellulose microfibrils has been observed for lignin [76,77,78,79], xylan [80], and glucomannan [80,81] inside of the secondary cell walls, these polymers still lack sufficient long-range order and are considered amorphous.
Even though the details are still being elucidated, the general consensus is that the amorphous cellulose, hemicelluloses, and lignin in the secondary cell wall matrix exist in distinguishable domains [82,83,84]. Each wood polymer is expected to exhibit different properties owing to their different chemistries and structures. Indeed, experiments suggest lignin and hemicelluloses in the matrix behave as a mechanically heterogeneous mixture, which have been interpreted to infer domain sizes with an effective diameter of at least 5 nm to 15 nm [85,86]. Based on solubility parameters, cellulose and lignin are not compatible, and hemicelluloses likely act as a bridge between the lignin and cellulose domains [62]. Cellulose, with its high hydroxyl group content, has higher solubility parameters than lignin. The solubility parameters of hemicelluloses depend on the side group substitution. Hemicelluloses with more polar side groups, such as hydroxyl groups, are more compatible with cellulose. In contrast, hemicelluloses with less polar side groups, such as acetyl and methyl substituted side groups, are more compatible with lignin. In computational investigations of molecular interactions between crystalline cellulose and lignin, a thermodynamic preference for lignin to interact with the relatively hydrophobic faces of cellulose crystals, i.e., the 100 face of cellulose I, has also been suggested [87]. Some covalent bonding between lignin and hemicelluloses to create lignin-hemicellulose copolymers has also been observed [88,89]. Based on our current understanding, the wood polymers likely exist as compatible or immiscible polymer blends in the unmodified wood cell wall. Proposed nanostructures of a secondary cell wall and compound corner middle lamella are shown in Figure 6.
3.2. Wood–Water Relationships
Similar to other hydrophilic polymers, wood readily absorbs and desorbs water as demonstrated by the well-known swelling and shrinking of bulk wood with changes in moisture content. Water is largely prevented from diffusing into the highly ordered regions of cellulose elementary fibrils because of the strong hydrogen bonding between cellulose chains. However, some highly ordered regions become more disordered, as evidenced by decreases in measured cellulose crystallinity with increases in moisture content [94]. Wood moisture content (MC) is defined as the mass of water divided by the oven-dry mass of wood [95]. Wood MC depends on ambient temperature and relative humidity (RH) conditions. Water vapor absorption and desorption equilibrium curves have hysteresis, with the MC reach by desorption being higher than that reached by absorption at a given RH. Up to the fiber saturation point (FSP), which is traditionally reported to be between 25% and 32% MC depending on its definition [96], all water in wood is either water vapor in inter-cell wall pore volumes or bound water inside the wood cell walls. At the FSP, the maximum amount of bound water is reached and additional water at higher MC forms liquid water or ice in the inter-cell wall pore volumes. Because intra-molecular covalent bonds are not broken during water sorption, the process is reversible. Although it has long been thought that the first drying of green wood causes irreversible changes to the wood structure, this has recently been shown to be incorrect [97,98].
Sorption and swelling thermodynamics in wood have been summarized by Skaar in his seminal book [96]. The chemical potential of water in wood is less than the chemical potential of pure water, indicating a more thermodynamically favorable state absorbed in wood polymers. Therefore, when wood absorbs moisture from the environment, it releases heat, and this is referred to as the heat of sorption or sorption enthalpy. The sorption enthalpy can be measured directly in calorimetric experiments [99,100] or through the Clausius–Clapeyron equation when sorption data are available at two different temperatures [101]. The partial molar Gibbs free energy (∆G) of mixing at a given relative humidity can be directly calculated through [102]
where R is the ideal gas constant, T is temperature, and aw is the water activity, which is equivalent to the equilibrium relative humidity expressed as a decimal. The partial molar Gibbs free energy can be combined with experimental sorption isotherm data to plot the Gibbs free energy as a function of MC [103]. The entropy of sorption (S) is then typically calculated from the difference between experimentally determined sorption enthalpy (H) and Gibbs free energies (G) of sorption through the definition of Gibbs free energy as G = H − TS.
3.3. Moisture-Induced Swelling Pressures
In polymers, swelling pressures arise when mechanical constraints restrict the swelling [66,67]. At the molecular scale in wood, mechanical constraints in the wood polymer matrices include chemical and physical cross-links, such as hydrogen bonding and chain entanglements. As moisture-induced swelling increases, higher swelling pressures are needed to create additional elastic distortions in the polymers. Elastic energy stored in the swollen wood polymers comes from the mixing energy released from chemical interactions between water and wood polymers during absorption [64,65,66,67,104]. Because free volume and polymer properties depend on pressure, properly assessing and accounting for the swelling pressure will be key to developing useful models for moisture sorption and the effects of moisture on cell wall diffusion.
A major difference between wood and most monolithic hydrophilic polymers is the substantial moisture-induced swelling pressures that develop inside intact wood cell walls during moisture absorption [105]. It has been known since at least the time of the ancient Egyptians that moisture-induced swelling stresses are so high that simply wetting a dry wood wedge placed in a groove can produce forces large enough to split a boulder [106]. Furthermore, moisture-induced twisting of small wood slivers attached to thin tungsten wires were found to produce specific torques higher than electric motors or synthetic carbon nanotube yarn micro actuators [107,108]. Observations of cellulose crystalline lattice deformations in wood sections with changes in moisture indicate that swelling pressures also form in unconstrained wood [109,110,111]. Zabler et al. reported the transverse lattice parameter strains in cellulose elementary fibrils in wood to decrease approximately 0.6% going from dry to water-saturated conditions [109]. Using an estimated 20 GPa transverse modulus for crystalline cellulose [112], a 120 MPa swelling stress can be estimated using the 0.6% strain decrease. This swelling stress is in good agreement with previously estimated moisture-induced swelling pressures of 90 MPa in wood cell walls, which was estimated using the measured swelling stresses of wooden dowels with different densities [113]. Collectively, current data suggest that swelling pressures of about 100 MPa can form in unmodified wood cell walls during moisture swelling in wood with or without mechanical constraints.
Considering that the compression yield stress of the water-saturated S2 is estimated at only 60 MPa [114], which is lower than the approximately 100 MPa swelling stress estimated to form in the wood cell walls, we conclude that these swelling pressures must be balanced against mechanical constraints that are in addition to the molecular-scale constraints in the S2 matrix polymers. These additional mechanical constraints are most likely at larger structure levels. Here, we propose possible structural levels of multiscale constraints:
- Nanostructure constraints arise primarily from mechanical interactions between the compliant matrix wood polymers and stiff cellulose fibrils [104]. There may also be some constraints from the oriented nanostructure of the matrix polymers themselves, such as the xylan proposed to be oriented perpendicular to the cellulose microfibrils and bridging neighboring microfibrils [91,92,93].
- Cell wall microstructure constraints arise mostly from the S1 and S3 layers, which have high microfibril angles (>50°) that can withstand high hoop stresses during the swelling of the S2. The constraint effects of S1 and S3 are supported by measurements of cellulose elementary fibril spacing at high moisture conditions in which more swelling was observed in thin wood sections where these hoop constraints were mostly removed [115].
- Cellular-level constraints arise because neighboring cells affect swelling. In other words, an intact cell extracted from wood will swell differently than the same cell in intact wood. It is well known that an extracted cell or small wood sliver composed of a few cells in cross-section will twist with changes in MC because of the helical microfibril structure in the S2 [107,108,116,117,118]. Neighboring ray cells have also been proposed to affect swelling [119].
3.4. Glass Transitions in Wood Polymers
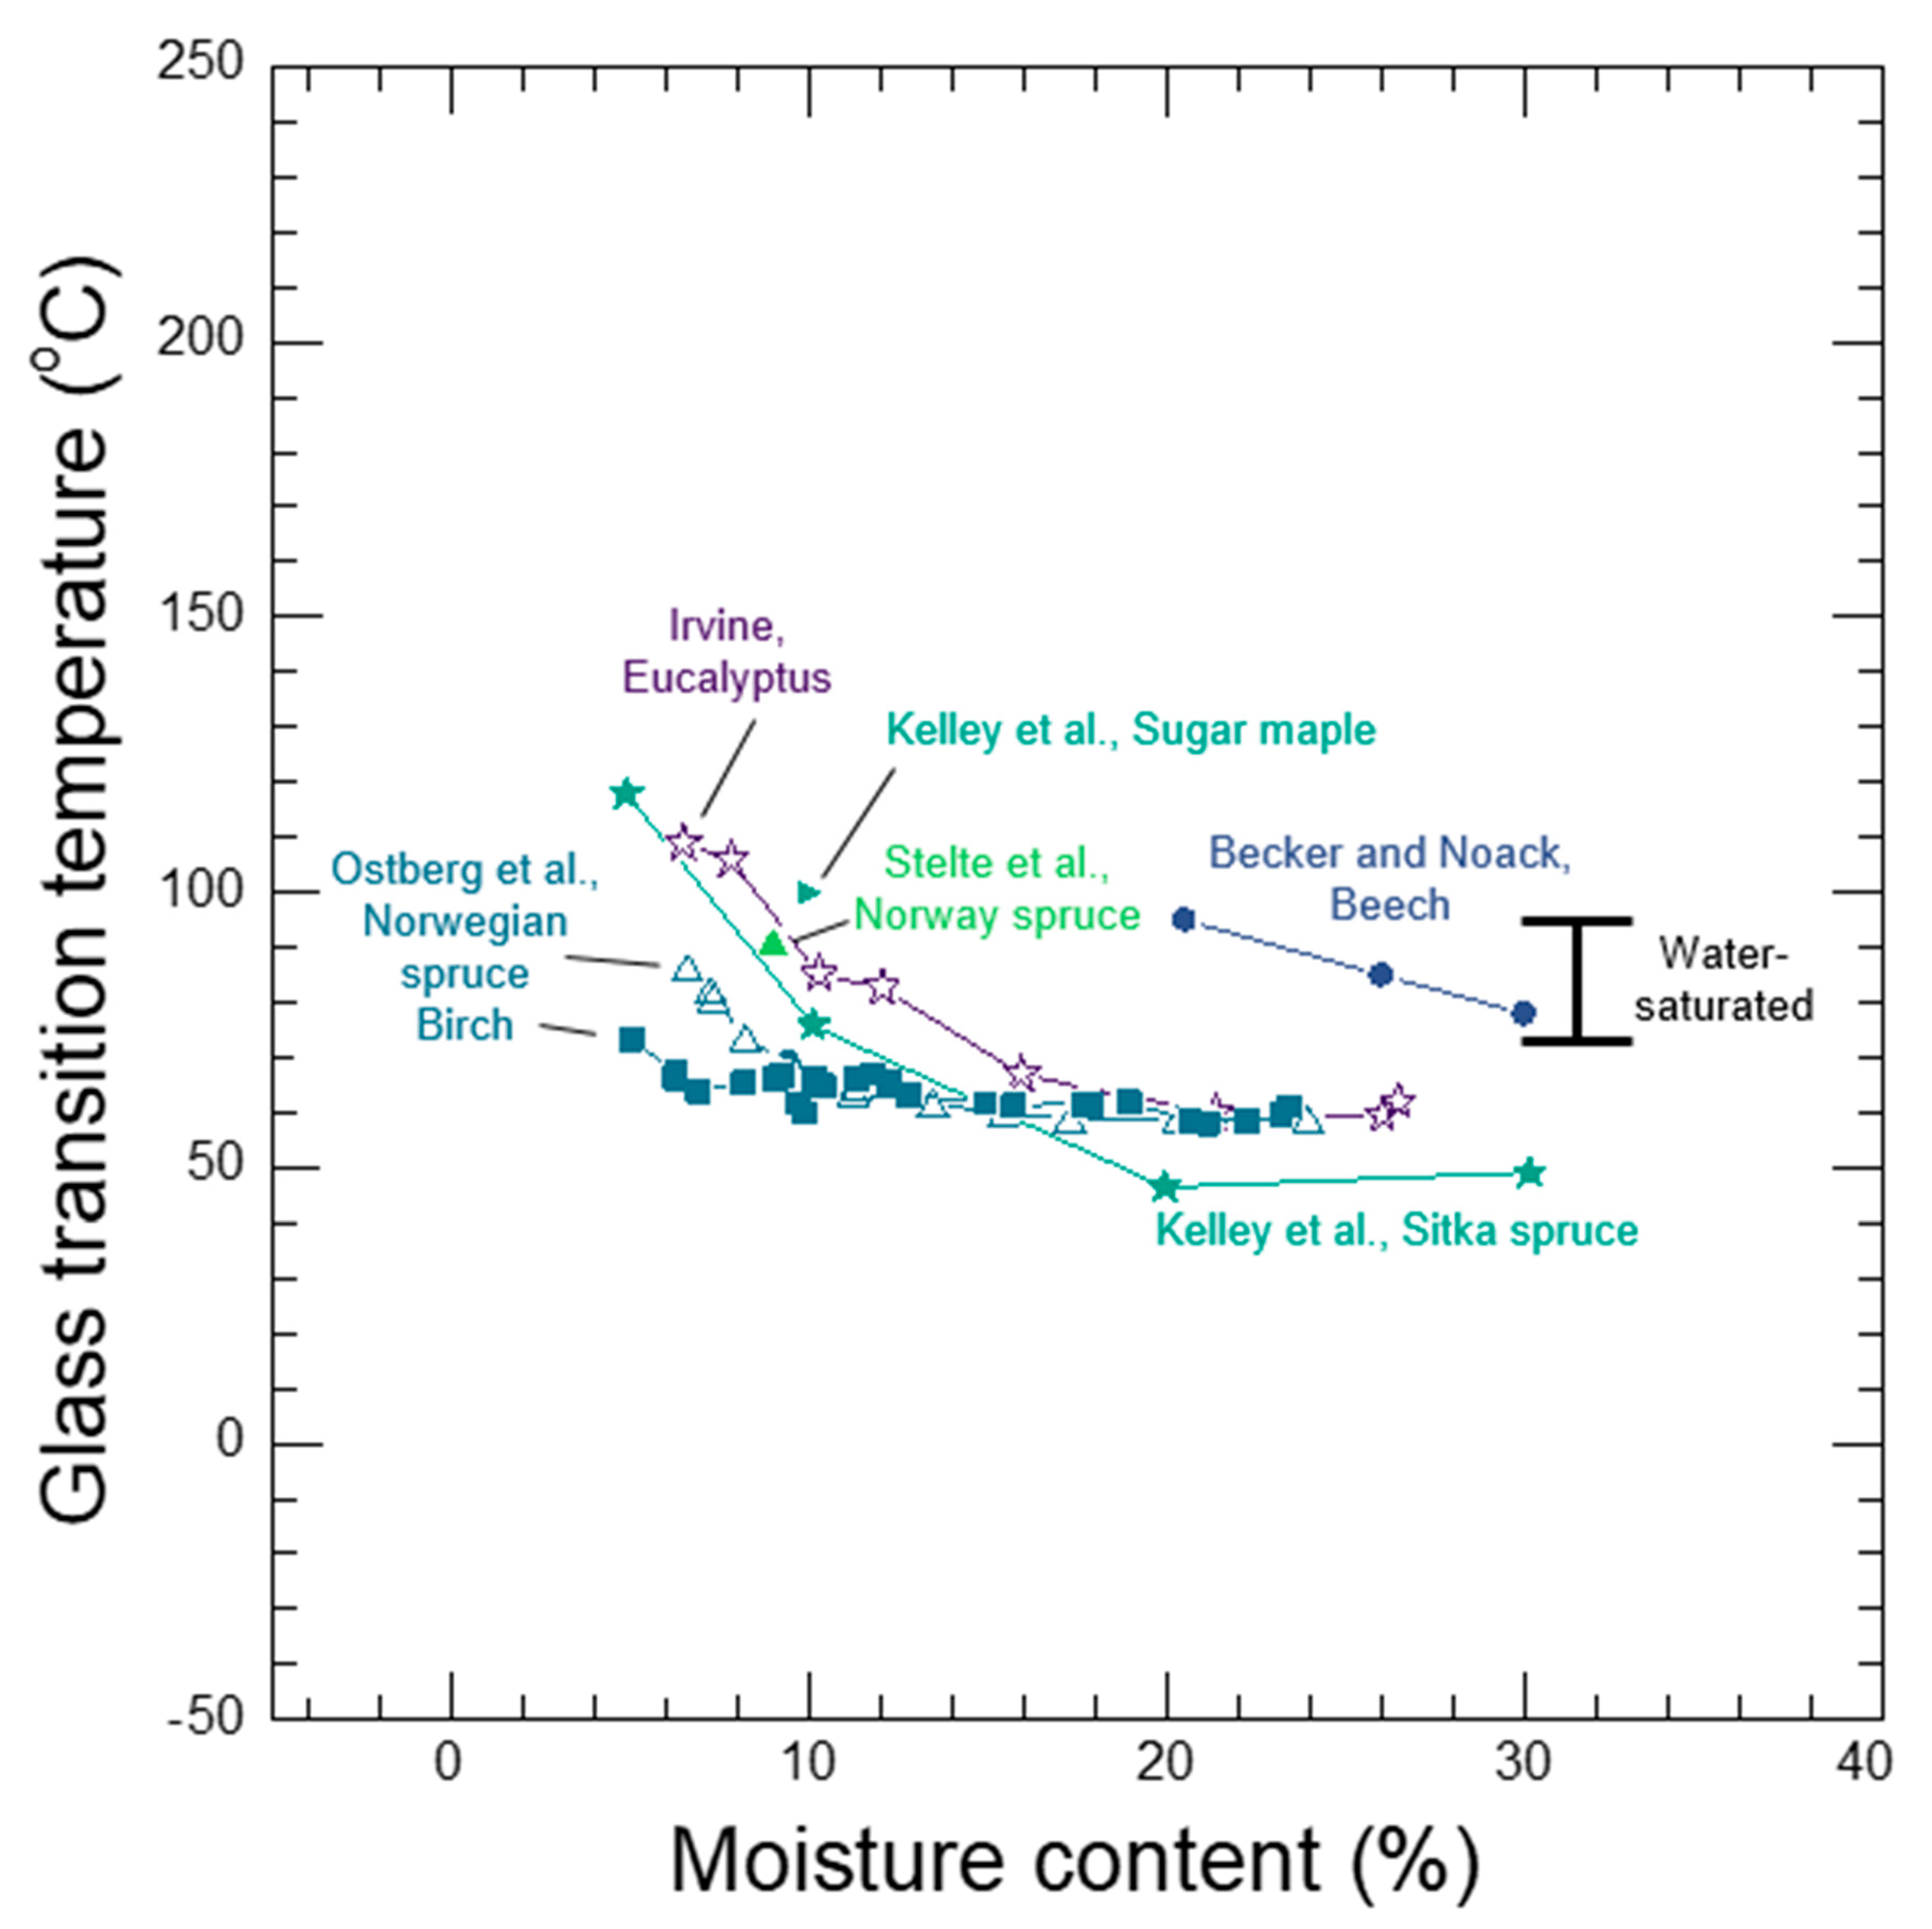
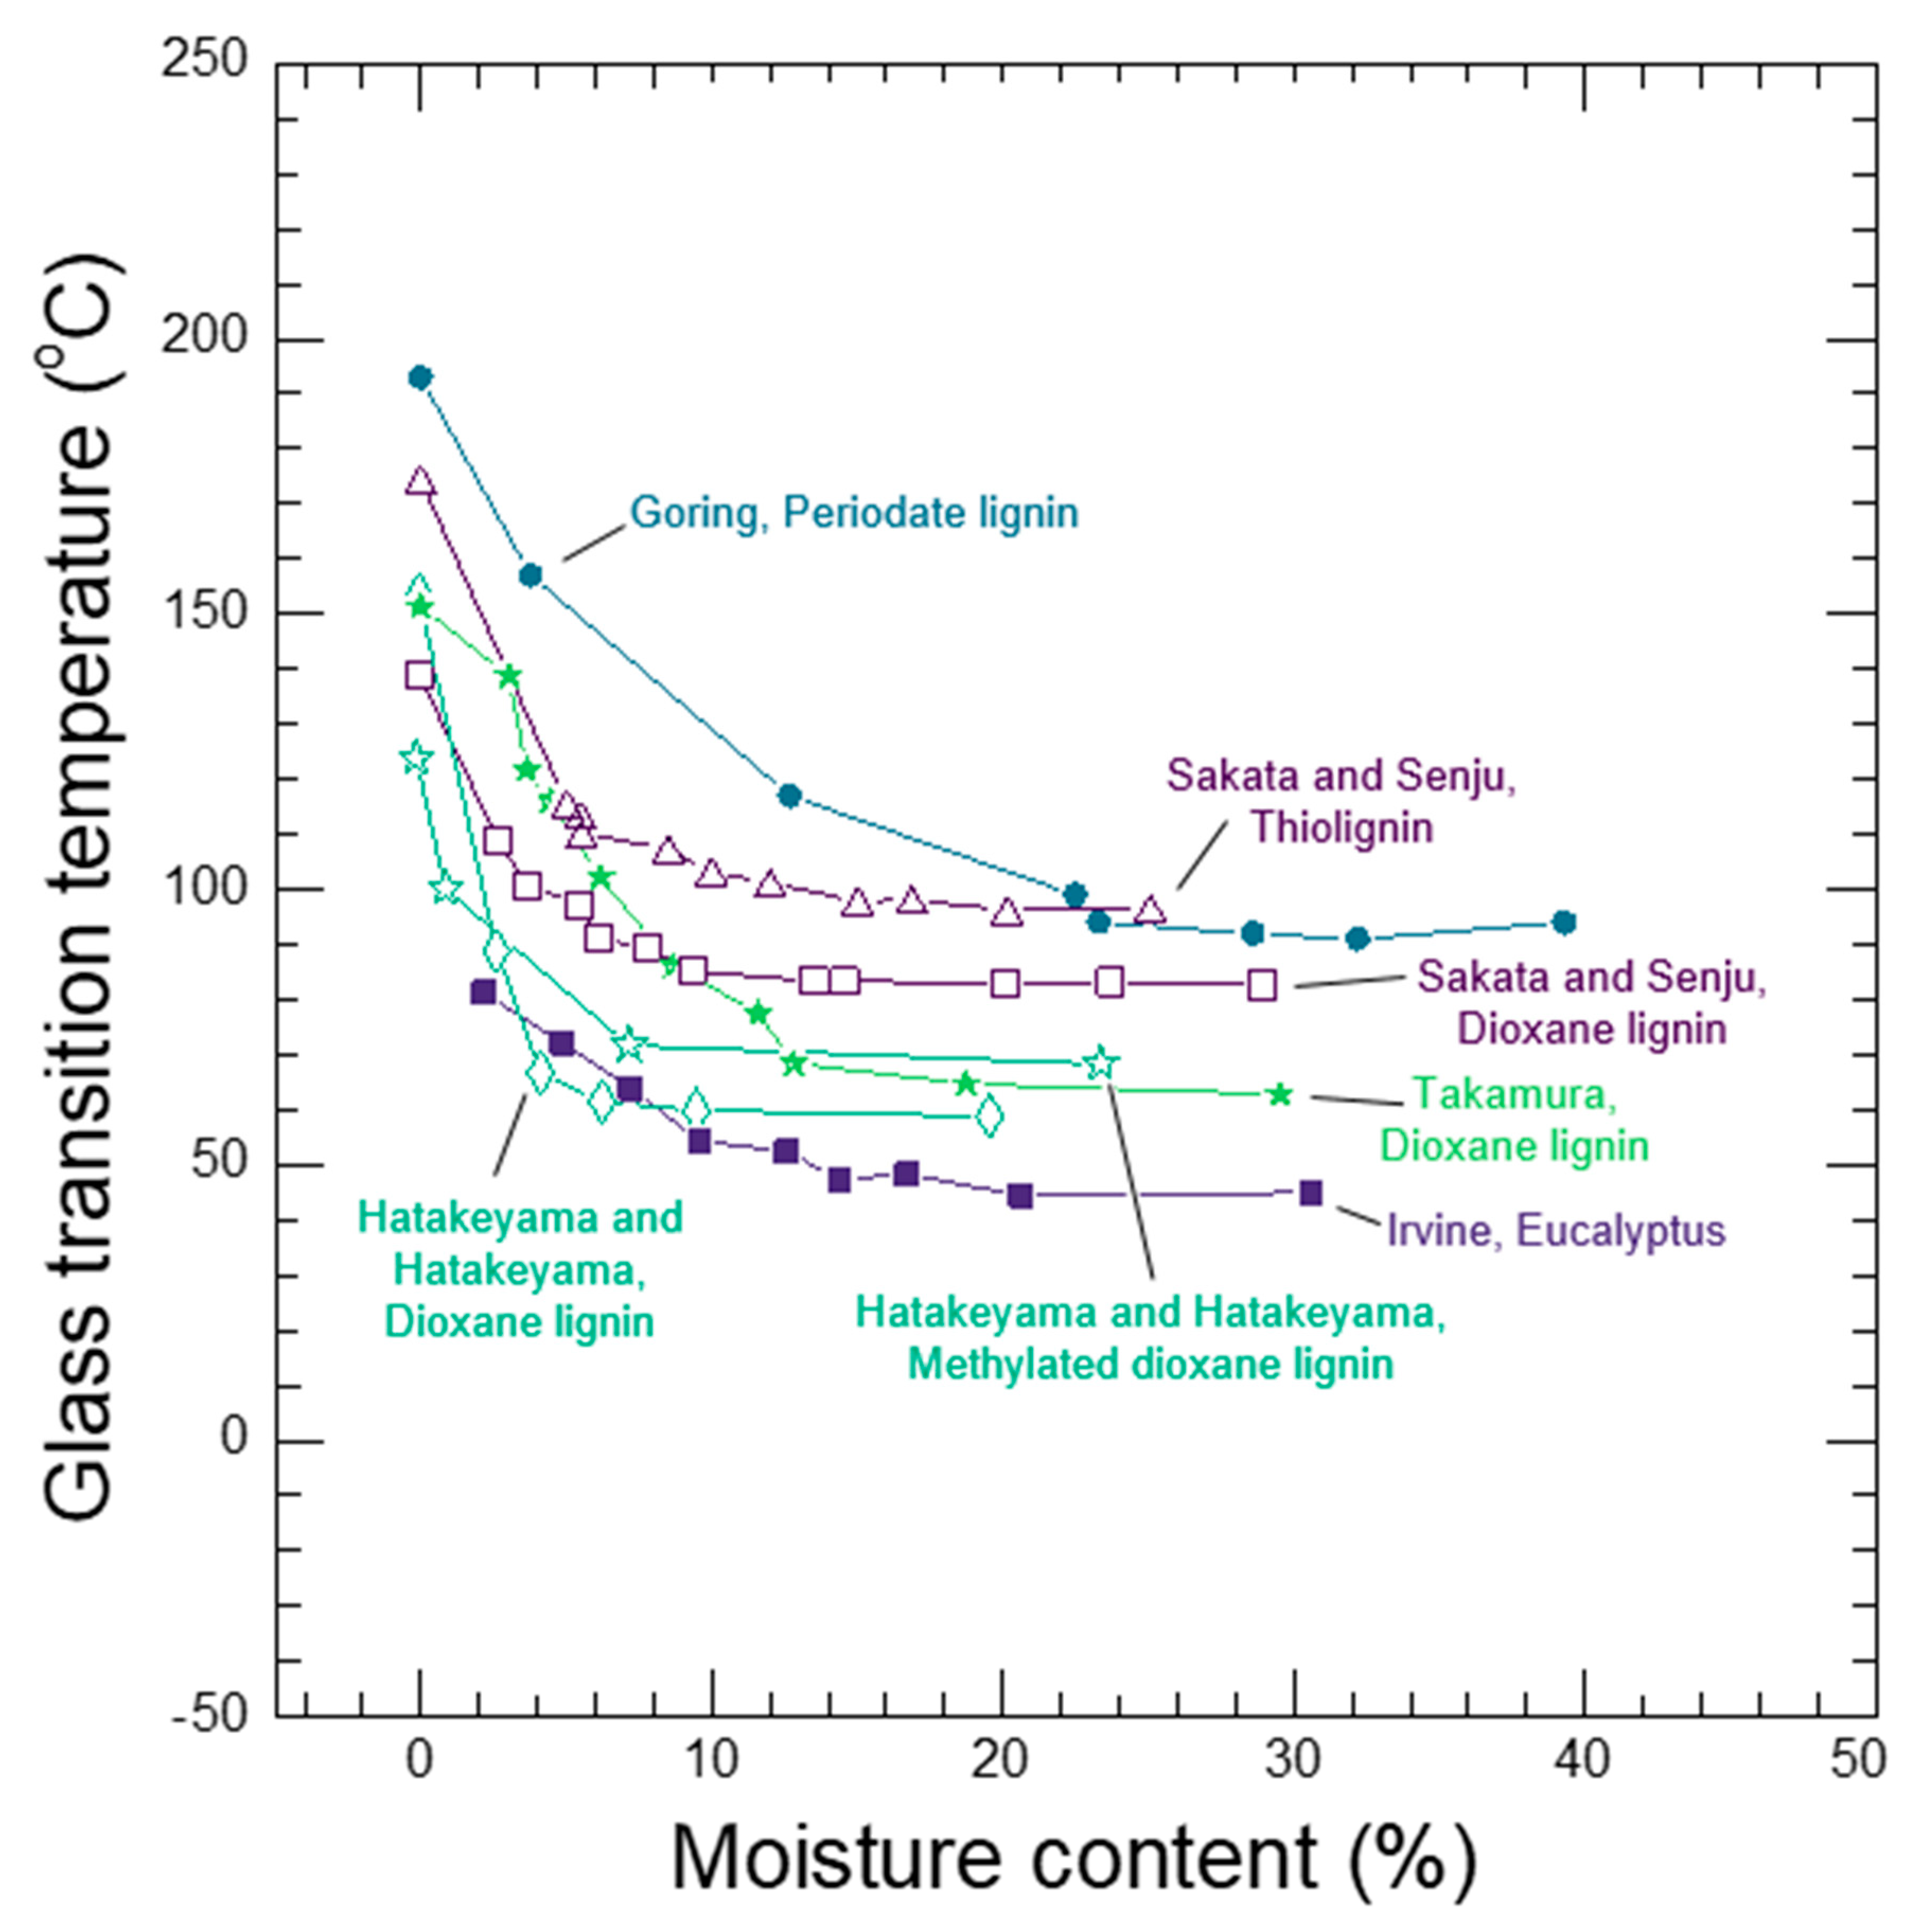
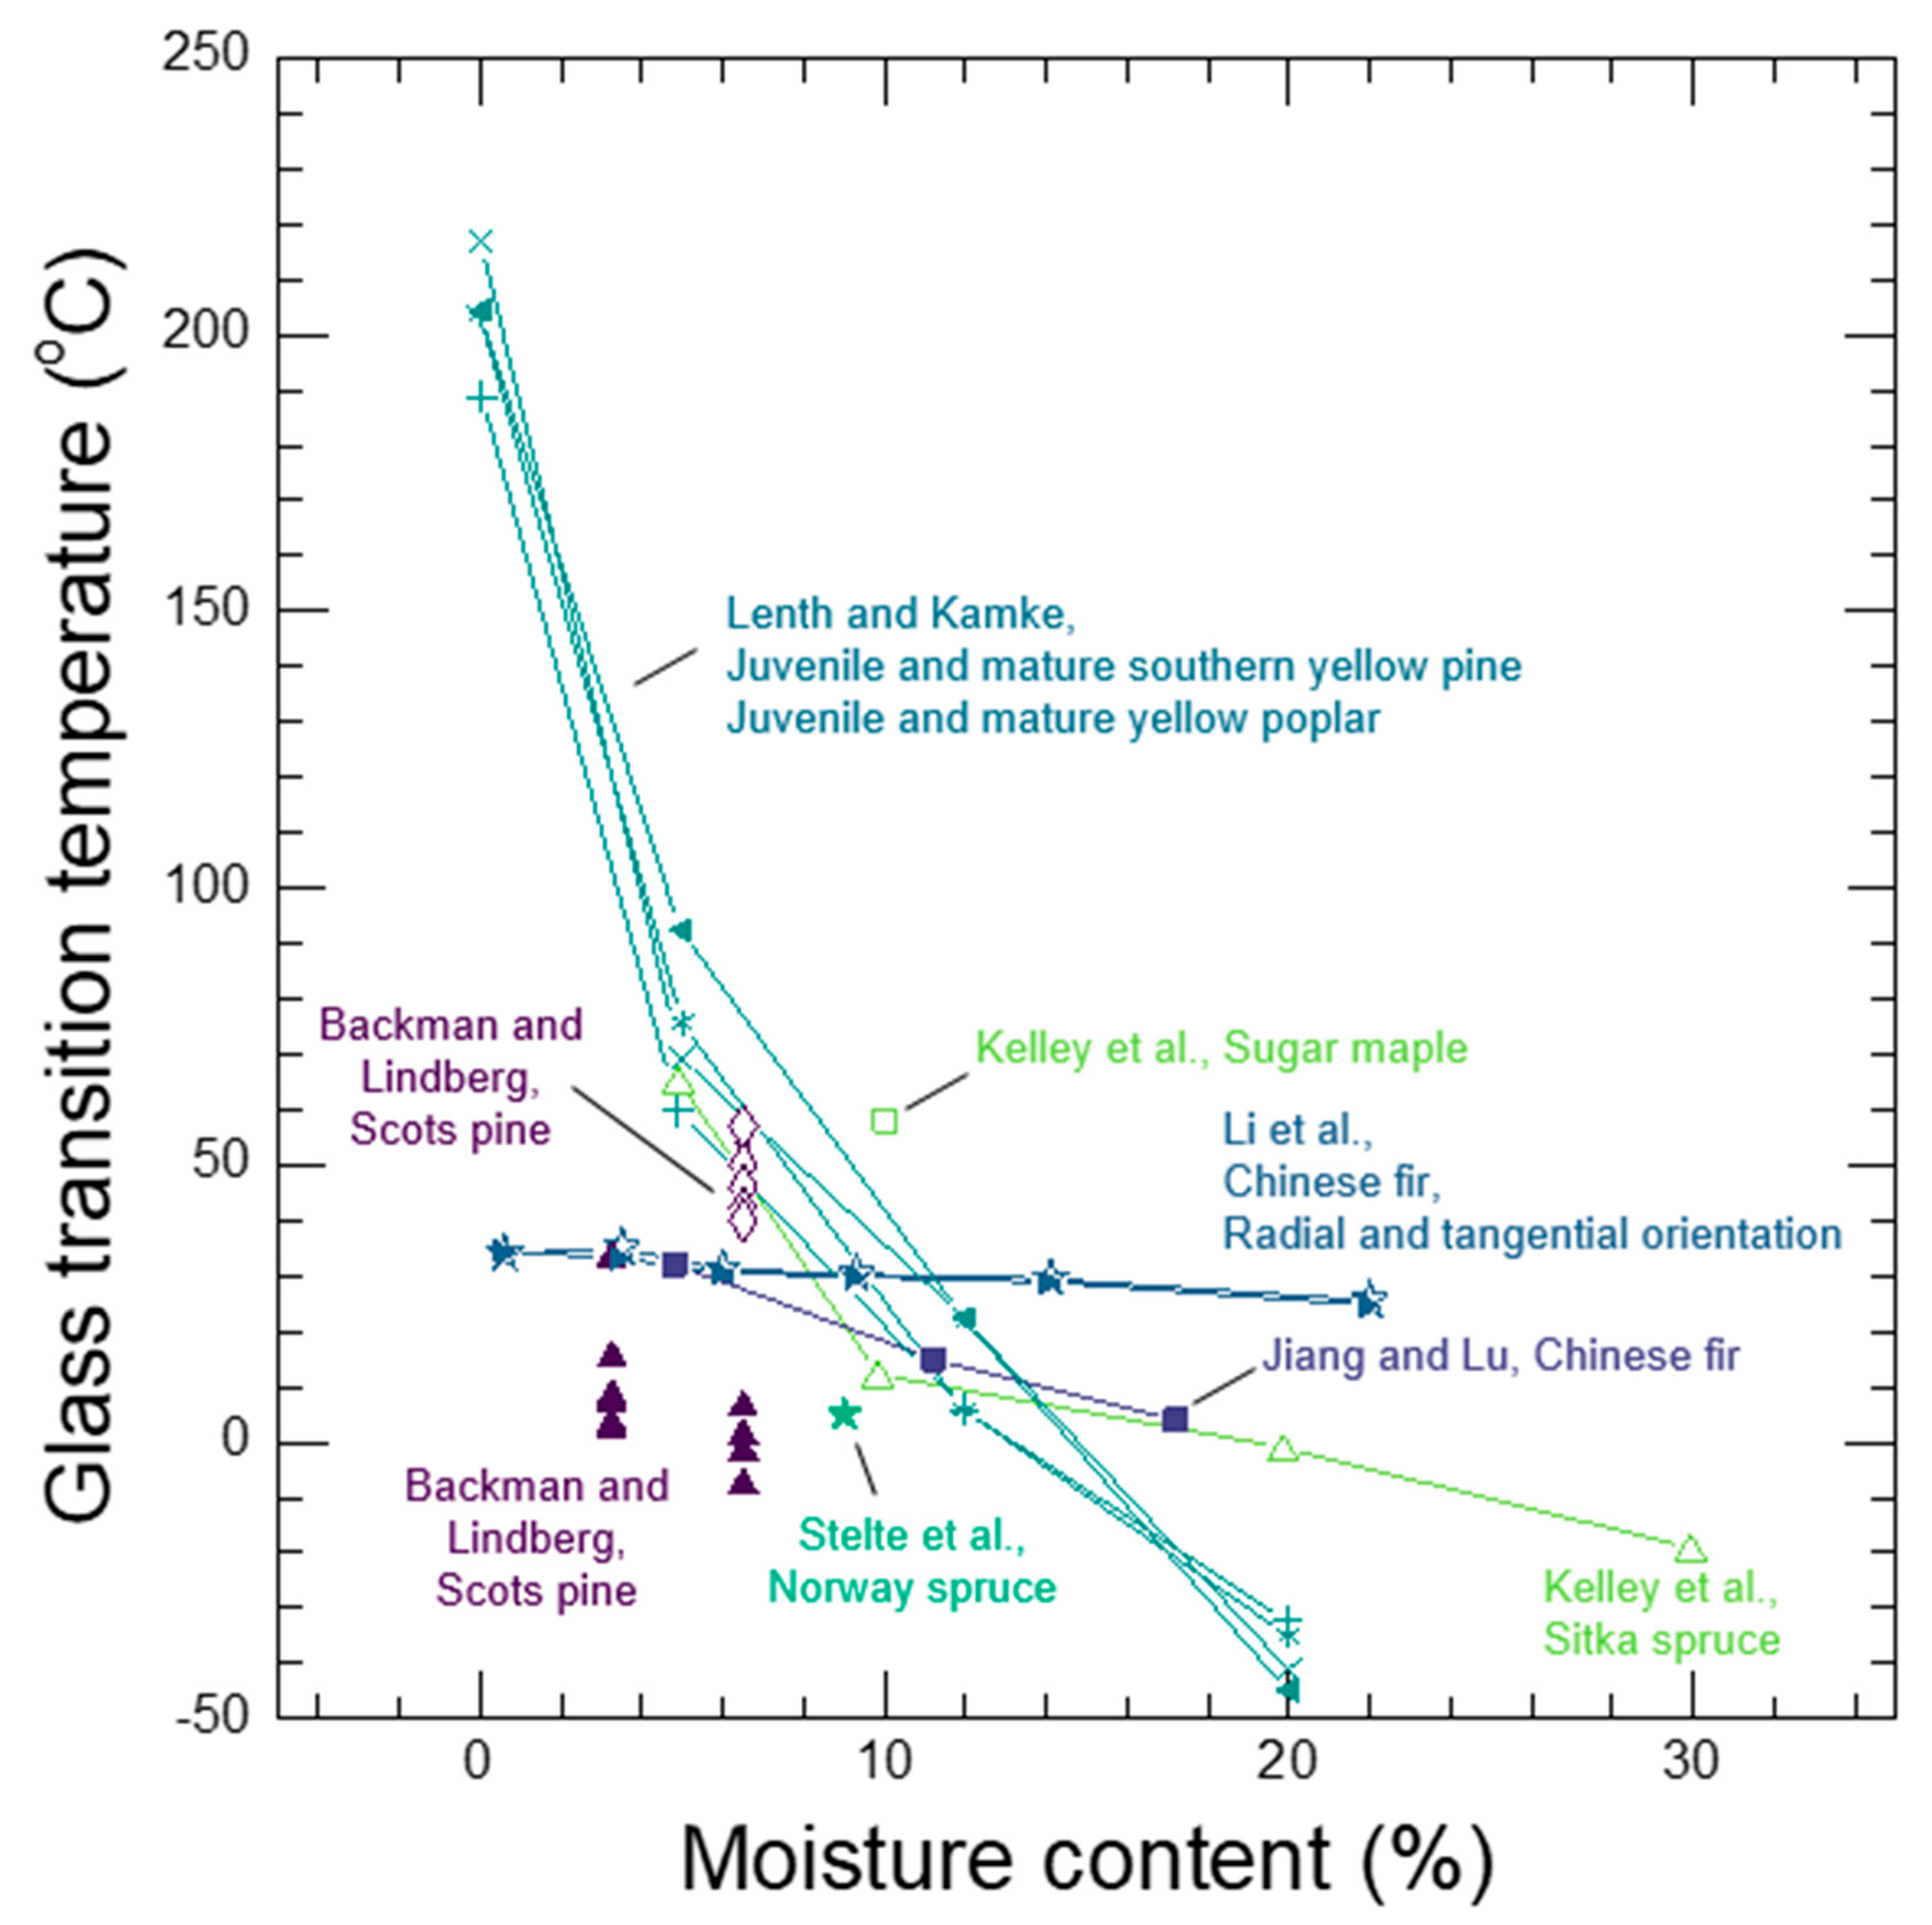
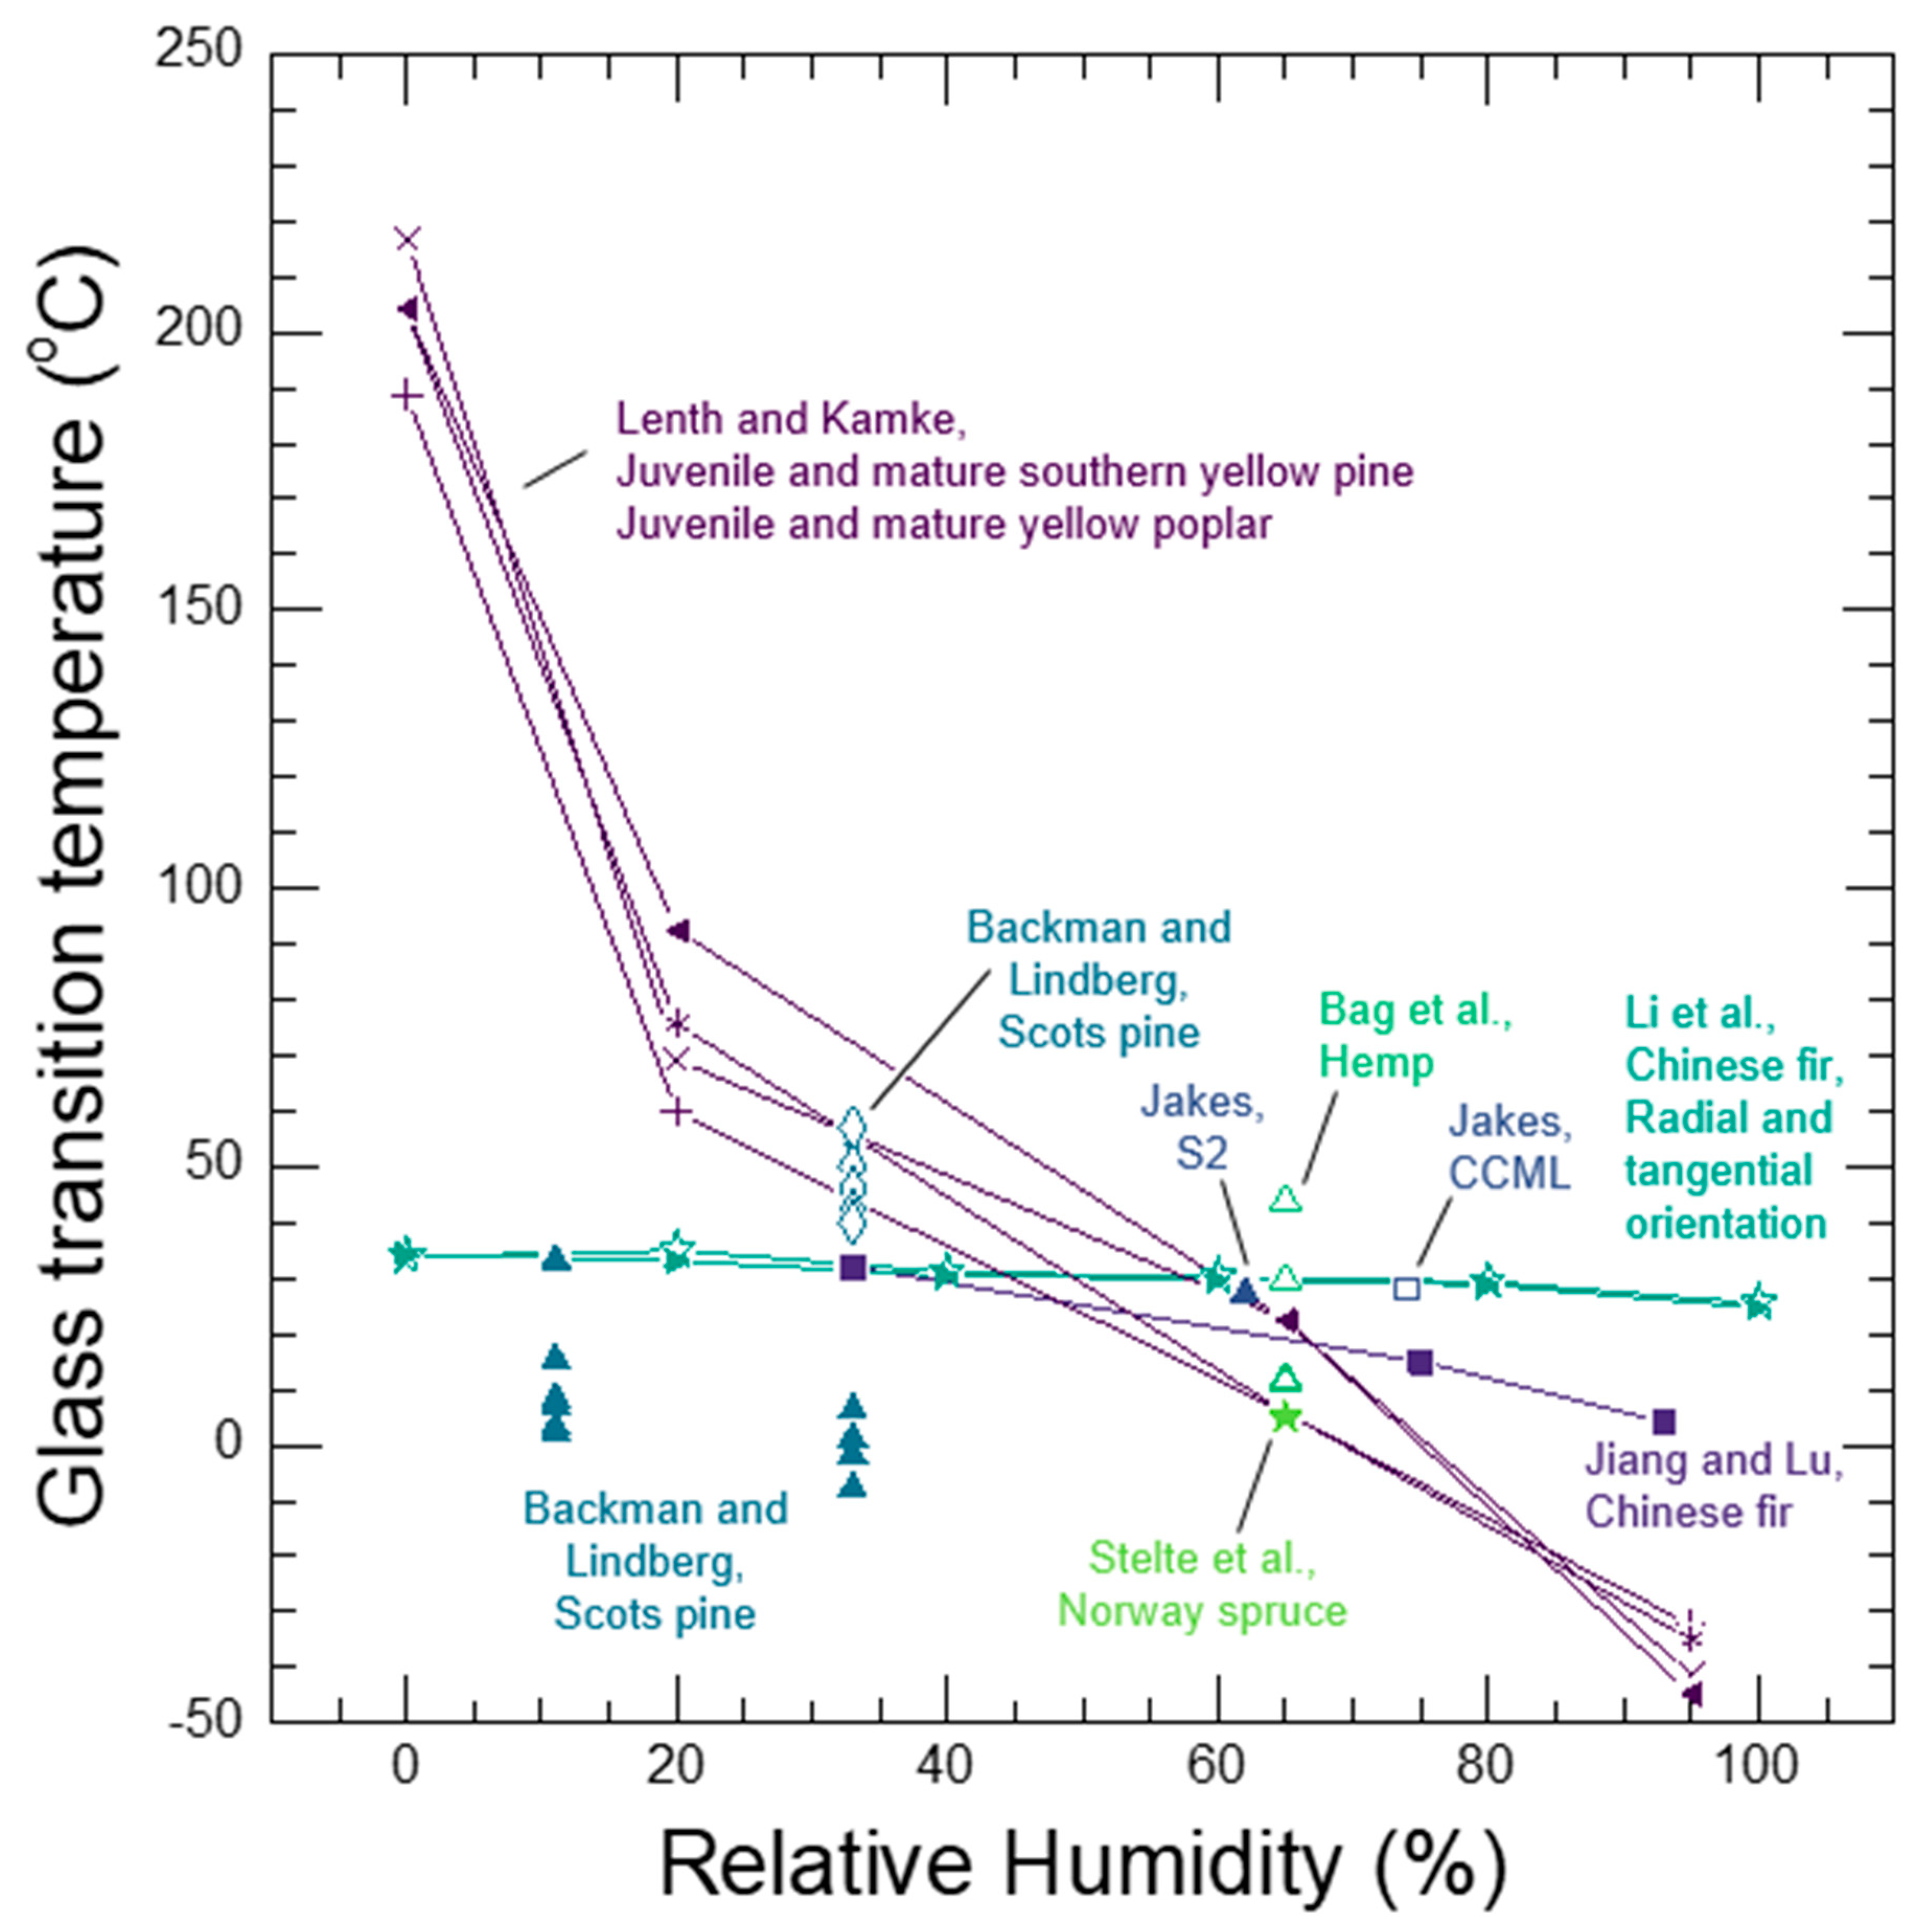
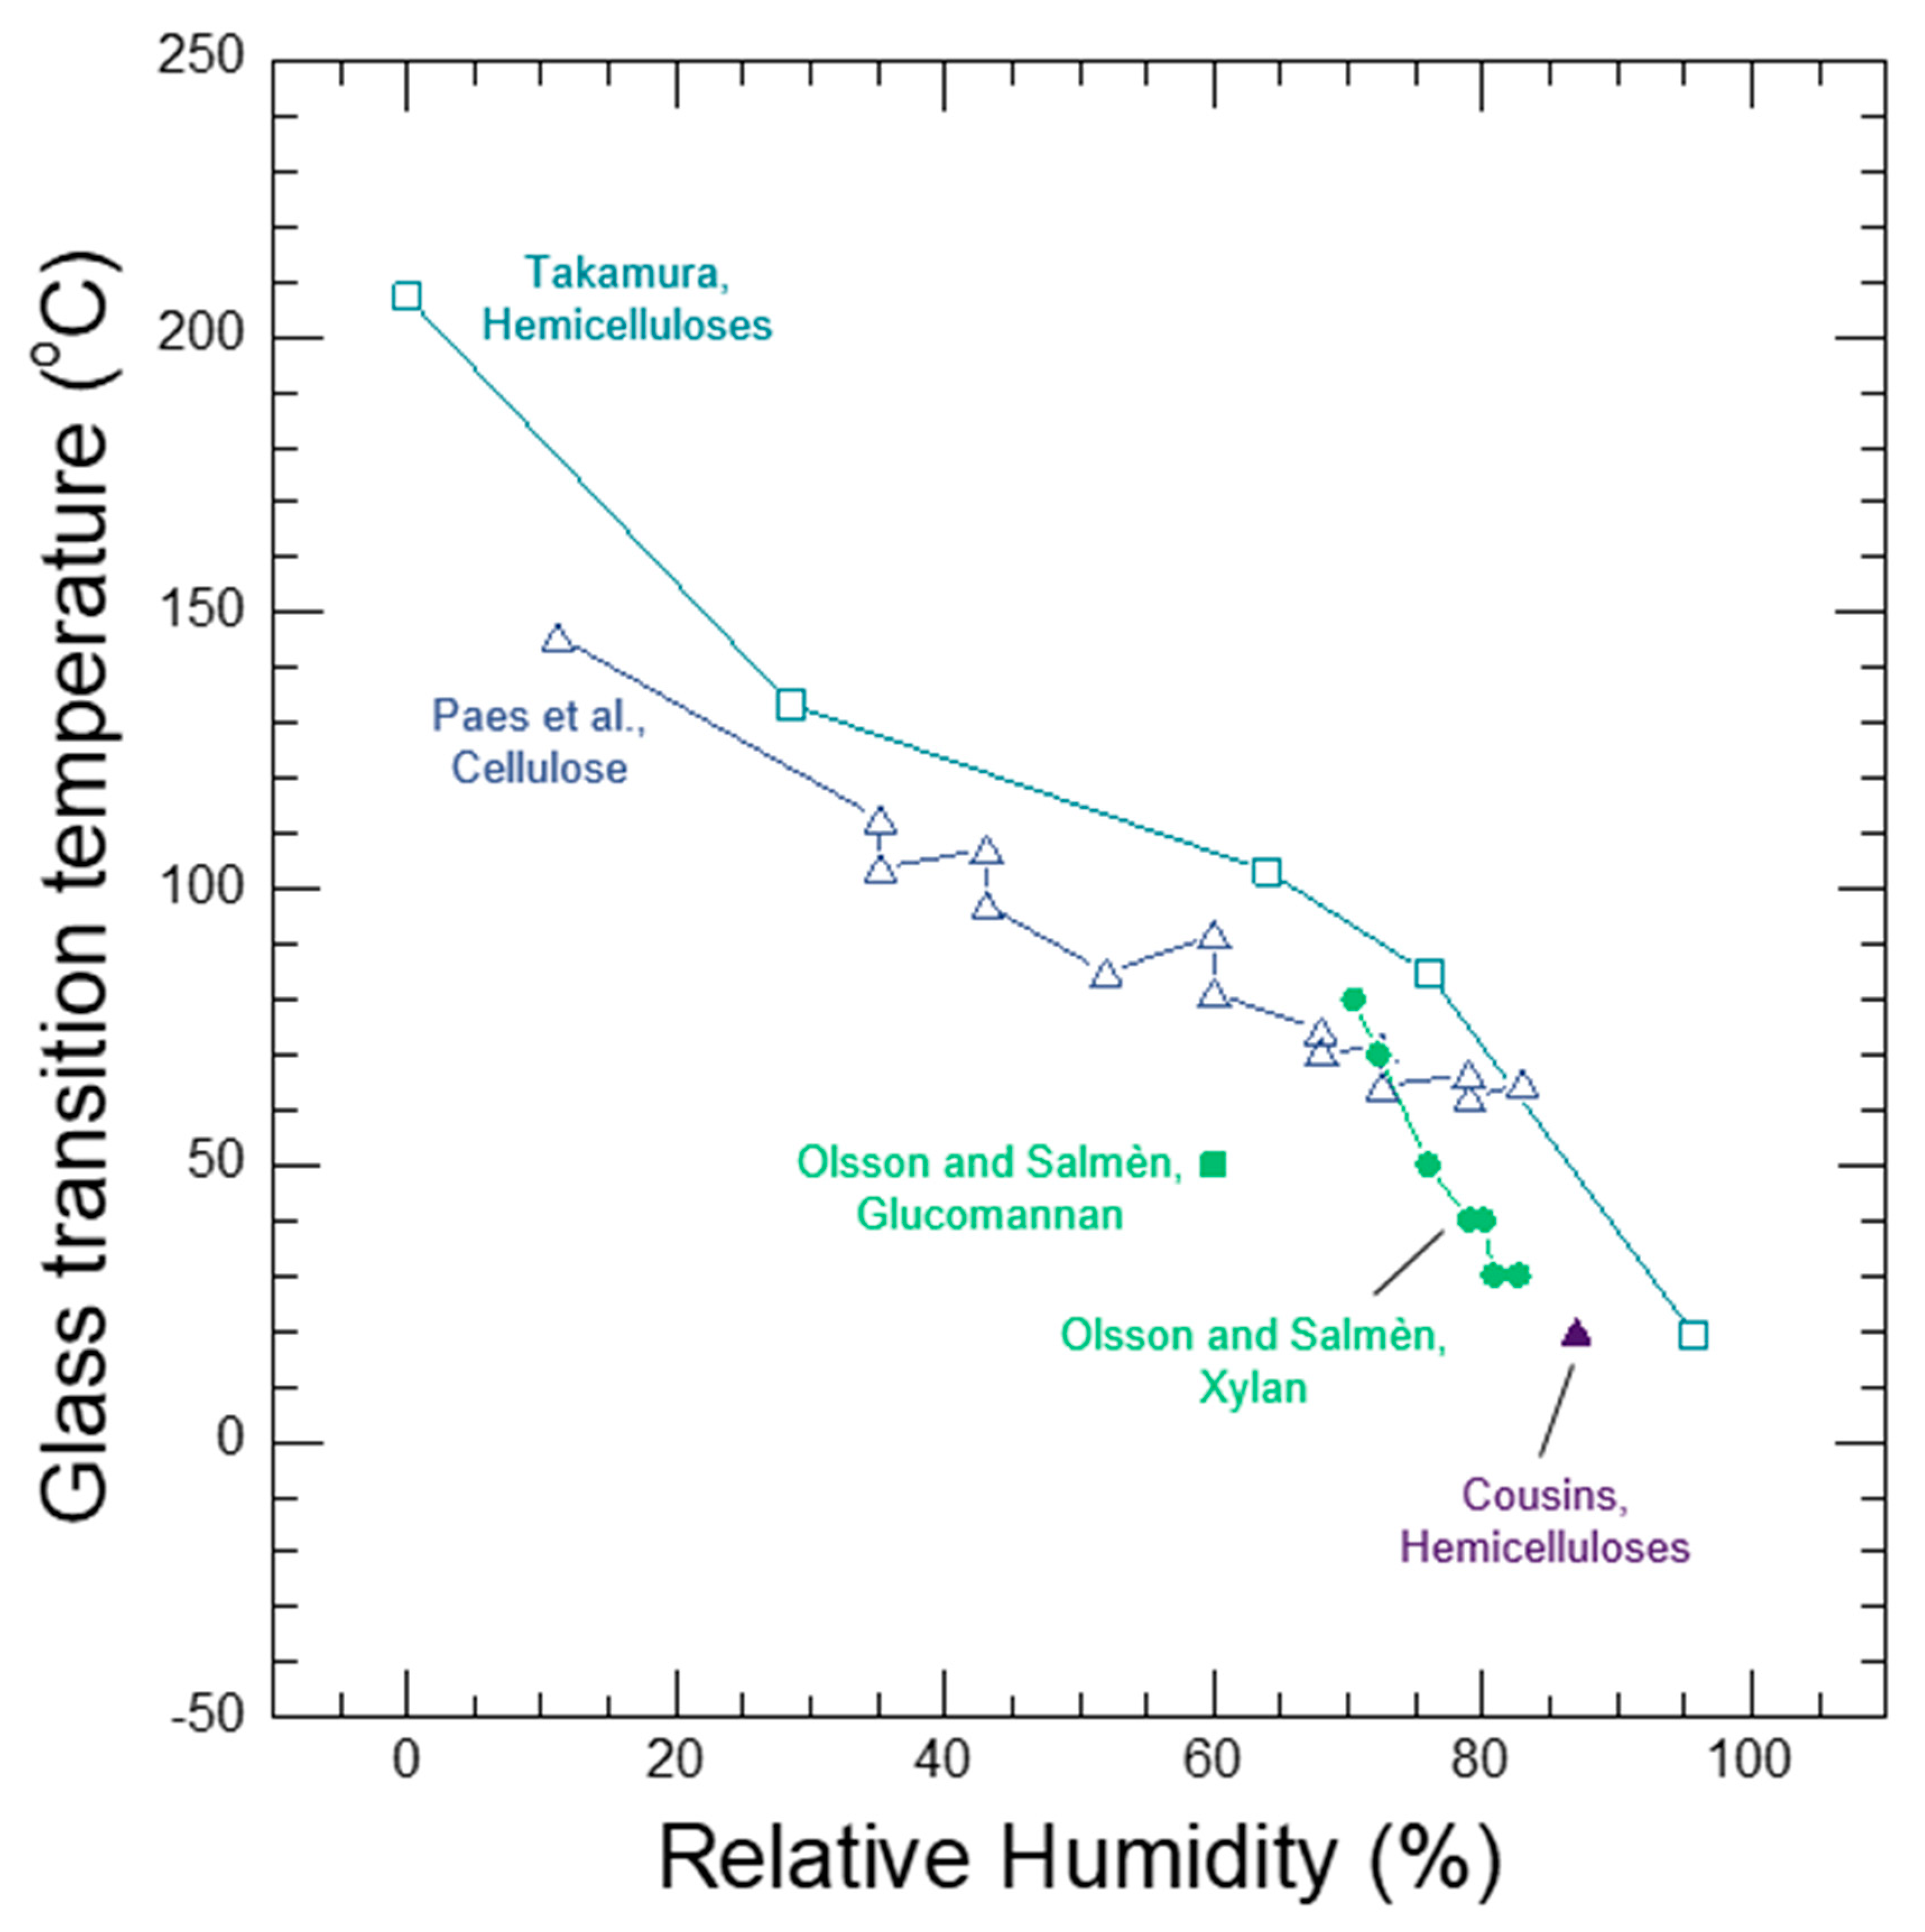
Whether a wood polymer is in its glassy or rubbery state has a very large effect on its diffusion properties. Understanding glass transitions in wood polymers is expected to be difficult because wood cell walls are complex polymer blends, and in secondary cell walls there are also the reinforcing cellulose fibrils. In wood, separate glass transitions for in situ lignin and in situ hemicelluloses have been reported. While the in situ lignin glass transition is widely accepted, there is much more uncertainty in the reported in situ hemicelluloses glass transitions. A thorough discussion and analysis of the literature is needed to clarify whether or not both lignin and hemicelluloses have glass transitions in wood. Therefore, in Section 7 we provide a supplementary discussion and analysis of the available literature for glass transitions in wood polymers. We conclude that both lignin and the amorphous polysaccharides very likely have glass transitions in wood. It is not possible to determine conclusively which of the amorphous polysaccharides (for example, amorphous cellulose, xylan, or glucomannan) may be responsible for the observed glass transitions. Therefore, we will group them together as amorphous polysaccharide glass transitions. Similar to other typical hydrophilic polymers, experimental observations of wood polymer glass transitions depend on temperature, MC, and time-scale of the experiment. At room temperature and a time scale of about 1 Hz, the in situ amorphous polysaccharides glass transitions most likely occurs when the bulk wood is at 10% to 15% MC, which corresponds to 60% to 85% RH conditions. In contrast the in situ lignin does not pass through a moisture-induced glass transition at room temperature, and even in water-saturated wood the glass transition temperature is well above room temperature with a reported 73 °C to 95 °C range when tested at an approximate 1 Hz time scale. The likely existence of two distinct glass transitions for lignin and amorphous polysaccharides further supports that the wood polymers exist as a compatible or immiscible polymer blend inside of wood cell walls.
3.5. Cell Wall Porosity
We use the term cell wall porosity to refer to the volumes in wood cell walls that are not occupied by the native wood polymers (i.e., cellulose, hemicelluloses, lignin, and pectins) or native chemicals deposited in the cell wall while the tree was living (e.g., extractives or mineral ions). In unmodified wood cell walls, these volumes include free volume and volumes occupied by typical atmospheric gases and water.
Dry, unmodified wood cell walls have long been regarded as essentially nonporous, solid materials [120,121,122,123,124]. The only porosity expected are free volume elements similar to those found in typical solid polymers. In unmodified wood cell walls, there is no evidence of interconnected pores that could facilitate mass transport, such as those proposed to form in pulp after lignin and hemicelluloses are removed from wood [23].
The premise that wood cell walls are essentially non-porous solids does not contradict reported wood porosity measurements made in dry wood. Some of these cell wall porosity measurements were made in wood dried through solvent-exchange or supercritical CO2 methods, which introduces cell porosity not present in unmodified dry wood [120,124,125]. Although Stone and Scallan concluded that unmodified wood cell walls are essentially non-porous in their nitrogen adsorption experiments [124], more recent mercury intrusion and helium pycnometry measurements report pore diameters as small as a few nanometers in a wide variety of wood species under dry conditions [126,127]. The more recent work claimed the small pores were in the wood cell walls. However, direct experimental evidence of the pores existing inside unmodified wood cell walls, or for that matter creating interconnected pores that could facilitate mass transport, cannot be directly interpreted from these types of porosity measurements.
3.6. Unmodified Versus Modified Wood
Unmodified wood is wood that has not undergone substantial changes in its cell wall structure, nanostructure, or molecular structure. Unmodified wood may include native chemicals that were deposited in the cell wall while the tree was living, such as extractives in heartwood or the mineral ions that compose wood ash. Unmodified wood may be intentionally dried, such as in a kiln or chip dryer, as long as the associated heating does not cause substantial, irreversible property changes. Unmodified wood can be any MC. Wood typically undergoes some type of size reduction (cutting, peeling, chipping, etc.), but for wood to be considered unmodified its cellular structure must remain largely intact with cell walls that are not mechanically damaged. This intactness is important because removing structural levels of constraint (e.g., polymer matrix, nanostructure, cell wall layer, or cellular level constraints) would likely modify the swelling pressure, and consequentially moisture sorption and diffusion properties.
Modified wood is wood that can no longer be considered unmodified because of substantial, irreversible changes to its cell wall structure, nanostructure, or molecular structure. Modifications often occur intentionally during many of the processes that utilize wood, including pulping, biorefinery pretreatments, thermal modifications, composite manufacture, and chemical modifications, such as acetylation. Some specific examples of modifications include cell wall infiltration of any non-native chemicals besides water (for example, pH modifier, adhesive components, organic solvents, etc.) or mechanically damaging the cell wall structure, such as during medium density fiberboard production or the manufacture of compressed wood. Wood may also be unintentionally modified, such as during fungal decay or metal fastener corrosion degradations of wood products.
4. Phenomenological Framework for Diffusion in Unmodified Wood Cell Walls
Mass transport mechanisms differ substantially in the cell wall and inter-cell wall volumes in wood. Convective mass transport of gases and liquids can occur through the inter-cell wall pore volumes in response to pressure gradients and capillary forces. Molecular diffusion within these inter-cell wall regions is typically considered as Fickian diffusion through the liquid or gaseous material occupying the volume [128]. A diffusant first infiltrates the cell wall surface through either sorption from a gas phase or through liquid wetting. The diffusant may enter the cell wall from an exposed surface on the piece of wood or an internal surface through which the diffusant traveled via inter-cell wall pore volumes. Mass transport through unmodified wood cell walls is also a diffusion process; however, progress in achieving a detailed understanding of this process has been challenged by the complexities of lignocellulose structure in the cell wall. In this section we explore these complexities and assemble a phenomenological framework to aid in elucidating diffusion through unmodified wood cell walls.
4.1. Diffusion in Dry Wood Cell Walls
The amorphous wood polymers are in their glassy state under dry conditions. Similar to other amorphous polymers, diffusion into dry wood cell walls is expected to be very complex because it depends on interrelations between polymer matrix free volume, diffusant dimensions, solubility of the diffusant in the polymer matrix, and molecular motions of the wood polymers. Whether diffusion is Fickian, case II, or anomalous will depend primarily on whether the diffusant motion causes perturbations in the polymer matrix. In glassy wood polymers, similar to other glassy polymers, the polymer matrix is expected to take a long time to relax after a perturbation caused by diffusant motion or swelling because the cooperative motions needed for the relaxations do not occur readily in glassy polymers. Consequentially, diffusion would be expected to be anomalous if substantial swelling occurs. However, diffusion can be Fickian if the diffusant or the concentration gradient is so small that diffusion does not cause swelling or shrinking in the polymer matrix.
Experimentally, diffusion into wood cell walls by various liquids has most often been assessed by making a measurement of swelling at the bulk level. If a molecule diffuses into the cell wall and causes swelling, the bulk-level swelling can be readily measured. There has been extensive work studying the bulk swelling caused by water and other chemicals, which provides insights into effects of diffusant dimensions and solubility on diffusion into wood cell walls.
Small polar molecules such as water and formamide are excellent swelling agents for wood. Increases in solvent basicity (hydrogen bond donor number) are linearly correlated with increases in swelling [129]. Diffusants with smaller molar volumes also promote both the total swelling [121,129,130] and rate of swelling [129,131]. Poly (ethylene glycol) (PEG) larger than 400 Da did not swell, or diffuse into, dry wood cell walls [132], which provides a measure of a reasonable maximum diffusant size for a linear molecule that can enter the dry wood polymer matrix.
Non-polar molecules such as benzene, carbon tetrachloride, and heptane are not very soluble in wood cell walls and all swelled dry wood less than 0.01% on the time-scale of an hour [133], but after 8 days benzene swelling of 0.2%–0.3% was observed. Mantanis and coworkers reported dry wood swelling rates of non-polar solvents up to five orders of magnitude slower than water and, therefore, allowed 100 days of soaking before measuring 1.2% swelling in carbon tetrachloride and 0.85% in octane [129].
The highly ordered cellulose elementary fibrils are not soluble in water or most common solvents and can be dissolved only with certain solvents, such as N-methylmorpholine N-oxide and ionic liquids [134].
In principle, the three-dimensional Hansen solubility parameters are useful to interpret and predict the ability of solvents to enter and swell the wood polymers [62]. The solubility parameters are based on the construct of dividing total cohesion energy into energies arising from non-polar (London dispersion), permanent dipole to permanent dipole, and hydrogen bonding molecular-scale interactions. Although the Hansen solubility parameter data for wood polymers are incomplete, the current data reveal that although cellulose and lignin both have substantial contributions from all three molecular-scale interactions, the cellulose has overall higher solubility parameters than lignin. The solubility parameters of hemicelluloses depend on the side group structure and decoration frequency. More polar side groups, such as hydroxyl groups, increase solubility parameters, whereas less polar side groups, such as acetyl and methyl substituted side groups, decrease solubility parameters. Therefore, polar solvents with hydrogen bonding can be expected to swell wood much more than non-polar molecules.
4.2. Water Diffusion and Plasticization in Wood Polymers
As a small molecule with strong hydrogen-bonding capabilities, water readily diffuses into and out of the amorphous wood polymers in the secondary cell walls and compound middle lamella. The movement of water is likely controlled by the wood polymer small-scale molecular motions, as seen in other polymers [51,69]. Similar to other amorphous hydrophilic polymers [45,46,47,48,49], water inside of wood cell walls is expected to exist in states associated with molecular solution, hydrogen bonded, absorption in polymer matrix “holes”, or water clusters. Water in the molecular solution and hydrogen bonded states contribute to plasticization. At low MC or during diffusion driven by small concentration gradients, water diffusion is likely Fickian because the water motion is not causing enough swelling perturbations in the polymer matrix to be influenced by the slow cooperative motion relaxations in the glassy polymer matrix. When substantive amounts of swelling in the glassy polymer matrix occur, then water diffusion would be expected to become anomalous. It is likely both Fickian and anomalous diffusion occur simultaneously in the wood cell walls. The relative proportions of each type of diffusion will also likely be different in the different wood polymers.
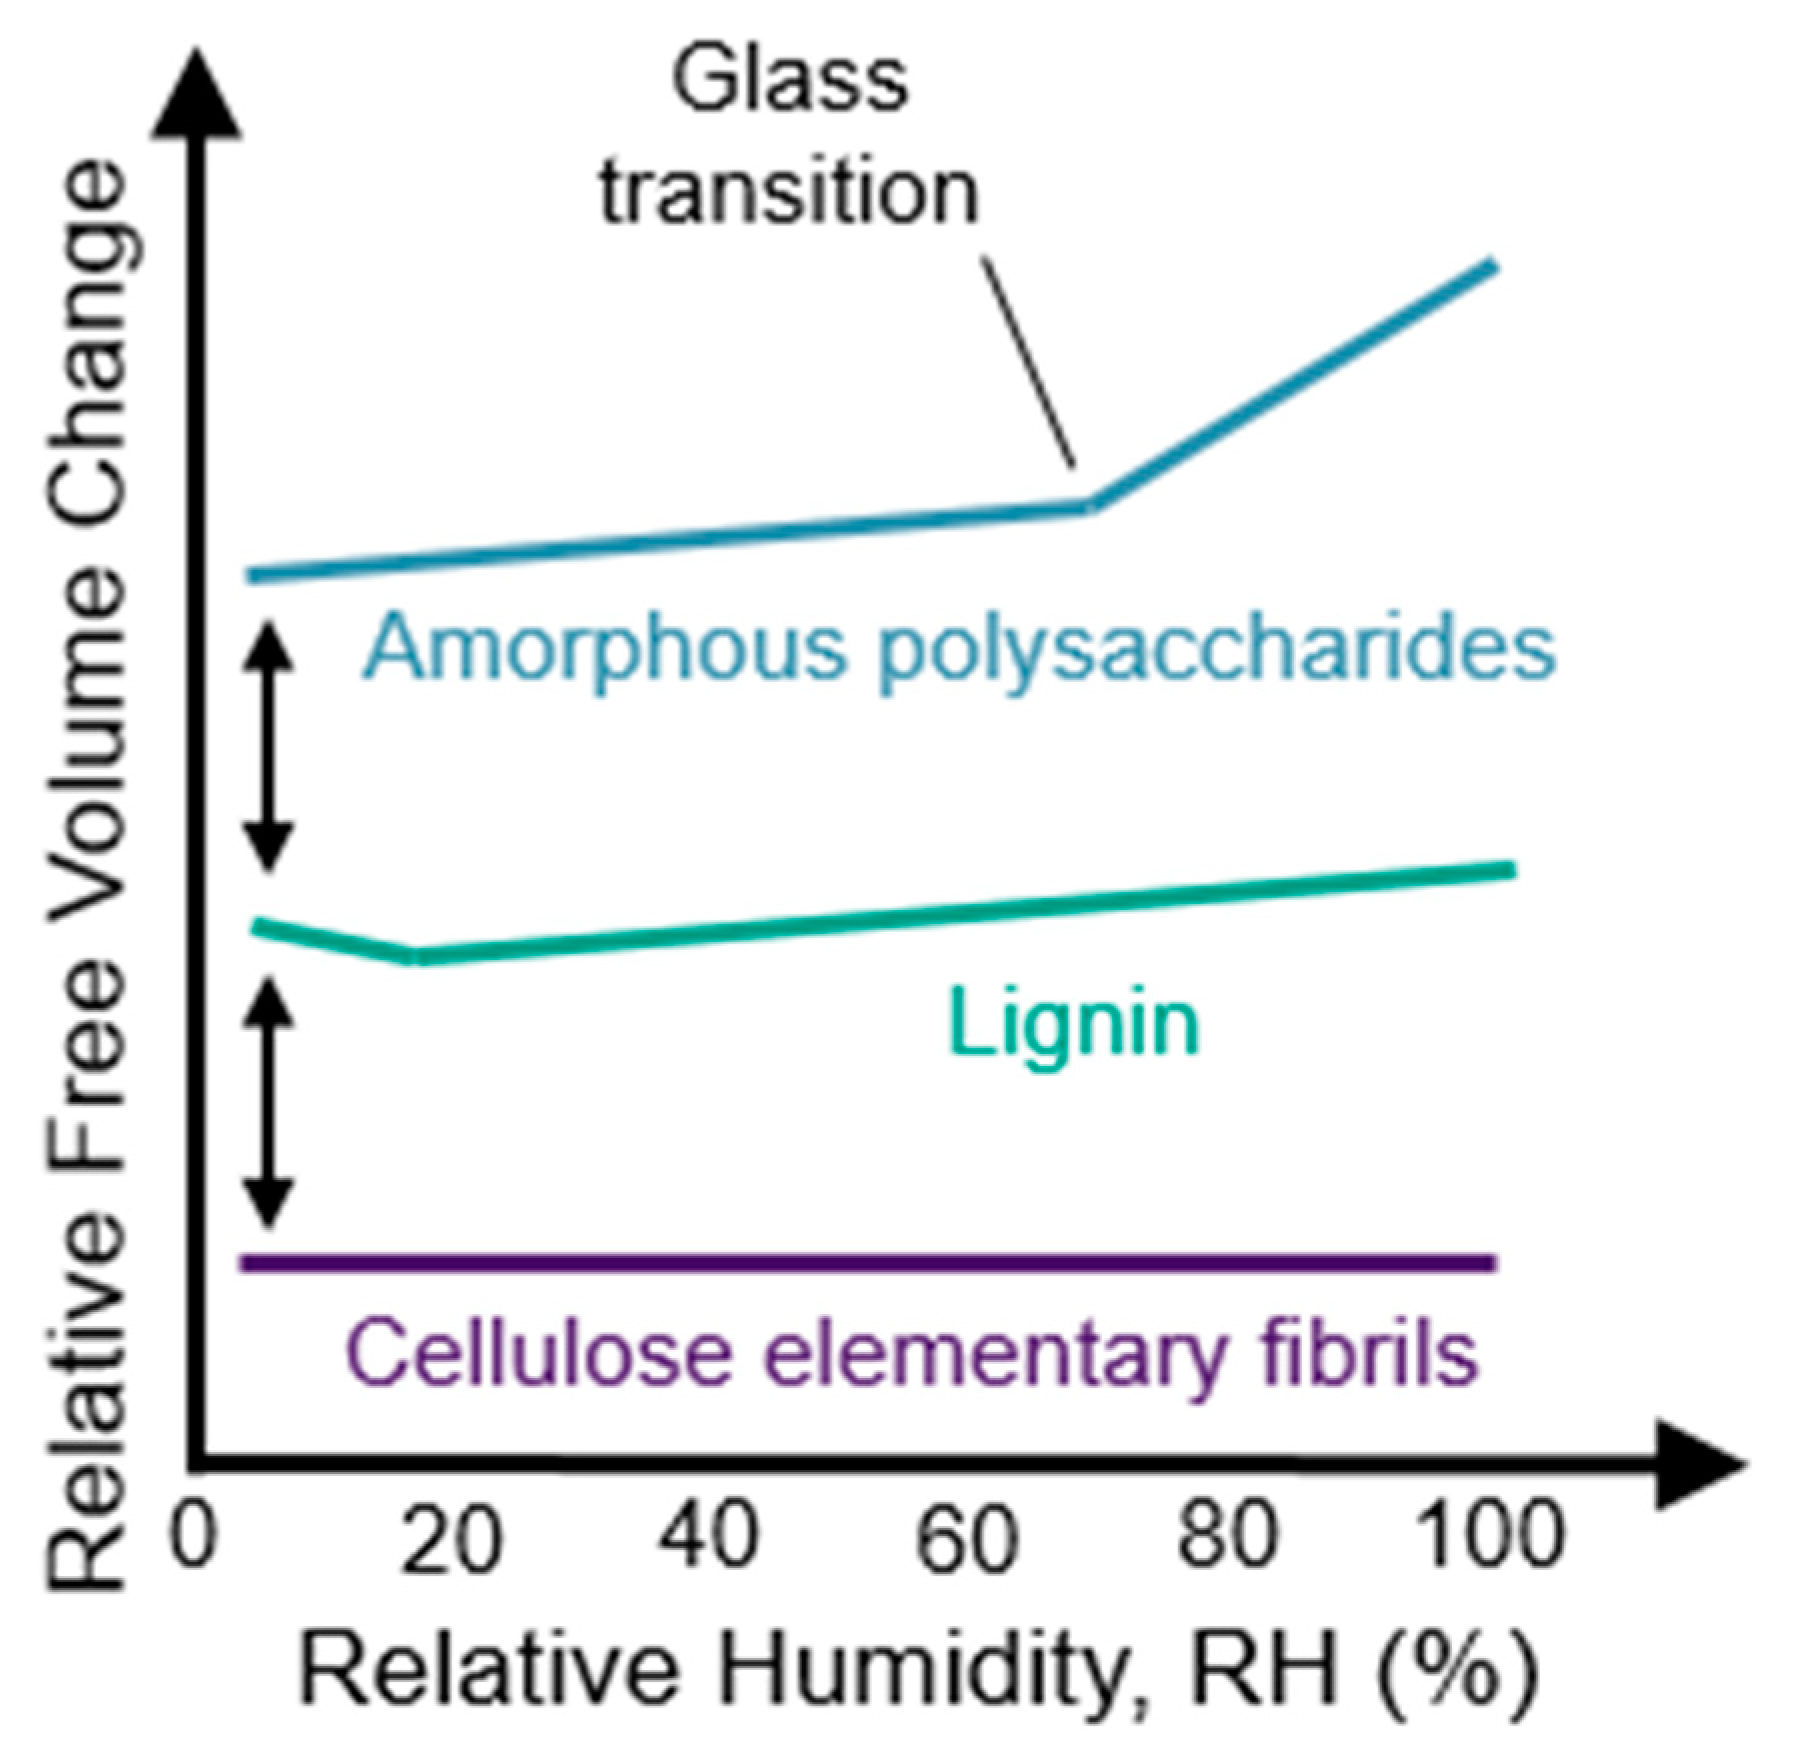
Within lignin assemblies, there is substantial evidence that polymer matrix “holes” exist and are filled with water molecules at low MC. These “holes” are free volume elements large enough to accommodate a water molecule without perturbing the polymer molecular structure. In molecular dynamic simulations, water filling “holes” is observed and the free volume in the lignin polymer matrix actually decreases at low levels of moisture [135]. The relative changes in lignin free volume with moisture are shown schematically in Figure 7. The new hydrogen bonds formed when the water fills “holes” in the polymer matrix result in an overall increase in lignin matrix stiffness that manifests as an increase in elastic modulus, which has been observed in both simulations and experiments [135,136]. At higher levels of moisture, water plasticizes the lignin and, therefore, likely exists in molecular solution and hydrogen bonding states. Water plasticization effects are supported by increases in lignin dynamics upon increasing hydration observed in quasielastic neutron scattering (QENS), dielectric spectroscopy, and simulation studies on isolated lignin from vanilla beans [137]. Therefore, using free volume concepts, diffusion through lignin would be expected to decrease slightly at low moisture contents, and then increase with free volume at higher moisture conditions.
In hemicelluloses and amorphous cellulose, the free volume is found to increase continually with moisture in molecular dynamic simulations [135,138], even at low moisture contents as shown schematically in Figure 7. This implies that there are fewer “holes” for the water to fill in amorphous polysaccharides, and even the first water molecules cause some swelling and plasticization. Diffusion would be expected to increase with the free volume and water plasticization. Indeed, increases in water mobility with hydration have been observed experimentally by nuclear magnetic resonance (NMR) relaxometry experiments on microcrystalline cellulose [139] and nanocomposites made of xyloglucan and cellulose nanofibrils [140]. Additionally, NMR spin-spin relaxation experiments of cellulose in hydrated paper [141] and QENS studies on deuterated bacterial cellulose [142] have also shown increases in water mobility with increases in moisture. An increase in water diffusion constants in amorphous cellulose and hemicelluloses have also been observed in simulations [143].
A few experiments have been performed to investigate the water states and diffusion constants in unmodified wood [144]. As the amount of water increases, diffusion of water increases as assessed experimentally using water absorption studies [145,146,147], NMR spin-spin relaxation studies [148], and QENS [149]. The QENS results suggest the presence of at least two distinct water populations in wood, and is able to quantify their dynamic state using a jump diffusion model [149]. The jump diffusion model agrees with the stop and go process proposed by simulations of water diffusion in wood polymers [138]. QENS also provides evidence for the formation of water clusters, which have estimated radii of confinement that increase from 3 to 6 Å as the RH increases from 20% to 98% RH [149]. These radii correspond to spherical volume increases from 113 to 904 Å3. Considering that a molecule in bulk water has a volume of approximately 30 Å3, these radii of confinement correspond to clusters that contain approximately 4 to 30 water molecules.
Understanding water clusters, or water-filled pores as they are sometimes referred to, is important to understanding the effects of moisture on diffusion because water in pores would not contribute as much to plasticization as molecular solution or hydrogen bonded water. Additionally, if present, interconnecting water-filled pores may provide avenues for aqueous diffusion of chemicals through cell walls. Thermoporosimetry measurements have also been made to measure the porosity of the fully water-saturated cell wall, and thus the sizes of potential water clusters [150,151]. For example, Grigsby et al. measured pore sizes from 3 nm in kiln-dried wood to 200 nm in water-saturated wood [150]. However, the scan rates used in these studies were over two orders of magnitude higher than what is needed to accurately measure pore sizes from the water melting phase transition [152]. Therefore, although these measurements suggest that clusters of water larger than those observed with QENS [149] might exist in the saturated cell wall, the total volume and size distribution of such clusters are still unknown.
It should be pointed out that the water clusters that may be present in cell walls are different from “capillary condensation”. Capillary condensation, described by the Kelvin equation, is a relationship between the activity of bulk water and the curvature of a liquid-vapor interface. Thygesen et al. [123] and Engelund et al. [153] showed that capillary condensation is only a minor contribution to the wood MC below 99.9% RH. Therefore, it is likely that water in clusters measured by thermoporosimetry does not behave similarly to bulk water, but instead has unique thermodynamic properties. This is supported by the observation that no water is observed to freeze in samples equilibrated below the fiber saturation point [30].
In addition to promoting water diffusion, increases in free volume associated with water plasticization would also be expected to promote diffusion of other chemicals. Borate treatments are generally found to diffuse more in wood with higher MC [154]. Interestingly, the diffusion of the nonpolar molecule n-hexadecane is not found to be substantially affected by the wood MC [155], which suggests that the polarity of the diffusant matters. Larger PEGs are able to diffuse into wet wood cell walls. The reported cutoff for access to the water-swollen cell wall ranges from 3600 to 58,000 Da [156], which is much higher than the 400 Da cutoff for PEG diffusion into the dry cell wall [132]. The maximum size of a diffusant that can enter a cell wall is also expected to depend on the shape of the molecule. Cylindrical molecules, such as dextrans, asymptotically approach cell wall exclusion around 5000 to 15,000 Da [157,158,159]. More spherical molecules would be expected to have even less accessibility [61].
As previously discussed, moisture-induced swelling pressures inside a wood cell wall are possibly as high as 100 MPa. Because free volume and, therefore, diffusion and water sorption, generally decreases with increases in pressure, it would be expected that some of the water plasticization effects would be counteracted by increases in cell wall swelling pressure. Using the thermodynamic framework above, it is also possible to examine the effects of swelling on sorption by applying an external pressure term [96]. In these cases, the differential change in MC with applied stress can be calculated from a “humidity expansion coefficient”. Simpson measured humidity expansion coefficients on red oak and found that application of a tensile stress increased the equilibrium MC, whereas a compressive stress decreased the equilibrium MC [160]. These experiments support the assertions by Barkas that wood polymers would be expected to absorb less water under states of compressive swelling stresses [66].
4.3. Diffusion in Rubbery Wood Polymers
See Section 7 for a thorough discussion and analysis of the wood polymer glass transition literature. At room temperature, glassy amorphous polysaccharides likely pass through their glass transition and become rubbery when conditioned at 55%–80% RH, which corresponds to 10% to 15% wood MC. An increase in the rate of free volume formation with additional moisture occurs at the glass transition, as illustrated in Figure 7. Lignin passes through a glass transition at higher temperatures. For example, lignin glass transition temperatures in water-saturated wood have been reported in the range of 73 °C and 95 °C. Upon transition to the rubbery phase, the larger-scale cooperative motions in wood polymers become activated. These larger cooperative motions are also expected to facilitate the transport of larger diffusants. Diffusion of water and other chemicals in the rubbery wood polymers is generally expected to be Fickian because with cooperative motions active, the rubbery polymer matrix can quickly accommodate the polymer matrix perturbations caused by diffusant motion and swelling. However, diffusion through amorphous polysaccharides inside of the cell wall that causes swelling may still be anomalous because the neighboring lignin domains may remain glassy and affect the rate of swelling in the rubbery amorphous polysaccharides.
Diffusion of inorganic ions is an example of a larger diffusant that can diffuse in the rubbery amorphous polysaccharides. In wood, cell wall inorganic ion transport is not observed in wood below about 10% MC [161,162]. However, above 10% MC the transport is observed [161,162,163,164,165]. Because no free water is present in inter-cell wall volumes in wood at this MC, the transport must be occurring through the wood cell walls. Similarities in moisture conditions at which the onset of cell wall inorganic ion transport and the moisture-induced glass transition of the amorphous polysaccharides are observed led to the proposal that that inorganic ion transport through wood cell walls occurs via diffusion through rubbery amorphous polysaccharides [31]. This proposed mechanism is now supported experimentally. Jakes recently used nanomechanical spectroscopy to assess the time-scale of the amorphous polysaccharides’ molecular relaxations in the S2 and compound corner middle lamella (CCML) of loblolly pine (Pinus taeda) as a function of RH conditioning from 0% to 98% RH [32]. Ion conductivity measurements, which were also made in the S2 and CCML of loblolly pine from 50% to 95% RH by Zelinka et al. [166], were compared to the mechanical spectroscopy results. The comparison reveals that the mechanism for cell wall transport of inorganic ions is indeed diffusion through the rubbery amorphous polysaccharides. Fickian diffusion has been observed in the diffusion of inorganic ions into wood cell walls under water-saturated conditions [167,168,169]. Collectively, the experimental results support that diffusion of inorganic ions in unmodified wood cell walls only occurs when the amorphous polysaccharides are in their rubbery state, and the diffusion is likely Fickian.
5. Summary of Polymer Science Phenomenological Framework for Wood Cell Wall Diffusion
In polymers, diffusion depends on complex interactions between the free volume of the polymer matrix, molecular motions, diffusant dimensions, and solubility of the diffusant in the polymer. Diffusants enter polymers when conditions are thermodynamically favorable. Under such conditions, energy of mixing is released because the chemical potential of the diffusant decreases as it is absorbed into the polymer. Concurrently, polymer swelling occurs when this released energy of mixing creates elastic energy that distorts the polymer into a swollen state. A diffusant randomly moves through a polymer matrix when a free volume element of sufficient size forms next to the diffusant, and the diffusant has sufficient thermal energy to “jump” into the free volume. In the presence of concentration gradients, the overall consequence of random diffusant motion is the net transport of the diffusant from areas of higher concentration to areas of lower concentration. Under dry conditions, the amorphous wood polymers are in their glassy state. In glassy polymers the predominant molecular motions are atomic vibrations and small-scale motions, which include motions of side groups or a few atoms along the polymer backbone. The glassy polymer matrix is rigid and hard. Therefore, it takes a long time to relax after any perturbation to its structure, such as those caused by the movement of diffusants and swelling. Diffusants that are sufficiently small and soluble readily diffuse into dry wood cell walls. Diffusion is most likely Fickian if the diffusants do not appreciably swell the glassy polymer matrix. If the diffusant swells the glassy polymer matrix, diffusion becomes anomalous because it becomes dependent on the time needed for the glassy polymer matrix to relax and accommodate the polymer matrix perturbation caused by the diffusion. Water readily diffuses in wood cell walls and likely exists in states associated with molecular solution, hydrogen bonded, adsorption in polymer matrix “holes”, or water clusters. The former two states contribute to plasticization. With increasing water plasticization, diffusion of water and other polar diffusants is promoted because free volume generally increases, which causes mobility to increase and larger molecular motions to become active. However, swelling pressures may counteract some of the water plasticization effects. At sufficiently high temperature or moisture conditions, the glassy wood polymers pass through a glass transition into a rubbery state. The amorphous polysaccharides pass through their glass transition at lower temperature and moisture conditions than lignin. Larger cooperative molecular motions, which involve the cooperative movements of approximately 40–50 atoms along the polymer backbone, become active in rubbery polymers. The activation of the larger cooperative motions causes the polymer matrix to become flexible and allows the molecular structure to rapidly relax after perturbations to its structure. The cooperative motions also create larger free volume elements in the polymer matrix to facilitate the transport of larger diffusants, such as inorganic ions. Diffusion in rubbery polymers is typically Fickian because the rubbery polymer matrix quickly relaxes to accommodate diffusant motion and swelling. Although diffusion may be non-Fickian under conditions in which the amorphous polysaccharides are rubbery and the lignin is glassy, such as under high-moisture conditions at room temperature, because the swelling in the rubbery amorphous polysaccharides may be affected by the much slower cooperative motion relaxations in the glassy lignin. In polymers, rates of diffusion are correlated to the molecular motions needed to facilitate the diffusant size. Therefore, small diffusants, such as gases and water, depend mostly on small-scale molecular motions, whereas larger diffusants depend on cooperative motions.
6. Future Direction and Questions to Address
An ultimate goal is to create quantitative, predictive models for diffusion that facilitate both process development for wood utilization and molecular-scale engineering of woody biomass to optimize its properties for specific uses, as well as resolve contradictions in the wood–water relationships literature. The following are a few suggestions for future research to achieve these goals.
6.1. Wood Molecular and Nanoscale Structures
Like any material, the full potential of wood and other lignocellulosic materials will never be realized until its structure is fully understood, especially at the molecular- and nanometer-length scales. Efforts to apply polymer science to better discern wood properties, including diffusion, are also hindered by the incomplete understanding of the wood structure at these small length scales. Proposed structures, such as the S2 and corner middle lamella nanostructures illustrated in Figure 6, remain to be fully evaluated. In particular, the interconnecting pathways of rubbery amorphous polysaccharides (amorphous cellulose and hemicelluloses) that are proposed to facilitate diffusion of larger chemicals, such as inorganic ions, need to be better understood.
Elucidating the molecular and nanoscale structures in wood requires a combination of spectroscopic and imaging techniques. Although the general polymer structures can be determined from experiments on extracted materials, understanding the in situ molecular-scale organization, motions, and interactions (e.g., inter- and intra-molecular hydrogen bonding, polymer entanglements in the interphases between the domains of lignin and hemicelluloses) requires experiments on intact unmodified wood cell walls. Of particular value are experiments that can be performed under varying moisture conditions so the effects of water can be studied. In addition to continuing the experimental and computational efforts that have led to our current understanding of wood structure, future work using solid-state NMR techniques, such as those recently developed to study molecular interactions in intact maize [170] and Arabidopsis [171] lignocellulosic cell walls, show promise to also advance our understanding of unmodified wood cell walls. Additional elastic and inelastic scattering techniques, especially like the QENS experiments already performed to study water structure and dynamics in wood [149], can also be employed to study wood polymer dynamics and interactions. For advancing the understanding of wood nanostructure, work utilizing X-ray and neutron scattering techniques should continue. In particular, new X-ray ptychography techniques [172] utilizing the bright coherent X-rays available at current generation synchrotrons may finally provide conclusive information about the 10 nm to 100 nm structure in unmodified wood cell walls. Likewise, soft and tender x-rays scattering techniques, such as soft x-ray resonance scattering [173], show promise in helping to determine conclusively the size and distribution of the cellulose microfibrils. Experimental measurements of free volume, such as using positron annihilation lifetime spectroscopy [174], would also provide useful structural information. Last but not least, modeling work should be used in conjunction with experiments to help deconvolute the complex experimental data.
6.2. Wood Polymer Glass Transitions
The reader is referred to Section 7 for a review and analyses of the current wood polymer glass transition literature. Because glass transitions play such a large role in amorphous polymer properties, the amorphous wood polymer glass transitions must be better understood, especially in the in situ amorphous polysaccharides because they likely undergo a moisture-induced glass transition at the temperatures where most wood is utilized. Efforts should focus on improving current experimental approaches to more reliably assess the in situ amorphous polysaccharides glass transition, in addition to employing new experimental techniques that have been used to study glass transitions in other polymers. These efforts should lead to further confirmation that the in situ amorphous polysaccharides have a glass transition and help determine which polysaccharides (e.g., amorphous cellulose, xylan, or glucomannan) are responsible for the reported thermal transitions.
Differential scanning calorimetry (DSC), dielectric thermal analysis (DETA), dynamic mechanical analysis (DMA), and other types of mechanical methods have been the most commonly employed techniques used to study wood polymer glass transitions. Of the current efforts, mechanical damping and dielectric loss tangent measurements made using DMA and DETA, respectively, have been the most successful in detecting the in situ amorphous polysaccharides glass transition. As discussed in Section 7, the amorphous polysaccharides glass transition is only evident in DMA when the applied stress is perpendicular to the wood longitudinal axis. Additionally, the wood may dry during DMA temperature scans. Therefore, when DMA is employed to study the hemicellulose glass transitions, the wood orientation in the test specimen must be properly oriented, and to avoid drying it would be best to perform frequency sweeps after conditioning the sample inside of the DMA at a specified temperature and humidity to maintain a constant MC. If DMA experiments are not performed under constant MC conditions, such as during a temperature scans, then the moisture loss during the experiment needs to be measured and reported. Additionally, potential mechanosorptive effects [175,176] in a specimen drying during a temperature scan would need to be addressed. Finally, similar to how Olsson and Salmèn confirmed the in situ lignin glass transition, future DMA and DETA studies should be performed on wood from a wide variety of tree species coupled with chemical analyses. Then a multivariate data analysis could be performed to further validate that the thermal transition is arising from hemicelluloses, and ideally help identify the specific polysaccharide related to the glass transition.
More sensitive and chemical-specific techniques should also be applied to study the amorphous wood polymer glass transitions. Solid-state NMR is a technique capable of assessing molecular motions in a specific molecule [177]. Systematic studies utilizing solid-state NMR to probe specific molecular motions in different wood polymers over a wide range of temperature and MC should provide direct information about the in situ wood polymer glass transitions. Another promising dielectric technique is thermally stimulated depolarization currents [178], which can be more sensitive than DETA and help resolve overlapping relaxations in complex polymer materials like wood cell walls.
6.3. Swelling Pressures
Because pressure has such a large effect on polymer properties, including diffusion, accurate measurements of swelling pressure inside wood cell walls are needed so it can be properly accounted for in any quantitative and predictive diffusion model. The multiscale constraint effects must also be taken into consideration when interpreting water sorption experiments done on extracted wood polymers, wood particles, or thin sections in which some of the constraints may have been removed. Systematic studies of moisture sorption and swelling pressure in pieces of wood spanning tens of nanometers to the bulk are needed to better understand the individual contributions of molecular structure, nanostructure, cell wall microstructure, and cellular structure constraints. Swelling pressure estimates utilizing strain measurements of cellulose lattice parameters with moisture, such as those reported by Zabler et al. [109], and cellulose elementary fibril elastic constants are promising as we demonstrated above. However, a more detailed micromechanical model should be developed. For example, if tension forces along the fibril longitudinal axis form during strain measurement, then a portion of the lattice parameter strain measurement may be arising from a Poisson’s ratio effect in addition to the moisture-induced swelling pressure. Finally, contributions of water sorption in different wood polymers to the released energy of mixing needs to be better elucidated to more efficiently develop molecular-scale engineering strategies to control and predict swelling pressures.
6.4. Modeling Work to Study Diffusion of Water and Chemicals
Simulations spanning length-scales from molecular to tissue structure would provide an excellent framework to evaluate diffusive processes in wood and assist in the interpretation of experimental results. Quantum mechanical (QM) simulations can provide fundamental insight about atomic interactions between diffusants, water, and cell wall polymers. Results from QM studies can be used to parameterize molecular dynamics simulations of polymer assemblies in lignocellulose; in principle, estimates of diffusion coefficients can be computed directly from these studies [179]. The obtained diffusion coefficients may be applied to cell wall and particle scale models of wood that incorporate species-specific microstructure [128] to perform simulations of bulk transport in wood. Models at this scale may be compared directly with relatively easily obtainable experimental results, which may be used to refine the modeling framework. Such a validated, multiscale simulation tool will find great utility in optimizing many wood treatment and conversion technologies for materials and biofuel/biochemical production applications. Additionally, it will be useful for molecular-scale engineering of woody biomass to optimize it for specific uses. Some methodological guidelines for using molecular simulations for studying wood–water relationships are also discussed by Chen et al. [180].
6.5. Experimental Work to Study Diffusion of Water and Chemicals
More systematic experiments are needed to quantify and link moisture-dependent diffusion and molecular motions in wood polymers. A large compliment of experiments are likely needed to span all the needed spatial, temporal, and environmental conditions. Although much work in this area has already been started, as described earlier in this perspective and reviewed by Plaza [144], variations in experimental conditions and types of wood or extracted material tested make comparisons difficult. Additionally, although studying extracted polymers is likely necessary to deconvolute the contributions of each wood polymer, the chemical and physical state of the extracted material is likely to be very different than inside the unmodified wood cell wall. Therefore, diffusion and molecular motion measurements should be made on extracted and intact wood under similar temperature, moisture, and pressure conditions whenever possible. The effects of swelling pressure on the moisture-induced glass transition of the amorphous polysaccharides also needs to be better understood. Experimental work will also be critical for validating the modeling work.
6.6. Application to Water Sorption Models
Given that water plasticizes the cell wall, which affects water diffusion, both the kinetics of water vapor sorption and equilibrium sorption theories, which includes hysteresis and the fiber saturation point (FSP), depend on the polymer-science-based phenomenological framework presented herein.
The parallel exponential kinetics (PEK) model was commonly used to describe the kinetics of water vapor sorption for over a decade [181,182]. This model describes the sorption process as having a “fast” absorption process and “slow” absorption process with their own time constants. Various theories were applied to describe these two time constants, ranging from different sorption sites to swelling pressures. However, Thybring et al. [183] showed that the PEK model cannot fit sorption data because sorption data have more than two time constants. Using a multi-exponential decay analysis method (MEDEA), Thybring et al. showed that the number of sorption time constants varies across cellulosic materials and between RH steps for the same material. Typically, sorption processes contained 4–5 time constants but in some cases only 2–3 were observed. Time constants varied from 100 s to 450 ks. Although Thybring et al. showed that the PEK model was inadequate to describe sorption kinetics in cellulosic materials, they did not go so far as to propose a new model for sorption kinetics. Because clearly sorption depends on water molecules diffusing into the wood and relaxations in the wood polymer matrix, it may be possible to derive a physical model for sorption kinetics partially based on this new understanding of water diffusion.
Equilibrium models of water vapor sorption in wood, or so-called “sorption isotherms”, also may benefit from a better understanding of free volume and diffusion. Several of the most common models used in wood, the GAB (Guggenheim [184], Anderson [185], and de Boer [186]) and Dent [187] isotherms assume that the water molecules are absorbing to an atomically flat, non-changing surface as they are extensions of the Brunauer–Emmett–Teller (BET) [188] and Langmuir [189] isotherms derived from statistical mechanics. Although these models fit the data well, they have been shown to give incorrect predictions of physical quantities [101,190,191] and cannot be valid. Furthermore, these models are mathematically equivalent yet predict different monolayer thicknesses so cannot be valid. Although many isotherm models have been proposed for wood (Skaar lists more than 15 in his seminal book [96]), none of these models explicitly includes plasticization of the substrate and changes to free volume described earlier in this paper, both of which will affect sorption. They also do not account for the high swelling pressures that likely form in wood as it absorbs moisture. The recent thermodynamic model developed by Derrien and Gilormini [68] couples internal swelling pressures to absorption capacity in fiber reinforced polymer composites and is likely applicable to help better understand water vapor sorption in wood.
Water vapor sorption in wood is hysteretic; that is, the amount of moisture in the wood at a given relative humidity is greater when reached through desorption than through absorption [98]. Despite the importance of sorption hysteresis in understanding wood-moisture relations, there is little consensus as to the physical nature of hysteresis in wood. Engelund and Thygesen [122] reviewed the literature and presented five potential theories. Two of the theories involved capillary condensation, which has been shown to be of minor importance in the hygroscopic range [123,153]. Another theory, the independent domain theory, is only a mathematical treatment of hysteresis from which it is difficult to obtain an understanding of the wood material. The final two theories for hysteresis involve swelling of the wood polymer during absorption and the potential for wood polymers to undergo a glass transition, both of which are related to the free volume of wood polymers. It appears that improving our understanding of free volume and diffusion is a key to better understanding moisture sorption hysteresis in wood.
An improved understanding of the fiber saturation point (FSP) may also be gained using the approach presented in this perspective. FSP conceptually divides water into either “bound water”, which is contained within the cell wall and absorbed in the wood polymers, or “free water”, which has properties similar to liquid water and exists in inter-cell wall volumes. The reported values for FSP depend on how it is measured. As previously mentioned, values between 25% and 32% MC are typically reported [96]. However, values as high as 40% MC have also been reported [122]. FSP estimates made using mechanical properties or physical properties, such as electrical conductivity and shrinkage, tend to be around 30% MC, whereas solute exclusion and pressure plate measurements typically find values of around 40% MC [122]. Because plasticization affects mechanical properties, it may be that the 30% MC estimates represent an upper bound for the amount of water absorbed in polymer matrix “holes” and the plasticizing molecular solution and hydrogen-bonding water. The 40% MC FSP estimates may be the upper bound for total amount of absorbed water, which would also include water molecules in water clusters that likely form predominately at the higher levels of MC. Water in water clusters would not be expected to contribute much to the cell wall plasticization. At a given temperature and pressure, the maximum amount of bound water, and therefore FSP, is likely reached when wood is in contact with liquid water and the wood is swollen to the maximum extent possible by the mixing energy released by water absorption in the wood polymers. An improved understanding of mixing energy and how elastic energy is stored across the multiscale polymer matrix, nanostructure, cell wall microstructure, or cellular level mechanical constraints in swollen wood is needed to better understand the FSP.
In summary, existing models for sorption kinetics, equilibrium water vapor sorption, and FSP are inadequate. More accurate descriptions of states of water in wood polymers, plasticization effects of water on wood polymers, and multiscale mechanical swelling constraints would be beneficial to developing new models.
6.7. Application to Modified Wood
Although this paper primarily aims to understand cell wall diffusion in unmodified wood, the overall approach would also be applicable to modified wood. It would be necessary to first understand how the modification changed the cell wall structure, nanostructure, or molecular structure. After the changes in structure are understood, then the effects of structural changes on underlying mechanisms controlling material transport and diffusion (for example, pore volume or free volume in the polymer matrix, solubility between the diffusant and polymer matrix, and molecular motions) could be explored.
6.8. Interpretation of Solute Exclusion Results
This view of water as a chemisorbed swelling agent, rather than simply occupying pores, has implications for the interpretation of existing solute exclusion literature. For instance, Alince [192] and Day et al. [193] argue that the solute exclusion technique is deeply flawed because molecules are partially excluded from pores less than 10 times their size, and the technique uses this exclusion data to probe pore volumes in wood. Although their criticism is correct for free water pores such as might be found in pulp, it is irrelevant to the case of unmodified wood, which explains why solute exclusion measurements produce reasonable results for unmodified wood samples. This suggests that solute exclusion measurements could be better conceptualized as the volume of cell wall polymer with sufficient free volume to allow diffusion of the probe molecule. Additionally, because amorphous polysaccharides (amorphous cellulose and hemicelluloses) are rubbery and lignin is glassy, it would be expected that the larger probe molecules would have greater access to the amorphous polysaccharides than the lignin.
7. Supplementary Discussion for Wood Polymer Glass Transitions
In the following sections, we summarize the literature reporting the moisture-dependent lignin, hemicelluloses, and amorphous cellulose glass transitions both in situ in wood and in extracted materials. While the thermal transition linked to the in situ lignin glass transition has been rather conclusively demonstrated, the reported in situ hemicelluloses glass transition links are much more uncertain. However, through a careful analysis of the available literature we will argue that the majority of the reported in situ hemicelluloses glass transitions are likely valid.
One of the major challenges to critically analyzing the literature is accounting for the numerous different wood species, techniques, and experimental conditions used in studies reporting wood polymer glass transitions. Similar to other hydrophilic polymers, experimental observations of wood polymer glass transitions depend on temperature, moisture, and the time-scale of the experiment. Reported experimental techniques used to study wood glass transitions include DSC, DETA, and mechanical methods, such as DMA. Another source of variability in the observations likely arises from the multiple methods available to define the glass transition, which vary significantly even within a single technique. For example, in DMA a glass transition can be defined as a softening point in the storage modulus spectra, or at a peak in mechanical damping or loss modulus spectra. Furthermore, when using mechanical methods the wood anisotropy may affect whether or not a glass transitions can be observed, especially for the in situ hemicelluloses glass transition as will be discussed. A critical analysis of how all of these factors affected the reported glass transitions falls outside the scope of this Perspective. However, many of the experimental details are still included to aid the discussion.
Another challenge is that it can be very difficult to conclusively determine whether or not an observed thermal transition is a glass transition. Other types of thermal transitions and relaxations also occur in wood polymers. For example, relaxations caused by the small-scale methylol side group motions at −125 °C and absorbed water motions at −50 °C have been observed and identified [194,195,196]. There are also observed thermal transitions whose origins are not known, such as the shoulders observed in the main mechanical damping peak of water-saturated wood by Chowdhury et al. [197].
A common method to determine whether or not a thermal transition is a glass transition is to observe whether or not the expected drastic softening in mechanical properties occurs as the material passes through its glass transition. In wood, a relatively large mechanical softening can be observed as the lignin passes through its glass transition. This expected behavior likely contributes to the wide acceptance of the in situ lignin glass transition in wood.
However, glass transitions in semi-crystalline polymers or polymer blends may not always be accompanied by an overall bulk-mechanical softening. The crystalline phase in a semi-crystalline polymer or a glassy phase in a polymer blend may serve to mask the softening effect when mechanical experiments are performed on the bulk material. Under these circumstances, another material property, such as mechanical damping or dielectric loss tangent, is often more sensitive and capable of detecting the glass transition. However, these properties are also more sensitive to other types of thermal transitions. Another method to gain insights into whether or not a relaxation is a glass transition is to calculate its activation energy. The activation energy is typically calculated using the Arrhenius relationship and the experimentally determined frequency dependence of the glass transition temperature [36,42]. Larger-scale relaxations, such as cooperative motions at a glass transition, require higher activation energies than smaller scale relaxations. Additionally, higher transition temperatures tend to correlate to higher activation energies [198]. Citing Boyer [198], in a study of in situ lignin glass transitions Salmèn suggested that an activation energy greater than 40 kJ/mol is indicative of a glass transition [199]. However, as a general rule this 40 kJ/mol value is likely too low based on the polymer glass transition activation energies listed in Boyer [198]. For example, poly(methyl methacrylate) and polystyrene, whose glass transition temperatures are 105 °C and 100 °C, respectively, have listed activations energies of 418 kJ/mol and 423 kJ/mol. Poly (vinyl acetate) and poly (methyl acrylate), whose glass transition temperatures are 27 °C and 0 °C, respectively, have 184 kJ/mol and 146 kJ/mol activations energies, respectively. For comparison, thermal transitions arising from small-scale side-chain molecular motions that occur at 40 °C in polystyrene and 45 °C in poly (methyl methacrylate) have activation energies of 146 kJ/mol and 88 kJ/mol, respectively [198]. When activation energies are reported in the literature for wood polymer glass transitions, they will be included in the discussion below. Although direct comparisons to the synthetic polymers listed in Boyer [198] are complicated by the complex effects of water plasticization and polymer blend morphology in wood polymers, the comparison still provides useful insight into whether or not an observed thermal transition is characteristic of a glass transition.
7.1. Lignin Glass Transitions
The work of Olsson and Salmén in 1997 [200] is often recognized as the most definitive work linking the lignin glass transition to an observed thermal transition in wood. They performed three-point bending DMA experiments under water-saturated conditions on wood from 16 different tree species. The long axis of the specimens was in the tangential wood orientation. Tests were performed using frequencies from 0.03 Hz to 5 Hz and temperature scans from 20 °C to 96 °C. Thermal transitions, which were defined at the mechanical damping peak in temperature scans, were observed at temperatures ranging from 73 °C to 92 °C at 1 Hz. As expected for typical polymer glass transitions, the thermal transitions temperature increased with increasing frequency and were accompanied by a substantial softening in the wood storage modulus. The wood compositions were also measured. A multivariate data analysis revealed a correlation between the thermal transition and lignin methoxyl content, but poor correlations were found with the carbohydrate compositions. Therefore, it was determined that the observed thermal transition was caused by the in situ lignin glass transition. Additionally, calculated activation energies for the transition ranged from 140 to 300 kJ/mol.
The wood thermal transition observed and attributed to the lignin glass transition by Olsson and Salmén [200] has also been observed by numerous other researchers over the past 50 years using various techniques and experimental conditions. Becker and Noack in 1968 [201] measured viscoelastic properties of beech wood (Fagus sylvatica L.) as a function of MC using a torsional pendulum operating at approximately 1 Hz. The long axis of the specimen corresponded to the radial wood orientation. Under water-saturated conditions, the maximum damping, which is indicative of a thermal transition, was observed at 78 °C. Hoglund et al. in 1976 [202] measured viscoelastic properties in water-saturated birch, aspen, spruce, and pine at frequencies from 0.5 to 5 Hz during a 20 °C to 160 °C temperature scan. Test specimens were prepared such that the long axis was either in the longitudinal or radial wood orientation. A maximum damping was observed at about 90 °C for all wood species and orientations. Becker et al. in 1977 [203] expanded this work by Hoglund et al. to higher 400–900 Hz frequencies, which resulted in the temperature of the damping peaks increasing to 110–140 °C. The increase in temperature with frequency is expected for a polymer glass transition. Salmèn in 1984 [199] measured viscoelastic properties in tension using DMA in water-saturated Norway spruce (Picea abies) at frequencies from 0.05 Hz to 20 Hz over a 20 °C to 140 °C temperature range. Specimens were prepared such that the tensile force was applied both parallel and perpendicular to the longitudinal wood axis. Peaks in mechanical damping increased from 80 °C to 100 °C with the increases in frequency. There was no effect of wood orientation on the observed peak in damping. An apparent activation energy of 395 kJ/mol was measured. In 1998, Uhmeier et al. [204] measured the compression yield stress in the radial direction of water-saturated spruce (Picea abies) from 0 °C to 200 °C. Based on a peak in the derivative of the yield stress versus temperature data, they found an 85 °C softening point that they attributed to the lignin glass transition. Placet et al. in 2007 [205] used the custom-built WAVET instrument to perform single-cantilever bending experiments to measure viscoelastic properties of water-saturated beech (Fagus sylvatica), oak (Quercus sessiliflora), poplar (Poplus sp.), and spruce (Picea abies) using frequencies from 5 mHz to 10 Hz and temperature scans from 5 °C to 95 °C. Specimens were prepared with their long axis in both tangential and radial wood orientations. At 1 Hz over the conditions tested, glass transitions defined at the peak of damping were only observed in both orientation for the oak and beech wood, and in the tangential orientation for the poplar. The values ranged from 78 °C to 85 °C. Presumably, the other glass transitions would have been observed at higher temperatures. They also reported activation energies between 299 and 341 kJ/mol, which were calculated using the Arrhenius relationship. Chowdury et al. in 2010 [197] tested water-saturated yellow poplar (Liriodendron tulipefera) in tensile- and compressive-torsion DMA in all three wood grain orientations. They found grain orientation and type of stress did not substantially affect lignin glass transition, which was defined as the peak of the mechanical damping and observed between 86 °C and 95 °C during heating scans.
All reported values of the water-saturated wood softening temperature related to the lignin glass transition fall between 73 °C and 95 °C when tested at a time-scale of approximately 1 Hz. All experimenters observed the thermal transition in water-saturated wood irrespective of wood species, type of mechanical experiment, or wood orientation. The only exceptions are the spruce specimens and the longitudinal poplar specimen tested by Placet et al. [205]. However, these experiments were only performed up to 95 °C, and it is likely the glass transition would have been observed at slightly higher temperatures.
For moisture conditions below the water-saturated state, the in situ lignin glass transition temperature is expected to increase with decreasing wood MC. The major challenge with making glass transition temperature measurements in wood under hygroscopic conditions is maintaining a constant wood MC during the temperature scans. Constant MC conditions can nominally be achieved in DSC experiments by using sealed pans. The DSC in situ lignin glass transition temperatures reported by Irvine [206] for Eucalyptus (Eucalyptus regnans) and Östberg et al. [207] for Norwegian spruce (Picea abies) and birch (Bertula verrocosa) are plotted in Figure 8.
The other data displayed in Figure 8 were made using mechanical measurements. The only mechanical measurements made under controlled MC conditions were those by Becker and Noack [201]. Their torsional pendulum testing apparatus was enclosed in a climate box with both temperature and RH control. At each temperature, the wood MC was kept constant by adjusting the RH until a second reference wood sample in the box was conditioned to the proper mass indicating a constant MC. They tested beech wood (Fagus sylvatica L.) and the observed thermal transition temperatures at 20.5% MC and 26% MC are plotted in Figure 8. The datum plotted at 30% MC was actually from their water-saturated test, but it is included to more clearly demonstrate that the lignin glass transition temperature increased with decreasing MC in their experiments.
The remaining reported lignin glass transitions in Figure 8 are from DMA studies in which the wood specimens were conditioned to an MC and then scanned over a range of temperatures in a DMA instrument under dry conditions. The glass transitions were determined from peaks in mechanical damping. Kelley et al. in 1987 [208] used a dual cantilever bending configuration in a DMA to test Sitka spruce (Picea sitchensis Bong. Carr.) and sugar maple (Acer saccharum Marsh.) at frequencies from 0.33 Hz to 30 Hz and temperatures from −140 °C up to approximately 150 °C. The orientation of their test specimens with respect to wood grain orientation was not reported. Kelley et al. also report a 339 kJ/mol activation energy for lignin in Sitka spruce at 15% MC. In 2011, Stelte et al. [209] tested a compressed mat of Norway spruce (Picea abies K.) particles using single cantilever bending experiments at 1 Hz from −60 °C to 200 °C. Neither of the DMA studies measured how much the samples dried during the temperature scans, so it is uncertain whether or not the reported MC values are accurate. Additionally, transient peaks in mechanical damping could be caused by mechanosorptive effects as water diffuses out of a drying specimen [175,176]. However, such transient peaks have only been reported in experiments with step changes in moisture conditions [175,176]. It remains unclear whether or not transient peaks in mechanical damping could arise from mechanosorptive effects during gradual drying, such as would likely occur during the DMA temperature scans. Therefore, it cannot be conclusively determined whether or not mechanosorptive effects influenced the thermal transitions observed by Kelley et al. [208] or Stelte et al. [209].
Also plotted in Figure 8 is the 73 °C to 95 °C range over which the lignin glass transition was reported for water-saturated conditions. It is noteworthy that with the exception of the careful work by Becker and Noack [201], all of the reported lignin glass transition temperatures greater than about 15% MC fall below the water-saturated range. It is uncertain what accounts for this discrepancy, especially considering that drying effects during the DMA experiments would be expected to have resulted in higher glass transition temperatures.
Calculated activation energies for the in situ lignin glass transition include the 140 kJ/mol to 300 kJ/mol range reported by Olsson and Salmèn [200], 395 kJ/mol value reported by Salmèn [199], 299 to 341 kJ/mol range reported by Placet et al. [205], and 339 kJ/mol value reported by Kelley et al. [208]. Although calculating an activation energy does not conclusively determine whether or not a thermal transition is a glass transition, these reported activation energies are overall consistent with the activation energy associated with a polymer glass transition [198].
For comparison, the reported moisture dependence of glass transition temperatures in various types of extracted lignins are plotted in Figure 9. It should be noted that the MC values in Figure 8 and Figure 9 are for bulk wood and lignin, respectively, so trends with respect to MC cannot be directly compared. Goring reported some of the earliest work studying the effects of moisture on the wood polymers glass transitions [210]. Goring developed a powder collapse method in which powder is compressed under constant load by a plunger during which negligible amounts of water evaporate. The plunger displacement is measured during constant rate heating. As the powder softens, the plunger displacement accelerates and then decelerates as the powder is compressed into a solid plug. The softening temperature is defined at the temperature in which the plunger reaches its peak velocity. The method worked well for fully amorphous materials when the softening occurred below 200 °C. At higher temperatures, thermal degradation of the powders was observed by both weight loss measurements and visually as the material darkened. The softening temperatures in the perodiate lignin is included in Figure 9. Sakata and Senju used a similar flow test to assess the effects of moisture on dioxane lignin and thiolignin softening temperatures [211]. Takamura also assessed the effects of moisture on lignin softening by observing the temperatures at which sample plugs shrank and became discolored [212]. The remaining data plotted in Figure 9 are DSC results from Irvine for a Eucalyptus (Eucalyptus regnan) milled wood lignin [206] and Hatakeyama and Hatakeyama for dioxane lignin and methylated dioxane lignin [213].
Collectively, neither the reported glass transitions of in situ lignin nor extracted lignins fall below room temperature. Therefore, lignin is expected to be in its glassy state in wood under ambient conditions. Both in situ and extracted lignin also follow the expected trends of increasing glass transition temperatures with decreasing MC. Additionally, the in situ lignin glass transitions were observed irrespective of wood species, and in mechanical experiments irrespective of wood orientation. It should also be noted that the dry lignin glass transition is difficult to assess because the high glass transition temperatures correspond to temperatures at which substantial decomposition of the wood polymers also occurs [210,214]. Nevertheless Back and Salmèn [214] provide an estimate of 205 °C for dry native lignin.
7.2. Hemicelluloses and Amorphous Cellulose Glass Transitions
The in situ glass transitions of hemicelluloses have been reported in both DMA and DETA experiments. In contrast to the lignin glass transition, no substantial mechanical softening is observed in bulk wood as the hemicelluloses pass through their reported glass transitions. This observation suggests that in mechanical tests the stiffer lignin or cellulose microfibrils are likely masking the mechanical softening of the hemicelluloses. Therefore, measurements of stiffness or yielding properties are not suitable for observing the hemicelluloses glass transition. However, the thermal transition can be detected in the mechanical damping or dielectric loss tangent measurements in DMA or DETA experiments, respectively. Additionally, although the in situ hemicelluloses glass transition has been sought in DSC experiments, it has not been reliably observed, likely because DSC is not sensitive enough to detect the glass transition of the hemicelluloses in wood [206].
Reported thermal transitions attributed to the hemicelluloses glass transition are plotted in Figure 10 as a function of wood MC. In the five studies that reported DMA experiments, the wood was first conditioned under specific moisture conditions and then tested under dry conditions. In addition to lignin, Kelley et al. [208] and Stelte et al. [209] also reported hemicelluloses glass transitions. In 2001, Backman and Lindberg [215] used tensile mode DMA to study Scots pine (Pinus sylvestris) conditioned at 11% RH (3% MC) or 33% RH (6% MC) over a temperature range from −120 °C to 80 °C and at a frequency of 1 Hz. Although specimens were prepared such that the tensile force was applied in either the radial or tangential wood orientation, no obvious orientation effects were observed. In the 6% MC specimen, a peak in mechanical damping attributed to an in situ hemicelluloses glass transition was observed between 40 °C and 57 °C. Additionally, under both moisture conditions a peak in mechanical damping was observed near 0 °C that was attributed to lower molecular weight hemicelluloses. Jiang and Lu in 2008 [216] tested Chinese fir (Cunninghamia lanceolata) using DMA single cantilever bending experiments from −120 °C to 40 °C at 1 Hz. The long axis of their bending specimens was in the radial wood orientation, and their reported hemicelluloses glass transition temperatures were assessed at the peaks in loss modulus spectra. Also in 2018, Li et al. [217] used tensile mode DMA to measure viscoelastic properties of Chinese fir from −120 °C to 40 °C over a range of frequencies form 0.5 Hz to 10 Hz. Specimens were prepared with the tensile direction in one of the three primary wood orientations. Thermal transition temperatures were taken at the peaks of loss moduli spectra. Only the specimens oriented in radial and tangential directions exhibited a peak attributed to the hemicelluloses. By testing over a range of frequencies, Li et al. were also able to estimate activation energies for the hemicelluloses glass transition peak, which varied from 145 kJ/mol to 261 kJ/mol with increasing MC corresponding to lower activation energies.
Moisture loss is a concern with all of the results from the reported DMA experiments in the preceding paragraph. To address these concerns, Backman and Lindberg [215] tested for moisture loss and reported that up to 0 °C water loss was negligible. They did not report any water loss tests for higher temperatures. Both Jiang and Lu [216] and Li et al. [217] report that up to 40 °C in their experiments the MC changed less than 0.5%. The specimen cross-section and heating rate are the two most likely experimental parameters that will affect the specimen drying during the temperature scans. Considering the other three DMA studies in Figure 10 all used wood specimens with similar sizes and heating rates that were either the same or faster than Jiang and Lu [216] and Li et al. [217], it is reasonable to assume that the reported hemicelluloses glass transitions at or below 40 °C are not appreciably affected by the specimens drying during the experiments.
The remaining set of hemicelluloses glass transition temperatures plotted in Figure 10 are DETA results from Lenth and Kamke in 2001 [218]. Experiments were performed on yellow poplar (Liriodendron tulipifera) and loblolly pine (Pinus taeda) over a frequency range of 0.1 Hz to 100 kHz. Temperatures ranged from 25 °C to 225 °C for the dry specimens, and 25 °C to 95 °C for specimens with moisture. Moisture loss during the experiments was minimized by edge sealing the specimens. Mass loss for all of the moisture conditions measured was determined to be 4% or less. Glass transition temperatures were measured using peaks in the dielectric loss tangent. The reported values estimated at 1 Hz are plotted in Figure 10. Calculated activation energies ranged between 53 and 145 kJ/mol, with the general trend of decreasing activation energy with increasing MC.
All of the studies with data plotted in Figure 10 except for the Kelley et al. [208] data also either reported the RH conditions under which the specimens were conditioned or sorption isotherms from which the RH could be estimated. The hemicelluloses glass transition temperatures as a function of RH are plotted in Figure 11. By plotting as a function of RH, additional data can be included. Bag et al. in 2011 [219] used DETA to assess in situ hemicelluloses glass transition in woody hemp cores. Experiments were performed on specimens conditioned at 65% RH over a frequency range of 1 to 100 Hz and temperature range from approximately −20 °C to 120 °C. A special sample holder was used to minimize water evaporation and no variation in MC was detected during the temperature scans. The glass transition temperatures were determined from peaks in the dielectric loss tangent and are plotted in Figure 11 for their unmodified specimens. Bag et al. also calculated activation energies from 193 kJ/mol to 257 kJ/mol. Also included in Figure 11 are the data collected by Jakes in 2019 [32] at the cell wall level using nanoindentation-based DMA. Nanoindentation experiments were performed at ambient temperatures under RH conditions from 0% to 98%. A hemicellulose glass transition was observed in experiments performed on a longitudinal plane in the S2 and the CCML. The observed glass transitions estimated at 1 Hz are plotted in Figure 11.
A critique of all of the reported in situ hemicelluloses glass transitions in Figure 10 and Figure 11 is that they almost exclusively rely on the original identification of the thermal transition by Kelley et al. [208]. In addition to their DMA experiments, Kelley et al. also reported DSC results from ground Sitka spruce at 25% MC. An enthalpy relaxation peak was observed at about 60 °C, which was attributed to the lignin glass transition. A second transition was observed at −22 °C that the authors stated was characteristic of a glass transition and, therefore, was attributed to the hemicelluloses glass transition because its temperature was similar to the proposed hemicelluloses glass transition temperature observed in their DMA experiments. No DSC results were reported at other MC values, which would have at least provided some evidence that both the observed DSC and DMA thermal transitions attributed to hemicelluloses tracked together. It is possible that the sub-ambient −22 °C DSC transition could have been caused by water melting, as suggested in Miki et al. who observed a similar peak in DSC experiments on ground hinoki (Chamaecyparis obtusa) conditioned at 75% RH [220]. It is notable that Miki et al. also tested solid hinoki and no sub-ambient peak was observed in the solid wood conditioned at 75% MC. This further suggests that the DSC transition reported by Kelley et al. may have been an artifact caused by using ground wood in their DSC experiments and is not related to a wood polymer glass transition. Consequentially, it is uncertain whether or not the reported thermal transitions in Figure 10 and Figure 11 are actually hemicelluloses glass transitions.
Further complicating the hemicelluloses glass transition question are DMA experiments performed over temperature and moisture conditions in which the expected hemicelluloses glass transition is not observed. As previously mentioned, Li et al. [217] observed hemicelluloses glass transitions when their specimens were oriented such that the tensile stresses were being applied in in radial and tangential wood orientations, but not the longitudinal orientation. Jakes [32] also performed nanoindentation in the transverse plane of the S2 in which the loads are applied parallel to the cellulose fibrils, but no thermal transition was observed in that orientation. Zhan et al. in 2019 [221] used three-point bending DMA experiments to measure viscoelastic properties of Chinese fir. The long axis of the bending specimens was in the longitudinal wood orientation. Frequency sweeps from 1 Hz to 100 Hz were performed under constant temperature and RH conditions. The temperatures ranged from 30 °C to 80 °C and the RH from 0% to 85%. Based on the reported data in Figure 10 and Figure 11, peaks in the mechanical damping spectra from the frequency sweeps would have been expected at the higher values of RH. However, no peaks in their mechanical damping spectra were observed, indicating no thermal transitions.
Insights into whether or not a hemicelluloses glass transition is observed in a mechanical experiment can be gained from the work of Salmèn and Olsson [86]. They reported DMA experiments in tension on strips of paper made from thermomechanical pulp (TMP) fibers. Humidity scans were performed from 40% to 95% RH at 80 °C. A xylan-impregnated glass fiber braid was also tested under similar conditions to determine the xylan glass transition. Glass transitions were identified visually as a substantial decrease in the storage modulus during the RH scan. In the reference TMP paper, no xylan glass transition was detected. However, when delignified TMP paper was tested, xylan thermal softening could be detected. Furthermore, when the xylan was also removed from the delignified TMP paper, the softening associated with the xylan ceased as expected. As a final step, the delignified TMP paper with both xylan and glucomannan removed was tested and behaved similar to the delignified paper with only xylan removed, which indicated that glucomannan was not contributing to the observed softening in these experiments. Salmèn and Olsson [86] concluded that in their experiments on the control TMP paper, the stiffer lignin component was masking the softening of the hemicelluloses.
When all DMA experiments in this section are examined collectively, it can be discerned that when the applied stress in a mechanical test is applied parallel to the wood’s longitudinal orientation (e.g., when the long axis of a beam tested in bending or tension is in the longitudinal wood orientation, or paper tested in tension), then the hemicelluloses softening is not observed. In this orientation, the stiffer glassy lignin or cellulose microfibrils are likely masking the hemicelluloses softening. In contrast, when the applied stress is applied perpendicular to the wood longitudinal axis (e.g., when the long axis of a beam tested in tension or bending is in the radial or tangential orientation), the thermal transition attributed to a hemicelluloses glass transition can be detected in the mechanical damping.
To address whether or not the thermal transitions reported in Figure 10 and Figure 11 are actually hemicelluloses glass transitions, first we will first discuss whether or not the thermal transitions are likely glass transitions. Then, we will discuss whether or not the thermal transition can be linked to the hemicelluloses.
The following arguments support that the observed thermal transition is a glass transition:
- The activation energies reported for the thermal transition are generally consistent with a glass transition. Reported ranges of values include 145 kJ/mol to 261 kJ/mol from Li et al. [217], 53 to 145 kJ/mol from Lenth and Kamke [218], and 193 kJ/mol to 257 kJ/mol from Bag et al. [219]. Although the values reported by Lenth and Kamke are at or below those for synthetic polymers with similar glass transition temperatures [198], the other two reported ranges are well within the expected range. Additionally, both Li et al. [217] and Lenth and Kamke [218] reported that activation energies decrease with increasing moisture, which is consistent with a water plasticization effect on a glass transition.
- The thermal transition is very unlikely to arise from small-scale side-chain molecular motions of the lignin. As previously mentioned, poly (methyl methacrylate) and polystyrene, whose glass transition temperatures are 105 °C and 100 °C, respectively, have thermal transitions arising from small-scale side-chain molecular motions that occur at 40 °C in polystyrene and 45 °C in poly (methyl methacrylate). Furthermore, these small-scale molecular motions in poly (methyl methacrylate) and polystyrene have activation energies of 146 kJ/mol and 88 kJ/mol, respectively [198], which are not largely dissimilar from those reported for the hemicelluloses glass transition. Based on a comparison of lignin to poly (methyl methacrylate) and polystyrene, it is conceivable that the reported hemicelluloses glass transition are actually thermal transitions caused by small-scale motions in lignin. However, the lignin glass transition observed in mechanical experiments is observed irrespective of the wood orientation, whereas the reported hemicelluloses glass transition is only observed when the stress is applied perpendicular to the longitudinal wood orientation. This orientation effect would be very unlikely if the reported hemicelluloses glass transitions were actually arising from the lignin.
- A direct link between the thermal transition and ionic conductivity supports that the thermal transition is a glass transition. As a function of RH at room temperature, Jakes used nanoindentation-based DMA to measure the time-dependence of the thermal transition in the S2 and CCML [32]. The time-dependence of the thermal transitions was found to be directly proportional to ionic conductivities measured made by Zelinka et al. [166] in the S2 and CCML under similar RH conditions. Over the moisture conditions studied, ionic conductivity in wood is most likely controlled by the diffusion of inorganic ions [163,222,223]. This direct relationship between the thermal transition and ionic conductivity indicates that the inorganic ion diffusion is causally linked to the polymer segmental motion causing the thermal transition [34,37,224,225]. Finally, because inorganic ion diffusion only appreciably occurs in polymers in their rubbery states [33,34,35] and the diffusion is strongly coupled to cooperative motions in the rubbery polymer [36,37,38], the thermal transition is most likely a glass transition.
Now that we have established the thermal transition is most likely a glass transition, the following arguments support that the glass transition is likely arising from the amorphous polysaccharides, which includes the hemicelluloses:
- By a process of elimination, the glass transition is most likely arising from the amorphous polysaccharides. The two predominate types of amorphous polymers in wood are lignin and amorphous polysaccharides, which includes amorphous cellulose and hemicelluloses. Amorphous polymers only have one glass transition. Because above about 15% wood MC the reported lignin glass transitions (Figure 8) occur at higher temperatures and are distinguishable from hemicelluloses glass transitions (Figure 10), the reported hemicelluloses glass transition are most likely from the amorphous polysaccharides.
- The effects of wood orientation on whether or not the hemicelluloses glass transition is observed in mechanical experiments is consistent with orientation effects observed in the mechanical properties of wood at low MC. In lignin, a small increase in elastic modulus with increasing MC is observed with a peak value at a few percent MC. This behavior has been observed in both computer simulations [135] and experiments on extracted lignin [136]. In wood, a similar peak in elastic modulus at low MC is observed when stresses are applied in the direction parallel to the wood longitudinal orientation, such as in nanoindentation measurements made on a transverse plane in the S2 [135] or elastic modulus measured parallel to the grain in bulk wood [226]. In contrast, the elastic modulus of hemicelluloses continually decrease with increasing MC in both simulations [135] and experiments on extracted hemicelluloses [227]. In wood, a similar continual decreases in elastic modulus at low MC is observed when stresses are applied in the direction perpendicular to the cellulose microfibrils, such as in nanoindentation measurements made on a longitudinal plane of the S2 [135] or elastic modulus measured perpendicular the grain in bulk wood [226]. This indicates that when stress is being applied parallel to the longitudinal wood orientation, the lignin has a larger mechanical effect than the hemicelluloses. Conversely, when stress is applied perpendicular to the longitudinal orientation, the hemicelluloses are having a larger effect than lignin. These relationship are consistent with the wood orientations in which the hemicelluloses glass transitions can be observed in the DMA experiments described earlier in this section.
- Between lignin and amorphous polysaccharides, the extracted amorphous polysaccharides behave more similarly than the extracted lignin to the reported in situ hemicelluloses thermal transitions shown in Figure 10 and Figure 11. As already shown, extracted lignin (Figure 9) has similar glass transition temperatures and dependence on moisture as in situ lignin glass transitions (Figure 8). Reported glass transitions for extracted hemicelluloses and amorphous cellulose are shown in Figure 12 as a function of RH. By plotting as a function of RH, these data can be more directly compared to the in situ hemicelluloses glass transitions in Figure 11, which are also plotted as a function of RH. In addition to lignin, Takamura also assessed effects of moisture on hemicelluloses softening [212]. Olsson and Salmèn in 2003 [228] used DMA to test xylan- or glucomannan-impregnated glass fiber braids in tension over frequencies from 0.04 Hz to 20 Hz. Humidity scans were performed from 1% to 90% RH at temperatures from 30 °C to 80 °C. The glass transitions were defined as the onset of the decrease in storage modulus spectra. Glass transition temperatures at 1 Hz are plotted in Figure 12. Paes et al. in 2010 [229] utilized a DMA pocket technique to measure the glass transition in ball milled eucalyptus pulp, which was attributed to the amorphous cellulose. The DMA experiments were performed at 10 Hz and glass transition temperatures defined at the peak in mechanical damping. The final datum in Figure 12 is calculated from the data of Cousins [227]. As suggested by Back and Salmén [214], a hemicelluloses glass transition can be estimated from Cousin’s mechanical measurements to occur at approximately 30% MC at 20 °C, which corresponds to approximately 87% RH. It is observed that the glass transition temperatures do fall below room temperature at high RH, similar to the glass transition temperatures reported for in situ hemicelluloses (Figure 11). In contrast, the extracted lignin glass transition temperatures never fall below room temperature.
Based on the above data and discussion we conclude that in situ amorphous polysaccharides likely undergo glass transitions, and the majority, if not all, of the reported hemicelluloses glass transitions in Figure 10 and Figure 11 are arising from the in situ amorphous polysaccharides glass transitions. We cannot be certain which polysaccharides (e.g., amorphous cellulose, xylan, or glucomannan) are responsible for the reported hemicelluloses thermal transitions, or if the different types of polysaccharides have similar or distinct in situ glass transitions. It is also possible that not all of the reported hemicelluloses glass transitions are actually arising from amorphous polysaccharides glass transitions. For instance, the reported hemicelluloses glass transitions from Li et al. [217] are questionable because they show very little of the expected moisture dependence clearly observed in other studies. More detailed work is needed to conclusively link reported hemicelluloses glass transitions to specific amorphous polysaccharides. See Section 6.2 for our suggested future work.
The above data collectively indicate that at room temperature, the in situ amorphous polysaccharides undergo a glass transition when wood is conditioned between 10% and 15% MC, which corresponds to 60% to 85% RH conditions. Similar to the lignin, the amorphous polysaccharides glass transition temperatures are affected by moisture and increase as the amount of moisture decreases. Under dry conditions, the amorphous polysaccharides glass transitions are difficult to assess because the temperature correspond to degradation temperatures. Nevertheless, Back and Salmèn [214] report glass transition estimates of 220 °C and 180 °C for dry amorphous cellulose and dry native hemicelluloses, respectively.
Author Contributions
J.E.J. outlined the paper and wrote the paper with substantial contributions from C.G.H., S.L.Z., P.N.C., and N.Z.P.
Funding
PNC acknowledges support from the Bioenergy Technology Office of the U.S. Department of Energy.
Conflicts of Interest
The authors declare no conflict of interest. The funders had no role in the design of the study; in the collection, analyses, or interpretation of data; in the writing of the manuscript; or in the decision to publish the results.
References
- Ragauskas, A.J.; Williams, C.K.; Davison, B.H.; Britovsek, G.; Cairney, J.; Eckert, C.A.; Frederick, W.J., Jr.; Hallett, J.P.; Leak, D.J.; Liotta, C.L.; et al. The path forward for biofuels. Science 2006, 311, 484–489. [Google Scholar] [CrossRef]
- Bergman, R.; Puettmann, M.; Taylor, A.; Skog, K.E. The carbon impacts of wood products. For. Prod. J. 2014, 64, 220–231. [Google Scholar] [CrossRef]
- Jakes, J.E.; Arzola, X.; Bergman, R.; Ciesielski, P.; Hunt, C.G.; Rahbar, N.; Tshabalala, M.; Wiedenhoeft, A.C.; Zelinka, S.L. Not just lumber—Using wood in the sustainable future of materials, chemicals, and fuels. JOM 2016, 68, 2395–2404. [Google Scholar] [CrossRef]
- Bergman, R. Drying and Control of Moisture Content and Dimensional Changes. In Forest Products Laboratory. Wood Handbook-Wood as an Engineering Material; USDA: Washington, DC, USA, 2010; p. 20. [Google Scholar]
- Hunt, C.G.; Frihart, C.R.; Dunky, M.; Rohumaa, A. Understanding Wood Bonds–Going Beyond What Meets the Eye: A Critical Review. Rev. Adhes. Adhes. 2018, 6, 369–440. [Google Scholar] [CrossRef]
- Kamke, F.A.; Lee, J.N. Adhesive penetration in wood-A review. Wood Fiber Sci. 2007, 39, 205–220. [Google Scholar]
- Wei, H.; Donohoe, B.S.; Vinzant, T.B.; Ciesielski, P.N.; Wang, W.; Gedvilas, L.M.; Zeng, Y.; Johnson, D.K.; Ding, S.-Y.; Himmel, M.E.; et al. Elucidating the role of ferrous ion cocatalyst in enhancing dilute acid pretreatment of lignocellulosic biomass. Biotechnol. Biofuels 2011, 4, 48. [Google Scholar] [CrossRef]
- Lebow, S.T. Wood preservation. In Wood Handbook: Wood as An Engineering Material. GTR-190; USDA: Washington, DC, USA, 2010; pp. 1–28. [Google Scholar]
- Goodell, B.; Jellison, J.; Liu, J.; Daniel, G.; Paszczynski, A.; Fekete, F.; Krishnamurthy, S.; Jun, L.; Xu, G. Low molecular weight chelators and phenolic compounds isolated from wood decay fungi and their role in the fungal biodegradation of wood. J. Biotechnol. 1997, 53, 133–162. [Google Scholar] [CrossRef]
- Arantes, V.; Jellison, J.; Goodell, B. Peculiarities of brown-rot fungi and biochemical Fenton reaction with regard to their potential as a model for bioprocessing biomass. Appl. Microbiol. Biotechnol. 2012, 94, 323–338. [Google Scholar] [CrossRef]
- Ringman, R.; Pilgård, A.; Brischke, C.; Richter, K. Mode of action of brown rot decay resistance in modified wood: A review. Holzforschung 2014, 68, 239–246. [Google Scholar] [CrossRef]
- Kerem, Z.; Jensen, K.A.; Hammel, K.E. Biodegradative mechanism of the brown rot basidiomycete Gloeophyllum trabeum: Evidence for an extracellular hydroquinone-driven fenton reaction. FEBS Lett. 1999, 446, 49–54. [Google Scholar] [CrossRef]
- Ringman, R.; Beck, G.; Pilgård, A. The Importance of Moisture for Brown Rot Degradation of Modified Wood: A Critical Discussion. Forests 2019, 10, 522. [Google Scholar] [CrossRef]
- Baker, A. Corrosion of metals in preservative-treated wood. In Proceedings of the Wood Protection Techniques and the Use of Treated Wood in Construction, Memphis, TN, USA, 28–30 October 1987; Hamel, M., Ed.; Forest Products Research Society: Madison, WI, USA, 1988; pp. 99–101. [Google Scholar]
- Zelinka, S.L.; Stone, D.S. Corrosion of metals in wood: Comparing the results of a rapid test method with long-term exposure tests across six wood treatments. Corros. Sci. 2011, 53, 1708–1714. [Google Scholar] [CrossRef]
- Zelinka, S.L. Corrosion of Metals in Wood Products. In Developments in Corrosion Protection; Aliofkhazraei, M., Ed.; INTECH: Kowloon, Hongkong, 2014; pp. 567–592. ISBN 9789535112235. [Google Scholar]
- Hill, C. Wood Modification: Chemical, Thermal and Other Processes; Stevens, C.V., Ed.; Wiley: Hoboken, NJ, USA, 2006. [Google Scholar]
- Frihart, C.R. Adhesive groups and how they relate to the durability of bonded wood. J. Adhes. Sci. Technol. 2009, 23, 611–627. [Google Scholar] [CrossRef]
- Arantes, V.; Goodell, B. Current understanding of brown-rot fungal biodegradation mechanisms: A review. ACS Symp. Ser. 2014, 1158, 3–21. [Google Scholar]
- Zelinka, S.L.; Ringman, R.; Pilgård, A.; Thybring, E.E.; Jakes, J.E.; Richter, K. The role of chemical transport in the brown-rot decay resistance of modified wood. Int. Wood Prod. J. 2016, 7, 66–70. [Google Scholar] [CrossRef]
- Ciesielski, P.N.; Pecha, M.B.; Bharadwaj, V.S.; Mukarakate, C.; Leong, G.J.; Kappes, B.; Crowley, M.F.; Kim, S.; Foust, T.D.; Nimlos, M.R. Advancing catalytic fast pyrolysis through integrated multiscale modeling and experimentation: Challenges, progress, and perspectives. Wiley Interdiscip. Rev. Energy Environ. 2018, 7, e297. [Google Scholar] [CrossRef]
- Eitelberger, J.; Hofstetter, K. Prediction of transport properties of wood below the fiber saturation point–A multiscale homogenization approach and its experimental validation: Part I: Thermal conductivity. Compos. Sci. Technol. 2011, 71, 134–144. [Google Scholar] [CrossRef]
- Stone, J.; Scallan, A. A structural model for the cell wall of water-swollen wood pulp fibres based on their accessibility to macromolecules. Cellul. Chem. Technol. 1968, 2, 343–358. [Google Scholar]
- Murphy, E.; Walker, A. Electrical Conduction in Textiles. I The Dependence of the Resistivity of Cotton, Silk and Wool on Relative Humidity and Moisture Content. J. Phys. Chem. 1928, 32, 1761–1786. [Google Scholar] [CrossRef]
- O’Sullivan, J.B. The Conduction of Electricity Through Cellulose: Part V. The Effect of Temperature. J. Text. Inst. Trans. 1948, 39, T368–T384. [Google Scholar] [CrossRef]
- Brown, J.; Davidson, R.; Skaar, C.; Skaar, C. Mechanism of electrical conduction in wood. For. Prod. J. 1963, 13, 455–459. [Google Scholar]
- Zelinka, S.L.; Glass, S.V.; Stone, D.S. A percolation model for electrical conduction in wood with implications for wood-water relations. Wood Fiber Sci. 2008, 40, 544–552. [Google Scholar]
- Thygesen, L.G.; Elder, T. Moisture in untreated, acetylated, and furfurylated Norway Spruce monitored during drying below fiber saturation using time domain NMR. Wood Fiber Sci. 2009, 41, 194–200. [Google Scholar]
- Nakamura, K.; Hatakeyama, T.; Hatakeyama, H. Studies on Bound Water of Cellulose by Differential Scanning Calorimetry. Text. Res. J. 1981, 51, 607–613. [Google Scholar] [CrossRef]
- Zelinka, S.; Lambrecht, M.; Glass, S.; Wiedenhoeft, A.; Yelle, D. Examination of water phase transitions in Loblolly pine and cell wall components by differential scanning calorimetry. Thermochim. Acta 2012, 533, 39–45. [Google Scholar] [CrossRef]
- Jakes, J.E.; Plaza, N.; Stone, D.S.; Hunt, C.G.; Glass, S.V.; Zelinka, S.L. Mechanism of Transport Through Wood Cell Wall Polymers. J. For. Prod. Ind. 2013, 2, 10–13. [Google Scholar]
- Jakes, J.E. Mechanism for Diffusion through Secondary Cell Walls in Lignocellulosic Biomass. J. Phys. Chem. B 2019, 123, 9b01430. [Google Scholar] [CrossRef]
- Armand, M. Polymers with Ionic Conductivity. Adv. Mater. 1990, 2, 278–286. [Google Scholar] [CrossRef]
- Angell, C.A. Mobile Ions in Amorphous Solids. Annu. Rev. Phys. Chem. 1992, 43, 693–717. [Google Scholar] [CrossRef]
- Saito, S.; Sasabe, H.; Nakajima, T.; Yada, K. Dielectric relaxation and electrical conduction of polymers as a function of pressure and temperature. J. Polym. Sci. Part A 2 Polym. Phys. 1968, 6, 1297–1315. [Google Scholar] [CrossRef]
- Ferry, J. Viscoelastic Properties of Polymers, 3rd ed.; John Wiley & Sons Inc.: Hoboken, NJ, USA, 1980. [Google Scholar]
- Killis, A.; Le Nest, J.F.; Gandini, A.; Cheradame, H.; Cohen-Addad, J.P. Correlation among transport properties in ionically conducting cross-linked networks. Solid State Ion. 1984, 14, 231–237. [Google Scholar] [CrossRef]
- Kumins, C.A.; Kwei, T.K. Free Volume and Other Theories. In Diffusion in Polymers; Crank, J., Park, G.S., Eds.; Academic Press: Cambridge, MA, USA, 1968; pp. 107–140. [Google Scholar]
- Jenkins, A.D.; Stepto, R.F.T.; Kratochvíl, P.; Suter, U.W. Glossary of basic terms in polymer science (IUPAC Recommendations 1996). Pure Appl. Chem. 1996, 68, 2287–2311. [Google Scholar] [CrossRef]
- Rowell, R.M.; Petterson, R.; Tshabalala, M.A. Cell Wall Chemistry. In Handbook of Wood Chemistry and Wood Composites; Rowell, R.M., Ed.; CRC Press: Boca Raton, FL, USA, 2013; pp. 33–72. [Google Scholar]
- Brazel, C.S.; Rosen, S.L.; Rosen, S.L. Fundamental Principles of Polymeric Materials, 3rd ed.; John Wiley & Sons: Hoboken, MA, USA, 2012; ISBN 9780470505427. [Google Scholar]
- Lakes, R.S. Viscoelastic Materials; Cambridge University Press: Cambridge, UK, 2009. [Google Scholar]
- Fernandes, A.N.; Thomas, L.H.; Altaner, C.M.; Callow, P.; Forsyth, V.T.; Apperley, D.C.; Kennedy, C.J.; Jarvis, M.C. Nanostructure of cellulose microfibrils in spruce wood. Proc. Natl. Acad. Sci. USA 2011, 108, E1195–E1203. [Google Scholar] [CrossRef] [PubMed]
- Kulasinski, K.; Guyer, R. Water adsorption in wood microfibril-hemicellulose system: Role of the crystalline–amorphous interface. Biomacromolecules 2015, 16, 2972–2978. [Google Scholar] [CrossRef] [PubMed]
- Apicella, A.; Tessieri, R.; de Cataldis, C. Sorption modes of water in glassy epoxies. J. Memb. Sci. 1984, 18, 211–225. [Google Scholar] [CrossRef]
- Frisch, H.L. Sorption and transport in glassy polymers-a review. Polym. Eng. Sci. 1980, 20, 2–13. [Google Scholar] [CrossRef]
- Starkweather, H.W. Some Aspects of Water Clusters in Polymers. Macromolecules 1975, 8, 476–479. [Google Scholar] [CrossRef]
- Mansfield, P.; Bowtell, R.; Blackband, S. Ingress of water into solid nylon 6.6. J. Magn. Reson. 1992, 99, 507–524. [Google Scholar] [CrossRef]
- Olsson, A.-M.; Salmén, L. The association of water to cellulose and hemicellulose in paper examined by FTIR spectroscopy. Carbohydr. Res. 2004, 339, 813–818. [Google Scholar] [CrossRef]
- Hodge, R.M.; Bastow, T.J.; Edward, G.H.; Simon, G.P.; Hill, A.J. Free volume and the mechanism of plasticization in water-swollen poly(vinyl alcohol). Macromolecules 1996, 29, 8137–8143. [Google Scholar] [CrossRef]
- Preda, F.-M.; Alegría, A.; Bocahut, A.; Fillot, L.-A.; Long, D.R.; Sotta, P. Investigation of Water Diffusion Mechanisms in Relation to Polymer Relaxations in Polyamides. Macromolecules 2015, 48, 5730–5741. [Google Scholar] [CrossRef] [Green Version]
- Alfrey, T.; Gurnee, E.F.; Lloyd, W.G. Diffusion in glassy polymers. J. Polym. Sci. Part C Polym. Symp. 1966, 12, 249–261. [Google Scholar] [CrossRef]
- Brostow, W.; Chiu, R.; Kalogeras, I.M.; Vassilikou-Dova, A. Prediction of glass transition temperatures: Binary blends and copolymers. Mater. Lett. 2008, 62, 3152–3155. [Google Scholar] [CrossRef]
- Jordan, J.; Jacob, K.I.; Tannenbaum, R.; Sharaf, M.A.; Jasiuk, I. Experimental trends in polymer nanocomposites—A review. Mater. Sci. Eng. A 2005, 393, 1–11. [Google Scholar] [CrossRef]
- Alcoutlabi, M.; McKenna, G.B. Effects of confinement on material behaviour at the nanometre size scale. J. Phys. Condens. Matter 2005, 17, R461–R524. [Google Scholar] [CrossRef]
- Crank, J. The Mathmatics of Diffusion, 2nd ed.; Oxford University Press: Oxford, UK, 1975. [Google Scholar]
- Cussler, E.L. Diffusion: Mass Transfer in Fluid Systems, 3rd ed.; Cambridge University Press: Cambridge, UK, 2009. [Google Scholar]
- Cohen, M.H.; Turnbull, D. Molecular Transport in Liquids and Glasses. J. Chem. Phys. 1959, 31, 1164–1169. [Google Scholar] [CrossRef] [Green Version]
- Ratner, M.A.; Shriver, D.F. Ion transport in solvent-free polymers. Chem. Rev. 1988, 88, 109–124. [Google Scholar] [CrossRef]
- Frisch, H.L. Mechanisms for fickian diffusion of penetrants in polymers. J. Polym. Sci. Part B Polym. Lett. 1965, 3, 13–16. [Google Scholar] [CrossRef]
- George, S.C.; Thomas, S. Transport phenomena through polymeric systems. Prog. Polym. Sci. 2001, 26, 985–1017. [Google Scholar] [CrossRef]
- Hansen, C.M.; Bjorkman, A. Ultrastructure of wood from a solubility parameter point of view. Holzforschung 1998, 52, 335–344. [Google Scholar] [CrossRef]
- Barton, A.F.M. Solubility parameters. Chem. Rev. 1975, 75, 731–753. [Google Scholar] [CrossRef]
- Ganji, F.; Vasheghani-Farahani, S.; Vasheghani-Farahani, E. Theoretical Description of Hydrogel Swelling: A Review. Iran. Polym. J. 2010, 19, 375–398. [Google Scholar]
- Brannon-Peppas, L.; Peppas, N.A. Equilibrium swelling behavior of pH-sensitive hydrogels. Chem. Eng. Sci. 1991, 46, 715–722. [Google Scholar] [CrossRef]
- Barkas, W.W. Wood water relationships—VII. Swelling pressure and sorption hysteresis in gels. Trans. Faraday Soc. 1942, 38, 194–209. [Google Scholar] [CrossRef]
- Flory, P.J.; Rehner, J. Statistical Mechanics of Cross-Linked Polymer Networks II. Swelling. J. Chem. Phys. 1943, 11, 521–526. [Google Scholar] [CrossRef]
- Derrien, K.; Gilormini, P. The effect of moisture-induced swelling on the absorption capacity of transversely isotropic elastic polymer–matrix composites. Int. J. Solids Struct. 2009, 46, 1547–1553. [Google Scholar] [CrossRef] [Green Version]
- Fujita, H. Organic Vapors above the Glass Transition Temperature. In Diffusion in Polymers; Crank, J., Park, G.S., Eds.; Academic Press: Cambridge, MA, USA, 1968; pp. 75–105. [Google Scholar]
- Masaro, L.; Zhu, X. Physical models of diffusion for polymer solutions, gels and solids. Prog. Polym. Sci. 1999, 24, 731–775. [Google Scholar] [CrossRef]
- Potreck, J.; Uyar, F.; Sijbesma, H.; Nijmeijer, K.; Stamatialis, D.; Wessling, M. Sorption induced relaxations during water diffusion in S-PEEK. Phys. Chem. Chem. Phys. 2009, 11, 298–308. [Google Scholar] [CrossRef]
- Vrentas, J.S.; Jarzebski, C.M.; Duda, J.L. A Deborah number for diffusion in polymer-solvent systems. AIChE J. 1975, 21, 894–901. [Google Scholar] [CrossRef]
- Vrentas, J.S.; Duda, J.L. Diffusion in polymer–solvent systems. III. Construction of Deborah number diagrams. J. Polym. Sci. Polym. Phys. Ed. 1977, 15, 441–453. [Google Scholar] [CrossRef]
- Park, G.S. The glassy state and slow process anomalies. In Diffusion in Polymers1; Crank, J., Park, G.S., Eds.; Academic Press: Cambridge, MA, USA, 1968; pp. 141–163. [Google Scholar]
- Wiedenhoeft, A.C. Structure and Function of Wood. In Handbook of Wood Chemistry and Wood Composites; Rowell, R.M., Ed.; CRC Press: Boca Raton, FL, USA, 2013; pp. 9–32. [Google Scholar]
- Terashima, N.; Yoshida, M.; Hafrén, J.; Fukushima, K.; Westermark, U. Proposed supramolecular structure of lignin in softwood tracheid compound middle lamella regions. Holzforschung 2012, 66, 907–915. [Google Scholar] [CrossRef]
- Salmen, L.; Olsson, A.-M.; Stevanic, J.; Simonović, J.; Radotić, K. Structural Organisation of the Wood Polymers in the Wood Fibre Structure. BioResources 2012, 7, 0521–0532. [Google Scholar]
- Atalla, R.H.; Agarwal, U.P. Raman microprobe evidence for lignin orientation in the cell walls of native woody tissue. Science 1985, 227, 636–638. [Google Scholar] [CrossRef] [PubMed]
- Akerholm, M.; Salmen, L. The Oriented Structure of Lignin and its Viscoelastic Properties Studied by Static and Dynamic FT-IR Spectroscopy. Holzforschung 2003, 57, 459–465. [Google Scholar] [CrossRef]
- Stevanic, J.S.; Salmén, L. Orientation of the wood polymers in the cell wall of spruce wood fibres. Holzforschung 2009, 63, 497–503. [Google Scholar] [CrossRef]
- Åkerholm, M.; Salmén, L. Interactions between wood polymers studied by dynamic FT-IR spectroscopy. Polymer 2001, 42, 963–969. [Google Scholar] [CrossRef]
- Salmen, L.; Burgert, I. Cell wall features with regard to mechanical performance. A review. COST Action E35 2004-2008: Wood machining-Micromechanics and fracture. Holzforschung 2009, 63, 121–129. [Google Scholar] [CrossRef]
- Hafren, J.; Fujino, T.; Itoh, T.; Westermark, U.; Terashima, N. Ultrastructural changes in the compound middle lamella of Pinus thunbergii during lignification and lignin removal. Holzforschung 2000, 54, 234–240. [Google Scholar] [CrossRef]
- Salmén, L. Wood morphology and properties from molecular perspectives. Ann. For. Sci. 2015, 72, 679–684. [Google Scholar] [CrossRef] [Green Version]
- Salmén, L. Micromechanical understanding of the cell-wall structure. Comptes Rendus Biol. 2004, 327, 873–880. [Google Scholar] [CrossRef]
- Salmen, L.; Olsson, A.-M. Interaction between hemicelluloses, lignin and cellulose: Structure-property relationships. J. Pulp Pap. Sci. 1998, 24, 99–103. [Google Scholar]
- Vermaas, J.V.; Petridis, L.; Qi, X.; Schulz, R.; Lindner, B.; Smith, J.C. Mechanism of lignin inhibition of enzymatic biomass deconstruction. Biotechnol. Biofuels 2015, 8, 217. [Google Scholar] [CrossRef] [PubMed] [Green Version]
- Yuan, T.-Q.; Sun, S.-N.; Xu, F.; Sun, R.-C. Characterization of Lignin Structures and Lignin–Carbohydrate Complex (LCC) Linkages by Quantitative 13 C and 2D HSQC NMR Spectroscopy. J. Agric. Food Chem. 2011, 59, 10604–10614. [Google Scholar] [CrossRef]
- Balakshin, M.; Capanema, E.; Gracz, H.; Chang, H.; Jameel, H. Quantification of lignin–carbohydrate linkages with high-resolution NMR spectroscopy. Planta 2011, 233, 1097–1110. [Google Scholar] [CrossRef]
- Jakob, H.F.; Fengel, D.; Tschegg, S.E.; Fratzl, P. The elementary cellulose fibril in Picea abies: Comparison of transmission electron microscopy, small-angle X-ray scattering, and wide-angle X-ray scattering results. Macromolecules 1995, 28, 8782–8787. [Google Scholar] [CrossRef]
- Terashima, N.; Kitano, K.; Kojima, M.; Yoshida, M.; Yamamoto, H.; Westermark, U. Nanostructural assembly of cellulose, hemicellulose, and lignin in the middle layer of secondary wall of ginkgo tracheid. J. Wood Sci. 2009, 55, 409–416. [Google Scholar] [CrossRef]
- Donaldson, L.A.; Knox, J.P. Localization of Cell Wall Polysaccharides in Normal and Compression Wood of Radiata Pine: Relationships with Lignification and Microfibril Orientation. Plant Physiol. 2012, 158, 642–653. [Google Scholar] [CrossRef] [PubMed] [Green Version]
- Wierzbicki, M.P.; Maloney, V.; Mizrachi, E.; Myburg, A.A. Xylan in the Middle: Understanding Xylan Biosynthesis and Its Metabolic Dependencies Toward Improving Wood Fiber for Industrial Processing. Front. Plant Sci. 2019, 10, 176. [Google Scholar] [CrossRef] [Green Version]
- Toba, K.; Yamamoto, H.; Yoshida, M. Crystallization of cellulose microfibrils in wood cell wall by repeated dry-and-wet treatment, using X-ray diffraction technique. Cellulose 2013, 20, 633–643. [Google Scholar] [CrossRef]
- Glass, S.; Zelinka, S. Moisture relations and physical properties of wood. In Wood Handbook: Wood As An Engineering Material. GTR-190; USDA: Washington, DC, USA, 2010; pp. 1–19. [Google Scholar]
- Skaar, C. Wood-Water Relations; Springer: Berlin/Heidelberg, Germany, 1988. [Google Scholar]
- Hoffmeyer, P.; Engelund, E.T.; Thygesen, L.G. Equilibrium moisture content (EMC) in Norway spruce during the first and second desorptions. Holzforschung 2011, 65, 875–882. [Google Scholar] [CrossRef]
- Fredriksson, M.; Thybring, E.E. Scanning or desorption isotherms? Characterising sorption hysteresis of wood. Cellulose 2018, 25, 4477–4485. [Google Scholar] [CrossRef] [Green Version]
- Kelsey, K.E.; Clarke, L.N. The heat of sorption of water by wood. Austrialian J. Appl. Sci. 1956, 7, 160–175. [Google Scholar]
- Wadsö, I.; Wadsö, L. A new method for determination of vapour sorption isotherms using a twin double microcalorimeter. Thermochim. Acta 1996, 271, 179–187. [Google Scholar] [CrossRef]
- Simpson, W. Sorption theories applied to wood. Wood Fiber Sci. 1980, 12, 183–195. [Google Scholar]
- Le Maguer, M. Solution Thermodynamics and the Starch-Water System. In Properties of Water in Foods; Springer: Berlin/Heidelberg, Germany, 1985; pp. 133–151. [Google Scholar]
- Zelinka, S.L.; Glass, S.V.; Jakes, J.E.; Stone, D.S. A solution thermodynamics definition of the fiber saturation point and the derivation of a wood–water phase (state) diagram. Wood Sci. Technol. 2016, 50, 443–462. [Google Scholar] [CrossRef]
- Bertinetti, L.; Fischer, F.D.; Fratzl, P. Physicochemical Basis for Water-Actuated Movement and Stress Generation in Nonliving Plant Tissues. Phys. Rev. Lett. 2013, 111, 238001. [Google Scholar] [CrossRef]
- Barkas, W.W. Wood water relationships. VIII. Some elastic constants and swelling pressures of natural wood and of its gel material. Trans. Faraday Soc. 1942, 38, 447b–462. [Google Scholar] [CrossRef]
- Rowell, R.M. Moisture Properties. In Handbook of Wood Chemistry and Wood Composites; Rowell, R.M., Ed.; CRC Press: Boca Raton, FL, USA, 2013; pp. 75–97. [Google Scholar]
- Plaza, N.; Zelinka, S.L.; Stone, D.S.; Jakes, J.E. Plant-based torsional actuator with memory. Smart Mater. Struct. 2013, 22, 072001. [Google Scholar] [CrossRef]
- Jakes, J.E.; Plaza, N.; Zelinka, S.L.; Stone, D.S.; Gleber, S.-C.; Vogt, S. Wood as inspiration for new stimuli-responsive structures and materials. In Proceedings of the 2014 SPIE Smart Structures/NDE, San Diego, CA, USA, 9–13 March 2014; Lakhtakia, A., Ed.; SPIE: Bellingham, WA, USA, 2014. [Google Scholar]
- Zabler, S.; Paris, O.; Burgert, I.; Fratzl, P. Moisture changes in the plant cell wall force cellulose crystallites to deform. J. Struct. Biol. 2010, 171, 133–141. [Google Scholar] [CrossRef]
- Abe, K.; Yamamoto, H. Mechanical interaction between cellulose microfibril and matrix substance in wood cell wall determined by X-ray diffraction. J. Wood Sci. 2005, 51, 334–338. [Google Scholar] [CrossRef]
- Abe, K.; Yamamoto, H. Change in mechanical interaction between cellulose microfibril and matrix substance in wood cell wall induced by hygrothermal treatment. J. Wood Sci. 2006, 52, 107–110. [Google Scholar] [CrossRef]
- Moon, R.J.; Martini, A.; Nairn, J.; Simonsen, J.; Youngblood, J. Cellulose nanomaterials review: Structure, properties and nanocomposites. Chem. Soc. Rev. 2011, 40, 3941–3994. [Google Scholar] [CrossRef] [PubMed]
- Tarkow, H.; Turner, H.D. The swelling pressure of wood. For. Prod. J. 1958, 8, 193–197. [Google Scholar]
- Yu, Y.; Fei, B.; Wang, H.; Tian, G. Longitudinal mechanical properties of cell wall of Masson pine (Pinus massoniana Lamb) as related to moisture content: A nanoindentation study. Holzforschung 2010, 65, 121–126. [Google Scholar] [CrossRef]
- Plaza, N.Z.; Pingali, S.V.; Qian, S.; Heller, W.T.; Jakes, J.E. Informing the improvement of forest products durability using small angle neutron scattering. Cellulose 2016, 23, 1593–1607. [Google Scholar] [CrossRef]
- Joffre, T.; Isaksson, P.; Dumont, P.J.J.; Du Roscoat, S.R.; Sticko, S.; Orgéas, L.; Gamstedt, E.K. A Method to Measure Moisture Induced Swelling Properties of a Single Wood Cell. Exp. Mech. 2016, 56, 723–733. [Google Scholar] [CrossRef]
- Gillis, P.P.; Mark, R.E. Analysis of shrinkage, swelling and twisting of pulp fibers. Cellul. Chem. Technol. 1973, 7, 209–234. [Google Scholar]
- Neagu, R.; Gamstedt, E. Modelling of effects of ultrastructural morphology on the hygroelastic properties of wood fibres. J. Mater. Sci. 2007, 42, 10254–10274. [Google Scholar] [CrossRef]
- Patera, A.; Van den Bulcke, J.; Boone, M.N.; Derome, D.; Carmeliet, J. Swelling interactions of earlywood and latewood across a growth ring: Global and local deformations. Wood Sci. Technol. 2018, 52, 91–114. [Google Scholar] [CrossRef]
- Hill, C.; Papadopoulos, A. A review of methods used to determine the size of the cell wall microvoids of wood. J. Inst. Wood Sci. 2001, 15, 337–345. [Google Scholar]
- Stamm, A. Wood and Cellulose Science; The Ronald Press Co.: New York, NY, USA, 1964. [Google Scholar]
- Engelund, E.; Thygesen, L.; Svennsson, S.; Hill, C. A critical discussion of the physics of wood–water interactions. Wood Sci. Technol. 2013, 47, 141–161. [Google Scholar] [CrossRef] [Green Version]
- Thygesen, L.G.; Tang Engelund, E.; Hoffmeyer, P. Water sorption in wood and modified wood at high values of relative humidity. Part I: Results for untreated, acetylated, and furfurylated Norway spruce. Holzforschung 2010, 64, 315–323. [Google Scholar] [CrossRef]
- Stone, J.; Scallan, A. A Study of Cell Wall Structure by Nitrogen Adsorption. Pulp Pap. Mag. Can. 1965, 66, 407–414. [Google Scholar]
- Yin, J.; Song, K.; Lu, Y.; Zhao, G.; Yin, Y. Comparison of changes in micropores and mesopores in the wood cell walls of sapwood and heartwood. Wood Sci. Technol. 2015, 49, 987–1001. [Google Scholar] [CrossRef]
- Plötze, M.; Niemz, P. Porosity and pore size distribution of different wood types as determined by mercury intrusion porosimetry. Eur. J. Wood Wood Prod. 2011, 69, 649–657. [Google Scholar] [CrossRef] [Green Version]
- Scholz, G.; Zauer, M.; Van den Bulcke, J.; Van Loo, D.; Pfriem, A.; Van Acker, J.; Militz, H. Investigation on wax-impregnated wood. Part 2: Study of void spaces filled with air by He pycnometry, Hg intrusion porosimetry, and 3D X-ray imaging. Holzforschung 2010, 64, 587–593. [Google Scholar] [CrossRef]
- Ciesielski, P.; Crowley, M. Biomass Particle Models with Realistic Morphology and Resolved Microstructure for Simulations of Intra-Particle Transport Phenomena. Energy Fuels 2015, 29, 242–254. [Google Scholar] [CrossRef]
- Mantanis, G.I.; Young, R.A.; Rowell, R.M. Swelling of Wood. Part II. Swelling in Organic Liquids. Holzforschung 1994, 48, 480–490. [Google Scholar] [CrossRef]
- Boluk, Y. Acid–base interactions and swelling of cellulose fibers in organic liquids. Cellulose 2005, 12, 577–593. [Google Scholar] [CrossRef]
- Jeremic, D.; Quijano-Solis, C.; Cooper, P. Diffusion rate of polyethylene glycol into cell walls of red pine following vacuum impregnation. Cellulose 2009, 16, 339–348. [Google Scholar] [CrossRef]
- Schneider, V. Basic investigations on the dimensional stabilization of wood with polyethylene glycol. Holz Als Roh-Und Werkst. 1969, 27, 209–224. [Google Scholar] [CrossRef]
- Christensen, G.N.; Hergt, H.F.A. The Apparent Density of Wood in Non-Swelling Liquids. Holzforschung 1968, 22, 165–170. [Google Scholar] [CrossRef]
- Lindman, B.; Karlström, G.; Stigsson, L. On the mechanism of dissolution of cellulose. J. Mol. Liq. 2010, 156, 76–81. [Google Scholar] [CrossRef]
- Youssefian, S.; Jakes, J.E.; Rahbar, N. Variation of Nanostructures, Molecular Interactions, and Anisotropic Elastic Moduli of Lignocellulosic Cell Walls with Moisture. Sci. Rep. 2017, 7, 2054. [Google Scholar] [CrossRef] [PubMed]
- Cousins, W.J. Elastic modulus of lignin as related to moisture content. Wood Sci. Technol. 1976, 10, 9–17. [Google Scholar] [CrossRef]
- Vural, D.; Gainaru, C.; O’Neill, H.; Pu, Y.; Smith, M.D.; Parks, J.M.; Pingali, S.V.; Mamontov, E.; Davison, B.H.; Sokolov, A.P.; et al. Impact of hydration and temperature history on the structure and dynamics of lignin. Green Chem. 2018, 20, 1602–1611. [Google Scholar] [CrossRef]
- Kulasinski, K.; Guyer, R.; Derome, D.; Carmeliet, J. Water diffusion in amorphous hydrophilic systems: A stop and go process. Langmuir 2015, 31, 10843–10849. [Google Scholar] [CrossRef]
- Peemoeller, H.; Sharp, A.R. N.m.r. study of cellulose-water systems: Water proton spin-lattice relaxation in the rotating reference frame. Polymer 1985, 26, 859–864. [Google Scholar] [CrossRef]
- Terenzi, C.; Prakobna, K.; Berglund, L.A.; Furó, I. Nanostructural Effects on Polymer and Water Dynamics in Cellulose Biocomposites: 2 H and 13 C NMR Relaxometry. Biomacromolecules 2015, 16, 1506–1515. [Google Scholar] [CrossRef]
- Topgaard, D.; Söderman, O. Diffusion of Water Absorbed in Cellulose Fibers Studied with 1 H-NMR. Langmuir 2007, 17, 2694–2702. [Google Scholar] [CrossRef]
- O’Neill, H.; Pingali, S.V.; Petridis, L.; He, J.; Mamontov, E.; Hong, L.; Urban, V.; Evans, B.; Langan, P.; Smith, J.C.; et al. Dynamics of water bound to crystalline cellulose. Sci. Rep. 2017, 7, 11840. [Google Scholar] [CrossRef] [PubMed] [Green Version]
- Kulasinski, K.; Keten, S.; Churakov, S. Molecular Mechanism of Moisture-Induced Transition in Amorphous Cellulose. ACS Macro Lett. 2014, 3, 1037–1040. [Google Scholar] [CrossRef]
- Plaza, N.Z. On the Experimental Assessment of the Molecular-Scale Interactions between Wood and Water. Forests 2019, 10, 616. [Google Scholar] [CrossRef] [Green Version]
- Sonderegger, W.; Vecellio, M.; Zwicker, P.; Niemz, P. Combined bound water and water vapour diffusion of Norway spruce and European beech in and between the principal anatomical directions. Holzforschung 2011, 65, 819–828. [Google Scholar] [CrossRef] [Green Version]
- Stamm, A.J. Bound-Water Diffusion Into Wood in the Fiber Direction. For. Prod. J. 1959, 9, 27–32. [Google Scholar]
- Stamm, A.J. Bound-Water Diffusion Into Wood in Across-The-Fiber Directions. For. Prod. J. 1960, 10, 524–528. [Google Scholar]
- Araujo, C.D.; Mackay, A.L.; Whittall, K.P.; Hailey, J.R.T. A Diffusion Model for Spin-Spin Relaxation of Compartmentalized Water in Wood. J. Magn. Reson. Ser. B 1993, 101, 248–261. [Google Scholar] [CrossRef]
- Plaza, N.Z. Neutron Scattering Studies of Nano-scale Wood-Water Interactions. Ph.D. Thesis, University of Wisconsin-Madison, Madison, WI, USA, 2017. [Google Scholar]
- Grigsby, W.J.; Kroese, H.; Dunningham, E.A. Characterisation of pore size distributions in variously dried Pinus radiata: Analysis by thermoporosimetry. Wood Sci. Technol. 2013, 47, 737–747. [Google Scholar] [CrossRef]
- Zauer, M.; Kretzschmar, J.; Großmann, L.; Pfriem, A.; Wagenführ, A. Analysis of the pore-size distribution and fiber saturation point of native and thermally modified wood using differential scanning calorimetry. Wood Sci. Technol. 2014, 48, 177–193. [Google Scholar] [CrossRef]
- Landry, M.R. Thermoporometry by differential scanning calorimetry: Experimental considerations and applications. Thermochim. Acta 2005, 433, 27–50. [Google Scholar] [CrossRef]
- Engelund, E.T.; Thygesen, L.G.; Hoffmeyer, P. Water sorption in wood and modified wood at high values of relative humidity. Part 2: Appendix. Theoretical assessment of the amount of capillary water in wood microvoids. Holzforschung 2010, 64, 325–330. [Google Scholar] [CrossRef]
- Morrell, J.J.; Freitag, C.M. Effect of wood moisture content on diffusion of boron-based biocides through Douglas-fir and western hemlock lumber. For. Prod. J. 1995, 45, 51–55. [Google Scholar]
- Baglayeva, G.; Seames, W.S.; Frihart, C.R.; O’dell, J.; Kozliak, E.I. Penetration of n-Hexadecane and Water into Wood under Conditions Simulating Catastrophic Floods. For. Prod. J. 2017, 67, 236–244. [Google Scholar] [CrossRef]
- Jeremic, D.; Cooper, P.; Brodersen, P. Penetration of poly(ethylene glycol) into wood cell walls of red pine. Holzforschung 2007, 61, 272–278. [Google Scholar] [CrossRef]
- Hill, C.A.S.; Forster, S.C.; Farahani, M.R.M.; Hale, M.D.C.; Ormondroyd, G.A.; Williams, G.R. An investigation of cell wall micropore blocking as a possible mechanism for the decay resistance of anhydride modified wood. Int. Biodeterior. Biodegrad. 2005, 55, 69–76. [Google Scholar] [CrossRef]
- Stone, J.E.; Scallan, A.M. The effect of component removal upon the porous structure of the cell wall of wood. Part III. A comparison between the sulphite and kraft processes. Pulp Pap. Mag. Can. 1968, 69, 69–74. [Google Scholar]
- Flournoy, D.S.; Kirk, T.K.; Highley, T.L. Wood Decay by Brown-Rot Fungi: Changes in Pore Structure and Cell Wall Volume. Holzforschung 1991, 45, 383–388. [Google Scholar] [CrossRef]
- Simpson, W.T. Moisture changes induced in red oak by transverse stress. Wood Fiber Sci. 1971, 3, 13–20. [Google Scholar]
- Lin, R.T. A Study of Electrical Conduction in Wood. PhD Thesis, State University of New York, New York, NY, USA, 1965. [Google Scholar]
- Zelinka, S.L.; Gleber, S.-C.; Vogt, S.; Rodríguez López, G.M.; Jakes, J.E. Threshold for ion movements in wood cell walls below fiber saturation observed by X-ray fluorescence microscopy (XFM). Holzforschung 2015, 69, 441–448. [Google Scholar] [CrossRef]
- Langwig, J.E.; Meyer, J.A. Ion migration in wood verified by neutron activation analysis. Wood Sci. 1973, 6, 39–50. [Google Scholar]
- Minato, K.; Kojima, N.; Ishimaru, Y.; Katayama, Y.; Aoki, A. Transverse migration of trace elements in woody stems under a direct current potential. Mokuzai Gakkaishi 1990, 36, 1089–1094. [Google Scholar]
- Hunt, C.G.; Zelinka, S.L.; Frihart, C.R.; Lorenz, L.; Yelle, D.; Gleber, S.-C.; Vogt, S.; Jakes, J.E. Acetylation increases relative humidity threshold for ion transport in wood cell walls–A means to understanding decay resistance. Int. Biodeterior. Biodegrad. 2018, 133, 230–237. [Google Scholar] [CrossRef]
- Zelinka, S.L.; Passarini, L.; Quintana, J.C.; Glass, S.V.; Jakes, J.E.; Wiedenhoeft, A.C. Cell wall domain and moisture content influence sourthern pine electrical conductivity. Wood Fiber Sci. 2016, 48, 54–61. [Google Scholar]
- Yata, S.; Mukudai, J.; Kajita, H. Morphological Studies on the Movement of Substances into the Cell Wall of Wood. II Diffusion of copper compunds into the cell wall. Mokuzai Gakkaishi 1979, 25, 171–176. [Google Scholar]
- Yata, S.; Mukudai, J.; Kajita, H. Morphological Studies on the Movement of Substances into the Cell Wall of Wood. III Diffusion of xinc compounds into the cell wall. Mokuzai Gakkaishi 1981, 27, 761–766. [Google Scholar]
- Yata, S.; Mukudai, J.; Kajita, H. Morphological Studies on the Movement of Substances into the Cell Wall of Wood. IV. diffusion of hexavalent chromium into the cell wall. Mokuzai Gakkaishi 1981, 27, 821–827. [Google Scholar]
- Kang, X.; Kirui, A.; Dickwella Widanage, M.C.; Mentink-Vigier, F.; Cosgrove, D.J.; Wang, T. Lignin-polysaccharide interactions in plant secondary cell walls revealed by solid-state NMR. Nat. Commun. 2019, 10, 347. [Google Scholar] [CrossRef]
- Dupree, R.; Simmons, T.J.; Mortimer, J.C.; Patel, D.; Iuga, D.; Brown, S.P.; Dupree, P. Probing the Molecular Architecture of Arabidopsis thaliana Secondary Cell Walls Using Two- and Three-Dimensional 13C Solid State Nuclear Magnetic Resonance Spectroscopy. Biochemistry 2015, 54, 2335–2345. [Google Scholar] [CrossRef]
- Deng, J.; Vine, D.J.; Chen, S.; Nashed, Y.S.G.; Jin, Q.; Phillips, N.W.; Peterka, T.; Ross, R.; Vogt, S.; Jacobsen, C.J. Simultaneous cryo X-ray ptychographic and fluorescence microscopy of green algae. Proc. Natl. Acad. Sci. USA 2015, 112, 2314–2319. [Google Scholar] [CrossRef] [Green Version]
- Ye, D.; Kiemle, S.N.; Rongpipi, S.; Wang, X.; Wang, C.; Cosgrove, D.J.; Gomez, E.W.; Gomez, E.D. Resonant soft X-ray scattering reveals cellulose microfibril spacing in plant primary cell walls. Sci. Rep. 2018, 8, 12449. [Google Scholar] [CrossRef]
- Bigg, D.M. A review of positron annihilation lifetime spectroscopy as applied to the physical aging of polymers. Polym. Eng. Sci. 1996, 36, 737–743. [Google Scholar] [CrossRef]
- Ebrahimzadeh, P.R.; Kubat, J. Mechanosorptive effects in cellophane, polyamide 6 and some other polymers studied by dynamic mechanical analysis. J. Mater. Sci. 1997, 32, 4227–4235. [Google Scholar] [CrossRef]
- Ebrahimzadeh, P.R.; Kubát, D.G. Effects of humidity changes on damping and stress relaxation in wood. J. Mater. Sci. 1993, 28, 5668–5674. [Google Scholar] [CrossRef]
- Spiess, H.W. Advanced solid-state nuclear magnetic resonance for polymer science. J. Polym. Sci. Part A Polym. Chem. 2004, 42, 5031–5044. [Google Scholar] [CrossRef]
- Fragiadakis, D.; Dou, S.; Colby, R.H.; Runt, J. Molecular Mobility, Ion Mobility, and Mobile Ion Concentration in Poly(ethylene oxide)-Based Polyurethane Ionomers. Macromolecules 2008, 41, 5723–5728. [Google Scholar] [CrossRef]
- Pant, P.V.K.; Boyd, R.H. Molecular-dynamics simulation of diffusion of small penetrants in polymers. Macromolecules 1993, 26, 679–686. [Google Scholar] [CrossRef]
- Chen, M.; Zhang, C.; Shomali, A.; Coasne, B.; Carmeliet, J.; Derome, D. Wood–Moisture Relationships Studied with Molecular Simulations: Methodological Guidelines. Forests 2019, 10, 628. [Google Scholar] [CrossRef] [Green Version]
- Hill, C.A.S.; Norton, A.; Newman, G. The water vapor sorption behavior of flax fibers-Analysis using the parallel exponential kinetics model and determination of the activation energies of sorption. J. Appl. Polym. Sci. 2010, 116, 2166–2173. [Google Scholar] [CrossRef]
- Kohler, R.; Alex, R.; Brielmann, R.; Ausperger, B. A New Kinetic Model for Water Sorption Isotherms of Cellulosic Materials. Macromol. Symp. 2006, 244, 89–96. [Google Scholar] [CrossRef]
- Thybring, E.E.; Boardman, C.R.; Glass, S.V.; Zelinka, S.L. The parallel exponential kinetics model is unfit to characterize moisture sorption kinetics in cellulosic materials. Cellulose 2019, 26, 723–735. [Google Scholar] [CrossRef]
- Guggenheim, E.A. Applications of Statistical Mechanics; Oxford University Press: Oxford, UK, 1966. [Google Scholar]
- Anderson, R.B. Modifications of the Brunauer, Emmett and Teller Equation. J. Am. Chem. Soc. 1946, 68, 686–691. [Google Scholar] [CrossRef]
- De Boer, J.H. The Dynamical Character of Adsorption; Oxford University Press: Oxford, UK, 1953. [Google Scholar]
- Dent, R.W. A Multilayer Theory for Gas Sorption. Text. Res. J. 1977, 47, 145–152. [Google Scholar] [CrossRef]
- Brunauer, S.; Emmett, P.H.; Teller, E. Adsorption of Gases in Multimolecular Layers. J. Am. Chem. Soc. 1938, 60, 309–319. [Google Scholar] [CrossRef]
- Langmuir, I. The adsorption of gases on plane surfaces of glass, mica and platinum. J. Am. Chem. Soc. 1918, 40, 1361–1403. [Google Scholar] [CrossRef] [Green Version]
- Zelinka, S.L.; Glass, S.V.; Thybring, E.E. Myth versus reality: Do parabolic sorption isotherm models reflect actual wood–water thermodynamics? Wood Sci. Technol. 2018, 52, 1701–1706. [Google Scholar] [CrossRef]
- Willems, W. A critical review of the multilayer sorption models and comparison with the sorption site occupancy (SSO) model for wood moisture sorption isotherm analysis. Holzforschung 2015, 69, 67–75. [Google Scholar] [CrossRef]
- Alince, B. Comments on porosity or swollen pulp fibers analyzed by solute-exclusion. Tappi J. 1991, 74, 200–202. [Google Scholar]
- Day, J.C.; Alince, B.; Robertson, A.A. The characterization of pore systems by macromolecular penetration. Cellul. Chem. Technol. 1979, 13, 317–326. [Google Scholar]
- Sun, N.; Sudipto, D.; Frazier, C.E. Dynamic mechanical analysis of dry wood: Linear viscoelastic response region and effects of minor moisture changes. Holzforschung 2007, 61, 28. [Google Scholar] [CrossRef]
- Obataya, E.; Norimoto, M.; Tomita, B. Mechanical relaxation processes of wood in the low-temperature range. J. Appl. Polym. Sci. 2001, 81, 3338–3347. [Google Scholar] [CrossRef]
- Sugiyama, M.; Obataya, E.; Norimoto, M. Viscoelastic properties of the matrix substance of chemically treated wood. J. Mater. Sci. 1998, 33, 3505–3510. [Google Scholar] [CrossRef]
- Chowdhury, S.; Fabiyi, J.; Frazier, C.E. Advancing the dynamic mechanical analysis of biomass: Comparison of tensile-torsion and compressive-torsion wood DMA. Holzforschung 2010, 64, 747–756. [Google Scholar] [CrossRef]
- Boyer, R.F. Transitions and Relaxations. Encycl. Polym. Sci. Technol. Suppl. 1977, 2, 745–839. [Google Scholar]
- Salmén, L. Viscoelastic properties of in situ lignin under water-saturated conditions. J. Mater. Sci. 1984, 19, 3090–3096. [Google Scholar] [CrossRef]
- Olsson, A.-M.; Salmén, L. The effect of lignin composition on the viscoelastic properties of wood. Nord. Pulp Pap. Res. J. 1997, 12, 140–144. [Google Scholar] [CrossRef]
- Becker, H.; Noack, D. Studies on dynamic torsional viscoelasticity of wood. Wood Sci. Technol. 1968, 2, 213–230. [Google Scholar]
- Hoglund, H.; Sohlin, U.; Tistad, G. Physical properties of wood in relation to chip refining. Tappi 1976, 59, 144–147. [Google Scholar]
- Becker, H.; Hoglund, H.; Tistad, G. Frequency and temperature in chip refining. Pap. Ja Puu 1977, 59, 123–130. [Google Scholar]
- Uhmeier, A.; Morooka, T.; Norimoto, M. Influence of thermal softening ad degradation on the radial compression behavior of wet spruce. Holzforschung 1998, 52, 77–81. [Google Scholar] [CrossRef]
- Placet, V.; Passard, J.; Perre, P. Viscoelastic properties of green wood across the grain measured by harmonic tests in the range 0–95 °C: Hardwood vs. softwood and normal wood vs. reaction wood. Holzforschung 2007, 61, 548–557. [Google Scholar] [CrossRef] [Green Version]
- Irvine, G.M. The glass transition of lignin and hemicellulose and their measurement by differential thermal analysis. TAPPI J. 1984, 67, 118–121. [Google Scholar]
- Östberg, G.; Salmén, L.; Terlecki, J. Softening Temperature of Moist Wood Measured by Differential Scanning Calorimetry. Holzforschung 1990, 44, 223–225. [Google Scholar] [CrossRef]
- Kelley, S.S.; Rials, T.G.; Glasser, W.G. Relaxation behaviour of the amorphous components of wood. J. Mater. Sci. 1987, 22, 617–624. [Google Scholar] [CrossRef]
- Stelte, W.; Clemons, C.; Holm, J.K.; Ahrenfeldt, J.; Henriksen, U.B.; Sanadi, A.R. Thermal transitions of the amorphous polymers in wheat straw. Ind. Crops Prod. 2011, 34, 1053–1056. [Google Scholar] [CrossRef] [Green Version]
- Goring, D.A.I. Thermal Softening of Lignin, Hemicellulose and Cellulose. Pulp Pap. Mag. Can. 1963, 64, T517–T527. [Google Scholar]
- Sakata, I.; Senju, R. Thermoplastic behavior of lignin with various synthetic plasticizers. J. Appl. Polym. Sci. 1975, 19, 2799–2810. [Google Scholar] [CrossRef]
- Takamura, N. Studies on hot pressing and drying process in the production of fibreboard. III. Softening of fibre components in hot pressing of fibre mat. J. Jpn. Wood Res. Soc. 1968, 14, 75–79. [Google Scholar]
- Hatakeyama, H.; Hatakeyama, T. Thermal Properties of Isolated and in situ Lignin. In Lignin and Lignans: Advances in Chemistry; Heitner, C., Dimmel, D., Schmidt, J., Eds.; CRC Press: Boca Raton, FL, USA, 2010; pp. 301–319. [Google Scholar]
- Back, E.L.; Salmén, L. Glass transitions of wood components hold implications for molding and pulping processes. TAPPI J. 1982, 65, 107–110. [Google Scholar]
- Backman, A.C.; Lindberg, K.A.H. Differences in wood material responses for radial and tangential direction as measured by dynamic mechanical thermal analysis. J. Mater. Sci. 2001, 36, 3777–3783. [Google Scholar] [CrossRef]
- Jiang, J.L.; Lu, J.X. Dynamic Viscoelasticity of Wood After Various Drying Processes. Dry. Technol. 2008, 26, 537–543. [Google Scholar] [CrossRef]
- Li, Z.; Jiang, J.; Lu, J. Moisture-dependent orthotropic viscoelastic properties of Chinese fir wood in low temperature environment. J. Wood Sci. 2018, 64, 515–525. [Google Scholar] [CrossRef] [Green Version]
- Lenth, C.; Kamke, F. Moisture Dependent Softening Behavior of Wood. Wood Fiber Sci. 2001, 33, 492–507. [Google Scholar]
- Bag, R.; Beaugrand, J.; Dole, P.; Kurek, B. Viscoelastic properties of woody hemp core. Holzforschung 2011, 65, 239–247. [Google Scholar] [CrossRef]
- Miki, T.; Sugimoto, H.; Kojiro, K.; Furuta, Y.; Kanayama, K. Thermal behaviors and transitions of wood detected by temperature-modulated differential scanning calorimetry. J. Wood Sci. 2012, 58, 300–308. [Google Scholar] [CrossRef]
- Zhan, T.; Jiang, J.; Lu, J.; Zhang, Y.; Chang, J. Temperature-humidity-time equivalence and relaxation in dynamic viscoelastic response of Chinese fir wood. Constr. Build. Mater. 2019, 227, 116637. [Google Scholar] [CrossRef]
- Simons, P.J.; Spiro, M.; Levy, J.F. Electrical transport of endogenous mineral ions in green sapwood of Pinus sylvestris L. (Scots pine). Wood Sci. Technol. 1998, 32, 403–410. [Google Scholar] [CrossRef]
- Zelinka, S.L.; Rammer, D.R.; Stone, D.S. Impedance spectroscopy and circuit modeling of Southern pine above 20% moisture content. Holzforschung 2008, 62, 737–744. [Google Scholar] [CrossRef]
- Abou Elfadl, A.; El-Sayed, S.; Hassen, A.; Abd El-Kader, F.H.; Said, G. Charge transport and glassy dynamics in polyisoprene. Polym. Bull. 2014, 71, 2039–2052. [Google Scholar] [CrossRef]
- Zhang, S.; Dou, S.; Colby, R.H.; Runt, J. Glass transition and ionic conduction in plasticized and doped ionomers. J. Non. Cryst. Solids 2005, 351, 2825–2830. [Google Scholar] [CrossRef]
- Green, D.W.; Kretschmann, D.E. Moisture Content and the Properties of Clear Southern Pine. For. Prod. Lab. Res. Pap. 1994, 8, 320–337. [Google Scholar]
- Cousins, W.J. Young’s modulus of hemicellulose as related to moisture content. Wood Sci. Technol. 1978, 12, 161–167. [Google Scholar] [CrossRef]
- Olsson, A.-M.; Salmén, L. The Softening Behavior of Hemicelluloses Related to Moisture; Gatenholm, P., Tenkanen, M., Eds.; American Chemical Society: Washington, DC, USA, 2003; Volume 864, ISBN 0-8412-3842-1. [Google Scholar]
- Paes, S.S.; Sun, S.; MacNaughtan, W.; Ibbett, R.; Ganster, J.; Foster, T.J.; Mitchell, J.R. The glass transition and crystallization of ball milled cellulose. Cellulose 2010, 17, 693–709. [Google Scholar] [CrossRef]
Figure 1.
Schematics of linear, branched, and cross-linked network types of polymers. Each diamond represents a repeating unit.
Figure 1.
Schematics of linear, branched, and cross-linked network types of polymers. Each diamond represents a repeating unit.

Figure 2.
Schematics showing different proposed states of water in water-plasticized polymer with hydrogen bonding. Each diamond represents a repeating unit. Molecular solution and hydrogen bonded water cause swelling of the polymer matrix, whereas absorption in “holes” water does not. Swelling is represented by the polymer chains being pushed apart by the water molecules. Also illustrated are a water cluster and the disruption of polymer-polymer hydrogen bonding in the dry polymer by the hydrogen bonded water in the water-plasticized polymer.

Figure 3.
Schematics illustrating steps for diffusion of a small and large diffusant through a polymer network. (A) A small and large diffusant residing in a polymer network. (B) Small-scale and cooperative motions occur near the small and large diffusant, respectively, to allow access to a new free volume element in the polymer network. (C) Diffusants “jump” into the new free volumes made available by the molecular motions. (D) The molecular motions relax to their original configuration with the diffusants in a new location.

Figure 4.
Illustrations of hardwood and softwood cellular structures.

Figure 5.
Schematic of typical wood fiber or tracheid cell wall structure.

Figure 6.
Schematics of proposed S2 secondary cell wall and compound middle lamella (CML) nanostructures. Highly ordered cellulose forms elementary fibrils that are bundled into microfibrils [43,90,91]. Proposed nanostructure organization of hemicelluloses includes a glucomannan sheath around microfibrils [81,82] and xylan perpendicular to the microfibrils [91,92,93]. Lignin encrusts the remaining S2 volume. The CML is proposed to be an open-cellular nanostructure of hemicelluloses encrusted with lignin [83].

Figure 7.
Proposed schematics illustrating changes in relative free volume as a function of relative humidity (RH) at room temperature for highly ordered regions in cellulose elementary fibrils, lignin, and amorphous polysaccharides. The amorphous polysaccharides include amorphous cellulose and hemicelluloses. As water cannot enter the highly-ordered cellulose in the elementary fibrils, the free volume is not expected to appreciably change with increasing moisture. The initial decrease in the lignin is caused by the first water molecules filling the molecular “holes” in lignin. In the amorphous polysaccharides, the kink is caused by the moisture-induced glass transition.

Figure 8.
Glass transition temperatures for in situ lignin as a function of wood moisture content as reported by Irvine [206], Ostberg et al. [207]. Kelley et al. [208], Stelte et al. [209], and Becker and Noack [201]. Each color represents a different study and each symbol represents results from a different wood material. All data plotted from dynamic mechanical measurements were from experiments performed at approximately 1 Hz. The 73 °C to 95 °C range labeled “Water-saturated” represents the range over which the lignin glass transition has been observed in water-saturated wood. See text for further experimental details.

Figure 9.
Glass transition temperatures for different types of extracted lignins as a function of lignin moisture content as reported by Goring [210], Sakata and Senju [211], Takamura [212], Irvine [206], and Hatakeyama and Hatakeyama [213]. Each color represents a different study and each symbol represents results from a different lignin material. See text for further experimental details.

Figure 10.
Glass transition temperatures for in situ hemicelluloses as a function of wood moisture content as reported by Lenth and Kamke [218], Kelley et al. [208], Li et al. [217], Jiang and Lu [216], Stelte et al. [209], and Backman and Lindberg [215]. All data plotted form dynamic mechanical or dielectric experiments were glass transition temperatures determined at approximately 1 Hz. Each color represents a different study and each symbol represents results from a different wood material. See text for further experimental details.

Figure 11.
Glass transition temperatures for in situ hemicelluloses as a function of relative humidity (RH) conditioning as reported by Lenth and Kamke [218], Li et al. [217], Jiang and Lu [216], Stelte et al. [209], Backman and Lindberg [215], Bag et al. [219], and Jakes [32]. The Jakes [32] results are from measurements in the S2 cell wall layer (S2) and corner compound middle lamella (CCML). All data plotted form dynamic mechanical or dielectric experiments were glass transition temperatures determined at approximately 1 Hz. Each color represents a different study and each symbol represents results from a different wood material or cell wall layer. See text for further experimental details.

Figure 12.
Glass transition temperatures for different types of extracted amorphous polysaccharides as a function of relative humidity conditioning (RH) as reported by Takamura [212], Cousins [227], Olsson and Salmèn [228], and Paes et al. [229]. Each color represents a different study and each symbol represents results from a different amorphous polysaccharide material. See text for further experimental details.

© 2019 by the authors. Licensee MDPI, Basel, Switzerland. This article is an open access article distributed under the terms and conditions of the Creative Commons Attribution (CC BY) license (http://creativecommons.org/licenses/by/4.0/).
Share and Cite
MDPI and ACS Style
Jakes, J.E.; Hunt, C.G.; Zelinka, S.L.; Ciesielski, P.N.; Plaza, N.Z. Effects of Moisture on Diffusion in Unmodified Wood Cell Walls: A Phenomenological Polymer Science Approach. Forests 2019, 10, 1084. https://doi.org/10.3390/f10121084
AMA Style
Jakes JE, Hunt CG, Zelinka SL, Ciesielski PN, Plaza NZ. Effects of Moisture on Diffusion in Unmodified Wood Cell Walls: A Phenomenological Polymer Science Approach. Forests. 2019; 10(12):1084. https://doi.org/10.3390/f10121084
Chicago/Turabian StyleJakes, Joseph E., Christopher G. Hunt, Samuel L. Zelinka, Peter N. Ciesielski, and Nayomi Z. Plaza. 2019. "Effects of Moisture on Diffusion in Unmodified Wood Cell Walls: A Phenomenological Polymer Science Approach" Forests 10, no. 12: 1084. https://doi.org/10.3390/f10121084
Note that from the first issue of 2016, this journal uses article numbers instead of page numbers. See further details here.