Article

Web-Based Forest Resources Management Decision Support System

1
Forest Research Centre, School of Agriculture, University of Lisbon Tapada da Ajuda, 1349-017 Lisboa, Portugal
2
US Department of Agriculture, Forest Service, Pacific Northwest Research Station, Corvallis Forestry Sciences Laboratory 3200 SW Jefferson Way, Corvallis, OR 97331, USA
3
Mathematics Department, School of Sciences and Technology, University of Evora Colégio Luís António Verney, Rua Romão Ramalho, 59, 7000-671 Évora, Portugal
*
Author to whom correspondence should be addressed.
Forests 2019, 10(12), 1079; https://doi.org/10.3390/f10121079
Submission received: 17 October 2019 / Revised: 19 November 2019 / Accepted: 23 November 2019 / Published: 27 November 2019

Abstract

:
In this paper, we present a web-based decision support system (DSS)—wSADfLOR—to facilitate the access of stakeholders to tools that may contribute to enhancing forest management planning. The emphasis is on a web-based architecture and a web graphic user interface (wGUI) that may effectively support the analysis of trade-offs between ecosystem services in order to address participatory and sustainable forest management objectives. For that purpose, the wGUI provides remote access to a management information system, enabling users to analyze environmental and biometric data and topological information as well. Moreover, the wGUI provides remote access to forest simulators so that users may define and simulate prescriptions such as chronological sequences of management options and the corresponding forest ecosystem services outcomes. Remote access to management planning methods is further provided so that users may input their objectives and constraints. The wGUI delivers information about tradeoffs between ecosystem services in the form of decision maps so that users in different locations may negotiate bundles of ecosystem services as well as the plan needed to provide them. The multiple criteria programming routines provide proposals for management plans that may be assessed further, using geographical and alphanumeric information provided by the wGUI. Results for an application to a forested landscape extending to 14,388 ha are presented and discussed. This landscape provides several ecosystem services and the development of its management plan involves multiple stakeholders. Results show that the web-based architecture and the wGUI provide effective access for stakeholders to information about the forest management planning area and to decision support tools that may contribute to addressing complex multi-objective and multiple-decision-maker management planning contexts. They also highlight that the involvement and participation of stakeholders in the design of the web-based architecture contributes to assuring the quality and the usability of the system.

1. Introduction

Decision support systems (DSS) are commonly used in several fields in the environmental sciences—including forestry, natural resource management, and landscape ecology [1]—and are very useful to support forest management planning [2]. A DSS is a computer-based system composed of a language system, presentation system, knowledge system, and problem-processing system whose collective purpose is the support of decision-making activities [3]. A web-based DSS is a software application that can be accessed by computer, smartphone, or tablet, and which is composed of dynamic web pages and web-based graphic user interfaces accessible through a browser [3]. The present study focuses on the architecture of a web-based decision support system for forestry and natural resources management.
DSS have been developed to support forest decision-makers and stakeholders, especially since the 1980s. Frequently, DSS are more focused on one of the three components of a knowledge system as defined in [4] and may encapsulate: a database management system (e.g., data on the forest concerned), a model-base management system (e.g., models for predicting growth and yield), and a methods-based management system (e.g., for calculating key statistics or a solver for optimizing a problem).
AFFOREST [5] and FORESTAR [6] are examples of DSSs more focused on the database management system. AFFOREST is essentially a spatial DSS implemented as an extension of ArcView™ 3.2 (Environmental Systems Research Institute, Redlands, CA, USA). Responsibility for the information and views set out in this article/publication lies entirely with the authors. The use of trade or firm names in this publication is for reader information and does not imply endorsement by the U.S. Department of Agriculture of any product or service. It was built to address management planning problems in Sweden, Denmark, The Netherlands, and Belgium. In turn, FORESTAR encompasses several interfaces with geospatial data for the Asian region, allowing querying and displaying, statistical analysis, and decisions made concerning forest management.
The literature reports the development and use of several DSS to simulate vegetation dynamics and ecosystem states. DSD [7] was one of the first DSS developed for central Europe, covering a range of objectives, including timber production management, nature conservation, and biodiversity. Other examples include (a) the Landscape Management System [8] that provides forest inventory projections over time in the form of various tabular and graphic views for sustainable forest management analysis, (b) the SILVA system [9] which was developed based on single-tree forest-growth simulators, (c) the European Forest Information Scenario Model (EFISCEN) [10,11], a forest resource projection model, and (d) the stansdsIM forest simulator [12]. Other tools have been developed for more specific analysis such as ForestGALES [13], a probability-based model built for assessing the impact of windthrow events on forest stands [14], developed in the U.K. for assessing tree species sustainability and estimating the yield potential of a site using the site index concept.
The literature further reports the development and application of DSS to address multiple criteria management problems. The Ecosystem Management Decision Support system [15], which integrates a variety of other DSS modules (NetWeaver Developer (Rules of Thumb, Inc., Northeast, PA, USA), Criterium DecisionPlus (InfoHarvest, Inc., Seattle, WA, USA), GeNIe (BayesFusion, LLC, Pittsburg, PA, USA), and VisiRule (Logic Programming Associates, LTD, Nottingham, UK)), is a system that provides spatial decision support for landscape-level analysis through logic and decision engines integrated in a geographic information system (GIS; e.g., ArcGIS, QGIS, MapWindow, and DotSpatial). The northeast decision model (NED, [16]) was developed for natural resource tradeoff analysis in project-level planning, including resource goals such as timber production, visual qualities, water quality and quantity, wildlife habitat, forest health, and ecology. Woodstock™, a strategic model-building component of the Remsoft Spatial Planning System (based on [17]) also fits this category, permitting modeling solutions that are obtained by simulation, optimization, or a combination of both. The ecosystem-based multiple-use forest management (ETÇAP) DSS developed by [18] has evolved to consider joint optimization of timber production, non-wood products, and other ecosystem services [19] with an architecture that integrates data, models, and methods bases. Seely et al. 2004 [20] developed the UBC-FM, a hierarchical DSS for evaluating multicriteria management options. Damme et al. 2003 in [21] described a DSS for forest management planning and monitoring, while [22] developed a system to support the selection of harvest areas and the allocation of timber to mills within a multiobjective planning context.
Contemporary DSS in forest management need to routinely consider multiple decision criteria and account for multiple stakeholders with conflicting interests, leading to the need for more flexible and versatile approaches to decision support [23]. At the same time, contemporary management planning emphasizes more active roles for stakeholders in participatory processes for making decisions, and for development of management strategies and their implementation [24,25]. As a result, stakeholder involvement is increasingly linked to the development and improvement of DSS [26,27,28,29,30].
Web technologies have emerged as tools for effectively addressing this context. They provide integrated platforms for designing, developing, and implementing DSS, and offer decision makers and stakeholders remote access to advanced planning techniques and methods via the Internet through web browsers [31]. Other benefits of these systems for decision makers are that there is no hardware cost for maintenance, instant access to software updates, small initial investment, and reduced risk [31].
Current web-based DSS address a wide range of decision tasks based on data, information management, simulation and optimization, sensitivity analysis, collaboration, decision implementation, and visualization [1]. Kirilenko et al. 2007 [32] built a system focused on decision support for non-industrial private forest landowners, the Timberland Decision Support System (TDSS). TDSS is essentially educational software based on a small number of input parameters, and encouraging informed forest management. Another web-based DSS for analyzing timber harvesting costs and productivity was developed by Wu et al. 2012 [33]. This system combines a VB.NET platform and a MS SQL server as a database management system (DBMS), enabling the simulation of harvesting scenarios in the Appalachian region of the southeastern US. FLIRE is an example of a web-based DSS that allows planning services, operations, and management, considering flood and wildfire events [1]. The Adaptive Forest Management (AFM) ToolBox is a web-based system that encapsulates a database, vulnerability assessment tools, and an optimization tool to generate optimized management plans at the level of management units or landscapes [2]. Garcia-Gonzalo et al. [34] presented the desktop version of the SADfLOR DSS for evaluating tradeoffs between ecosystem services. Relative to the former desktop version, wSADfLOR introduces a variety of system architecture innovations to support a web-based DSS solution. First, wSADfLOR was implemented with a Database Management System (DBMS) in PostgreSQL, which makes access to data more efficient than the desktop version, and provides improved performance for the queries and procedures needed to support the calculations to display results in the Geographic Information System (GIS). Second, whereas the desktop SADfLOR implemented MapWinGIS as its GIS component, wSADfLOR uses KML files built in Google Maps and QGIS to support a web implementation to improve system flexibility. Third, while the previous system included growth and yield simulators for cork and holm oak, wSADfLOR also considers growth and yield simulation for Pinus pinaster Ait, Eucalyptus globulus Labil, and chestnut. Finally, wSADfLOR includes a powerful, web-based version of Interactive Decision Maps with dynamic graphical user interfaces to develop the tradeoff decision analysis with Pareto frontiers.
Nevertheless, no DSS has been developed thus far that takes advantage of the integrated functionality of databases, vegetation dynamics simulators, optimization techniques, methods to interactively display tradeoffs between ecosystem services, and web-based graphical user interfaces. This research targets the integration of these functionalities in order to increase the efficiency and the effectiveness of forest management planning. They are integrated within web-based SADfLOR (hereafter, wSADfLOR for brevity), a Portuguese web-based DSS, composed of (1) an information management system with a relational database having PostgreSQL as its DBMS to support the whole system and with a GIS submodule to allow the display of geographic information; (2) standsSIM [12], a forest simulator that allows the simulation of stand-level prescriptions; (3) a multi-criteria optimization and decision module that incorporates interactive decision maps [35,36] with a Pareto Frontier tool [29,34]; (4) an analytic module for reporting solutions and results; and (5) a web-based graphical user interface (wGUI) that provides decision makers and stakeholders with remote access to data, information, models, methods, and reporting routines encapsulated in wSADfLOR modules.
After describing the DSS, the system functionality is demonstrated by application to a forested landscape extending to 14,388 ha. The emphasis is on the assessment of the web-based functionality to analyze tradeoffs between ecosystem services by several decision-makers and stakeholders, who subsequently evaluated their experience in a questionnaire about wSADfLOR. In this application, users can select combinations of criteria to optimize: wood forest products (e.g., wood, volume of ending inventory), and ecosystem services such as carbon sequestration and biodiversity [37]. These criteria reflect the trends in forestry and natural resources [38,39,40] that broaden the scope of forest management by taking into account a wider range of ecosystem services.

2. Materials and Methods
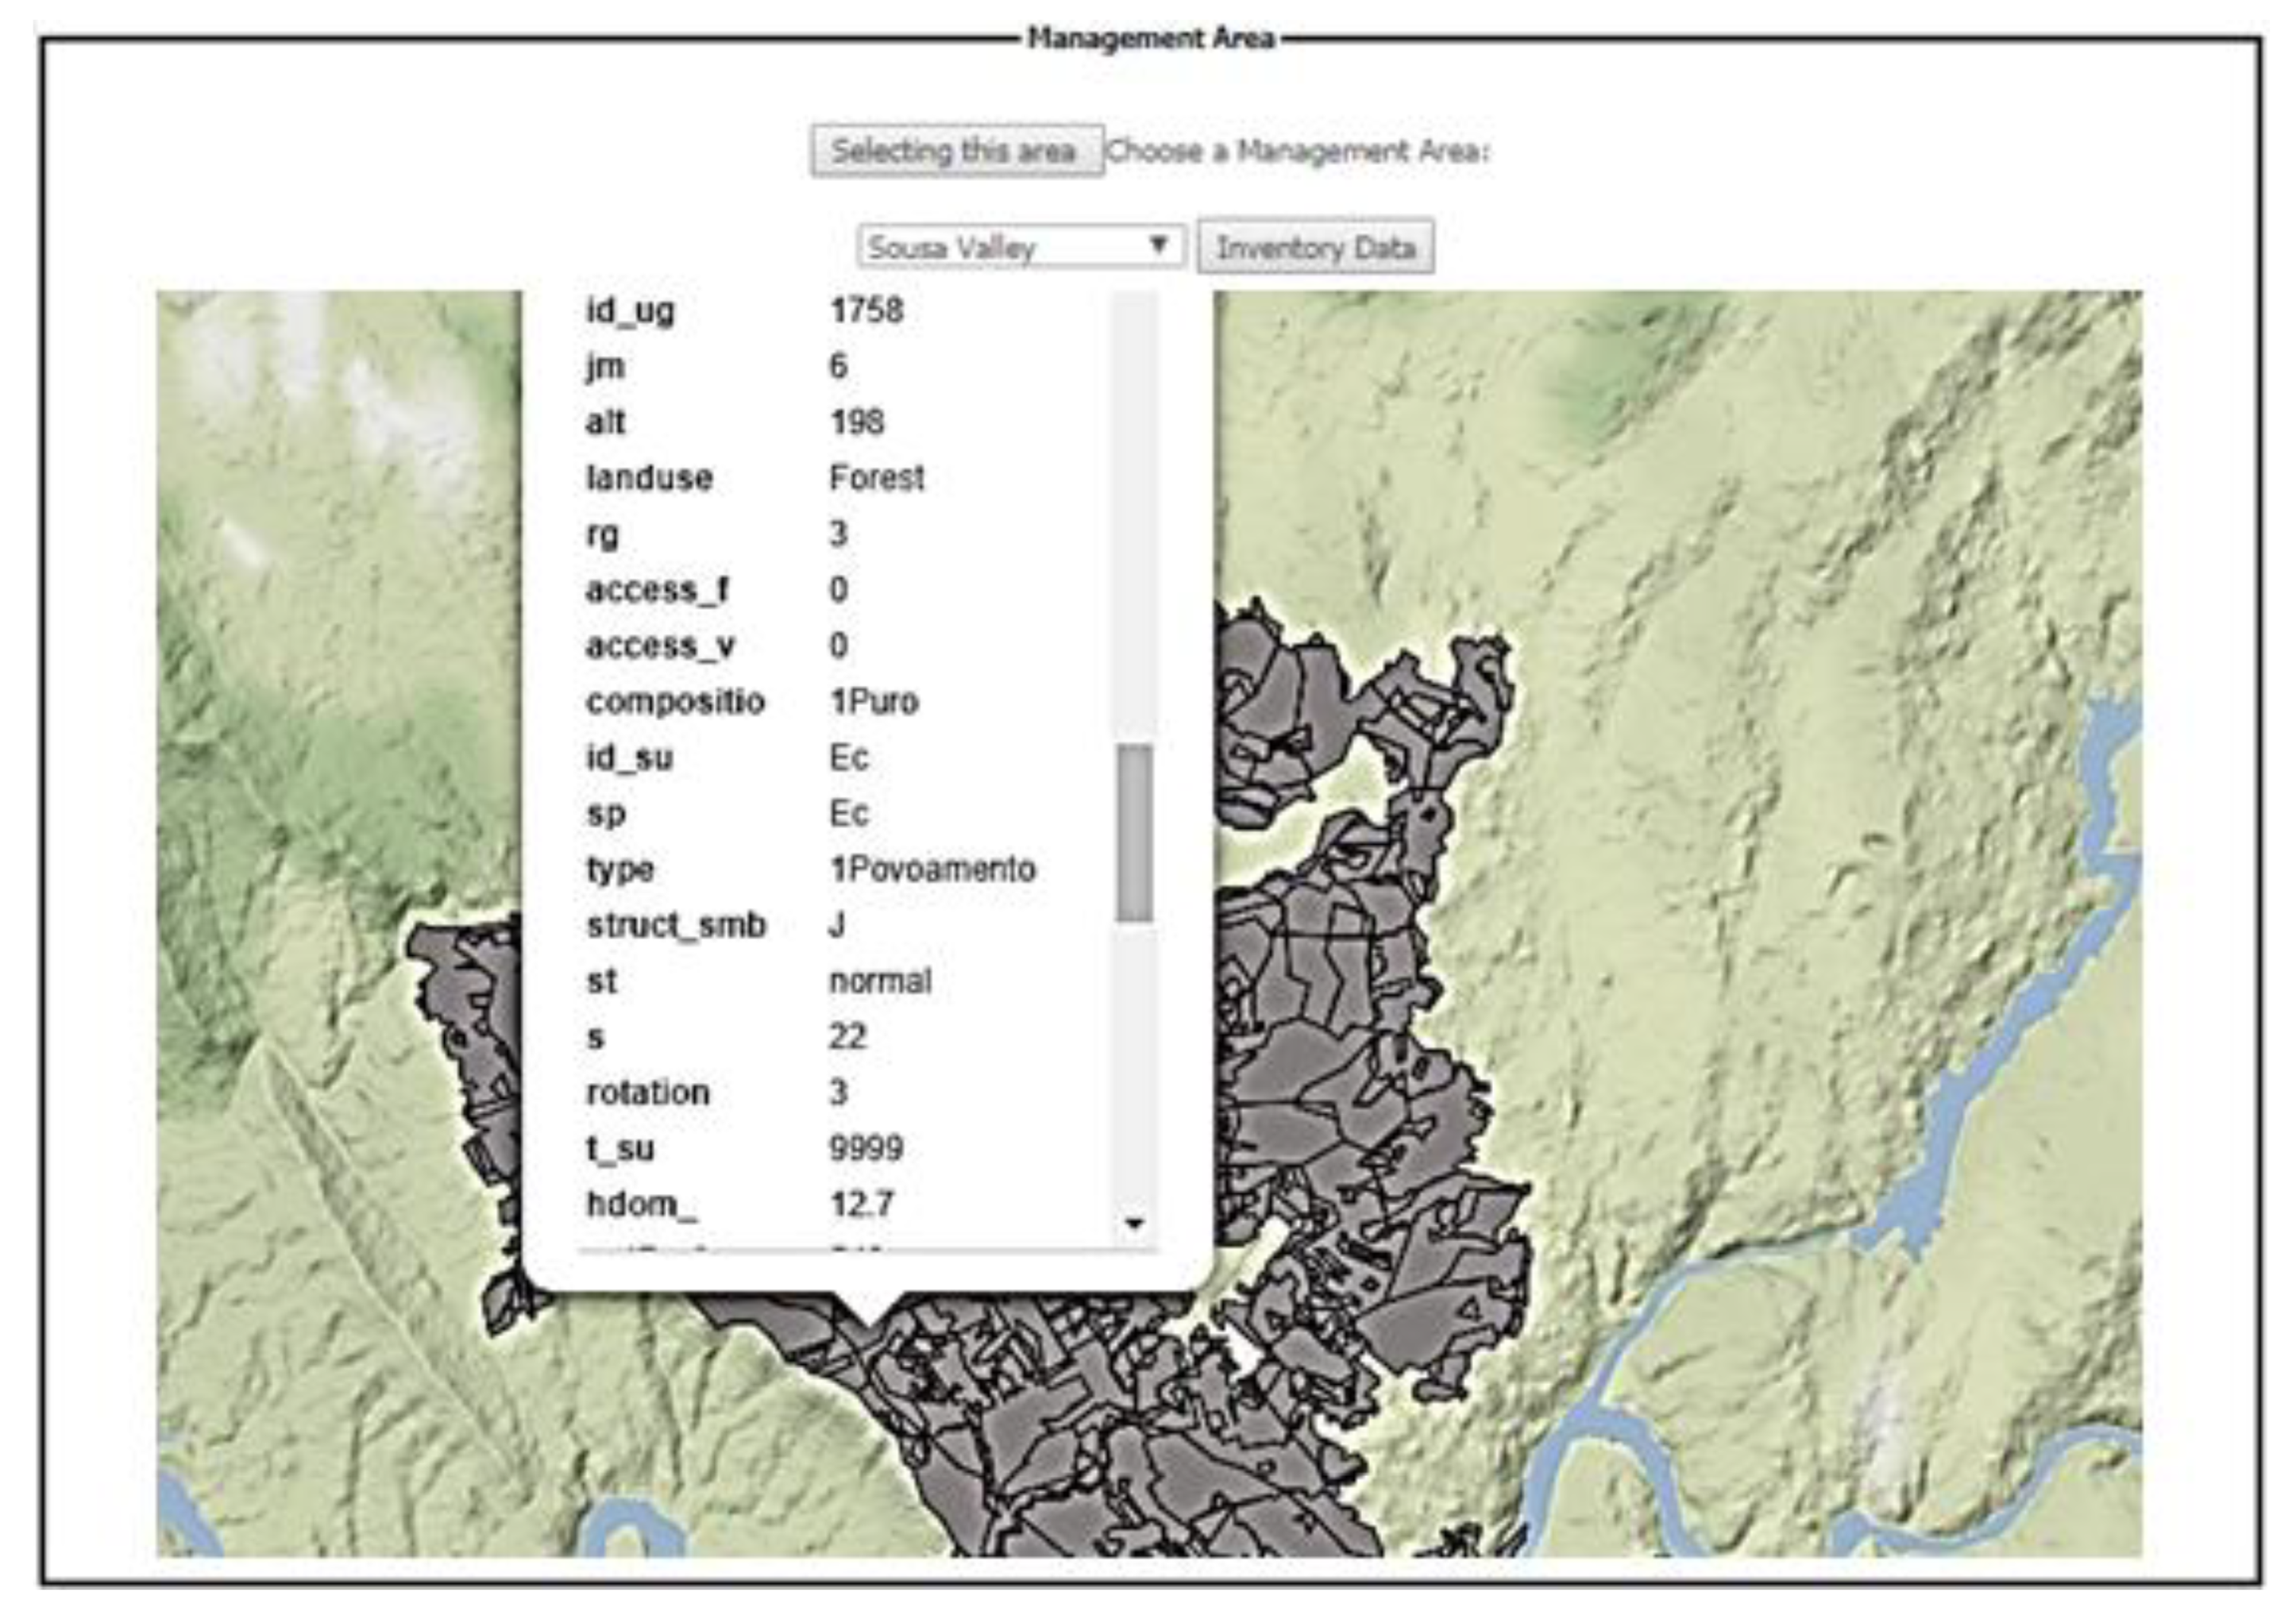
2.1. Study Area

The forested landscape is located in a rural area in northwestern Portugal. It is characterized by numerous small private holdings. To solve the problem of forest management in such a landownership structure, several actions have been taking place in order to promote joint management over the past several years. Among those, the “Zonas de Intervenção Florestal” (ZIF) are areas that group small private owners around a common management plan. The study covers two ZIF areas, Paiva and Entre-Douro e Sousa (here designated as ZIF_VS). It is composed of 1976 stands and occupies an area of 14,388 ha. The dominant species is eucalypt (mostly Eucalyptus globulus Labil). Pure eucalypt stands extend over 66% of the area. There are mixed stands of eucalypt and maritime pine (Pinus pinaster Ait.) as well (33% of the ZIF_VS area). Hardwood species represent about 1% of the stands and are mostly chestnuts. The cooperation among owners is key to addressing landscape-level objectives such as the reduction of wildfire risk. Nevertheless, the challenge to developing a joint management plan calls for tools that may provide and distribute information about alternative courses of action and help owners and other stakeholders negotiate solutions.

2.2. Stakeholder Involvement in wSADfLOR Development

ZIF Paiva stands belong to 185 associated landowners while ZIF Entre-Douro e Sousa has 191 associated landowners. A local forest owners association is responsible for the development of its joint management plan. A group of 18 stakeholders-seven land owners, six forest managers, two administrators, two consultants, and one researcher-, was selected with the support of this association to participate in a workshop to demonstrate the functionality of wSADfLOR, to assess its usefulness and ease of use and to get input to enhance the system. Sixteen stakeholders had more than four years of experience in the forestry sector, 10 had participated in more than three research and development projects, and 7 had used DSSs more than three times. The workshop was co organized by the forest owners association and the research team and it involved four facilitators. The latter had expertise and experience of developing and applying forests management decision support tools. The workshop took place in a room as this facilitated the communication of information between stakeholders in order to address the workshop objectives. The workshop started with an introduction to the system and its main components. This was followed by a session when stakeholders had the opportunity to work with it. They tested all the functionalities of wSADfLOR and used all the modules from the visualization of the management area to the data analysis of the results with the support of the researchers when necessary. Afterwards, all 18 stakeholders answered the assessment questionnaire. The objective of the questionnaire was to learn how this group of stakeholders perceived the user-friendliness and utility of wSADfLOR. Stakeholders were asked to respond to survey questions using a 7-point Likert scale. For summarizing the survey results, answers to each question were grouped into three categories: 1–3, 4, and 5–7, representing negative, neutral, and positive answers, respectively. The involvement of the stakeholders has been deemed relevant for the evolution of wSADfLOR. Suggestions from stakeholders were considered over the course of the development process.

2.3. The Strategic (i.e., Long-Term) Forest Management Planning Problem

In order to test and demonstrate wSADfLOR, we consider the ZIF_VS landscape-level management planning problem. Its temporal horizon extends over nine 10-year planning periods. The simulation of stand-level prescriptions considers management options (e.g., range of rotation ages, species conversion options, fuel-treatment scheduling options) considered by stakeholders [29]. The set of ecosystem services to be provided by ZIF_VS was defined by stakeholders, and it includes eucalypt pulpwood and maritime pine sawlogs as well as hardwood sawlogs (mostly chestnut), carbon storage, and biodiversity. In this management planning problem, wSADfLOR is used to help stakeholders explore the criteria and decision spaces, namely through the presentation of tradeoff information on ecosystem services. In turn, stakeholders provide input regarding the easy of use as well as the usefulness of wSADfLOR to support that exploration and the solution of the forest-management planning problem. A questionnaire was designed for that purpose.

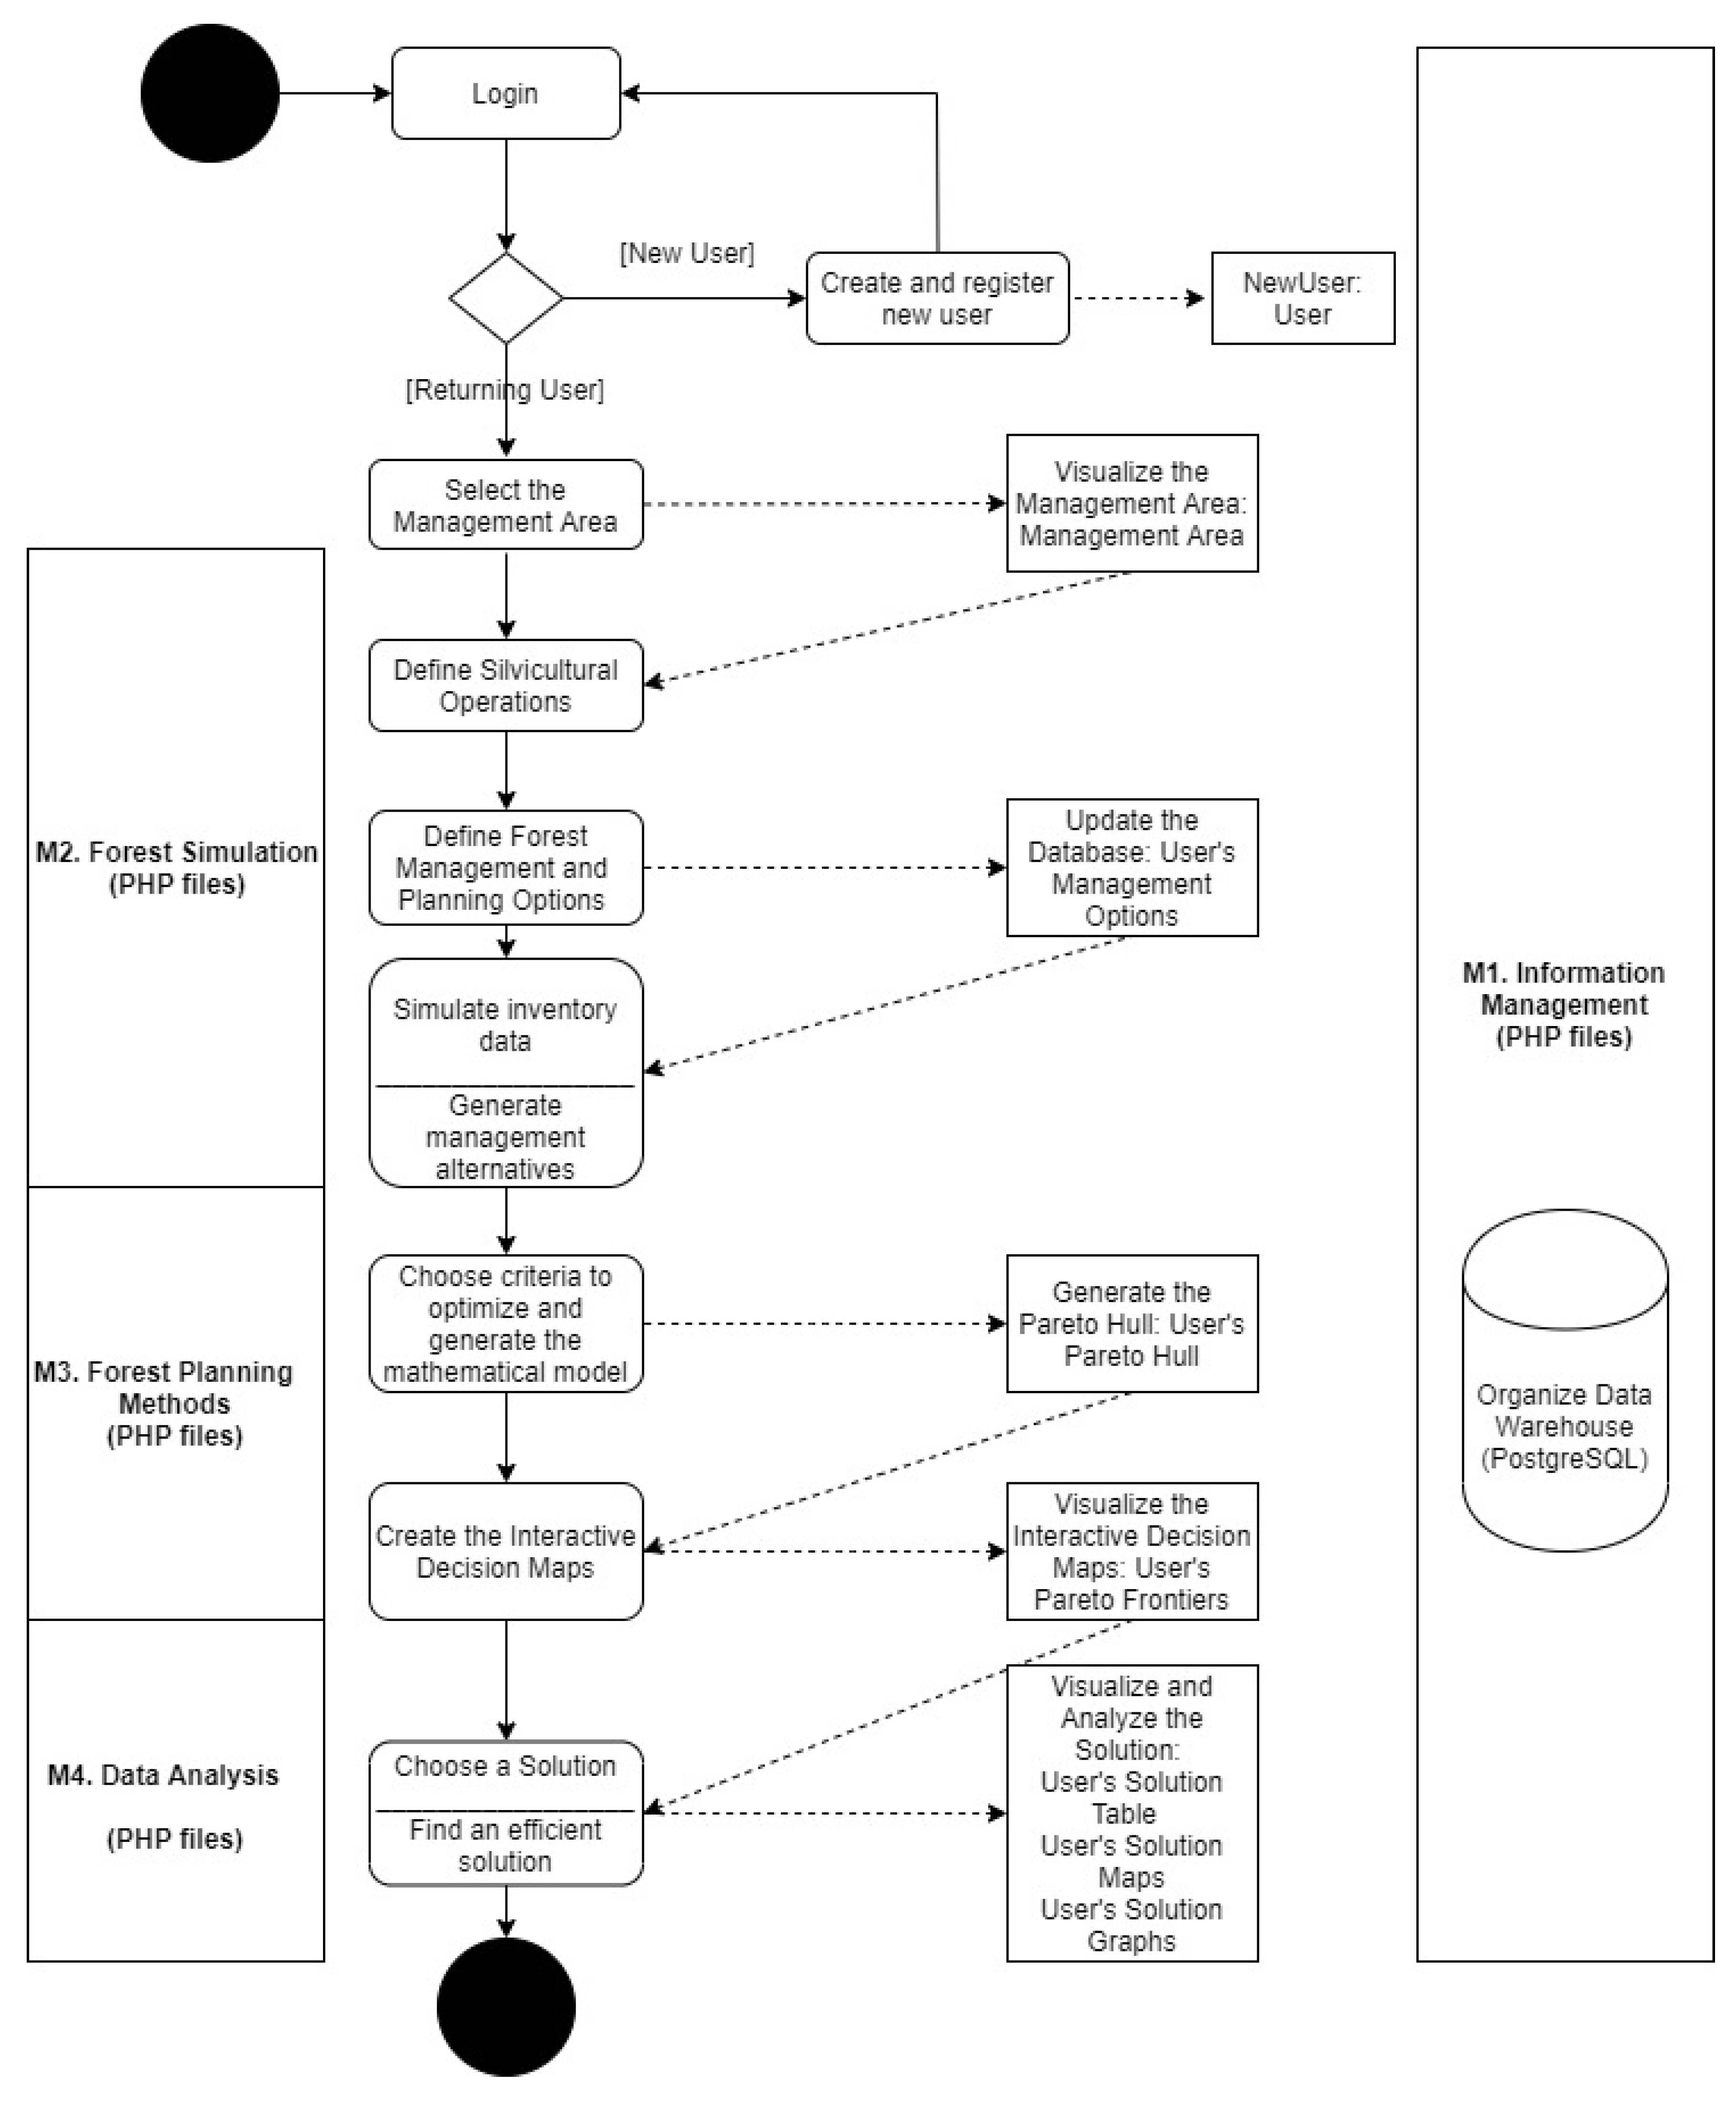
2.4. Web-Based DSS wSADfLOR’s Structure and Modules

The wSADfLOR architecture (Figure 1) builds from PC-based versions of the DSS [34,41,42] to develop a web-based functionality that provides remote access to forestry data and information, to forest models, and to management planning methods. The emphasis is on an architecture that facilitates participation of stakeholders in the analysis of trade-offs between ecosystem services and in the negotiation of forest management plans. The Diagram of Activities ofwSADfLOR (Figure 1) highlights the functionalities and the main relationships between the system components. They were implemented using PHP version 5 and JavaScript version ECMAScript 2015 and are described in the following subsections.

2.4.1. Information Management Module

The information management module (wIMM) in wSADfLOR includes a database and PostgreSQL procedures to provide all the data management needs of the system. It includes the routines for the authentication of login data and for delivering all data and information to the other modules. It currently stores and organizes data from 2130 forest inventory plots (339 maritime pine, 1723 eucalypt, and 68 hardwood (mostly chestnut) trees), in the ZIF_VS management planning area. It also stores forest operations data (e.g., labor and other resource requirements to implement management options and the corresponding cost) and prices.
Basic spatial attributes and neighborhood relations of the 1976 stands have to be taken into account when building a strategic forest plan intended for use by landowners. Therefore, the information management module includes a GIS component to provide accurate, precise, and relevant information to decision makers for correct perception and interpretation of the main characteristics of the forests, and consequently of the results of the strategic plan when displayed in maps.
The data and information in the wIMM are accessed through various wGUI forms (Figure 2 shows an example form) that trigger the retrieval of data and information and its display in maps, graphs, or tables. The wGUI was developed with Keyhole Markup Language (KML) stand files in Google Maps. KML files for stands were created with the QGIS qgis2web plugin and the Google Fusion Tables application. The latter allows users to upload tabular data files (spreadsheets, CSV, and KML). KML stand files use a tag-based structure nested within elements and attributes based on the XML (Extensible Markup Language) standard. This format is useful to show geographic information in Google Maps applications. The wGUI uses these applications to display relevant stand information in various ways (e.g., charts, maps, and timelines).

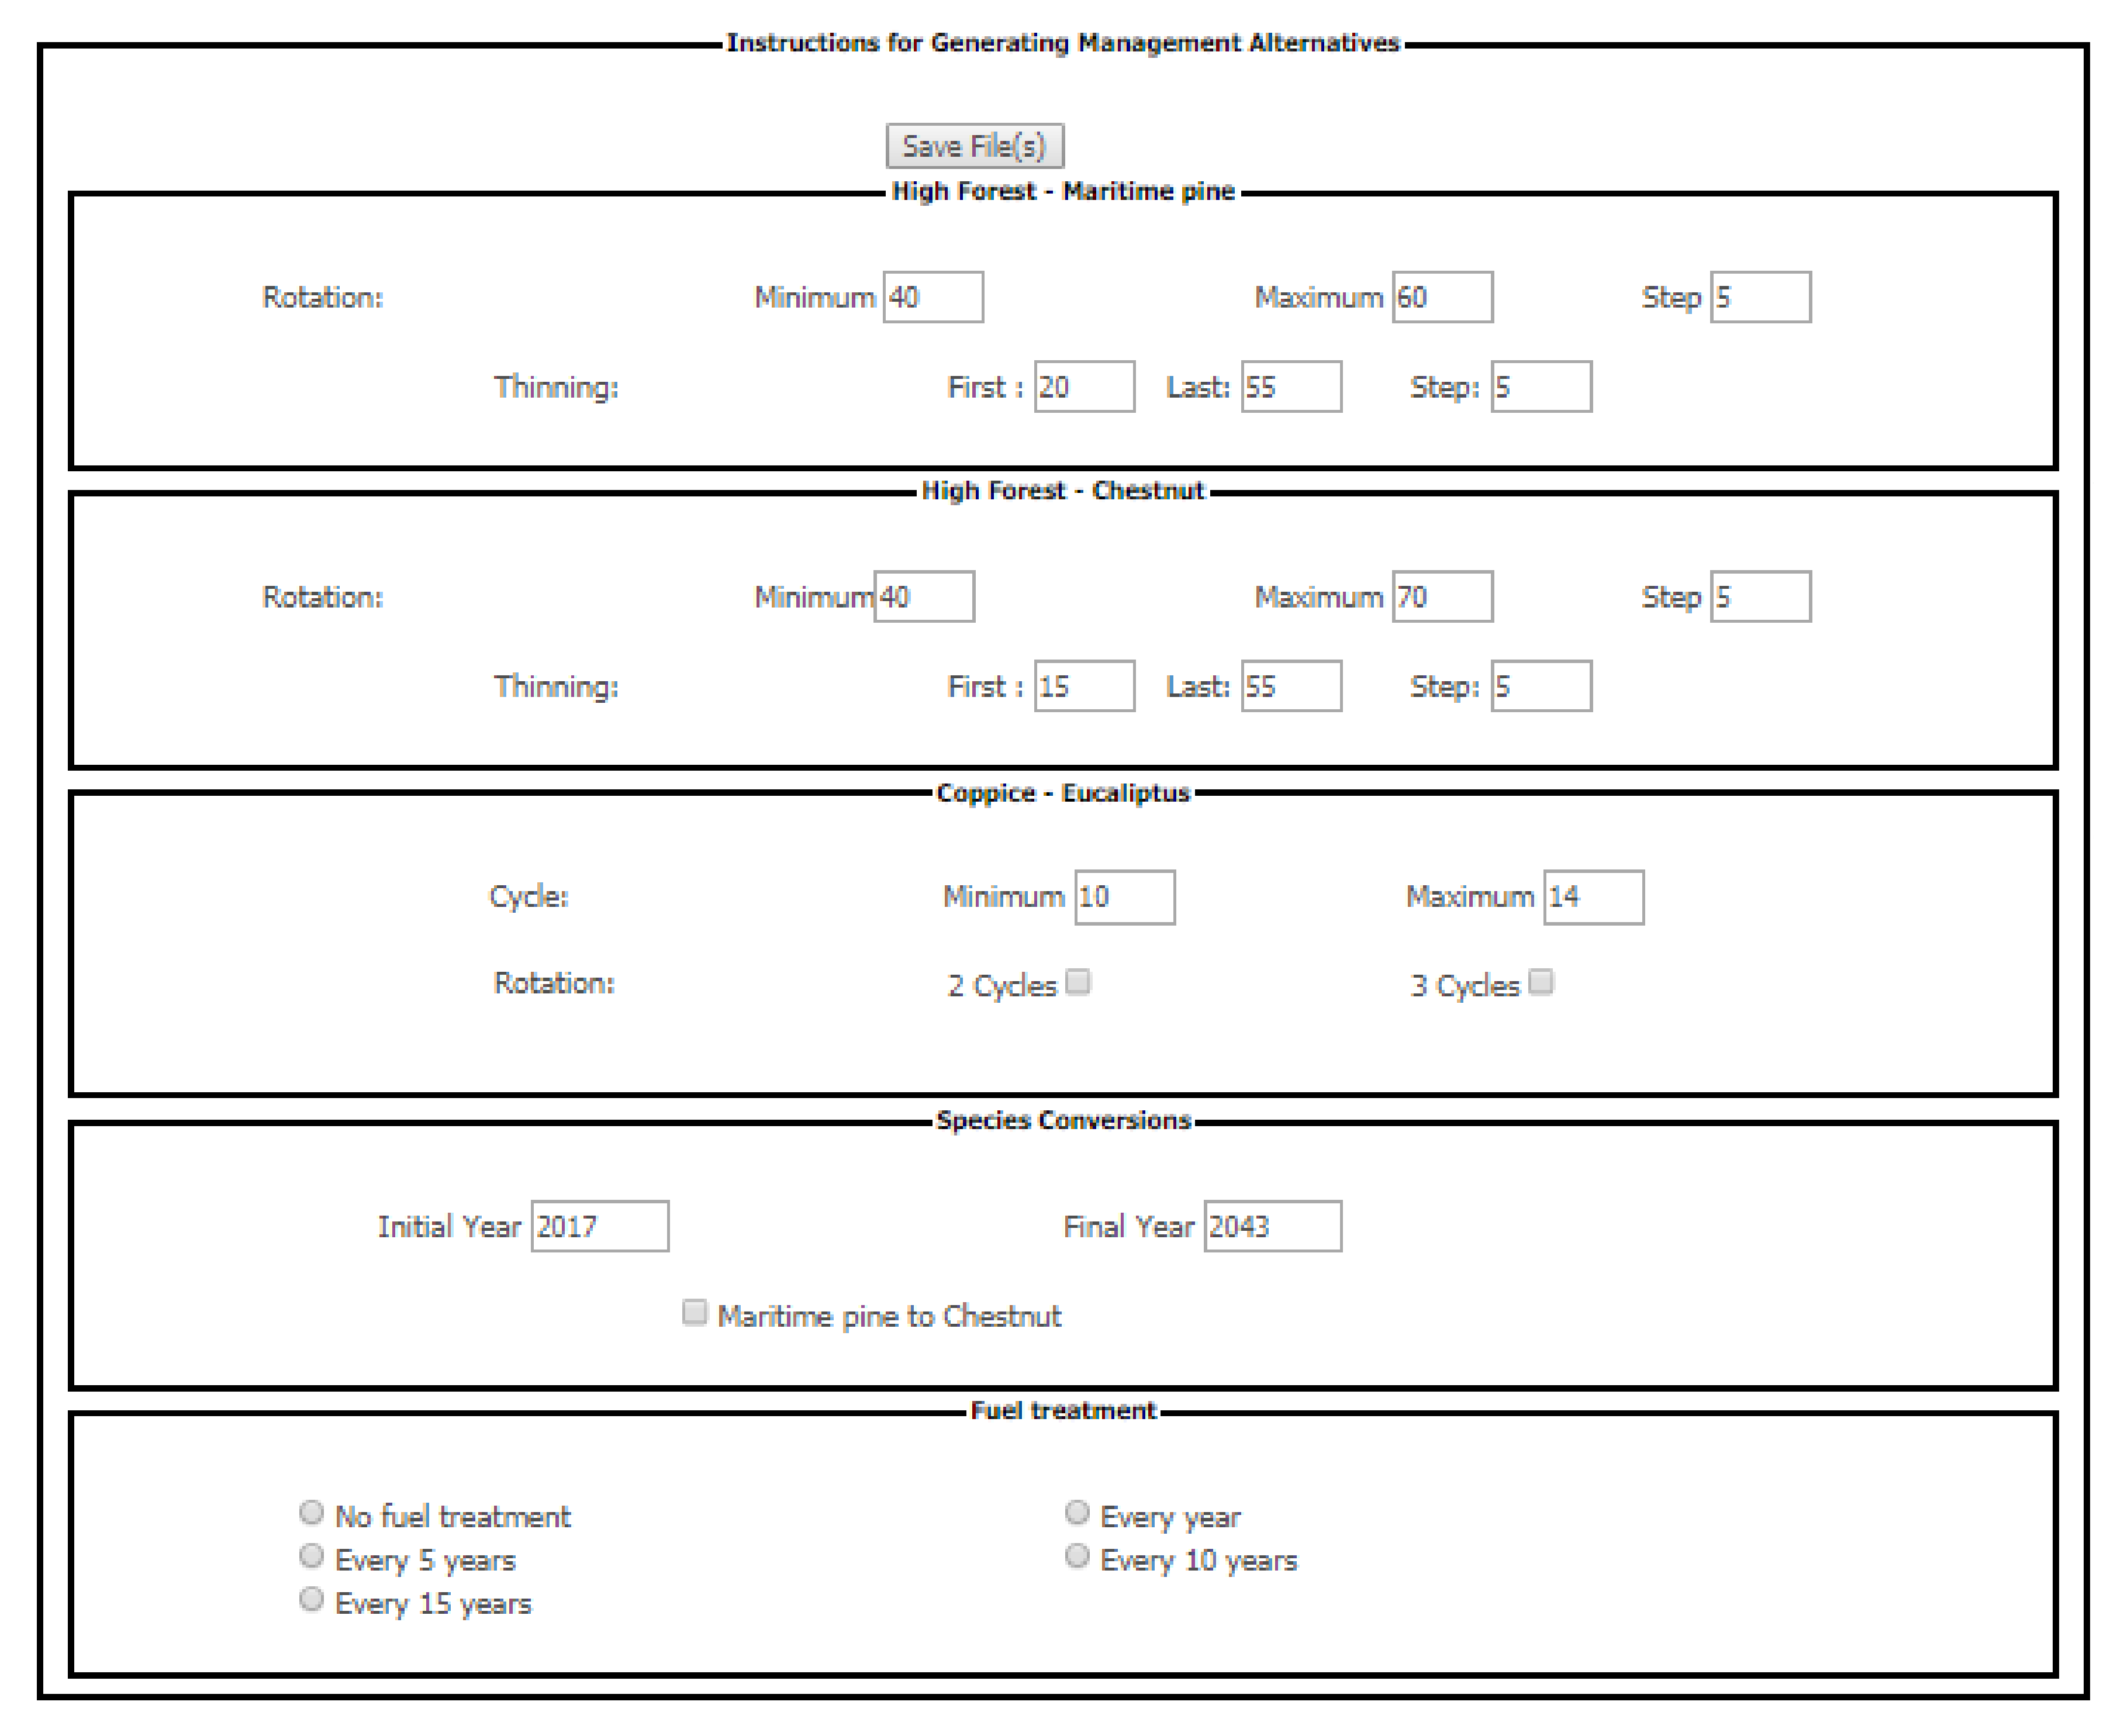
2.4.2. Forest Simulation Module

The wSADfLOR forest simulation module (wFSM) encapsulates growth and yield models in standalone executable simulation files, whose outputs are included in the data warehouse and interact with the PHP programmed files. It is used to define silviculture models and to generate management alternatives (Figure 1). The standsSIM simulator [12] is useful to project stand growth and estimate wood product yields and carbon storage values. It also encapsulates models to estimate the value of stand-level biodiversity [37] and wildfire resistance indicators [43,44]. It simulates stand development under alternative stand-level prescriptions-sequences of silvicultural operations-according to management options specified by the user. The wGUI includes forms developed in PHP language for the user to trigger the generation of stand-level prescriptions over the planning horizon by inputting thinning regime options, rotation ages, species conversion, and fuel-treatment scheduling options as well as the extent of the planning horizon (Figure 3). In Figure 3, we only consider management alternatives for Eucalyptus globulus, Maritime pine, and Chestnut, because these are the most representative species for our case study area, but the wGui is easily configured for other species landowners might want to consider. The example below shows the instructions to generate a set of prescriptions for maritime pine, combining thinning and clear-felling ages (e.g., 40, 45, 50, … 60). In this example, the wFSM assumes that the last thinning occurs 5 years before the rotation age if the latter is less than or equal to 55 years. Moreover, the wFSM reads from the wIMM information about the stands where a species conversion (pine to chestnut) may take place. Finally, in this example, the user may specify a single fuel-treatment schedule to be applied over the whole planning horizon.
The wFSM is also used to generate the resource capability models (RCMs) [45] for the forest ecosystem management planning problems. The former consists of sets of mathematical equations in which prescriptions correspond to the decision variables. The coefficients of the decision variables in each equation describe the contribution of each prescription to the provision of each ecosystem service—namely pine wood, eucalypt pulpwood, chestnut sawlogs, volume of the ending inventory, carbon sequestration, wildfire resistance, and biodiversity—in each period of the planning horizon. Thus, the RCMs correspond to the decision spaces of planning problems for forest ecosystem management. These decision spaces are generated according to the silviculture options selected on the wGUI (Figure 3). Its input by the user triggers a call to functions in PostgreSQL as well as to functions coded in PHP in order to generate the full set of equations that describe the decision space. This set of equations is stored in a LP-format (extension for linear programming) file. The linear programming (LP) model is built according to the choices of the decision maker, considering whatever ecosystem services are of interest, and includes a set of equations, one for each management unit, which guarantees that only one prescription is applied to manage a polygon.

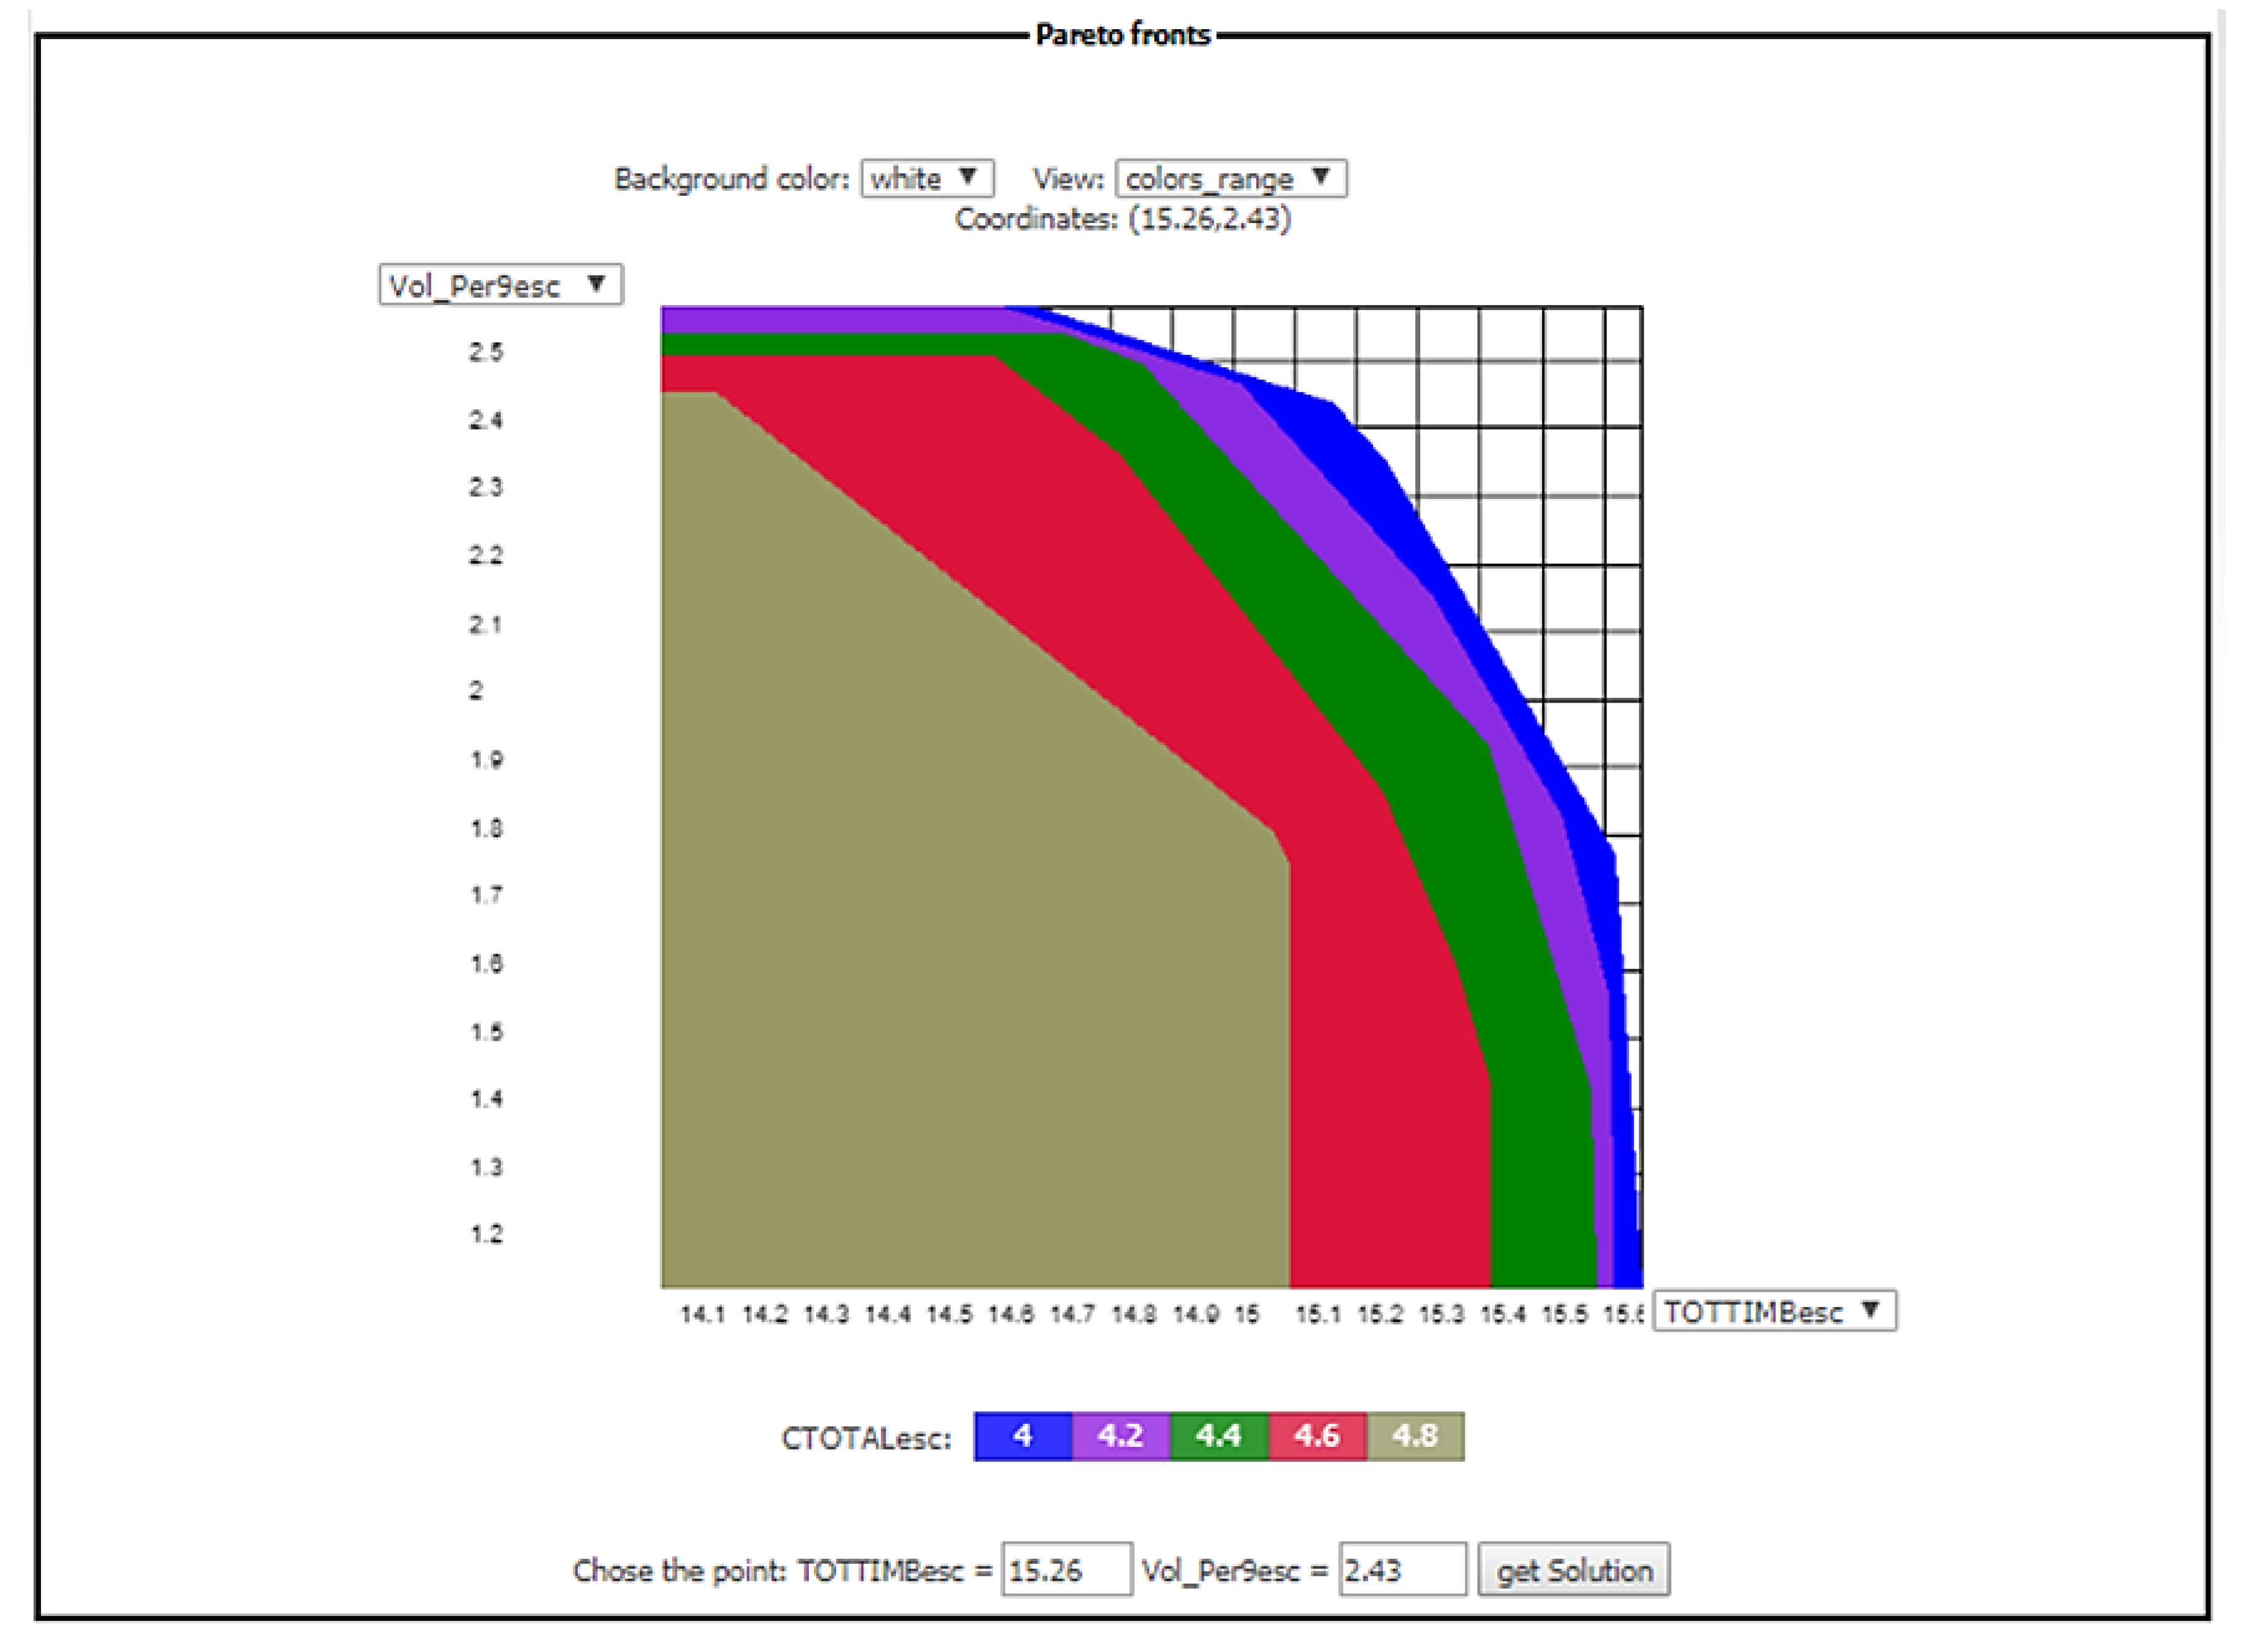
2.4.3. Forest Planning Methods Module

This module (wFPM) was developed mainly with HTML, JavaScript and PHP software. It reads the decision-space file written by the wFSM. The decision-space file and the coefficients of decision variables were previously calculated in wFSM or generated with some routines in PHP and PostgreSQL using data from wFSM. It also reads information provided by the user through the wGUI to define the set of management planning criteria and the policy model (Figure 4), which prescribes a set of management operations and policies for managing forest stands. This information is processed by PHP routines in order to develop the equations of the mathematical model (Figure 1). In this application of the system, the set of criteria includes eucalypt pulpwood, maritime pine sawlogs, chestnut sawlogs, carbon storage, biodiversity, wildfire resistance, volume of the ending inventory, and net present value. The latter may include conditions regarding product and revenue flows or the fluctuation over the temporal horizon of any indicator of an ecosystem service.
This information is translated by the wFPM into an input file that can be read by several off-the-shelf mathematical programming (e.g., linear programming, goal programming, mixed integer programming) routines and software (e.g., CPLEX or GLPK). GLPK was included as it is freeware that may be used to solve simple problems. The structure and contents of this linear programming (lp) file were defined so that it may also be read by a set of Pareto frontier method routines to provide information about criteria tradeoffs. The reader is referred to [28] for a description of the mathematical approach to generate the feasible set in the criteria space. In this DSS, this set is built by an iterative procedure developed in C++, which runs as a standalone executable application. The wGUI enables the user to input constraints with respect to minimum and maximum criteria values for the planning horizon. The set of routines includes linear programming solvers to address the series of auxiliary optimization problems needed to develop the Pareto frontier method. They also include a PHP implementation of the Gift Wrapping Algorithm for building Convex Hulls [46] to generate decision maps. The wGUI enables the user to define the accuracy of the development of the decision maps and the corresponding Pareto frontiers. These are displayed by the wGUI (Figure 4) so that users can interactively analyze tradeoffs between up to five criteria. Users can use this information to select bundles of ecosystem services by clicking on a point in the Pareto frontier in the wGUI (Figure 4). The system is capable of displaying different projections, fixing some of the criteria. Each decision map displays tradeoffs between two criteria when up to three other criteria are fixed. Each map in a two-dimensional graph corresponds to a value of the third criterion. The system provides the user with sliders to change the values of a fourth and fifth criterion. When moving the slider(s) the decision maps in the two-dimensional graph change. For clarity, we chose to display only up to a maximum of three criteria our examples. This triggers the implementation of mathematical programing routines to report the corresponding forest ecosystem management plan. The results, with the strategic plan for each management unit, are shown in a CPLEX xml format or simply in a .csv flat file, representing all basic variables of the last optimization iteration. The reader is referred to [28,36] for a detailed mathematical description of the Pareto frontier method.

2.4.4. Data Analysis

The data analysis module provides information about the bundles of ecosystem services selected by the user and the corresponding management plans. This information is displayed by the wGUI in the form of maps (KML files), tables, and charts (Figure 1). The wGUI can display information about the set of forest operations as well as about its stand and landscape-level outcomes in any given period of the planning horizon. Outcomes can also be aggregated for the whole planning horizon. The wSADfLOR’s data analysis module complements the tabular results with a map showing the harvested and thinned volume in each 10-year period of the planning horizon. Additionally, a map with the annual distribution of these volumes per age class and species can be presented for each stand. In these dynamic graphical interfaces, the final harvest and thinned volume flows—as well as the carbon sequestered—can also be seen per period of the planning horizon. Finally, a graph with the distribution of standing volume along the planning horizon can also be presented.

3. Results

The decision maker starts their navigation in wSADfLOR with the authentication step. Once authenticated, they can visualize the case study area (ZIF_VS) and analyze some of the characteristics of the management area regarding the initial inventory available for each management unit in the GIS. After that, they decide which silvicultural operations will be chosen to best follow their aims. Because they have done this work, the simulation process will be developed. At the end of the simulation process, the system provides the data structured for building the mathematical model. The mathematical model is built according to the management decisions and criteria chosen by the end user. The Pareto Convex Hull is built by the system in the next step, and finally the interactive decision maps with the Pareto Frontiers are shown. At this point, the decision maker is ready to choose the point which represents their preferences, taking into account the trade-offs (how much we need to sacrifice in the amount of one criterion for increasing the amount of another criterion) and then the optimization process generates the forest management plan. There are also some additional tabular, statistical, and graphical analyses shown, which are related to the plan that has been selected to manage the study area.

3.1. Simulation

In this application, the wFSM was used to generate stand-level prescriptions over a 90-year planning horizon with nine 10-year planning periods. The reader is referred to [29] for more details regarding the selection of management options to generate prescriptions in the ZIF_VS area. The latter are classified into four forest management models—mixed pine and eucalypt with pine as the dominant species (FMM1), mixed pine and eucalypt with eucalypt as the dominant species (FMM2), pure chestnut (FMM3), and pure eucalypt (FMM4). The decision space thus included 59,133 decision variables. Its linear programming formulation encompassed 1976 stand area equations and 46 equations to estimate the landscape-level provision of each ecosystem service over the planning horizon.

3.2. The Decision Support Process

The web version of decision maps developed in wSADfLOR is one important decision tool in this web-based system, and permits several analyses among the criteria to be considered in the optimization process. First, we analyze a trade-off with two criteria to be drawn on an interactive decision map (Pareto frontiers in Figure 5 and Figure 6). Trade-offs were analyzed between average carbon sequestration (105 Mg year−1; CTOTALesc) and total wood (106 m3; TOTTIMBesc) on one hand (Figure 5), and on the other hand between the biodiversity indicator (IBiodiversity) and total wood (106 m3) (Figure 6). In both cases, the opportunity cost to have a greater amount of one criterion is reflected in a lower amount of the other scaled criterion on the efficient frontier of each polygon (considering we are maximizing the two criteria). All the criteria must have similar scales of magnitude to permit a good visualization with Pareto Frontiers, and to make the optimization process more efficient. Therefore, criteria were scaled as necessary. A performance runtime test for all modules of wSADfLOR was done. Running the information management module, namely to display the map with the management area and retrieve stand inventory, takes about 2 min. It takes about 3 min to run activities in forest simulation (using the information available by default). In the case of the forest planning methods module, the running time extends over about 4 min (from which about 2 min correspond to the construction of the Edgeworth-Pareto hull with three criteria). Finally, running the data analysis module takes about 6 min (including about 2 min to show the solution with the management plan). Nevertheless, the computational cost of a specific application will depend on the number of solutions t (e.g., points in the Pareto frontier) that the stakeholders may want to check.

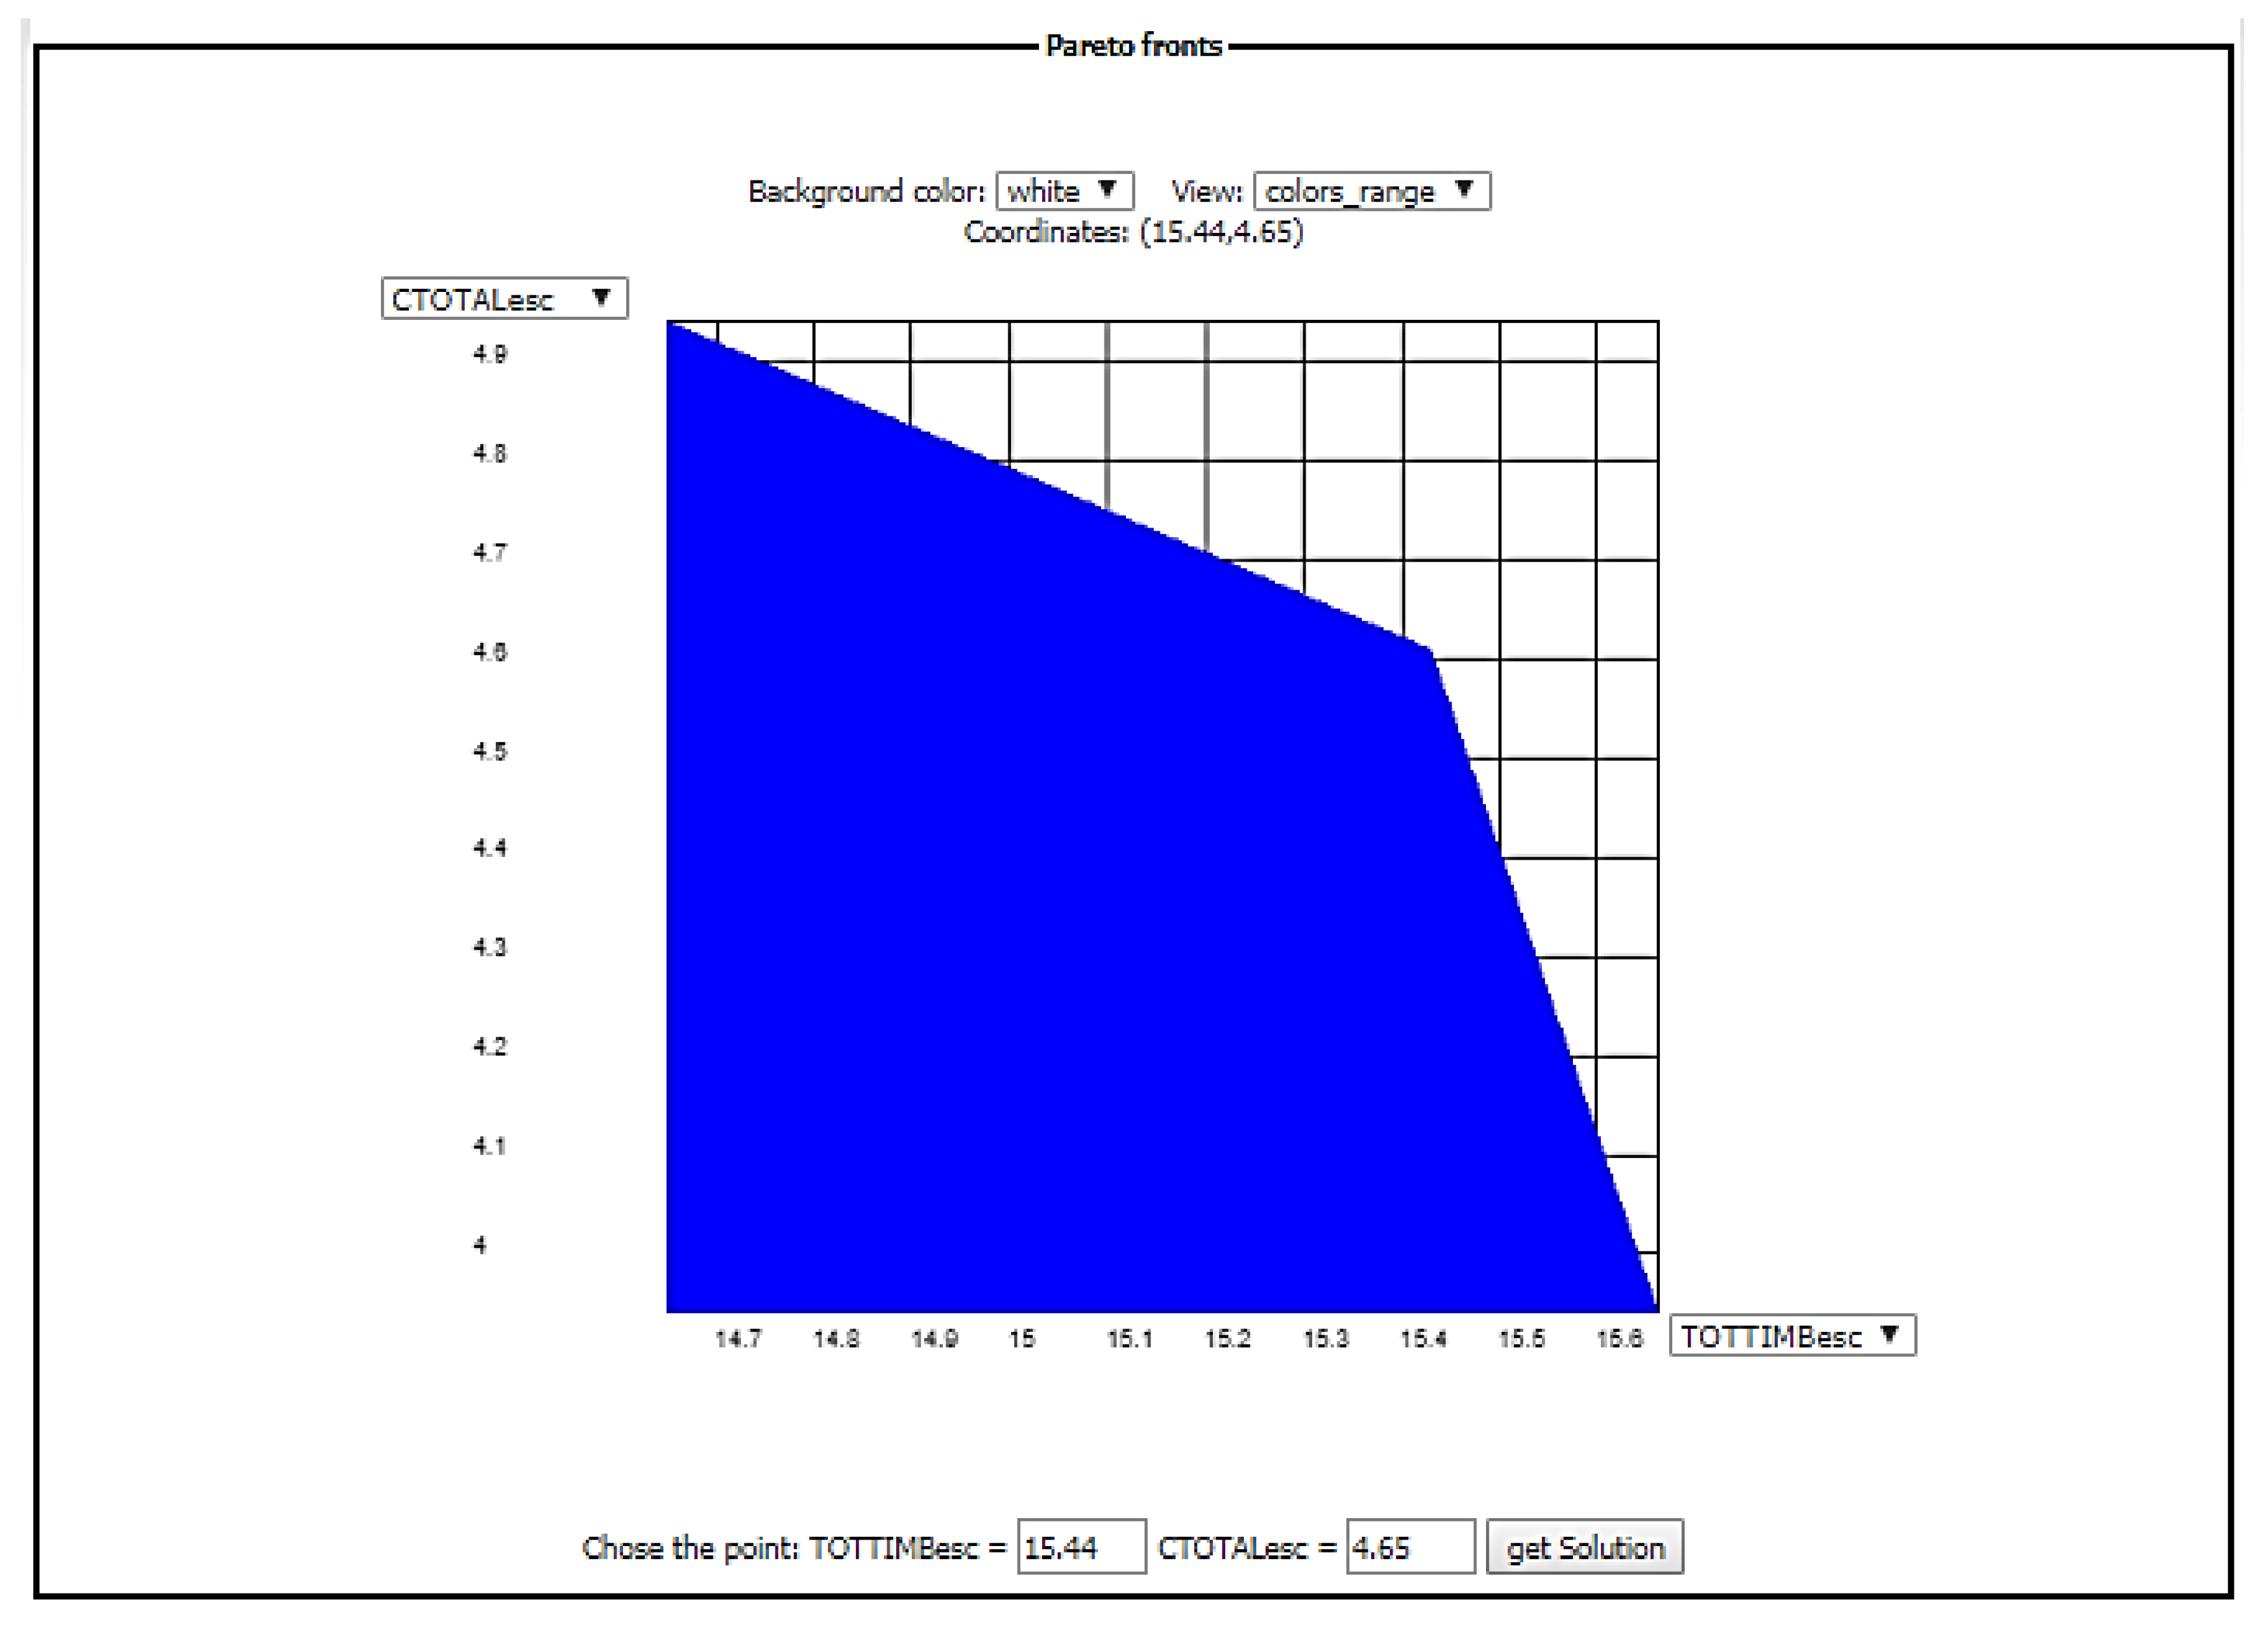
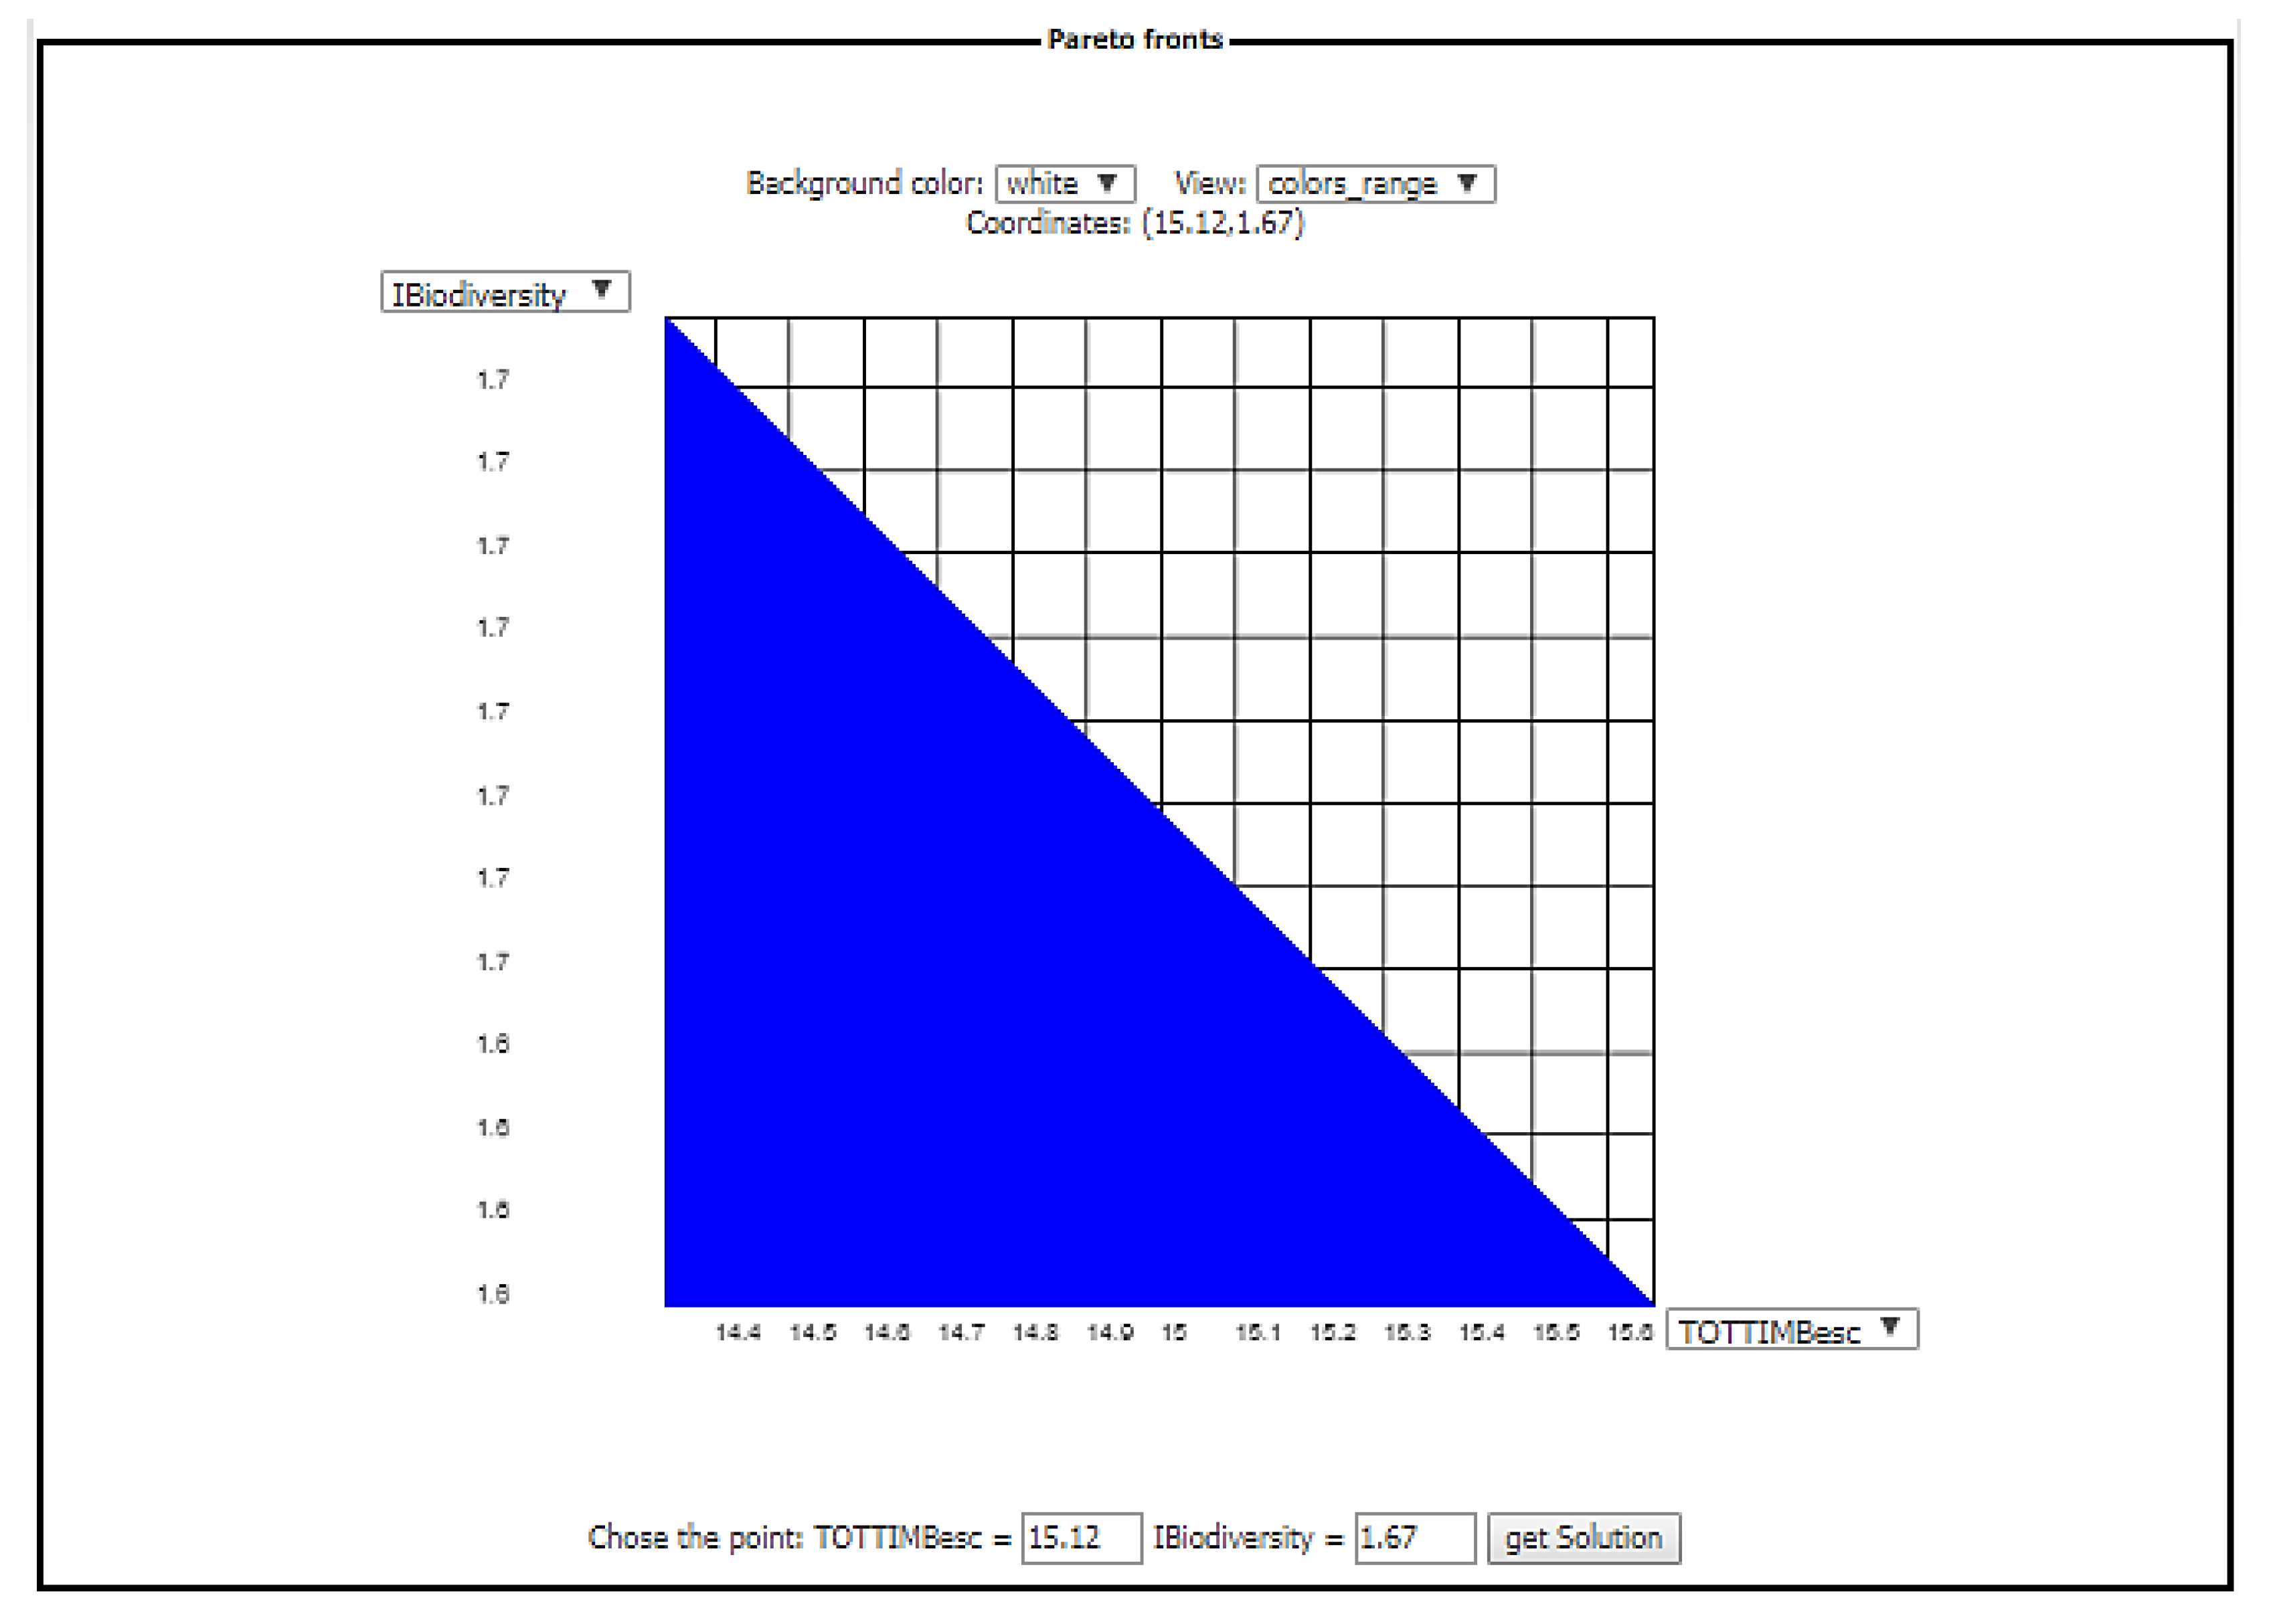
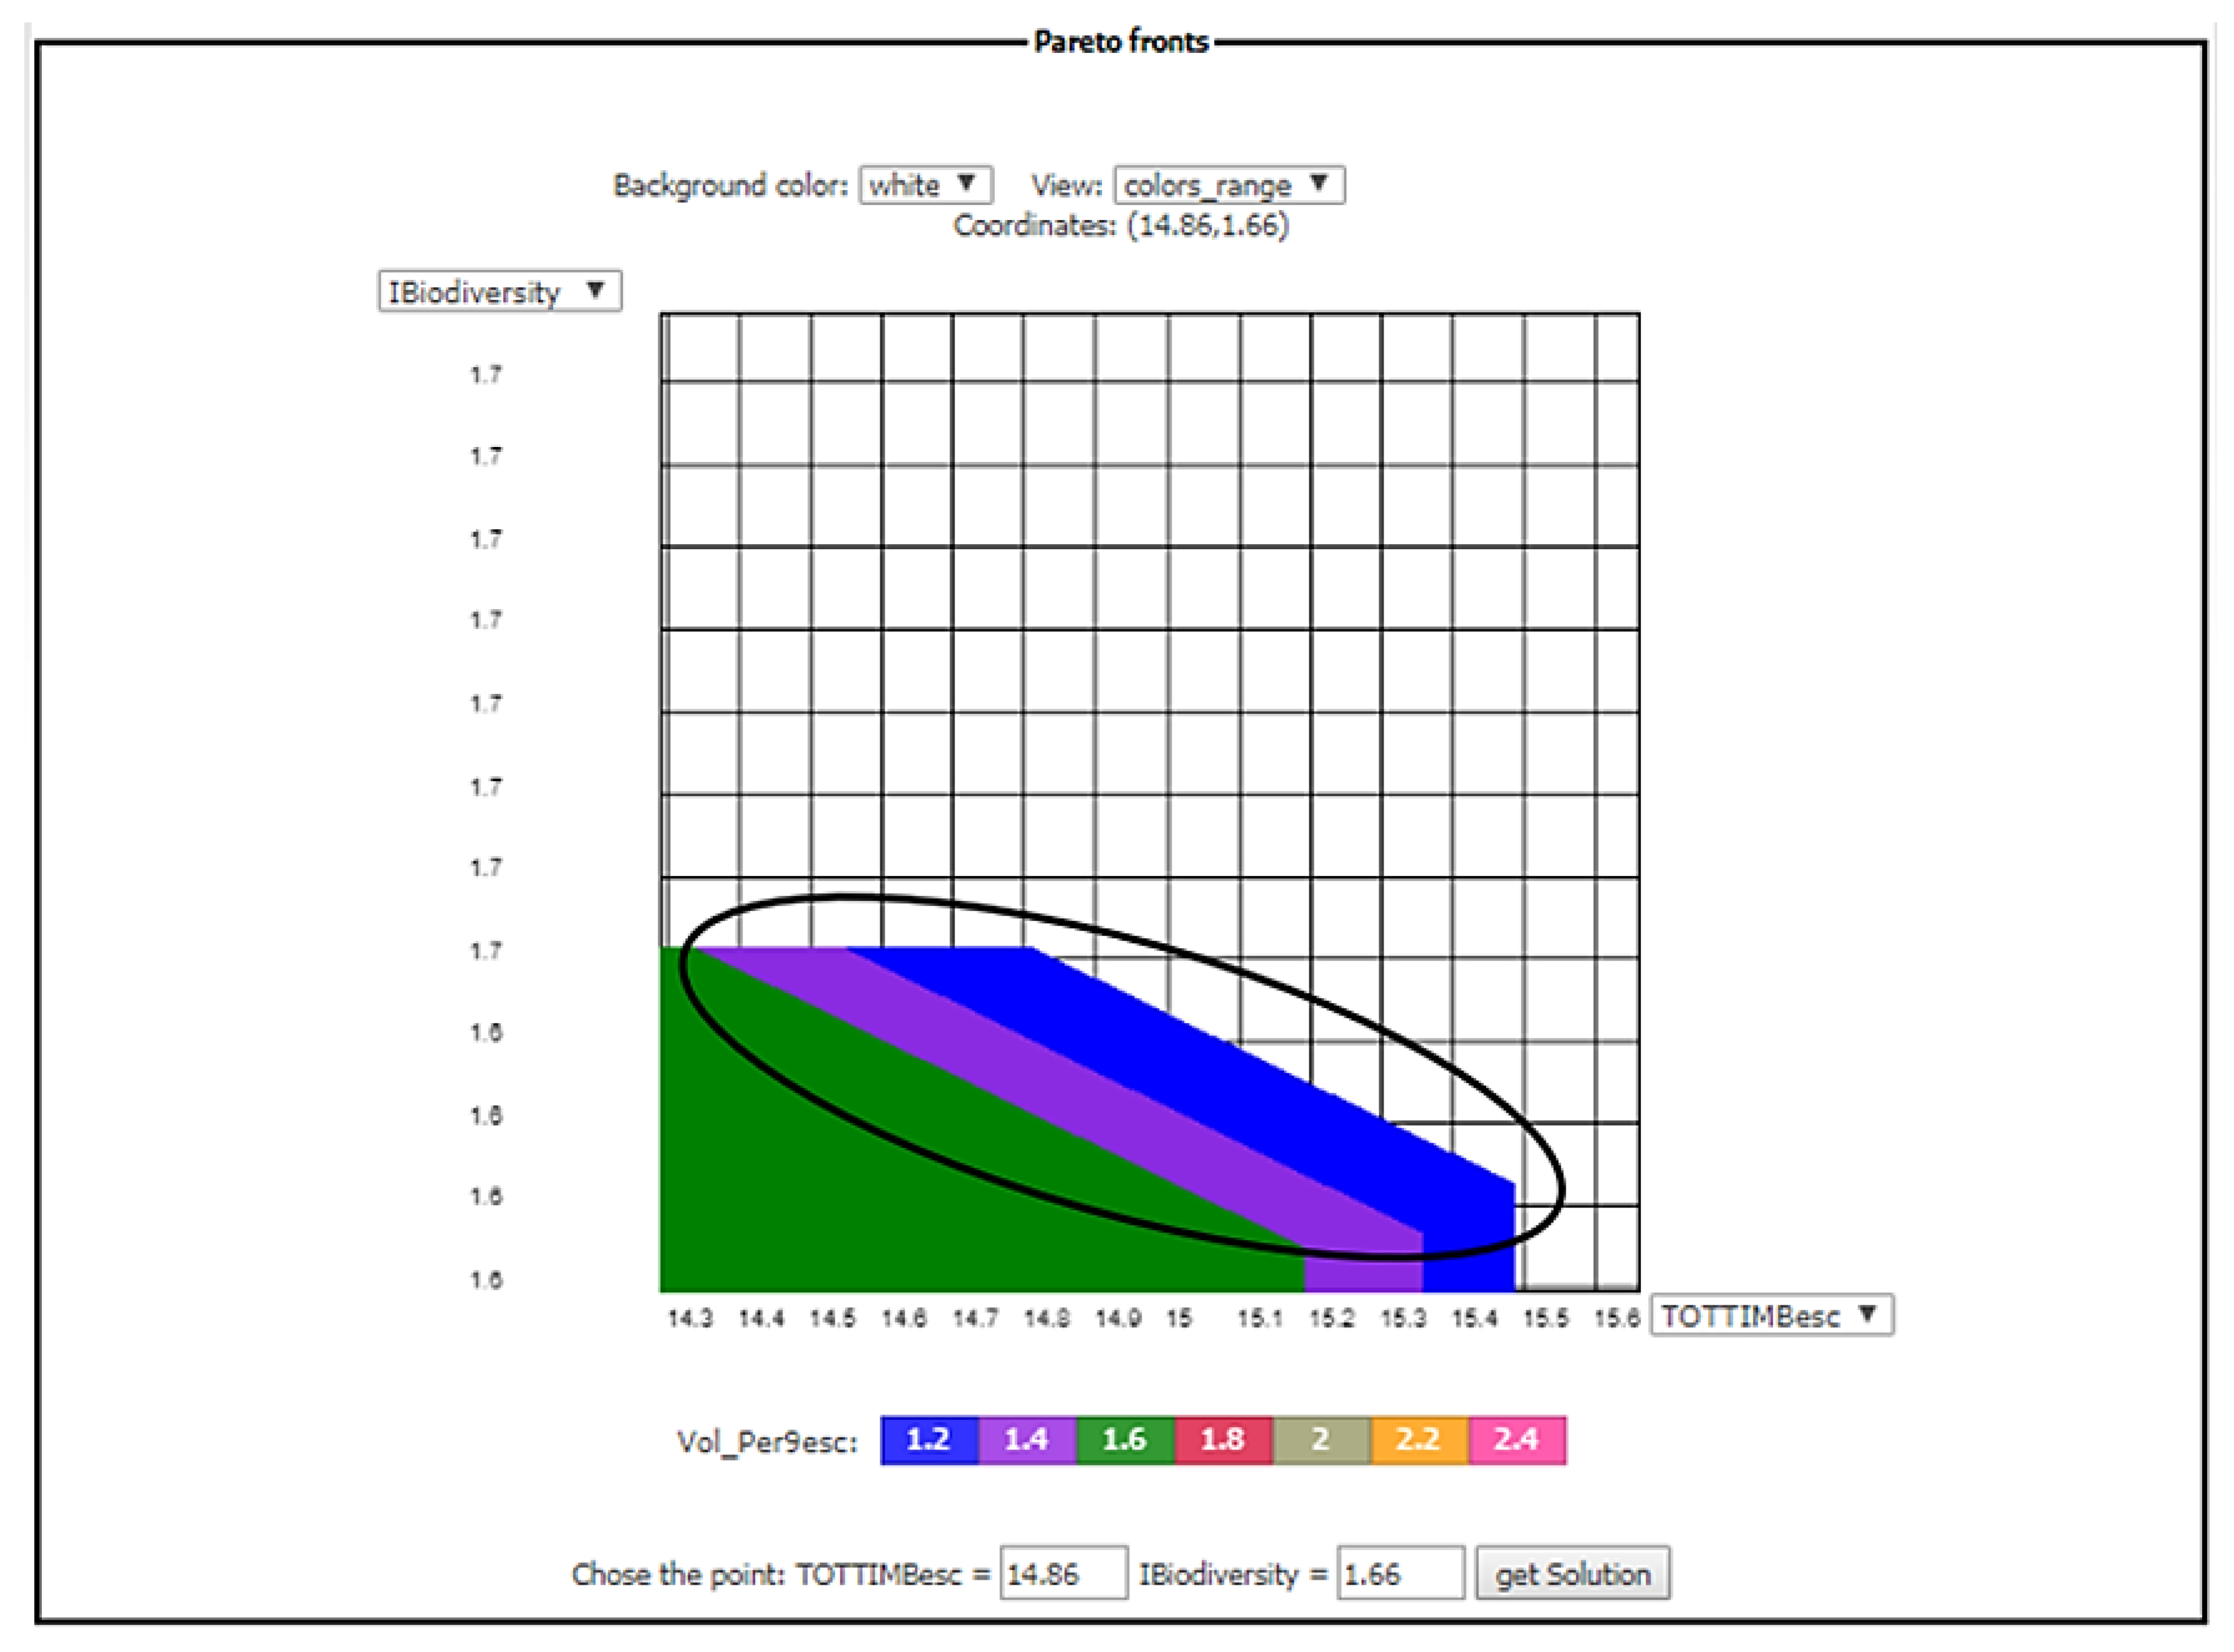
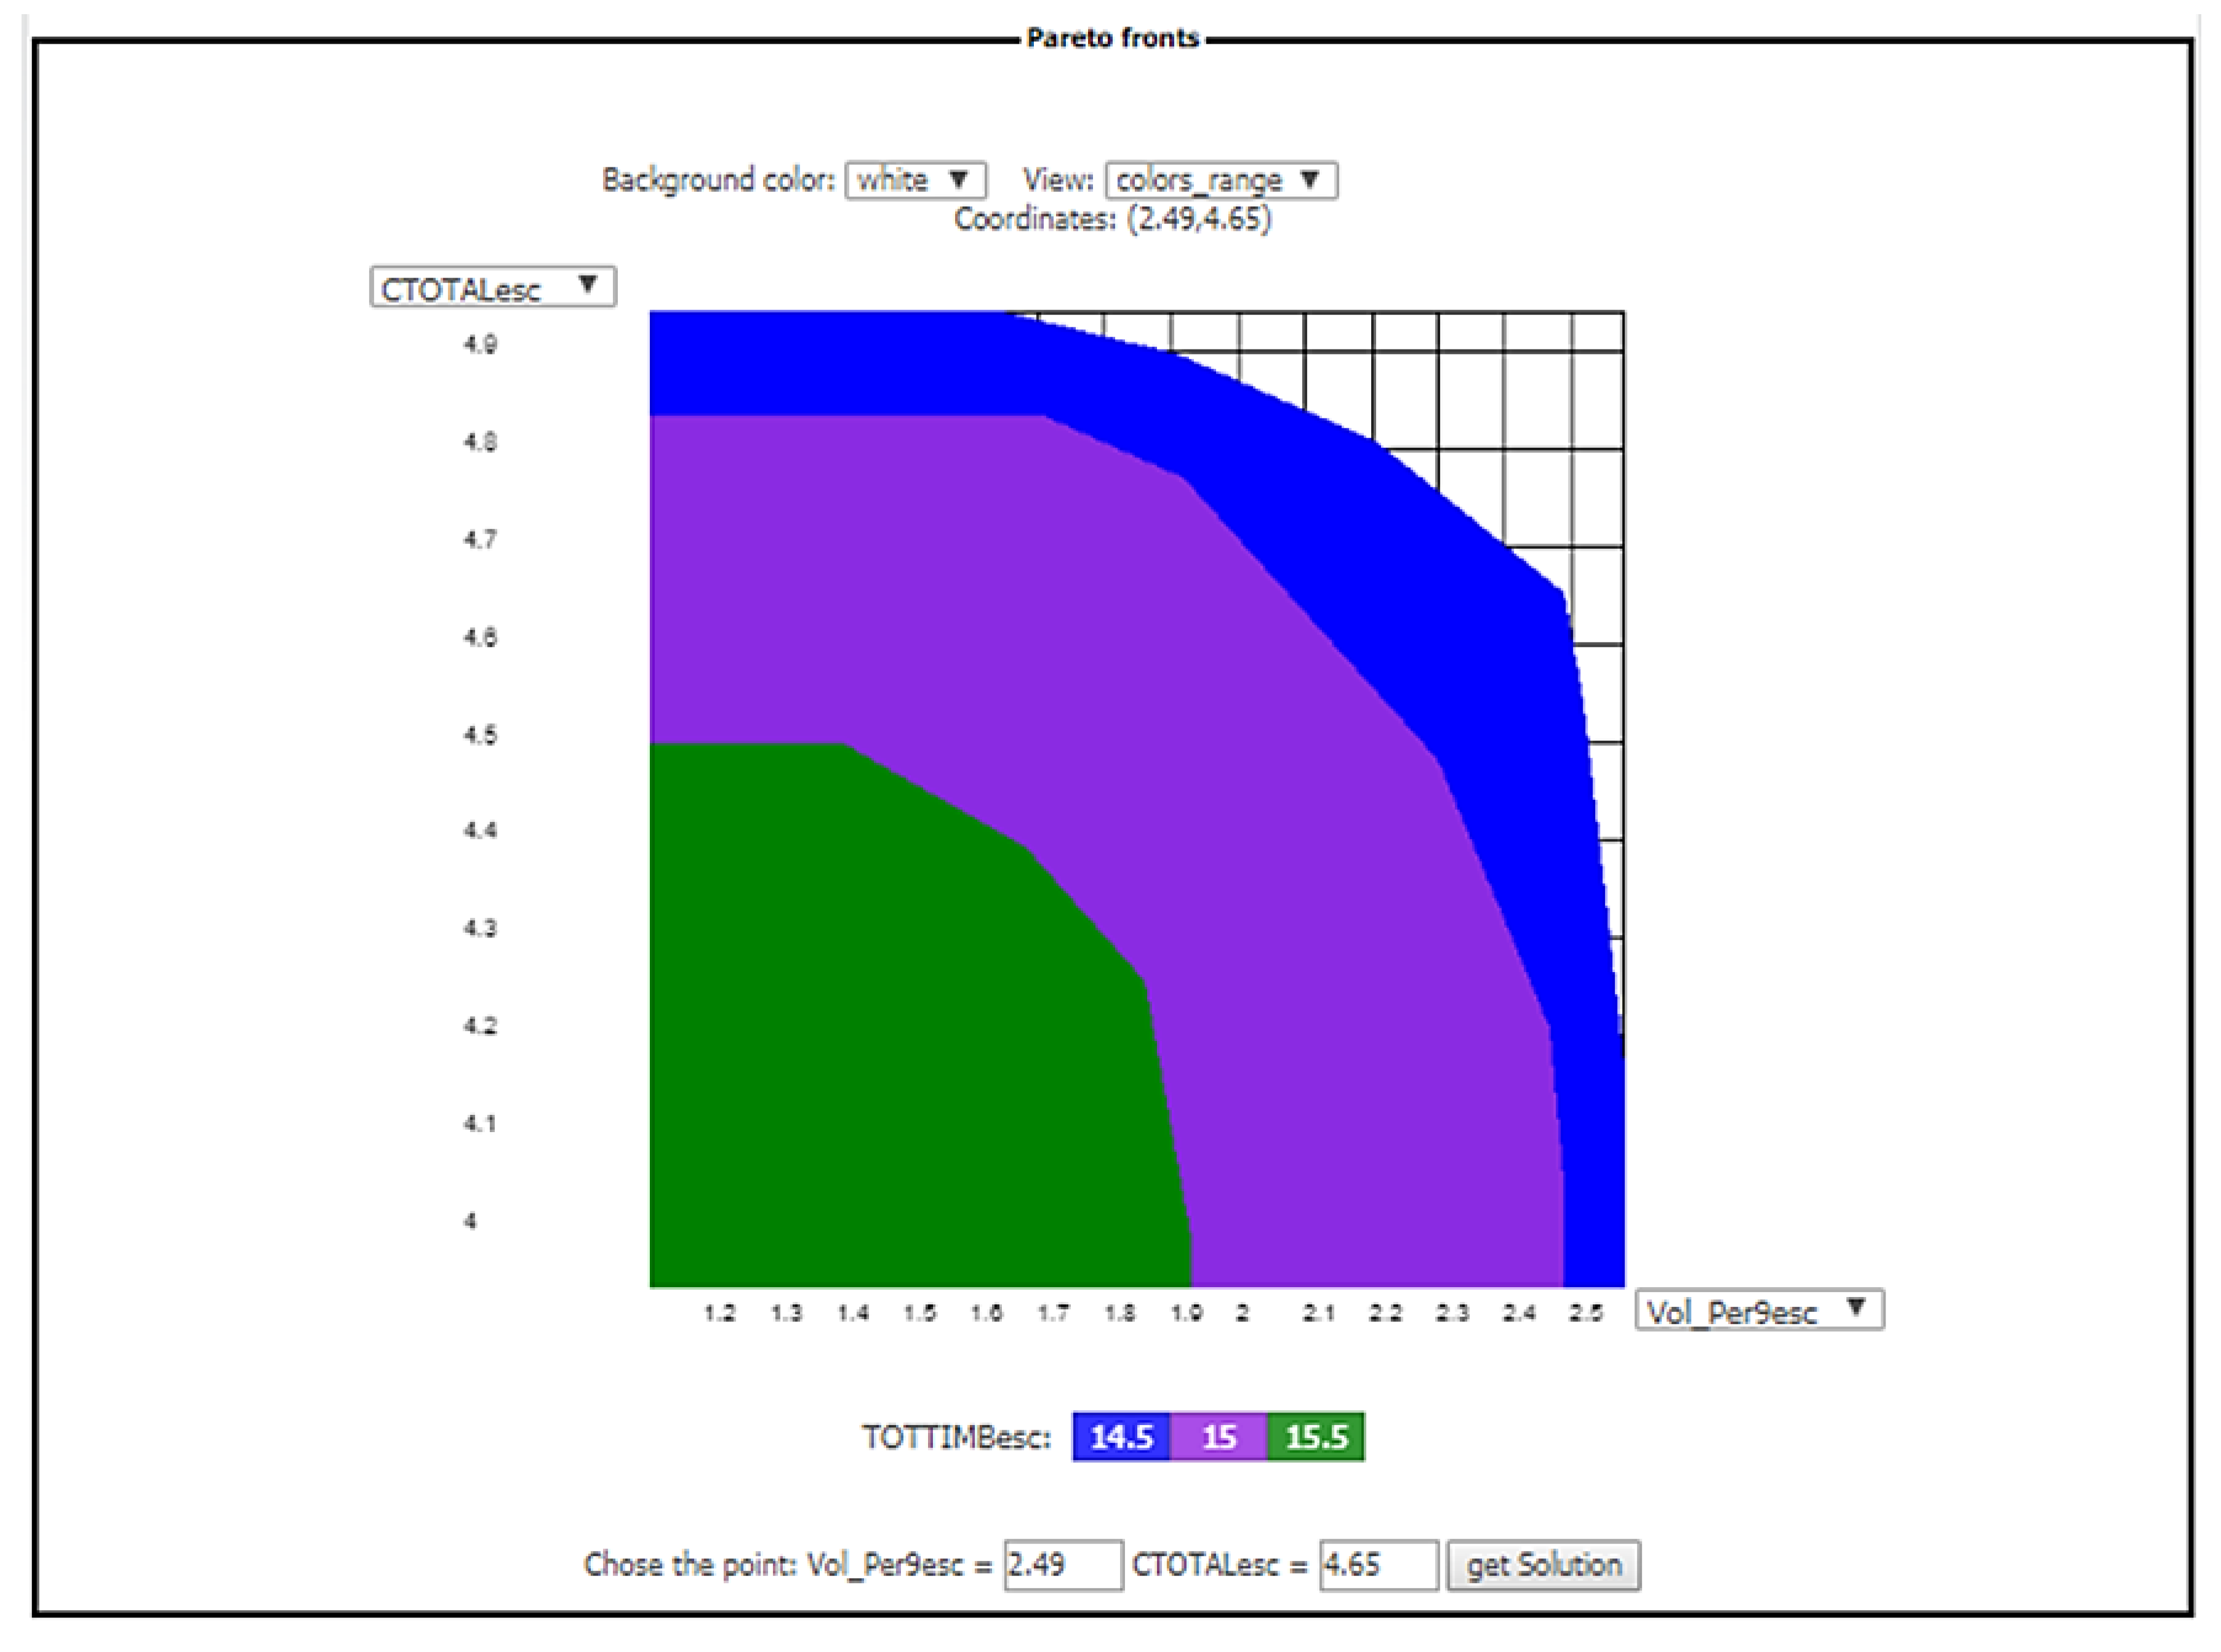
3.3. Interactive Decision Maps in wSADfLOR

The polygon in Figure 6 is closer to the form of a triangle, while the polygon in Figure 5 has four vertices. The biodiversity indicator is a function of species and age, and there is a linear trade-off between total wood and the biodiversity indicator and a small variation of the biodiversity indicator as well. On the other hand, the trade-off in Figure 5 can be easily explained by the correlation between total wood and harvesting, because less trees means less capacity of the ecosystem to sequester carbon. Again in Figure 5, the trade-off is divided into two straight segments; in the segment on the left, if we want to change the amount of total wood from 15 × 106 m3 to 15.2 × 10⁶ m3 (about 1.3%), the amount of average carbon sequestration will change from 4.8 × 10⁵ Mg year−1 to 4.7 × 10⁵ Mg year−1 (about 2%), whereas in the segment on the right, if we want to change from 15.5 × 10⁶ m3 to 15.6 × 10⁶ m3 (about 0.6%), the amount of average carbon sequestration will decrease about 6.8% (from 4.4 × 10⁵ Mg year−1 to 4.1 × 10⁵ Mg year−1). As a result, the slope in the first straight segment is about −0.5 whereas the slope in the right segment is about −3. The common point to the two straight segments is approximately the point (total wood, average carbon sequestration) = (15.42 × 10⁶ m3, 4.61 × 10⁵ Mg year−1).
Next, the analysis is extended to a third criterion (Figure 7 and Figure 8). The volume of ending inventory—the standing volume in last year of planning horizon (106 m3; Vol_Per9esc) was introduced together with total wood and average carbon sequestration (Figure 8). In Figure 7, the third criterion is represented by colored slices indicating different discrete values, which are shown at the bottom of the decision map. Because all criteria are maximized at the same time, the interpretation of the sets of non-dominated solutions is very similar to the one for the previous two criteria (Figure 5 and Figure 6). It is easy to find that the third criterion represented by the scale of colors increases as we are closer to the point with the lowest values for the criteria represented on the axis of each decision map because we are maximizing all the criteria. The non-dominated solutions represented in Figure 7 are on the three straight segments with absolute value of slope greater than 0 and smaller than infinite (inside the ellipse), whereas in Figure 8 it is more difficult to show all the non-dominated sets of solutions. We can find them when selecting all the straight segments for each Pareto frontier that do not belong to the set of vertical or horizontal straight segments that are borders of each slice on the decision map. Some interesting trade-offs are shown in Figure 7 between the three criteria involved, where we can conclude that if we want to choose a greater level for the biodiversity indicator in the ellipse for each fixed level of standing volume in the last year of planning horizon, then we need to decrease the level of total wood. This fact occurs due to a positive correlation of the biodiversity indicator with the age of the trees and species. Then, to get a higher level of total wood, we need to decrease the biodiversity indicator, and for lower levels of total wood we have higher levels of biodiversity and standing volume in the last year of planning horizon. The slope of the three straight segments that are the efficient solutions are the same because they are parallel. So, considering the criteria on the x-axis and y-axis, the amount we need to sacrifice to have a greater amount of the other criterion does not change for different values of the criterion represented by different colors for different values. Relative to Figure 8, we chose only three slices to be represented. For the minimum level of total wood (14.5 × 10⁶ m3) that is represented, the slope changes for each efficient straight segment represented as the Pareto frontier (all straight segments which are nor vertical neither horizontal). For example, if we increase the volume of ending inventory from 2.2 × 10⁶ m3 to 2.4 × 10⁶ m3 (about 8.3%), the average carbon sequestration will decrease from 4.8 × 10⁵ Mg year−1 to 4.7 × 10⁵ Mg year−1 (about 2.1%). However, if we consider higher levels of volume of ending inventory (again for the same level of total wood), there is a greater sensitivity in the supply of average carbon sequestered. A change of the volume of ending inventory from 2.50 × 10⁶ m3 to 2.55 × 10⁶ m3 (2%) is reflected in a decrease in average carbon sequestered from 4.6 × 10⁵ Mg year−1 to 4.2 × 10⁵ Mg year−1 (9.5%). As the volume of ending inventory is increased, the slope of the trade-off with average carbon sequestered becomes more negative and greater in absolute terms. Another relevant point on this trade-off is that as the total wood increases, the volume of ending inventory tends to decrease, and higher levels of total wood signify less trees and then lesser capacity to sequester carbon.

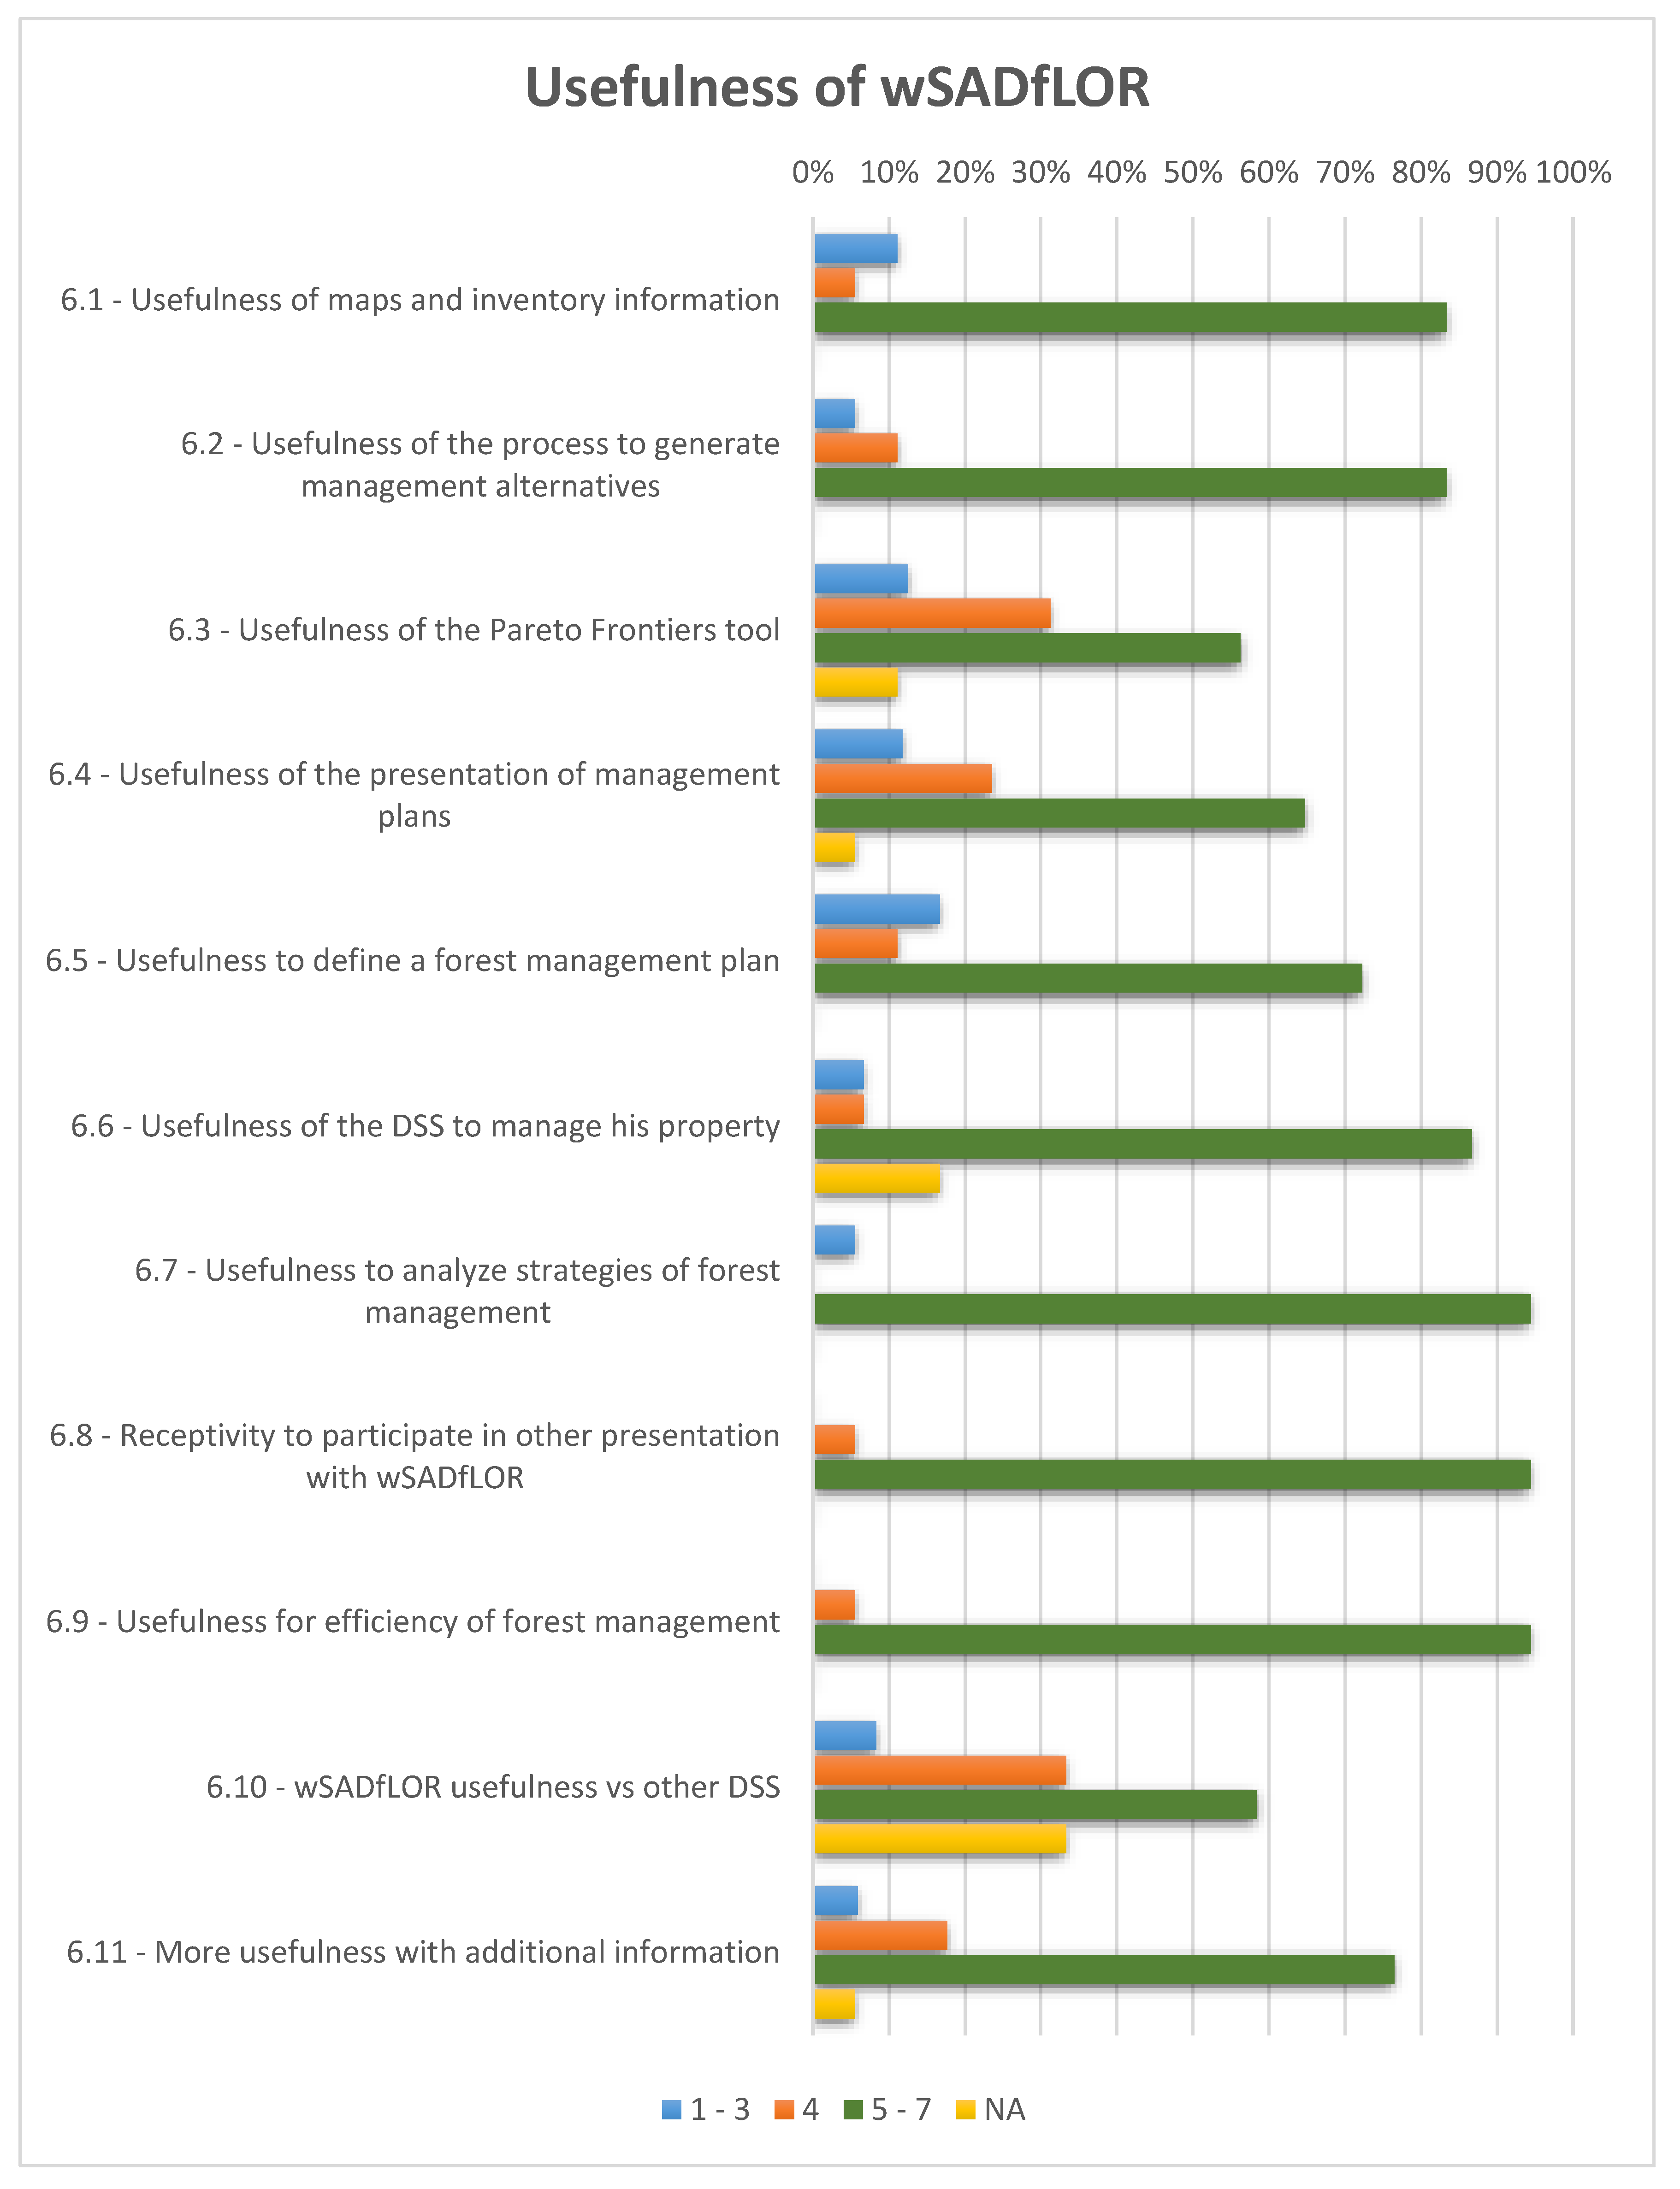
3.4. Stakeholder Feedback on Using the DSS

In this subsection, we analyze the survey responses from those stakeholders, forest managers, and other decision makers (a group of 18 people) who tested wSADfLOR. Results of the survey are presented in terms of ease of use (Figure 9) and utility (Figure 10). Considering all stakeholder responses (Figure 9 and Figure 10), responses to all questions were predominantly neutral or positive. Another general observation is that stakeholder perceptions were consistently more positive with respect to utility (Figure 10) as opposed to ease of use (Figure 9).
Looking in more detail at questions related to ease of use (Figure 9), stakeholders were generally neutral concerning user friendliness of interacting with maps and inventory data, design of management alternatives, and use of Pareto frontiers, but responses were generally positive concerning ease of use related to creation of management plans, overall use of the system, and analyzing management strategies. With respect to utility of the system, very strong positive responses were observed for usefulness of maps and inventory data, the process for generating management alternatives, management of a property, analyzing strategies, and efficiency in forest management. Stakeholders also demonstrated a very strong interest in continuing involvement in participation with wSADfLOR applications.
In order to further assess the functionality of wSADfLOR, the questionnaire included an open section so that stakeholders might provide suggestions for improving the system or for facilitating its use. Most respondents suggested the development of a user guide as well as of further training sessions. Some users were not familiar with Pareto frontiers, but after some training they could better understand this decision tool, found it a very useful tool and manifested interest in working more with it. Moreover, some stakeholders acknowledged the usefulness of the system to support planning processes, while suggesting its expansion to include more models to address other forest species and other ecosystem services. The main questions posed by stakeholders during the workshop were more related to the interpretation of the optimization, decision, and analysis tools of the DSS. Some participants only required assistance with how to interpret the decision and analytic tools.
Finally, lack of stakeholder response was generally very low, the one exception being responses to Question 6.10, concerning the usefulness of wSADfLOR versus other DSS (Figure 10). In the latter case, six respondents had never used a DSS before, and so had no basis for answering the question.

4. Discussion

The wSADfLOR system was built to aid decision makers with preparing forest management plans. Landowners, governmental staff, forest managers, forest consultants and researchers can be potential users of this system as decision makers. The study area used in this work, ZIF_VS, is located in northwestern Portugal, covers 14,388 ha, and involves a very large number of owners. The decision makers have the challenging task of choosing between trade-offs of various forest ecosystem services and products that this study area can provide to them. The tools and methods of this study provide an example for developing similar forest management and decision strategies in other management areas that seek to promote the participation and collaboration of stakeholders (including landowners) in order to create a unique strategic and sustainable management plan that takes advantage of synergies of stakeholders’ similar objectives. We found that the theoretical models and decision models can be put into practical use for aiding stakeholders in decision making tasks. Due to the spatial character of the forest management areas in Portugal in particular, the stakeholders must be alerted to the importance of collaboration. Although the geographically specific results of this study cannot be generalized, the analytical procedures can be easily replicated, and the methodology applied to other management areas.
The architecture of the system encompasses a nuclear module of information management by which the user can see, in a web GIS, all the management units which belong to the study area, and visualize information about each one, stored on the dynamic wGUI. The information management module provides all the needed data and information for the system, as well as interacts directly with the forest simulation module for the generation and manipulation of data to build the data matrix for forest management alternatives, which is then used to build the mathematical decision problem. Because the decision problem was built, the wGUIs on the forest planning methods module can help to choose among different decision maker’s preferences for managing the study area. In the latter module, a Pareto frontier tool is available to show different configurations of trade-offs generated by the choices of the decision maker. The last module, the data analysis module, is useful for providing tabular, graphical, and GIS analysis of chosen amounts of forest ecosystem services and products according to the consensus solution.
In the past, decision support systems or tools similar to wSADfLOR were built and analyzed, namely a desktop version of a Pareto frontier approach [34] and a hybrid system to get consensus solutions when decision makers do not agree on a unique solution [47]. These authors emphasized the need for web-based systems. Finally, there are additional works which aim to study how to work with and analyze Pareto frontiers, and some of them were applied to a wide array of subjects in forest and natural resources management [28,35,36,44,48].
One of the advantages of the system presented here is that it is almost completely based on freeware, apart from the optimization software CPLEX, which is the only off-the-shelf commercial component of wSADfLOR, and Google Fusion maps. Running CPLEX potentially involves costs, but as wSADfLOR will be hosted on the servers at University of Lisbon, the users and researchers will not incur these costs. Currently, the individual responsible for the maintenance, upgrades, and wSADfLOR’s software management is a researcher from our research team. Currently, wSADfLOR is available at https://sadflor.isa.ulisboa.pt/ISA3/PHP/index.php, and users only need authentication (username and password) provided by the wSADfLOR manager. We should note, however, that there is also a desktop version available for users who do not have internet access. The wSADfLOR is optimized for the Google Chrome browser, but we have done some experiments with IOS and Microsoft Edge, and the system seems to work well in these environments, but we want to guarantee and improve its responsiveness on other browsers, and make it available to a larger community of decision makers. The modular architecture of the system is very convenient for application to forest management and planning decision problems, and continues to undergo evolutionary development at the Forest Research Centre of school of Agriculture due to the continuing need to address new forest ecosystem services and products. The Pareto frontier tool is evolving as a separate tool. There is an internal web-based version that only needs a formatted mathematical programming problem ready to be read with CPLEX or GLPK. Newer versions of this separate version of the Pareto frontier tool will be tested, and integrated in the wSADfLOR, if they prove to be useful advances. Apart from new functionalities or aesthetic improvements that can be considered in the Pareto frontier tool, its use in a server with more memory and processing resources could improve its performance with respect to generating the Edgeworth–Pareto hull and computing the solutions with CPLEX after a decision maker chooses the point on IDM. Moreover, although the Pareto frontiers included in this manuscript were developed by the authors as examples, and were not taken from stakeholder input, the Pareto frontier tool included in wSADfLOR provides a strategic forest management plan and policies to be followed by decision makers considering their own initial selection of concerns and objectives for managing the forest in the tradeoff analysis.
Another advantage of wSADfLOR concerns its potential to support participatory and collaborative forest management planning. In this context, the motivation is to produce systems or tools to facilitate the task of decision makers, and, at the same time, make transparent decisions with which the decision makers are comfortable ([15]). As the system encapsulates an a posteriori preference modeling approach ([28,29]), it does not require the elicitation of preferences by the stakeholders before they analyze the tradeoffs between ecosystem services. Borges et al. 2017 [29] highlighted the potential of this approach to support the negotiation of consensual solutions. Nevertheless, the use of the wSADfLOR tool does not explicitly support the collaboration of decision makers for building a consensus bundle of ecosystem services, but it can be used together with EMDS for that purpose as described in [47]. Most stakeholders who participated in the workshop considered wSADfLOR user-friendly and useful as seen from the analysis of questionnaires. Future research can continue to improve this system, following the suggestions of stakeholders, researchers, and other decision makers, with respect to new tools and functionalities, user-friendliness of the wGUI, system response time, visualization of the wGUI, and analysis of information.

5. Conclusions

wSADfLOR is a modular, web-based decision support system for forest management and planning. It includes modules dedicated to simulation, forest management and planning, decision making with a Pareto frontier tool, and a GUI for relevant data analysis. Looking to the future, and based on our experiences with stakeholder involvement discussed in this work, we see collaboration between the academic and the forest decision-making communities as key to the success of the continuing evolution of wSADfLOR.
The workshops with stakeholders promoted a constructive collaboration between researchers and stakeholders. Both groups learned more about the recent issues that landowners face in managing their properties, and the researchers may be able to suggest possible solutions, or alternatively identify new research needs related to the modeling and tools for helping decision makers better manage their properties as pieces of the greater forest mosaic.
Stakeholders play a critical part in the software development process, and with the experience of this workshop, we learned that they are open to express their opinions, and they like the idea that researchers are interested to collaborate with them in addressing their forest management issues. Our stakeholders demonstrated the desire to take part in more workshops like the one described in this paper, in which they can continue to learn and use these decision tools. Some of them reveled the importance of having more training support with the Pareto frontier tool. According to the insights learned from stakeholders, there is always room to improve the user-friendliness of the Pareto frontier tool and the way in which the system presents the results for management plans.
The use of wSADfLOR helps support collaborative planning in contexts characterized by multiple decision makers. Even if stakeholders are not able to select a single bundle of ecosystem services and to define a unique forest management plan, the tool helps narrow the range of choices and plans to be discussed. Other research demonstrated that it can easily be complemented with EMDS DSSs (CDP and NetWeaver) for suggesting a unique bundle of ecosystem services as a solution for a forest management plan when multiple (groups of) decision makers do not agree on the composition of the bundle ([47]).
Future work with wSADfLOR looks to promote a more effective collaboration and negotiation among decision makers to select bundles of ecosystem services to input to an auctioning platform to attract voluntary payments for ecosystem services.

Author Contributions

M.M. (Marco Marto), J.G.B. and K.M.R. conceived this work; M.M. (Marco Marto), K.M.R., J.G.B. and V.A.B. developed the methodology; M.M. (Marco Marto) and V.A.B. were responsible for processing and software development; M.M. (Marco Marto), V.A.B., and S.M. participated in validation of data; All the authors wrote this paper. K.M.R., J.G.B. and M.M. (Marco Marto) wrote, reviewed, and edited the last versions of this paper.

Funding

This research has received funding from the European Union’s Horizon 2020 Research and Innovation Programme (grant agreement no. 676754) (ALTERFOR), from the Marie Skodowska-Curie Research and Innovation Staff Exchange (RISE) within the H2020 Work Programme (H2020-MSCA-RISE-2015), project Models and decision Support tools for integrated Forest policy development under global change and associated Risk and Uncertainty (SUFORUN), which specifically funded the collaboration of the authors, and by project LISBOA-01-0145-FEDER-030391 with the title “Forest ecosystem management decision-making methods—an integrated bio-economic approach to sustainability” (BIOECOSYS).

Acknowledgments

The authors would like to thank the Portuguese Science Foundation for funding through the Forest Research Centre Project UID/AGR/00239/2013 as well as the Post Doc grant of Susete Marques SFRH/BPD/96806/2013, the Ph.D. grant of Marlene Marques PD/BD/128257/2016 and the Ph.D. grant of Marco Marto SFRH/BD/108225/2015.

Conflicts of Interest

The authors declare no conflict of interest.

Disclaimer

Responsibility for the information and views set out in this article/publication lies entirely with the authors. The use of trade or firm names in this publication is for reader information and does not imply endorsement by the U.S. Department of Agriculture of any product or service.

References

  1. Kochilakis, G.; Poursanidis, D.; Chrysoulakis, N.; Varella, V.; Kotroni, V.; Eftychidis, G.; Lagouvardos, K.; Papathanasiou, C.; Karavokiros, G.; Aivazoglou, M.; et al. A web based DSS for the management of floods and wildfires (FLIRE) in urban and periurban areas. Environ. Model. Softw. 2016, 86, 111–115. [Google Scholar] [CrossRef]
  2. Rammer, W.; Schauflinger, C.; Vacik, H.; Palma, J.H.N.; Garcia-Gonzalo, J.; Borges, J.G.; Lexer, M.J. A web-based toolbox approach to support adaptive forest management under climate change. Scand. J. For. Res. 2014, 29, 96–107. [Google Scholar] [CrossRef]
  3. Holsapple, C. Handbook on Knowledge Management 1: Knowledge Matters; Holsapple, C., Ed.; Springer Science & Business Media: Berlin, Germany, 2013; Volume 1. [Google Scholar]
  4. Borges, J.G.; Nordström, E.M.; Garcia Gonzalo, J.; Hujala, T.; Trasobares, A. Computer-Based Tools for Supporting Forest Management. The Experience and the Expertise World-Wide; Department of Forest Resource Management, Swedish University of Agricultural Sciences: Umeå, Sweden, 2014. [Google Scholar]
  5. Hansen, K. (Ed.) Planning Afforestation on Previously Managed Arable Land—Influence on Deposition, Nitrate Leaching, and Carbon Sequestration. 2002. Available online: http://www.eugris.info/displayresource.aspx?r=4221 (accessed on 26 November 2019).
  6. Shao, G.F.; Dai, L.M.; Li, Y.S.; Liu, Y.M.; Bai, G.X. FORESTAR: A decision-support system for multi-objective forest management in Northeast China. J. For. Res. 2003, 14, 141–145. [Google Scholar]
  7. Lexer, M.J.; Vacik, H.; Palmetzhofer, D.; Oitzinger, G. A decision support tool to improve forestry extension services for small private landowners in southern Austria. Comput. Electron. Agric. 2005, 49, 81–102. [Google Scholar] [CrossRef]
  8. McCarter, J.B. Landscape Management System (LMS): Background, Methods, and Computer Tools for Integrating Forest Inventory, GIS, Growth and Yield, Visualization, and Analysis for Sustaining Multiple Forest Objectives. Ph.D. Thesis, University of Washington, Seattle, WA, USA, 2001. [Google Scholar]
  9. Pretzsch, H.; Biber, P.; Ďurský, J. The single tree-based stand simulator SILVA: Construction, application and evaluation. For. Ecol. Manag. 2002, 162, 3–21. [Google Scholar] [CrossRef]
  10. Nabuurs, G.J.; Schelhaas, M.J.; Pussinen, A. Validation of the European forest information scenario model (EFISCEN) and a projection of Finnish forests. Silva Fenn. 2000, 34, 167–179. [Google Scholar] [CrossRef]
  11. Pussinen, A.; Schelhaas, M.J.; Verkaik, E.; Heikkinen, E.; Liski, J.; Karjalainen, T.; Päivinen, R.; Nabuurs, G.J. Manual for the European Forest Information Scenario Model (EFISCEN), version 2.0.; EFI Internal Report 5; European Forest Institute: Joensuu, Finland, 2001; pp. 1–49. [Google Scholar]
  12. Barreiro, S.; Rua, J.; Tomé, M. StandsSIM-MD: A management driven forest SIMulator. For. Syst. 2016, 25, 8. [Google Scholar] [CrossRef]
  13. Dunham, R.; Gardiner, B.; Quine, C.P.; Suarez, J. ForestGales, a PC-Based Wind Risk Model for British Forests; Forestry Commission: Edinburgh, UK, 2000. [Google Scholar]
  14. Pyatt, G.; Ray, D.; Fletcher, J. An Ecological Site Classification for Forestry in Great Britain. Bulletin 124; British Forestry Commission: Edinburgh, UK, 2001. [Google Scholar]
  15. Reynolds, K.M.; Hessburg, P.F.; Bourgeron, P.S. Making Transparent Environmental Management Decisions; Springer: Berlin/Heidelberg, Germany, 2014. [Google Scholar] [CrossRef]
  16. Nute, D.; Potter, W.D.; Maier, F.; Wang, J.; Twery, M.; Rauscher, H.M.; Knopp, P.; Thomasma, S.; Dass, M.; Uchiyama, H.; et al. NED-2: An agent-based decision support system for forest ecosystem management. Environ. Model. Softw. 2004, 19, 831–843. [Google Scholar] [CrossRef]
  17. Jamnick, M.S.; Walters, K.R. Spatial and temporal allocation of stratum-based harvest schedules. Can. J. For. Res. 1993, 23, 402–413. [Google Scholar] [CrossRef]
  18. Baskent, E.Z.; Başkaya, S.; Terzioğlu, S. Developing and implementing participatory and ecosystem based multiple use forest management planning approach (ETCAP): Yalnızçam case study. For. Ecol. Manag. 2008, 256, 798–807. [Google Scholar] [CrossRef]
  19. Küçüker, D.M.; Baskent, E.Z. Sustaining the joint production of timber and Lactarius mushroom: A case study of a forest management planning unit in Northwestern Turkey. Sustainability 2017, 9, 92. [Google Scholar] [CrossRef]
  20. Seely, B.; Nelson, J.; Wells, R.; Peter, B.; Meitner, M.; Anderson, A.; Harshaw, H.; Sheppard, S.; Bunnell, F.L.; Kimmins, H.; et al. The application of a hierarchical, decision-support system to evaluate multi-objective forest management strategies: A case study in northeastern British Columbia, Canada. For. Ecol. Manag. 2004, 199, 283–305. [Google Scholar] [CrossRef]
  21. Damme, L.V.; Russell, J.S.; Doyon, F.; Duinker, P.N.; Gooding, T.; Hirsch, K.; Rothwell, R.; Rudy, A. The development and application of a decision support system for sustainable forest management on the Boreal Plain. J. Environ. Eng. Sci. 2003, 2, S23–S34. [Google Scholar] [CrossRef]
  22. Ouhimmou, M.; Haddad, S.; Boukherroub, T. Decision support system for selection of harvest areas and wood allocation to mills. IFAC PapersOnLine 2015, 48, 628–633. [Google Scholar] [CrossRef]
  23. Kangas, J.; Kangas, A. Multiple criteria decision support in forest management—The approach, methods applied, and experiences gained. For. Ecol. Manag. 2005, 207, 133–143. [Google Scholar] [CrossRef]
  24. Mendoza, G.A.; Prabhu, R. Combining participatory modeling and multi-criteria analysis for community-based forest management. For. Ecol. Manag. 2005, 207, 145–156. [Google Scholar] [CrossRef]
  25. Martins, H.; Borges, J.G. Addressing collaborative planning methods and tools in forest management. For. Ecol. Manag. 2007, 248, 107–118. [Google Scholar] [CrossRef]
  26. Marques, A.F.; Borges, J.G.; Sousa, P.; Pinho, A.M. An enterprise architecture approach to forest management support systems design: An application to pulpwood supply management in Portugal. Eur. J. For. Res. 2011, 130, 935–948. [Google Scholar] [CrossRef]
  27. Marques, A.F.; Fricko, A.; Kangas, A.; Rosset, C.; Ferreti, F.; Rasinmaki, J.; Packalen, T.; Gordon, S. Empirical guidelines for forest management decision support systems based on the past experiences of the expert’s community. For. Syst. 2013, 22, 320–339. [Google Scholar] [CrossRef]
  28. Borges, J.G.; Garcia-Gonzalo, J.; Bushenkov, V.A.; McDill, M.E.; Marques, S.; Oliveira, M.M. Addressing multi-criteria forest management with Pareto Frontier methods: An application in Portugal. For. Sci. 2014, 60, 63–72. [Google Scholar] [CrossRef]
  29. Borges, J.G.; Marques, S.; Garcia-Gonzalo, J.; Rahman, A.U.; Bushenkov, V.; Sottomayor, M.; Carvalho, P.O.; Nordström, E.M. A multiple criteria approach for negotiating ecosystem services supply targets and forest owners’ programs. For. Sci. 2017, 63, 49–61. [Google Scholar] [CrossRef]
  30. Sheppard, S.R.; Meitner, M. Using multi-criteria analysis and visualisation for sustainable forest management planning with stakeholder groups. For. Ecol. Manag. 2005, 207, 171–187. [Google Scholar] [CrossRef]
  31. Chichernea, V.; Pop, D.P. Web operations management: A web-based decision support systems for concret transportation in industrial are of the smart city. J. Inf. Syst. Oper. Manag. 2014, 8, 48–60. [Google Scholar]
  32. Kirilenko, A.; Chivoiu, B.; Crick, J.; Ross-Davis, A.; Schaaf, K.; Shao, G.; Singhania, V.; Swihart, R. An internet-based decision support tool for non-industrial private forest landowners. Environ. Model. Softw. 2007, 22, 1498–1508. [Google Scholar] [CrossRef]
  33. Wu, J.; Wang, J.; Li, Y.; Spong, B. A web-based decision support system for analyzing timber harvesting costs and productivity. North. J. Appl. For. 2012, 29, 141–149. [Google Scholar] [CrossRef]
  34. Garcia-Gonzalo, J.; Bushenkov, V.; McDill, M.E.; Borges, J.G. A decision support system for assessing trade-offs between ecosystem management goals: An application in Portugal. Forests 2015, 6, 65–87. [Google Scholar] [CrossRef]
  35. Lotov, A.; Bushenkov, V.A.; Kamenev, G.K. Interactive Decision Maps: Approximation and Visualization of Pareto Frontier; Springer Science & Business Media: New York, NY, USA, 2004; Volume 89. [Google Scholar]
  36. Efremov, R.V.; Lotov, A.V. Multi-criteria remote asynchronous group decision screening: An experimental study. Group Decis. Negot. 2014, 23, 31–48. [Google Scholar] [CrossRef]
  37. Nieuwenhuis, M.; Biber, P. Milestone 11—Projections with Current FMMs Per Case Study; University College Dublin—Technical University of Munich: Dublin, Munich, 2018. [Google Scholar]
  38. Carpenter, S.R.; DeFries, R.; Dietz, T.; Mooney, H.A.; Polasky, S.; Reid, W.V.; Scholes, R.J. Millennium ecosystem assessment: Research needs. Science 2006, 314, 257–258. [Google Scholar] [CrossRef]
  39. Carpenter, S.R.; Mooney, H.A.; Agard, J.; Capistrano, D.; DeFries, R.S.; Díaz, S.; Dietz, T.; Duraiappah, A.K.; Oteng-Yeboah, A.; Pereira, H.M.; et al. Science for managing ecosystem services: Beyond the Millennium Ecosystem Assessment. Proc. Natl. Acad. Sci. USA 2009, 106, 1305–1312. [Google Scholar] [CrossRef]
  40. Braat, L.C.; de Groot, R. The ecosystem services agenda: Bridging the worlds of natural science and economics, conservation and development, and public and private policy. Ecosyst. Serv. 2012, 1, 1–15. [Google Scholar] [CrossRef]
  41. Borges, J.G.; Falcao, A.O.; Miragaia, C.; Marques, P.; Marques, M. A Decision Support System for Forest Ecosystem Management in Portugal. In Systems Analysis in Forest Resources. Managing Forest Ecosystems; Arthaud, G.J., Barrett, T.M., Eds.; Springer: Dordrecht, The Netherlands, 2003; Volume 7. [Google Scholar] [CrossRef]
  42. Reynolds, K.M.; Twery, M.; Lexer, M.J.; Vacik, H.; Ray, D.; Shao, G.; Borges, J.G. Decision support systems in forest management. In Handbook on Decision Support System 2; Burstein, F., Holsapple, C., Eds.; International Handbooks on Information Systems Series; Springer: Berlin/Heidelberg, Germany, 2008; Volume 2, pp. 499–534. [Google Scholar] [CrossRef]
  43. Ferreira, L.C.R. Desenvolvimento de Modelos de Optimização da Gestão Florestal em Situações de Risco de Incêndio. Ph.D. Thesis, University of Lisbon, Lisbon, Portugal, December 2011. [Google Scholar]
  44. Marques, S.; Marto, M.; Bushenkov, V.; McDill, M.; Borges, J. Addressing wildfire risk in forest management planning with multiple criteria decision making methods. Sustainability 2017, 9, 298. [Google Scholar] [CrossRef] [Green Version]
  45. Davis, L.S.; Johnson, K.N.; Bettinger, P.S.; Howard, T.E. Forest Management: To Sustain Ecological, Economic, and Social Values, 4th ed.; Waveland Press, Inc.: Long Grove, IL, USA, 2005. [Google Scholar]
  46. Preparata, F.P.; Hong, S.J. Convex hulls of finite sets of points in two and three dimensions. Commun. ACM 1977, 20, 87–93. [Google Scholar] [CrossRef]
  47. Marto, M.; Reynolds, K.; Borges, J.; Bushenkov, V.; Marques, S. Combining decision support approaches for optimizing the selection of bundles of ecosystem services. Forests 2018, 9, 438. [Google Scholar] [CrossRef] [Green Version]
  48. Tóth, S.F.; McDill, M.E. Finding efficient harvest schedules under three conflicting objectives. For. Sci. 2009, 55, 117–131. [Google Scholar]
Figure 1. wSADfLOR architecture. Modules and information flows.
Forests 10 01079 g001
Figure 2. wGUI form displaying part of the study area as well as stand level inventory data.
Forests 10 01079 g002
Figure 3. wGUI for creating prescriptions and generating the decision space for the planning horizon.
Forests 10 01079 g003
Figure 4. Interactive decision maps for a decision problem. The x-axis presents the total wood (TOTTIMBesc; harvested wood, and thinned wood), and the y-axis represents the volume of ending inventory (Vol_Per9esc), and on the scale colors represent the five Pareto frontiers for five levels of average carbon sequestration (CTOTALesc).
Forests 10 01079 g004
Figure 5. Pareto frontier showing the trade-off between average carbon sequestration (105 Mg year−1; CTOTALesc) in y-axis and total wood—harvested wood and thinned wood (106 m3; TOTTIMBesc)—in the x-axis.
Forests 10 01079 g005
Figure 6. Pareto frontier showing the trade-off between the biodiversity indicator (IBiodiversity) in the y-axis and total wood—total harvested and thinned volume (106 m3; TOTTIMBesc)—in the x-axis.
Forests 10 01079 g006
Figure 7. Interactive decision map showing the trade-off between three criteria: value of biodiversity indicator (ranges from 0 to 5 in its original scale; IBiodiversity) in the y-axis; total wood (106 m3; TOTTIMBesc) in the x-axis, and volume of ending inventory—standing volume in last year of planning horizon (106 m3; Vol_Per9esc) in the colored scale.
Forests 10 01079 g007
Figure 8. Interactive decision map showing the trade-off between three criteria: average carbon sequestration (105 Mg year−1; CTOTALesc) in the y-axis; volume of ending inventory—standing volume in last year of planning horizon (106 m3; Vol_Per9esc) in the x-axis; and total wood (106 m3; TOTTIMBesc) in the colored scale.
Forests 10 01079 g008
Figure 9. Questionnaire responses regarding the question on the easiness of use SADfLOR. Answers to each question were grouped into three categories: 1–3, 4, and 5–7, representing negative, neutral, and positive answers, respectively.NA represents not available (non-responses).
Forests 10 01079 g009
Figure 10. Questionnaire responses regarding the question on the usefulness of wSADfLOR. Answers to each question were grouped into three categories: 1–3, 4, and 5–7, representing negative, neutral, and positive answers, respectively. NA represents not available (non-responses).
Forests 10 01079 g010

