Effect of Phosphinothricin on Transgenic Downy Birch (Betula pubescens Ehrh.) Containing bar or GS1 Genes


1
Branch of the Shemyakin-Ovchinnikov Institute of Bioorganic Chemistry, Russian Academy of Sciences, Prospekt Nauki 6, 142290 Pushchino, Moscow Region, Russia
2
Department of Forest Genetics and Forest Tree Breeding, Georg-August University of Göttingen, Büsgenweg 2, 37077 Göttingen, Germany
3
Center for Integrated Breeding Research, Georg-August University of Göttingen, Albrecht-Thaer-Weg 3, 37075 Göttingen, Germany
4
Laboratory of Population Genetics, N. I. Vavilov Institute of General Genetics, Russian Academy of Sciences, Gubkin Str. 3, 119333 Moscow, Russia
5
Laboratory of Forest Genomics, Genome Research and Education Center, Institute of Fundamental Biology and Biotechnology, Siberian Federal University, Akademgorodok 50a/2, 660036 Krasnoyarsk, Russia
6
Department of Ecosystem Science and Management, Texas A&M University, 2138 TAMU, College Station, TX 77843-2138, USA
*
Author to whom correspondence should be addressed.
Forests 2019, 10(12), 1067; https://doi.org/10.3390/f10121067
Submission received: 20 October 2019
/
Revised: 9 November 2019
/
Accepted: 20 November 2019
/
Published: 24 November 2019
(This article belongs to the Special Issue Forest Genetics and Tree Improvement)
Abstract
:Weeds are a big problem in agriculture and forestry, and herbicides are the main tools to control them. Phosphinotricin (ammonium glufosinate, PPT) is one of the most effective non-selective herbicides, to which weeds hardly gain resistance, but the reasons for its effect and toxicity to plants are still unclear, and especially, it is little studied in trees, including transgenic ones. We studied the physiological responses of downy birch (Betula pubescens Ehrh.) containing the herbicide resistance bar gene or the cytosol glutamine synthetase GS1 gene (the target enzyme of the herbicide) to PPT-based Basta herbicide treatment in various doses under open-air conditions during two years. Birch saplings with the bar gene were resistant to a double field dose (10 L/ha), but the expression of the GS1 gene only slightly increased resistance compared to the control. Herbicide treatment increased the ammonium level in leaf tissue by 3–8 times, but this, apparently, was not the main cause of plant death. Among leaf pigments, chlorophyll B was the most resistant to PPT, and carotenoids were the most sensitive. Responses of birch trees with the GS1 gene (accumulation of ammonium, pigment content, and dehydration) during treatment with a low dose of herbicide were less pronounced than in control plants. One-year-old control and transgenic plants with the GS gene died after 2.5 L/ha treatment, and two-year-old plants lost foliage after such treatment but remained alive and developed buds four weeks after treatment. Herbicide treatment of plants with the bar gene did not cause significant deviations in height (first year) or the accumulation of aboveground biomass (second year). The obtained results improve our understanding of the effect of PPT on woody plants and can be used both to clarify mechanisms of herbicide action and in plantation forestry.
1. Introduction
Weed vegetation is a serious problem in agriculture. For instance, it was estimated that weeds produced the highest potential loss of production (34%) compared to pests and pathogens in a study on the potential and actual losses of wheat, rice, maize, potatoes, soybeans, and cotton for the period 2001–2003 on a regional basis (19 regions), as well as for the global basis [1]. The most common methods of weed management include mechanical treatments, but these methods are ineffective as well as costly and laborious. Therefore, chemical treatments, i.e., the use of herbicides, became the main approach to control weeds. Phosphinothricin (2-Amino-4-[hydroxy(methyl)phosphoryl]butanoic acid, PPT) is a natural phytotoxin resulting from the bialophos tripeptide antibiotic breakdown produced by the Streptomyces soil bacteria. d and l phosphinothricin (glufosinate) racemic mixture is used as a broad-spectrum commercial herbicide that is employed for post-emergence control of weeds in many agricultural and non-agricultural systems and is the only true commercialized natural product herbicide [2]. In addition, PPT is used to desiccate crops before harvest. The PPT mode of action, as well as of another widespread herbicide such as glyphosate, is based on amino acid metabolism inhibition. The D-PPT form does not possess any biological activity, while L-PPT is a structural analog of glutamate and competes for the glutamate-binding site in glutamine synthetases (GS; EC 6.3.1.2), thereby irreversibly inhibiting this main enzyme of nitrogen metabolism in plants [3], which ultimately leads to their death.
PPT-based herbicides are one of the most commonly used non-selective herbicides in the world associated with and also promoting the dissemination of transgenic glufosinate-tolerant crops. Methods of enhancing tolerance to PPT could be divided into two groups, those directed at the (1) herbicide and (2) target enzyme, respectively. The main method of enhancing tolerance to PPT could be an introduction of bar or pat genes from the Streptomyces soil bacteria discovered in the 1980s into a plant [4]. These genes encode the PAT (PPT acetyltransferase) enzyme detoxifying PPT to inactive compounds. Later the mat gene from Nocardia sp. strain AB2253 soil bacteria [5] and RePAT gene from the Rhodococcus sp. strain YM12 marine bacteria [6] encoding similar enzymes were identified, but they are still not widely used yet. In addition, attempts were made to reduce the toxicity of PPT using the ginseng PgGST gene encoding the glutathione S-transferase (EC 2.5.1.18), and a slight increase in tolerance was obtained in transgenic tobacco containing this gene [7]. Another approach is to increase the GS content in a cell or decrease its sensitivity to PPT. An increase in resistance compared to control was demonstrated in hybrid poplar containing the GS1 gene [8] and in rice containing the GS1;2, but not GS1;1 gene [9]. Rice containing the mutant GS gene turned out to be more tolerant of PPT than those containing a natural variant of the gene [10].
It is difficult to develop new methods of plant protection against PPT without knowledge of the exact mechanism of its action. It is known that as a result of GS inhibition, toxic ammonium is accumulated, and metabolic pathways downstream of GS are disrupted. However, the interaction between these processes is probably very complicated and still was not sufficiently understood [11]. At first, a significant correlation between herbicidal activity and NH4 accumulation suggested that the main mechanism of the herbicide action was the NH4 accumulation as a result of GS inhibition [12]; and a decrease in glutamine was not the major factor in the herbicidal activity induction [13]. However, the results of a number of subsequent studies called into question this conclusion since the addition of amino acids weakened the negative effect of PPT [14,15]. To date, the reason for extremely rapid glufosinate-induced death of leaves is still unclear [16]. It should be noted that despite (or due to) the widespread use of both glyphosate and glufosinate in the world, currently, more than 40 species of glyphosate-tolerant weeds are known in the world [17], while glufosinate-tolerance are limited only to two species [18]. This makes PPT more preferable for use in agriculture but complicates the study of the mechanisms of its action.
Weed control is carried out mainly for annual crops, but the weed problem also exists for woody plants. This problem is still serious in forestry, especially in forest nurseries, where the development of weeds is facilitated by long periods of growing the tree seedlings in one and the same place, simplified crop rotation, and slow growth of woody species, especially conifers, at the early age. Weed management can be one of the most expensive treatments in nurseries, and manual weeding may constitute 25–90% of total production costs [19]. Use of a much more efficient method of weed control, such as the chemical ones, is limited by the high sensitivity of some forest species to them, as well as by non-selectivity of the most efficient and environmentally friendly herbicides that usually inhibit the biosynthesis of the amino acids and equally affect both cultivated plants and weeds. A solution to this problem lies in developing plants with herbicide tolerance using genetic engineering methods.
Birch is the most important broadleaved tree in boreal forests and is promising for use in plantation forestry, which requires high-quality planting material. In this work, we assessed the degree of tolerance to herbicide treatment under open-air conditions in transgenic birch saplings with the bar gene, as well as with an additional gene of the GS cytosolic form from Pinus sylvestris L., and determined the effect of PPT on the content of ammonium and leaf pigments, such as chlorophyll and carotenoids, as well as the water status of birch saplings and their growth during two years.
2. Materials and Methods
Non-transgenic bp3f1 genotype of downy birch (Betula pubescens Ehrh.) kindly provided by Prof. V. E. Padutov (Forest Institute, Gomel, Belarus) was used in our study. This genotype is characterized by rapid growth.
Transformation of this genotype was carried out using the CBE21 Agrobacterium tumefaciens strain with pBIBar binary vector containing nos-nptII gene and bar gene from Streptomyces hygroscopicus under CaMV 35S promoter [20], or pGS containing nos-nptII gene and GS1 gene encoding the cytosolic form of GS from Pinus sylvestris under CaMV 35S promoter [21]. Leaves from plants in vitro were used as explants and were transformed according to the method of Lebedev et al. [22]. The transgenic status of the obtained kanamycin-tolerant transformants was confirmed by PCR and RT-PCR [23].
Three transgenic lines containing the bar gene, including F38Bar1a, F38Bar1b, and F38Bar3a (referred further as Bar1a, Bar1b, and Bar3a for simplicity) and one transgenic line F14GS8b containing the GS1 gene (referred further as GS8b) were selected for experiments on herbicide tolerance. These four lines and the non-transgenic control were micro-propagated, adapted to non-sterile conditions in the greenhouse during two months, transplanted into 1-L plastic pots with peat/perlite substrate (3:1), and were transferred into open air conditions. In mid-July, four plants of each line in each treatment were sprayed with either water (control) or 0.5%, 1%, and 2% aqueous solution of the Basta herbicide (Bayer CropScience, Leverkusen, Germany; 150 g/L PPT) in doses equivalent to 2.5 (desiccation dose), 5 (standard field dose), and 10 L/ha (double field dose), respectively. Plants with the GS1 gene were treated only with 0.5% and 1% herbicide solution.
Visual assessment of the entire plants was carried out in 3, 7, 14, and 28 days after treatment according to the following scoring scale: 0 points—no damage, 1—necrosis on up to 25% of the leaf surface, 2—25–50%, 3—50–75%, 4—75–100%, 5—entire leaf necrosis. Four saplings per line were evaluated.
Leaf samples for assessing ammonium content were selected on the day of treatment and after three days for assessing water and leaf pigment (chlorophyll and carotenoids) content—on the same day and additionally after seven days. For one-year-old birch saplings, one leaf from a central part of the stem for each of the four saplings per line was used for this analysis. Extraction for ammonium content determination was performed, according to De Block et al. [24]. Ammonium nitrogen was determined according to [25]. Chlorophyll A and B and carotenoids were extracted with 80% acetone and determined according to [26]. The optical density of solutions was measured using the Shimadzu UV-1800 spectrophotometer at 625 nm for ammonium and 663, 646, and 470 nm for pigments. The relative water content (RWC) was determined, according to [27]. Plant height was measured after transplantation into pots and at the end of the vegetation season.
All plants after winter under natural conditions were transplanted into 3 L pots in the spring of the following year, and the dead plants in control and GS8b lines were replaced by reserve ones. In mid-July, the plants were treated with the herbicide, according to the same scheme as in the previous year. Visual assessment of plants was carried out in 1, 3, 7, 14, and 28 days after treatment. The content of ammonium and RWC was determined on the day of treatment and after three days. For two-year-old birch saplings, one leaf from a central part of four lateral branches for each of the four saplings per line was used for this analysis. The four probes from the same sapling were pooled. After the completion of the growing season and falling of all leaves, the aboveground biomass of plants was determined. In our experiments, the proportion of dry mass to the fresh mass was very stable—55–56% (unpublished data); therefore, we used only the fresh mass for measuring the aboveground biomass.
Statistical difference between treatments and lines was estimated by analysis of variance (ANOVA) and Duncan’s multiple range test (DMRT) at a significance level of 0.05 using the Statistica 6.1 software (TIBCO Software Inc., Palo Alto, CA, USA).
3. Results
3.1. Visual Injury after Herbicide Treatment
Three days after the plants were treated with the herbicide, the signs of damage were noticeable on the birch leaves of both control plants and plants containing the GS gene, and on these plants treated with low concentration, the symptoms were slightly weaker than with the control ones (Table 1). No signs of damage were registered on plants with the bar gene. The symptoms increased at seven days after treatment, i.e., after treatment with the 2% herbicide solution, all the leaves with the control species were completely necrotic, and at lower concentrations, the degree of damage was four points, as in plants with the GS gene (Figure 1). All the transgenic lines with the bar gene treated with the 2% solution demonstrated first symptoms of damage—up to 5% of the leaf surface was necrotic on individual leaves. After 14 days, complete necrosis of all leaves was observed with the non-transgenic control and plants with the GS gene, and after 28 days, the plants completely died. Plants with the bar gene demonstrated a slight increase in the damage symptoms after treatment with the maximum dose; the necrosis degree increased up to 10% of the leaf surface. In addition, weak signs of damage appeared in the Bar1a line treated with the 1% herbicide solution. Further observations did not reveal an increase in the damage symptoms.
In the second year of cultivation, a high degree of resistance of transgenic birch saplings with the bar gene remained—the damage (necrosis) was insignificant on individual leaves of transgenic plants when treated with a double field dose (Table 2).
The nature of the damage was different in the wild-type (control) vs. transgenic plants containing the bar gene. In wild-type plants, necrosis spots appeared over the entire surface of the leaves, but in transgenic plants, the symptoms of the damage were manifested mainly in necrosis of indents of the apical leaves (Figure 2).
The first signs of necrosis in the control and transgenic plants containing the GS gene appeared one day after treatment in the form of small spots of necrosis on the leaf surface, which subsequently increased and merged together. In the control plants, seven days after treatment with 1% and 2% solution of herbicides, the leaves were almost completely necrotic, and only leaves treated by 0.5% solution still preserved areas of living tissue (Figure 3). Figure 3 also shows the dead weeds in pots killed by all the doses of the herbicide. The symptoms of damage in transgenic plants containing the GS gene were slightly weaker than that in controls (Table 2). In the control plants and transgenic plants containing the GS gene, budburst was observed 28 days after treatment with a 0.5% herbicide solution, mainly in the lower part of the stem (Figure 4). Budburst was more active in plants containing the GS gene (20–25 buds per plant on average) than in controls (12–15 buds per plant on average). Treatments at higher concentrations resulted in the complete death of birch trees that did not carry the bar gene.
3.2. Ammonium Accumulation
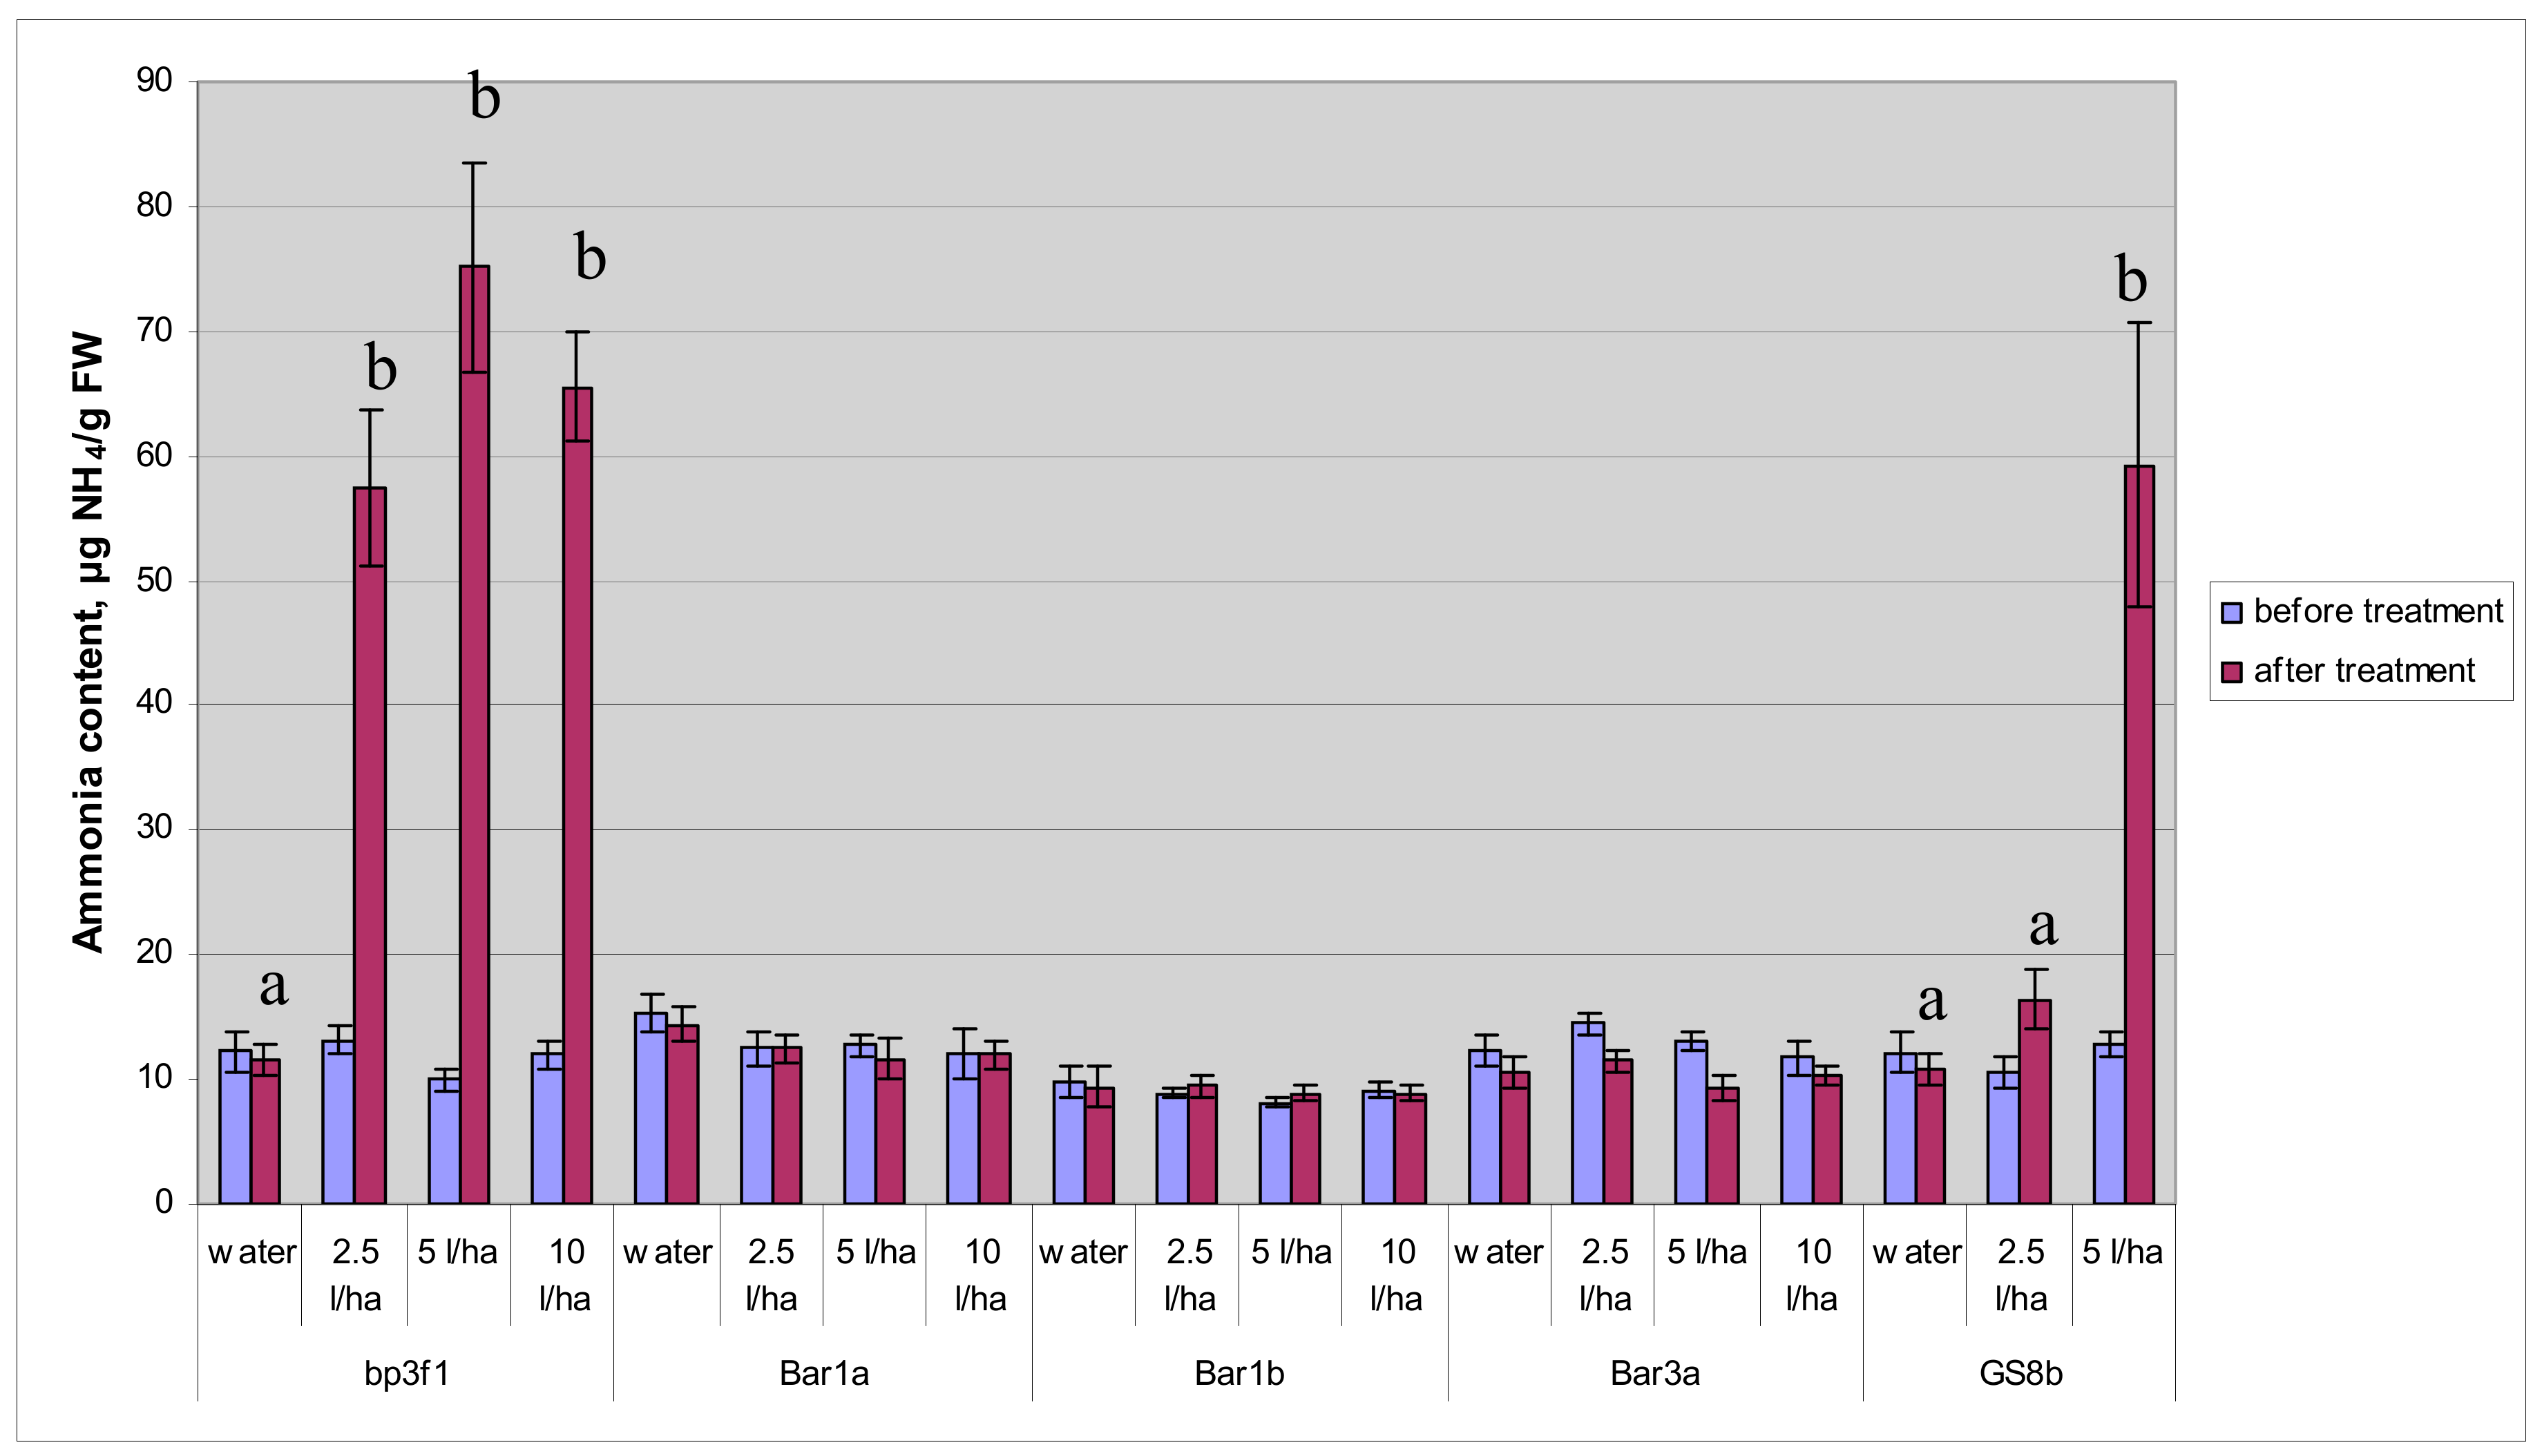
The level of ammonium was fairly similar in all birch lines. Analysis of ammonium content in leaf tissue of the control plants showed its sharp statistically significant increase three days after treatment with the herbicide, i.e., by 4–8 times as compared to the initial level (Figure 5). In transgenic birch saplings containing the GS gene, a significant increase in ammonium content was registered only after treatment by the 1% herbicide solution, i.e., from 12.8 to 59.2 μg NH4/g wet weight, while treatment by the 0.5% solution had no statistical effect. In transgenic plants containing the bar gene, herbicide treatment did not cause a significant change of the ammonium content in leaf tissue. Water treatment also produced no effect.
In two-year-old birch saplings, the level of ammonium before treatment was slightly lower than in one-year-old birch saplings. Herbicide treatment caused an increase in the level of ammonium in the control plants, and this increase correlated better with the dose of the herbicide in two-year-old than in one-year-old plants (Figure 6). The herbicide had no effect on the accumulation of ammonium in transgenic plants containing the bar gene. The level of ammonium in transgenic plants containing the GS gene did not increase significantly after treatment by the minimum dose, but treatment by a 1% solution increased the ammonium content in the leaf tissue by almost six times.
3.3. Leaf Pigments (Chlorophyll and Carotenoids) Content
Treatment of the transgenic Bar1a line plants with any concentration of the herbicide did not lead to any change in the content of chlorophyll A and B, or carotenoids (Table 3). A significant decrease in the carotenoid content was observed in the transgenic Bar1b line plants seven days after treatment with the 2% herbicide solution. The treatment with 0.5% and 1% herbicide solutions did not change the content of leaf pigments in the Bar3a line plants, but the maximum concentration led to a decrease in the chlorophyll A and carotenoids content; this decrease appeared to be significant after three days and even more after seven days. In non-transgenic plants, a significant drop in the chlorophyll A and carotenoids content was observed three days after treatment with the 0.5% herbicide solution, in chlorophyll A, carotenoids, and total chlorophyll A and B after treatment with the 1% herbicide solution, and a significant drop also in chlorophyll B after treatment with the 2% herbicide solution. In contrast to the control non-transgenic plants, birch saplings containing the GS gene did not demonstrate any effect on the leaf pigment content after being treated with the 0.5% herbicide solution, but the 1% solution caused a significant decrease in all the measured pigments.
3.4. Relative Water Content (RWC)
The RWC values in the leaf tissue of various birch saplings in the first season before treatment were very similar, ranging from 81.1% to 83.3% (Table 4). Three days after treatment with the herbicide, some dehydration of the leaf tissue was observed in the Bar1a and Bar3a lines in treatments with the 2% herbicide solution, but it was insignificant. The Bar1b plants treated with the maximum dose of herbicide demonstrated more obvious and statistically significant water loss. In non-transgenic control birch saplings, treatment with any concentration of herbicide caused significant water loss. In birch saplings containing the GS gene, treatment with the 0.5% herbicide solution caused a significant dehydration, but not to the same extent as in control plants. Seven days after treatment, further dehydration was not observed in the transgenic plants with the bar gene. In control leaves and in plants with the GS gene, water loss continued. In the second year of research, three days after treatment, water losses were lower than in one-year-old plants. The GS8b plants were more resistant to dehydration than control plants.
3.5. Height and Biomass
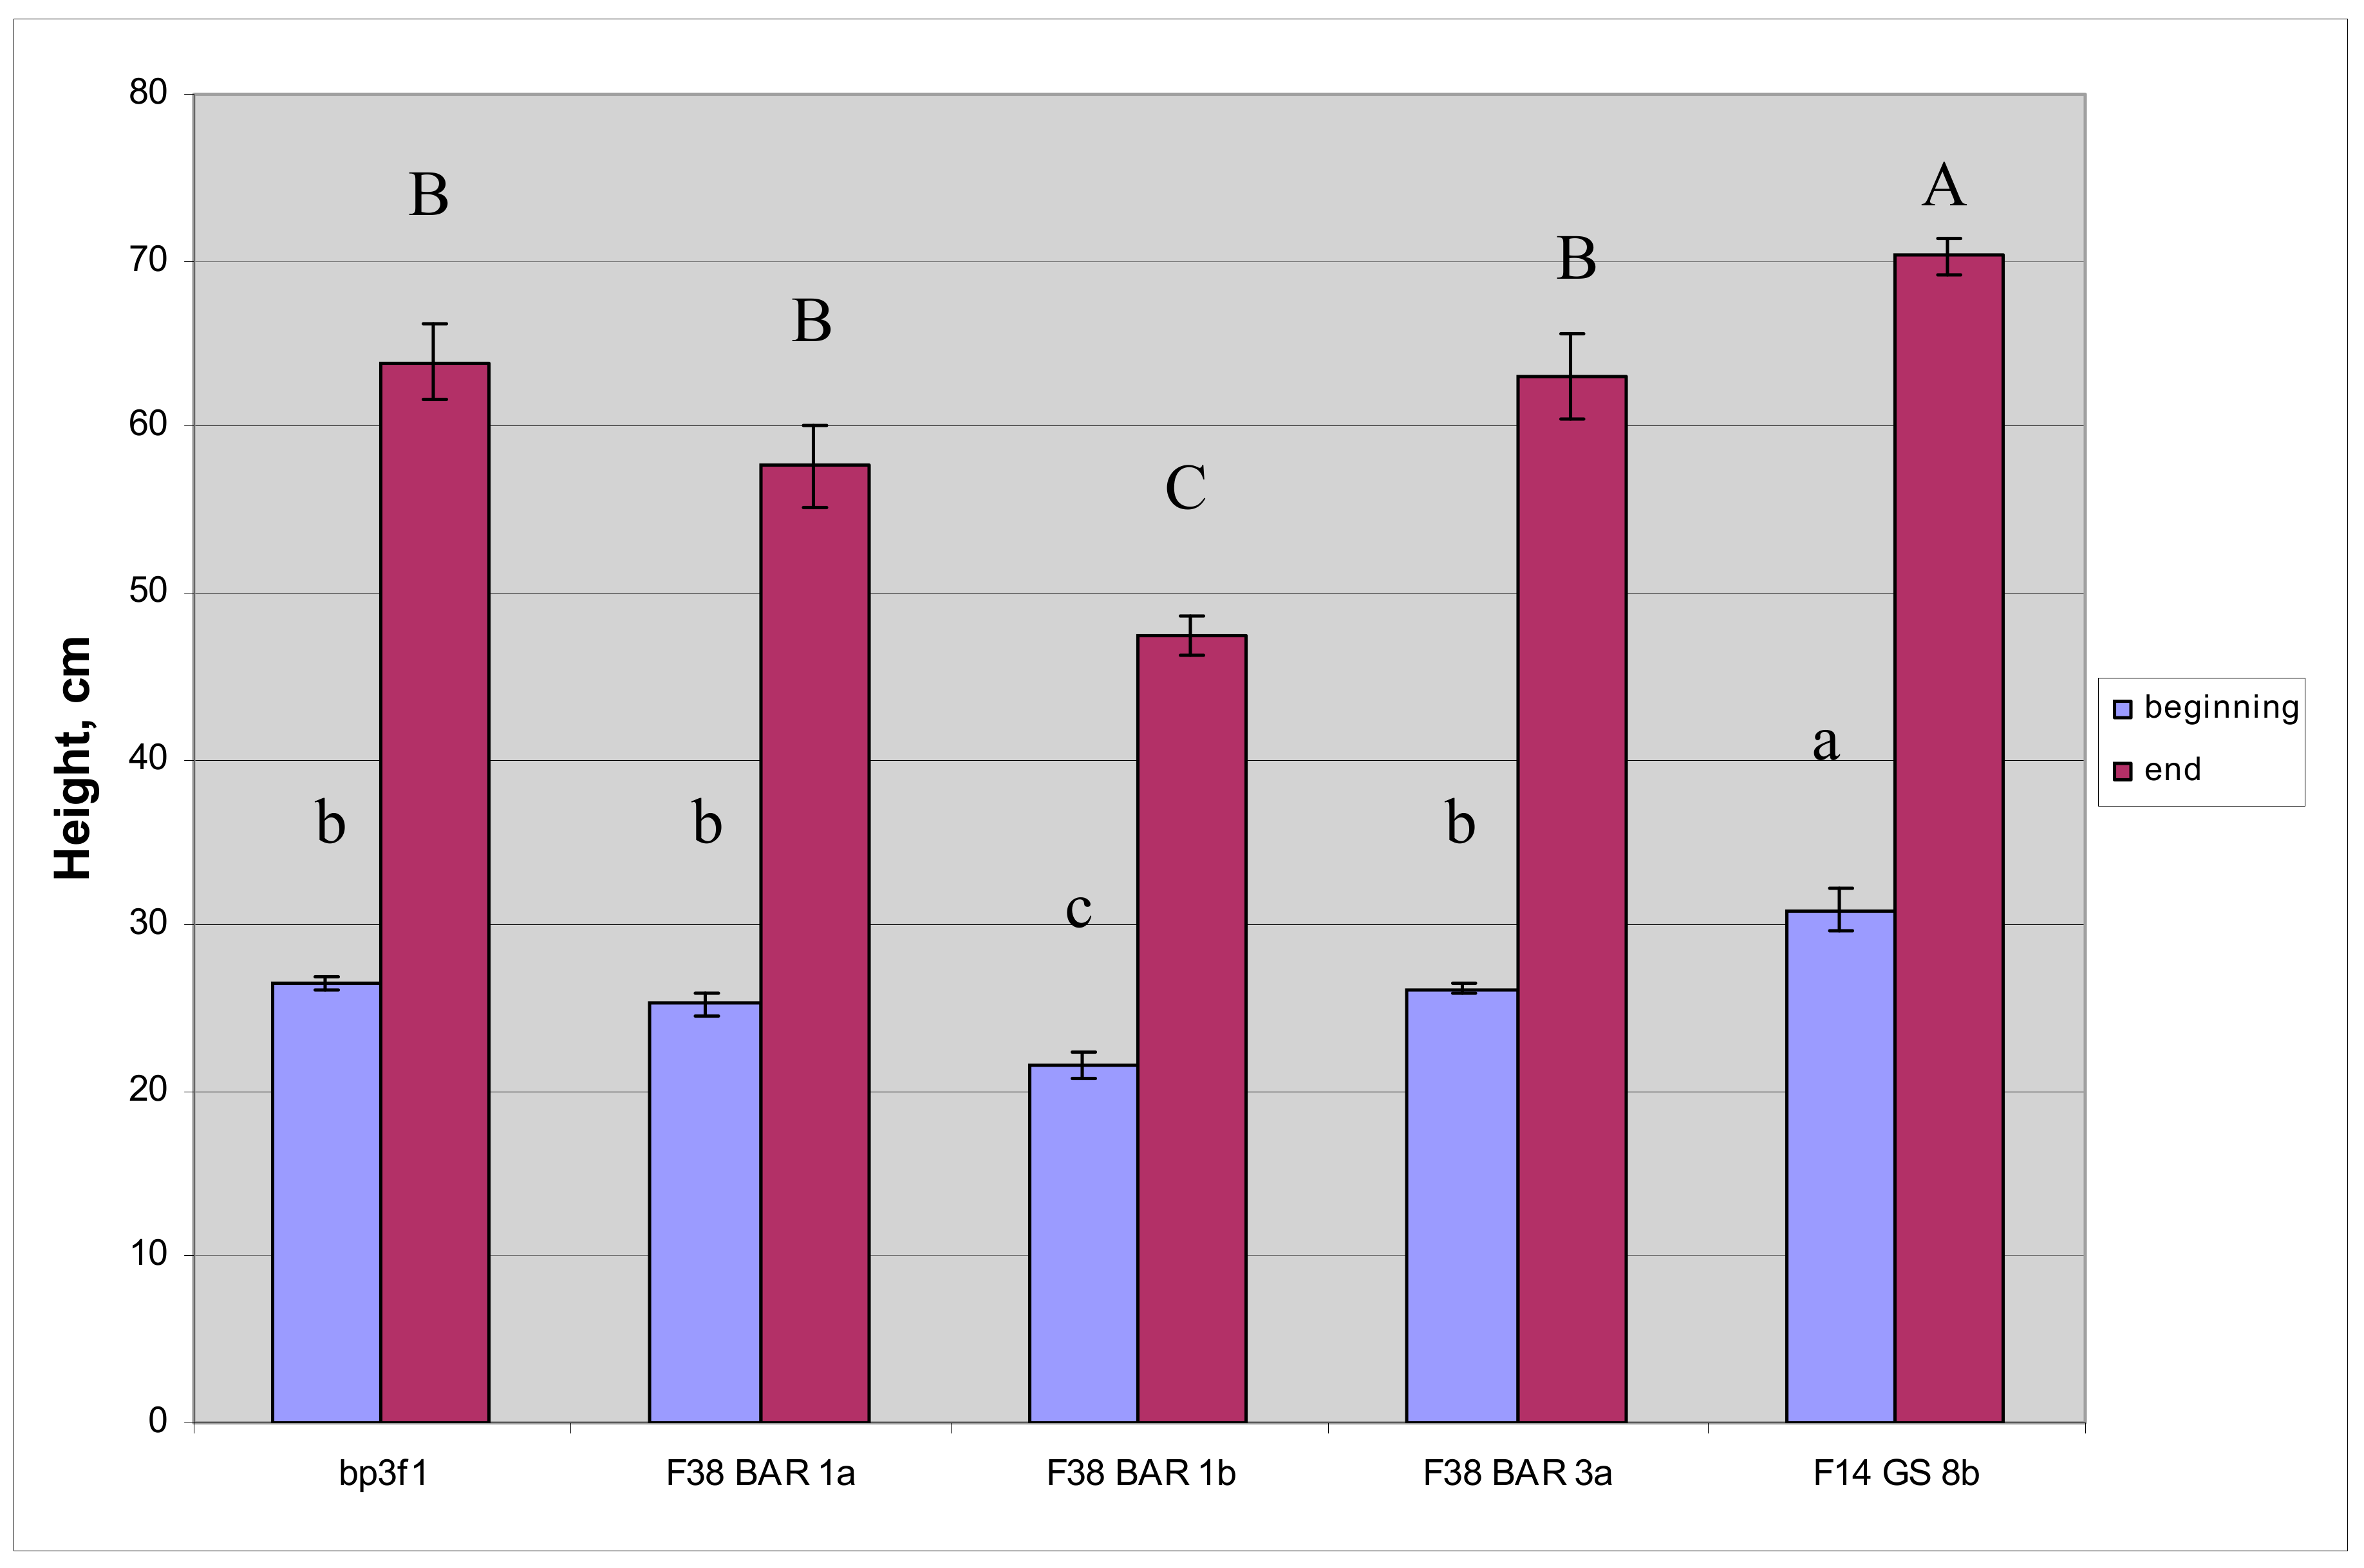
Biometric indicators height and biomass were measured to evaluate effect of: (1) the bar and GS1 genes on the growth of birch plants compared to the wild type; (2) the herbicide treatment on the growth of plants containing the bar gene. For the first objective the height of the transgenic and control lines was measured at the beginning and end of the first growing season. All plants were measured at the beginning of the season, but the control plants and GS8b died after herbicide treatment by the end of the first growing season and were replaced by new plants. The plants of the Bar1a and Bar3a lines did not differ from the control plants, while the Bar1b line plants were significantly lower than the control plants by 19.1% and 25.9% at the beginning and end of the seasons, respectively, while plants of the GS8b line were significantly taller by 16.3% and 9.9%, respectively (Figure 7). For the second objective, the height of transgenic plants containing the bar gene was compared under different treatments of herbicides in various concentrations and with controls (treatment by water without herbicide) at the end of the season. Transgenic plants containing the bar gene did not demonstrate any effect of herbicide treatment on the height regardless of the herbicide content compared to the control (Table 5).
Similar results were obtained at the end of the second year of research. Measurements of the aboveground plant biomass showed significantly faster growth of transgenic plants GS8b containing the GS gene compared to the non-transgenic control by 24.0% (Figure 8).
The Bar1b line continued to lag behind in growth, but the differences were not significant. Neither herbicide treatment (p = 0.114), nor genotype (p = 0.330), nor the interaction of these factors (p = 0.650) had an effect on the aboveground biomass in plant containing the bar gene (Table 6).
4. Discussion
Based on the results obtained in the present study, the transgenic birch saplings containing the bar gene showed a high degree of tolerance to the herbicide when treated under open-air conditions for two years. All three lines demonstrated complete tolerance to treatment by a standard field dose (5 L/ha) and showed slight signs of damage (up to 10% of the surface was necrotized on separate leaves) when treated with a double field dose (10 L/ha) compared to control non-transgenic plants that died completely already after 2.5 L/ha treatment. We are unaware of any other previously published study on the transgenic herbicide-tolerant birch saplings, but other woody species containing the bar gene such as Populus spp. [28,29,30] and Eucalyptus camaldulensis [31] demonstrated similar levels of tolerance sufficient for their commercial use. Minor symptoms of the lesion were observed mainly on the apical leaves. Since GS expression is associated with photosynthetic tissues, young leaves and the apical meristem are the main targets of PPT [8]. In the two-year-old birch saplings, leaf necrosis developed somewhat more slowly compared to the one-year-old plants in our study (Table 1 and Table 2). It should be noted that the wild-type Betula pubescens plants were less sensitive to PPT than Populus tremula plants—complete leaf necrosis was observed in birch saplings after seven or more days, while in aspen plants, complete leaf necrosis occurred three days after being treated with the same doses of herbicide treatment [30].
It is known that increasing the target enzyme activity is one of the strategies for enhancing tolerance to herbicides [32], and the increased GS activity could contribute to a certain tolerance of plants to PPT. For example, in hybrid poplar plants containing the major small heat shock protein (sHSP) gene, an increase in tolerance to PPT in the rooting medium is associated with a 3–4-fold increase in GS activity [33]. Transgenic plants with the GS gene showed slightly lower symptoms of damage at this dose three days after 2.5 L/ha (375 g PPT/ha) treatment, but after seven days, the symptoms were the same as for the non-transgenic (non-transformed) plants. When treated with 5 L/ha (750 g PPT/ha), both transgenic plants containing the GS gene and control plants died. Our data agreed with the results of Pascual et al. [8], where hybrid poplars containing the GS gene were rather more tolerant than the control plants when treated with the 275 g/ha PPT, but after 500 g/ha PPT all the plants died. Thus, increasing the expression of GS genes can slightly increase resistance to PPT, but it is not enough for commercial use of these plants. Attempt to use another ammonium assimilation gene, i.e., glutamate dehydrogenase, to increase tolerance to PPT in tobacco also failed [34].
The GS/GOGAT pathway is the only efficient method in plants to detoxify ammonium released during different metabolic processes [35], and plants are very sensitive to the GS inhibitors, including PPT. The close correlation between ammonium content and herbicidal activity [12] makes it possible to use this indicator to estimate plants’ tolerance to PPT. Ammonium content in leaves of the transgenic plants containing the bar gene remained almost unchanged after three days following treatment with any dose of the herbicide, which indicates a high level of tolerance in all transgenic lines. A number of studies reported significant fluctuations (up to 10 times) in the ammonium content in transgenic lines containing the bar gene after treatment, which were close to the values of non-transgenic control plants [24,36]. Perhaps, this could be connected to the preliminary selection of transgenic birch lines in vitro. In the leaves of control plants, the ammonium content did not depend on the dose of the herbicide; it increased by 4–8 times. De Block et al. [28] reported that one day after treatment of hybrid poplar in the greenhouse, the ammonium in the control group grew by approximately 100 times. However, field treatment of corn plants showed that in three days after treatment, the ammonium content increased by 70% compared with the control (only) water treatment, and it increased by four times in 14 days [37]. Perhaps, the reason lies in the growing conditions, in the greenhouse, a sharp increase is observed, while in the field—only insignificant. It is also possible that a sharp increase in the ammonium content occurred during the first hours after treatment. An increase in ammonium after PPT treatment is characteristic of wild-type plants but it has recently been reported that in various maize lines containing the pat gene, the ammonium content increased of about 12–25 times after treatment with 4 kg of glufosinate per ha [38]. After four days, a decrease by 4–12 times was observed compared with the control group, and only after 14 days the indicators almost equalized.
There are only a few studies to assess the level of ammonium in plants with the GS gene after PPT treatment [30,39]. Treatment of birch saplings containing the GS gene using the 1% herbicide solution caused the same increase in the ammonium levels, as in the non-transgenic control species, but a lower dose increased the ammonium level insignificantly. James et al. [39] showed that overexpression of the GS isoform genes in rice was able to partially neutralize the excess ammonium produced by 0.5% PPT treatment. Thus, additional copies of the GS gene prevented the accumulation of ammonium after treatment by low concentrations of herbicide. In our work, all transgenic and control birch lines had a similar initial level of ammonium—an average of 9–13 μg/g of fresh weight. In our other study of two aspen genotypes and the transgenic lines obtained from them with the bar gene also did not significantly differ in ammonium content, but they contained it almost twice as much as birch saplings—on average 18–24 μg/g fresh weight [30]. At the same time, cotton plants with the pat gene contained three times more ammonium than the control non-transgenic cotton [40] and rice plants with the OsGS1;1 and OsGS2 genes contained three times less ammonium than the control non-transgenic rice [39].
There is no consensus on the causes of plants’ death as a result of PPT treatment—ammonium accumulation or glutamine and glutamate depletion. On the one hand, the addition of glutamine did not produce a significant effect on the PPT herbicidal activity [13,41], and photosynthesis inhibition in amaranth plants after PPT treatment was also accompanied by a significant increase in ammonium levels [42]. On the other hand, addition of glutamine to the Brassica napus culture hairy roots made it possible to overcome the negative effects of PPT treatment [15], and Wendler et al. [14] indicated that NH4 accumulation could not be the primary cause for photosynthesis inhibition in C3 and C4 plants by PPT, although accumulation of ammonium increased significantly. Finally, De Block et al. [43] demonstrated on rapeseed that the mechanism of PPT toxicity in vitro was mainly determined by the tissues’ metabolic activity of tissues, as tissues with high metabolic activity were more sensitive to NH4, and with low metabolic activity—more to glutamine depletion. In general, analysis of alfalfa metabolome showed that the GS inhibition by PPT led to significant alterations in the metabolism of nitrogen and carbon [44]. Recent studies have not clarified this issue. After treatment by 200 g/ha or 400 g/ha of glufosinate-ammonium, cotton plants accumulated similar levels of ammonium, but only plants treated by 400 g/ha died [40]. Leaf disks of six PPP-sensitive Amaranthus palmeri genotypes accumulated on average two times more ammonium than six resistant genotypes, but the maximum for tolerant and the minimum for sensitive species were quite similar [45]. An insignificant increase in ammonium in subsequently dead birch saplings containing the GS gene suggests that it is not ammonium that causes their death. More recently, a third reason for the toxicity of PPT to plants has been proposed. Takano et al. [16] demonstrated that reactive oxygen species are the main driver for rapid cell death after glufosinate treatment resulted in ammonium accumulation, and changes in amino acid levels are probably a secondary effect of the GS inhibition. A similar assumption was previously made by Merino et al. [33], which linked increased resistance to PPT in hybrid poplar expressing small heat shock protein (sHSP) gene with general protection of proteins and membranes against oxidative stress.
Physiological alterations induced by PPT in plants expressing the bar gene still remain unclear [46]. Chlorophylls and carotenoids are the main components of the photosynthetic apparatus, and change in their content could provide information on the physiological state of leaves [47]. Chlorophyll content [7] and fluorescence [48] are among well-known signs in assessing plants’ damage after stress treatment. In our work, birch saplings with the bar gene did not reveal alterations in the chlorophylls and carotenoids content when treated with a standard field dose, but the effect of a double dose depended on the line. The decrease in the pigment content was observed in all the lines, but it was statistically insignificant in the Bar1a line, only the carotenoid content significantly decreased in the Bar1b line, while carotenoids, chlorophyll A and the total of chlorophyll A and B decreased in the Bar3a line (Table 3). Chlorophyll content in soybean plants with PPT tolerance genes did not change after treatment with the herbicide [5], but rice plants with the bar gene were used to show that PPT caused temporary phytotoxicity: chlorophyll content decreased in 1–2 days after treatment and almost completely disappeared after 7–10 days [46].
PPT caused a decrease in chlorophyll content in non-transgenic soybean plants three days after treatment [49]. In non-transgenic birch saplings, three days after treatment with the 0.5% PPT solution, the chlorophyll A and carotenoids content significantly decreased, after the 1% solution the total of chlorophyll A and B also decreased, and after treatment with the 2% solution the same happened to chlorophyll B. However, in plants with the GS gene, the pigment content did not change significantly after treatment with the 0.5% PPT solution, which served as an indicator of increased tolerance to the herbicide action. Insertion of the ginseng glutathione S-transferase gene in tobacco after exposure to PPT in a concentration of 100 mM contributed to a decrease in chlorophyll to a lesser extent than in the control plants, but the damage was the same after concentration was increased by 10 times to 1 M [7]. Our results demonstrated that chlorophyll B was the most resistant, and carotenoids were the least resistant to PPT among the birch leaves’ pigments. Carotenoids are well known for their role in protecting against photooxidative stress [50]. Kozaki et al. [51] showed that transgenic tobacco plants with the transferred chloroplast GS gene possessed increased photorespiration ability, which protected them from photooxidation. In addition, chlorophyll was degrading more slowly in plants with the high GS content. It could be assumed that accumulation of ammonium as a result of PPT action inhibits photorespiration, causing photooxidative stress; and primarily carotenoids are affected in the process of protection against it. In plants with GS gene, the increased level of the enzyme protects against this at the low levels of herbicide, which is confirmed by a low level of ammonium in such plants. It is interesting to note that the chlorophyll content in plants with the bar gene did not differ from the control group, whereas it was lower in the line with the GS gene. Apparently, this is due to individual differences; in transgenic rice plants containing OsGS1 and OsGS2 genes, the level of chlorophyll was significantly higher for only one out of three clones compared to the control group [39].
The water status of a leaf is closely connected to several physiological parameters and is a useful indicator of the plants’ water balance [52]. Transgenic birch saplings with bar or GS genes did not differ from the control plants in RWC. It was also the same in rice control non-transgenic plants and in transgenic plants containing OsGS1 and OsGS2 genes [39]. Estimating the water status of leaves is important in assessing the PPT effects since herbicides containing it in a reduced dose are used as desiccants causing dehydration of plants. Dayan [53] noted that studies on the glufosinate mode of action were not taking into account the rapid drying of foliage caused by its use. Our studies demonstrated that transgenic plants containing the bar gene were not dehydrating when treated with a standard field dose of herbicide, but when treated with a double dose RWC was significantly decreased only in the Bar1b line. At the same time, non-transgenic control plants lost 42% of the initial RWC values in three days after treatment already by the minimum dose of the herbicide, and 65% were lost in a week. In transgenic plants containing the GS gene, water loss was going slower than in control non-transgenic group, i.e., 21% after 2.5 L/ha and 41% after 5 L/ha, which indicated an increase in the tolerance level. After a week, these indicators almost equaled with the control group. Pornprom et al. [37] also reported that differences between the maize varieties with different PPT tolerance smoothed out with an increase in the treatment dose. In two-year-old birch saplings, dehydration was slower.
Despite the fact that a double field dose of the herbicide caused insignificant signs of damage to leaves, slight dehydration, and a decrease in the level of leaf pigments in some birch lines containing the bar gene, this did not lead to a decrease in these plants’ viability. At the end of the first growing season, it turned out that the treatment option (water or various doses of the herbicide) did not significantly affect the height of plants. We are unaware of such studies on transgenic trees containing the bar gene, but field studies on glyphosate-tolerant Populus hybrids showed growth deterioration in 25% of lines after treatment with a 1-fold dose of herbicide and in 17–61% of lines after treatment with a two-fold dose [54].
The height of the saplings in the Bar1 and Bar 3 lines did not differ from control saplings, while saplings in the Bar1b line were significantly lower than control saplings at the beginning and end of the season. This could be either due to the insertion of the bar gene in the wrong place (position effect) or a result of somaclonal variation during transformation and regeneration in vitro. The lines such as this one should not be, of course, considered for commercial use.
Aboveground biomass measurements after two years of growing birch saplings confirmed the absence of significant differences from control plants caused by both transfer of the bar gene (Figure 8) and treating with herbicides (Table 6), although in some lines, the biomass was slightly lower after treatment with the herbicide. Transgenic plants containing the GS gene grew faster than non-transgenic control, which was already noted for poplar hybrid plants with this gene [55].
Our studies have shown that the bar gene provided a high degree of protection against PPT in birch saplings. Expression was stable, and treatment with the herbicide for two years did not lead to a significant decrease in biomass accumulation compared to the control. It turned out that in birch saplings, the GS gene gave only slight resistance to PPT. Other attempts to use additional copies of natural GS genes to protect against PPT did not produce a clear positive result: only limited resistance to a low dose of herbicide has been shown for hybrid poplar [8] and rice [9,39]. Differences in resistance between different Amaranthus palmeri genotypes were also not associated with copy number or GS gene expression [45]. It is possible that the use of mutant GS genes will be more effective, but there are very few such studies, so very few glufosinate-resistant weeds are known. Tian et al. [10] performed DNA shuffling on OsGS1S, and one highly PPT-tolerant mutant with four amino acid alterations was isolated after three rounds of DNA shuffling and screening. This gene was transferred to Arabidopsis, and it provided better protection against PPT compared to the natural form of the gene due to the ability to easily bind with glutamate but not PPT. This mechanism is similar to the glyphosate tolerance of Amaranthus hybridus, where substitution of three amino acids limited glyphosate binding with the EPSPS enzyme [56]. The mechanisms of resistance in glufosinate-resistant genotypes Eleusine indica [18] and Lolium multiflorum [57] have not yet been determined.
The absence of glufosinate-resistant weeds suggests a high specificity of the action of this herbicide and provides it with an advantage over the widely used glyphosate. It was shown that glufosinate from the practical and economic points of view turned out to be the best for the control of glyphosate-tolerant weeds in citrus orchards [58]. However, the study of the metabolome in several PPT-tolerant transgenic cultures demonstrated increased accumulation of acetylamino adipate and acetyl tryptophan, which indicated non-specific activity of the bar gene [59]. Perhaps, a more detailed study of the PPT effect on control and transgenic plants would make it possible to clarify the mechanisms of its action and to develop new methods of protection.
5. Conclusions
Our studies revealed that transgenic birch saplings containing the bar gene were highly tolerant to treatment with the herbicide containing PPT. Insignificant signs of necrosis and a certain decrease in leaf pigments did not affect the viability of such plants. Incorporation of the GS gene increased tolerance of birch saplings to the low dose of herbicide compared to the control plants, which resulted in reduced accumulation of ammonium and absence of a decrease in the leaves’ pigment content. When treated with a standard field dose of herbicides, plants with the GS gene did not differ from the control group. Results suggest that an increase in ammonium is not the main cause of birch saplings’ death from PPT.
Author Contributions
Conceptualization—V.G.L. and K.A.S.; methodology, investigation, formal analysis—V.G.L.; resources—K.A.S.; funding acquisition—K.V.K. and K.A.S.; writing—V.G.L., K.V.K., and K.A.S.
Funding
This research was carried out within the state program of Ministry of Science and High Education of the Russian Federation (theme “Plant molecular biology and biotechnology: their cultivation, pathogen and stress protection (BIBCH)” (No 0101–2019-0037).
Conflicts of Interest
The authors declare no conflict of interest.
References
- Oerke, E.C. Crop losses to pests. J. Agric. Sci. 2006, 144, 31–43. [Google Scholar] [CrossRef]
- Dayan, F.E.; Cantrell, C.L.; Duke, S.O. Natural products in crop protection. Bioorg. Medic. Chem. 2009, 17, 4022–4034. [Google Scholar] [CrossRef] [PubMed]
- Forde, B.G.; Lea, P.J. Glutamate in plants: Metabolism, regulation and signalling. J. Exp. Bot. 2007, 58, 2339–2358. [Google Scholar] [CrossRef] [PubMed]
- OECD. Consensus Document on General Information Concerning the Genes and their Enzymes that Confer Tolerance to Phosphinothricin Herbicide, SERIES on Harmonization of Regulatory Oversight in Biotechnology No. 11, 1999, OECD, Paris. Available online: www.oecd.org/env/biotrack/46815628.pdf (accessed on 30 August 2019).
- Kita, Y.; Hanafy, M.; Deguchi, M. Generation and characterization of herbic ide-resistant soybean plants expressing novel phosphinothricin N-acetyltransferase genes. Breed. Sci. 2009, 59, 245–251. [Google Scholar] [CrossRef]
- Cui, Y.; Liu, Z.; Li, Y.; Zhou, F.; Chen, H.; Lin, Y. Corrigendum: Application of a novel phosphinothricin N-acetyltransferase (RePAT) gene in developing glufosinate-resistant rice. Sci. Rep. 2018, 8, 46937. [Google Scholar] [CrossRef]
- Kim, Y.-J.; Lee, O.R.; Lee, S.; Kim, K.-T.; Yang, D.-C. Isolation and characterization of a theta glutathione S-transferase gene from Panax ginseng Meyer. J. Ginseng Res. 2012, 36, 449–460. [Google Scholar] [CrossRef]
- Pascual, M.B.; Jing, Z.P.; Kirby, E.G.; Canovas, F.M.; Gallardo, F. Response of transgenic poplar overexpressing cytosolic glutamine synthetase to phosphinothricin. Phytochemistry 2008, 69, 382–389. [Google Scholar] [CrossRef]
- Cai, H.; Zhou, Y.; Xiao, J.; Li, X.; Zhang, Q.; Lian, X. Overexpressed glutamine synthetase gene modifies nitrogen metabolism and abiotic stress responses in rice. Plant Cell Rep. 2009, 28, 527–537. [Google Scholar] [CrossRef]
- Tian, Y.-S.; Xu, J.; Zhao, W.; Xing, X.-J.; Fu, X.-Y.; Peng, R.-H.; Yao, Q.-H. Identification of a phosphinothricin-resistant mutant of rice glutamine synthetase using DNA shuffling. Sci. Rep. 2015, 5, 15495. [Google Scholar] [CrossRef]
- Abdeen, A.; Miki, B. The pleiotropic effects of the bar gene and glufosinate on the Arabidopsis transcriptome. Plant Biotech. J. 2009, 7, 266–282. [Google Scholar] [CrossRef]
- Tachibana, K.; Watanabe, T.; Sekizawa, Y.; Takematsu, T. Accumulation of ammonium in plants treated with bialaphos. J. Pestic. Sci. 1986, 11, 33–37. [Google Scholar] [CrossRef]
- Tachibana, K.; Watanabe, T.; Sekizawa, Y.; Takematsu, T. Inhibition of glutamine synthetase and quantitative changes of free amino acids in shoots of bialaphos-treated Japanese barnyard millet. J. Pestic. Sci. 1986, 11, 27–31. [Google Scholar] [CrossRef]
- Wendler, C.; Barniske, M.; Wild, A. Effect of phosphinothricin (glufosinate) on photosynthesis and photorespiration of C3 and C4 plants. Photosynt. Res. 1990, 24, 55–61. [Google Scholar] [CrossRef] [PubMed]
- Downs, C.G.; Christey, M.C.; Maddocks, J.F.S.; Stevenson, D.G. Hairy roots of Brassica napus: I. Applied glutamine overcomes the effect of phosphinothricin treatment. Plant Cell Rep. 1994, 14, 37–40. [Google Scholar] [CrossRef] [PubMed]
- Takano, H.K.; Beffa, R.; Preston, C.; Westra, P.; Dayan, F.E. Reactive oxygen species trigger the fast action of glufosinate. Planta 2019, 249, 1837–1849. [Google Scholar] [CrossRef] [PubMed]
- Heap, I.; Duke, S.O. Overview of glyphosate-resistant weeds worldwide. Pest Manag. Sci. 2018, 74, 1040–1049. [Google Scholar] [CrossRef]
- Jalaludin, A.; Yu, Q.; Zoellner, P.; Beffac, R.; Powlesa, S.B. Characterisation of glufosinate resistance mechanisms in Eleusine indica. Pest Manag. Sci. 2017, 73, 1091–1100. [Google Scholar] [CrossRef] [PubMed]
- McNabb, K.; South, D.B.; Mitchell, R.J. Weed management systems for forest nurseries and woodlands. In Handbook of Weed Management Systems; Smith, A.E., Ed.; Marcel Dekker: New York, NY, USA, 1995; pp. 667–771. [Google Scholar]
- Padegimas, L.; Shulga, O.A.; Skryabin, K.G. Phosphinothricin-resistant transgenic nicotiana-tabacum and solanum-tuberosum plants. Mol. Biol. 1994, 28, 294–297. [Google Scholar]
- Shestibratov, K.A.; Bulatova, I.V.; Novikov, P.S. In vitro response of transgenic aspen containing glutamine synthetase gene GSI to the sublethal dose of phosphinothricin. Appl. Biochem. Microbiol. 2010, 46, 763–768. [Google Scholar] [CrossRef]
- Lebedev, V.G.; Schestibratov, K.A.; Shadrina, T.E.; Bulatova, I.V.; Abramochkin, D.G.; Miroshnikov, A.I. Cotransformation of aspen and birch with three T-DNA regions from two different replicons in one Agrobacterium tumefaciens strain. Russ. J. Genet. 2010, 46, 1282–1289. [Google Scholar] [CrossRef]
- Shestibratov, K.; Lebedev, V.; Podrezov, A.; Salmova, M. Transgenic aspen and birch trees for Russian plantation forests. BMC Proc. 2011, 5 (Suppl. 7), 124. [Google Scholar] [CrossRef]
- De Block, M.; De Brouwer, D.; Tenning, P. Transformation of Brassica napus and Brassica oleracea using Agrobacterium tumefaciens and the expression of the bar and neo genes in the transgenic plants. Plant Physiol. 1989, 91, 694–701. [Google Scholar] [CrossRef] [PubMed]
- Weatherburn, M. Phenol-hypochloride reaction for ammonium. Anal. Chem. 1967, 39, 971–974. [Google Scholar] [CrossRef]
- Wellburn, A.R. The spectral determination of chlorophylls a and b, as well as total carotenoids, using various solvents with spectrophotometers of different resolution. J. Plant Physiol. 1994, 144, 307–313. [Google Scholar] [CrossRef]
- Barr, H.D.; Weatherley, P.E. A re-examination of the relative turgidity technique for estimating water deficit in leaves. Aust. J. Biol. Sci. 1962, 15, 413–428. [Google Scholar] [CrossRef]
- De Block, M. Factors influencing the tissue culture and the Agrobacterium tumefaciens-mediated transformation of hybrid aspen and poplar clones. Plant Physiol. 1990, 93, 1110–1116. [Google Scholar] [CrossRef]
- Confalonieri, M.; Belenghi, B.; Balestrazzi, A.; Negri, S.; Facciotto, G.; Schenone, G.; Delledonne, M. Transformation of elite white poplar (Populus alba L.) cv. ‘Villafranca’ and evaluation of herbicide resistance. Plant Cell Rep. 2000, 19, 978–982. [Google Scholar] [CrossRef]
- Lebedev, V.G.; Faskhiev, V.N.; Kovalenko, N.P.; Schestibratov, K.A.; Miroshnikov, A.I. Testing transgenic aspen plants with bar gene for herbicide resistance under semi-natural conditions. Acta Nat. 2016, 8, 92–101. [Google Scholar] [CrossRef]
- Harcourt, R.L.; Kyozuka, J.; Floyd, R.B.; Bateman, K.S.; Tanaka, H.; Decroocq, V.; Llewellyn, D.J.; Zhu, X.; Peacock, W.J.; Dennis, E.S. Insect- and herbicide-resistant transgenic eucalypts. Mol. Breed. 2000, 6, 307–315. [Google Scholar] [CrossRef]
- Quinn, J.P. Evolving strategies for the genetic engineering of herbicide resistance in plants. Biotech. Adv. 1990, 8, 321–333. [Google Scholar] [CrossRef]
- Merino, I.; Contreras, A.; Jing, Z.-P.; Gallardo, F.; Cánovas, F.M.; Gómez, L. Plantation forestry under global warming: Hybrid poplars with improved thermotolerance provide new insights on the in vivo function of small heat shock protein chaperones. Plant Physiol. 2014, 164, 978–991. [Google Scholar] [CrossRef] [PubMed]
- Nolte, S.A.; Young, B.G.; Mungur, R.; Lightfoot, D.A. The glutamate dehydrogenase gene gdhA increased the resistance of tobacco to glufosinate. Weed Res. 2004, 44, 335–339. [Google Scholar] [CrossRef]
- Miflin, B.J.; Lea, P.J. Amino acid metabolism. Annu. Rev. Plant Physiol. 1997, 28, 299–329. [Google Scholar] [CrossRef]
- Asano, Y.; Ito, Y.; Fukami, M.; Sugiura, K.; Fujiie, A. Herbicide-resistant transgenic creeping bentgrass plants obtained by electroporation using an altered buffer. Plant Cell Rep. 1998, 17, 963–967. [Google Scholar] [CrossRef] [PubMed]
- Pornprom, T.; Chompoo, J.; Grace, B. Glufosinate tolerance in hybrid corn varieties based on decreasing ammonium accumulation. Weed Biol. Manag. 2003, 3, 41–45. [Google Scholar] [CrossRef]
- Krenchinski, F.H.; Carbonari, C.A.; Cesco, V.J.S.; Albrecht, A.J.P.; de Lara Campos Arcuri, M.; de Godoy Maia, I.; Velini, E.D. Glufosinate resistance level is proportional to phosphinothricin acetyltransferase gene expression in glufosinate-resistant maize. J. Agric. Food Chem. 2018, 66, 12641–12650. [Google Scholar] [CrossRef]
- James, D.; Borphukan, B.; Fartyal, D.; Ram, B.; Singh, J.; Manna, M.; Sheri, V.; Panditi, V.; Yadav, R.; Achary, V.M.M. Concurrent Overexpression of OsGS1;1 and OsGS2 genes in transgenic rice (Oryza sativa L.): Impact on tolerance to abiotic stresses. Front. Plant Sci. 2018, 9, 786. [Google Scholar] [CrossRef] [PubMed]
- Carbonari, C.A.; Latorre, D.O.; Gomes, G.L.; Velini, E.D.; Owens, D.K.; Pan, Z.; Dayan, F.E. Resistance to glufosinate is proportional to phosphinothricin acetyltransferase expression and activity in LibertyLink(®) and WideStrike(®) cotton. Planta 2016, 243, 925–933. [Google Scholar] [CrossRef] [Green Version]
- Tsai, C.J.; Wang, C.S.; Wang, C.Y. Physiological characteristics of glufosinate resistance in rice. Weed Sci. 2006, 54, 634–640. [Google Scholar] [CrossRef]
- Coetzer, E.; Al-Khatib, K. Photosynthetic inhibition and ammonium accumulation in Palmer amaranth after glufosinate application. Weed Sci. 2001, 49, 454–459. [Google Scholar] [CrossRef]
- De Block, M.; Sonville, A.D.; Debrouwer, D. The selection mechanism of phosphinothricin is influenced by the metabolic status of the tissue. Planta 1995, 197, 619–626. [Google Scholar] [CrossRef]
- Barsch, A.; Carvalho, H.G.; Cullimore, J.V.; Niehaus, K. GC–MS based metabolite profiling implies three interdependent ways of ammonium assimilation in Medicago truncatula root nodules. J. Biotech. 2006, 127, 79–83. [Google Scholar] [CrossRef]
- Salas-Perez, R.A.; Saski, C.A.; Noorai, R.E.; Srivastava, S.K.; Lawton-Rauh, A.L.; Nichols, R.L.; Roma-Burgos, N. RNA-Seq transcriptome analysis of Amaranthus palmeri with differential tolerance to glufosinate herbicide. PLoS ONE 2011, 13, e0195488. [Google Scholar] [CrossRef]
- Ahn, I.-P. Glufosinate ammonium-induced pathogen inhibition and defense responses culminate in disease protection in bar-transgenic rice. Plant Physiol. 2008, 146, 213–227. [Google Scholar] [CrossRef] [PubMed] [Green Version]
- Selzer, L.J.; Busso, C.A. Pigments and photosynthesis of understory grasses: Light irradiance and soil moisture effects. Russ. J. Plant Physiol. 2016, 63, 224–234. [Google Scholar] [CrossRef]
- Keča, N.; Tkaczyk, M.; Żółciak, A.; Stocki, M.; Kalaji, H.M.; Nowakowska, J.A.; Oszako, T. Survival of European ash seedlings treated with phosphite after infection with the Hymenoscyphus fraxineus and Phytophthora species. Forests 2018, 9, 442. [Google Scholar] [CrossRef] [Green Version]
- Reddy, K.N.; Zablotowicz, R.M.; Bellaloui, N.; Ding, W. Glufosinate effects on nitrogen nutrition, growth, yield, and seed composition in glufosinate-resistant and glufosinate-sensitive soybean. Int. J. Agron. 2011, 2011, 109280. [Google Scholar] [CrossRef]
- Li, Z.; Keasling, J.D.; Niyogi, K.K. Overlapping photoprotective function of vitamin E and carotenoids in Chlamydomonas. Plant Physiol. 2012, 158, 313–323. [Google Scholar] [CrossRef] [Green Version]
- Kozaki, A.; Takeba, G. Photorespiration protects C3 plants from photooxidation. Nature 1996, 384, 557–560. [Google Scholar] [CrossRef]
- Yamasaki, S.; Dillenburg, L.R. Measurements of leaf relative water content in Araucaria angustifolia. Rev. Bras. Fisiol. Veg. 1999, 11, 69–75. [Google Scholar]
- Dayan, F.E. Current status and future prospects in herbicide discovery. Plants 2019, 8, 341. [Google Scholar] [CrossRef] [PubMed] [Green Version]
- Meilan, R.; Han, K.-H.; Ma, C.; DiFazio, S.P.; Eaton, J.A.; Hoien, E.A.; Stanton, B.J.; Crockett, R.P.; Taylor, M.L.; James, R.R.; et al. The CP4 transgene provides high levels of tolerance to Roundup herbicide in field-grown hybrid poplars. Can. J. For. Res. 2002, 32, 967–976. [Google Scholar] [CrossRef]
- Gallardo, F.; Fu, J.; Canton, F.R.; Garcia-Gutierrez, A.; Canovas, F.M.; Kirby, E.G. Expression of a conifer glutamine synthetase gene in transgenic poplar. Planta 1999, 210, 19–26. [Google Scholar] [CrossRef] [PubMed]
- García, M.J.; Palma-Bautista, C.; Rojano-Delgado, A.M.; Bracamonte, E.; Portugal, J.; Alcántara-de la Cruz, R.; De Prado, R. The triple amino acid substitution TAP-IVS in the EPSPS gene confers high glyphosate resistance to the superweed Amaranthus hybridus. Int. J. Mol. Sci. 2019, 20, 2396. [Google Scholar] [CrossRef] [Green Version]
- Brunharo, C.; Takano, H.; Mallory-Smith, C.; Dayan, F.; Hanson, B. Role of Glutamine synthetase isogenes and herbicide metabolism in the mechanism of resistance to glufosinate in Lolium perenne L. spp. multiflorum biotypes from Oregon. J. Agric. Food Chem. 2019, 67, 8431–8440. [Google Scholar] [CrossRef] [Green Version]
- Alcántara-de la Cruz, R.; Domínguez-Martínez, P.A.; da Silveira, H.M.; Cruz-Hipólito, H.E.; Palma-Bautista, C.; Vázquez-García, J.G.; Domínguez-Valenzuela, J.A.; De Prado, R. Management of glyphosate-resistantweeds in Mexican citrus groves: Chemical alternatives and economic viability. Plants 2019, 8, 325. [Google Scholar] [CrossRef] [Green Version]
- Christ, B.; Hochstrasser, R.; Guyer, L.; Francisco, R.; Aubry, S.; Hörtensteiner, S.; Weng, J.K. Non-specific activities of the major herbicide-resistance gene BAR. Nat. Plants 2017, 3, 937–945. [Google Scholar] [CrossRef] [Green Version]
Figure 1.
One-year-old birch saplings seven days after treatment by water and the Basta herbicide: on the left—non-transgenic (control) plants, on the right—plants of the Bar1a transgenic line; in each group from left to right plants were treated by water or 2.5, 5, 10 L/ha solutions of the Basta herbicide, respectively.

Figure 2.
Typical symptoms of leaf damage in the transgenic birch saplings containing the bar gene seven days after treatment by the Basta herbicide.
Figure 2.
Typical symptoms of leaf damage in the transgenic birch saplings containing the bar gene seven days after treatment by the Basta herbicide.

Figure 3.
Two-year-old birch saplings seven days after treatment by water and the Basta herbicide: on the left—non-transgenic (control) plants, on the right—plants of the Bar1a transgenic line; in each group from left to right, plants were treated by water or 2.5, 5, 10 L/ha solutions of the Basta herbicide, respectively.

Figure 4.
Two-year-old birch saplings in 5 weeks after treatment by water and the Basta herbicide: on the left—water treatment, center—2.5 L/ha, on the right—5 L/ha; in each group from left to right there are three plants representing control, GS8b, and Bar1a lines, respectively.
Figure 4.
Two-year-old birch saplings in 5 weeks after treatment by water and the Basta herbicide: on the left—water treatment, center—2.5 L/ha, on the right—5 L/ha; in each group from left to right there are three plants representing control, GS8b, and Bar1a lines, respectively.

Figure 5.
Mean ammonium content in the leaves of one-year-old birch saplings based on four leaves representing one leaf for each of the four saplings per line, respectively. The vertical lines across the top of the bars represent ± standard error intervals; a and b indicate significant statistical differences between the treatments at p < 0.05 for the bp3f1 and GS8b lines; no statistical difference was found between treatments for the bar lines based on ANOVA and DMRT.

Figure 6.
Mean ammonium content in the leaves of two-year-old birch saplings based on four probes representing four saplings per line with four leaves pooled per each sapling, respectively. The vertical lines across the top of the bars represent ± standard error intervals; a, b, c, and d indicate significant statistical differences between treatments at p < 0.05 for the bp3f1 and GS8b lines; no statistical difference was found between the treatments for the bar lines based on ANOVA and DMRT.

Figure 7.
Mean height of plants that were treated only by water in the first vegetation season. Measurements were taken at the beginning of the experiment and based on all 16 saplings per line measured before treatments and at the end based on the four control saplings per line that were treated only by water. Letters indicate significant statistical difference between treatments at p < 0.05 based on ANOVA and DMRT.

Figure 8.
Mean aboveground biomass of two-year-old birch saplings based on four saplings in one non-transgenic (bp3f1) and four transgenic lines. Letters indicate significant statistical difference between lines after all treatments and compared to controls (sprayed by water without herbicides) at p < 0.05 based on ANOVA and DMRT.


Table 1.
Visual scores of necrosis observed on leaves of one-year-old birch saplings in control and transgenic lines treated by the Basta herbicide.
Table 1.
Visual scores of necrosis observed on leaves of one-year-old birch saplings in control and transgenic lines treated by the Basta herbicide.
| Birch Line | Concentration of the Basta Herbicide Solution% | Visual Scores of Necrosis Measured in 3, 7, and 14, or 28 Days after Treatment | ||
|---|---|---|---|---|
| 3 | 7 | 14 or 28 | ||
| bp3f1 (non-transgenic control) | 0.5 | 2–3 | 4 | 5 |
| 1 | 2–3 | 4 | 5 | |
| 2 | 3 | 5 | 5 | |
| Bar1a | 0.5 | 0 | 0 | 0 |
| 1 | 0 | 0 | 0–1 * | |
| 2 | 0 | 0–1 * | 0–1 ** | |
| Bar1b | 0.5 | 0 | 0 | 0 |
| 1 | 0 | 0 | 0 | |
| 2 | 0 | 0–1 * | 0–1 ** | |
| Bar3a | 0.5 | 0 | 0 | 0 |
| 1 | 0 | 0 | 0 | |
| 2 | 0 | 0–1 * | 0–1 ** | |
| GS8b | 0.5 | 2 | 4 | 5 |
| 1 | 2–3 | 4 | 5 | |
Visual scores of necrosis: 0—no damage, 1—up to 25% of the leaf surface, 2—up to 50%, 3—up to 75%, 4—up to 100%, 5—entire leaf necrosis; damage in the line GS8b was not statistically different from controls, while no or minimal damage of up to 5% (*) or 10% (**) was observed in all three lines containing the bar gene that were statistically different from the bp3f1 and GS8b lines.
Table 2.
Visual scores of necrosis observed on the leaves of two-year-old birch saplings in the control and transgenic lines treated by the Basta herbicide.
Table 2.
Visual scores of necrosis observed on the leaves of two-year-old birch saplings in the control and transgenic lines treated by the Basta herbicide.
| Birch Line | Concentration of the Basta Herbicide Solution % | Visual Scores of Necrosis Measured in 1, 3, 7, 14, and 28 Days after Treatment | ||||
|---|---|---|---|---|---|---|
| 1 | 3 | 7 | 14 | 28 | ||
| bp3f1 (non-transgenic control) | 0.5% | 0–1 ** | 1–2 | 3–4 | 4 | 4–5 **** |
| 1% | 0–1 ** | 1–2 | 4 | 5 | 5 | |
| 2% | 0–1 *** | 1–2 | 4 | 5 | 5 | |
| Bar1a | 0.5% | 0 | 0 | 0 | 0 | 0 |
| 1% | 0 | 0 | 0–1 ** | 0–1 ** | 0–1 ** | |
| 2% | 0 | 0–1 * | 0–1 ** | 0–1 ** | 0–1 ** | |
| Bar1b | 0.5% | 0 | 0 | 0 | 0 | 0 |
| 1% | 0 | 0 | 0–1 ** | 0–1 ** | 0–1 ** | |
| 2% | 0 | 0–1 * | 0–1 ** | 0–1 *** | 0–1 *** | |
| Bar3a | 0.5% | 0 | 0 | 0 | 0 | 0 |
| 1% | 0 | 0 | 0–1 ** | 0–1 ** | 0–1 ** | |
| 2% | 0 | 0–1 * | 0–1 ** | 0–1 ** | 0–1 ** | |
| GS8b | 0.5% | 0–1 ** | 1–2 | 2–3 | 4 | 4–5 **** |
| 1% | 0–1 ** | 1–2 | 3–4 | 5 | 5 | |
Visual scores of necrosis: 0—no damage, 1—up to 25% of the leaf surface, 2—up to 50%, 3—up to 75%, 4—up to 100%, 5—entire leaf necrosis; damage in the line GS8b was not statistically different from the controls, while no or minimal damage of up to 5% (*), 10% (**), or 25% (***) was observed in all three lines containing the bar gene that were statistically different from the bp3f1 and GS8b lines; ****—bud germination.
Table 3.
Mean chlorophyll and carotenoids content in leaves of one-year-old birch treated by the Basta herbicide and in control.
Table 3.
Mean chlorophyll and carotenoids content in leaves of one-year-old birch treated by the Basta herbicide and in control.
| Birch Line | Herbicide Content in Water % | Days after Treatment 1 | Chlorophyll 2, µg/mg FW | Carotenoids 2, µg/mg FW | ||
|---|---|---|---|---|---|---|
| A | B | A + B | ||||
| bp3f1 (non-transgenic control) | 0 (control) | 0 | 1.860 | 0.409 | 2.269 | 0.632 |
| 3 | 1.847 | 0.429 | 2.276 | 0.585 | ||
| 7 | 1.838 | 0.414 | 2.252 | 0.537 | ||
| 0.5 | 0 | 1.716 a | 0.381 | 2.097 | 0.650 a | |
| 3 | 1.498 b | 0.391 | 1.889 | 0.468 b | ||
| 7 | - | - | - | - | ||
| 1 | 0 | 1.807 a | 0.392 | 2.199 a | 0.647 a | |
| 3 | 1.474 b | 0.356 | 1.830 b | 0.475 b | ||
| 7 | - | - | - | - | ||
| 2 | 0 | 1.967 a | 0.441 a | 2.409 a | 0.691 a | |
| 3 | 1.378 b | 0.361 b | 1.739 b | 0.416 b | ||
| 7 | - | - | - | - | ||
| Bar1a | 0 (control) | 0 | 1.715 | 0.385 | 2.100 | 0.581 |
| 3 | 1.692 | 0.391 | 2.083 | 0.590 | ||
| 7 | 1.744 | 0.417 | 2.161 | 0.616 | ||
| 0.5 | 0 | 1.754 | 0.427 | 2.181 | 0.551 | |
| 3 | 1.782 | 0.457 | 2.239 | 0.607 | ||
| 7 | 1.729 | 0.429 | 2.158 | 0.618 | ||
| 1 | 0 | 1.814 | 0.416 | 2.230 | 0.587 | |
| 3 | 1.730 | 0.439 | 2.169 | 0.548 | ||
| 7 | 1.748 | 0.424 | 2.172 | 0.517 | ||
| 2 | 0 | 1.791 | 0.391 | 2.182 | 0.617 | |
| 3 | 1.741 | 0.409 | 2.150 | 0.574 | ||
| 7 | 1.665 | 0.364 | 2.029 | 0.549 | ||
| Bar1b | 0 (control) | 0 | 1.781 | 0.449 | 2.230 | 0.625 |
| 3 | 1.760 | 0.439 | 2.199 | 0.575 | ||
| 7 | 1.870 | 0.446 | 2.316 | 0.575 | ||
| 0.5 | 0 | 2.101 | 0.606 | 2.708 | 0.702 | |
| 3 | 1.945 | 0.564 | 2.509 | 0.667 | ||
| 7 | 1.913 | 0.552 | 2.464 | 0.658 | ||
| 1 | 0 | 1.997 | 0.519 | 2.517 | 0.717 | |
| 3 | 2.031 | 0.537 | 2.569 | 0.656 | ||
| 7 | 1.891 | 0.513 | 2.404 | 0.567 | ||
| 2 | 0 | 2.040 | 0.518 | 2.558 | 0.712 a | |
| 3 | 1.980 | 0.523 | 2.503 | 0.569 ab | ||
| 7 | 1.693 | 0.454 | 2.148 | 0.529 b | ||
| Bar3a | 0 (control) | 0 | 1.748 | 0.404 | 2.152 | 0.588 |
| 3 | 1.793 | 0.411 | 2.204 | 0.583 | ||
| 7 | 1.675 | 0.399 | 2.074 | 0.513 | ||
| 0.5 | 0 | 1.646 | 0.361 | 2.007 | 0.591 | |
| 3 | 1.627 | 0.350 | 1.976 | 0.551 | ||
| 7 | 1.658 | 0.379 | 2.036 | 0.496 | ||
| 1 | 0 | 1.684 | 0.379 | 2.064 | 0.561 | |
| 3 | 1.452 | 0.306 | 1.759 | 0.497 | ||
| 7 | 1.586 | 0.370 | 1.956 | 0.483 | ||
| 2 | 0 | 1.617 a | 0.325 | 1.941 a | 0.592 a | |
| 3 | 1.399 b | 0.294 | 1.692 b | 0.472 b | ||
| 7 | 1.151 c | 0.261 | 1.411 c | 0.381 c | ||
| GS8b | 0 (control) | 0 | 1.560 | 0.343 | 1.903 | 0.595 |
| 3 | 1.619 | 0.365 | 1.984 | 0.535 | ||
| 7 | 1.774 | 0.389 | 2.163 | 0.607 | ||
| 0.5 | 0 | 1.579 | 0.354 | 1.933 | 0.580 | |
| 3 | 1.592 | 0.345 | 1.937 | 0.541 | ||
| 7 | - | - | - | - | ||
| 1 | 0 | 1.602 a | 0.397 a | 1.999 a | 0.601 a | |
| 3 | 1.257 b | 0.279 b | 1.536 b | 0.470 b | ||
| 7 | - | - | - | - | ||
1 “0” means control measurements that were done on the same day of treatment, but before treatment; 2 a,b, and c—indicate significant statistical differences between treatments at p < 0.05 based on ANOVA and DMRT. Means were based on four leaves representing one leaf for each of the four saplings per line, respectively.
Table 4.
Mean relative water content (RWC, %) in leaves of one year-old and two-year-old birch saplings treated by the Basta herbicide and in the controls in the first and second seasons measured on the same day before treatment (0), and after 3 and 7 days, respectively.
Table 4.
Mean relative water content (RWC, %) in leaves of one year-old and two-year-old birch saplings treated by the Basta herbicide and in the controls in the first and second seasons measured on the same day before treatment (0), and after 3 and 7 days, respectively.
| Birch Line | Herbicide Content in Water % | First Season 1 | Second Season 1 | |||
|---|---|---|---|---|---|---|
| Same Day | 3 Days | 7 Days | Same Day | 3 Days | ||
| bp3f1 (non-transgenic control) | 0 (control) | 82.2 | 82.4 a | 81.3 a | 83.6 | 82.9 a |
| 0.5 | 82.0 | 47.4 b | 28.6 b | 86.7 | 78.8 b | |
| 1 | 81.8 | 41.4 b | 29.3 b | 83.9 | 78.1 b | |
| 2 | 83.0 | 42.6 b | 22.1 b | 84.3 | 70.1 c | |
| Bar1a | 0 (control) | 82.6 | 83.2 | 81.5 | 87.3 | 87.6 |
| 0.5 | 82.2 | 83.5 | 81.2 | 89.5 | 87.2 | |
| 1 | 83.1 | 83.1 | 82.0 | 86.1 | 87.6 | |
| 2 | 82.9 | 78.6 | 79.3 | 86.5 | 86.7 | |
| Bar1b | 0 (control) | 82.2 | 81.4 a | 81.3 a | 84.6 | 84.5 |
| 0.5 | 83.1 | 82.1 a | 83.3 a | 85.9 | 86.3 | |
| 1 | 82.1 | 83.7 a | 82.9 a | 85.1 | 85.8 | |
| 2 | 81.5 | 72.7 b | 75.0 b | 86.5 | 86.4 | |
| Bar3a | 0 (control) | 83.3 | 83.0 | 82.2 | 83.7 | 85.3 |
| 0.5 | 81.5 | 82.7 | 82.9 | 86.9 | 87.0 | |
| 1 | 81.1 | 83.4 | 83.2 | 85.0 | 88.4 | |
| 2 | 82.9 | 77.7 | 77.9 | 84.6 | 85.5 | |
| GS8b | 0 (control) | 83.0 | 82.0 a | 81.9 a | 84.2 | 84.7 a |
| 0.5 | 82.8 | 64.5 b | 34.5 b | 86.4 | 82.8 ab | |
| 1 | 81.6 | 48.7 c | 30.5 b | 82.6 | 77.2 b | |
1 a, b, and c indicate significant statistical difference between treatments at p < 0.05 based on ANOVA and DMRT. Means for one-year-old saplings were based on four leaves representing one leaf for each of the four saplings per line, respectively; means, two-year-old saplings were based on four probes representing four saplings per line with four leaves pooled per each sapling, respectively.
Table 5.
Mean height (cm) of the plants and mean ± standard error in three transgenic lines containing the bar gene at the end of the first season 1.
Table 5.
Mean height (cm) of the plants and mean ± standard error in three transgenic lines containing the bar gene at the end of the first season 1.
| Herbicide Content in Water % | Bar1a | Bar1b | Bar3a |
|---|---|---|---|
| 0 (control treatment) | 57.6 ± 2.5 | 47.4 ± 1.2 | 63.0 ± 2.6 |
| 0.5 | 57.8 ± 4.7 | 48.2 ± 3.4 | 63.9 ± 2.9 |
| 1 | 53.5 ± 2.4 | 51.1 ± 5.0 | 69.4 ± 3.0 |
| 2 | 54.1 ± 1.9 | 52.6 ± 1.1 | 64.7 ± 3.9 |
1 No statistical difference was found between treatments by herbicide and the controls for each bar line based on ANOVA and DMRT. Means and their ± standard errors were based on four leaves representing one leaf for each of the four saplings per line, respectively.
Table 6.
Mean aboveground biomass (g fresh weight) of plants and their mean ± standard error in three transgenic lines containing the bar gene at the end of the second season 1.
Table 6.
Mean aboveground biomass (g fresh weight) of plants and their mean ± standard error in three transgenic lines containing the bar gene at the end of the second season 1.
| Herbicide Content in Water % | Bar1a | Bar1b | Bar3a |
|---|---|---|---|
| 0 (control treatment) | 29.8 ± 3.4 | 24.9 ± 2.3 | 29.4 ± 2.1 |
| 0.5 | 24.7 ± 2.0 | 25.4 ± 1.6 | 23.5 ± 1.2 |
| 1 | 26.3 ± 2.7 | 21.6 ± 2.0 | 25.5 ± 1.6 |
| 2 | 24.5 ± 2.6 | 24.5 ± 1.9 | 24.4 ± 1.6 |
1 No statistical difference was found between treatments by herbicide and the control for each bar line was based on ANOVA and DMRT. Means and their ± standard errors were based on four saplings per line.
© 2019 by the authors. Licensee MDPI, Basel, Switzerland. This article is an open access article distributed under the terms and conditions of the Creative Commons Attribution (CC BY) license (http://creativecommons.org/licenses/by/4.0/).
Share and Cite
MDPI and ACS Style
Lebedev, V.G.; Krutovsky, K.V.; Shestibratov, K.A. Effect of Phosphinothricin on Transgenic Downy Birch (Betula pubescens Ehrh.) Containing bar or GS1 Genes. Forests 2019, 10, 1067. https://doi.org/10.3390/f10121067
AMA Style
Lebedev VG, Krutovsky KV, Shestibratov KA. Effect of Phosphinothricin on Transgenic Downy Birch (Betula pubescens Ehrh.) Containing bar or GS1 Genes. Forests. 2019; 10(12):1067. https://doi.org/10.3390/f10121067
Chicago/Turabian StyleLebedev, Vadim G., Konstantin V. Krutovsky, and Konstantin A. Shestibratov. 2019. "Effect of Phosphinothricin on Transgenic Downy Birch (Betula pubescens Ehrh.) Containing bar or GS1 Genes" Forests 10, no. 12: 1067. https://doi.org/10.3390/f10121067
Note that from the first issue of 2016, this journal uses article numbers instead of page numbers. See further details here.