Effects of Warming and Nitrogen Addition on the Soil Bacterial Community in a Subtropical Chinese Fir Plantation
by
Lin Xie
1, 
Qunjie Zhang
2,3,
Jiling Cao
1,
Xiaofei Liu
1,
Decheng Xiong
1,
Qian Kong
3 and
Yusheng Yang
1,* 1
Key Laboratory for Subtropical Mountain Ecology (Ministry of Science and Technology and Fujian Province Funded), School of Geographical Science, Fujian Normal University, Fuzhou 350007, China
2
Institution of Genomics and Bioinformatics, South China Agricultural University, Guangzhou 510642, China
3
Agro-biological Gene Research Center, Guangdong Academy of Agricultural Sciences, Guangzhou 510640, China
*
Author to whom correspondence should be addressed.
Forests 2019, 10(10), 861; https://doi.org/10.3390/f10100861
Submission received: 9 August 2019
/
Revised: 17 September 2019
/
Accepted: 24 September 2019
/
Published: 2 October 2019
(This article belongs to the Special Issue Forest Microbial Communities and Processes)
Abstract
:Soil warming has the potential to alter bacterial communities, affecting carbon (C) storage and nitrogen (N) cycling in forest ecosystems. We studied bacterial community changes by warming soil and adding two N-levels (40 and 80 kg N ha−1 year−1) for two years in a subtropical plantation of Chinese fir (Cunninghamia lanceolate (Lamb.) Hook) in southern China. Soil warming significantly changed the bacterial community structure, causing decreases in Proteobacteria and Acidobacteria, while increasing Actinobacteria and Chloroflexi. The high N addition had a greater impact on the bacterial community structure than the low N addition. Warming shifted the bacterial community towards oligotrophic taxa, while N addition could dilute this tendency. Results of the ecological networks indicated that warming resulted in a more complicated co-occurrence network and an increased interaction between different phylum communities, while N addition enhanced the cooperation within communities pertaining to the same phylum. The changes to the soil properties, typical catabolism enzymes, and plant growth also showed that soil warming and N addition accelerated the C and N cycles in the soil, and lead to an increased upward flow of N (from underground to aboveground) and decomposition rate of soil organic carbon (SOC). Overall, the results provided insights into the bacterial community and soil C and N cycling change at a subtropical plantation.
1. Introduction
Warming and nitrogen (N) deposition are important factors to consider in future global environmental change scenarios. It has been estimated that global land surface temperatures may increase by 2.6–4.8 °C by the end of this century [1]. With progressing industrialization, global N deposition is expected to increase 50%–100% by the year 2030 [2]. China has become the third largest N deposition area in the world. N deposition in the subtropical zone ranges between 26–55 kg N ha−1 year−1 [3,4].
Forest soils have a diverse microbial community. Most of the studies on forest soil ecology have focused on fungi, as fungi are considered the main components of soil because of their symbiotic and decomposition attributes, which are critical for soil nutrient cycling and dynamics [5,6,7]. Although bacterial communities greatly contribute to key soil biogeochemical processes, far less is known about them in forest soil environments.
Many warming experiments have been conducted in boreal and temperate forest ecosystems [8,9,10,11,12,13,14,15,16]. Most of them reported that bacterial biomass in the warming treatments did not significantly differ from that in the control treatments; nevertheless, the bacterial diversity changed [8,9,10,11,12,14]. DeAngelis et al. [8] found that a short-term increase in CO2 emissions with warming, as well as slowed CO2 emissions following this initial increase, indicated that labile C was depleted, and there was a shift in microbial carbon use efficiency. Previous studies also found that warming could affect the composition of the soil bacterial community toward the taxa that favor using complex C sources [9,17]. Particularly, the abundance of Alphaproteobacteria, Acidobacteria, and Actinobacteria increased under warming conditions [8,9,10,14], suggesting that the lifestyle of the soil bacteria community changed to oligotrophic in response to the temperature increase. Alterations in the bacterial community’s composition would likely affect soil C cycling.
Nitrogen deposition can influence the bacterial community’s composition in forest soils. Many studies found that N addition reduced the soil bacterial biomass [18,19,20,21,22,23,24] and diversity [25,26,27,28]. Some bacterial phyla (e.g., the Bacteroidetes, Gammaproteobacteria, Proteobacteria, Acidobacteria, and Verrucomicrobia) tended to decrease, while Firmicutes and Actinobacteria tended to increase after N addition [21,22,23,25,26,27,28]. Turlapati et al. [21] found that Acidobacteria did not generally respond to N addition, but some subgroups of this phylum were significantly affected. However, some studies in fir plantations in subtropical China found that N addition accelerated soil microbial biomass and functional diversity [29], increased bacterial phospholipid fatty acids (PLFAs) [30], with no significant effect on the soil bacterial diversity, and increased the abundance of Proteobacteria group [31]. These findings suggest that the response of soil bacterial communities to N deposition may be complex.
Although many warming experiments have been conducted, previous studies have rarely focused on the interactive effects of warming and N addition, especially in tropical and subtropical forests [32]. Warming was observed to affect the N cycle in soil, and the soil warming effect may be diluted by N deposition [33]. Compared with the temperate and boreal forests, tropical and subtropical forest soils are highly weathered and N-rich because of a faster N cycling [34]. Thus, the effects of both warming and N deposition on tropical and subtropical forest ecosystems could be wholly different from those on temperate or boreal forest ecosystems.
The Chinese fir (Cunninghamia lanceolata (Lamb.) Hook) is the most important plantation tree species in terms of areal coverage, both in China and generally on Earth. It covers 17 × 106 ha in China, corresponding to 24% of the forest plantations in China and to 6.3% of those on Earth [35]. Hence, Chinese fir plantations have great implications on global carbon cycling [35]. In this experiment, we used a Chinese fir plantation as a model system to examine the effects of warming and N addition on the structure and composition of the soil bacterial community. We hypothesized that: (1) warming will have a greater effect on soil bacterial community structure; (2) warming will shift the bacterial community towards oligotrophic taxa, but combined with N addition the warming effect will be offset; and (3) warming may make the relationships and interactions among bacterial species more complicated.
2. Materials and Methods
2.1. Study Sites and Experimental Design
As described previously in Zhang et al. [36], the experiment was conducted at the Fujian Normal University’s Forest Ecosystem and Global Change Research Station at the Chenda site, Sanming City, Fujian Province of China (26°19′ N, 117°36′ E). This site is situated on latosol soil, which has been classified as clay, gibbsite-mixed, thermal, and Typic Hapludult. Its color, when moist, corresponds to 2.5YR5/4. The regional climate is typical of a subtropical monsoon: the average annual precipitation, temperature, and evaporation are 1670 mm, 19.1 °C, and 1585 mm, respectively. Moreover, the site is located 300 m above sea level.
For our experiment, we used a randomized complete block factorial design, in which warming and N fertilization were the fixed factors. The design included 30 mini-plots (2 m width × 2 m length). The indigenous soil of these plots was replaced with sieved topsoil from a nearby forest area, down to a depth of 60 cm. Then, a Polyvinyl chloride (PVC) sheet (200 cm width × 60 cm depth) was buried vertically in each plot. Four C. lanceolata seedlings were planted in each plot in November 2013.
Artificial warming and N addition were conducted in March 2014, and soils were sampled in April of 2016. Warming plots were heated continuously from March 2014. A series of warming cables were buried in a spiral pattern, at a depth of 10 cm below the ground, which were used to increase the soil temperature in the warmed plots by 5 °C compared to the control plots. The control and unwarmed plots included “dummy” heating cables, which had the same shape and size as the real heating cables, in order to avoid disturbance effects. During this same period, two N addition levels (40 N/ha/year and 80 kg N/ha/year, respectively) were applied to the N addition plots in the form of NH4NO3. The control and unfertilized plots received the same quantity of deionized water as the fertilized plots. Only in the fertilized plots, however, N was added at the beginning of each month.
2.2. Collection and Properties of the Soil Samples
The soils were sampled in April of 2016, two years after the initiation of the treatments. The average soil temperature in April was ~20 °C, while the average annual temperature was 19.1 °C. Moreover, the temperature of the warmed plots in April was between 24–26 °C. Five soil cores were taken randomly between 0–10 cm depth in each plot using a 5-cm soil sampler. We collected six treatments: untreated (CT), warming (W), light N addition (LN), high N addition (HN), warming combined with light N addition (WLN), and warming combined with high N addition (WHN). Each treatment contained five repetitions. All soil samples were immediately stored in an icebox and then transported to the laboratory. Each soil sample was passed through a 2-mm sieve to remove roots, organic debris, and rocks. The sieved soils were then stored in a refrigerator: those destined for chemical analysis were stored at a temperature of 4 °C, while those destined for DNA extraction were stored at −20 °C.
One subsample was used for the analysis of NO3−, NH4+, and available P. Another subsample was used to determine of total soil of C and N under high-temperature oxidation, using a CN analyzer (Elementar Vario MAX, Hanau, Germany). Soil pH was measured using a mixture of soil and water at a ratio of 1:2.5. For the NO3− and NH4+ analyses, 5 g of fresh soil was extracted from each sample, using a 2-mol/L KCl solution. These solutions were then shaken for 40 min and filtered using a continuous flow analyzer (SKALAR San++, Breda, Holland). The available P was determined by the Mehlich-3 method [37]. Three grams of soil was put into a 150 mL disposable plastic cup, creating a solution of soil and M3 (at a ratio of 1:10, respectively). Then, this solution was shaken for 5 min on an orbital shaker at 200 rpm before being filtered through Whatman No. 42 filter paper. The supernatant was used to determine the available P by using the continuous flow analyzer (SKALAR San++, Breda, Holland).
The activities of the soil enzymes involved in C and N mineralization were also measured. They included two hydrolytic enzymes (i.e., β-glucosidase (βG) and cellobiohydrolase (CBH)) and two oxidases enzymes (i.e., phenol oxidase (PHO) and peroxidase (PEO)). The activities of substrate-labeled hydrolytic enzymes were marked using 4-methylumbelliferone (MUB) as a substrate, while the activities of oxidases enzymes were estimated using L-dihydroxyphenylalanine (L-DOPA). For each sample, 1 g of fresh soil was sieved through a 2-mm mesh sieve and mixed with 125 mL of a 50 mM acetate buffer (pH = 5.0). The solution was then homogenized, by stirring it for 5 min using a magnetic stir bar, before a sub-sample was extracted (200 µL) by a pipettor and placed in a 96-well plate. The mixtures were then incubated in the dark for 4 h (in the case of hydrolytic enzymes) and 18 h (in the case of oxidases enzymes) at 20 °C. Following incubation, the sample fluorescence was measured using 365 nm excitation and 450 nm emission filters (in the case of hydrolase enzymes) or absorbance filters at 450 nm (in the case of oxidases enzymes) on a Synergy H4 Microplate Reader (Bio-Tek, Gene Co. limited, Winooski, VT, USA).
2.3. DNA Extraction, PCR, and Sequencing
From each sample, 0.25 g of soil was used for soil DNA extraction, using a Power Soil DNA isolation kit (MoBio, Carlsbad, CA, USA). Targeted metagenomic profiling of the samples was carried out by sequencing the V4–V5 region, between 515–907, of the bacterial 16S rRNA (515F: 5′-GTGCCAGCMGCCGCGGTAA-3′; 907R: 5′-CCGTCAATTCCTTTGAGTTT-3′). The PCR reactions were carried out with a Phusion High-Fidelity PCR Master Mix (New England Biolabs Inc., Ipswich, MA, USA). The PCR products were mixed in equally dense ratios, and the mixture of PCR products was purified using a Qiagen Gel Extraction Kit (Qiagen, Hilden, Germany). Sequencing libraries were generated using a TruSeq DNA PCR-Free Sample Preparation Kit (Illumina Inc., San Diego, CA, USA), following the manufacturer’s recommendations and adding index codes. Library quality was assessed through a Qubit 2.0 Fluorometer (Thermo Scientific Inc., Waltham, MA, USA) and an Agilent Bioanalyzer 2100 system (Agilent Inc., Santa Clara, MA, USA). Finally, the library was sequenced on an Illumina HiSeq 2500 platform (Illumina Inc., San Diego, CA, USA), generating 250 bp paired-end reads.
2.4. Sequencing Data Analysis
After removal of low-quality (Phred score <30) and un-paired reads, these paired-end reads were merged using FLASH (v1.2.7) [38], which is a very fast and accurate analysis tool designed to merge paired-end reads when at least some of the reads overlap with those generated from the opposite end of the same DNA fragment. We called the splicing sequences ‘raw tags’. High-quality clean tags were obtained using QIIME (v1.7.0) [39] under specific filtering conditions [40]. The remaining tags were then compared with the Gold database through the UCHIME algorithm (v4.1) [39], to detect and remove chimera sequences [41].
We performed sequence analyses using the Uparse software (v7.0.1001) [42]. The sequences were assigned to the same operational taxonomic units (OTUs) for similarities >97%. The taxonomic information of each representative sequence was classified through an Ribosomal Database Project (RDP) classifier (v2.2) [43] algorithm against the GreenGene database [44]. The phylogenetic relationship of different OTUs and the differences in dominant species among different samples were determined by multiple sequence alignment, using MUSCLE (v 3.8.31) [45]. Finally, the OTU abundance information was normalized using a standard sequence number corresponding to the sample with the least sequences.
2.5. Statistical Analyses
For α-diversity, QIIME (v1.7.0) [39] was used to calculate the observed-species, Chao1, Shannon, Simpson, Abundance-based Coverage Estimator (ACE), and Good’s coverage indexes for all samples. A cluster analysis was preceded by a principal component analysis (PCA), in order to reduce the original number of variables to a few dimensions, using the FactoMineR (v1.32) and the ggplot2 packages in R (v2.15.3). A principal coordinate analysis (PCoA) was performed using the WGCNA package in order to obtain the principal coordinates and visualize them in the form of multidimensional data. Non-metric multi-dimensional scaling (NMDS) was done using the vegan package in R (v3.2.2) [46]. Weighted and unweighted pair-group methods using arithmetic means (WPGMA and UPGMA hierarchical clustering) were applied using QIIME (v1.7.0) [39], in order to interpret the distance matrix with the average linkage algorithm.
Additional statistical analyses were carried out using R (v3.2.2). We detected differentially abundant microbial community levels (i.e., phylum, class, order, family, genus, and species) using the t-test and MetaStat [47,48]. Afterwards, we used the LEfSe (linear discriminant analysis effect size, v1.0) method to identify biomarkers that were statistically different among the treatments [49]. The analysis of group similarities (Anosim) and the multiple response permutation procedure (MRPP), performed in R (v3.2.2), tested the significance of differences between two or more treatments. Differentially abundant OTUs were detected using the BioConductor package DESeq2 [50], using a maximum likelihood estimate (MLE) approach for the log2 fold change.
Network analyses were carried out to investigate interrelationships and interactions within the bacterial community. In order to analyze the networks, all possible Pearson’s rank correlation coefficients were calculated through Weighted correlation network analysis (WGCNA) network analysis in R (v3.2.2) [51]. The correlation data were filtered with a cut-off (absolute R-value >0.75); a significant p-value (<0.05) was applied to further filter the data from the above step and improve the veracity of the networks. The networks were finally visualized through the interactive platform Gephi (v0.9.2) [52], using the Fruchterman–Reingold layout.
A variation partitioning analysis (VPA) was performed to calculate the proportion of bacterial community variation attributable to environmental factors, using the ‘varpart’ function of the vegan package in R (v3.2.2). The distance based linear model (DistLM) was applied to determine the effects of environmental properties on soil bacterial diversity and community, using the Primer (v7) software [53]. Finally, a series of mantel tests were carried out using the vegan package in R (v3.2.2) in order to examine the correlations between the composition of the bacterial community and the environmental variables.
3. Results
3.1. Bacterial Community Diversity by 16S rRNA Gene Analysis
We obtained 1,978,135 pair-end reads by 16S rRNA gene sequencing using the Illumina HiSeq 2500 platform. The effective tags equaled 697 Mb (Table S1). A total of 5046 clean OTUs were obtained. The average number of OTUs for each treatment was 1449; among them, 1379 OTUs were common to all samples (Table S1). Species accumulation curves were calculated using observed species counts to determine the total number of bacteria and species in samples (Figure S1). The curve strongly rose at the beginning and then became smooth with an increasing number of samples analyzed, which indicated a high number of bacterial species in a relatively small number of samples.
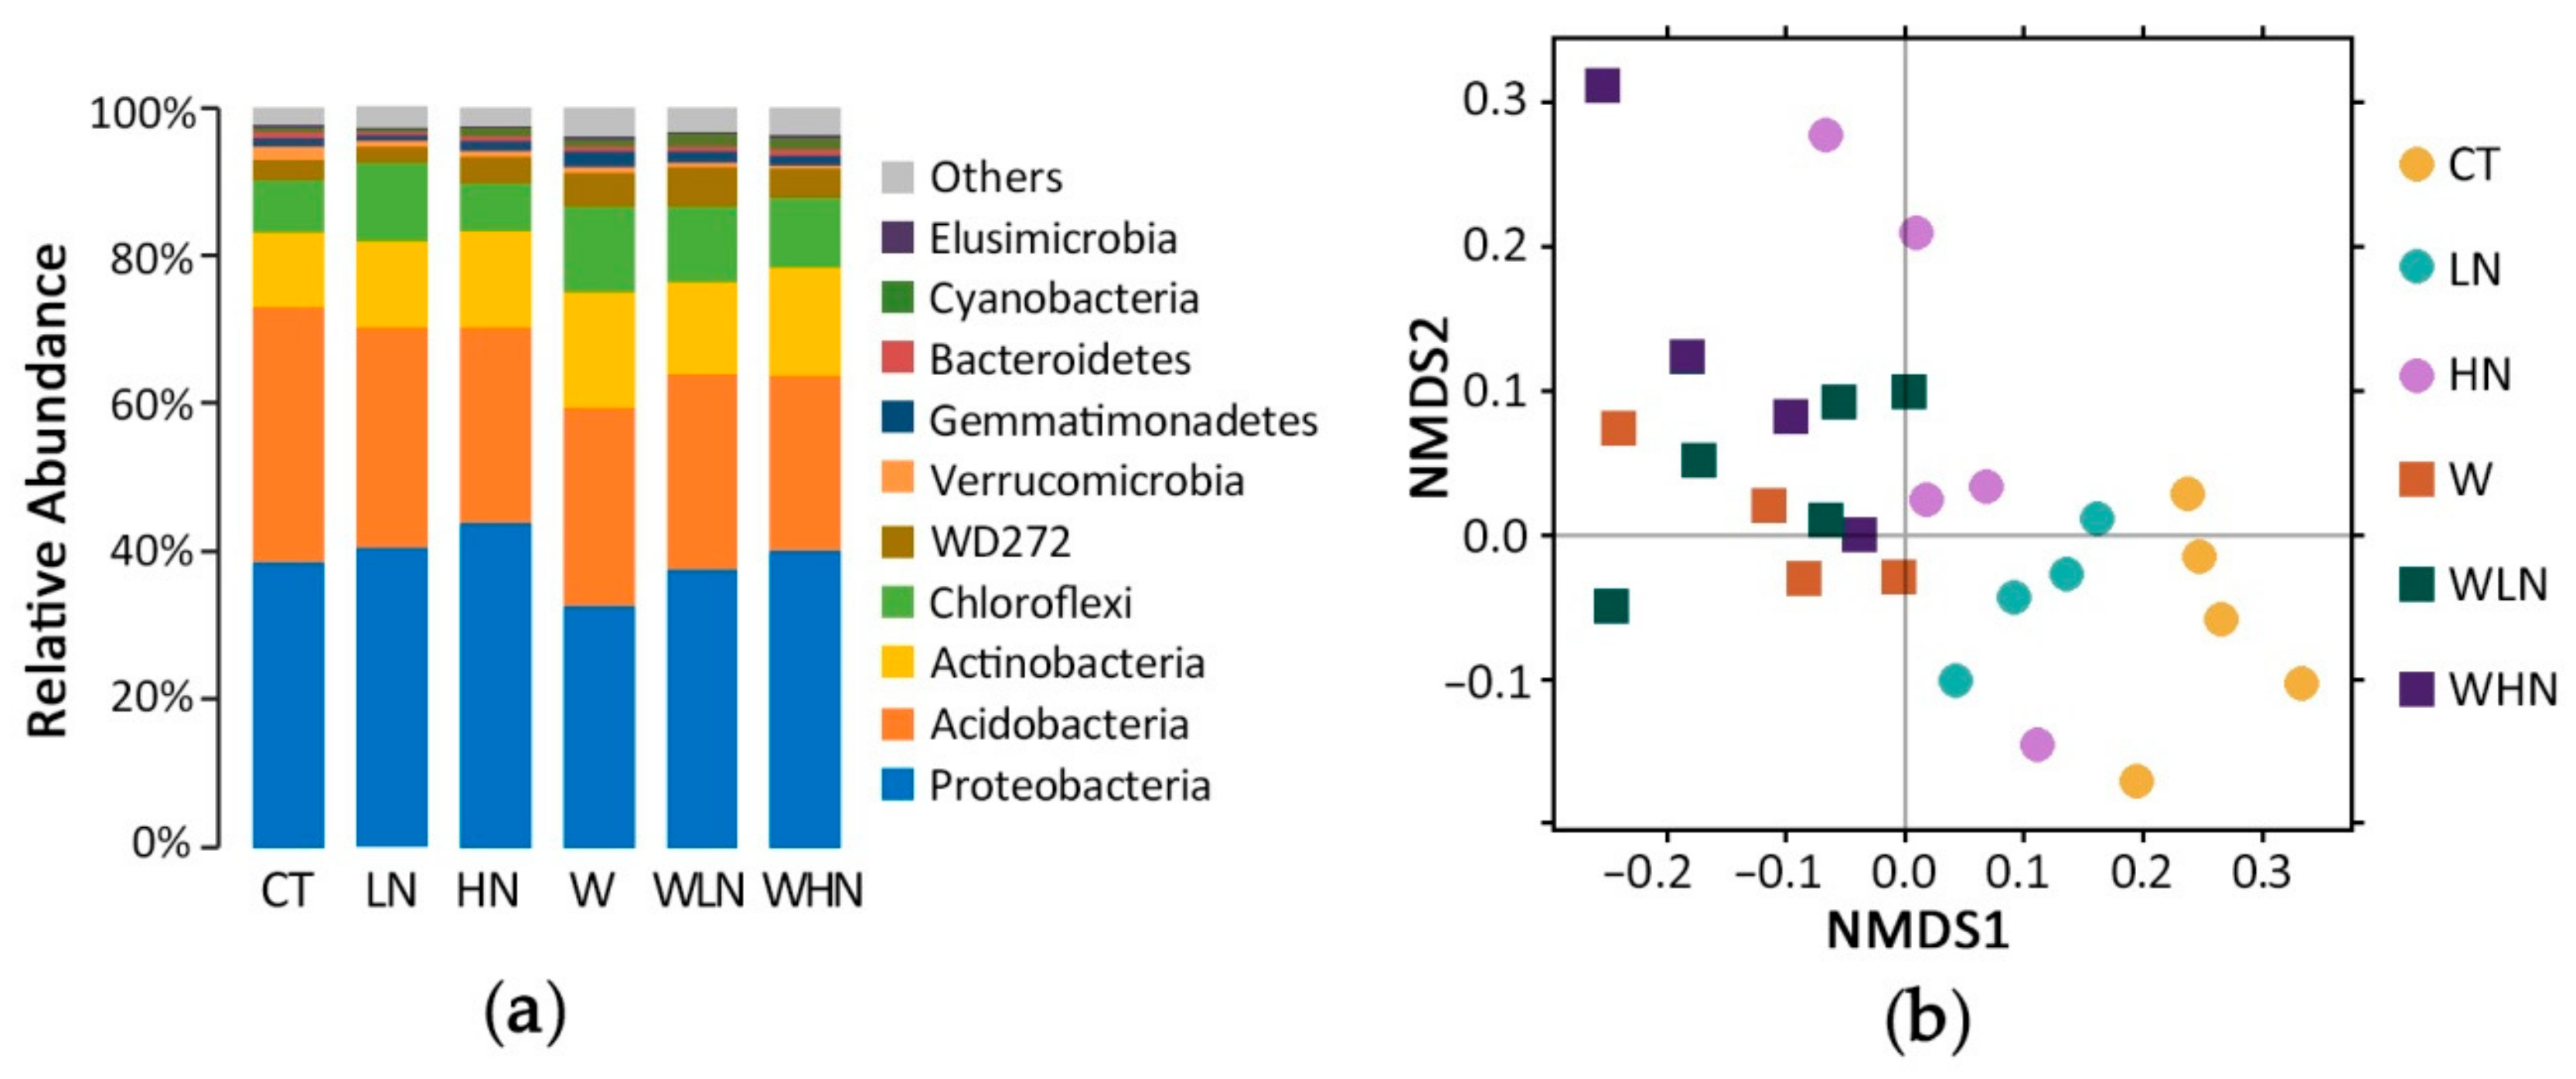
In total, 99.2% of the total 16S rRNA gene sequences belonged to 34 phyla (Figure 1a, Table S2). Proteobacteria represented the most abundant phylum, containing 38.6% of the OTUs (20.6% of Alphaproteobacteria, 11.6% of Deltaproteobacteria, 5.0% of Gammaproteobacteria, and 1.1% of Betaproteobacteria). Alphaproteobacteria included two major orders: Rhodospirillales (9.1%), which produce energy through photosynthesis, and Rhizobiales (8.8%), which can fix N (Figure S2). Acidobacteria (34.5%) were the second most abundant phylum. Actinobacteria (10.0%) were the third most abundant phylum, while the N fixing bacteria Frankiales (6.3%) represented the major order within this phylum. The green non-sulfur bacteria Chloroflexi (7.1%) were the fourth most abundant phylum and Ktedonobacteria (4.3%) represented the major class within this phylum. Other minor phyla were also identified including WD272 (2.7%), Verrucomicrobia (1.8%), Gemmatimonadetes (1.1%), and Bacteroidetes (0.9%) (Figure 1a, Table S2, Figure S2).
3.2. Changes in the Soil Bacterial Community Structure under Warming and N Addition
The within-sample diversity (α-diversity), Shannon, Simpson, Chao1, and ACE indices were calculated for all samples. The difference in α-diversity between each pair of treatments was not statistically significant (Table 1, Table S3). The NMDS results showed that the CT could be separated from all other treatments, and those of the N addition treatments (LN, HN) tended to be closer to the warmed samples; moreover, the warmed samples tended to be closer to each other (Figure 1b, Figure S3a–c). The response pattern in the unwarmed treatments to N addition was similar to that in W, where LN and HN moved along the first principal coordinate towards W (Figure 1b). Anosim and MRPP were used to quantify the differences within and between samples. Except for W–WLN and WLN–WHN, the differences between samples (for a single factor) were greater than those within each group of samples: they were significant based on the Anosim (p < 0.05). The MRPP corroborated these results, highlighting significant differences (p < 0.05) between CT–W, CT–LN, CT–HN, and HN–WHN (Table 1). Overall, the α-diversity and β-diversity results indicated that warming caused a bigger change in the bacterial community than N addition.
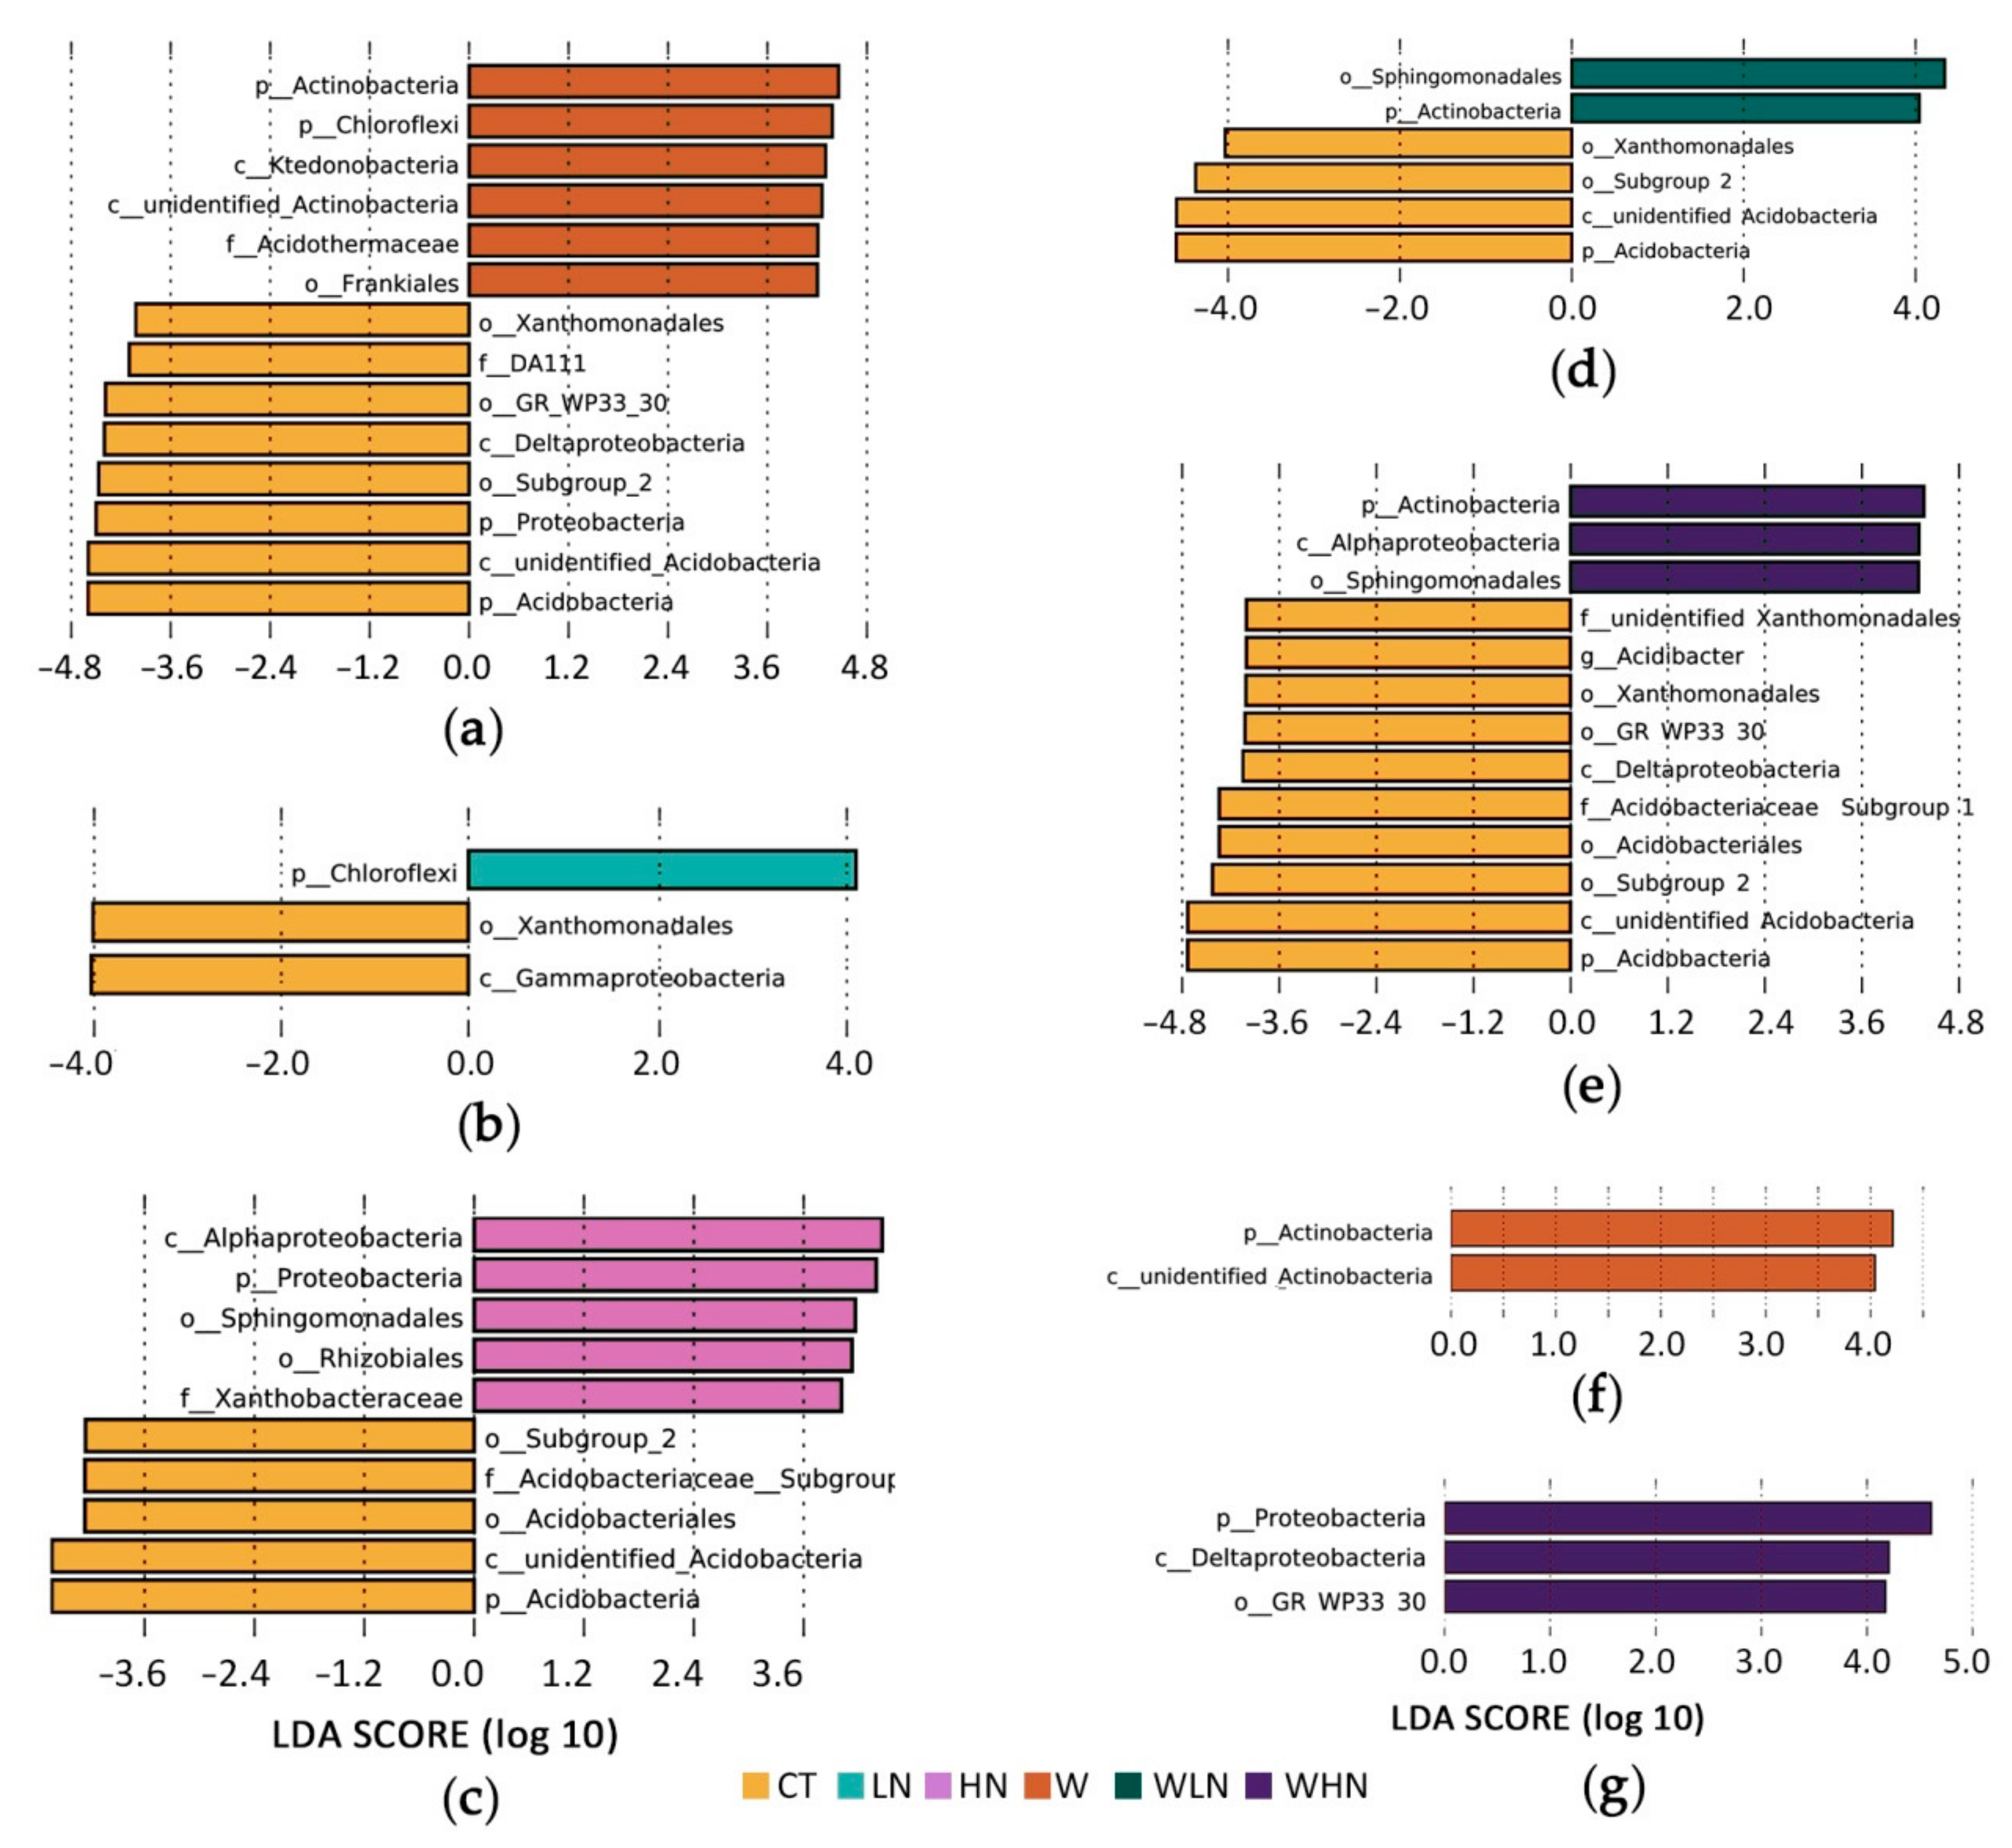
LEfSe [49] was used to identify significant changes among the communities. Under warming conditions, Actinobacteria and Chloroflexi significantly increased, while the percentage of Proteobacteria and Acidobacteria decreased (Figure 2a). Chloroflexi increased in LN but not in HN (Figure 2b,c); on the other hand, Proteobacteria increased and Acidobacteria decreased in the HN treatment (Figure 2c). For the combined effects of warming and N addition, Actinobacteria increased while Acidobacteria decreased in both WLN and WHN (Figure 2d,e). For N addition after warming, WLN had less Acidobacteria than W and WHN had more Proteobacteria, especially Deltaproteobacteria than W (Figure 2f,g). Metastat [47] was used to further check and complement the differences between microbial groups. The results of this analysis were similar to those of LEfSe at phylum and class level. Following warming, the increase in Actinobacteria involved increases in both Pseudonocardiales (2.3 times) and Frankiales (1.5 times), which are orders capable of fixing N (Table S4).
We further calculated the changes in OTU abundance amongst treatments. Compared with the CT, 157 OTUs were significantly enriched and 234 were significantly depleted under the W treatment, 38 OTUs were significantly enriched and 50 were significantly depleted under the LN treatment, and 43 OTUs were significantly enriched and 37 were significantly depleted under the HN treatment (Figure S4, Figure S5). Both LN and HN caused different changes in the OTUs, and more than half of the significant changes in HN were identified in W, which was especially true for the depleted OTUs (Figure S4a, Figure S3). Under warming conditions, because of the interactive effect, WLN (85 enriched and 132 depleted) caused changes similar to those of W, while WHN (174 enriched and 237 depleted) caused some distinct changes (Figure S4b). These results indicate that N addition and the +5 °C warming had similar effects on the soil microbial structure, but there was a combined effect related to the volume of N addition.
3.3. Co-Occurrence Network Patterns in the Soil Bacteria Communities
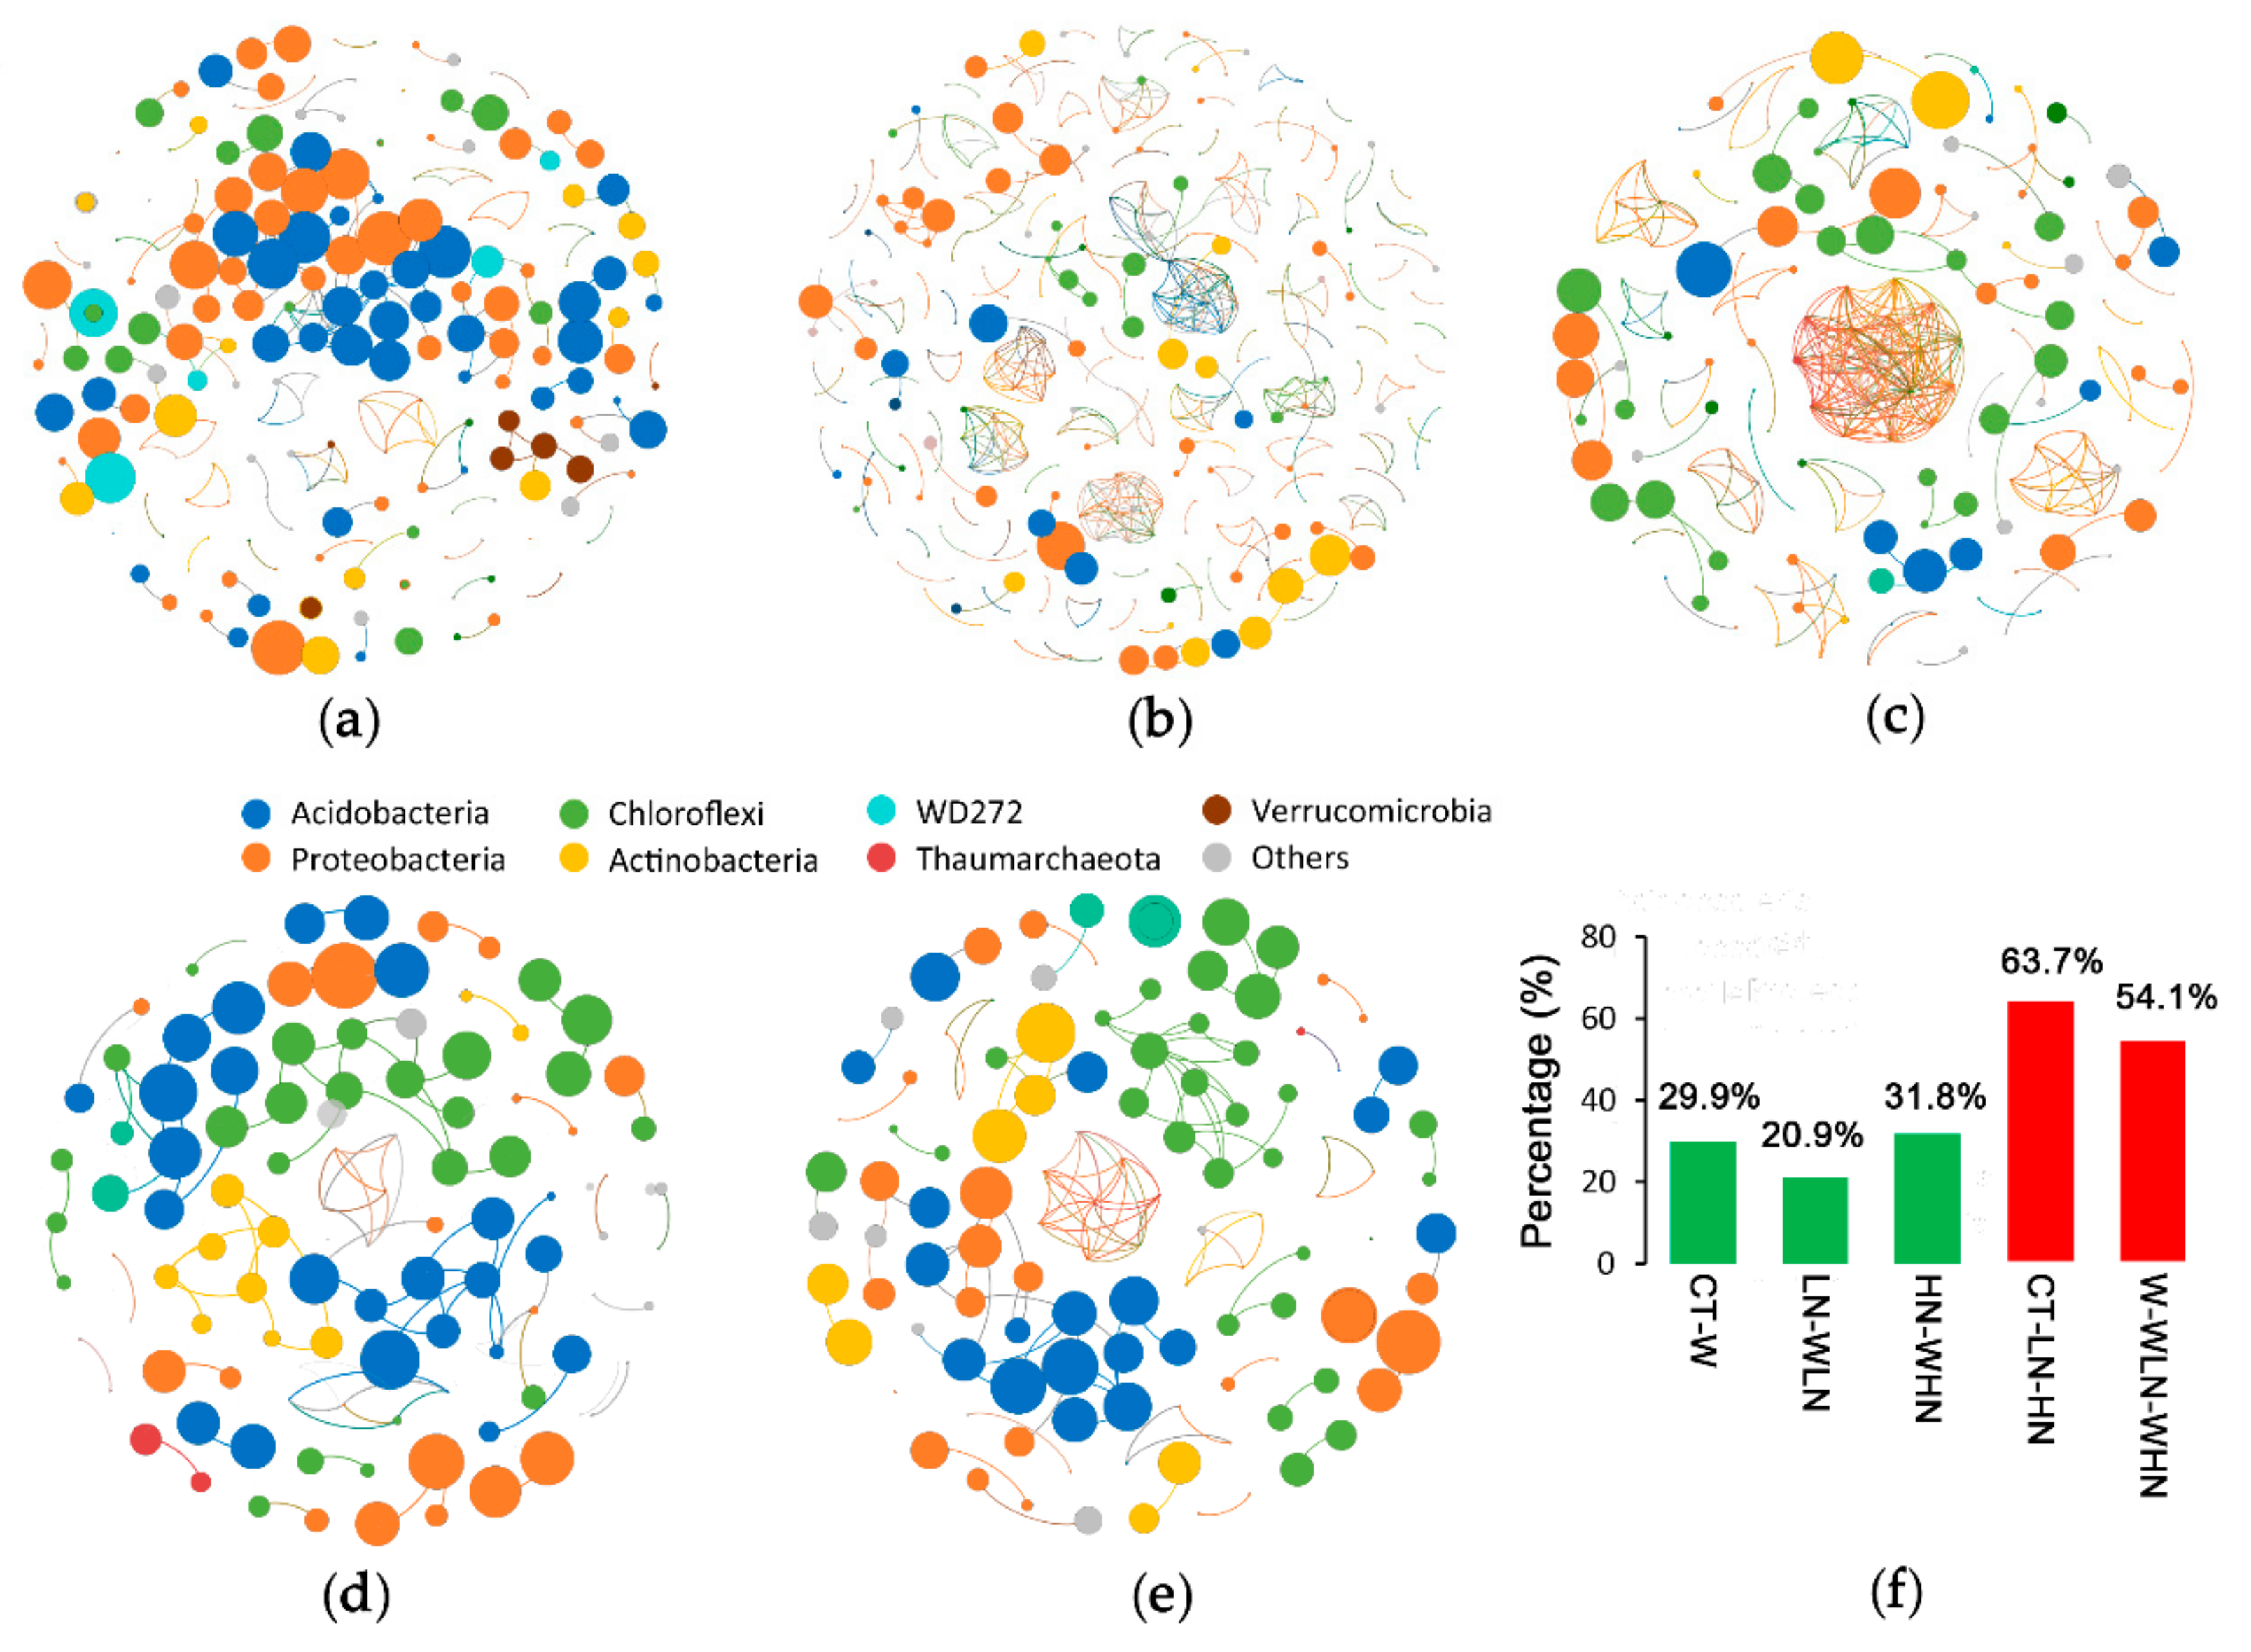
We firstly compared the co-expression status of warming for three groups: CT–W (Figure 3a), LN–WLN (Figure 3b), and HN–WHN (Figure 3c). The warming treatment was characterized by a greater number of OTU co-occurrences than the N addition treatment. Numerous interactions were identified in the warming treatment between different phyla, especially between Proteobacteria and three other major phyla (i.e., Acidobacteria, Actinobacteria, Chloroflexi), and between Acidobacteria and Chloroflexi (Figure 3a–c, Table S5). The highest co-occurrence of OTUs occurred within Proteobacteria (Table S5). The co-expression status following N addition was compared within two groups: for unwarmed (CT–LN–HN; Figure 3d) and warmed samples (W–WLN–WHN; Figure 3e). In the first case, the co-occurrence of OTUs mainly occurred within each phylum (63.7%), and at a lower degree between different phyla (Figure 3f), especially for Acidobacteria and Chloroflexi (Figure 3d, Table S5). In the second case, we observed a similar trend. The link within phyla (54.1%) was high for Chloroflexi; moreover, that within Proteobacteria was higher than that within Acidobacteria (Figure 3e, Table S5).
3.4. Correlation between Warming, Soil Properties, Plant Growth, and the Bacterial Community
In order to study the effects of environmental factors on the treatments, we measured some key soil physicochemical parameters: (1) temperature, (2) a group of properties (i.e., soil moisture, pH, NH4+-N, NO3−-N, total phosphorus (TP), dissolved organic carbon (DOC), and dissolved organic nitrogen (DON)), and (3) the ground plant growth state (i.e., plant height and diameter) (Table S6, Figure S6).
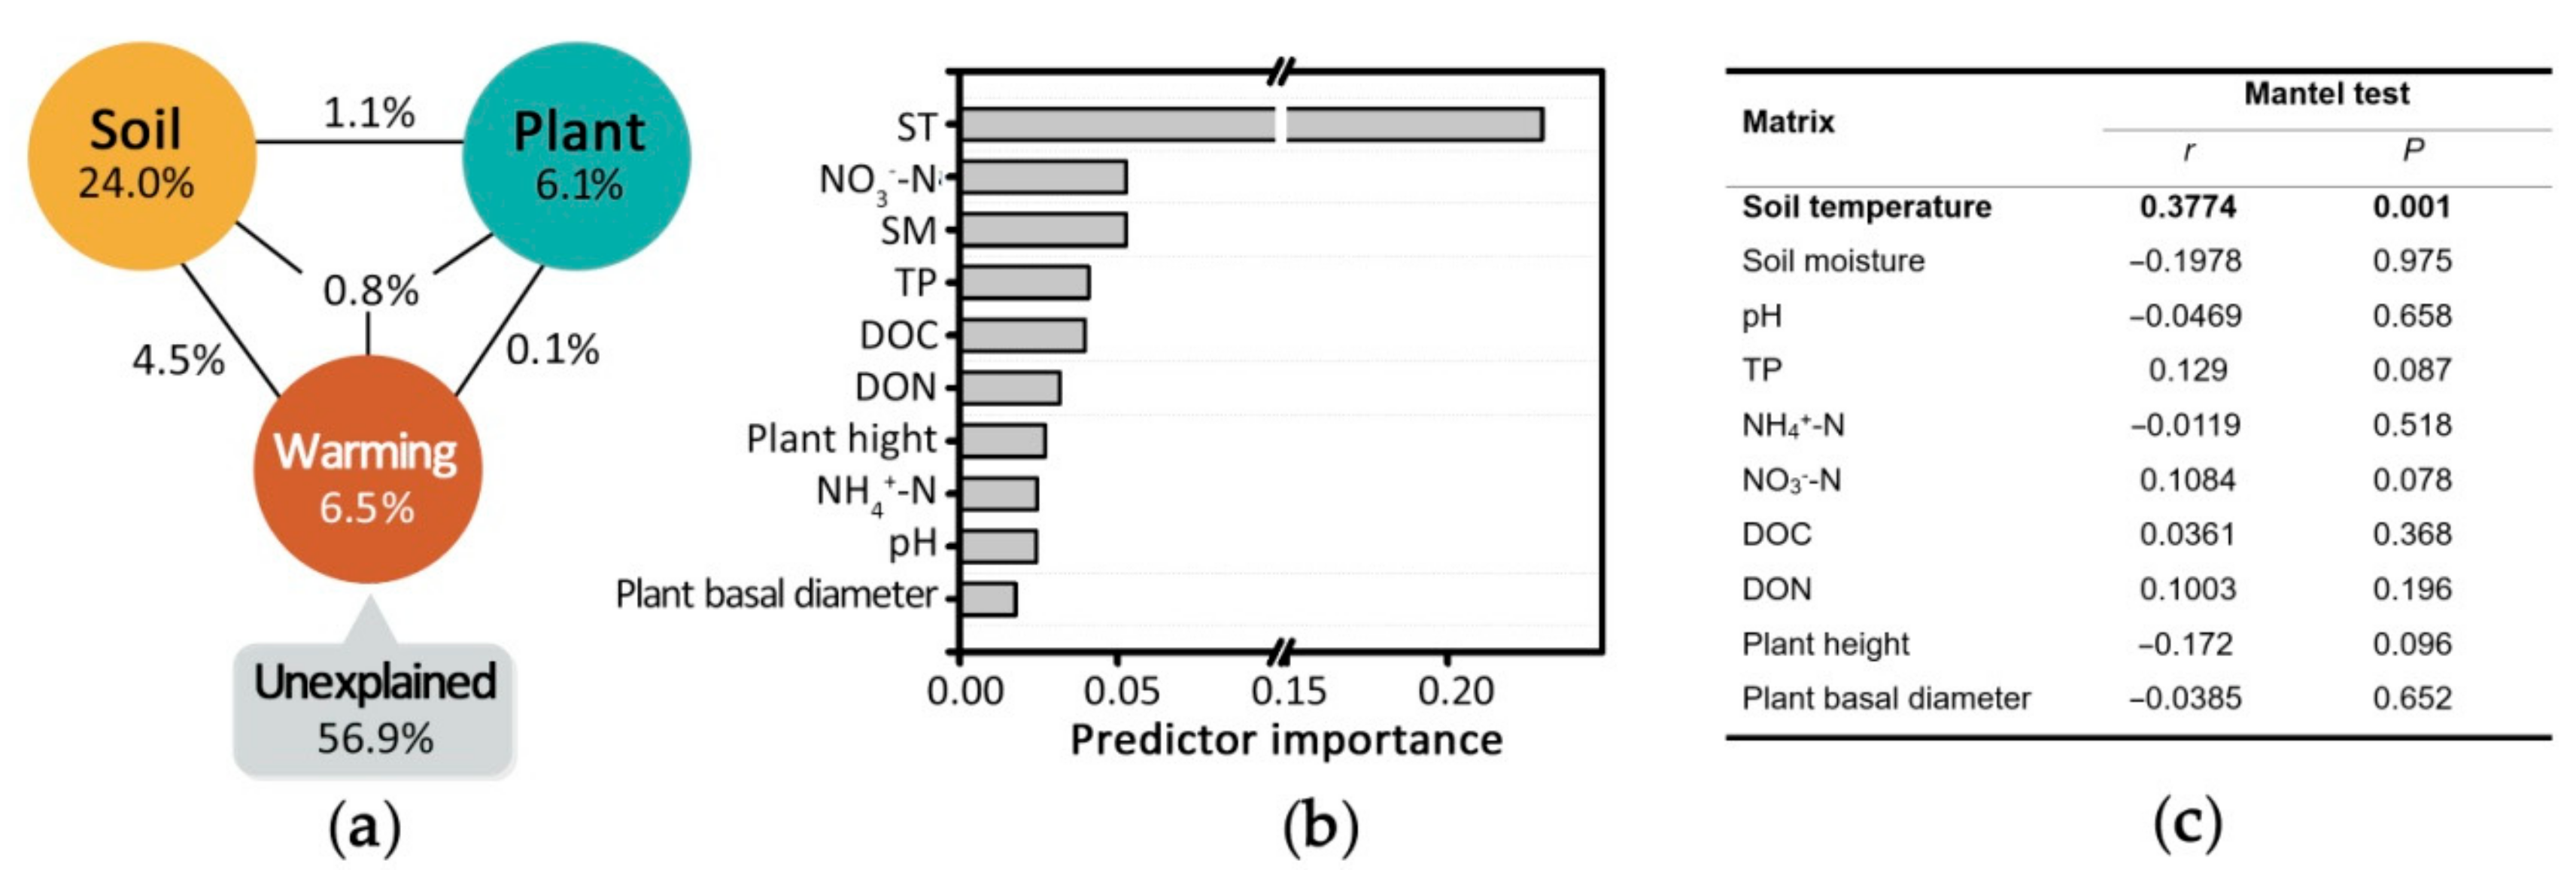
VPA results showed that soil temperature, properties, and plant growth state explained 11.9%, 30.4%, and 8.1% of the observed variations, respectively, and 56.9% of the variation remained unexplained (ANOVA, p-value = 0.001, Figure 4a). Soil temperature alone explained 6.5% of the variation, and its contribution was shared with soil properties (4.5%). Soil properties overall explained the highest amount (24%) of the variation. Soil moisture and NO3−-N were the most important contributors within the group of soil properties (Figure 4b); nevertheless, no soil property showed significant effect as revealed by the mantel test (Figure 4c). Plant growth alone explained ~6.1% of the variation and its contribution was relatively independent from that of other factors (Figure 4a). The above integrated responses of soil–microbe–plant systems analyses showed that warming directly affected the microbial community structure through thermal energy, but also changed the complex system of soil properties that influenced the microbial community structure.
4. Discussion
The soil bacterial community structure significantly changed after two years of warming in our experimental subtropical plantation plots. Our results showed that the unwarmed treatments were separated from warmed treatments; moreover, the HN treatment tended to be closer to the warmed samples (Figure 1b). This supported our first hypothesis that warming will have a greater effect on the soil bacterial community structure. In previous studies, warming has been reported to change the composition of the microbial community [8,10,14,15,54]. DeAngelis et al. [8] studied an organic soil horizon and found that the bacterial community structure was significantly altered by 20 years of warming. This change was attributed to a reduction in the readily available C [9]; in fact, changes in soil substrate availability are reported to affect the microbial community structure in soils [55,56]. Melillo et al. [57] reported that soil warming in a temperate forest stimulated organic N mineralization. In our experiment, we detected the activity of four typical catabolism enzymes in the soil: βG and CBH, which can decompose cellulose (Figure S7a,b), and PHO and PEO, which can decompose lignin (Figure S7c,d). Compared to CT, the activities of nearly all enzymes significantly increased under warming and N addition, except for PHO and PEO in LN (Figure S7c,d). Both warming and N addition increased the activity of enzymes related to the degradation of cellulose, lignin, and humus. Hence, SOC was produced at a faster rate in the warming soil. At the same time, under warming, N was colonized and decomposed by microorganisms at a faster rate, before flowing to the plant through the root system; this resulted in an increased plant growth rate and in a higher fraction of N in the leaves [36,58,59].
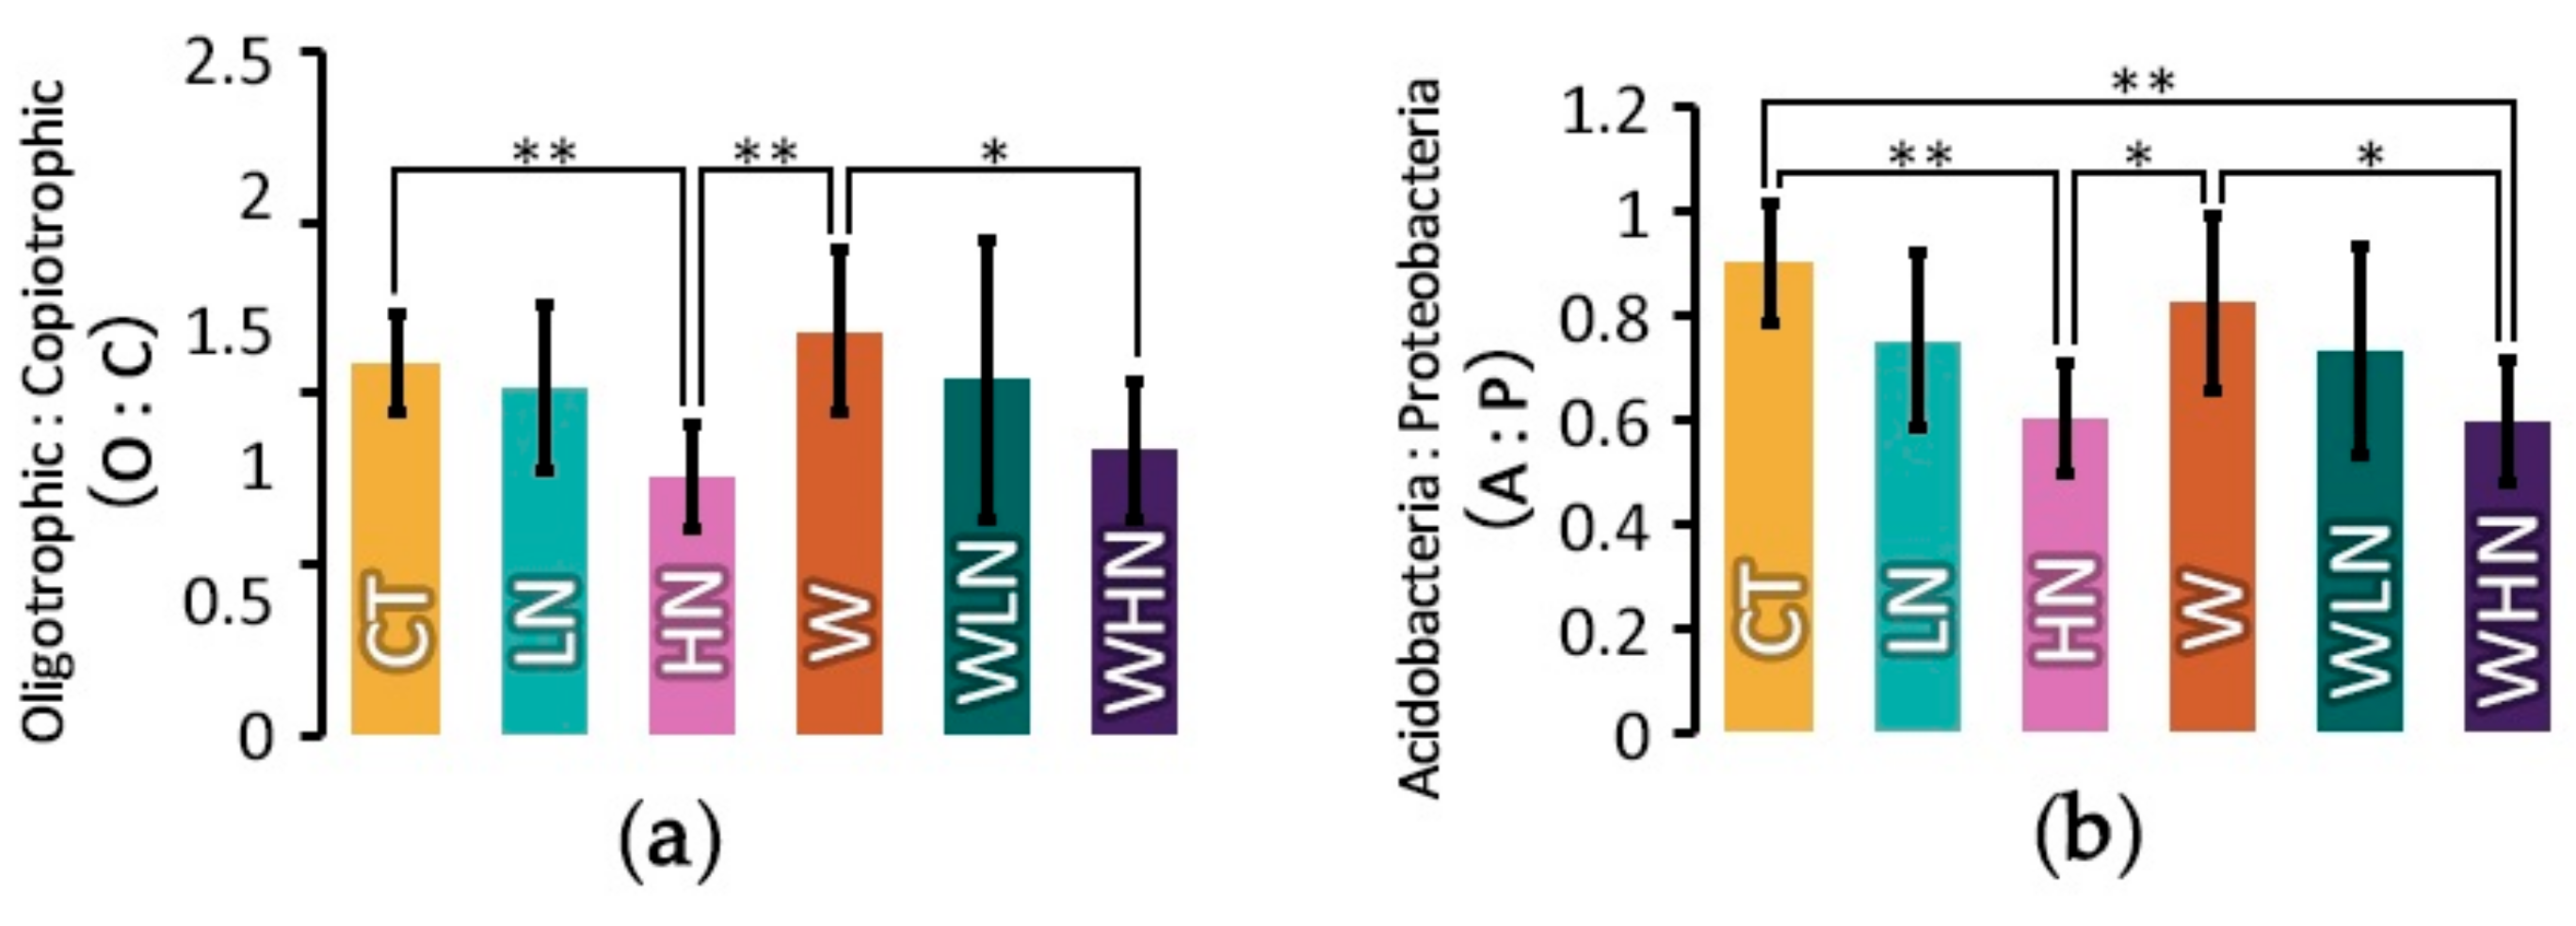
Our second hypothesis was about the soil bacterial lifestyle changes under different treatments. Based on the oligotrophic–copiotrophic theory, copiotrophic taxa have high nutritional requirements and high growth rates; hence they prefer labile carbon. In contrast, oligotrophic taxa can survive under conditions of lower organic carbon availability (low nutrients) since they have low growth rates [56]. In our study, we found that Acidobacteria, Proteobacteria, Chloroflexi, and Actinobacteria were the major phyla occurring in the subtropical plantation. Acidobacteria and Chloroflexi are considered oligotrophic microorganisms, while Proteobacteria are considered copiotrophic microorganisms [56]. In contrast to previous studies [8,9,10,14], we observed that the percentage of Acidobacteria decreased in N addition and warming treatments. Proteobacteria significantly decreased under warming, but they significantly increased in the high N addition treatment (Figure 2a,c). As a result, the oligotrophic:copiotrophic (O:C) and Acidobacteria:Proteobacteria (A:P) ratios did not change under warming, but they significantly decreased in the N addition treatment. There are not many studies on Filamentous Chloroflexi (green non-sulfur bacteria). Previous studies reported their abundance in eutrophic waters and soils, suggesting that they contribute to nutrient removal [60]. Chloroflexi were significantly increased under the warming treatments (Figure 2d). Actinobacteria do not yet have a well-defined ecological category, and previous studies showed mixed responses to nutrient additions [61]. Actinobacteria have been known for behaving like fungi and for growing slowly, like oligotrophs [62]. In our study, the percentage of Actinobacteria increased under warming, but it did not change significantly in the N addition treatment or in the combined warming and N addition treatment. These results confirm the oligotrophic nature of these organisms in the studied area.
Acidobacteria was an abundant phylum in soil with an oligotrophic lifestyle, and we assumed that it would increase under warming conditions. But we found that the relative abundance of Acidobacteria decreased under warming treatment. Oligotrophy can occur under conditions of high spatial or high heterogeneity, and long-term warming caused a change in soil structure that increased the spatial heterogeneity or other physical structures of the soil [8]. To some extent, in our experiment, two years of soil warming might have not been enough time to see changes in the spatial heterogeneity or physical structure of soil. Meanwhile, Chloroflexi were significantly increased under the warming treatments. It was the fourth most abundant phylum in our study. Under warming conditions, it might replace some of the Acidobacteria niche. As discussed above, N addition, especially high N addition, caused a significant shift towards copiotrophic taxa, which was also found in our previous study [31]. Warming may cause a shift in the bacterial community towards oligotrophic taxa, while N addition could dilute this tendency (Figure 5).
The analyzed network changes indicated that warming and N addition could affect bacterial group interactions in different ways. Our results, to some extent, support our third hypothesis. In all our networks, >97% of the co-occurrence links had positive correlations after warming and N addition (Table S5), indicating that the microbial groups tended to collaborate rather than antagonize under these conditions. In response to warming, microbial communities showed their major interactions between different phyla. Meanwhile, co-occurrence of OTUs was affected by N addition mainly within phyla, suggesting that warming is a complex process, involving the interaction and competition of different microbial communities.
Changes in the soil bacterial community structure and lifestyle may affect the decomposition of soil organic matter and, as a result, the growth of plants. Shifts in bacterial community composition can reflect changes in the availability of soil nutrients under warming. The proportion of oligotrophic and copiotrophic taxa in the bacterial community is an important predictor of soil organic carbon (SOC) mineralization [62]. Considering the shift (from copiotrophic towards oligotrophic taxa) we observed after two years of soil warming; the ecology and function of these two groups in the forest biogeochemical cycles are worth further investigation. Our results suggest that different species may respond to warming in different ways, leading to changes in the relative abundance of certain taxa; however, the ecological effects need to be further investigated.
Combining the changes in N content observed in soil, bacteria, and plants, we speculated that both warming and N addition increased the turnover of C and N (between plants and microorganisms) and plant production in the long-term. Although our study focused on bacterial communities, we cannot ignore the role of other microbial components (e.g., fungi, mycorrhiza, microfauna, etc.) and how these in turn may be influenced by the changed climate [63,64,65]. However, due to limited resources such as high demand for power and topographical constraints in the mountainous area, the size of the experiment plot was too small for such a multifactorial experiment. Although our replicates may not be enough to extrapolate our results to natural forests, our experiment can be valuable to understand the mechanisms of warming and N addition effects on soil microbes. In addition, a duration of two years to examine the effects of soil warming and N addition and their interactions may be too short. Short-term effects of warming and N addition could markedly differ from long-term responses. Although our results found the bacterial community was changed by the two years of warming, more long-term research is needed, and the mechanisms behind the ecological effects need to be further investigated.
5. Conclusions
In our study, the soil bacterial community structure changed after two years of soil warming and N addition. Actinobacteria and Chloroflexi significantly increased in response to warming, while concentrations of Proteobacteria and Acidobacteria decreased. The high N addition treatment had a greater impact on the bacterial community structure than light N addition. Although N addition had smaller impacts than warming, it translated to similar change patterns at the OTUs, phylum, and class levels. Warming induced a shift towards oligotrophic taxa, while N addition could dilute this tendency. The topological indices of the ecological networks further highlighted different co-occurrence patterns within the soil bacterial community under warming and N addition. Warming made the co-occurrence network more complicated, increasing the interaction between different microbial phyla, while N addition induced a higher level of cooperation within the phyla. Soil warming and N addition accelerated the C and N cycles in the soil, increasing the upward flow of N (from underground to aboveground) and the decomposition rate of SOC, hence promoting tree growth. We still need to do more research on mature forests and/or natural forests and carry out a long-term study to investigate the mechanisms behind these ecological effects.
Supplementary Materials
The following are available online at https://www.mdpi.com/1999-4907/10/10/861/s1, Figure S1: Species accumulation curve of bacterial taxonomic groups, Figure S2: Relative abundance of bacterial taxonomic groups, Figure S3: β-diversity of the bacterial community under N addition and warming, Figure S4: Number of significantly enriched and depleted OTUs after treatments, Figure S5: Number of significantly enriched and depleted OTUs in W, WLN, and WHN compared to CT, Figure S6: Monitored environmental factors between samples, Figure S7: Soil enzyme activity under warming and N addition, Table S1: Statistic of 16s rRNAs sequencing, Table S2: Tax of microbial abundance for 16s rRNAs, Table S3: Statistic of α-diversity of observed OTUs, Table S4: Different expression microbial community between samples by Metastat, Table S5: Number of links within same phylum for co-occurrence ecological networks, Table S6: Environmental factors between samples.
Author Contributions
L.X., Q.Z. and Y.Y. designed the experiments; L.X., J.C., X.L., D.X. and Q.K. performed the experiments; L.X., Q.Z., J.C. and Y.Y. analyzed the data, wrote and revised the paper.
Funding
This research was supported by the National Key Basic Research Program of China (grant number 2014CB954003), the Natural Science Foundation of Fujian Province, China (grant number 2018J01715) and the Project of Fujian Provincial Department of Education, China (grant number JAT160136).
Acknowledgments
We are grateful to the anonymous reviewers whose comments greatly helped to improve this manuscript. We thank the help of Yong Zheng and Jianfen Guo in revising the article, and thanks to the help of B.G in microbial analysis.
Conflicts of Interest
The authors declare no conflict of interest.
References
- IPCC. Climate Change 2014: Synthesis Report; Core Writing Team, Pachauri, R.K., Meyer, L.A., Eds.; Contribution of Working Groups I, II and III to the Fifth Assessment Report of the Intergovernmental Panel on Climate Change; IPCC: Geneva, Switzerland, 2014; 151p. [Google Scholar]
- Reay, D.S.; Dentener, F.; Smith, P.; Grace, J.; Feely, R.A. Global nitrogen deposition and carbon sinks. Nat. Geosci. 2008, 1, 430–437. [Google Scholar] [CrossRef]
- Richter, A.; Burrows, J.P.; Nüß, H.; Granier, C.; Niemeier, U. Increase in tropospheric nitrogen dioxide over China observed from space. Nature 2005, 437, 129–132. [Google Scholar] [CrossRef] [PubMed]
- Du, E.; Vries, W.D.; Han, W.; Liu, X.; Yan, Z.; Yuan, J. Imbalanced phosphorus and nitrogen deposition in China’s forests. Atmos. Chem. Phys. 2016, 16, 8571–8579. [Google Scholar] [CrossRef]
- Baldrian, P. Forest microbiome: Diversity, complexity and dynamics. FEMS Microbiol. Rev. 2017, 41, 109–130. [Google Scholar] [CrossRef] [PubMed]
- Bonfante, P.; Anca, I.-A. Plants, Mycorrhizal Fungi, and Bacteria: A Network of Interactions. Annu. Rev. Microbiol. 2009, 63, 363–383. [Google Scholar] [CrossRef] [PubMed] [Green Version]
- Heiko, N.; Martin, E.; Silja, B.; Christiane, F.; Janine, T.; Rolf, D. Identification and characterization of novel cellulolytic and hemicellulolytic genes and enzymes derived from German grassland soil metagenomes. Biotechnol. Lett. 2012, 34, 663–675. [Google Scholar]
- DeAngelis, K.M.; Pold, G.; Topçuoğlu, B.D.; van Diepen, L.T.A.; Varney, R.M.; Blanchard, J.L.; Melillo, J.; Frey, S.D. Long-term forest soil warming alters microbial communities in temperate forest soils. Front. Microbiol. 2015, 6, 104. [Google Scholar] [CrossRef] [PubMed] [Green Version]
- Pold, G.; Melillo, J.M.; DeAngelis, K.M. Two decades of warming increases diversity of a potentially lignolytic bacterial community. Front. Microbiol. 2015, 6, 480. [Google Scholar] [CrossRef] [Green Version]
- Schindlbacher, A.; Rodler, A.; Kuffner, M.; Kitzler, B.; Sessitsch, A.; Zechmeister-Boltenstern, S. Experimental warming effects on the microbial community of a temperate mountain forest soil. Soil Biol. Biochem. 2011, 43, 1417–1425. [Google Scholar] [CrossRef] [Green Version]
- Li, J.; Ziegler, S.; Lane, C.S.; Billings, S.A. Warming-enhanced preferential microbial mineralization of humified boreal forest soil organic matter: Interpretation of soil profiles along a climate transect using laboratory incubations. J. Geophys. Res. Biogeosci. 2012, 117. [Google Scholar] [CrossRef] [Green Version]
- Savage, K.E.; Parton, W.J.; Davidson, E.A.; Trumbore, S.E.; Frey, S.D. Long-term changes in forest carbon under temperature and nitrogen amendments in a temperate northern hardwood forest. Glob. Chang. Biol. 2013, 19, 2389–2400. [Google Scholar] [CrossRef] [PubMed] [Green Version]
- Stone, M.M.; Weiss, M.S.; Goodale, C.L.; Adams, M.B.; Fernandez, I.J.; German, D.P.; Allison, S.D. Temperature sensitivity of soil enzyme kinetics under N-fertilization in two temperate forests. Glob. Chang. Biol. 2012, 18, 1173–1184. [Google Scholar] [CrossRef]
- Schindlbacher, A.; Schnecker, J.; Takriti, M.; Borken, W.; Wanek, W. Microbial physiology and soil CO2 efflux after 9 years of soil warming in a temperate forest—No indications for thermal adaptations. Glob. Chang. Biol. 2015, 21, 4265–4277. [Google Scholar] [CrossRef] [PubMed]
- Vanhala, P.; Karhu, K.; Tuomi, M.; Björklöf, K.; Fritze, H.; Hyvärinen, H.; Liski, J. Transplantation of organic surface horizons of boreal soils into warmer regions alters microbiology but not the temperature sensitivity of decomposition. Glob. Chang. Biol. 2011, 17, 538–550. [Google Scholar] [CrossRef]
- Luo, X.; Fu, X.; Yang, Y.; Cai, P.; Peng, S.; Chen, W.; Huang, Q. Microbial communities play important roles in modulating paddy soil fertility. Sci. Rep. 2016, 6, 20326. [Google Scholar] [CrossRef] [PubMed]
- Xue, K.; Yuan, M.M.; Shi, Z.J.; Qin, Y.; Deng, Y.; Cheng, L.; Wu, L.; He, Z.; Van Nostrand, J.D.; Bracho, R.; et al. Tundra soil carbon is vulnerable to rapid microbial decomposition under climate warming. Nat. Clim. Chang. 2016, 6, 595–600. [Google Scholar] [CrossRef] [Green Version]
- Wallenstein, M.D.; Vilgalys, R.J. Quantitative analyses of nitrogen cycling genes in soils. Pedobiologia 2005, 49, 665–672. [Google Scholar] [CrossRef]
- Frey, S.D.; Ollinger, S.; Nadelhoffer, K.; Bowden, R.; Brzostek, E.; Burton, A.; Caldwell, B.A.; Crow, S.; Goodale, C.L.; Grandy, A.S.; et al. Chronic nitrogen additions suppress decomposition and sequester soil carbon in temperate forests. Biogeochemistry 2014, 121, 305–316. [Google Scholar] [CrossRef]
- Long, X.; Chen, C.; Xu, Z.; Linder, S.; He, J. Abundance and community structure of ammonia oxidizing bacteria and archaea in a Sweden boreal forest soil under 19-year fertilization and 12-year warming. J. Soils Sediments 2012, 12, 1124–1133. [Google Scholar] [CrossRef]
- Turlapati, S.A.; Minocha, R.; Bhiravarasa, P.S.; Tisa, L.S.; Thomas, W.K.; Minocha, S.C. Chronic N-amended soils exhibit an altered bacterial community structure in Harvard Forest, MA, USA. FEMS Microbiol. Ecol. 2013, 83, 478–493. [Google Scholar] [CrossRef]
- Wallenstein, M.D.; McNulty, S.; Fernandez, I.J.; Boggs, J.; Schlesinger, W.H. Nitrogen fertilization decreases forest soil fungal and bacterial biomass in three long-term experiments. For. Ecol. Manag. 2006, 222, 459–468. [Google Scholar] [CrossRef]
- Frey, S.D.; Knorr, M.; Parrent, J.L.; Simpson, R.T. Chronic nitrogen enrichment affects the structure and function of the soil microbial community in temperate hardwood and pine forests. For. Ecol. Manag. 2004, 196, 159–171. [Google Scholar] [CrossRef]
- Kai, Y.; Yan, P.; Peng, C.; Yang, W.; Xin, P.; Wu, F. Stimulation of terrestrial ecosystem carbon storage by nitrogen addition: A meta-analysis. Sci. Rep. 2016, 6, 19895. [Google Scholar] [CrossRef]
- Freedman, Z.; Eisenlord, S.D.; Zak, D.R.; Xue, K.; He, Z.; Zhou, J. Towards a molecular understanding of N cycling in northern hardwood forests under future rates of N deposition. Soil Biol. Biochem. 2013, 66, 130–138. [Google Scholar] [CrossRef]
- Freedman, Z.B.; Romanowicz, K.J.; Upchurch, R.A.; Zak, D.R. Differential responses of total and active soil microbial communities to long-term experimental N deposition. Soil Biol. Biochem. 2015, 90, 275–282. [Google Scholar] [CrossRef] [Green Version]
- Freedman, Z.B.; Upchurch, R.A.; Zak, D.R. Microbial Potential for Ecosystem N Loss Is Increased by Experimental N Deposition. PLoS ONE 2016, 11, e0164531. [Google Scholar] [CrossRef]
- Ramirez, K.S.; Craine, J.M.; Fierer, N. Consistent effects of nitrogen amendments on soil microbial communities and processes across biomes. Glob. Chang. Biol. 2012, 18, 1918–1927. [Google Scholar] [CrossRef]
- Yuan, Y.H. Effects of Nitrogen Deposition on Soil Microbial Biomass, Microbial Functional Diversity and Enzyme Activities in Fir Plantations of Subtropical China. Adv. Mater. Res. 2012, 610, 323–330. [Google Scholar] [CrossRef]
- Dong, W.Y.; Zhang, X.Y.; Liu, X.Y.; Fu, X.L.; Chen, F.S.; Wang, H.M.; Sun, X.M.; Wen, X.F. Responses of soil microbial communities and enzyme activities to nitrogen and phosphorus additions in Chinese fir plantations of subtropical China. Biogeosciences 2015, 12, 5537–5546. [Google Scholar] [CrossRef] [Green Version]
- Hao, Y.Q.; Xie, L.; Chen, Y.M.; Tang, C.D.; Liu, X.F.; Lin, W.S.; Xiong, C.; Yang, Y.S. Effects of nitrogen deposition on diversity and composition of soil bacterial community in a subtropical Cunninghamia lanceolata plantation. Chin. J. Appl. Ecol. 2018, 29, 53–58. [Google Scholar]
- Cavaleri, M.A.; Reed, S.C.; Smith, W.K.; Wood, T.E. Urgent need for warming experiments in tropical forests. Glob. Chang. Biol. 2015, 21, 2111–2121. [Google Scholar] [CrossRef] [PubMed]
- Zhao, C.; Zhu, L.; Liang, J.; Yin, H.; Yin, C.; Li, D.; Zhang, N.; Liu, Q. Effects of experimental warming and nitrogen fertilization on soil microbial communities and processes of two subalpine coniferous species in Eastern Tibetan Plateau, China. Plant Soil 2014, 382, 189–201. [Google Scholar] [CrossRef]
- Zhang, J.; Zhu, T.; Cai, Z.; Müller, C. Nitrogen cycling in forest soils across climate gradients in Eastern China. Plant Soil 2011, 342, 419–432. [Google Scholar] [CrossRef]
- Yang, Y.; Wang, L.; Yang, Z.; Xu, C.; Xie, J.; Chen, G.; Lin, C.; Guo, J.; Liu, X.; Xiong, D.; et al. Large Ecosystem Service Benefits of Assisted Natural Regeneration. J. Geophys. Res. Biogeosci. 2018, 123, 676–687. [Google Scholar] [CrossRef]
- Zhang, Q.; Xie, J.; Lyu, M.; Xiong, D.; Wang, J.; Chen, Y.; Li, Y.; Wang, M.; Yang, Y. Short-term effects of soil warming and nitrogen addition on the N:P stoichiometry of Cunninghamia lanceolata in subtropical regions. Plant Soil 2016, 411, 395–407. [Google Scholar] [CrossRef]
- Webster, R. Soil Sampling and Methods of Analysis—Edited by M.R. Carter & E.G. Gregorich. Eur. J. Soil Sci. 2010, 59, 1010–1011. [Google Scholar]
- Magoc, T.; Salzberg, S.L. FLASH: Fast length adjustment of short reads to improve genome assemblies. Bioinformatics 2011, 27, 2957–2963. [Google Scholar] [CrossRef]
- Caporaso, J.G.; Kuczynski, J.; Stombaugh, J.; Bittinger, K.; Bushman, F.D.; Costello, E.K.; Fierer, N.; Pena, A.G.; Goodrich, J.K.; Gordon, J.I.; et al. QIIME allows analysis of high-throughput community sequencing data. Nat. Methods 2010, 7, 335–336. [Google Scholar] [CrossRef] [Green Version]
- Bokulich, N.A.; Subramanian, S.; Faith, J.J.; Gevers, D.; Gordon, J.I.; Knight, R.; Mills, D.A.; Caporaso, J.G. Quality-filtering vastly improves diversity estimates from Illumina amplicon sequencing. Nat. Methods 2013, 10, 57–59. [Google Scholar] [CrossRef]
- Haas, B.J.; Gevers, D.; Earl, A.M.; Feldgarden, M.; Ward, D.V.; Giannoukos, G.; Ciulla, D.; Tabbaa, D.; Highlander, S.K.; Sodergren, E.; et al. Chimeric 16S rRNA sequence formation and detection in Sanger and 454-pyrosequenced PCR amplicons. Genome Res. 2011, 21, 494–504. [Google Scholar] [CrossRef] [Green Version]
- Edgar, R.C. UPARSE: Highly accurate OTU sequences from microbial amplicon reads. Nat. Methods 2013, 10, 996–998. [Google Scholar] [CrossRef] [PubMed]
- Wang, Q.; Garrity, G.M.; Tiedje, J.M.; Cole, J.R. Naive Bayesian classifier for rapid assignment of rRNA sequences into the new bacterial taxonomy. Appl. Environ. Microbiol. 2007, 73, 5261–5267. [Google Scholar] [CrossRef] [PubMed]
- DeSantis, T.Z.; Hugenholtz, P.; Larsen, N.; Rojas, M.; Brodie, E.L.; Keller, K.; Huber, T.; Dalevi, D.; Hu, P.; Andersen, G.L. Greengenes, a chimera-checked 16S rRNA gene database and workbench compatible with ARB. Appl. Environ. Microbiol. 2006, 72, 5069–5072. [Google Scholar] [CrossRef] [PubMed]
- Edgar, R.C. MUSCLE: Multiple sequence alignment with high accuracy and high throughput. Nucleic Acids Res. 2004, 32, 1792–1797. [Google Scholar] [CrossRef] [PubMed]
- Clarke, K.R. Non-parametric multivariate analyses of changes in community structure. Aust. J. Ecol. 1993, 18, 117–143. [Google Scholar] [CrossRef]
- White, J.R.; Nagarajan, N.; Pop, M. Statistical methods for detecting differentially abundant features in clinical metagenomic samples. PLoS Comput. Biol. 2009, 5, e1000352. [Google Scholar] [CrossRef] [PubMed]
- Paulson, J.N.; Pop, M.; Bravo, H.C. Metastats: An improved statistical method for analysis of metagenomic data. Genome Biol. 2011, 12, P17. [Google Scholar] [CrossRef]
- Segata, N.; Izard, J.; Waldron, L.; Gevers, D.; Miropolsky, L.; Garrett, W.S.; Huttenhower, C. Metagenomic biomarker discovery and explanation. Genome Biol. 2011, 12, R60. [Google Scholar] [CrossRef]
- Love, M.I.; Huber, W.; Anders, S. Moderated estimation of fold change and dispersion for RNA-seq data with DESeq2. Genome Biol. 2014, 15, 550. [Google Scholar] [CrossRef] [Green Version]
- Ma, B.; Wang, H.; Dsouza, M.; Lou, J.; He, Y.; Dai, Z.; Brookes, P.C.; Xu, J.; Gilbert, J.A. Geographic patterns of co-occurrence network topological features for soil microbiota at continental scale in eastern China. ISME J. 2016, 10, 1891. [Google Scholar] [CrossRef]
- Bastian, M.; Heymann, S.; Jacomy, M. Gephi: An open source software for exploring and manipulating networks. Icwsm 2009, 8, 361–362. [Google Scholar]
- Clarke, K.; Warwick, R. Change in Marine Communities: An Approach to Statistical Analysis and Interpretation; PRIMER-E Ltd.: Plymouth, UK, 2001. [Google Scholar]
- Li, Y.; Lin, Q.; Wang, S.; Li, X.; Liu, W.; Luo, C.; Zhang, Z.; Zhu, X.; Jiang, L.; Li, X. Soil bacterial community responses to warming and grazing in a Tibetan alpine meadow. FEMS Microbiol. Ecol. 2016, 92, fiv152. [Google Scholar] [CrossRef] [PubMed]
- Cleveland, C.C.; Nemergut, D.R.; Schmidt, S.K.; Townsend, A.R. Increases in soil respiration following labile carbon additions linked to rapid shifts in soil microbial community composition. Biogeochemistry 2006, 82, 229–240. [Google Scholar] [CrossRef]
- Fierer, N.; Bradford, M.A.; Jackson, R.B. Toward an Ecological Classification of Soil Bacteria. Ecology 2007, 88, 1354–1364. [Google Scholar] [CrossRef] [PubMed]
- Melillo, J.M.; Butler, S.; Johnson, J.; Mohan, J.; Steudler, P.; Lux, H.; Burrows, E.; Bowles, F.; Smith, R.; Scott, L.; et al. Soil warming, carbon-nitrogen interactions, and forest carbon budgets. Proc. Natl. Acad. Sci. USA 2011, 108, 9508–9512. [Google Scholar] [CrossRef] [PubMed]
- Xiong, D.; Yang, Z.; Chen, G.; Liu, X.; Lin, W.; Huang, J.; Bowles, F.P.; Lin, C.; Xie, J.; Li, Y.; et al. Interactive effects of warming and nitrogen addition on fine root dynamics of a young subtropical plantation. Soil Biol. Biochem. 2018, 123, 180–189. [Google Scholar] [CrossRef]
- Xiong, J.; Peng, F.; Sun, H.; Xue, X.; Chu, H. Divergent Responses of Soil Fungi Functional Groups to Short-term Warming. Microb. Ecol. 2014, 68, 708–715. [Google Scholar] [CrossRef]
- Lovisa, B.R.; Philip, H.; Tyson, G.W.; Blackall, L.L. Filamentous Chloroflexi (green non-sulfur bacteria) are abundant in wastewater treatment processes with biological nutrient removal. Microbiology 2002, 148, 2309. [Google Scholar]
- Fierer, N.; Lauber, C.L.; Ramirez, K.S.; Zaneveld, J.; Bradford, M.A.; Knight, R. Comparative metagenomic, phylogenetic and physiological analyses of soil microbial communities across nitrogen gradients. ISME J. 2011, 6, 1007–1017. [Google Scholar] [CrossRef] [Green Version]
- Yao, F.; Yang, S.; Wang, Z.; Wang, X.; Ye, J.; Wang, X.; DeBruyn, J.M.; Feng, X.; Jiang, Y.; Li, H. Microbial Taxa Distribution Is Associated with Ecological Trophic Cascades along an Elevation Gradient. Front. Microbiol. 2017, 8, 2071. [Google Scholar] [CrossRef]
- Bardgett, R.D.; van der Putten, W.H. Belowground biodiversity and ecosystem functioning. Nature 2014, 515, 505–511. [Google Scholar] [CrossRef] [PubMed]
- Pritchard, S.G. Soil organisms and global climate change. Plant Pathol. 2011, 60, 82–99. [Google Scholar] [CrossRef]
- Thompson, L.R.; Sanders, J.G.; McDonald, D.; Amir, A.; Ladau, J.; Locey, K.J.; Prill, R.J.; Tripathi, A.; Gibbons, S.M.; Ackermann, G.; et al. A communal catalogue reveals Earth’s multiscale microbial diversity. Nature 2017, 551, 457–463. [Google Scholar] [CrossRef] [PubMed]
Figure 1.
Composition of the bacterial community in the subtropical soil, based on the 16S rRNA gene. (a) Relative abundance of the top 10 phyla within the microbial community. (b) β-diversity using non-metric multi-dimensional scaling (NMDS). Abbreviations: CT—untreated, W—warming, LN—light N addition, HN—high N addition, WLN—warming combined with light N addition, WHN—warming combined with high N addition.

Figure 2.
The linear discriminant analysis effect size (LEfSe) bar graphs indicate significant differences under warming and N addition. (a) CT–W, (b) CT–LN, (c) CT–HN, (d) CT–WLN, (e) CT–WHN, (f) W–WLN, and (g) W–WHN.
Figure 2.
The linear discriminant analysis effect size (LEfSe) bar graphs indicate significant differences under warming and N addition. (a) CT–W, (b) CT–LN, (c) CT–HN, (d) CT–WLN, (e) CT–WHN, (f) W–WLN, and (g) W–WHN.

Figure 3.
Co-occurrence of ecological networks between the samples. Co-occurrence under warming conditions in (a) CT–W, (b) LN–WLN, and (c) HN–WHN. Co-occurrence under N addition conditions in (d) CT–LN–HN and (e) W–WLN–WHN. (f) Percentage of positive correlations within the co-occurrence networks.
Figure 3.
Co-occurrence of ecological networks between the samples. Co-occurrence under warming conditions in (a) CT–W, (b) LN–WLN, and (c) HN–WHN. Co-occurrence under N addition conditions in (d) CT–LN–HN and (e) W–WLN–WHN. (f) Percentage of positive correlations within the co-occurrence networks.

Figure 4.
Relationships between environmental factors and samples. (a) Variation partitioning analysis (VPA), (b) distance-based linear model test, and (c) Mantel test.
Figure 4.
Relationships between environmental factors and samples. (a) Variation partitioning analysis (VPA), (b) distance-based linear model test, and (c) Mantel test.

Figure 5.
Oligotrophic:copiotrophic (O:C) and Acidobacteria:Proteobacteria (A:P) ratios under warming and N addition. (a) O:C ratio and (b) A:P ratio (in (a) and (b), * p ≤ 0.05 and ** p ≤ 0.01, respectively).
Figure 5.
Oligotrophic:copiotrophic (O:C) and Acidobacteria:Proteobacteria (A:P) ratios under warming and N addition. (a) O:C ratio and (b) A:P ratio (in (a) and (b), * p ≤ 0.05 and ** p ≤ 0.01, respectively).


Table 1.
Statistical analysis on the group differences of bacterial community structure.
| Group-Pair | Shannon Index Difference a | Anosim | MRPP | ||
|---|---|---|---|---|---|
| Difference | p-Value | r-Value | p-Value | Significance b | |
| CT–W | 0.8 | 0.9137 | 0.856 | 0.009 | 0.01 * |
| CT–LN | 14.5 | 0.0564 | 0.372 | 0.017 | 0.02 * |
| CT–HN | 13.3 | 0.0788 | 0.508 | 0.008 | 0.008 ** |
| LN–HN | 1.2 | 0.8709 | 0.2 | 0.017 | 0.012 |
| LN–WLN | −8.1 | 0.2771 | 0.456 | 0.009 | 0.013 |
| HN–WHN | −6.5 | 0.3815 | 0.32 | 0.031 | 0.014 * |
| WLN–WHN | −0.4 | 0.9568 | −0.096 | 0.912 | 0.773 |
| W–WLN | 5.6 | 0.4502 | −0.036 | 0.557 | 0.454 |
| W–WHN | 6 | 0.4188 | 0.308 | 0.008 | 0.051 |
a The Shannon index difference statistical analysis between groups by Wilcox; b “*” for p-value < 0.05 and “**” for p-value < 0.01.
© 2019 by the authors. Licensee MDPI, Basel, Switzerland. This article is an open access article distributed under the terms and conditions of the Creative Commons Attribution (CC BY) license (http://creativecommons.org/licenses/by/4.0/).
Share and Cite
MDPI and ACS Style
Xie, L.; Zhang, Q.; Cao, J.; Liu, X.; Xiong, D.; Kong, Q.; Yang, Y. Effects of Warming and Nitrogen Addition on the Soil Bacterial Community in a Subtropical Chinese Fir Plantation. Forests 2019, 10, 861. https://doi.org/10.3390/f10100861
AMA Style
Xie L, Zhang Q, Cao J, Liu X, Xiong D, Kong Q, Yang Y. Effects of Warming and Nitrogen Addition on the Soil Bacterial Community in a Subtropical Chinese Fir Plantation. Forests. 2019; 10(10):861. https://doi.org/10.3390/f10100861
Chicago/Turabian StyleXie, Lin, Qunjie Zhang, Jiling Cao, Xiaofei Liu, Decheng Xiong, Qian Kong, and Yusheng Yang. 2019. "Effects of Warming and Nitrogen Addition on the Soil Bacterial Community in a Subtropical Chinese Fir Plantation" Forests 10, no. 10: 861. https://doi.org/10.3390/f10100861
Note that from the first issue of 2016, this journal uses article numbers instead of page numbers. See further details here.