On Wood–Water Interactions in the Over-Hygroscopic Moisture Range—Mechanisms, Methods, and Influence of Wood Modification


Building Materials, Department of Building and Environmental Technology, Lund University; P.O. Box 118, SE-22100 Lund, Sweden
Forests 2019, 10(9), 779; https://doi.org/10.3390/f10090779
Submission received: 28 June 2019
/
Revised: 2 September 2019
/
Accepted: 5 September 2019
/
Published: 8 September 2019
(This article belongs to the Special Issue Wood-Moisture Relations)
Abstract
:Wood is a hygroscopic material that absorbs and desorbs water to equilibrate to the ambient climate. Within material science, the moisture range from 0 to about 95–98% relative humidity is generally called the hygroscopic moisture range, while the exceeding moisture range is called the over-hygroscopic moisture range. For wood, the dominating mechanisms of moisture sorption are different in these two moisture ranges; in the hygroscopic range, water is primarily bound by hydrogen bonding in cell walls, and, in the over-hygroscopic range, water uptake mainly occurs via capillary condensation outside cell walls in macro voids such as cell lumina and pit chambers. Since large volumes of water can be taken up here, the moisture content in the over-hygroscopic range increases extensively in a very narrow relative humidity range. The over-hygroscopic range is particularly relevant for durability applications since fungal degradation occurs primarily in this moisture range. This review describes the mechanisms behind moisture sorption in the over-hygroscopic moisture range, methods that can be used to study the interactions between wood and water at these high humidity levels, and the current state of knowledge on interactions between modified wood and water. A lack of studies on interactions between modified wood and water in the over-hygroscopic range was identified, and the possibility of combining different methods to acquire information on amount, state, and location of water in modified wood at several well-defined high moisture states was pointed out. Since water potential is an important parameter for fungal growth, such studies could possibly give important clues concerning the mechanisms behind the increased resistance to degradation obtained by wood modification.
Keywords:
moisture; moisture content; over-hygroscopic; sorption isotherm; sorption; water; wood; wood modification.1. Introduction
In the living tree, water and nutrients are transported from the roots to the transpiring leaves in the canopy through the xylem in the wood stem, a transport mechanism which requires that a continuous path of water [1]. The structure of the xylem differs between softwoods and hardwoods, but they both have in common that water travels from cell lumen to cell lumen through openings (pits or perforation plates) that connect lumina of adjacent cells. The structure of the xylem is, thus, specialized in conducting and holding water, something that needs to be considered when using wood as a construction material.
The moisture content of the xylem in the living tree is high, in the range of 100–200% (mass of water in relation to dry mass) in sapwood depending on wood species [2]. After a tree is felled, the wood, therefore, needs to be dried before it can be used as a construction material. If the wood is kept in a relatively dry environment, e.g., indoors, it will not return to as high moisture levels as in the living tree. However, if wood is exposed in humid environments or to liquid water, e.g., outdoors, the moisture content can again reach levels similar to those in the living tree. Within material science, the moisture range from 0 to about 95–98% relative humidity is generally called the hygroscopic moisture range [3]. The moisture range exceeding about 95–98% is called the over-hygroscopic moisture range [4] or the capillary moisture range [3]. During the lifespan of wood used as a construction material, it experiences moisture contents in the over-hygroscopic range on mainly two occasions: during drying after felling and if the wood is wetted again in humid environments or by rain exposure. Therefore, for engineering applications, the over-hygroscopic moisture range is mainly relevant within wood-drying technology and for outdoor structures. In wood-drying technology, research on wood–water interactions mainly focused on moisture sorption and transport at high moisture levels for the purpose of developing models describing and optimizing wood-drying processes [5,6,7,8]. For wood in outdoor applications, this moisture range is relevant since degradation by wood-decaying fungi occurs at high humidity levels; the minimum water potential that allows activity of wood-degrading fungi is in the range of −4 to −0.1 MPa [9,10,11,12], which corresponds to 97–99.9% relative humidity.
The objectives of this review are to describe the mechanisms behind moisture sorption in the over-hygroscopic moisture range, the methods that can be used to study the interactions between wood and water at these high humidity levels, and the current state of knowledge on interactions between modified wood and water.
2. Moisture Sorption in Wood in the Over-Hygroscopic Moisture Range
In the over-hygroscopic moisture range, wood takes up a substantial amount of water in a very narrow relative humidity range. A softwood with a density of 400 kg∙m−3 absorbs 150% water (based on the dry mass of the wood) between 99.5% and 100% relative humidity [13]. For comparison, the moisture content in the whole hygroscopic moisture range increases from 0 to about 30%. The dominating mechanisms behind moisture sorption are different in the hygroscopic and over-hygroscopic moisture ranges. In the hygroscopic range, water is absorbed in cell walls and interacts with hydroxyl groups of the chemical constituents cellulose, hemicellulose, and lignin, and water is bound by hydrogen bonding. In this moisture range, physical wood properties, such as strength and dimensional stability, are strongly influenced by moisture content. In the over-hygroscopic range, water uptake is dominated by capillary condensation in macro voids such as cell lumina and pit chambers. Here, physical wood properties are not affected to the same extent as in the hygroscopic range, but this is the range where fungal degradation occurs. In the present paper, water absorbed in cell walls is denoted cell-wall water, while water outside cell walls is denoted capillary water.
For a long period of time, the paradigm within wood science was that water is found in cell lumina only when the cell walls are saturated with water [14]. According to this theory, cell walls should be saturated when capillary condensation in cell lumina occurs during absorption, and, in desorption, capillary water in macro voids should drain before the moisture content of cell walls decreases. However, others [15] suggested that the transition between the hygroscopic and the over-hygroscopic moisture range is more gradual in terms of where the water molecules are taken up in the wood structure [15]. This is supported by the fact that the moisture content at which large changes in mechanical properties and dimensions occur (referred to as the fiber saturation point) is generally lower than the cell-wall moisture content of water-saturated specimens measured by differential scanning calorimetry (DSC), solute exclusion, or low-field nuclear magnetic resonance (LFNMR) [15]. An additional indication of the fact that this transition is more gradual is that small dimensional changes and changes in mechanical properties were observed at high moisture levels, despite careful conditioning procedures being used to avoid moisture gradients [16,17,18].
Capillary Condensation
The dominating mechanism for water uptake in wood in the over-hygroscopic range is capillary condensation. That is, in small voids, water vapor can condense below the saturation vapor pressure [19,20]. The relative humidity at which capillary condensation occurs depends on void dimensions and geometry and is given by Equation (1) [20].
where φ is the relative humidity (Pa∙Pa−1), γ (N∙m−1) is the water surface tension, θ is the water–wood surface contact angle, V (m3∙mol−1) is the molar volume of water, R (8.314 J∙mol−1∙K−1) is the gas constant, T (K) is the temperature, and r1 and r2 (m) are the principal radii of condensation. In small voids, capillary condensation, thus, occurs at a lower relative humidity than in large pores, but also depends on pore geometry. For example, for a cylindrical pore, r1 = r2 = r, where r is the pore radius, while, for a slit shaped pore, r1 = r and r2 = ∞. For further examples of capillary condensation in pores of different geometries, see References [20,21].
Since the voids or pores outside of cell walls are in the micrometer range, capillary condensation to a significant extent occurs only at very high relative humidity levels. For cylindrical pores, the relative humidity at which capillary condensation occurs in different pore sizes is given in Table 1. Assuming cylindrical geometry for cell lumina and a radius of 5 µm, capillary condensation will occur at 99.98% relative humidity (Table 1). However, the wood macro structure also contains other, smaller spaces where capillary condensation can occur at lower humidity levels, e.g., pit chambers and the tapered ends of tracheid cell lumina. A relative humidity above 99% is, however, still needed in these smaller spaces in order to have significant amounts of water outside cell walls during absorption [22].
3. The Over-Hygroscopic Sorption Isotherm
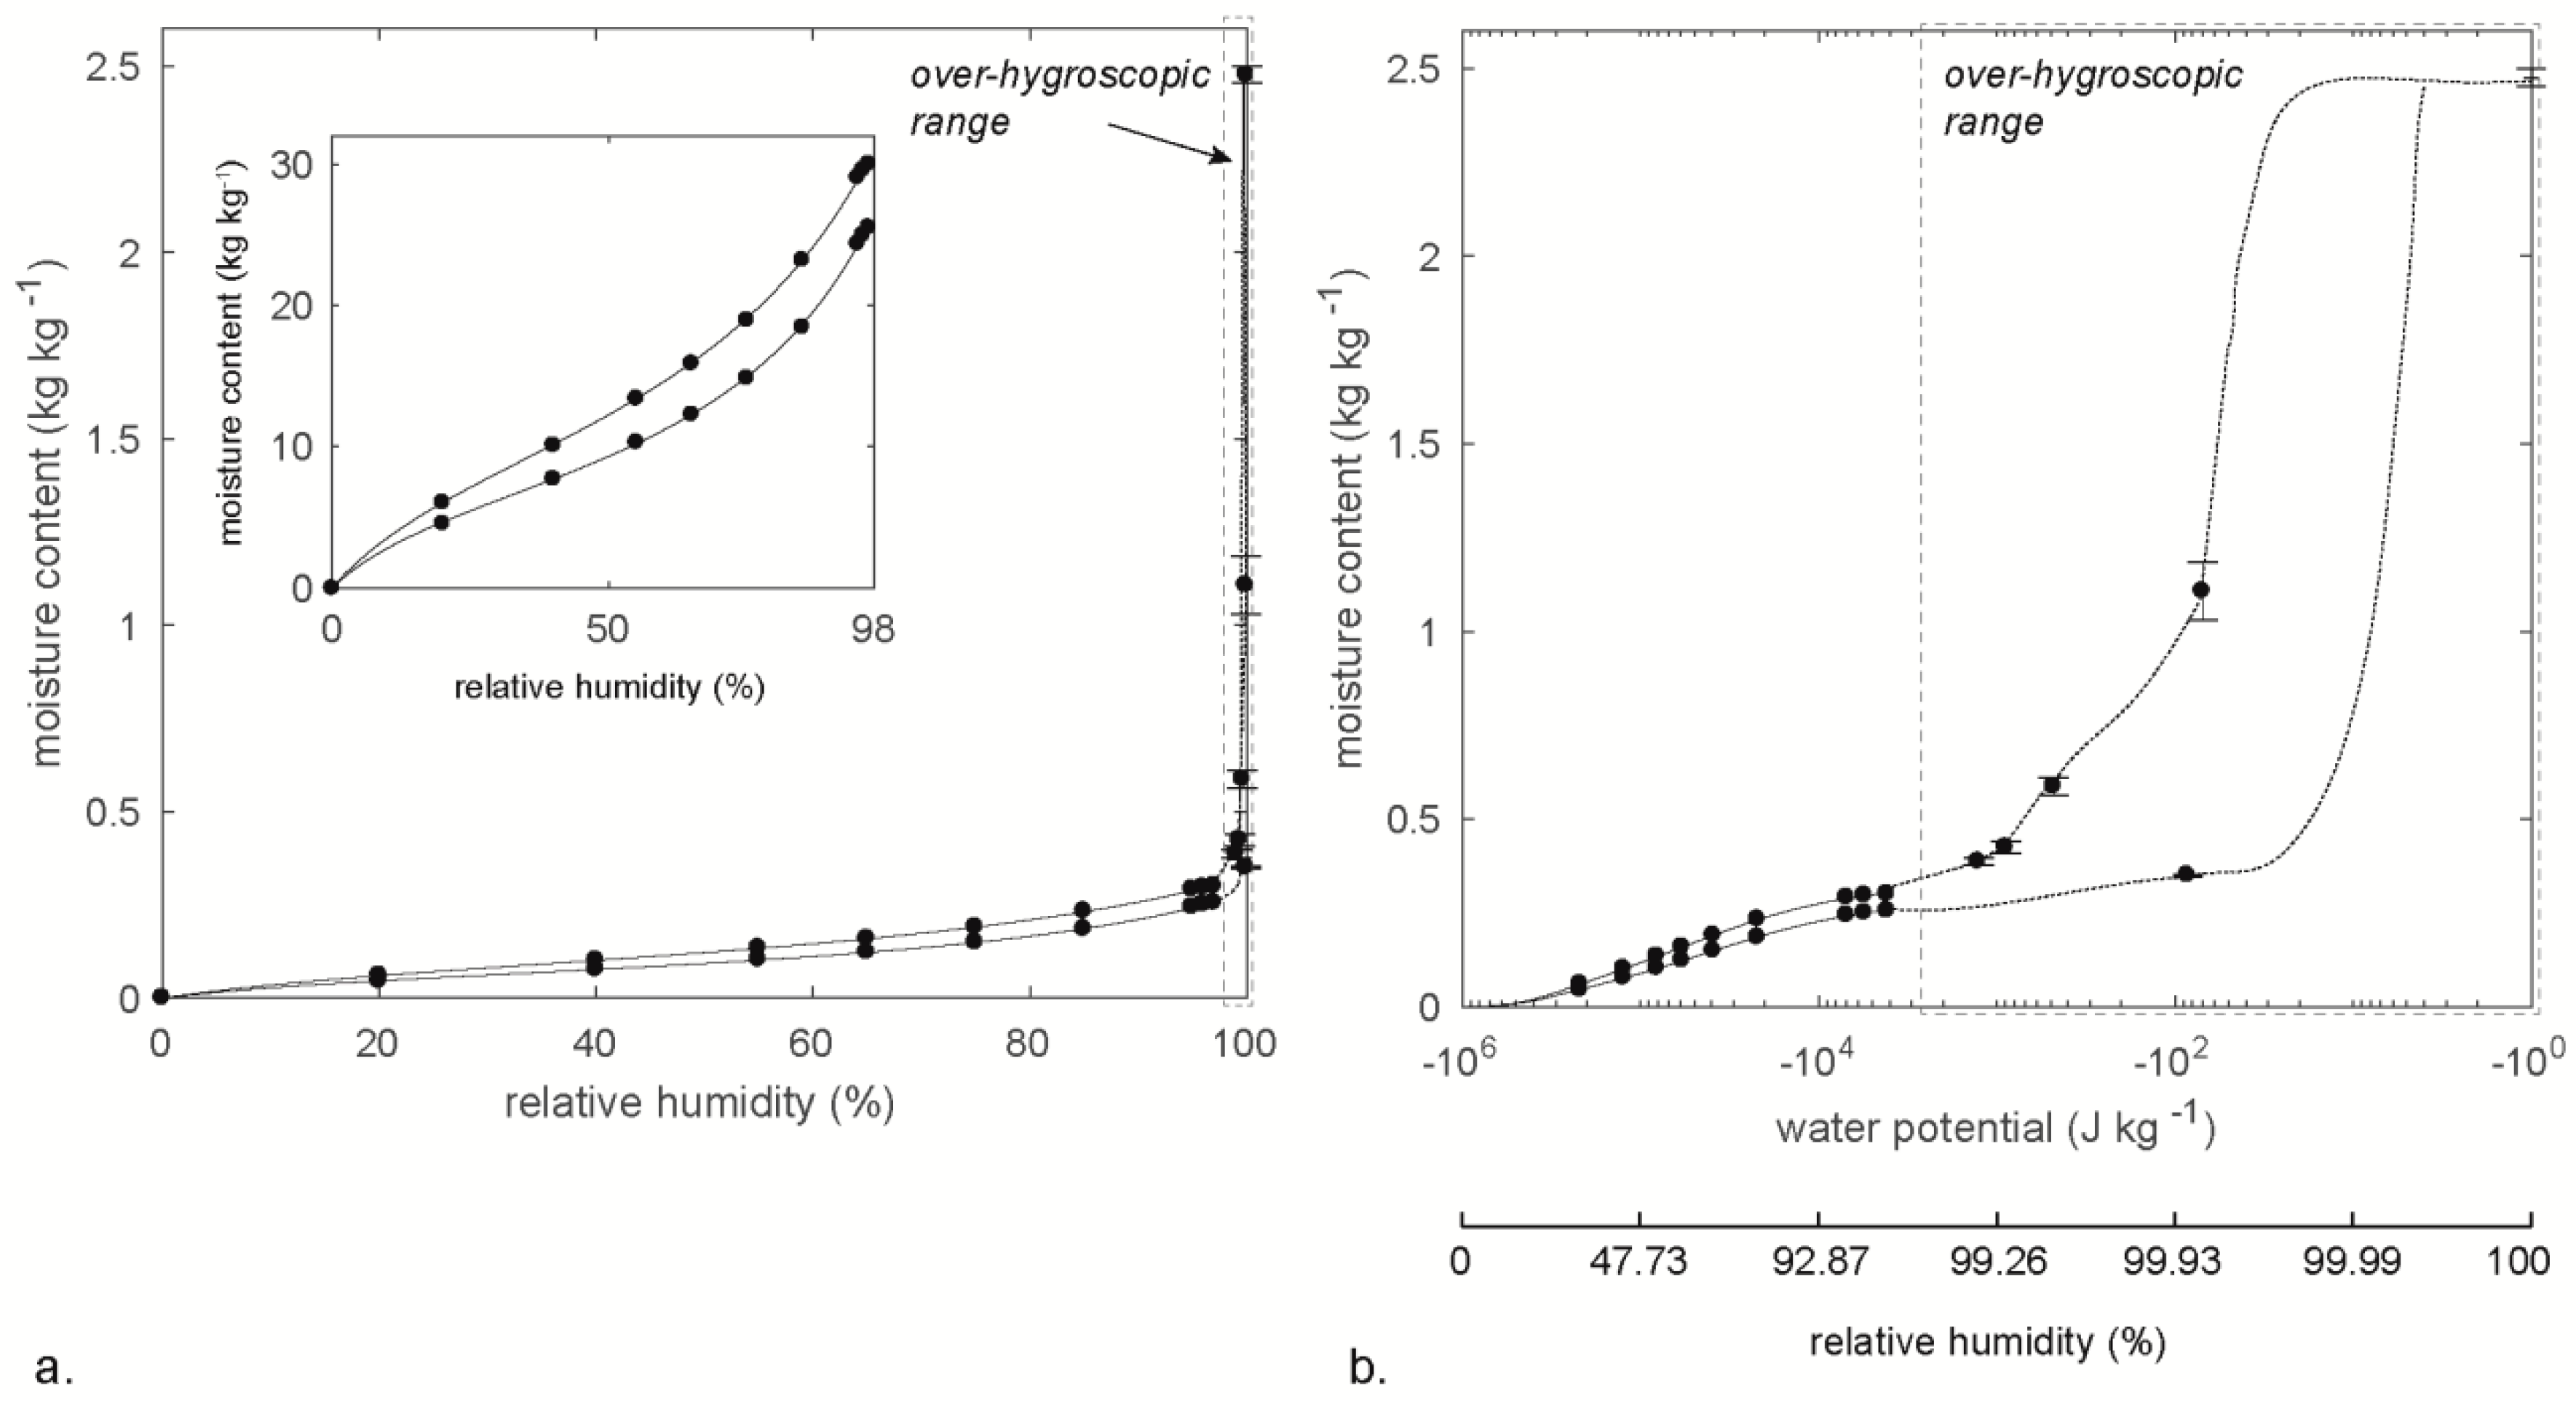
The total amount of water present in a material at equilibrium with a certain relative humidity is shown in a sorption isotherm. In the hygroscopic moisture range, the sorption isotherm is typically expressed as a function of relative humidity (insert in Figure 1a). Sorption isotherms covering the full moisture range, however, are commonly expressed as a function of water potential or pore water pressure since this gives a higher resolution at high humidity levels (Figure 1b). The water potential ψ (J∙kg−1) is related to relative humidity ϕ (Pa∙Pa−1) by Equation (2) [7].
where R (8.314 J∙mol−1∙K−1) is the gas constant, T (K) is the temperature, and Mw (0.018 kg∙mol−1) is the molar mass of water. Water potential can also be expressed in other units such as MPa. For example, 1 J∙kg−1 is 10−3 MPa. For conversion between different units, see Table 2.1 in Cooper [23]. For more details on the theoretical background, see Cloutier and Fortin [24].
3.1. Sorption Hysteresis
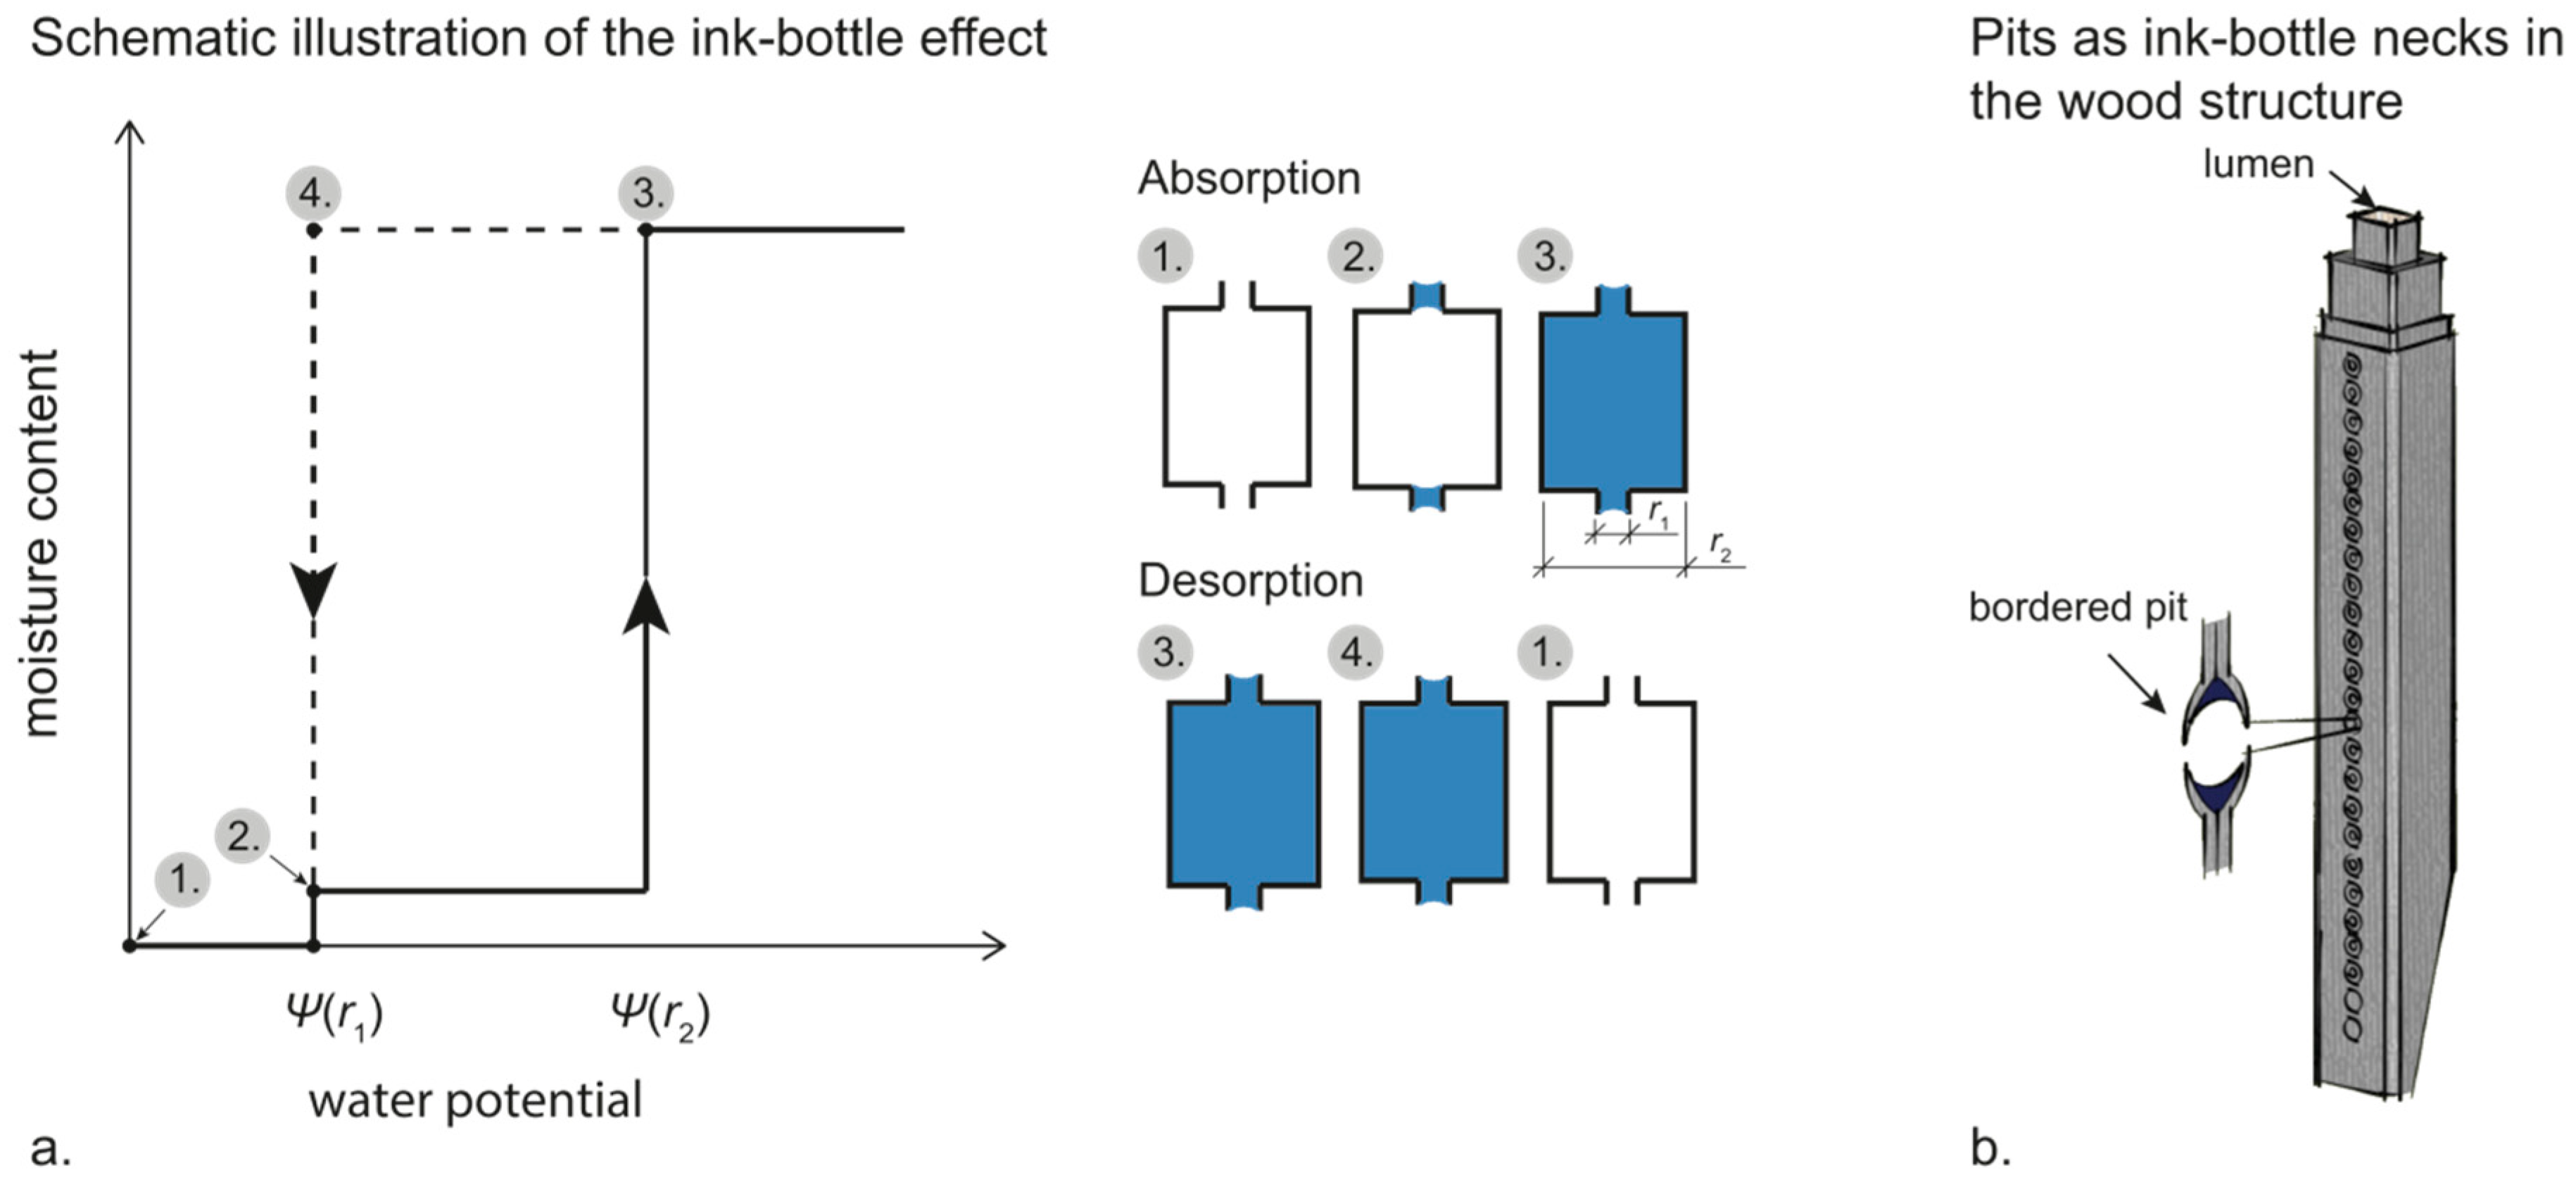
The equilibrium moisture content of a material does not only depend on the ambient climate; it also depends on the previous moisture level. An initially water-saturated material that reached equilibrium at a certain relative humidity contains more water than an initially dry material that reached equilibrium at the same relative humidity. This is called sorption hysteresis, and, as seen in Figure 1, the sorption hysteresis is particularly large in the over-hygroscopic moisture range. This large hysteresis for wood in this range is attributed to the ink-bottle effect or the pore blocking effect [26]. That is, the relative humidity where the pore is emptied depends on the radius of the opening that the water needs to pass through during drainage rather than the radius of the actual pore [20,27,28]. For example, assume a cylindrical pore with a radius of 5 µm having two cylindrical openings (bottle necks) each with a radius of 1 µm (Figure 2a). During absorption, capillary condensation in the bottle necks will occur at a water potential/relative humidity that corresponds to a radius of 1 µm, which is at 99.8922% (Table 1). The wider part of the pore will be filled at the relative humidity corresponding to a radius of 5 µm, which is 99.9784% (Table 1). The absorption isotherm would then have two steps: one where the ink-bottle necks are filled and one where the rest of the pore is filled (Figure 2a). During desorption, however, the wider part of the pore cannot be emptied until the bottle necks are emptied. Therefore, the whole pore will be emptied at the water potential/relative humidity that corresponds to a radius of 1 µm, which results in hysteresis between the absorption and desorption isotherms (Figure 2a). In wood, the pits that connect adjacent cell lumina act as ink-bottle necks [26] (Figure 2b). Therefore, during desorption, it is not the size of cell lumina that decides when the macro voids are emptied, but the size of the pit openings [26]. Water in cell lumina is not emptied until the relative humidity that corresponds to the size of the pit openings is reached. Since the pit openings are smaller than the cell lumina, this water will, thus, be emptied at a lower relative humidity than when it was filled. Therefore, if a cell has very small pit openings, water can be held in cell lumina down to moisture contents in the hygroscopic range during desorption. This was observed by Passarini et al. [29], where capillary water in lumina of axial parenchyma of Eucalyptus saligna Sm. was present at 90% relative humidity. This was attributed to the presence of vestured pits (pits in which the openings are very small), in possible combination with blocking by tyloses. Note, however, that sorption hysteresis for cell-wall water is attributed to other mechanisms than the ink-bottle effect (see References [15,30]).
Since the equilibrium moisture content depends not only on the ambient climate, but also on the previous moisture level, there are also intermediate curves, connecting the desorption and isotherm isotherms, called scanning isotherms [4,31,32]. These curves describe the equilibrium moisture content obtained when starting from another initial moisture state than a dry or water-saturated state. There are no measurements of scanning isotherms in the over-hygroscopic moisture range, but Cloutier and Fortin [7] tried different hypothetical scanning isotherms in their drying model and found that the choice of scanning isotherm significantly influenced the results.
3.2. Influence of Wood Structure
In the hygroscopic moisture range, the sorption isotherm expressed as moisture content (kg∙kg−1) is not strongly density-dependent. In the over-hygroscopic range, however, low wood density means a larger volume of macro voids (cell lumina) which can be filled with water. The maximum wood moisture content and the uppermost part of the over-hygroscopic sorption isotherm is, therefore, strongly density-dependent. This is shown in Figure 3 where desorption isotherms from the literature for wood of different densities are shown. The water potential where the drop in moisture content occurs depends on the size of the pit openings in the different cell types. [33]. Thus, two wood species can have the same density and similar maximum moisture content, but the shape of the desorption isotherm depends on wood structure in terms of the size of the pit openings and the volumes of water that are entrapped by these pit openings. This is seen by comparing sorption isotherms for two wood species with similar densities in Figure 3: beech (Fagus grandifolia Ehrhart) and congona (Brosimum alicastrum Swartz). The maximum moisture content of these wood species is similar due to the similar density, but the sorption isotherm of beech drops early in the desorption process, while water is held at lower humidity for congona. According to the results by Almeida and Hernandez [33], congona lost 37% of the water between −100 J∙kg−1 and −300 J∙kg−1, which corresponds to radii of 0.48 and 1.44 µm, respectively. According to mercury intrusion porosimetry (MIP) results from the same study, 37% of the pores were larger than 0.48 µm. Since MIP measures the pore entry sizes rather than the pore sizes themselves [34], there was a good correlation between the water potential at which the desorption isotherm dropped and the size of the “ink-bottle necks” determined by MIP. In addition, the relative volume of vessels, fiber lumina, and axial parenchyma was determined to be 38%, and this volume was, thus, well correlated with the amount of water lost between these two levels. Beech, on the other hand, lost a lot of water before −100 J∙kg−1, which correlated with having a large number of pore openings larger than 1.44 µm [33].
4. Experimental Methods for Studies of Moisture Conditions in the Over-Hygroscopic Moisture Range
4.1. Amount of Water and Sorption Isotherms
Conditioning of specimens to different moisture levels, as well as determination of sorption isotherms, is commonly done by using saturated salt solutions since different salts generate different relative humidity levels [36]. In addition, for determination of sorption isotherms, sorption balances [37] are commonly used. These techniques can, however, only be used up to about 95–97% relative humidity. For conditioning and determination of sorption isotherms at higher levels, i.e., in the over-hygroscopic moisture range, other techniques than those used in the hygroscopic range are needed. Such techniques are the pressure plate technique, pressure membrane technique, centrifuge techniques, and hanging water column.
The pressure plate technique was originally developed to study water holding capacity in soil [38], but was since widely used within wood science [16,17,18,24,25,26,33,35,39,40,41,42,43,44,45,46]. To condition a material to high moisture levels, specimens are placed on a water-saturated porous ceramic plate inside a pressure container. The pore size distribution of the ceramic plate is designed so that it will withstand the pressure applied during the experiment. Therefore, when pressure is applied, the pores in the plate will not empty, but the water in the pores will have curved menisci. The pores in the specimens in which the capillary pressure is lower than the applied pressure will be emptied, and this water is transported out through the ceramic plate since the underside of the ceramic plate is exposed to atmospheric pressure. The pressure plate technique can be used up to 15 bar, which corresponds to a relative humidity of 98.9%. For higher pressures, up to 100 bar, corresponding to a relative humidity of about 92.9%, the pressure membrane technique is used instead, since the pores in the ceramic plates are too large to withstand such high pressures. For determination of sorption isotherms with pressure plate/membrane techniques, specimens are equilibrated to several different pressures/moisture levels. The equilibrium mass is then determined, and the specimens are dried to determine the dry mass and, subsequently, the moisture content.
A less common technique to equilibrate wood specimens to moisture contents in the over-hygroscopic range is to spin specimens using a centrifuge [47,48]. This creates a body force which causes water to flow out of the wood specimen until the capillary forces are equal to the body force [48]. By spinning specimens at different rates, the moisture content as a function of capillary pressure can be obtained [47,48]. This is similar to the approach used to determine water retention value [49,50]. An additional method is the hanging water column, which is mainly used within soil science, but sometimes also for construction materials [51]. This method can, however, only be used at very low pressures close to saturation, since the pressure difference is obtained by elevating the sample (see References [51,52] for further details).
Conditioning above water instead of a saturated salt solution is sometimes claimed to correspond to conditioning at 100% relative humidity, which is not the case. The reason for this is that very small changes in temperature would either induce condensation or lower the relative humidity using this method. For example, if a sample is put above water in a climate box at 20.0 °C and the temperature later increases to 20.2 °C, the saturation vapor content would change from 17.28 g∙m−3 to 17.49 g∙m−3. A vapor content in the air of 17.28 g∙m−3 (assuming 100% relative humidity from the start) would, thus, make the relative humidity decrease to 98.8%. From Figure 1 and Figure 3, it is seen that this seemingly small change in relative humidity substantially decreases the equilibrium moisture content of the wood. Even a temperature change as small as 0.1 °C would decrease the relative humidity to 99.4%, and also change the moisture content substantially. For this reason, extreme accuracy in temperature would be needed in order to have a constant climate at 100% relative humidity, making this method practically impossible.
An additional way of conditioning samples to high moisture contents, which is sometimes used, is to let a dry piece of wood absorb a certain amount of water, or, to let water saturate a piece of wood and let it air-dry in a certain climate. The sample is then sealed in order for the moisture to redistribute within the sample. This will, however, not give a uniform moisture content within the specimen; during the redistribution process, some parts of the sample will reach equilibrium by absorption and others by desorption. Due to the large hysteresis, especially at high humidity levels (see Figure 1), different parts of the piece of wood will end up at different scanning isotherms and, thus, have different equilibrium moisture contents, albeit in equilibrium at the same relative humidity level [53]. This procedure should, thus, only be used if simply the average moisture content of the sample is important; furthermore, it is important to be aware that the specimens have moisture gradients, and interpretations of the results should be done accordingly.
4.2. Location and State of Water
The abovementioned methods are conditioning methods and, via moisture content determination after conditioning, they provide information on how much water is present in the wood at a certain relative humidity. However, no information is given on where in the wood structure the water is located. At low moisture contents, this information is not needed since water is predominantly present within cell walls. At higher moisture levels, however, water can be present in cell walls, cell lumina in cells of different sizes, and other small voids within the wood structure such as pit chambers. Therefore, it is relevant to study not only how much water is present, but also where the water is located.
To differentiate between different pools of water within the wood structure, low-field nuclear magnetic resonance (LFNMR) can be used [54,55,56,57,58,59,60,61,62,63,64] (for a theoretical background, see Rutledge [65]). Here, spin–spin relaxation time (T2) distributions are evaluated from exponential decay functions. The exponential functions are de-convoluted either by discrete multi-exponential fitting or by algorithms where continuous distributions of T2 relaxation times and amplitudes are obtained [66]. A drawback with the former is that it assumes that a discrete number of water populations are present. The latter, however, gives a continuous T2 distribution, and no assumption of number of water populations is needed. In the literature, both approaches are sometimes used for comparison (see References [54,59,67]).
A change in T2 indicates a change in wood–water interactions, which can be due to either a change in physical environment (surface-to-volume ratio) or chemical environment (surface chemistry inside pores or solutes in the water) [68]. Water in large pores has a longer T2 than water in small pores, and it is, therefore, possible to distinguish between capillary water in differently sized cell lumina [61]. It can be difficult to interpret if a change in T2 is caused by a change in the physical or chemical environment. To separate these two effects, two-dimensional (2D) LFNMR, where the correlation between two relaxation times, T1 and T2, is determined, can be used [63,68].
Apart from separating different pools of capillary water, LFNMR also gives information on water in and outside of cell walls. However, this technique can underestimate the amount of cell-wall water due to an exchange between capillary water and cell-wall water [67]. Therefore, measurements of absolute values of cell-wall moisture contents using this method should be interpreted with care. Cell-wall moisture content can be determined using LFNMR if the measurements are performed at sub-zero temperatures [67,69]. The capillary water then freezes, the signal normally obtained from capillary water disappears, and only one peak representing cell-wall water is seen [69]. The exchange between capillary water and cell-wall water is, thus, hindered. Beck et al. [67] showed that the cell-wall moisture content determined by LFNMR at sub-zero temperatures is higher than the cell-wall moisture content determined using the same technique at room temperature.
Apart from LFNMR at sub-zero temperatures, there are two additional techniques which can be used to differentiate between water inside and outside of cell walls: differential scanning calorimetry (DSC) [70,71,72,73,74] and solute exclusion technique (SET) [75]. As with LFNMR at sub-zero temperatures, DSC is based on the assumption that the water in cell walls does not freeze, but all water outside cell walls does at the temperatures used in the experiment. The specimen is exposed to sub-zero temperatures, and the energy needed to the melt the ice formed during cooling, i.e., the enthalpy of melting, is evaluated. From this, the amount of frozen (capillary water) and non-frozen water (cell-wall water) can be determined (see Simpson and Barton [73]). Solute exclusion can also be used to determine the cell-wall moisture content; however, unlike DSC and sub-zero temperature LFNMR, the specimen is not frozen. Instead, a water-saturated specimen is placed in a solution of molecular probe solutes with known concentration and known size of the probe molecules. The change in concentration, which occurs when the probe molecules diffuse into the specimen, is used to determine the volume of accessible water [75,76].
4.3. Combining Different Techniques to Determine Amount, Location, and State of Water
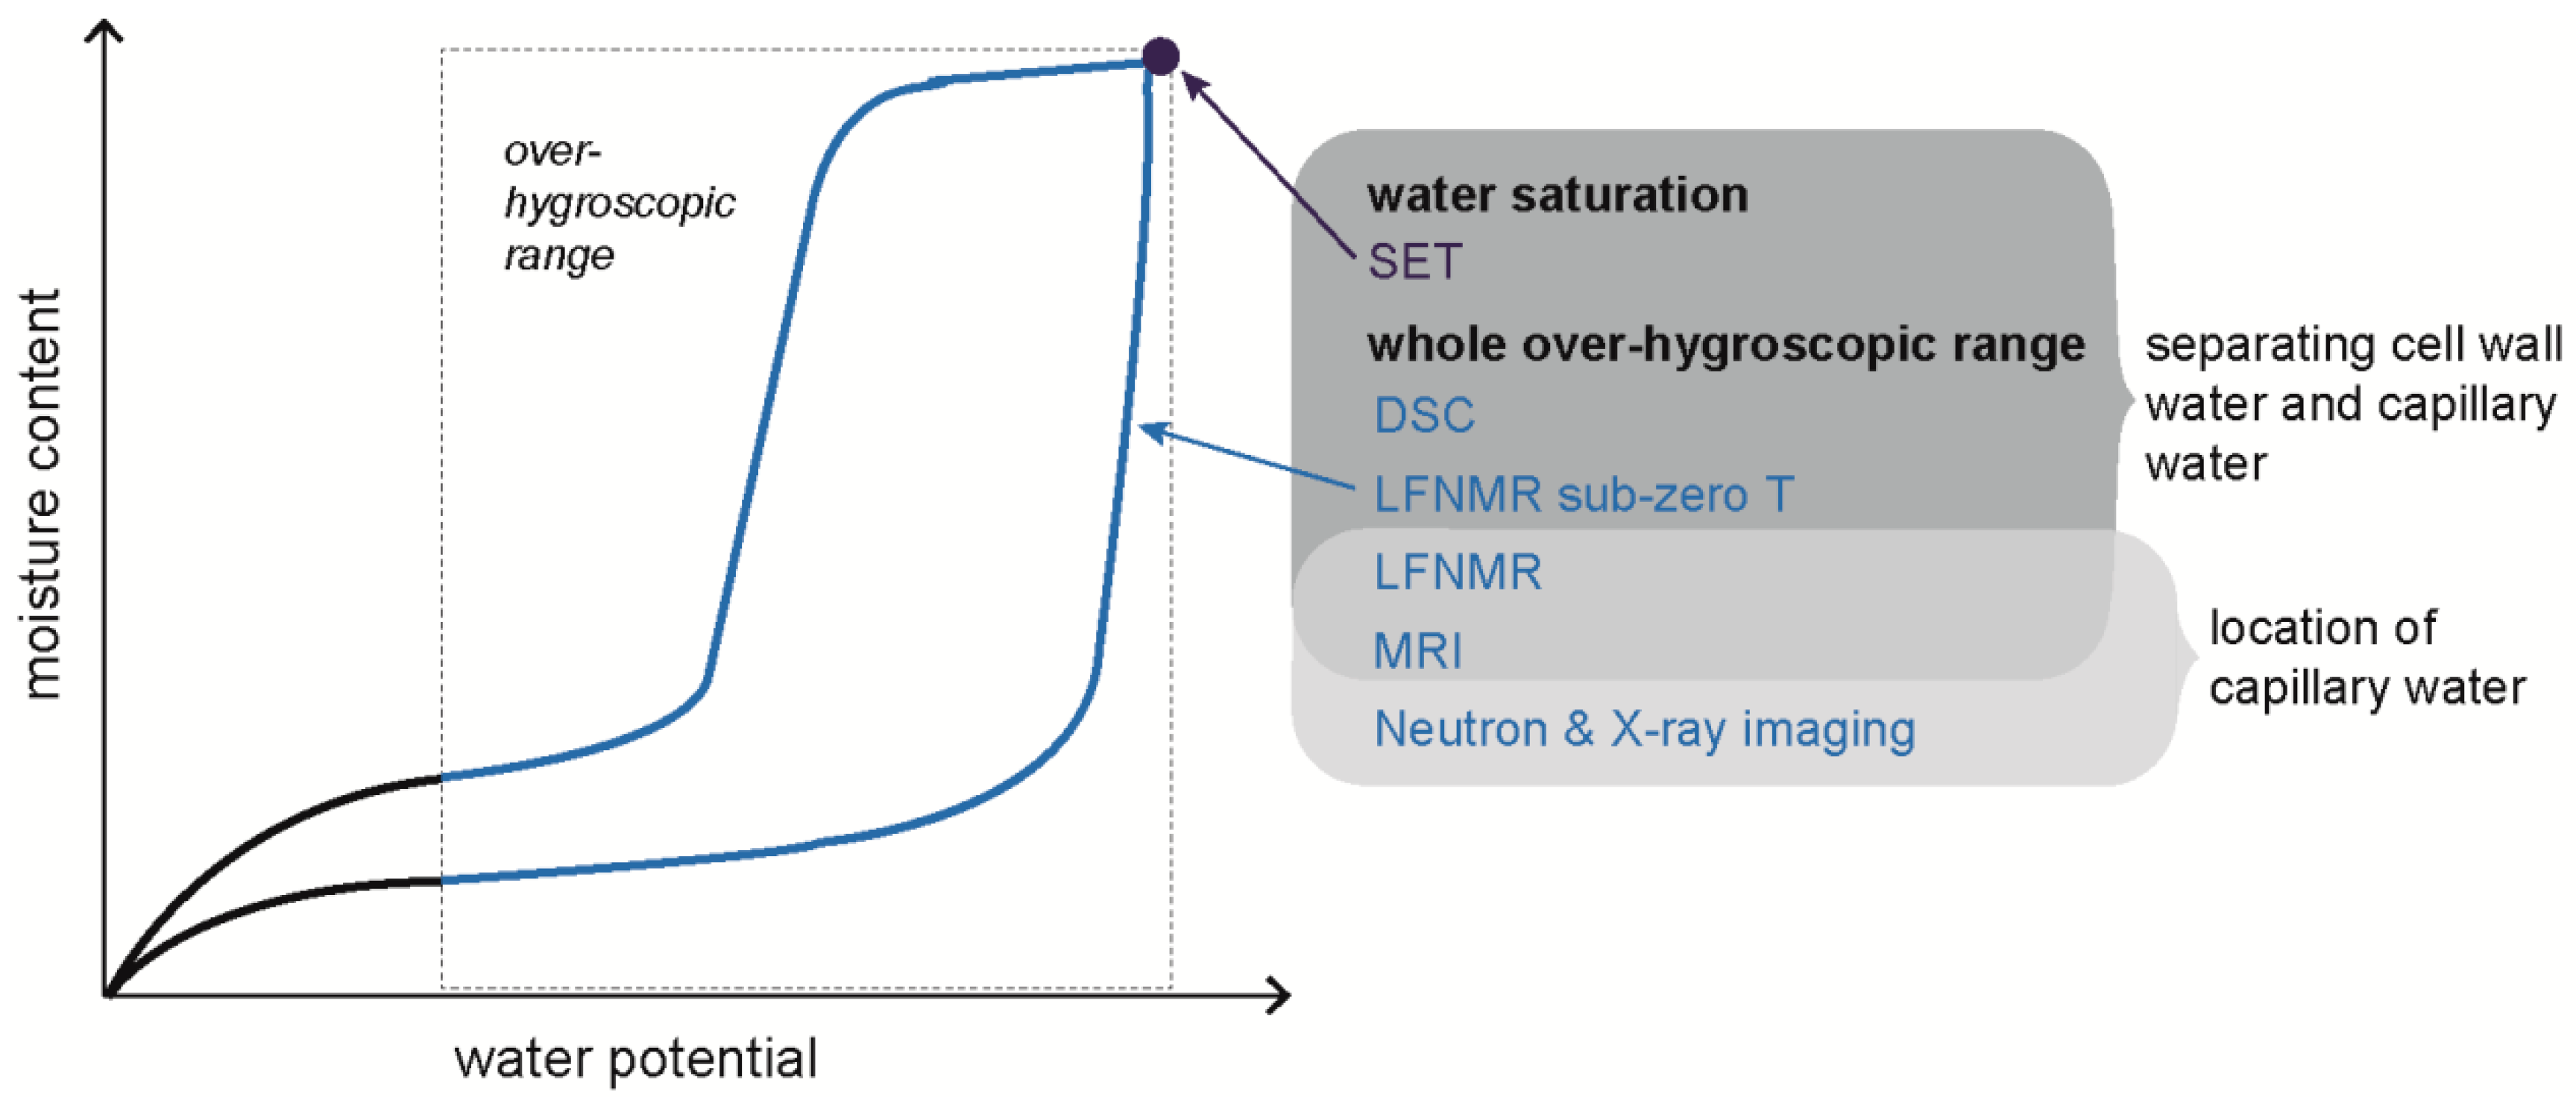
Techniques for determining the location and state of water described above were mainly used on water-saturated specimens, or on specimens during drying or wetting, i.e., with moisture gradients present within the specimen. Depending on the purpose of the measurement, the latter can make the interpretation of the data challenging. However, all the techniques mentioned above, except SET, can potentially be used at different well-defined moisture levels in the over-hygroscopic range (Figure 4). This requires that these techniques are combined with any of the conditioning techniques giving well-defined moisture states described in Section 4.1. This makes it possible to get information about the amount, location, and state of water in wood at several humidity levels in the over-hygroscopic moisture range. There are, however, few examples in the literature where this was done. Almeida et al. [46] combined MRI with pressure membrane conditioning to visualize spatial distributions and transport of liquid water during drying under controlled high-humidity conditions. Also, Thygesen et al. [43] used LFNMR on specimens conditioned by the pressure plate technique to establish if capillary water was present within the wood structure.
5. Influence of Modification
Wood modifications, such as acetylation, furfurylation, and thermal modification, are known to improve resistance to fungal degradation; however, the exact mechanisms behind the improved durability are not fully understood (see References [85,86,87]). It is well known that water plays an important role in degradation processes, since wood-degrading fungi need water for several different purposes [12]. All modification techniques mentioned above lower the moisture content within cell walls, and the moisture exclusion achieved by the modification is, therefore, considered to be an important factor [88]. It was also suggested that not only the total moisture content is of importance, but also the distribution of water within the wood structure, e.g., if sufficient amounts of water are accessible to fungal hyphae [89]. Water potential is a central factor for fungal growth [11,12], and, for wood-degrading fungi, the minimum water potential is in the range of −4 to −0.1 MPa [9,10,11,12], which corresponds to about 97–99.9% relative humidity. Fungal degradation, therefore, primarily occurs in the over-hygroscopic moisture range. However, despite the importance of the over-hygroscopic range for fungal degradation, few studies investigated the interaction between modified wood and water in this moisture range.
5.1. Acetylation
In acetylation, wood reacts with acetic anhydride, producing acetic acid as a by-product [90]. During the reaction, accessible hydroxyl groups are replaced with acetyl groups, thus reducing the number of hydroxyl groups accessible for water molecules [91,92]. In addition, acetylation swells the cell wall, leaving less available space for water. Cell-wall bulking is considered to be the main mechanism for the lowered cell-wall moisture content in acetylated wood [93]. This lowered cell-wall moisture content is a possible reason for the enhanced durability, since a low cell-wall moisture content could hinder the transport of substances necessary for the fungi [87]. There are, however, indications that acetylation not only changes the cell-wall moisture content, but also influences the interactions between wood and capillary water [62,67]. Wood-degrading fungi need capillary water [12], and acetylation lowers the over-hygroscopic desorption isotherm [43]. Thygesen and Elder [62] and Beck et al. [67] studied the influence of acetylation on interactions between wood and water using LFNMR and found that acetylation increased T2 for the peak corresponding to lumen water. Beck et al. [67] found that this increase was linked to the weight percentage gain of the acetylated wood; a higher weight percentage gain achieved from the acetylation led to a longer T2. An increased T2 can mean either a larger pore size (change in physical environment) or a changed interaction between the material and water (change in chemical environment). It is unlikely that acetylation increases the size of the cell lumina, and Thygesen and Elder [62] concluded that the longer T2 was more likely due to acetylation making the lumen surface more hydrophobic. This is reasonable since a change in contact angle was detected on surfaces of acetylated wood using the Wilhelmy method [94,95,96], even though contact-angle measurements using this method under non-equilibrated conditions on materials that absorb water were questioned [97]. Since a change in contact angle would change the relative humidity at which capillary condensation occurs (Equation (1)), this should change the over-hygroscopic absorption isotherm. However, over-hygroscopic absorption isotherms were not determined for acetylated wood and, as discussed above, the shape of the desorption isotherms depends on the size of pit openings. No anatomical changes were, however, detected for acetylated wood [98,99]. This is, thus, consistent with the almost constant ratio between the desorption isotherm of acetylated wood and untreated wood obtained by Thygesen et al. [43]
5.2. Furfurylation
Furfurylation is performed by impregnating wood with a mixture of furfuryl alcohol and catalysts during heating so that polymerization occurs [100]. As with acetylation, furfurylation reduces the cell-wall moisture content of wood, and the suggested mechanism is cell-wall bulking, i.e., the polymer fills space in the cell wall otherwise available for water [88,101,102]. In addition, the polymer fills or partly fills lumina of softwood tracheids [99,103]. Moghaddam et al. [99] found that the cross-section of the lumina in southern yellow pine (Pinus palustris Mill.) became more circular or elliptic after furfurylation. In maple (Acer platanoides L.), polymer deposits were mainly found in rays and vessels, but not in the fiber lumina [99].
Thygesen and Elder [62] studied the influence of furfurylation on the interactions between wood and water by LFNMR and found that, as with the acetylated specimens, the T2 increased for the peak related to water in cell lumina. An increase in T2 could mean larger voids, but furfurylation rather decreases the size of the cell lumina due to polymer deposition. However, since the cell lumina of different cell types are filled to a different extent, an increase in T2 could possibly be seen if cells with small cell lumina were filled to a larger extent than cells with large lumina, i.e., if, for example, latewood tracheid lumina were filled to a larger extent than earlywood tracheid lumina. The increased T2 for the water in cell lumina could, as suggested for acetylated wood, also be related to the increased hydrophobicity of the of the wood due to furfurylation [62].
Unlike acetylated wood, the sorption isotherm of furfurylated wood is not lowered in the whole moisture range; Thygesen et al. [43] found that the sorption isotherm was lowered up to about 99 % relative humidity, but the sorption isotherm of furfurylated wood was higher than for untreated wood above that level. Since parts of the cell lumina were likely filled in the furfurylated wood, this can seem counterintuitive; however, a possible reason is that voids not present in untreated wood were introduced by the furfurylation process. Both intercellular cracks and micro-cracks were observed in furfurylated wood [103]. Therefore, it is possible that capillary condensation occurs in these voids, which would change the over-hygroscopic sorption isotherms. Also, since the furfurylation changes the geometry of cell lumina [99] and possibly also the contact angle [94], this can affect the relative humidity at which capillary condensation occurs (Equation (1)). An additional possible explanation could be that pit openings of some cells are blocked by polymer deposits. Water would then remain in cell lumina during desorption, resulting in a higher desorption isotherm.
5.3. Thermal Modification
Studies on heat-treated wood in the over-hygroscopic moisture range are limited. Zauer et al. [44] found that the over-hygroscopic sorption isotherms decreased for heat-treated spruce (Picea abies (L.) Karst.) heartwood, but the extent of the decrease was different at different moisture levels. Javed et al. [77] found that heat treatment at 230 and 240 °C gave higher maximum moisture contents based on dry mass than for untreated references, but the absolute amount of water was always lower in the heat-treated samples. This may be a consequence of the mass loss occurring during thermal treatment; the moisture content can, thus, increase because of the lower dry mass, but without the actual amount of water being higher. For other modifications, e.g., acetylation and furfurylation, which increase the dry mass of the wood, this is generally corrected for so that the moisture content is given based on dry mass before the treatment [88].
6. Concluding Remarks and Outlook for Future Research
Despite the importance of the over-hygroscopic moisture range for fungal degradation, and the importance of the change in interactions between modified wood and water in decay protection, few studies focused on the influence of wood modification on the interaction between wood and water in this moisture range. Three of the most widely studied modification techniques affect the sorption isotherm (water potential–moisture content relationship) at high humidity levels. However, since these modification techniques act in different ways, the underlying mechanisms are not necessarily the same. It is, however, likely that the contact angle between water and lumen surfaces is influenced for all these modification techniques. A change in contact angle would affect the capillary condensation of water (Equation (1)) and could, thus, change the sorption isotherm in the transition zone between the hygroscopic and the over-hygroscopic moisture ranges, i.e., around the limit where fungal activity can occur. The situation is more complex for furfurylated wood since cell lumina are filled to some extent and intercellular cracks and micro-cracks in cell walls were observed, which also affects when capillary condensation of water occurs. There are, however, no data on over-hygroscopic absorption isotherms for modified wood and, thus, no data of sorption hysteresis for modified wood in this moisture range. Such data could, however, give information on the mechanisms behind changes in sorption behavior due to wood modification.
There are a range of techniques available to study interactions between wood and water at high relative humidity levels. Combining any of the conditioning techniques with techniques detecting the location and state of water, as described in Section 4.3, enables detailed studies of the amount, location, and state of water at well-defined equilibrium moisture content, as well as on the way to equilibrium. For example, pressure plate conditioning in combination with DSC and/or LFNMR would enable studies of the influence of modification on capillary water and cell-wall water separately under equilibrated conditions. Imaging under well-defined climate conditions can give information both on the transport of water on the way to equilibrium and the location of capillary water at different high moisture contents. More work on modified wood in the over-hygroscopic range using these methods would most likely give new insights into the amount, state, and location of water in modified wood. Since water potential is an important factor for fungal growth, such studies could give important clues concerning the mechanisms behind the increased resistance to degradation.
Funding
This research was funded by Svenska Forskningsrådet FORMAS (the Swedish Research Council FORMAS), grant number 2018-00387.
Acknowledgments
The funding from the Swedish Research Council FORMAS is gratefully acknowledged.
Conflicts of Interest
The author declares no conflicts of interest.
References
- Fitter, A.H.; Hay, R.K.M. Environmental Physiology of Plants, 3rd ed.; Academic Press: London, UK, 2002. [Google Scholar]
- Kollmann, F.F.P.; Côté, W.A. Principles of Wood Science and Technology I. Solid Wood; Springer: Berlin/Heidelberg, Germany, 1968. [Google Scholar]
- Nilsson, L.-O.; Franzoni, E.; Paroll, H. Introduction. In Methods of Measuring Moisture in Building Materials and Structures; Nilsson, L.-O., Ed.; Springer: Berlin/Heidelberg, Germany, 2018. [Google Scholar]
- Espinosa, R.M.; Franke, L. Influence of the age and drying process on pore structure and sorption isotherms of hardened cement paste. Cem. Concr. Res. 2006, 36, 1969–1984. [Google Scholar] [CrossRef]
- Fortin, Y.; Defo, M.; Nabhani, M.; Tremblay, C.; Gendron, G. A simulation tool for the optimization of lumber drying schedules. Dry. Technol. 2004, 22, 963–983. [Google Scholar] [CrossRef]
- Wiberg, P.; Sehlstedt Persson, S.M.B.; Morén, T.J. Heat and mass transfer during sapwood drying above the fibre saturation point. Dry. Technol. 2000, 18, 1647–1664. [Google Scholar] [CrossRef]
- Cloutier, A.; Fortin, Y. Wood drying modelling based on the water potential concept—Hysteresis effects. Dry. Technol. 1994, 12, 1793–1814. [Google Scholar] [CrossRef]
- Cloutier, A.; Fortin, Y. A model of moisture movement in wood based on water potential and the determination of the effective water conductivity. Wood Sci. Technol. 1993, 27, 95–114. [Google Scholar] [CrossRef]
- Boddy, L. Effect of temperature and water potential on growth-rate of wood-rotting basidiomycetes. Trans. Br. Mycol. Soc. 1983, 80, 141–149. [Google Scholar] [CrossRef]
- Griffin, D.M. Water potential and wood-decay fungi. Annu. Rev. Phytopathol. 1977, 15, 319–329. [Google Scholar] [CrossRef]
- Griffith, G.S.; Boddy, L. Fungal decomposition of attached angiosperm twigs 3. Effect of water potential and temperature on fungal growth, survival and decay of wood. New Phytol. 1991, 117, 259–269. [Google Scholar] [CrossRef]
- Schmidt, O. Wood and Tree Fungi: Biology, Damage, Protection and Use; Springer: Berlin/Heidelberg, Germany, 2006. [Google Scholar]
- Stamm, A.J. Wood and Cellulose Science; The Ronald Press Company: New York, NY, USA, 1964. [Google Scholar]
- Tiemann, H.D. Effect of Moisture Upon the Strength and Stiffness of Wood; U.S. Department of Agriculture: Washington, DC, USA, 1906. [Google Scholar]
- Engelund, E.T.; Thygesen, L.G.; Svensson, S.; Hill, C.A.S. A critical discussion of the physics of wood-water interactions. Wood Sci. Technol. 2013, 47, 141–161. [Google Scholar] [CrossRef]
- Almeida, G.; Hernandez, R.E. Changes in physical properties of tropical and temperate hardwoods below and above the fiber saturation point. Wood Sci. Technol. 2006, 40, 599–613. [Google Scholar] [CrossRef]
- Almeida, G.; Hernandez, R.E. Changes in physical properties of yellow birch below and above the fiber saturation point. Wood Fiber Sci. 2006, 38, 74–83. [Google Scholar]
- Hernández, R.E.; Pontin, M. Shrinkage of three tropical hardwoods below and above the fiber saturation point. Wood Fiber Sci. 2006, 38, 474–483. [Google Scholar]
- Thomson, W. On the equilibrium of vapour at a curved surface of liquid. Lond. Dublin Philos. Mag. J. Sci. 1871, 42, 448–452. [Google Scholar] [CrossRef]
- Gregg, S.J.; Sing, K.S.W. Adsorption, Surface Area and Porosity; Academic Press: Cambridge, MA, USA, 1967. [Google Scholar]
- Everett, D.H. Some problems in the investigation of porosity by adsorption methods. In Proceedings of the Tenth Symposium of the Colston Research Society, Bristol, UK, 24–27 March 1958; pp. 95–120. [Google Scholar]
- Engelund, E.T.; Thygesen, L.G.; Hoffmeyer, P. Water sorption in wood and modified wood at high values of relative humidity. Part 2: Appendix. Theoretical assessment of the amount of capillary water in wood microvoids. Holzforschung 2010, 64, 325–330. [Google Scholar] [CrossRef]
- Cooper, J.D. Soil Water Measurement: A Practical Handbook; Wiley: Hoboken, NJ, USA, 2016. [Google Scholar]
- Cloutier, A.; Fortin, Y. Moisture-content—Water potential relationship of wood from saturated to dry conditions. Wood Sci. Technol. 1991, 25, 263–280. [Google Scholar] [CrossRef]
- Fredriksson, M.; Johansson, P. A method for determination of absorption isotherms at high relative humidity levels: Measurements on lime-silica brick and Norway spruce (Picea abies (L.) Karst.). Dry. Technol. 2016, 34, 132–141. [Google Scholar] [CrossRef]
- Fortin, Y. Moisture Content—Matric Potential Relationship and Water Flow Properties of Wood at High Moisture Contents. Ph.D. Thesis, University of British Columbia, Vancouver, BC, Canada, 1979. [Google Scholar]
- McBain, J.W. An Explanation of Hysteresis in the Hydration and Dehydration of Gels. J. Am. Chem. Soc. 1935, 57, 699–700. [Google Scholar] [CrossRef]
- Ravikovitch, P.I.; Neimark, A.V. Experimental Confirmation of Different Mechanisms of Evaporation from Ink-Bottle Type Pores: Equilibrium, Pore Blocking, and Cavitation. Langmuir 2002, 18, 9830–9837. [Google Scholar] [CrossRef]
- Passarini, L.; Malveau, C.; Hernández, R.E. Distribution of the equilibrium moisture content in four hardwoods below fiber saturation point with magnetic resonance microimaging. Wood Sci. Technol. 2015, 49, 1251–1268. [Google Scholar] [CrossRef]
- Salmén, L.; Larsson, P.A. On the origin of sorption hysteresis in cellulosic materials. Carbohydr. Polym. 2018, 182, 15–20. [Google Scholar] [CrossRef]
- Fredriksson, M.; Thybring, E.E. Scanning or desorption isotherms? Characterising sorption hysteresis of wood. Cellulose 2018, 25, 4477–4485. [Google Scholar] [CrossRef] [Green Version]
- Peralta, P.N.; Bangi, A.P. Modeling wood moisture sorption hysteresis based on similarity hypothesis. Part 1. Direct approach. Wood Fiber Sci. 1998, 30, 48–55. [Google Scholar]
- Almeida, G.; Hernandez, R.E. Influence of the pore structure of wood on moisture desorption at high relative humidities. Wood Mater. Sci. Eng. 2007, 2, 33–44. [Google Scholar] [CrossRef]
- Berodier, E.; Bizzozero, J.; Muller, A.C.A. Mercury intrusion porosimetry. In A Practical Guide to Microstructural Analysis of Cementitious Materials; Scrivener, K., Snellings, R., Lothenbach, B., Eds.; CRC Press: Boca Raton, FL, USA, 2016. [Google Scholar]
- Tremblay, C.; Cloutier, A.; Fortin, Y. Moisture content water potential relationship of red pine sapwood above the fiber saturation point and determination of the effective pore size distribution. Wood Sci. Technol. 1996, 30, 361–371. [Google Scholar] [CrossRef]
- Greenspan, L. Humidity fixed points of binary saturated aqueous solutions. J. Res. NBS A Phys. Chem. 1977, 81, 89–96. [Google Scholar] [CrossRef]
- Williams, D.R. The characterisation of powders by gravimetric water vapour sorption. Int. LABMATE 1995, 20, 40–42. [Google Scholar]
- Richards, L.A. Porous plate apparatus for measuring moisture retention and transmission by soil. Soil Sci. 1948, 66, 105–110. [Google Scholar] [CrossRef]
- Fredriksson, M.; Wadsö, L.; Johansson, P. Small resistive wood moisture sensors; a method for moisture content determination in wood structures Eur. J. Wood Wood Prod. 2013, 71, 515–524. [Google Scholar] [CrossRef]
- Cloutier, A.; Tremblay, C.; Fortin, Y. Effect of specimen structural orientation on the moisture content—Water potential relationship of wood. Wood Sci. Technol. 1995, 29, 235–242. [Google Scholar] [CrossRef]
- Defo, M.; Fortin, Y.; Cloutier, A. Moisture content-water potential relationship of sugar maple and white spruce wood from green to dry conditions. Wood Fiber Sci. 1999, 31, 62–70. [Google Scholar]
- Zhang, J.; Peralta, P.N. Moisture content-water potential characteristic curves for red oak and loblolly pine. Wood Fiber Sci. 1999, 31, 360–369. [Google Scholar]
- Thygesen, L.G.; Engelund, E.T.; Hoffmeyer, P. Water sorption in wood and modified wood at high values of relative humidity. Part I: Results for untreated, acetylated, and furfurylated Norway spruce. Holzforschung 2010, 64, 315–323. [Google Scholar] [CrossRef]
- Zauer, M.; Meissner, F.; Plagge, R.; Wagenführ, A. Capillary pore-size distribution and equilibrium moisture content of wood determined by means of pressure plate technique. Holzforschung 2016, 70, 137. [Google Scholar] [CrossRef]
- Penner, E. Suction and its use as a measure of moisture contents and potentials in porous materials. In Humidity and Moisture Vol. 4. Principles and Methods of Measuring Moisture in Liquids and Solid; Wexler, A., Ed.; Reinhold: New York, NY, USA, 1965; pp. 245–252. [Google Scholar]
- Almeida, G.; Leclerc, S.; Perre, P. NMR imaging of fluid pathways during drainage of softwood in a pressure membrane chamber. Int. J. Mulitph. Flow 2008, 34, 312–321. [Google Scholar] [CrossRef]
- Choong, E.T.; Tesoro, F.O. Relationship of capillary-pressure and water saturation in wood. Wood Sci. Technol. 1989, 23, 139–150. [Google Scholar]
- Spolek, G.A.; Plumb, O.A. Capillary-pressure in softwoods. Wood Sci. Technol. 1981, 15, 189–199. [Google Scholar] [CrossRef]
- Weiss, N.D.; Thygesen, L.G.; Felby, C.; Roslander, C.; Gourlay, K. Biomass-water interactions correlate to recalcitrance and are intensified by pretreatment: An investigation of water constraint and retention in pretreated spruce using low field NMR and water retention value techniques. Biotechnol. Prog. 2016, 33, 146–153. [Google Scholar] [CrossRef]
- Weiss, N.D.; Felby, C.; Thygesen, L.G. Water retention value predicts biomass recalcitrance for pretreated lignocellulosic materials across feedstocks and pretreatment methods. Cellulose 2018. [Google Scholar] [CrossRef]
- Hall, C.; Hoff, W.D. Water Transport in Brick, Stone and Concrete, 2nd ed.; CRC Press: Abingdon, UK, 2012. [Google Scholar]
- Vanapalli, S.K.; Nicotera, M.V.; Sharma, R.S. Axis Translation and Negative Water Column Techniques for Suction Control. Geotech. Geol. Eng. 2008, 26, 645. [Google Scholar] [CrossRef]
- Salin, J.G. Inclusion of the sorption hysteresis phenomenon in future drying models. Some basic considerations. Maderas-Cienc. Tecnol. 2011, 13, 173–182. [Google Scholar] [CrossRef]
- Fredriksson, M.; Thygesen, L.G. The states of water in Norway spruce (Picea abies (L.) Karst.) studied by low-field nuclear magnetic resonance (LFNMR) relaxometry: Assignment of free-water populations based on quantitative wood anatomy. Holzforschung 2017, 71, 77–90. [Google Scholar] [CrossRef]
- Labbé, N.; De Jéso, B.; Lartigue, J.C.; Daudé, G.; Pétraud, M.; Ratier, M. Time-domain 1H NMR characterization of the liquid phase in greenwood. Holzforschung 2006, 60, 265–270. [Google Scholar] [CrossRef]
- Menon, R.S.; Mackay, A.L.; Hailey, J.R.T.; Bloom, M.; Burgess, A.E.; Swanson, J.S. An NMR determination of the physiological water distribution in wood during drying. J. Appl. Polym. Sci. 1987, 33. [Google Scholar] [CrossRef]
- Menon, R.S.; Mackay, A.L.; Flibotte, S.; Hailey, J.R.T. Quantitative separation of NMR images of water in wood on the basis of T2. J. Magn. Reson. 1989, 82, 205–210. [Google Scholar] [CrossRef]
- Flibotte, S.; Menon, R.S.; MacKay, A.L.; Hailey, J.R.T. Proton magnetic resonanance of Western red cedar. Wood Fiber Sci. 1990, 22, 362–376. [Google Scholar]
- Araujo, C.D.; Mackay, A.L.; Hailey, J.R.T.; Whittall, K.P.; Le, H. Proton magnetic resonance techniques for characterization of water in wood—Application to white spruce. Wood Sci. Technol. 1992, 26, 101–113. [Google Scholar] [CrossRef]
- Labbé, N.; De Jéso, B.; Lartigue, J.C.; Daudé, G.; Pétraud, M.; Ratier, M. Moisture content and extractive materials in maritime pine wood by low field 1H NMR. Holzforschung 2002, 56, 25–31. [Google Scholar] [CrossRef]
- Almeida, G.; Gagné, S.; Hernández, R.E. A NMR study of water distribution in hardwoods at several equlibrium moisture contents. Wood Sci. Technol. 2007, 41, 293–307. [Google Scholar] [CrossRef]
- Thygesen, L.G.; Elder, T. Moisture in untreated, acetylated, and furfurylated Norway spruce studied during drying using time domain NMR. Wood Fiber Sci. 2008, 40, 309–320. [Google Scholar]
- Cox, J.; McDonald Peter, J.; Gardiner Barry, A. A study of water exchange in wood by means of 2D NMR relaxation correlation and exchange. Holzforschung 2010, 64, 259–266. [Google Scholar] [CrossRef] [Green Version]
- Elder, T.; Houtman, C. Time-domain NMR study of the drying of hemicellulose extracted aspen (Populus tremuloides Michx.). Holzforschung 2013, 67, 405–411. [Google Scholar] [CrossRef]
- Rutledge, D.N. Low resolution pulse nuclear magnetic resonance (LRP-NMR). Anal. Mag. 1992, 20, 58–62. [Google Scholar]
- Provencher, S.W. Contin: A general purpose constrained regularization program for inverting noisy linear algebraic and integral equations. Comput. Phys. Commun. 1982, 27, 229–242. [Google Scholar] [CrossRef]
- Beck, G.; Thybring Emil, E.; Thygesen Lisbeth, G.; Hill, C. Characterization of moisture in acetylated and propionylated radiata pine using low-field nuclear magnetic resonance (LFNMR) relaxometry. Holzforschung 2017, 72, 225–233. [Google Scholar] [CrossRef]
- Jeoh, T.; Karuna, N.; Weiss, N.D.; Thygesen, L.G. Two-Dimensional 1H-Nuclear Magnetic Resonance Relaxometry for Understanding Biomass Recalcitrance. ACS Sustain. Chem. Eng. 2017, 5, 8785–8795. [Google Scholar] [CrossRef]
- Telkki, V.V.; Yliniemi, M.; Jokisaari, J. Moisture in softwoods: Fiber saturation point, hydroxyl site content, and the amount of micropores as determined from NMR relaxation time distributions. Holzforschung 2013, 67, 291–300. [Google Scholar] [CrossRef]
- Zelinka, S.L.; Lambrecht, M.J.; Glass, S.V.; Wiedenhoeft, A.C.; Yelle, D.J. Examination of water phase transitions in Loblolly pine and cell wall components by differential scanning calorimetry. Thermochim. Acta 2012, 533, 39–45. [Google Scholar] [CrossRef]
- Zauer, M.; Kretzschmar, J.; Großmann, L.; Pfriem, A.; Wagenführ, A. Analysis of the pore-size distribution and fiber saturation point of native and thermally modified wood using differential scanning calorimetry. Wood Sci. Technol. 2014, 48, 177–193. [Google Scholar] [CrossRef]
- Passarini, L.; Zelinka, S.L.; Glass, S.V.; Hunt, C.G. Effect of weight percent gain and experimental method on fiber saturation point of acetylated wood determined by differential scanning calorimetry. Wood Sci. Technol. 2017, 51, 1291–1305. [Google Scholar] [CrossRef]
- Simpson, L.A.; Barton, A.F.M. Determination of the fibre saturation point in whole wood using differential scanning calorimetry. Wood Sci. Technol. 1991, 25, 301–308. [Google Scholar] [CrossRef]
- Digaitis, R.; Thybring, E.E.; Künniger, T.; Thygesen, L.G. Synergistic effects of enzymatic decomposition and mechanical stress in wood degradation. Wood Sci. Technol. 2017, 51, 1067–1080. [Google Scholar] [CrossRef]
- Stone, J.E.; Scallan, A.M. Effect of component removal upon porous structure of cell wall of wood.2. Swelling in water and fiber saturation point. Tappi 1967, 50, 496–501. [Google Scholar]
- Gama, F.M.; Teixeira, J.A.; Mota, M. Cellulose morphology and enzymatic reactivity: A modified solute exclusion technique. Biotechnol. Bioeng. 1994, 43, 381–387. [Google Scholar] [CrossRef] [PubMed]
- Javed, M.A.; Kekkonen Päivi, M.; Ahola, S.; Telkki, V.-V. Magnetic resonance imaging study of water absorption in thermally modified pine wood. Holzforschung 2015, 69, 899–907. [Google Scholar] [CrossRef]
- Gezici-Koç, Ö.; Erich, S.J.F.; Huinink, H.P.; van der Ven, L.G.J.; Adan, O.C.G. Bound and free water distribution in wood during water uptake and drying as measured by 1D magnetic resonance imaging. Cellulose 2017, 24, 535–553. [Google Scholar] [CrossRef]
- Žlahtič Zupanc, M.; Mikac, U.; Serša, I.; Merela, M.; Humar, M. Water distribution in wood after short term wetting. Cellulose 2018. [Google Scholar] [CrossRef]
- Sedighi-Gilani, M.; Griffa, M.; Mannes, D.; Lehmann, E.; Carmeliet, J.; Derome, D. Visualization and quantification of liquid water transport in softwood by means of neutron radiography. Int. J. Heat Mass Transf. 2012, 55, 6211–6221. [Google Scholar] [CrossRef]
- Sedighi Gilani, M.; Abbasion, S.; Lehmann, E.; Carmeliet, J.; Derome, D. Neutron imaging of moisture displacement due to steep temperature gradients in hardwood. Int. J. Therm. Sci. 2014, 81, 1–12. [Google Scholar] [CrossRef]
- Lanvermann, C.; Sanabria Sergio, J.; Mannes, D.; Niemz, P. Combination of neutron imaging (NI) and digital image correlation (DIC) to determine intra-ring moisture variation in Norway spruce. Holzforschung 2014, 68, 113. [Google Scholar] [CrossRef]
- Fredriksson, M.; Lindgren, O. End grain water absorption and redistribution in slow grown and fast grown Norway spruce (Picea abies (L.) Karst.) heartwood and sapwood. Wood Mater. Sci. Eng. 2013, 8, 245–252. [Google Scholar] [CrossRef]
- Patera, A.; Van den Bulcke, J.; Boone, M.N.; Derome, D.; Carmeliet, J. Swelling interactions of earlywood and latewood across a growth ring: Global and local deformations. Wood Sci. Technol. 2018, 52, 91–114. [Google Scholar] [CrossRef]
- Alfredsen, G.; Flæte, P.O.; Militz, H. Decay resistance of acetic anhydride modified wood: A review. Int. Wood Prod. J. 2013, 4, 137–143. [Google Scholar] [CrossRef]
- Ringman, R.; Pilgård, A.; Brischke, C.; Richter, K. Mode of action of brown rot decay resistance in modified wood: A review. Holzforschung 2014, 68, 239. [Google Scholar] [CrossRef]
- Zelinka, S.L.; Ringman, R.; Pilgård, A.; Thybring, E.E.; Jakes, J.E.; Richter, K. The role of chemical transport in the brown-rot decay resistance of modified wood. Int. Wood Prod. J. 2016, 7, 66–70. [Google Scholar] [CrossRef]
- Thybring, E.E. The decay resistance of modified wood influenced by moisture exclusion and swelling reduction. Int. Biodeter. Biodegr. 2013, 82, 87–95. [Google Scholar] [CrossRef]
- Alfredsen, G.; Ringman, R.; Pilgård, A.; Fossdal, C.G. New insight regarding mode of action of brown rot decay of modified wood based on DNA and gene expression studies: A review. Int. Wood Prod. J. 2015, 6, 5–7. [Google Scholar] [CrossRef]
- Rowell, R.M. Acetylation. For. Prod. J. 2006, 56, 4–12. [Google Scholar]
- Beck, G.; Strohbusch, S.; Larnøy, E.; Militz, H.; Hill, C. Accessibility of hydroxyl groups in anhydride modified wood as measured by deuterium exchange and saponification. Holzforschung 2017, 72, 17. [Google Scholar] [CrossRef]
- Popescu, C.-M.; Hill, C.A.S.; Curling, S.; Ormondroyd, G.; Xie, Y. The water vapour sorption behaviour of acetylated birch wood: How acetylation affects the sorption isotherm and accessible hydroxyl content. J. Mater. Sci. 2014, 49, 2362–2371. [Google Scholar] [CrossRef]
- Hill, C.A.S.; Forster, S.C.; Farahani, M.R.M.; Hale, M.D.C.; Ormondroyd, G.A.; Williams, G.R. An investigation of cell wall micropore blocking as a possible mechanism for the decay resistance of anhydride modified wood. Int. Biodeter. Biodegr. 2005, 55, 69–76. [Google Scholar] [CrossRef]
- Bryne, L.E.; Wålinder, M.E.P. Ageing of modified wood. Part 1: Wetting properties of acetylated, furfurylated, and thermally modified wood. Holzforschung 2010, 64, 295–304. [Google Scholar] [CrossRef]
- Moghaddam, M.S.; Wålinder, M.; Claesson, P.; Swerin, A. Wettability and swelling of acetylated and furfurylated wood analyzed by multicycle Wilhelmy plate method. Holzforschung 2015, 70, 69–77. [Google Scholar] [CrossRef]
- Englund, F.; Bryne, L.E.; Ernstsson, M.; Lausmaa, J.; Wålinder, M. Spectroscopic studies of surface chemical composition and wettability of modified wood. Wood Mater. Sci. Eng. 2009, 4, 80–85. [Google Scholar] [CrossRef]
- Barsberg, S.; Thygesen, L.G. Nonequilibrium Phenomena Influencing the Wetting Behavior of Plant Fibers. J. Colloid Interface Sci. 2001, 234, 59–67. [Google Scholar] [CrossRef] [PubMed]
- Sander, C.; Beckers, E.P.J.; Militz, H.; van Veenendaal, W. Analysis of acetylated wood by electron microscopy. Wood Sci. Technol. 2003, 37, 39–46. [Google Scholar] [CrossRef]
- Moghaddam, M.S.; Van den Bulcke, J.; Wålinder, M.E.P.; Claesson Per, M.; Van Acker, J.; Swerin, A. Microstructure of chemically modified wood using X-ray computed tomography in relation to wetting properties. Holzforschung 2017, 71, 119. [Google Scholar] [CrossRef]
- Mantanis, G.I. Chemical Modification of Wood by Acetylation or Furfurylation: A Review of the Present Scaled-up Technologies. Bioresources 2017, 12, 4478–4489. [Google Scholar] [CrossRef]
- Thygesen, L.G.; Elder, T. Moisture in untreated, acetylated and furfurlated Norway spruce monitored during drying below fiber saturation using time domain NMR. Wood Fiber Sci. 2009, 41, 194–200. [Google Scholar]
- Venås, T.M. A Study of Mechanisms Related to the Fungal Decay Protection Rendered by Wood Furfurylation. Ph.D. Thesis, University of Copenhagen, Copenhagen, Denmark, 2008. [Google Scholar]
- Wålinder, M.; Omidvar, A.; Seltman, J.; Segerholm, K. Micromorphological studies of modified wood using a surface preparation technique based on ultraviolet laser ablation. Wood Mater. Sci. Eng. 2009, 4, 46–51. [Google Scholar] [CrossRef]
- Yulei, G.; Kang, X.; Hui, P.; Jiali, J.; Rongjun, Z.; Jianxiong, L. Effect of Heat Treatment on Water Absorption of Chinese fir Using TD-NMR. Appl. Sci. 2018, 9, 78. [Google Scholar] [CrossRef]
- Kekkonen, P.M.; Ylisassi, A.; Telkki, V.-V. Absorption of water in thermally modified pine wood as studied by nuclear magnetic resonance. J. Phys. Chem. C 2014, 118, 2146–2153. [Google Scholar] [CrossRef]
Figure 1.
Sorption isotherms for Norway spruce (Picea abies (L.) Karst.) as a function of relative humidity (a) and water potential (b); data from Fredriksson and Johansson [25]. The insert in (a) shows the hygroscopic part of the sorption isotherm. Note that, in (b), the moisture content at −100 J∙kg−1 is the moisture content at water saturation, and the shape of the over-hygroscopic part of the sorption isotherm is an estimation based on the structure of spruce.

Figure 2.
A schematic illustration of the ink-bottle effect and the effect on the sorption isotherms (a). A tracheid cell where the bordered pits act as ink-bottle necks and trap water during desorption (b).
Figure 2.
A schematic illustration of the ink-bottle effect and the effect on the sorption isotherms (a). A tracheid cell where the bordered pits act as ink-bottle necks and trap water during desorption (b).

Figure 3.
Over-hygroscopic desorption isotherms for wood of different densities. Data for red pine (Pinus resinosa Ait.) [35], aspen (Populus tremuloides Michx.) [24], congona (Brosimum alicastrum Swartz) [33], beech (Fagus grandifolia Ehrhart) [16], and huayuro (Robinia coccinea Aublet) [33]. All densities, ρ (kg∙m−3), were defined as dry mass in relation to green volume. Note that the moisture content at water saturation is arbitrarily placed at −10° J∙kg−1.

Figure 4.
Overview of methods that can be used to study location of water in the over-hygroscopic moisture range.
Figure 4.
Overview of methods that can be used to study location of water in the over-hygroscopic moisture range.


Table 1.
The relative humidity and water potential at which capillary condensation occurs in cylindrical pores with different radii at 20 °C. The relative humidity was calculated from Equation (1) with r1 = r2 = r. For conversion of relative humidity to water potential, see Equation (2).
Table 1.
The relative humidity and water potential at which capillary condensation occurs in cylindrical pores with different radii at 20 °C. The relative humidity was calculated from Equation (1) with r1 = r2 = r. For conversion of relative humidity to water potential, see Equation (2).
| Radius | Relative Humidity | Water Potential |
|---|---|---|
| (μm) | (%) | (J∙kg−1) |
| 0.01 | 89.7734 | −14587.5 |
| 0.1 | 98.9270 | −1458.7 |
| 0.5 | 99.7845 | −291.7 |
| 1 | 99.8922 | −145.8 |
| 2 | 99.9461 | −72.9 |
| 5 | 99.9784 | −29.2 |
| 10 | 99.9892 | −14.6 |
| 20 | 99.9946 | −7.3 |
| 40 | 99.9973 | −3.7 |
© 2019 by the author. Licensee MDPI, Basel, Switzerland. This article is an open access article distributed under the terms and conditions of the Creative Commons Attribution (CC BY) license (http://creativecommons.org/licenses/by/4.0/).
Share and Cite
MDPI and ACS Style
Fredriksson, M. On Wood–Water Interactions in the Over-Hygroscopic Moisture Range—Mechanisms, Methods, and Influence of Wood Modification. Forests 2019, 10, 779. https://doi.org/10.3390/f10090779
AMA Style
Fredriksson M. On Wood–Water Interactions in the Over-Hygroscopic Moisture Range—Mechanisms, Methods, and Influence of Wood Modification. Forests. 2019; 10(9):779. https://doi.org/10.3390/f10090779
Chicago/Turabian StyleFredriksson, Maria. 2019. "On Wood–Water Interactions in the Over-Hygroscopic Moisture Range—Mechanisms, Methods, and Influence of Wood Modification" Forests 10, no. 9: 779. https://doi.org/10.3390/f10090779
Note that from the first issue of 2016, this journal uses article numbers instead of page numbers. See further details here.