Article

Growth and Yield Models for Balsa Wood Plantations in the Coastal Lowlands of Ecuador

by
Álvaro Cañadas-López
1,2,
Diana Rade-Loor
3,
Marianna Siegmund-Schultze
4,
Geovanny Moreira-Muñoz
1,
J. Jesús Vargas-Hernández
5 and
Christian Wehenkel
6,*
1
Carrera Ingeniería Agropecuaria, Facultad de Ingeniería Agropecuaria, Universidad Laica Eloy Alfaro de Manabí, C.P. 130301 Av. Eloy Alfaro, Chone, Ecuador
2
Programa de Forestaría, Instituto Nacional de Investigaciones Agropecuarias (INIAP), Estación Experimental Tropical Pichilingue, C.P. 120501 Km 5 vía Quevedo—El Empalme, Pichilingue, Ecuador
3
Centro de Investigación de las Carreras de la ESPAM-MFL (CICEM), Escuela Superior Politécnica de Manabí (ESPAM-MFL), Campus Politécnico Calceta, C.P. 130250 Sitio El Limón, Calceta, Ecuador
4
Environmental Assessment and Planning Research Group, Technische Universität Berlin, Straße des 17. Juni 145, 10623 Berlin, Germany
5
Posgrado en Ciencias Forestales, Colegio de Postgraduados, Montecillo, Texcoco C.P. 56230, México
6
Instituto de Silvicultura e Industria de la Madera, Universidad Juárez del Estado de Durango, Boulevard Guadiana #501, Ciudad Universitaria, Torre de Investigación, Durango C.P. 34120, México
*
Author to whom correspondence should be addressed.
Forests 2019, 10(9), 733; https://doi.org/10.3390/f10090733
Submission received: 2 July 2019 / Revised: 14 August 2019 / Accepted: 20 August 2019 / Published: 26 August 2019
(This article belongs to the Section Forest Ecophysiology and Biology)

Abstract

:
Balsa trees are native to neotropical forests and frequently grow on fallow, degraded land. Balsa can be used for economic and ecological rehabilitation of farmland with the aim of restoring native forest ecosystems. Although Ecuador is the world’s largest producer of balsa, there is a lack of knowledge about production indicators for management of balsa stands in the country. The aim of this study was to develop growth and yield models (i.e., site index (SI) curves and stem volume models) for balsa plantations in the coastal lowlands of Ecuador. Balsa trees growing in 2161 plots in seven provinces were sampled. Here we present the first growth and yield models for the native, although underutilized, balsa tree. Three curve models were fitted to determine SI for balsa stands, differentiating five site quality classes. Eight volume models were compared to identify the best fit model for balsa stands. The mean annual increment was used to assess balsa production. The generalized algebraic difference approach (GADA) equation yielded one of the best results for the height–age and diameter–age models. The Newnham model was the best volume model for balsa in this comparative study. The maximum annual increment (i.e., for the best stand index) was reached in the second year of plantation. The fitted models can be used to support management decisions regarding balsa plantations. However, the models are preliminary and must be validated with independent samples. Nevertheless, the very fast development of the native balsa tree is particularly promising and should attract more attention from forest owners and politicians.

1. Introduction

Many non-native tree species have been used around the world for productive plantations, ornamental purposes and for rehabilitation of degraded land, eventually contributing to the homogenization of landscapes, reducing native diversity, and with mixed effects on ecosystem services [1]. Rehabilitation of degraded land is a worldwide necessity and is increasingly gaining political attention. In the context of climate change and biodiversity loss, locally-adapted solutions are needed. The balsa tree, Ochroma pyramidale (Cav. Ex Lam), is native to the neotropical forests and frequently grows on fallow and degraded land. It can be used for economic, ecological rehabilitation of farmland with the aim of restoring native forest ecosystems [2,3]. In 2008, Ecuador was the world’s top producer of balsa wood, producing 89% of the balsa sold worldwide, followed by Papua New Guinea with 8%. The global trade in sawn kiln-dried balsa wood and semi-finished wood products (155,000 m3) was worth an estimated US $71 million [4].
According to Cañadas [5], the economic value of potential forestlands could be increased by using light-demanding trees such as balsa to establish plantations and agroforestry systems. Balsa has considerable potential in secondary forests and on abandoned agricultural land: It grows rapidly, the wood quality meets the requirements of the industry, and the species appears suitable for plantations and agroforestry systems. It could meet increased future requirements of the industry, as production costs are low [6,7]. Balsa is known as a “frame species” because of the following properties: (1) Good survival and high growth rates in degraded conditions; (2) rapid canopy development, which suppresses highly competitive heliophilous weeds; and (3) it provides food and perches that attract seed dispersal fauna [8]. These characteristics are associated with improved soil fertility [9], rehabilitation of degraded areas, and forest restoration [2]. Balsa plantations are deemed an economic alternative for the Ecuadorian coastal region because of the very light wood and versatility for adaptation to the needs of local small producers and timber exportation [10]. These characteristics contribute to the diversification of forestry production in smallholder farming systems [11].
The main components that influence the quality of plantation sites are climate and soil. In forest studies, site quality has been evaluated with the help of different indices. In even-aged stands, site index (SI) is the most popular means of assessing site quality and is also used to evaluate tree growth and yield potential. SI relates tree height or diameter of a species to tree age. However, SI and height growth are sensitive to incidents in the stand history [12,13]. Finally, measuring volume production of trees is a difficult task, and easier methods are desirable [14,15,16,17].
In 2016, the Ecuadorian Forest Incentives Program (PROFORESTAL), implemented by the Ministry of Agriculture, Livestock, and Aquaculture (MAGAP), recorded a total of 48,533 ha of forest plantations with the following species: teak (Tectona grandis L.), 19,602 ha; melina (Gmelina arborea Roxb.), 10,467 ha; balsa, 8518 ha; pine, 4733 ha; and other species, in the remaining 5213 ha [18]. Growth models predicting balsa stand development would be useful to estimate the stand dynamics and thus sustain decision making in stand management. Nevertheless, management of balsa stands suffers from a lack of reliable quantitative tools for simulating stand dynamics [19]. In addition, little research has addressed production, silvicultural, and management aspects of balsa, such as SI, stand density, growth rate, and soil fertility [19], except for a previous study in which we modelled the SI of Ecuadorian balsa for both height and diameter on the basis of the Chapman-Richards model [7]. However, there are wide array of growth and yield models, each with advantages and disadvantages. These models differ in the type of data used and the method of construction [20].
The aim of this study was to develop the first growth and yield models, including SI curves and volume models, for balsa plantations in the coastal region of Ecuador, thus contributing to the development of further silvicultural and economic studies.

2. Materials and Methods
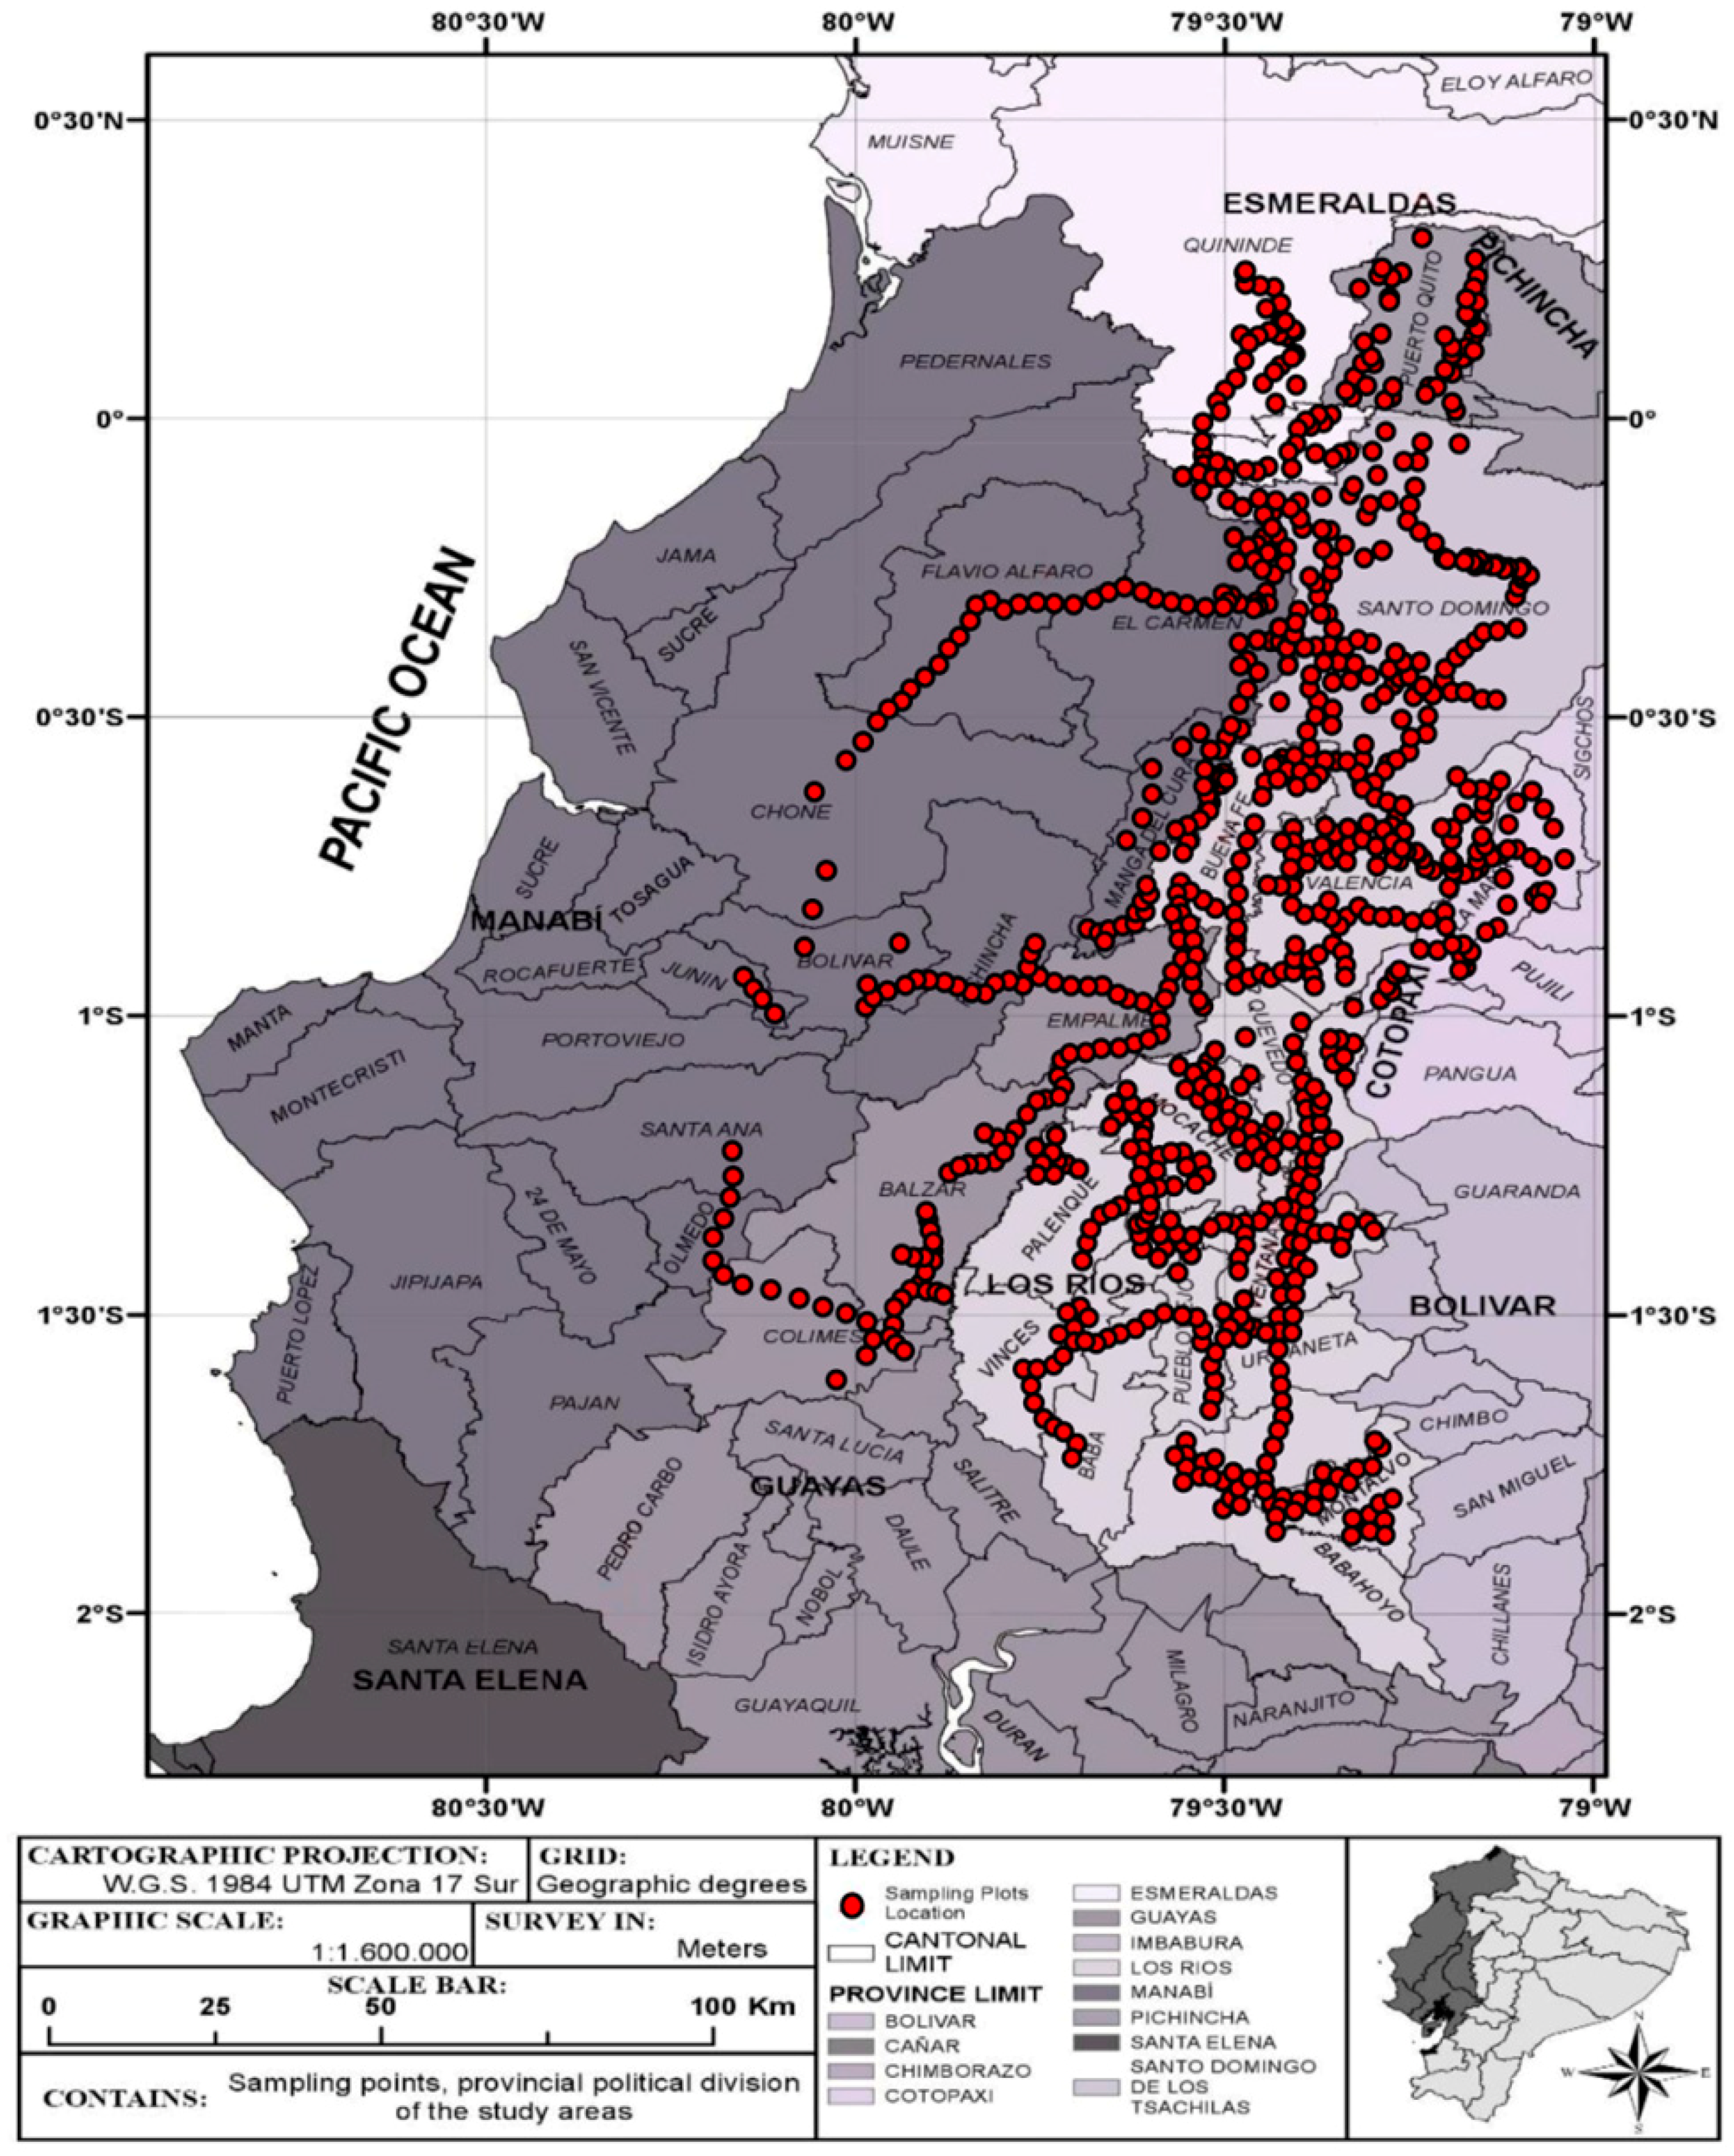
2.1. Study Area

Balsa plantations were evaluated in seven provinces in the coastal region of Ecuador (Figure 1).
The climate data for the period 2009–2013 was taken from the Instituto Nacional de Meteorología e Hidrología (INAMHI) [21] meteorological yearbook. The number of plots sampled in each site was proportional to the surface area of each Balsa plantation. Table 1 shows the basic stand attributes of balsa plantations in the research region. Table 2 summarizes the annual precipitation, mean annual temperature, elevation, and the number of plots sampled by province and life zone, defined as evapotranspiration potential.

2.2. Data Collection

The data was collected from a total of 2161 plots. Due to the planting density (Table 1), the sampled plot sizes varied from 500 to 5000 m2 to yield a minimum of 40 balsa trees per plot. Each rectangular plot was georeferenced and coded, and the plantation age was recorded after consulting the plantation owner. Diameter at breast height (DBH) was measured with a caliper. The height (H) was estimated with a Haga hypsometer. Two consecutive measurements (2015–2016) were made.

2.3. Site Index Assessment

Mean dominant height (Hd) and diameter at breast height (DBHd) were estimated as mean values for each sample plot of the 30 tallest balsa trees. In this study, different asymptotic models were applied to the height–age and diameter–age data to determine the best fitting model. Three different models were used to assess the SI: The model equations developed by Chapman-Richards [22] (Equation (1)), Hossfeld II cited in Peschel [23] (Equation (2)), and the generalized algebraic difference approach (GADA) (Equations (3) and (4)) [24]. All were computed in R software (version 3.3.3) (R foundation for Statistical Computing, Vienna, Austria).
H d = a ( 1 e ( b t ) ) c
H d = t ( a 1 + a 2 t 2 ) a 3 + t 3
where Hd = dominant height (m); t = age (year); a1, a2, a3 = equation parameters. Polymorphic curves were developed from these curves, using the maximum height reached at 5 years of age as the reference [25] in this study. The guide curves obtained by Equations (1) and (2) were compared with the generalized algebraic difference approach (GADA) [26,27].
Owing to its flexibility, the three-parameter Chapman–Richards model is widely used in forest growth modelling and prediction, especially for developing site index models [28,29]. Parameter a1 is the maximum value of this growth variable. a2 is an empirical growth parameter scaling the absolute growth rate. The empirical parameter a3 is related to catabolism rate [30]. The starting point of the curve is at the origin of axes, which is only useful if growth begins at zero [31]. The Hossfeld equation generates S-shaped curves giving a realistic growth of young trees and generates sensible curves when extrapolating outside the age and SI range of the data [32].
The advantage of GADA over guide curves and the algebraic difference approach (ADA) is that it produces dynamic site equations that are base-age-invariant (BAI) and have the path invariance property (PIP). GADA; thus, allows more than one parameter to be site specific. GADA site curves display “concurrent” polymorphism and variable asymptotes and use a variety of growth characteristics that operate across different sites [33].
For application of the GADA method, Equation (1) (Chapman-Richards) was selected to identify which parameters depended on site productivity. Thus, the selected parameters are expressed as site quality functions via the variable X0. X0 is an unobservable, independent variable that describes site productivity and reflects the management and ecological conditions and new parameters. The bi-dimensional equations (H = f(t)) were expanded to three-dimensional equations of the site index (Hd = f(t, X)), determining X from the initial site conditions (t0 and H0) [26]. The polymorphic curves with multiple asymptotes can be obtained by the GADA method with the following dynamic equation (Equation (3)).
H 1 = [ 1 e b 1 t 1 1 e b 1 t o ] ( b 2 + b 3 / X o )
where H0 is the dominant height at the initial age, t0 and H1 is the dominant height at age t1. H0 is derived for Equation (4).
X 0 = 1 2 { ln H 0 b 2 L 0 ± [ ln H 0 b 2 ] 2 4 b 3 L 0 }
where L0 = ln[1 − expb1t0]. Fitting this equation with the dominant height–age data enables estimation of the values of the global parameters b1, b2, b3. The family of curves obtained by the GADA method are invariant relative to the reference age and invariant relative to the simulation path [27,34]. The mean structure (determined with the growth equation) and the mean error structure (determined by the auto regression model) were fitted simultaneously with the GADA package, in R (version 2.2.2) (R Foundation for Statistical Computing, Vienna, Austria [35] (Development Core Team 2018). The procedure was also applied to DBHd in order to generate the three-mean dominant DBH–age models (Equations (1)–(4)).
Fitting the performance of the Hd and DBHd models was based on comparison of curves. The bias and the root mean square errors (RMSEs) were calculated from the residuals obtained during the fitting stages. Graphical analysis was carried out by (1) superimposing the fitted curves, (2) plotting residuals against the values predicted by the model, and (3) analyzing changes in bias and RMSEs for the different age groups.

2.4. Tree Volume Assessment

A total of 532 dominant balsa trees (diameter average 23.1 ± 0.5 cm, height average 15.5 ± 0.6 m) were selected and destructively sampled in seven provinces with a total of 76 trees per province. The DBH and H were measured before and after felling the trees, respectively. A diameter tape was used to measure the diameter (di) over the bark on the ground and at different heights: 0.3 m, 2.3 m, and every 2.0 m along the stem to the top. The total tree volume of each tree (V, m3) was calculated by measuring the diameter at each end of the section (di and di+1) and the length of sections (l) of the felled specimens using the following formula [16]:
V = 1 π 3 [ ( d i 2 ) 2 + ( d i d i + 1 ) 4 + ( d i + 1 2 ) 2 ]
Several commonly-used volume estimation models [36] were tested to determine the best regression model for V, DBH, and H for the balsa stands (Table 3). The parameters to be determined are a, b, c, and d. The generalized method of moments (GMM), implemented in SAS/ETS® [37], was used to fit the models.
We estimated the goodness of fit of the volume models from the mean squared error (MSE), standard error (SE), and adjusted determination coefficient (R2Adj). Finally, the best model (of those tested) was selected by the Akaike information criterion (AIC), where lower AIC values indicate better performance [44]. Use of AIC or other criterions, such as the Bayesian information criterion, are a way of selecting the model that best balances (i) the true nature of the variability in the outcome variable and (ii) model generality [45].

2.5. Assessment of Balsa Production

The average density of the balsa stands in the study region was 300 trees ha−1. The total volume was estimated by the modelled mean tree volume per age and SI multiplied by the indicated stand density. Mean annual increment (MAI) and periodic annual increment (PAI) were calculated. MAI is the total growth of a tree or stand up to a given age divided by the total age. PAI is equal to the tangent slope to the growth curve and describes the growth rate at age t. The PAI is cumulated at maximum tangent slope, where the tangent and the growth curve pass through the origin [46].

3. Results

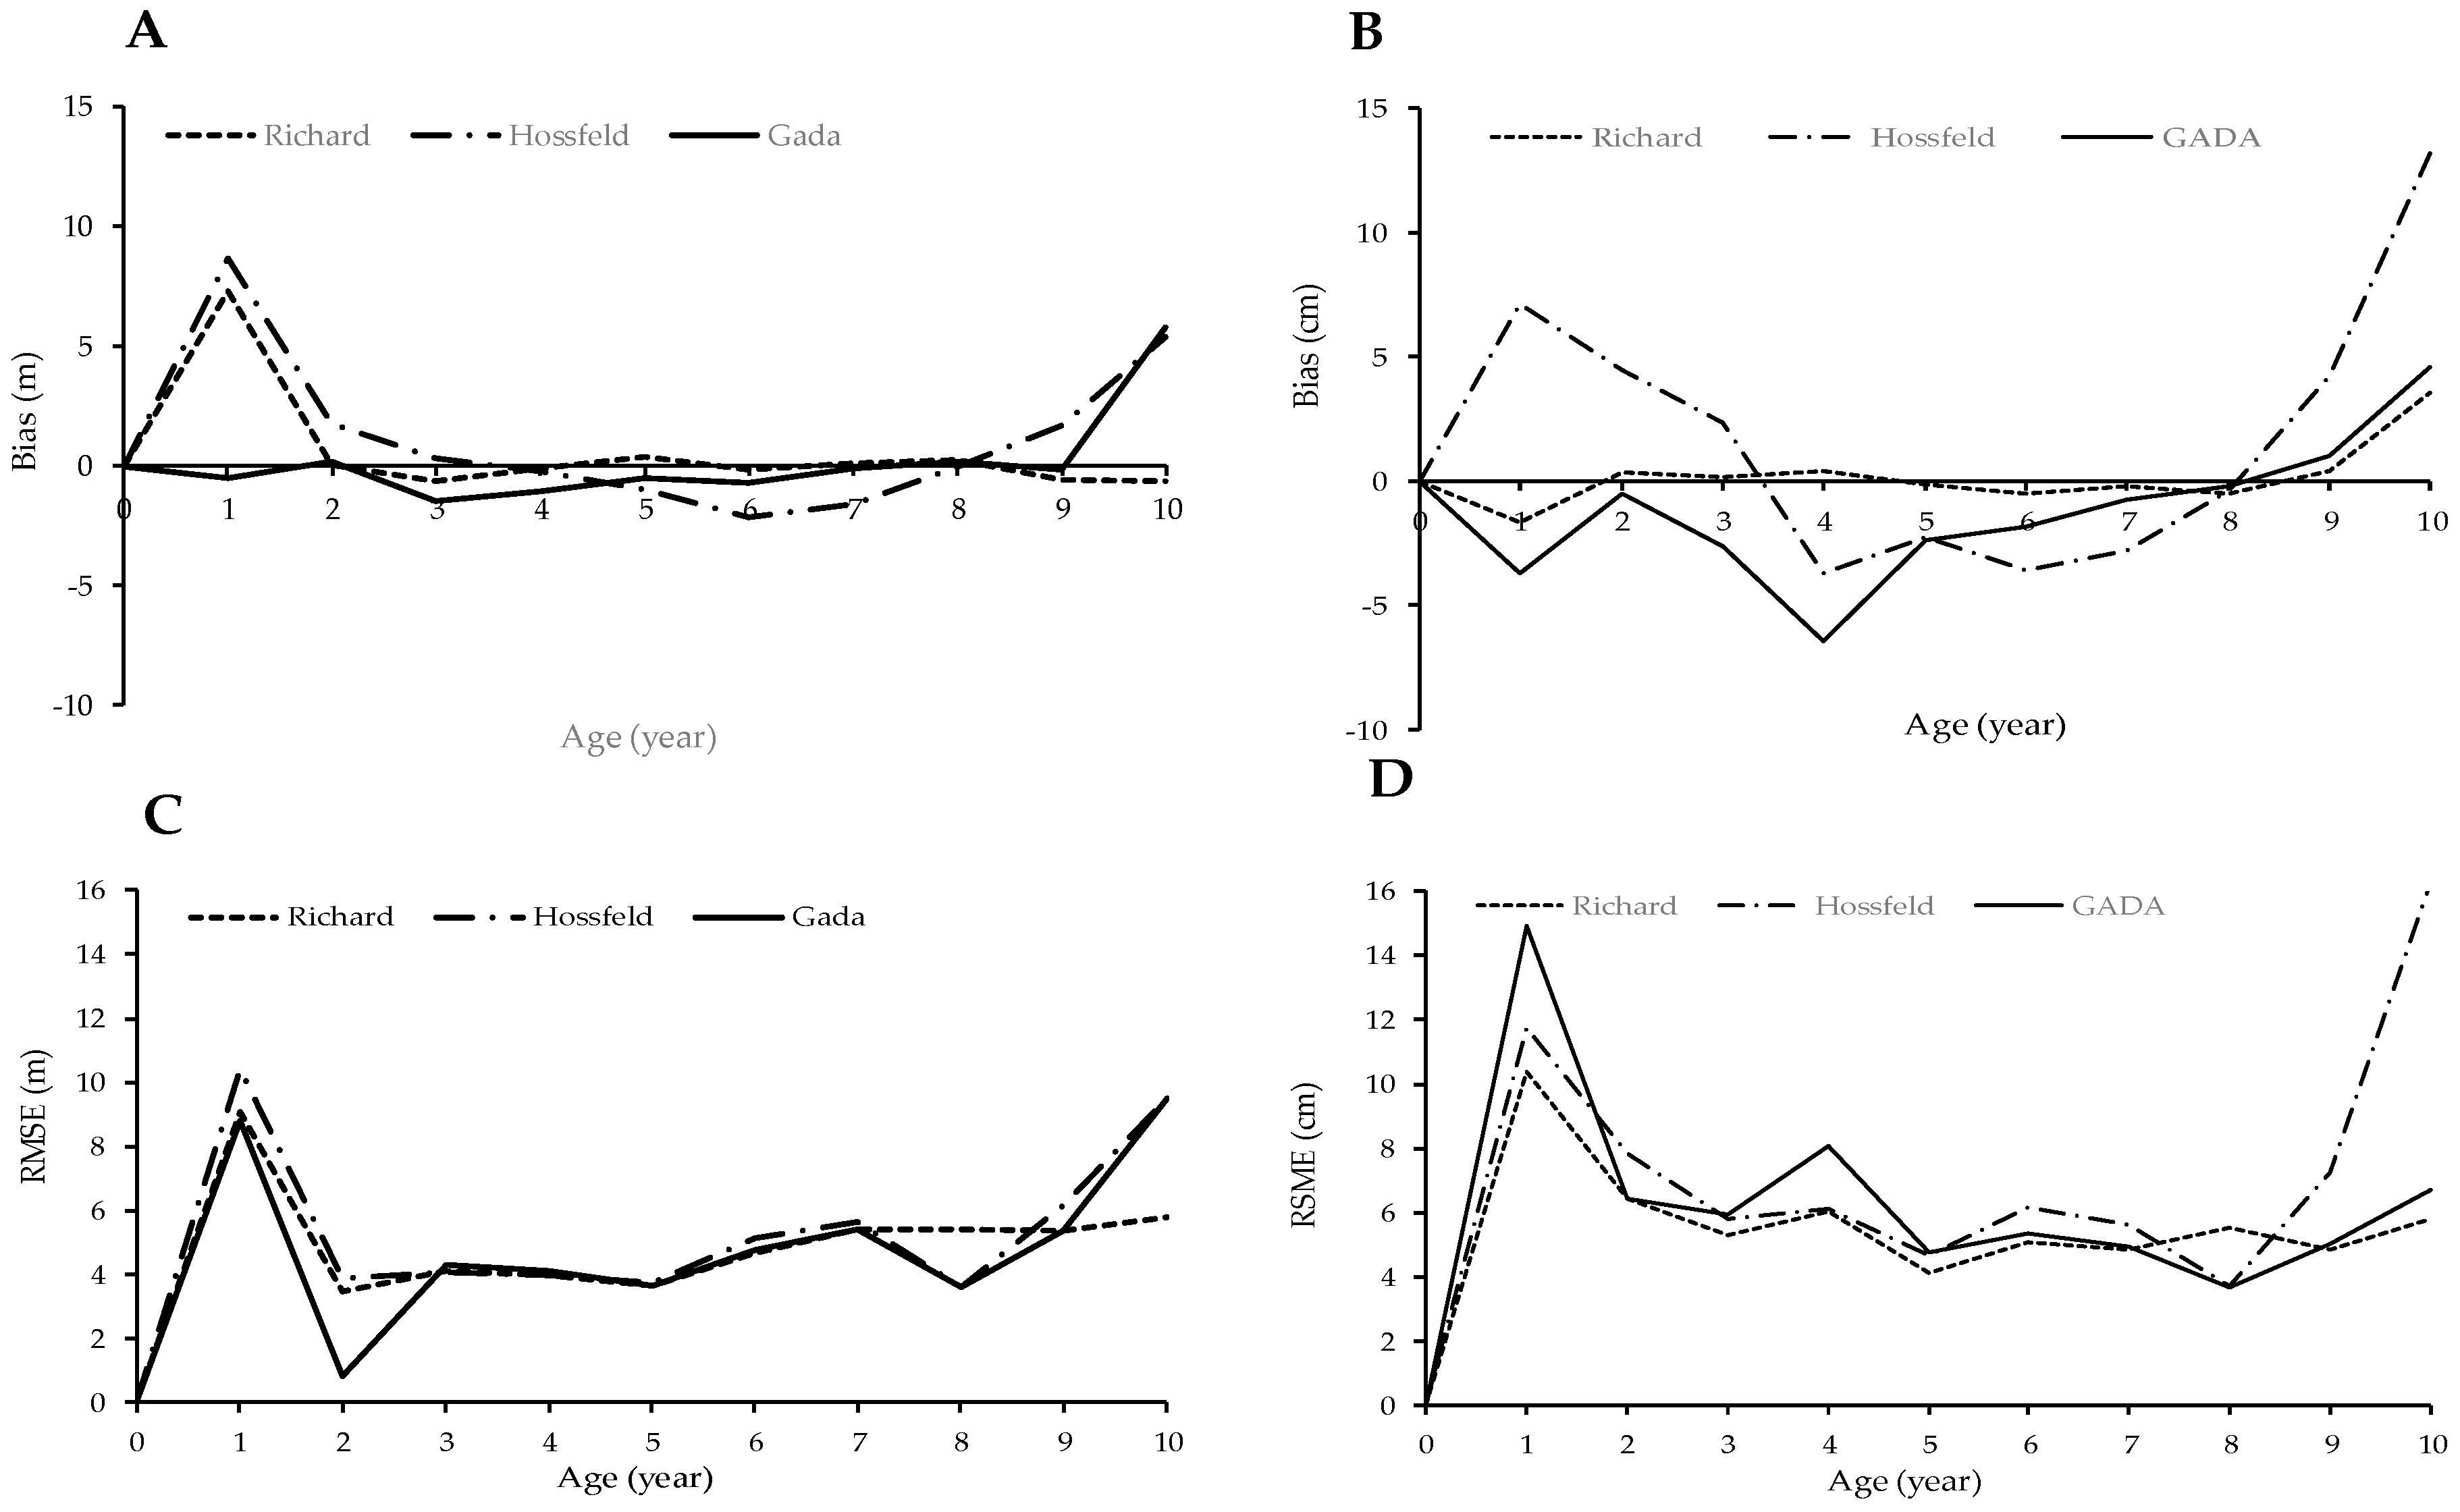
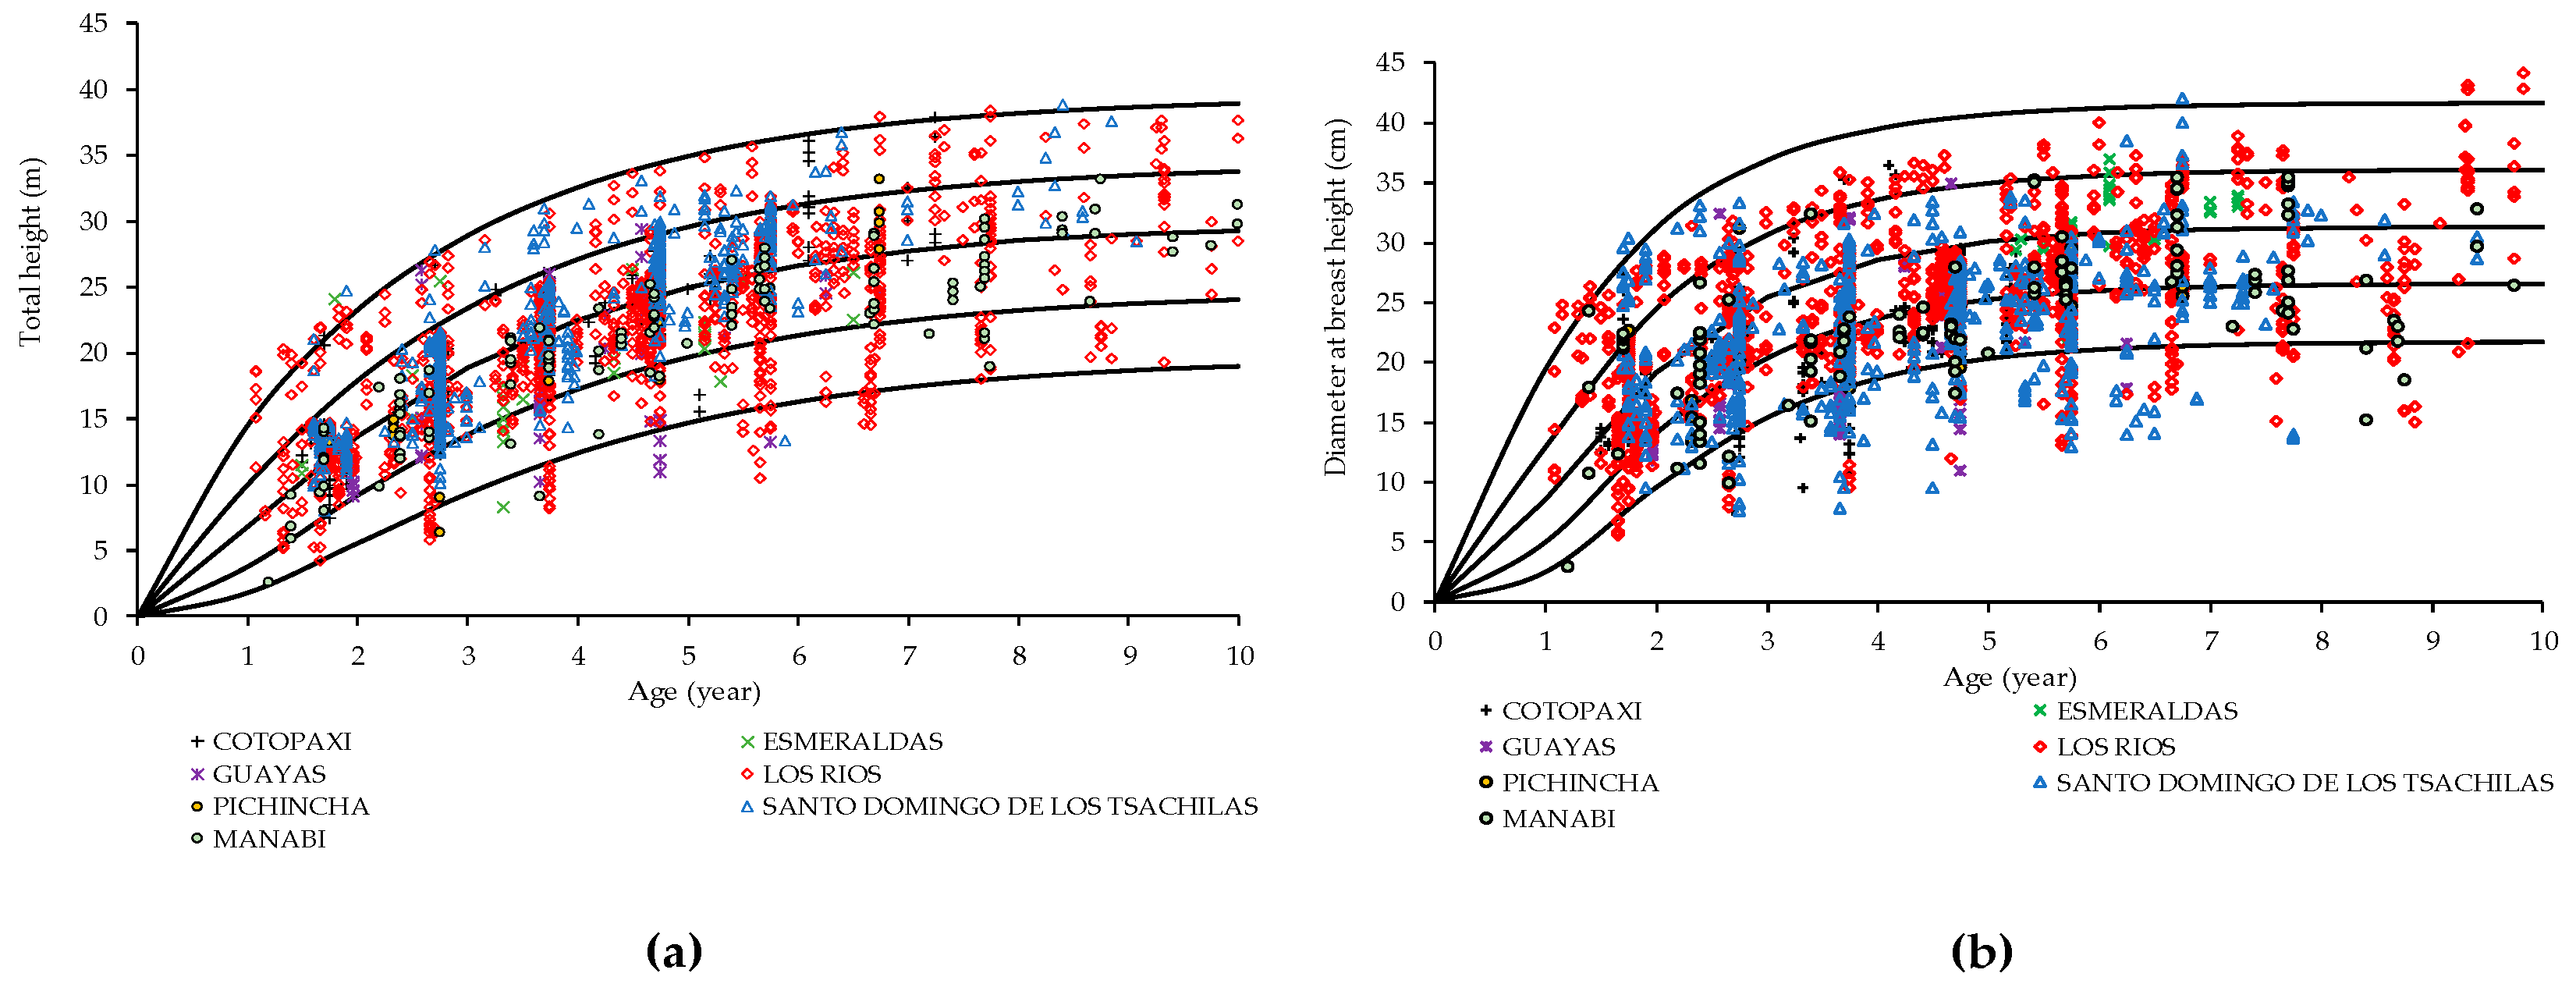
3.1. Balsa Site Index

The estimated parameters for Equations (1)–(3), and the fitting statistics are shown in Table 4. All parameters were significant at the 1% level, including the site-dependent parameter for each tree. The lowest values of RMSE corresponded to the GADA method, for both Hd and DBHd.
Figure 2 shows the results of analysis of the bias and RMSE evaluation for the age classes for both Hd and DBHd. Estimation with the GADA method showed a distribution of bias around zero for both parameters with no consistent trend. For RMSE, both Chapman-Richards and Hossfeld equations exhibited a similar trajectory for all age classes. The Chapman-Richards and GADA model showed a low RMSE, especially for the juvenile ages, for Hd. The largest bias and RMSE dispersions were particularly observed in the age class 9 to 10 years due to the lack of data for these classes. The GADA method; thus, yielded good fit models.
With the GADA procedure based on the Chapman-Richards base model, both parameters a1 and a3 are dependent on-site quality and the error structure is included in the interaction procedure:
Height H d 1 = H d 0 [ 1 e 0.42017 × t 1 1 e 0.42017 × t 0 ] ( 4.6136 + 20.3953 / X 0 )
Diameter D B H d 1 = D B H d 0 [ 1 e 0.7989 × t 1 1 e 0.7989 × t 0 ] ( 9.7919 + 41.2342 / X 0 )
where H1 is the predicted height (m) at age t1 (years), and H0 and t0 represent the initial dominant height and age.
Height
X 0 = 1 2 { ln H 0 4.6136 × L 0 ± [ ln H 0 4.6136 ] 2 81.5812 × L 0 } L 0 = l n [ 1 e ( 4.6136 × t 0 ) ]
Diameter
X 0 = 1 2 { ln H 0 9.7819 × L 0 ± [ ln H 0 9.7819 ] 2 164.9379 × L 0 } L 0 = ln [ 1 e ( 9.7819 × t 0 ) ]
Balsa site index was divided into five classes. Class one (I) represented the best site quality and class V the poorest quality both for H and DBH. The GADA model was used to fit SI curves for Hd (from 34.6 to 15.3 m) and DBHd (from 40.3 to 15.6 cm) at a reference age of five years. The fitted curves follow the same trends. The curves did not perform better for any particular province (Figure 3).

3.2. Volume Models

The outcome of the fitted regression of the eight-volume function estimation for balsa is given in Table 5.
Half of the tested models provided good fits to the data with an adjusted R2 > 0.9. For the Newnham, Spurr with independent term, incomplete generalized combined variable, and Australian formula models, the adjusted R2 values were 0.9. According to the AIC criterion, the model that best fits the characteristics of the balsa tree stands was the Newnham model (Equation (13)). However, this model overestimates the volume of trees with a DBH under 15 cm.

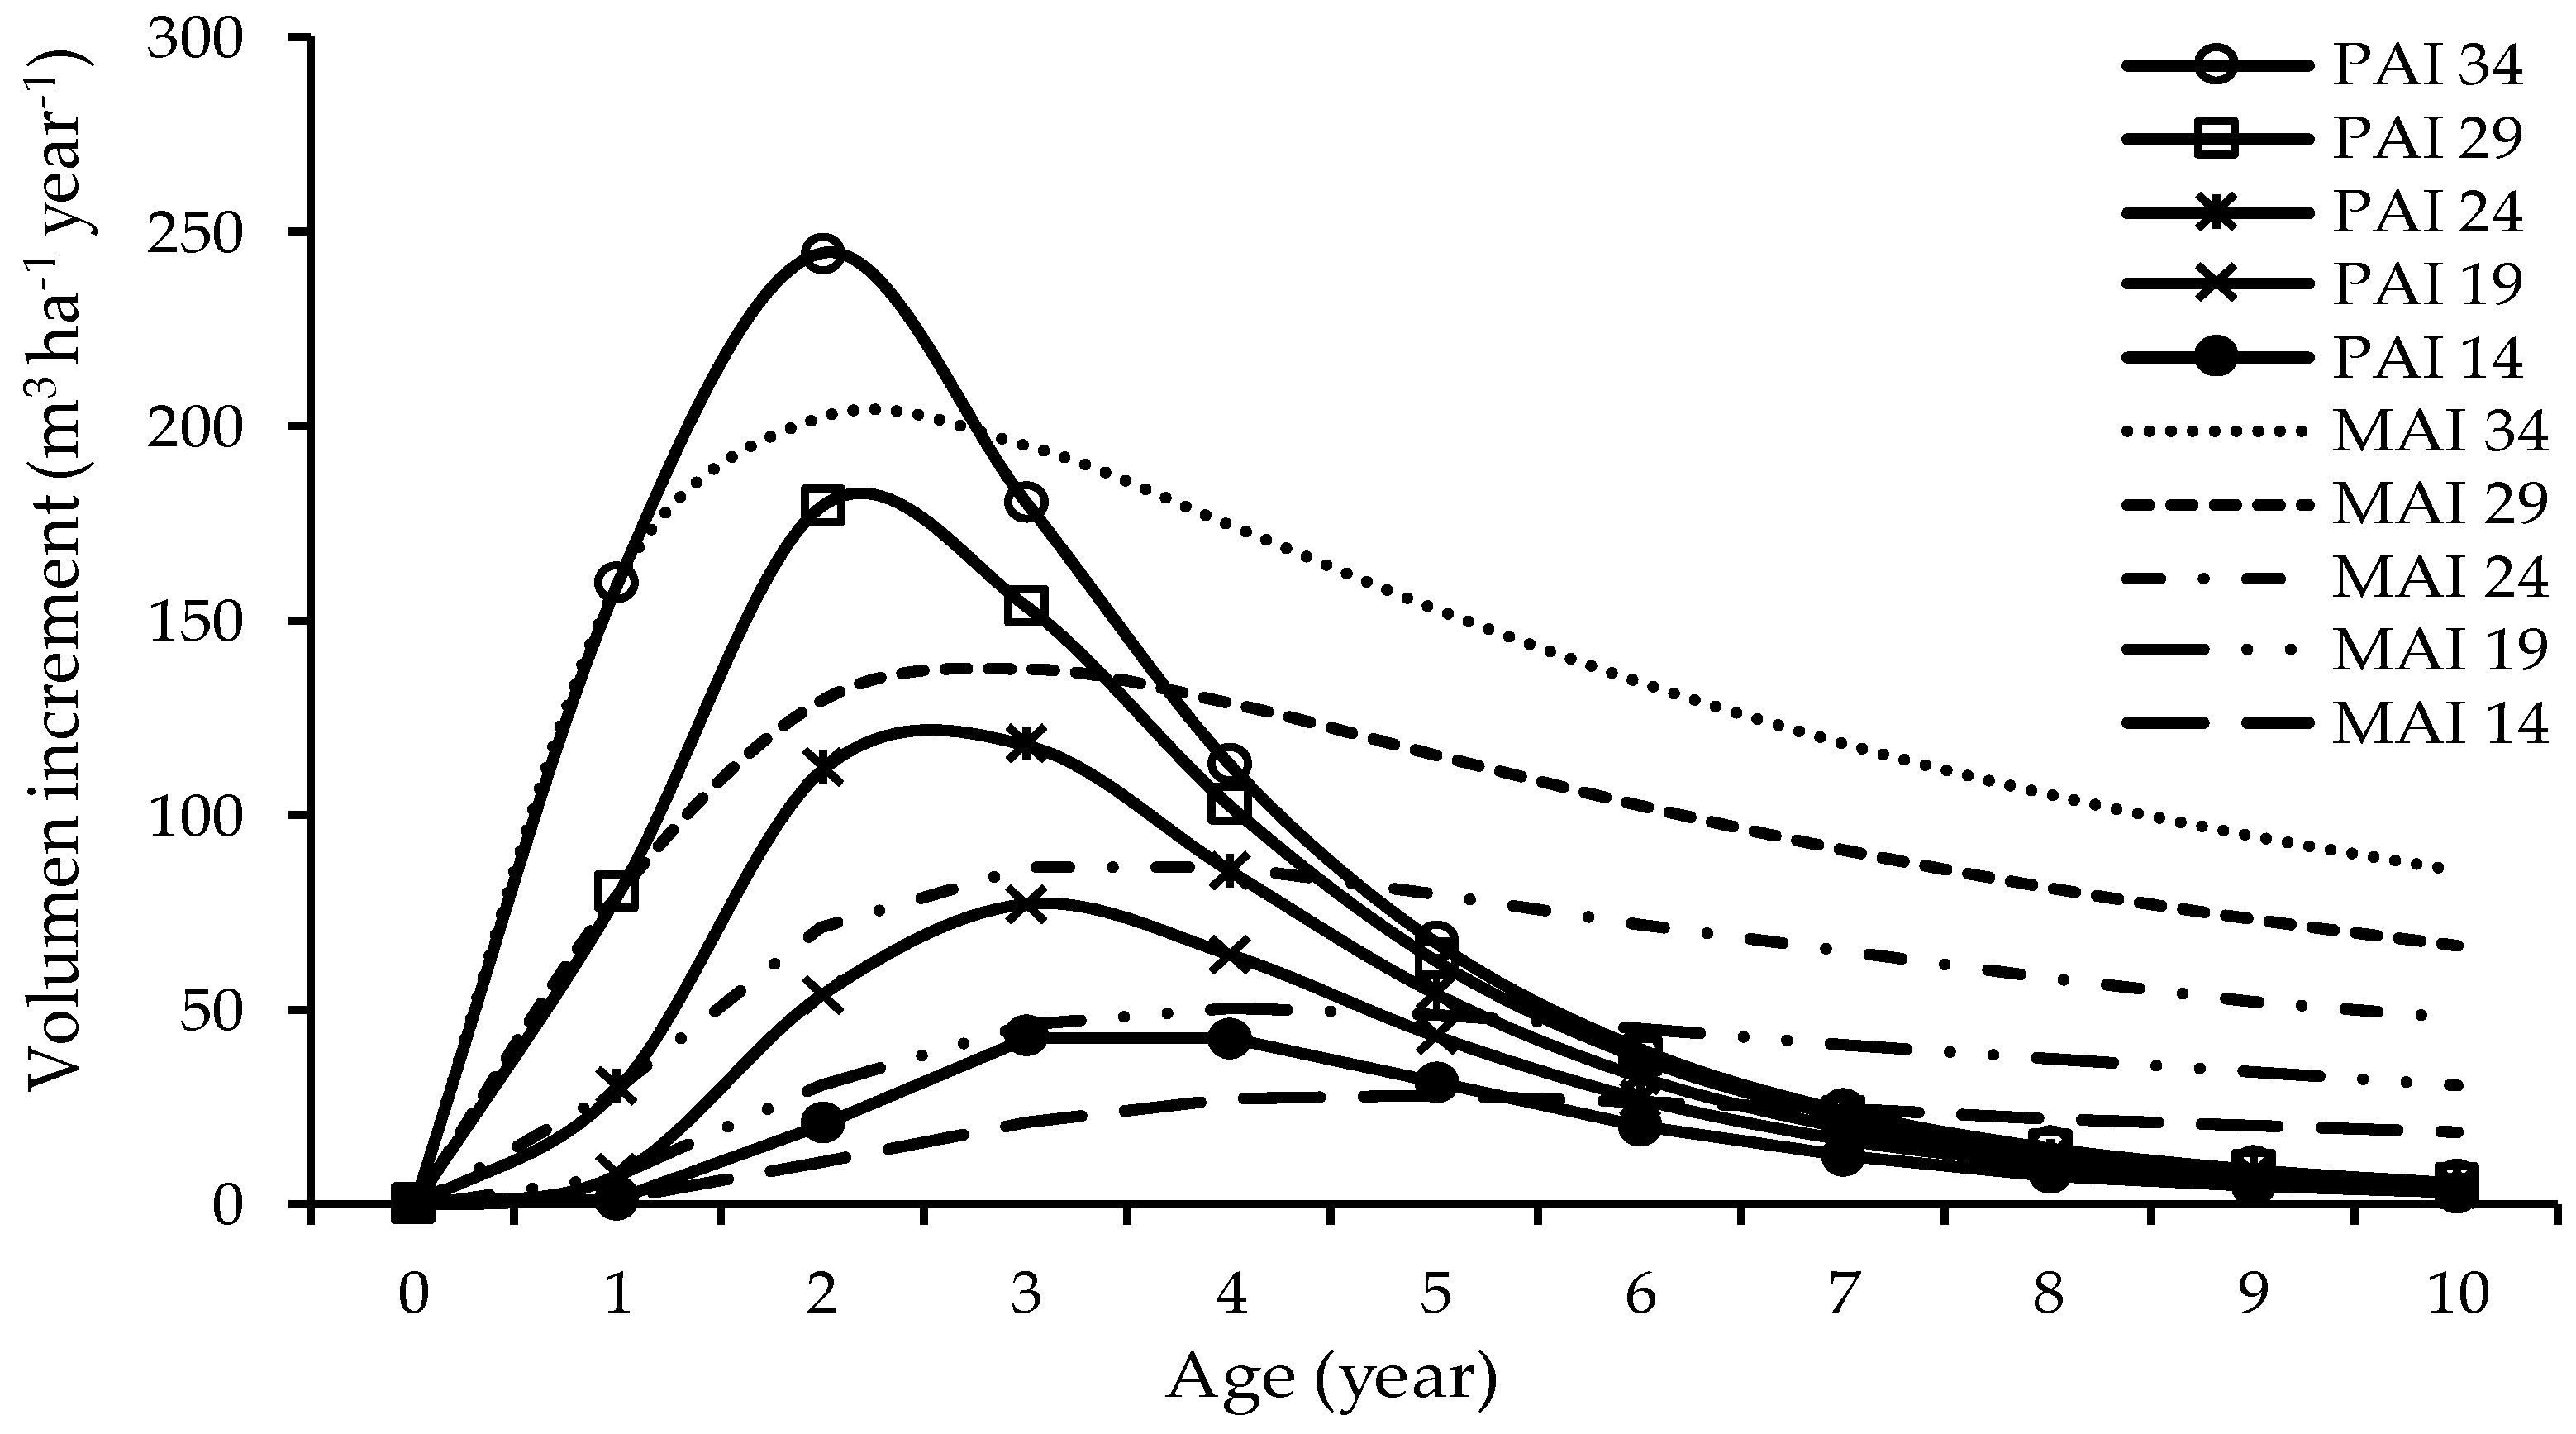
3.3. Mean Annual Increment

The optimal biological rotation was obtained for each SI at a reference age (Figure 4). The rotation lengths were three years for the best site, expanding to five years for the worst sites, when there were no other constraints. Considering a balsa tree density of 300 trees ha−1, the MAI was 194.8 m3 ha−1 for the best SI, 86.6 m3 ha−1 for intermediate SI, and 27.7 m3 ha−1 for the lowest SI.

4. Discussion

4.1. Site Index Assessment of Height and Diameter

Comparison of the Chapman-Richards and Hossfeld models with the GADA model revealed that the latter provided better fits and site index curves for both Hd and DBHd and generated polymorphic curves. These types of curves are comparable with those obtained by Cañadas et al. [36] for Tectona; Rodríguez-Carrillo et al. [47] for Juniperus; Díaz-Maroto et al. [48] for Quercus and Diéguez-Aranda et al. [49] for Pinus. The Chapman-Richards and Hossfeld models presented early asymptotes and greatly overestimated Hd and DBHd at early ages. The Chapman-Richards models for balsa were used by Cañadas et al. [10] in Ecuador to determine the SI from both height and diameter. By contrast, the polymorphic curves obtained by the GADA method best described the growth of balsa, especially for plantations aged between one and three years old. Graphical analysis of bias and RMSE showed that the GADA model best described the biological parameters by passing the site index curves for the observed data of Hd and DBHd age. These results are consistent with those obtained by Stankova and Diéguez-Aranda [50], who highlight the benefits of the GADA procedure, which provides the best model fits.
Gräfe [51] observed a surprisingly rapid growth of balsa at a young age within a secondary forest. This explains why balsa reaches its final height after only seven years. Under favorable environmental conditions this was about 20 m, and under unfavorable conditions, about 12 m. The final growth point of H and DBH was not observed in our study areas, where balsa was cultivated in plantations of the same age.
According to Lamprecht [52], balsa (Ochroma lagopus (Cav. Ex Lam.) Urb) generally requires average annual precipitation of between 1500 to 3000 mm year−1 and an average temperature of 22 to 27 °C. The edaphic demands for optimal growth of such forest plantations are exceptionally high. Optimal growth of balsa only occurs in deep soils of alluvial origin, with a sandy or slightly clayish texture, resulting from the weathering of rocks rich in bases. These edaphoclimatic conditions coincide with the best sites for growing balsa in the province of Los Ríos (Table 1), in the Ecuadorian coastal lowlands, as mentioned above. Our data differed from those obtained by Lamprecht [52], who recorded a height of 19 m and DBH of 33 cm at the age of five years in fertile alluvial soils of the Venezuelan western llanos.
In Panama, heights of 7.0 m were recorded for the Soberania site (precipitation of 2226 mm year−1, 4.0 dry months), on the Los Santos site 5.8 m (1946 mm year−1, 5.2 dry months) and 3.6 m in Río Hato (1107 mm year−1, 6.7 dry months) for plantations aged two years [53]. These values are lower than those obtained in the present study.
Sites with rainfall equal or below 1000 mm year−1 with seven dry months (here the province of Manabí in the tropical dry forest life zone, TdF-TrF with evapotranspiration ratio of 1–2) or precipitation of 3019 mm year−1 and no dry months (province of Cotopaxi, Twf-TrF with a evapotranspiration ratio 0.2–0.5) were limiting conditions for balsa growth, indicated by Hd = 15.3 m, DBHd = 15.6 cm to Hd = 20.0 m, DBHd = 21.4 cm at five years. This is consistent with the observations made by Butterfield [54], Dalling et al. [55], Pearson et al. [56], Healy et al. [57], van Breugel et al. [58], and Azambuja et al. [59], who emphasized that (micro-) variations in water and soils locally affect the tree growth and survival of balsa.
Early successional species such as balsa generally show exceptional growth: Their crowns suppress weeds [54] and quickly improve the environmental conditions [60]. Balsa is characterized by high survival rates [61]. Nevertheless, de-Miguel et al. [19] observed high mortality in balsa, which affected by suboptimal environmental conditions in Bolivia and is considered a consequence of manual weed control. Such occurrences were not observed in the balsa plantations in our study region, as 61.5% of the weed control is carried out with chemicals in this part of Ecuador. Lamprecht [52] mentioned that no economic damage or diseases have been observed in plantations of O. lagopus, another species of balsa grown in tropical regions.
In this study, efforts have been made to develop god fitting balsa site index models for the coastal lowlands of Ecuador. However, these models can be improved in relation to dendro-ecological resolution, developing individual growth models used in other studies [13,62]. The inclusion of additional variables such as position, size of specific trees and spatial distribution could help to improve the understanding of the stand growth and production [13].

4.2. Tree Volume Assessment

Volume estimation plays a major role in productive forests. This is the first report of balsa volume models. In general, the Newnham model (Equation (13)) consistently provided adequate volume estimates, as demonstrated by the fitting statistics for balsa, indicated by the low MSE and AIC and high R2Adj value. Newnham [43] proposed use of the Newnham model to estimate the volumes for Pinus banksiana Lamb., Pinus contorta Dougl., Picea glauca (Moench) and Populus tremuloides Michx in Alberta, Canada. In Ecuador, Cañadas et al. [36] used the Newnham model in a comparative study to describe the volume of Tectona grandis L. (teak) under agroforestry systems, and the model also provided the best fit to the data. This was also found by Hernández-Ramos [63] for Eucalyptus urophylla S.T.Blake. The balsa volume equation based on the Newnham formula (Equation (13)) overestimated smaller trees (0.34 m3), because parameter a amounted to 0.34 (i.e., the smallest tree (DBH = 5 cm) would already have a volume of 0.34 m3).
However, to date, the commercial volumes have only been determined by the simple, but less accurate, volume model, predicting tree volume as a function of DBH, height, and absolute form factor of 0.7 [64,65,66,67].

4.3. Mean Annual Increment in Volume

We chose to use the Schumacher-Hall (allometric) (Equation (6)) formula to calculate the volume and to estimate MAI and PAI, due to the better estimation of small tree dimensions. MAI and PAI coincided at three years of the balsa plantation growth as optimal biological rotation in the best site conditions. Therefore, the maximum rotation length increased rapidly with decreasing SI. These results are very different from those obtained by de-Miguel et al. [19], who proposed that the duration of the maximum rotation of balsa plantations in Bolivia would be one year if the size of trees and economic aspects are not considered. In the present study, the results indicated a three-year rotation for the best SI and five years for the SI. Harvesting at that age would take advantage of the low specific gravity of the young wood [68]. However, these data differ from those obtained by Longwood [69] who suggested rotation lengths of between four to six years for balsa plantations. Webb [70] suggested rotations of between seven to eight years. González-Osorio et al. [71] and Midgley et al. [4] determined optimal rotation lengths of between four to eight years. All the aforementioned researchers did not describe the method applied to determine the rotation age. However, de-Miguel et al. [19] assumed a rotation of five years in a study conducted in Bolivia using an individual-tree innovative approach.
Nevertheless, beyond technical forestry concerns, in the tropical lowland regions of Ecuador balsa is commercialized when a DBH of 18 cm or more is reached. This is due to the traders’ prices for whole trees (10 to 15 US $ per tree). However, industry demands larger DBH (33–40 cm), doubling the tree value [71], and such diameters can be reached in the best SI at three years of age (Figure 2B).
The maximum variations in MAI of 202, 87, and 28 m3 ha−1 for good, medium, and poor sites, respectively, demonstrated that balsa behaves as a typical pioneer species and is highly sensitive to site conditions [4]. Wycherley and Mitchell [72] concluded that MAI followed a decreasing trend of this forest parameter at plantation establishment. By contrast, we have found that the maximum MAI was reached after two years for the best SI, four years for intermediate SI, and five years for the worst SI.
For the best SI, the MAI observed in the present study cannot be compared in quantity nor in rotation lengths with those obtained by Webb [70], who measured MAI in volume between 17 and 30 m3 ha−1 year−1 in tropical regions at ages of seven and eight years old. However, plantation densities were not provided. Nevertheless, Howcroft [73] and Midgley et al. [4] mentioned that stands older than five to seven years were characterized by poor growth and wood quality. In Bolivia, de-Miguel et al. [19] predicted a mean annual commercial volume increment of 5.9, 10.4, and 12.9 m3 ha−1 year−1 in five-year-old plantations, for poor, medium, and good sites, respectively; plantation densities were not presented because of the high mortality recorded.

5. Conclusions

In summary, forest models describe how trees grow and how forest structures are modified over time. The site index models for DBH and H, and volume and MAI, obtained in the present study must be validated with an independent sample for comparison of these forest parameters. Such validation could contribute to enable reasonable predictions to be made about balsa tree growth and stand development in the coastal lowlands of Ecuador. Moreover, balsa is an example of a native tree whose socio-economic and ecological potential is not yet fully known or exploited. Balsa is a pioneer species that thrives on abandoned land and is maintained with minimal input of labor, usually with a high survival rate and triggering forest succession. Despite the multiple attributes of this native species, it has unfortunately not yet been promoted by the Ecuadorian state reforestation program. However, the current environmental challenges associated with climate variation or change, deterioration of ecosystem services, and decline in biodiversity require several silviculture solutions. These can be obtained through reforestation with fast-growing native species with high potential of biomass production, while at the same time recovering degraded areas.

Author Contributions

Á.C.-L., D.R.-L. and G.M.-M. conceived and designed the experiments, collected the data, and wrote the first draft; Á.C.-L., J.J.V.-H. and C.W. expanded the statistical analyses and M.S.-S. the argumentation lines; C.W. and M.S.-S. carried out a detailed revision of the paper.

Funding

This research received no external funding.

Acknowledgments

We thank the Director of the Portoviejo Experimental Research Station (EEP) of the National Institute of Agricultural Research (INIAP) and the INIAP General Director for providing the necessary logistics and resources in order to carry out this project.

Conflicts of Interest

The authors declare no conflict of interest.

References

  1. Castro-Díez, P.; Vaz, A.S.; Silva, J.S.; van Loo, M.; Alonso, Á.; Aponte, C.; Bayón, Á.; Bellingham, P.J.; Chiuffo, M.C.; DiManno, N.; et al. Global effects of non-native tree species on multiple ecosystem services. Biol. Rev. 2019. [Google Scholar] [CrossRef]
  2. Douterlungne, D.; Thomas, E.; Levy-Tacher, S.I. Fast-growing pioneer tree stands as a rapid and effective strategy for bracken elimination in the Neotropics. J. Appl. Ecol. 2013, 50, 1257–1265. [Google Scholar] [CrossRef]
  3. Levy-Tacher, S.; Vleut, I.; Román-Dañobeytia, F.; Aronson, J. Natural regeneration after long-term bracken fern control with balsa (Ochroma pyramidale) in the Neotropics. Forests 2015, 6, 2163–2177. [Google Scholar] [CrossRef]
  4. Midgley, S.; Blyth, M.; Howcroft, N.; Midgley, D.; Brown, A. Balsa: Biology, Production and Economics in Papua New Guinea, 1st ed.; ACIAR Technical Report Series; ACIAR: Canberra, Australia, 2010; pp. 98–99. [Google Scholar]
  5. Cañadas, L. El mapa ecológico y bioclimático del Ecuador; Editores Asociados Cia. Ltd.: Quito, Ecuador, 1983; pp. 50–120. ISBN 978-9942-09360-8. [Google Scholar]
  6. Vleut, I.; Levy-Tacher, S.I.; de Boer, F.; Galindo-González, J.; Ramírez-Marcial, N. Can a fast-growing early successional tree (Ochroma pyramidale, Malvaceae) accelerate forest succession? J. Trop. Ecol. 2013, 29, 173–180. [Google Scholar] [CrossRef]
  7. Cañadas-López, A.; Rade-Loor, D.; Cevallos, G.F.; Andrade, J.M.D.; Murillo-Hernández, I.; Molina-Hidrovo, C.M.; Castro, H.Q. Ecuaciones generales de diámetro-altura para Ochroma pyramidale, Región Costa-Ecuador. Bosques. Latitud. Cero. 2016, 6, 1–14. [Google Scholar]
  8. Goosem, S.P.; Tucker, N.I.J. Repairing the Rainforest-Theory and Practice of Rainforest Re-Establishment in North Queensland’s Wet Tropics; Casswary Publication: Cairns, Australia, 1995; pp. 71–80. [Google Scholar]
  9. Martínez-Garza, C.; Campo, J.; Ricker, M.; Tobón, W. Effect of initial soil properties on six-year growth of 15 tree species in tropical restoration plantings. Ecol. Evol. 2016, 6, 8686–8694. [Google Scholar] [CrossRef] [PubMed]
  10. Cañadas, A.; Rade, D.; Domínguez, J.M.; Murillo, I.; Molina, C. Modelación forestal como Innovación tecnológica para el manejo silvicultural y aprovechamiento económico de la Balsa, Región Costa-Ecuador; Abya Yala: Quito, Ecuador, 2016; pp. 10–50. ISBN 978-9942-09-360-8. [Google Scholar]
  11. Haggar, J.; Sosa, M.; Días, B.; Hernández, G.; Contreras, J.A.; Uc, C. Integración de factores biofísicos, económicos y sociales en el diseño de sistemas agroforestales en la península de Yucatán. In Los Sistemas Agroforestales de Latinoamérica y de la Selva Baja Caducifolia en México; Monroy, R., Colin, H., Boyas, J., Eds.; IICA; INIFAP; UAEM: Estado de Morales, México, 1998; pp. 71–85. [Google Scholar]
  12. Vincent, A.B. Is height/age a reliable index of site? For. Chron. 1961, 37, 144–150. [Google Scholar] [CrossRef]
  13. Montoro Girona, M.; Morin, H.; Lussier, J.-M.; Walsh, D. Radial growth response of black spruce stands ten years after experimental shelter woods and seed-tree cuttings in boreal forest. Forests 2016, 7, 240. [Google Scholar] [CrossRef]
  14. Kleinn, C. Überlegungen zur Berechnung von Einzelbaumvolumen mittels kubischer Spline Interpolation. AFZ 1989, 47, 1246–1247. [Google Scholar]
  15. Diéguez-Aranda, U.; Castedo-Dorado, F.; Álvarez-González, J.G.; Rojo, A. Compatible taper function for Scots pine plantations in northwestern Spain. Can. J. For. Res. 2006, 5, 1190–1205. [Google Scholar] [CrossRef]
  16. Wehenkel, C.; Cruz-Cobos, F.; Carrillo, A.; Lujan-Soto, J.E. Estimating bark volumes for 16 native tree species on the Sierra Madre Occidental, Mexico. Scand. J. For. Res. 2012, 27, 578–585. [Google Scholar] [CrossRef]
  17. Simental-Cano, B.; López-Sánchez, C.A.; Wehenkel, C.; Vargas-Larreta, B.; Álvarez-González, J.G.; Corral-Rivas, J.J. Species-specific and regional volume models for 12 forest species in Durango, Mexico. RCHSCFA 2017, 23, 155–171. [Google Scholar] [CrossRef]
  18. MAGAP. La política Agropecuaria Ecuatoriana. Hacia un Desarrollo Territorial Sostenible 2015–2025; I Parte; MAGAP: Quito, Ecuador, 2016; pp. 328–330. [Google Scholar]
  19. De-Miguel, S.; Pukkala, T.; Morales, M. Using optimization to solve tree misidentification and uneven measurement interval problems in individual-tree modeling of Balsa stand dynamics. Ecol. Eng. 2014, 69, 232–236. [Google Scholar] [CrossRef]
  20. Weiskittel, A.R.; Hann, D.W.; Kershaw, J.A., Jr.; Vanclay, J.K. Forest Growth and Yield Modeling, 1st ed.; John Wiley & Sons: Noida, India, 2011; pp. 40–98. [Google Scholar]
  21. INAMHI. Boletines Hidrometeorológicos. Available online: http://www.serviciometeorologico.gob.ec/boletines-avisos-y-alertas/ (accessed on 16 April 2019).
  22. Richards, F.J. A flexible growth function for empirical use. J. Exp. Bot. 1959, 10, 290–300. [Google Scholar] [CrossRef]
  23. Peschel, W. Die mathematischen Methoden zur Herleitung der Wachstumsgesetze von Baun und Bestand und die Ergebnisse ihrer Anwendung. Tharandter. Forstl. Jahrb. 1938, 169–247. [Google Scholar]
  24. Cieszewski, C.J. Three methods of deriving advanced dynamic site equations demonstrated on inland Douglas-fir site curves. Can. J. For. Res. 2001, 31, 165–173. [Google Scholar] [CrossRef]
  25. Shater, Z.; de-Miguel, S.; Kraid, B.; Pukala, T.; Palahi, M. A growth and yield model for eveng-aged Pinus brutia Ten. stands in Syria. Ann. For. Sci. 2011, 68, 149–157. [Google Scholar] [CrossRef]
  26. Cieszewski, C.J. Comparing fixed- and variable-base-age site equations having single versus multiple asymptotes. For. Sci. 2002, 48, 7–23. [Google Scholar] [CrossRef]
  27. Cieszewski, C.J. Developing a well-behaved dynamic site equation using a modified Hossfeld IV function Y3 = (axm)/(c + xm−1), a simplified mixed-model and scant subapline fir data. For. Sci. 2003, 49, 539–554. [Google Scholar] [CrossRef]
  28. Colbert, J.J.; Schuckers, M.; Fekedulegn, D.; Rentch, J.; Mac Siúrtáin, M.; Gottschalk, K. Individual tree basal-area growth parameter estimates for four models. Ecol. Model. 2004, 174, 115–126. [Google Scholar] [CrossRef]
  29. Burkhart, H.; Tomé, M. Modeling Forest Trees and Stands, 1 st ed.; Springer: Dordrecht, The Nederland, 2012; pp. 45–70. [Google Scholar]
  30. Pienaar, L.V.; Turnbull, K.J. The Chapman-Richards generalization of von Bertalanffy’s growth model for basal area growth and yield in even-aged stands. For. Sci. 1973, 19, 2–22. [Google Scholar] [CrossRef]
  31. Tjørve, E.; Tjørve, K.M. A unified approach to the Richards-model family for use in growth analyses: Why we need only two model forms. J. Theor. Biol. 2010, 267, 417–425. [Google Scholar] [CrossRef]
  32. Palahí, M.; Grau, J.M. Preliminary site index model and individual-tree growth and mortality models for black pine (Pinus nigra Arn.) in Catalonia (Spain). Forest Syst. 2003, 12, 137–148. [Google Scholar]
  33. Panik, M.J. Growth Curve Modeling: Theory and Applications, 1st ed.; John Wiley & Sons: Noida, India, 2013; pp. 56–89. [Google Scholar]
  34. Cieszewski, C.J. GADA Derivation of Dynamic Site Equations with Polymorphism and Variable Asymptotes from Richards, Weibull, and Other Exponential Functions; PMRC-Technical Report 2004–20045; Daniel N. Warnell School of Forest Resources, University of Georgia: Athens, GA, USA, 2004; p. 16. [Google Scholar]
  35. Development Core Team. R: A Language and Environment for Statistical Computing; R Foundation for Statistical Computing: Vienna, Austria, 2017; Available online: http://www.R-project.org/ (accessed on 18 January 2019).
  36. Cañadas-López, Á.; Andrade-Candell, J.; Domínguez-A, J.; Molina-Hidrovo, C.; Schnabel-Delgado, O.; Vargas-Hernández, J.; Wehenkel, C. Growth and yield models for teak planted as living fences in coastal Ecuador. Forests 2018, 9, 55. [Google Scholar] [CrossRef]
  37. SAS Institute Inc. SAS/ETS® 9.2 User’s Guide; SAS Institute Inc.: Cary, NC, USA, 2008. [Google Scholar]
  38. Schumacher, F.X.; Hall, F.S. Logarithmic expression of timber-tree volume. J. Agric. Res. 1933, 47, 719–734. [Google Scholar]
  39. Spurr, S.H. Forest Inventory; Ronald Press Co.: New York, NY, USA, 1952; p. 476. [Google Scholar]
  40. Avery, T.E.; Burkhart, H.E. Forest Measurements, 5th ed.; McGraw-Hill: New York, NY, USA, 2002; p. 456. ISBN 1478629088. [Google Scholar]
  41. Ruiz, R.M.; Martínez, G.E.R.; Mata, J.J. Análisis del crecimiento y producción de látex en plantaciones forestales comerciales de hule (Hevea brasiliensis Muell Arg.) en el estado de Oaxaca, México. RaXimhai 2007, 3, 565–578. [Google Scholar]
  42. Honer, T.G. A new total cubic foot volume function. For. Chron. 1965, 41, 476–493. [Google Scholar] [CrossRef]
  43. Newnham, R.M. Variable-form taper functions for four Alberta tree species. Can. J. For. Res. 1992, 22, 210–223. [Google Scholar] [CrossRef]
  44. Akaike, H. Information Theory and an Extension of the Maximum Likelihood Principle. In Selected Papers of Hirotugu Akaike; Parzen, A., Tanabe, K., Kitagawa, G., Eds.; Springer: New York, NY, USA, 1998; pp. 199–213. [Google Scholar]
  45. Snipes, M.; Taylor, D.C. Model selection and Akaike Information Criteria: An example from wine ratings and prices. Wine Econ. Policy 2014, 3, 3–9. [Google Scholar] [CrossRef] [Green Version]
  46. Pukkala, T.; von Gadow, K. Continuous Cover Forestry; Springer Verlag: Dordrecht, Holland, 2012; pp. 85–128. ISBN 978-94-007-2201-9. [Google Scholar]
  47. Rodríguez-Carrillo, A.; Cruz-Cobos, F.; Vargas-Larreta, B.; Hernández, F.J. Compatible dominant height-site index model for juniper (Juniperus deppeana Steud.). Rev. Chapingo Ser. Cie. 2015, 21, 97–108. [Google Scholar] [CrossRef]
  48. Díaz-Maroto, I.J.; Fernández-Parajes, J.; Vila-Lameiro, P. Site index model for natural stands of rebollooak (Quercus pyrenaica Willd.) in Galicia, NW Iberian Peninsula. Cienc. For. 2010, 20, 57–68. [Google Scholar] [CrossRef]
  49. Diéguez-Aranda, U.; Grandas-Árias, J.A.; Álvarez-González, J.G.; Gadow, K. Site quality curves for birch stands in North Western Spain. Silva Fenn. 2006, 40, 631–644. [Google Scholar] [CrossRef]
  50. Stankova, T.; Diéguez-Aranda, U. A tentative dynamic site index model for Scots pine (Pinus sylvestris L.) plantations in Bulgaria. Silva Balcanica 2012, 13, 5–19. [Google Scholar]
  51. Gräfe, W. Struktur-und Dynamikuntersuchungen in jungen Zweitwuchsbeständen der westlichen Llanos Venezuelas. Ph.D. dissertation, Georg-August-Universität zu Göttingen, Göttigen, Germany, 1981. [Google Scholar]
  52. Lamprecht, H. Silviculture in the Tropics—Tropical Forest Ecosystems and Their Tree Species-Possibilities and Methods for Their Long-Term Utilization; GTZ: Eschborn, Germany, 1989; pp. 297–298. [Google Scholar]
  53. Wishnie, M.H.; Dent, D.H.; Mariscal, E.; Deago, J.; Cedeño, N.; Ibarra, D.; Condit, R.; Ashton, P.M.S. Initial performance and reforestation potential of 24 tropical tree species planted across a precipitation gradient in the Republic of Panama. For. Ecol. Manag. 2007, 243, 39–49. [Google Scholar] [CrossRef]
  54. Butterfield, R.P. Early species selection for tropical reforestation: A consideration of stability. For. Ecol. Manag. 1996, 81, 161–168. [Google Scholar] [CrossRef]
  55. Dalling, J.W.; Lovelock, C.E.; Hubbell, S.P. Growth responses of seedlings of two neotropical pioneer species to simulated forest gap environments. J. Tro. Eco. 1999, 15, 827–839. [Google Scholar] [CrossRef] [Green Version]
  56. Pearson, T.R.H.; Burslem, D.F.R.P.; Goeriz, R.E.; Dalling, J.W. Regeneration niche partitioning in neotropical pioneers: Effects of gap size, seasonal drought and herbivory on growth and survival. Oecologia 2003, 137, 456–465. [Google Scholar] [CrossRef]
  57. Healy, C.; Gotelli, N.J.; Potvin, C. Partitioning the effects of biodiversity and environmental heterogeneity for productivity and mortality in a tropical tree plantation. J. Ecol. 2008, 96, 903–913. [Google Scholar] [CrossRef]
  58. Van Breugel, M.; Hall, J.S.; Craven, D.; Bailon, M.; Hernández, A.; Abbene, M.; van Breugel, P. Succession of ephemeral secondary forests and their limited role for the conservation of floristic diversity in a human-modified tropical landscape. PloS ONE 2013, 8, e82433. [Google Scholar] [CrossRef]
  59. Azambuja Magalhães, W.; da Silva Freddi, O.; Lange, A.; Wruck, F.J.; Silva, W.M.; Soares, M.B. Atributos físico-hídricos do solo em sistema integrado de produção com diferentes arranjos do componente florestal paricá. Pesq Agropec Bras 2018, 53, 351–360. [Google Scholar] [CrossRef]
  60. De Souza, F.M.; Batista, J.L.F. Restoration of seasonal semideciduous forests in Brazil: Influence of age and restoration design on forest structure. For. Ecol. Manag. 2004, 191, 185–200. [Google Scholar] [CrossRef]
  61. Román-Dañobeytia, F.J.; Levy-Tacher, S.I.; Aronson, J.; Rodrigues, R.R.; Castellanos-Albores, J. Testing the performance of fourteen native tropical tree species in two abandoned pastures of the Lacandon rainforest region of Chiapas, Mexico. Restor. Ecol. 2012, 20, 378–386. [Google Scholar] [CrossRef]
  62. Montoro Girona, M.; Rossi, S.; Lussier, J.M.; Walsh, D.; Morin, H. Understanding tree growth responses after partial cuttings: A new approach. PLoS ONE 2017, 12, e0172653. [Google Scholar] [CrossRef]
  63. Hernández-Ramos, J.; Santos-Posadas, H.M.; Valdéz-Lazalde, J.R.; Tamarit-Urias, J.C.; Ángeles-Pérez, G.; Hernández-Ramos, A.; Méndez-López, B.; Peduzzi, A. Estimación del volumen comercial en plantaciones de Eucalyptus urophylla con modelos de volumen total y de razón. Agrociencia-Mexico 2017, 51, 561–580. [Google Scholar]
  64. Sautunce-Cunuhay, P.; Coronel, T.G.D.; García-Cruzatty, L. Crecimiento de especies arbóreas tropicales en la colección de la Universidad Técnica Estatal de Quevedo. Revista Ciencia y Tecnología 2009, 2, 21–27. [Google Scholar]
  65. Mora-Yela, R.V. Valoración económica de las plantaciones de teca (Tectona grandis) y balsa (Ochroma pyramidale) en tres cantones del Litoral Ecuatoriano. Tesis de Ingeniería, Universidad Técnica Estatal de Quevedo, Quevedo, Ecuador, 2011. [Google Scholar]
  66. Murillo-Lince, J.C. Tablas de volumen y porcentaje de aprovechamiento en el aserrado de Ochroma pyramidale (BALSA) en el recinto El Vergel, Cantón Valencia, Provincia de Los Ríos. Tesis de Ingeniería, Universidad Técnica Estatal de Quevedo, Quevedo, Ecuador, 2012. [Google Scholar]
  67. Barragán-Márquez, M.S. Evaluación de la calidad de plantaciones de balsa Ochroma pyramidale (Cav. ex Lam.) Urb. de un año de edad, en los cantones Valencia y Mocache. Tesis de Ingeniería, Universidad Técnica Estatal de Quevedo, Quevedo, Ecuador, 2015. [Google Scholar]
  68. Rueda, R.; Williamson, G.B. Radial and vertical wood specific gravity in Ochroma pyramidale (Cav. ex Lam.) Urb. (Bombacaceae). Biotropica 1992, 24, 4–512. [Google Scholar] [CrossRef]
  69. Longwood, F. Present and Potential Commercial Timbers of the Caribbean; U.S. Department of Agriculture Agric. Handb: Washington, DC, USA, 1962; pp. 36–38.
  70. Webb, D.B.; Wood, P.J.; Smith, J.P.; Henman, G.S. A Guide to Species Selection for Tropical and Sub-Tropical Plantations; Commonwealth Forestry Institute: Oxford, UK, 1980; pp. 34–54. [Google Scholar]
  71. González-Osorio, B.G.; Molina, X.C.; Navarrete, E.T.; Fonseca, C.S.; Ochoa, L.S. Caracterización del cultivo de balsa (Ochroma pyramidale) en la Provincia de los Ríos-Ecuador. Revista Ciencia y Tecnología 2010, 3, 7–11. [Google Scholar]
  72. Wycherley, P.R.; Mitchell, B.A. Growth of Balsa trees Ochroma lagopus Sw. at the Rubber Research Institute Experiment Station. Mal. Forest. 1962, 25, 140–149. [Google Scholar]
  73. Howcroft, N.H.S. The Balsa Manual: Techniques for Establishment and the Management of Balsa (Ochroma lagopus) plantations in Papua New Guinea; ITTO: Keravat, Papua New Guinea, 2002; pp. 28–44. [Google Scholar]
Figure 1. Spatial distribution of the balsa sampling plots in the coastal lowland provinces in Ecuador.
Forests 10 00733 g001
Figure 2. Bias (A,B) and root mean square error (RMSE; C,D) by age class for dominant height (Hd) (A,C) and dominant diameter at breast height (DBHd) (B,D) estimated with the Equations (1)–(3) (Chapman-Richards, Hossfeld, GADA formulation, respectively).
Forests 10 00733 g002
Figure 3. Site index curves for five site class for balsa in the coastal lowlands of Ecuador. (a) Total height (14, 19, 24, 29, and 34 m) and (b) diameter at breast height (20, 25, 30, 35, and 40 cm), using the GADA model (for a reference age of five years).
Forests 10 00733 g003
Figure 4. Relationship between mean annual increment (MAI) (dashed line) and periodic annual increment (PAI) curves (solid lines) for the volume increment at different ages and SI at five years. Coincidence of these two parameters can be considered to indicate the optimum biological rotation age with a density of 300 trees ha−1 for the balsa plantations in the littoral region of Ecuador. The numbers associated with MAI and PAI correspond to the SI estimated by the height (14, 19, 24, 29, and 34 m) of mean dominant trees at five years. The volume was estimated with Equation (6) [38].
Forests 10 00733 g004
Table 1. Mean stand characteristics of the Balsa plantations by province in the coastal region of Ecuador.
Province Density of Plantation (Trees ha−1)Age (Year)Diameter at Breast Height (cm)Total Height (m)Basal Area (m2 ha−1)Mean Annual Increment * (m3 ha−1)
Los RíosAverage334.44.422.422.413.029.2
Maximum1506.010.944.140.626.0228.1
Minimum90.01.12.92.50.32.2
Stand Err±712.5±0.1±1.1±1.3±0.6±5.1
Santo Domingo de los TsáchilasAverage343.24.122.522.714.133.0
Maximum856.09.444.635.026.9198.4
Minimum100.01.33.87.42.02.3
Stand Err±777.4±0.1±1.4±1.6±0.8±9.9
CotopaxiAverage390.53.923.323.915.839.2
Maximum760.07.237.534.628.199.5
Minimum190.01.58.810.74.810.4
Stand Err±892.2±0.2±2.8±2.9±1.8±15.3
ManabíAverage280.75.121.923.111.622.9
Maximum800.010.835.234.322.543.9
Minimum90.01.46.87.42.23.0
Stand Err±280.7±0.6±3.8±4.9±1.7±6.4
GuayasAverage408.53.619.220.611.929.4
Maximum599.06.833.628.622.052.1
Minimum194.01.810.910.84.67.1
Stand Err±881.9±0.2±4.2±3.4±2.3±13.4
EsmeraldasAverage361.43.821.820.513.416.3
Maximum569.06.532.527.830.038.9
Minimum155.01.513.711.46.018.3
Stand Err±2842.5±0.3±4.2±4.2±4.9±28.4
PichinchaAverage337.03.924.620.211.623.1
Maximum493.06.832.627.619.237.4
Minimum210.01.815.39.94.07.4
Stand Err±1160.5±0.6±5.9±5.7±3.3±9.8
* Note: Mean annual increment is the total growth of a stand up to a given age divided by the total age.
Table 2. Province, general conditions, and number of plots in the balsa plantations under study in the coastal region of Ecuador.
ProvinceTotal Annual Precipitation (mm)Mean Annual Temperature (°C)Elevation (Meters above Sea Level)Number of PlotsLife Zone *
Los Ríos200025.230–3001300TwF-TrF
Santo Domingo de los Tsáchilas228023.5200–700529Twf-TrF
Cotopaxi301924.0300–600117TmF-TrF
Manabí100024.620–300100TdF-TrF
Guayas118926.730–10056TdF-TrF
Esmeraldas264625.6100–30032TwF-TrF
Pichincha199825.0300–70027TwF-TrF
* According to Cañadas [5]: Tropical dry forest, evapotranspiration potential 1–2 (TdF); tropical moist forest, evapotranspiration potential 0.5–1 (TmF); tropical wet forest, evapotranspiration potential 0.2–0.5 (TwF); tropical rain forest, evapotranspiration potential 0.1–2 (TrF).
Table 3. Models tested for fitting volume equations for balsa trees by using diameter at breast height (DBH in cm) and total tree height (H in m) of dominant trees.
ModelExpression
Schumacher-Hall (allometric) [38] V = a × D B H b × H c (6)
Spurr [39] V = a × D B H 2 × H (7)
Spurr potential [40] V = a × ( D B H × H ) b (8)
Spurr with independent term [40] V = a + b × D B H 2 × H (9)
Incomplete generalized combined variable [40] V = a + b × H + c × D B H 2 × H (10)
Australian formula [41] V = a + b × D B H 2 + c × H + d × D B H 2 × H (11)
Honer [42] V = D B H 2 / ( a + b / H ) (12)
Newnham [43] V = a + b D B H c × H d ) (13)
Table 4. Estimated values of parameters, p values, and goodness-of-fit statistics for the three-mean height–age and diameter–age models for balsa plantations of the coastal region of Ecuador.
ParameterModelParameterEstimated ValueStandard Errorp ValueRMSE
Height–AgeEquation (1)a131.8440.6646<0.00113.79
a20.29730.0247<0.001
a31.07670.0662<0.001
Equation (2)a10.80360.0065<0.0016.43
a2−0.13820.0001<0.001
a30.13310.001<0.001
Equation (3)b10.42070.1483<0.0014.27
b2−4.61360.2719<0.001
b320.3955.4538<0.001
Diameter–AgeEquation (1)a133.6070.7364<0.00123.06
a20.31080.0372<0.001
a30.78760.0696<0.001
Equation (2)a11.30900.00003<0.00000018.53
a2−0.18860.00001<0.001
a30.17920.00004<0.0000001
Equation (3)b10.79890.0791<0.00000015.61
b2−9.78192.3562<0.0000001
b341.2340.2583<0.0000001
Table 5. Goodness of fit statistics of the models predicting the volume (in m3 for diameter at breast height over bark of 5 cm or more) of balsa plantations in the coastal lowlands of Ecuador.
ModelMSER2AdjParameterEstimatorSEAIC
Newnham0.0280.909a0.3497270.0198−392
b0.0000240.000005
c2.3431510.0629
d0.7604810.0518
Spurr with independent term0.0280.907a0.3226450.0124−380
b0.0000420.0000003
Incomplete generalized combined variable0.0280.907a0.2792410.0528−379
b0.003750.00379
c0.0000410.0000008
Australiana formula0.0280.907a0.2826140.0572−378
b−0.000060.000050
c0.0040890.00382
d0.0000430.000002
Schumacher-Hall (allometric)0.0460.849a0.0024020.000331−122
b1.1009580.0465
c0.8192850.0738
Spurr potential0.0460.848a0.0022640.000281−121
b0.9805550.0181
Honer0.0580.809a973.357138.44571.56
b−1995.99822.1
Spurr0.0810.733a0.0000550.0000004177
MSE = mean squared error; R2Adj = adjusted determination coefficient; SE = standard error; AIC = Akaike information criterion.

