Salicylic Acid Alleviated Salt Damage of Populus euphratica: A Physiological and Transcriptomic Analysis


1
College of Biological Sciences and technology, Beijing Forestry University, Beijing 100083, China
2
National Engineering Laboratory for Tree Breeding, Beijing Forestry University, Beijing 100083, China
3
Beijing Advanced Innovation Center for Tree Breeding by Molecular Design, Beijing Forestry University, Beijing 100083, China
*
Author to whom correspondence should be addressed.
Forests 2019, 10(5), 423; https://doi.org/10.3390/f10050423
Submission received: 2 April 2019
/
Revised: 10 May 2019
/
Accepted: 10 May 2019
/
Published: 16 May 2019
(This article belongs to the Special Issue Physiological Responses to Abiotic and Biotic Stress in Forest Trees)
Abstract
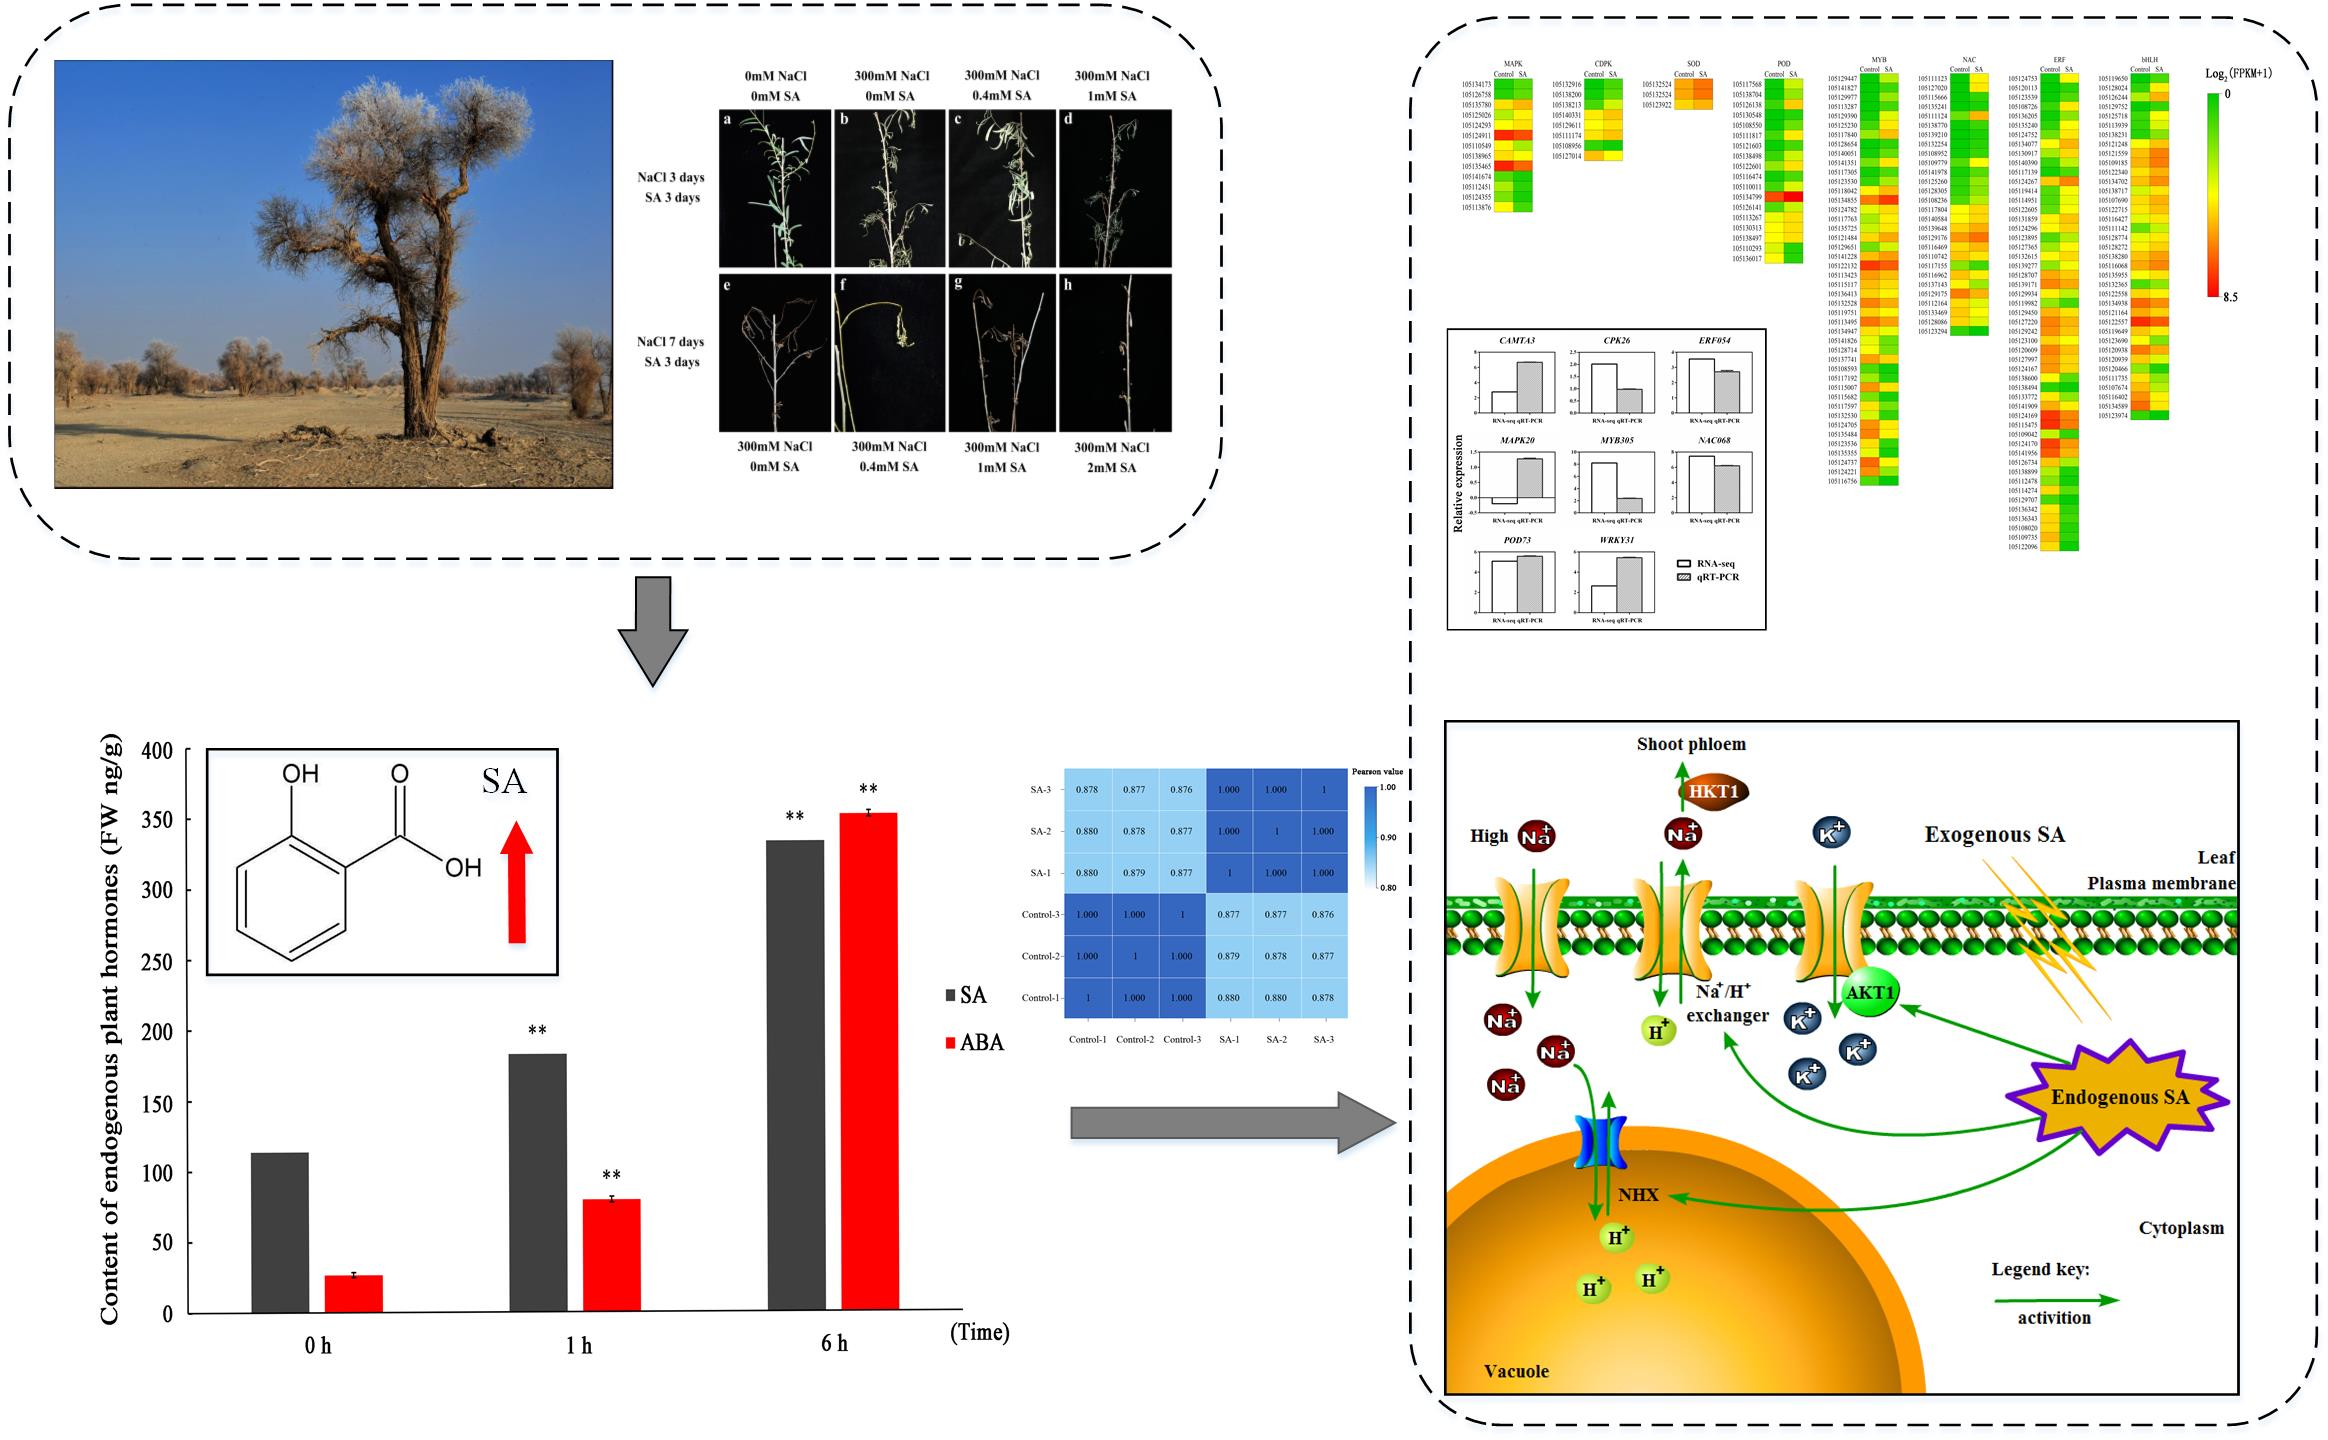
:Populus euphratica Oliv. is a model tree for studying abiotic stress, especially salt stress response. Salt stress is one of the most extensive abiotic stresses, which has an adverse effect on plant growth and development. Salicylic acid (SA) is an important signaling molecule that plays an important role in modulating the plant responses to abiotic stresses. To answer whether the endogenous SA can be induced by salt stress, and whether SA effectively alleviates the negative effects of salt on poplar growth is the main purpose of the study. To elucidate the effects of SA and salt stress on the growth of P. euphratica, we examined the morphological and physiological changes of P. euphratica under 300 mM NaCl after treatment with different concentrations of SA. A pretreatment of P. euphratica with 0.4 mM SA for 3 days effectively improved the growth status of plants under subsequent salt stress. These results indicate that appropriate concentrations of exogenous SA can effectively counteract the negative effect of salt stress on growth and development. Subsequently, transcripts involved in salt stress response via SA signaling were captured by RNA sequencing. The results indicated that numerous specific genes encoding mitogen-activated protein kinase, calcium-dependent protein kinase, and antioxidant enzymes were upregulated. Potassium transporters and Na+/H+ antiporters, which maintain K+/Na+ balance, were also upregulated after SA pretreatment. The transcriptome changes show that the ion transport and antioxidant enzymes were the early enhanced systems in response of P. euphratica to salt via SA, expanding our knowledge about SA function in salt stress defense in P. euphratica. This provides a solid foundation for future study of functional genes controlling effective components in metabolic pathways of trees.

1. Introduction
Plants are exposed to multiple environmental stresses such as salinity, drought, and extreme temperatures that are harmful to plants. In particular, salinity stress, which usually occurs in arid and semi-arid regions, severely affects plant growth and development throughout the world [1]. Many studies confirm the inhibitory effect of salt stress on physiological and biochemical processes, which inhibits photosynthesis and destroys cell membranes. The question of how stressed plants can diminish the deleterious effects of salt stress has drawn a lot of attention. Salicylic acid (SA) is a naturally synthesizing endogenous signaling molecule that activates plant growth and defense responses to systemic acquired resistance (SAR) and biotic resistance [2,3,4,5]. It was first discovered to be a plant immune signal, produced by a pathogen challenge to induce SAR. SA exhibits a very broad-spectrum defense against reinvasion of pathogens and has been widely investigated due to its functions in plant immunity against diseases or biotic resistance [6]. The accumulation of endogenous SA can induce the expression of pathogenesis-related genes, by imitating endogenous phenolic signaling molecules and activating the development of SAR, thereby increasing resistance of plants [7]. In addition to biotic resistance, an increasing number of studies indicate that SA may modulate abiotic tolerance and have potential functions in response to plant salinity resistance. SA could generate a wide range of metabolic and physiological responses in plants by affecting their growth and development. For example, foliar SA application has been reported to markedly promote growth and relative water content and reduce electrolyte leakage of cucumber plants grown under salt stress [8,9]. During salt stress, SA can also improve sunflower growth and photosynthesis [10]. However, the effective concentration of SA to alleviating salt damages depends on the plant species, genotypes, developmental stages, and tissue types. To date, the abiotic tolerance response mechanism of SA, especially in trees, still needs to be elucidated. Further studies are needed to determine the function of SA in abiotic tolerance, and the early response genes to SA and investigate whether abiotic stress can increase the levels of endogenous SA and how the SA signaling pathway is involved in abiotic stress response.
Populus euphratica Oliv. is a special poplar species found in saline and semi-arid desert regions extending from western China, through the Middle East and Central Asia, to North Africa [11,12]. Being the only arboreal species in the largest shifting sand desert in the world [13], P. euphratica has the ability to adapt to hostile and extreme environmental stresses, especially salt, which makes it a model species for elucidating mechanisms of abiotic stress resistance in trees [14]. Research on the mechanism of resistance in P. euphratica should greatly contribute to the cultivation of woody plants and the protection of P. euphratica germplasm resources [15,16,17]. Previously, scientists completed the whole-genome sequencing of P. euphratica and obtained dozens of salt stress responsive genes in this species [18]. However, whether SA influences or participates in the abiotic stress response of P. euphratica remains to be elucidated.
In view of the above description, the main purpose of this study was to determine whether endogenous SA could be induced under salt stress in P. euphratica, and whether exogenous SA could effectively alleviate the negative effects of salt stress on plant growth. By studying the physiological, biochemical parameters, and genomic transcriptional profile of SA-pretreated P. euphratica seedlings under salt stress, the theoretical foundation for the expansion of abiotic stress response mechanism in regions with high salinity was further established.
2. Materials and Methods
2.1. Plant Materials
The P. euphratica seeds were collected from the Inner Mongolia Autonomous Region of China. The seeds were first sterilized and cultured in tissue-cultured plantlets for growth and propagation. Then, they were transferred to plastic pots for 1 month in the greenhouse of Beijing Forestry University. After that, seedlings with similar stem length and number of expanded leaves were selected and grown hydroponically in half-strength Hoagland’s solution in a hydroponic box for another month. The environment conditions were as follows: 16 h photoperiod, 25 ± 2 °C/18 ± 2 °C (day/night) temperature, 250 µmol m−2 s−1 light intensity, and 65% ± 5% relative humidity. Each hydroponic box dish contained 12 seedlings.
2.2. Quantification of SA after Salt Treatment
P. euphratica seedlings were divided into three groups, which were treated with 300 mM NaCl solution for 0, 1, and 6 h, respectively. The salt-treated leaves were snap-frozen in a liquid nitrogen environment and ground into a fine powder by vigorous vortexing. Approximately 50 mg of powder per tube was immediately weighed with a 1/10,000 balance weight. Afterward, 0.5 mL of extraction solvent (dichloromethane, 99.9%) was added, followed by 50 µL of 0.2 ng µL−1 IH4 SA and 10 µL of 1 ng µL−1 D6 abscisic acid (ABA) as internal standards. The tubes were then placed on a shaker at a speed of 100 rpm under 4 °C for 30 min. After centrifugation at 13,000 rpm for 5 min, two phases were formed, and approximately 900 µL of the solvent from the lower phase was transferred for later use. Finally, the samples were evaporated to dryness and dissolved in 0.1 mL methanol. The contents of SA and ABA were determined using ultra performance liquid chromatography/tandem mass spectrometry (UPLC-MS/MS) (Agilent 5500, Agilent Technologies Inc., Santa Clara, CA, USA), by injecting 50 µL of sample solution into the reverse-phase C18 Gemini UPLC column. The area of peaks in the chromatogram was quantified using MassHunter software (Agilent Technologies Inc., Santa Clara, CA, USA).
2.3. Effects of SA and NaCl Treatment on Morphology and Physiology
To test the effects of SA treatments on P. euphratica growth, SA was dissolved in ethanol and Tween-20 (0.1% dilute solution), and double-distilled water was added to obtain an SA mother liquor concentration. We further divided the plants into four groups and cultured them in half-strength Hoagland’s solution containing SA at concentrations of 0, 0.4, 1.0, and 2.0 mM. After 3 days, all the seedlings were rinsed with distilled water to remove residual SA and then transferred to half-strength Hoagland’s solution supplemented with 300 mM NaCl. The performances were recorded on the 3rd day after NaCl treatment. To clearly observe the effect of SA on alleviating salt stress from the phenotype, we performed the same experiment using salt treatment on the 7th day of lethality during phenotypic observation.
The chlorophyll contents of the leaves were measured using the Minolta Chlorophyll Meter (SPAD-502, Konica Minolta, Osaka, Japan) in vivo. The seedlings growing under normal growth condition were used as untreated control. Six random leaves of the upper, middle, and lower parts of each plant were selected in the same position, and each leaf was measured thrice. At the end of experiment, the leaves from three replications per treatment were harvested for fresh weight (FW) determination.
2.4. Determination of Malondialdehyde (MDA) Content and Antioxidant Enzyme
The MDA contents were determined following the previously reported method [19,20]. The leaves of seedlings (0.50 g) were homogenized in 10 mL of 10% (w/v) trichloroacetic acid (TCA) and then centrifuged at 10,000 × g. Approximately 2 mL of 0.6% (w/v) thiobarbituric acid containing 10% (w/v) TCA was added. The samples were heated for 30 min in a boiling water bath at 100 °C. The absorbance of the supernatant was recorded at 532, 450, and 600 nm after the samples cooled. The MDA content was calculated as follows: C (µmol g−1) = 6.45 × (A532 − A600) − 0.56 × A450. Peroxidase (POD) activities were assayed according to Meloni et al. [21]. The activity of superoxide dismutase (SOD) was determined according to the method described by Becana et al. [22]. Three replicate measurements were made for each treatment, and the results were averaged.
2.5. Determination of K and Na Contents
After various treatments, the leaves of seedlings were dried in an oven at 70 °C to constant weight. The dried samples were weighed and pulverized, and then digested at 260 °C with 2 mL of 30% H2O2 and 5 mL of H2SO4 in a microwave oven (CEM mars240/50, CEM Inc., Matthews, NC, USA). Then, the samples were cooled and subjected to atomic absorption spectrometer (Varian, Spectraa-220) to determine the concentrations of K and Na.
2.6. RNA Extraction, Library Preparation, and RNA Sequencing (RNA-seq)
Leaves of P. euphratica seedlings pretreated with 0 and 0.4 mM of SA solution were frozen in liquid nitrogen immediately after harvest at 0 h and 6 h time points and stored at −80 °C for later use. Total RNA was extracted using RNAprep Pure Plant Kit (TIANGEN BIOTECH Co. Ltd., Beijing, China). After extracting and treating the RNA with DNase I, we used Oligo (dT) to isolate mRNA (Messenger RNA), which was further fragmented to synthesize cDNA by reverse transcription. After using the Agilent 2100 Bioanalyzer (Agilent Technologies Inc., Santa Clara, CA, USA) and ABI StepOnePlus Real-Time PCR System (Applied Biosystems, Waltham, MA, USA) to quantify and qualify the sample library, the cDNA library was sequenced using Illumina HiSeq 2000™ (Illumina, San Diego, CA, USA).
2.7. Processing of Sequence Data
The raw data for sequencing included low quality, linker contamination, and reads with unknown base N content, which need to be removed prior to data analysis to ensure reliable results. We used SOAPnuke (https://github.com/BGI-flexlab/SOAPnuke, The Beijing Genomics Institute, Shenzhen, Guang Dong, China), a filter software developed by BGI company, to remove reads containing adaptor, reads with unknown base N content greater than 5%, and low-quality bases (>20% of the bases with a quality score ≤10). After filtering, the remaining reads were called “clean reads” and stored in FASTQ (A format that stores biological sequences and corresponding quality assessments) format [23].
2.8. Mapping Reads to the P. euphratica Genome and Function Annotation
We used HISAT2 (http://www.ccb.jhu.edu/software/hisat, The Center for Computational Biology at Johns Hopkins University, Baltimore, MD, USA) and Bowtie2 (http://bowtie-bio.sourceforge.net/Bowtie2/index.shtml, The Center for Computational Biology at Johns Hopkins University, Baltimore, MD, USA) to compare RNA-seq reads from control and treated samples with reference genomic sequences of P. euphratica [24,25]. The abundance of transcripts was calculated using the RSEM method of gene expression by mapping the transcript to RNA-seq reads and expressed as fragments per kilobase of transcript per million mapped reads (FPKM) [25,26].
2.9. Differential Expression Analysis
To identify differentially expressed genes (DEGs) in SA-pretreated and non-SA-pretreated salt-stressed P. euphratica leaves, we used the DEGseq method based on the Poisson distribution model for differential gene detection [27]. To improve the accuracy of DEGs, we defined the false discovery rate (FDR) ≤0.001 and log2 ratio ≥1 as thresholds to discriminate significant DEGs. The differential genes were functionally classified by Gene Ontology (GO), using the Web Gene Ontology Annotation Plot (WEGO) software package. The phyper function of the R software was used for enrichment analysis with the threshold of FDR ≤0.001. Transcription factors (TFs) were predicted using HMMsearch (http://hmmer.org, European Bioinformatics Institute, Cambridge, Cambs, England) [28].
2.10. Pathway Enrichment Analysis of DEG
Pathway enrichment analysis was based on the Kyoto Encyclopedia of Genes and Genomes (KEGG) database (http://www.genome.jp/kegg/, Kyoto University Bioinformatics Center, Sakyo ku, Kyoto, Japan) and performed as described previously [14]. Q value was used for determining the threshold of significance in multiple tests. Pathways with a Q value of ≤0.05 were considered significantly enriched for DEGs.
2.11. Validation of DEGs through qRT-PCR (Quantitative Real-Time PCR)
To validate the reliability of RNA-seq experiments, we randomly selected eight functional DEGs from RNA-seq results. Total RNA was extracted using P. euphratica leaves from the same three samples. Reverse transcription was performed using FastQuant RT Kit with DNase (TIANGEN BIOTECH Co., Ltd., Beijing, China) to synthesize the first-strand cDNA. qRT-PCR was performed in an optical 96-well reaction plate using the ABI PRISM 7500 real-time PCR system (Applied Biosystems). SuperReal PreMix Plus SYBR Green (TIANGEN BIOTECH Co., Ltd., Beijing, China) was used in the experiments. Each reaction contained 12.5 µL of SYBR Premix ExTaq, 0.5 µL of ROX Reference Dye, 2.0 µL of cDNA samples, and 1.0 µL of gene-specific primers, with a final volume of 25 µL. The thermal cycle program used was as follows: 95 °C for 10 s, 45 cycles at 95 °C for 5 s, and 60 °C for 40 s. Real-time PCR data were analyzed using the 2−∆∆CT method [29].
2.12. Statistical Analysis
Statistical tests were performed with the SPSS software (version 20.0, SPSS Inc., Chicago, IL, USA). Duncan’ test was used to analyze the data unless otherwise indicated. The means were compared on the basis of p < 0.05.
3. Results
3.1. Increased SA Content in P. euphratica under Salt Stress
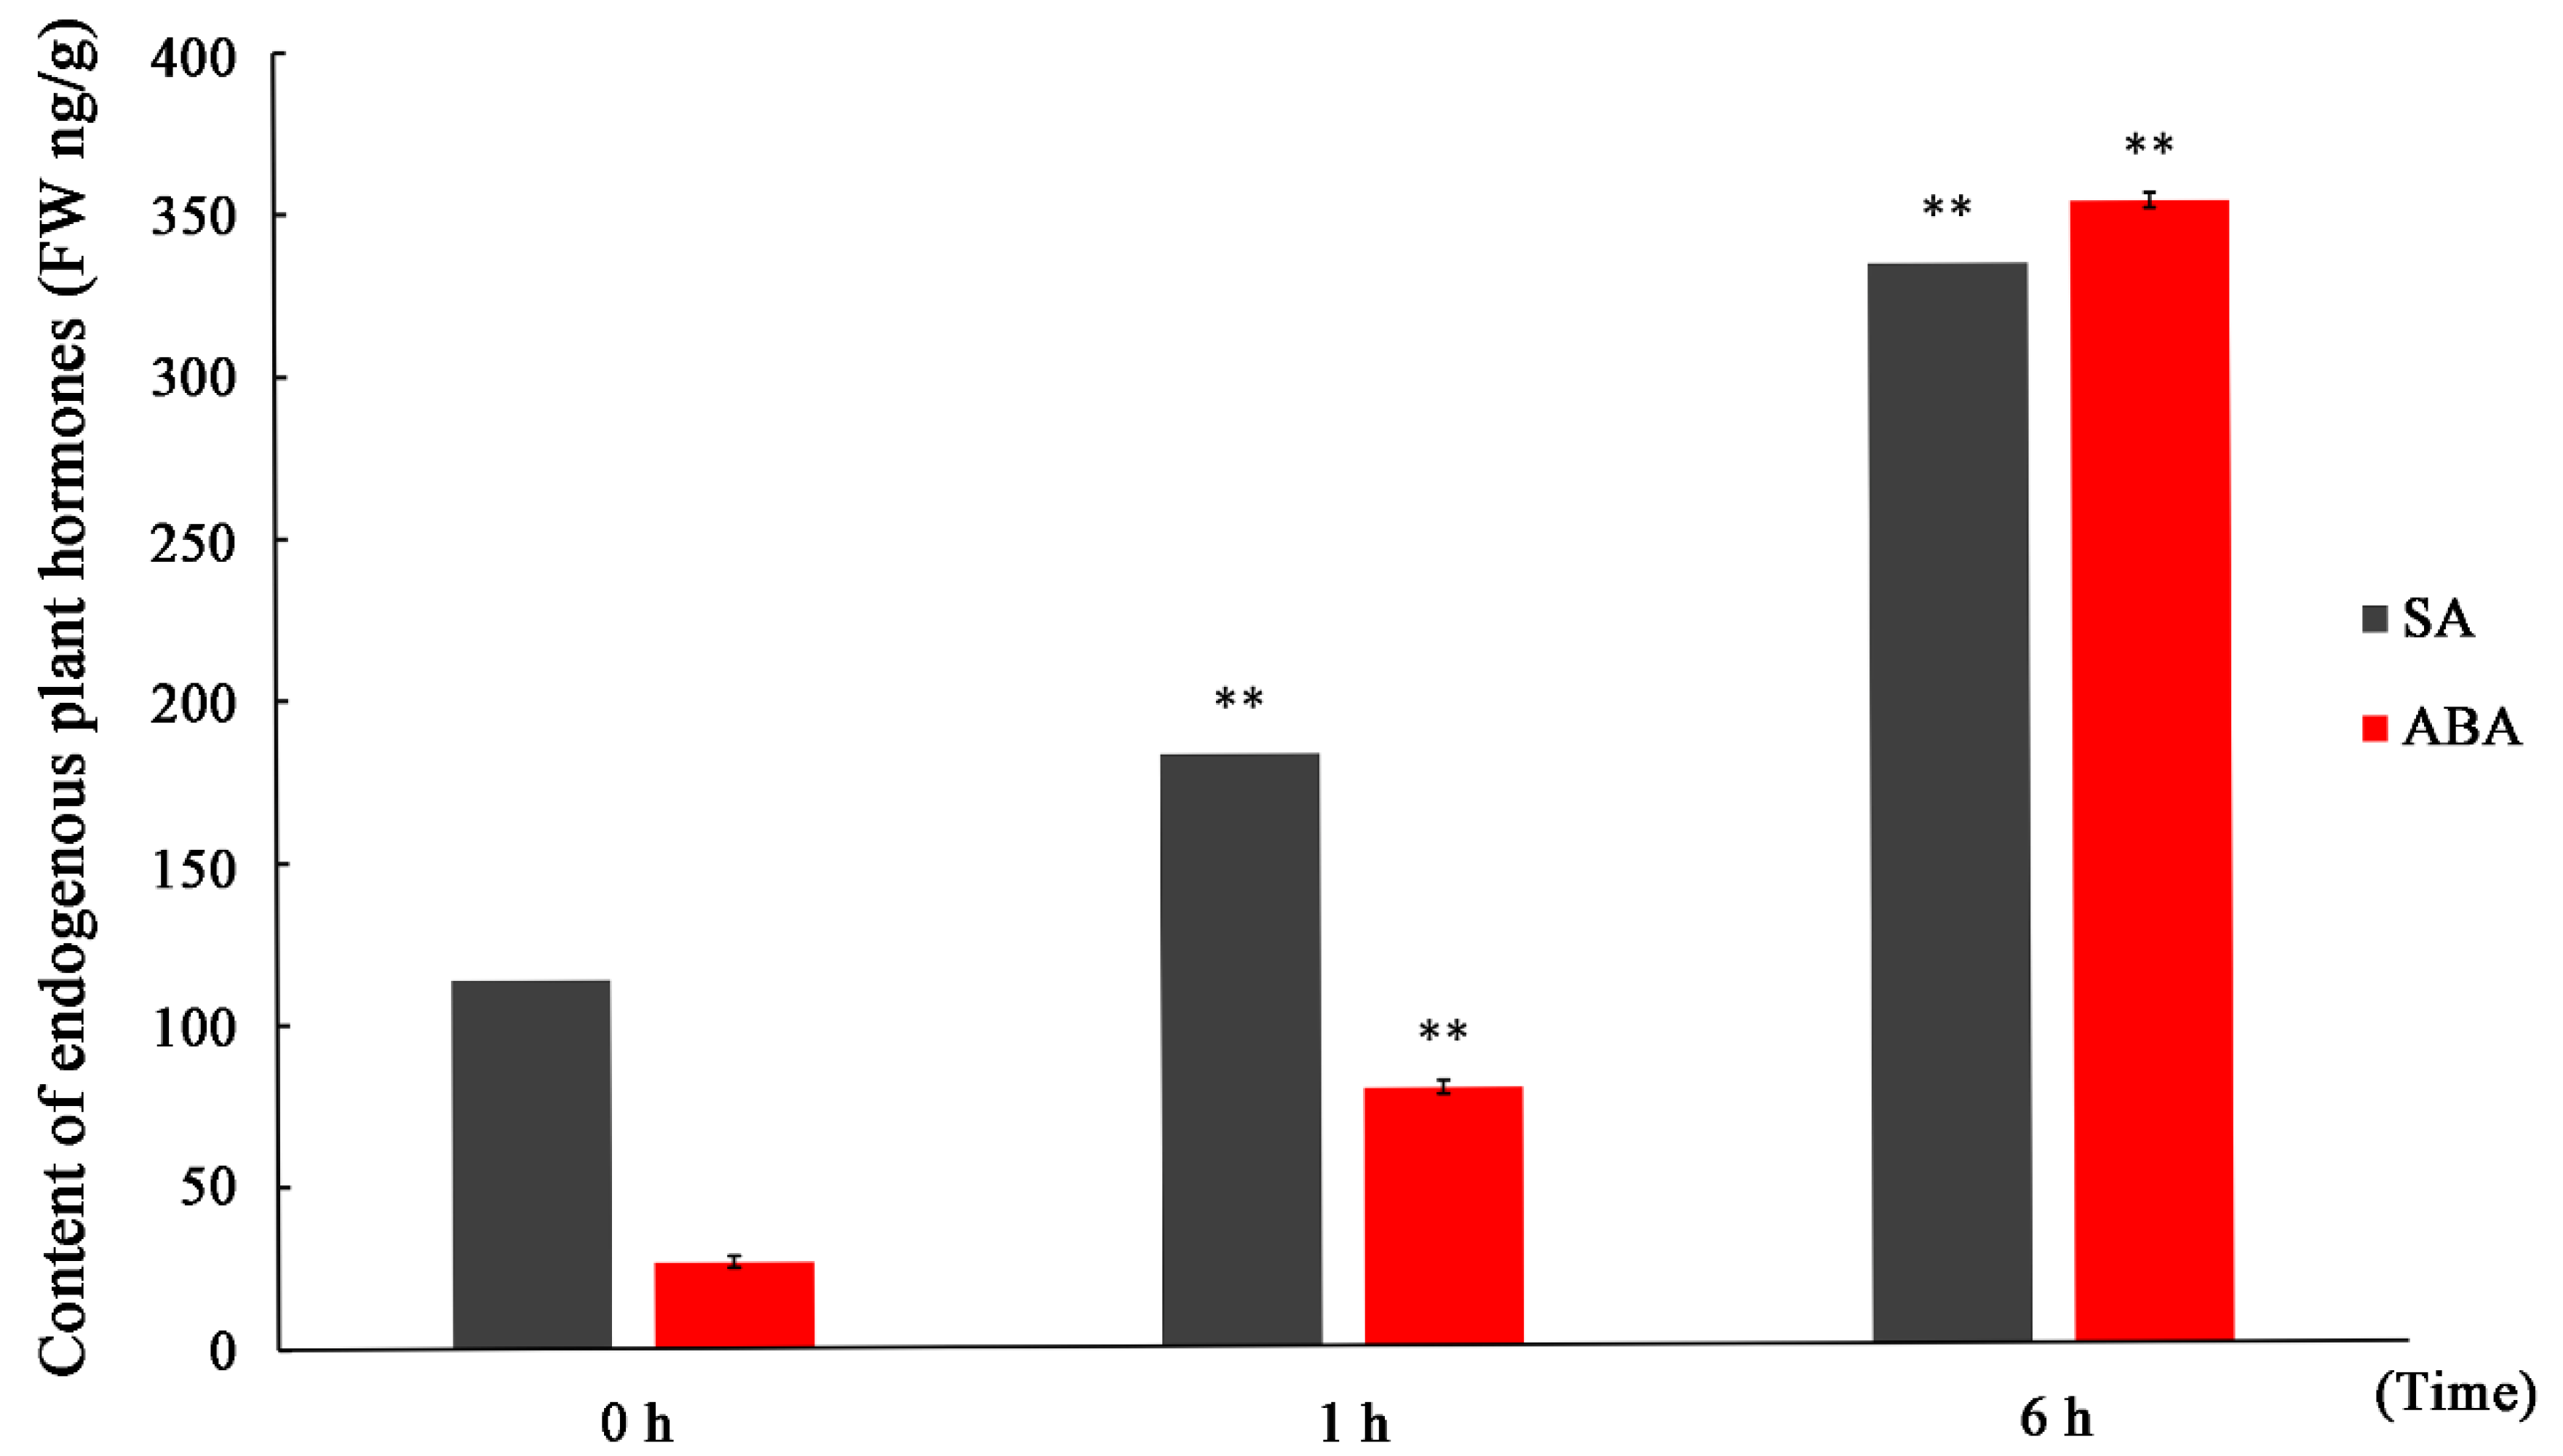
To illustrate the relationship between endogenous SA and salt stress, we evaluated the SA content by UPLC-MS/MS after short-term salt treatment. Given that ABA has been shown to be involved in the adaptation to environmental stresses, it was used as a reference phytohormone in the measurement. UPLC- MS/MS was used for the quantitative profiling of SA and ABA contents in P. euphratica leaves. Figure 1 shows the SA and ABA content results of a typical MRM chromatogram of internal standard solution and sample under control calculated by Analyst® 1.5 software (Agilent Technologies Inc., Santa Clara, CA, USA). Their internal standard is shown in Figure S1. For the quantitative analysis of SA and ABA, their contents under salt treatment at different time points were calculated by comparing with their internal standards. Our results showed that the levels of SA and ABA increased significantly at 1 and 6 h after application of 300 mM NaCl, respectively. The SA and ABA contents were approximately 200 and 100 ng/g FW− at 1 h, respectively, and both reached a concentration of about 350 ng/g FW−a at 6 h. This result indicated that the content of SA and ABA increased significantly during the first 6 h of salt treatment, but the rate of SA increased was lower than that of ABA.
3.2. Morphological and Physiological Response of SA Treatment to Salt Tolerance of P. euphratica Seedlings
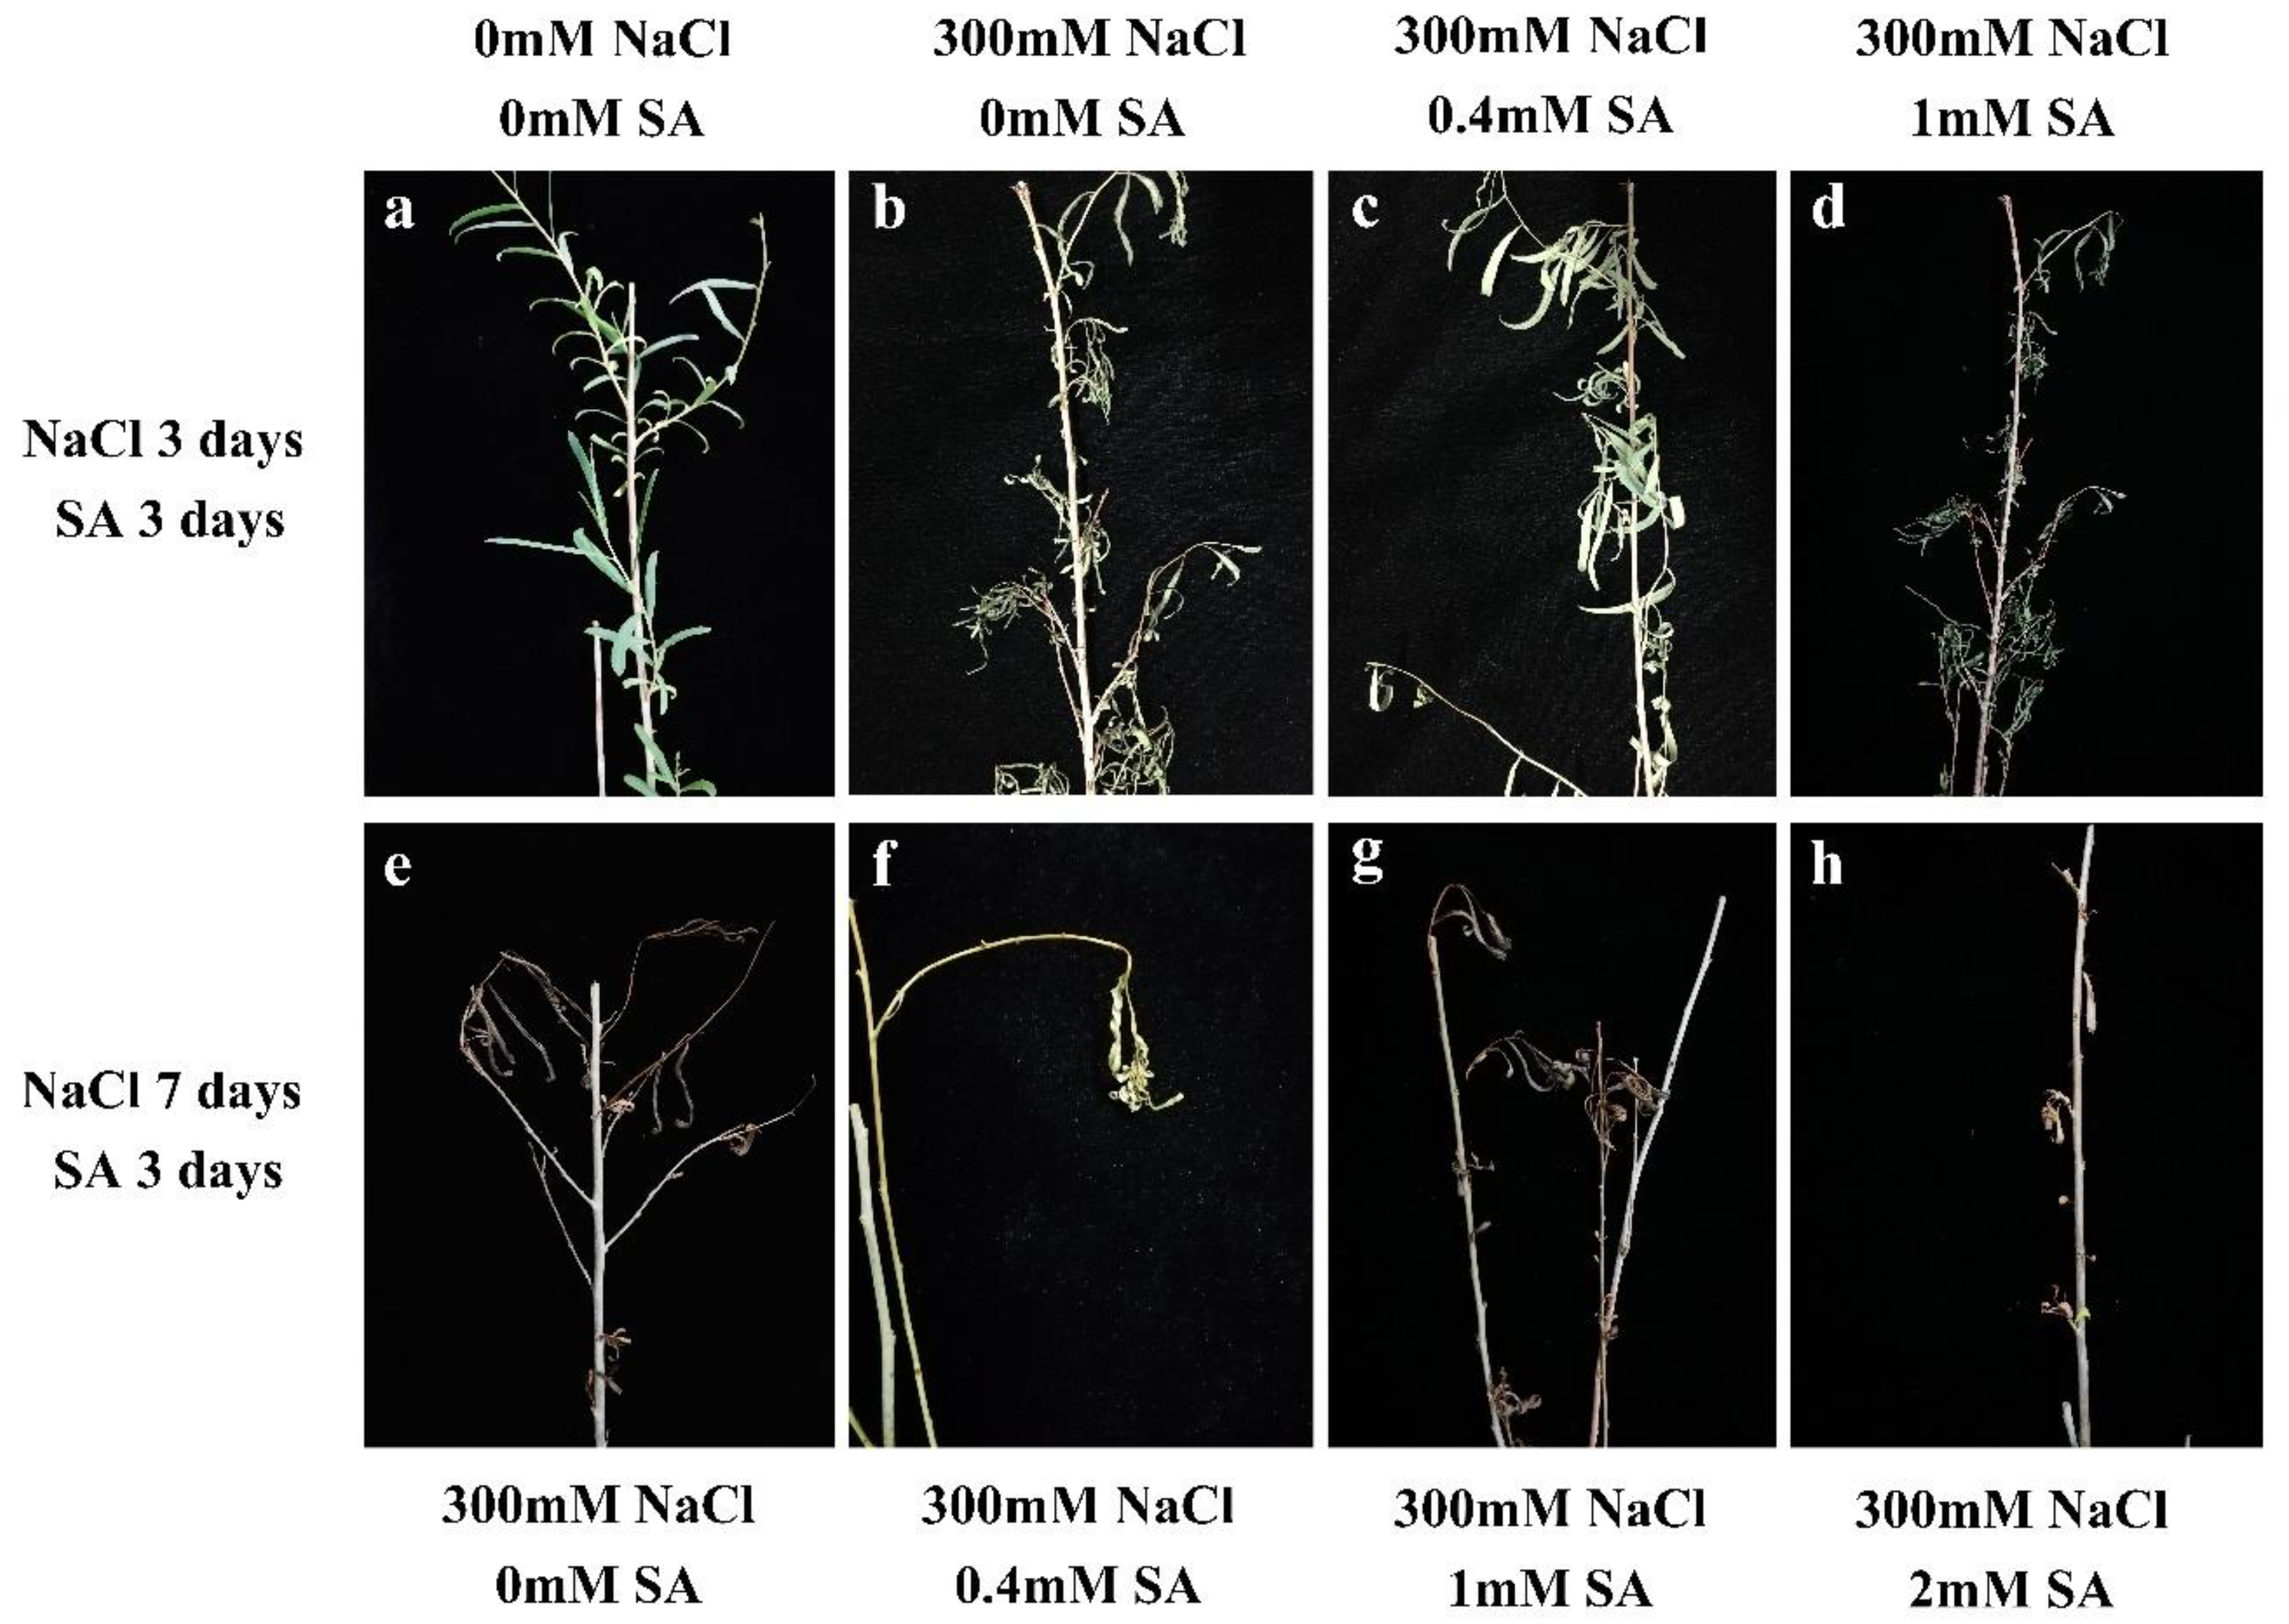
The general morphological traits of the plants at the end of the experiment are strongly dependent on the treatment. To demonstrate the relationship between SA pretreatment and salt stress response performance at the phenotypic and physiological level, we treated P. euphratica with SA concentration gradients of 0, 0.4, 1, and 2 mM, followed by a 300 mM NaCl treatment. When treated with 300 mM NaCl for 3 days, the leaves of P. euphratica showed obvious curl and chlorosis (Figure 2b). Most leaves of 0.4 mM SA-pretreated seedlings remained unfolded and green when treated with the same concentration of NaCl (Figure 2c). However, when the SA concentration was increased to 1 mM, the whole plant began to curl (Figure 2d). P. euphratica was treated continuously with 300 mM NaCl. After 7 days of 300 mM NaCl treatment, the leaves of P. euphratica seedlings without SA treatment withered (Figure 2e). Based on the phenotype, the 0.4 mM SA significantly alleviated the negative effect of salt stress (Figure 2f). Although the leaves became curly, they still remained green. The seedlings pretreated with 0.4 mM SA also displayed better performance than the seedlings treated with higher concentrations (1 mM and 2 mM) of SA (Figure 2g–h), indicating that moderate SA treatment on the phenotype could alleviate the damage caused by salt stress to P. euphratica.
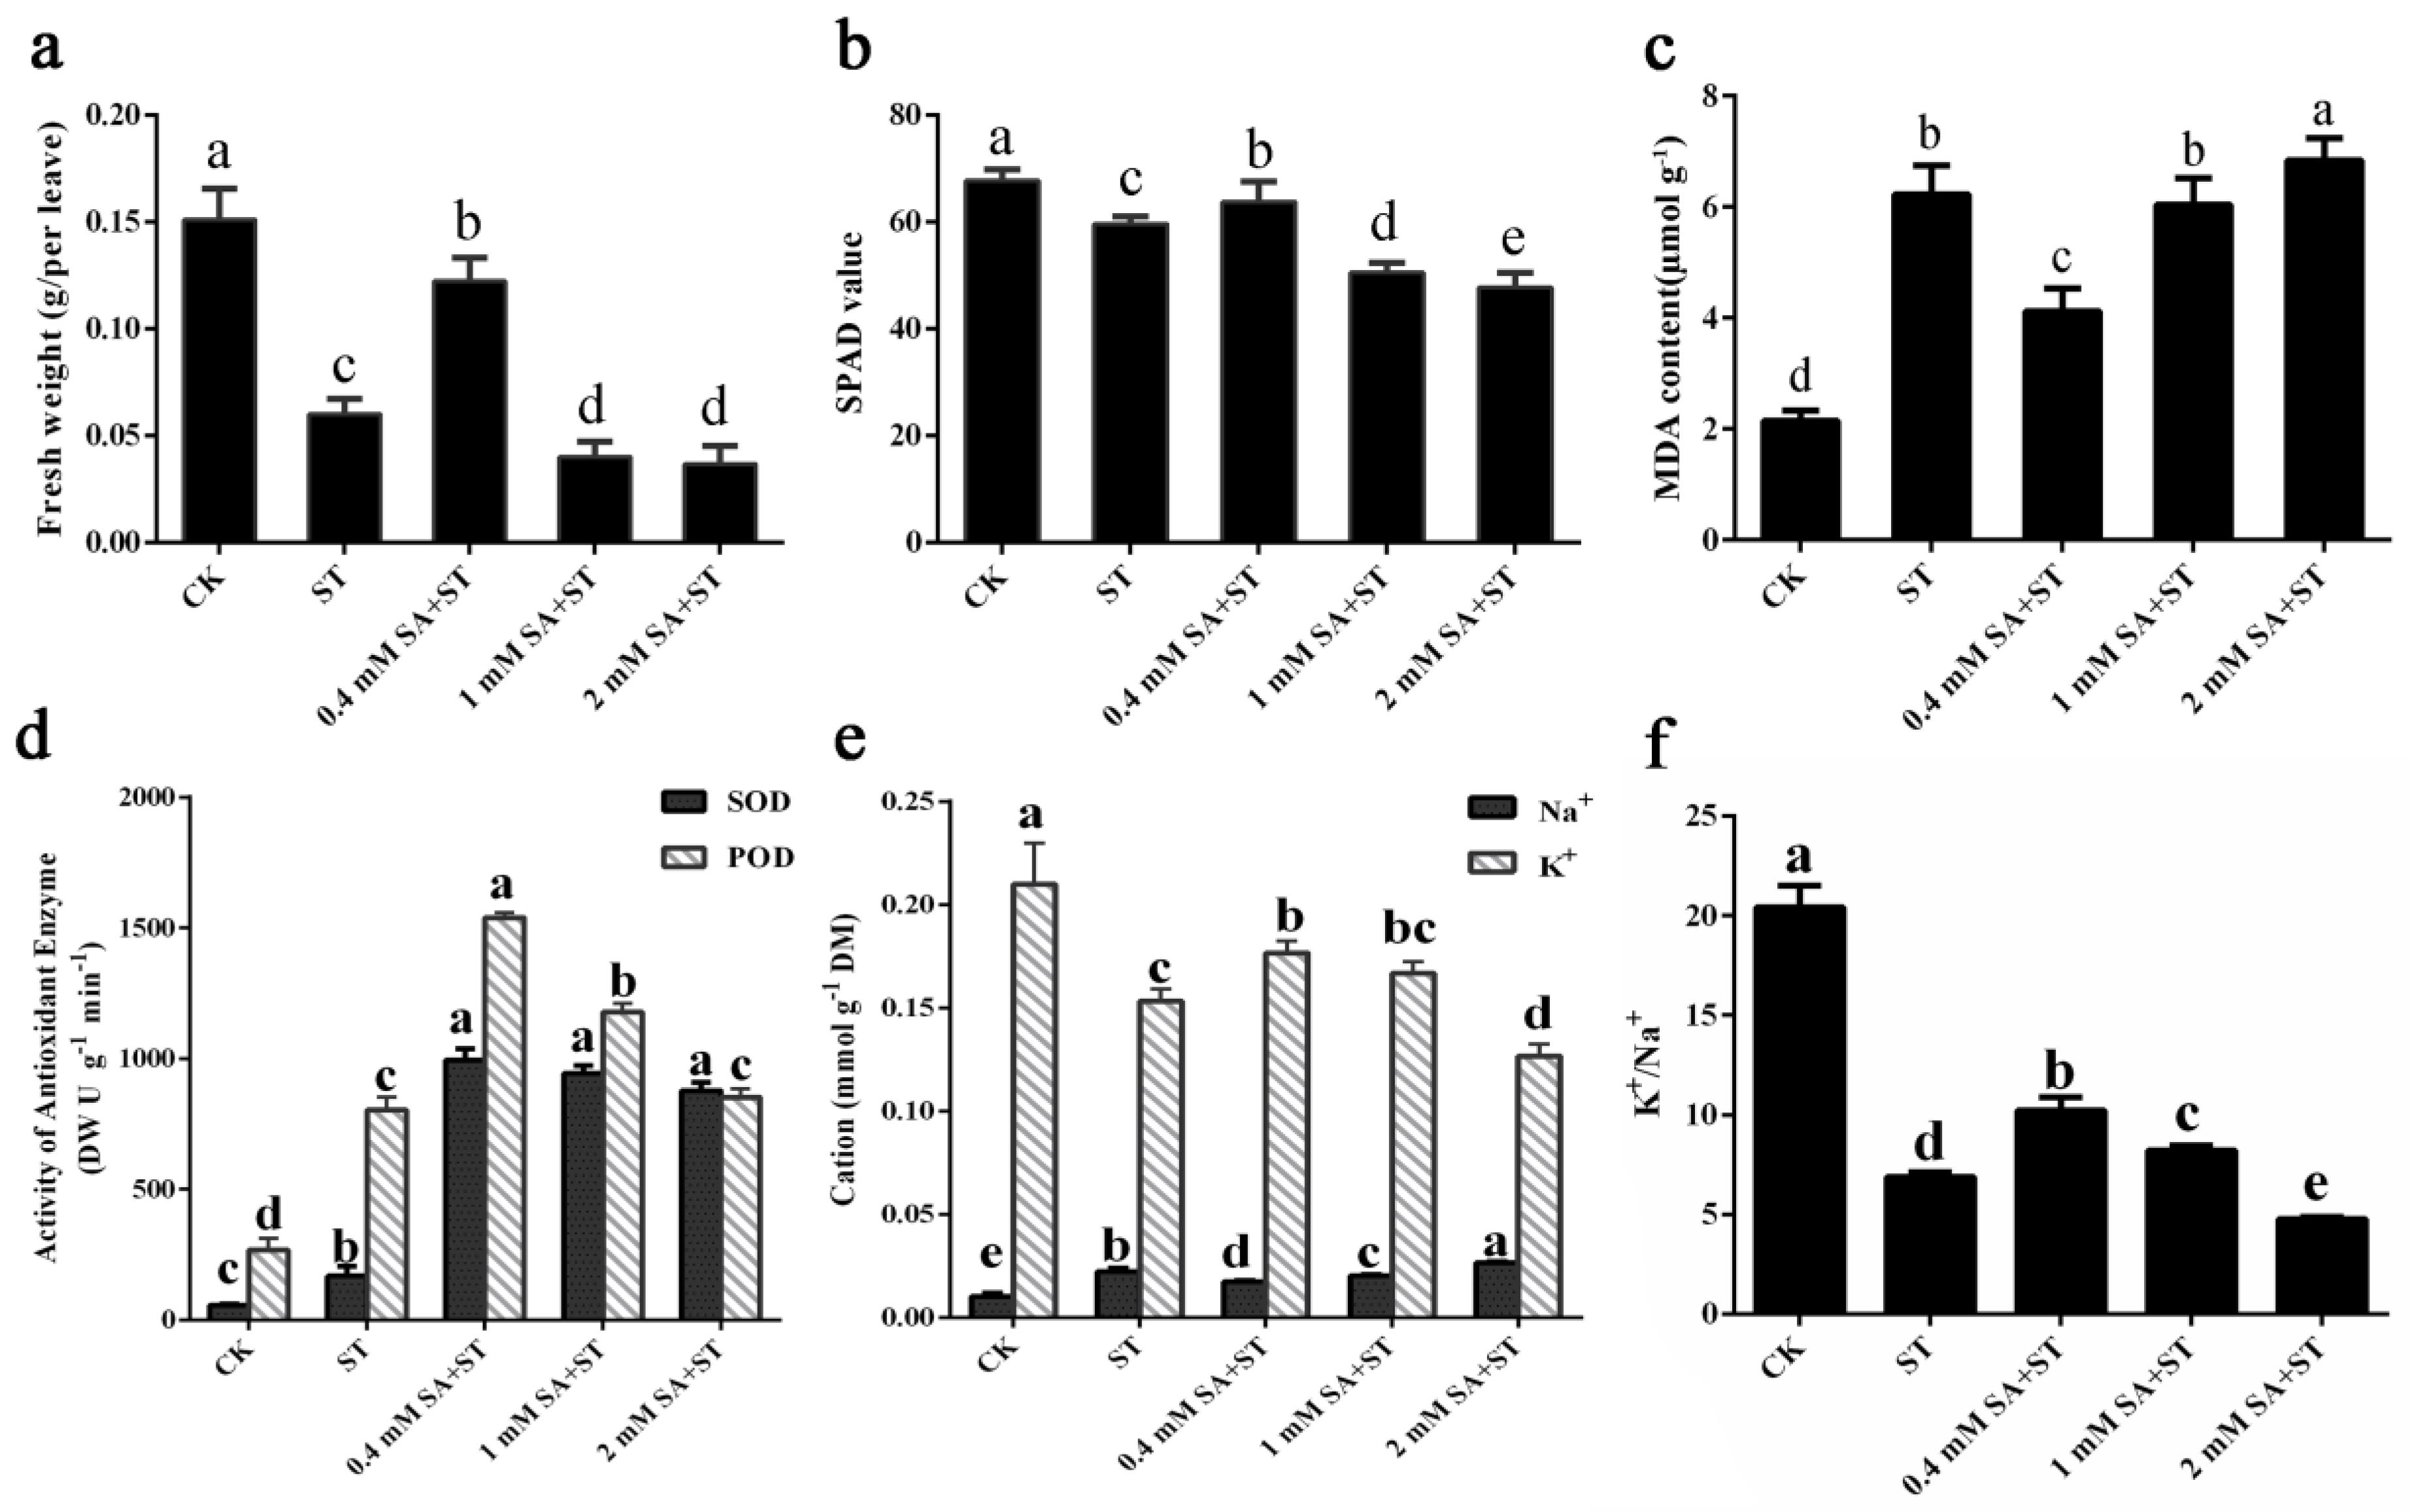
We further measured physiological indices of P. euphratica seedlings before and after salt treatment with or without SA pre-application. Overall, 0.4 mM SA-pretreated seedlings exhibited less chlorosis and relatively increased total FW after 3 days of salt stress treatment compared to the salt only treated group. The total FW in the 0.4 mM SA + salt treatment group for 3 days was very close to the untreated control, and it was 48.3%, 28.3%, and 30.8% higher than those in the salt treatment—1 mM SA + salt pretreatment, and 2 mM SA + salt pretreatment groups, respectively (Figure 3a). The chlorophyll content in the 0.4 mM SA + salt treatment group was 29.9%, 28.3%, and 30.8% higher than those in the salt treatment, 1 mM SA + salt pretreatment, and 2 mM SA + salt pretreatment groups, respectively (Figure 3b). The phenotypic results were confirmed by MDA content measurement. As shown in Figure 3c, the MDA content was reduced significantly in 0.4 mM SA-treated samples compared with salt-treated and 1 or 2 mM SA-pretreated samples. Furthermore, a significant accumulation of MDA (over three times higher) was observed in the 2 mM pretreatment + 300 mM NaCl treatment samples compared with direct salt treatment, indicating that when the concentration of SA exceeded a certain range, it would cause damage to the plants. The results showed that salinity caused membrane damage to P. euphratica seedlings. The oxidative damage of plasma membrane was alleviated with the addition of 0.4 mM exogenous SA, but not with 1 or 2 mM SA. Therefore, the application of appropriate concentrations of exogenous SA could ameliorate membrane deterioration under salt stress and facilitate the maintenance of membrane functions in P. euphratica.
3.3. Antioxidant Enzyme and Ion Contents of P. euphratica under Salt Stress and SA Treatments
POD and SOD are crucial antioxidants that can scavenge reactive oxygen species (ROS). Thus, we detected the activities of these two enzymes in P. euphratica seedlings before and after salt treatment with or without SA pre-application. The results indicated that the activity levels of POD and SOD were dramatically elevated in seedlings suffering salt stress in comparison to those growing under normal growth conditions (Figure 3d). The SOD and POD activities in P. euphratica were also significantly affected by SA pretreatment. SOD was increased more than threefold under the SA-pretreated compared with the only salt-treated conditions, but the difference between the 0.4 mM SA + salt treatment and the 1 or 2 mM SA + salt treatment groups was not significant (Figure 3d). In addition, POD was increased by 92.1% (p < 0.05) and 48.6% under 0.4 or 1 mM SA + NaCl conditions, respectively, compared with the only salt treated plants. However, when pretreated with 2 mM SA, the POD activity of seedlings decreased to a level similar to that of seedlings treated only with salt (Figure 3d). The SOD and POD activities of plants treated with 0.4 mM SA were both enhanced to a high level compared with those of non-SA-treated plants under salt stress.
After 3 days of salt treatment, K+ content in leaves of P. euphratica seedlings was significantly lower, while Na+ content was significantly higher than that of the control (Figure 3e). When pretreated with 0.4 and 1 mM SA, K+ content increased significantly compared with only salt treated seedlings, but it was still lower than that of control plants (Figure 3e). As for 2 mM SA pretreated seedlings, K+ content decreased to the lowest level while the Na+ content reached the highest level. The lowest Na+ content and the highest K+/ Na+ were shown in 0.4 mM SA pretreated group (Figure 3 e–f). The results showed that moderate concentration of SA pretreatment play an important role in the balance of K+ and Na+ in P. euphratica.
3.4. Analysis and Mapping to Transcriptome Sequencing
Leaves from non-SA-pretreated salt control and 0.4 mM SA-pretreated plants were sampled. Their cDNAs were prepared and sequenced independently for three replicates. The cDNA libraries were sequenced using Illumina HiSeq 2000™. Raw data were deposited in the National Center for Biotechnology Information (NCBI) database under the accession number PRJNA503730. After trimming of the sequencing reads containing low-quality, adaptor-polluted and ambiguous reads, 13.70 Gb clean bases from all samples remained for transcriptome assembly. To elucidate the potential molecular events of the DEG profiles, all clean reads were aligned with the reference P. euphratica genome database (GCF_000495115.1_PopEup_1.0). All groups were able to map more than 90% sequences to the genome, and more than 70% of the distinct tags were uniquely mapped to the reference sequence. The length distribution of all transcripts is shown in Figure S2. The correlation of the three replicates of the gene expression in the control and SA-pretreated samples was higher than 0.99, indicating that the sequencing results were well reproducible (Figure S3).
3.5. Functional Analysis of DEGs
To investigate changes in transcription levels caused by SA pretreatment, we analyzed DEGs between SA-pretreated and untreated samples. According to the FPKM value of unigenes, we detected 5537 upregulated and 2231 downregulated unigenes (Table S1), as well as 552 unannotated novel DEGs between the only salt-treated and SA-pretreated groups (Table S2). The differential genes between the SA-pretreated and untreated groups were functionally classified by Gene Ontology (GO) and Kyoto Encyclopedia of Genes and Genomes (KEGG) analyses.
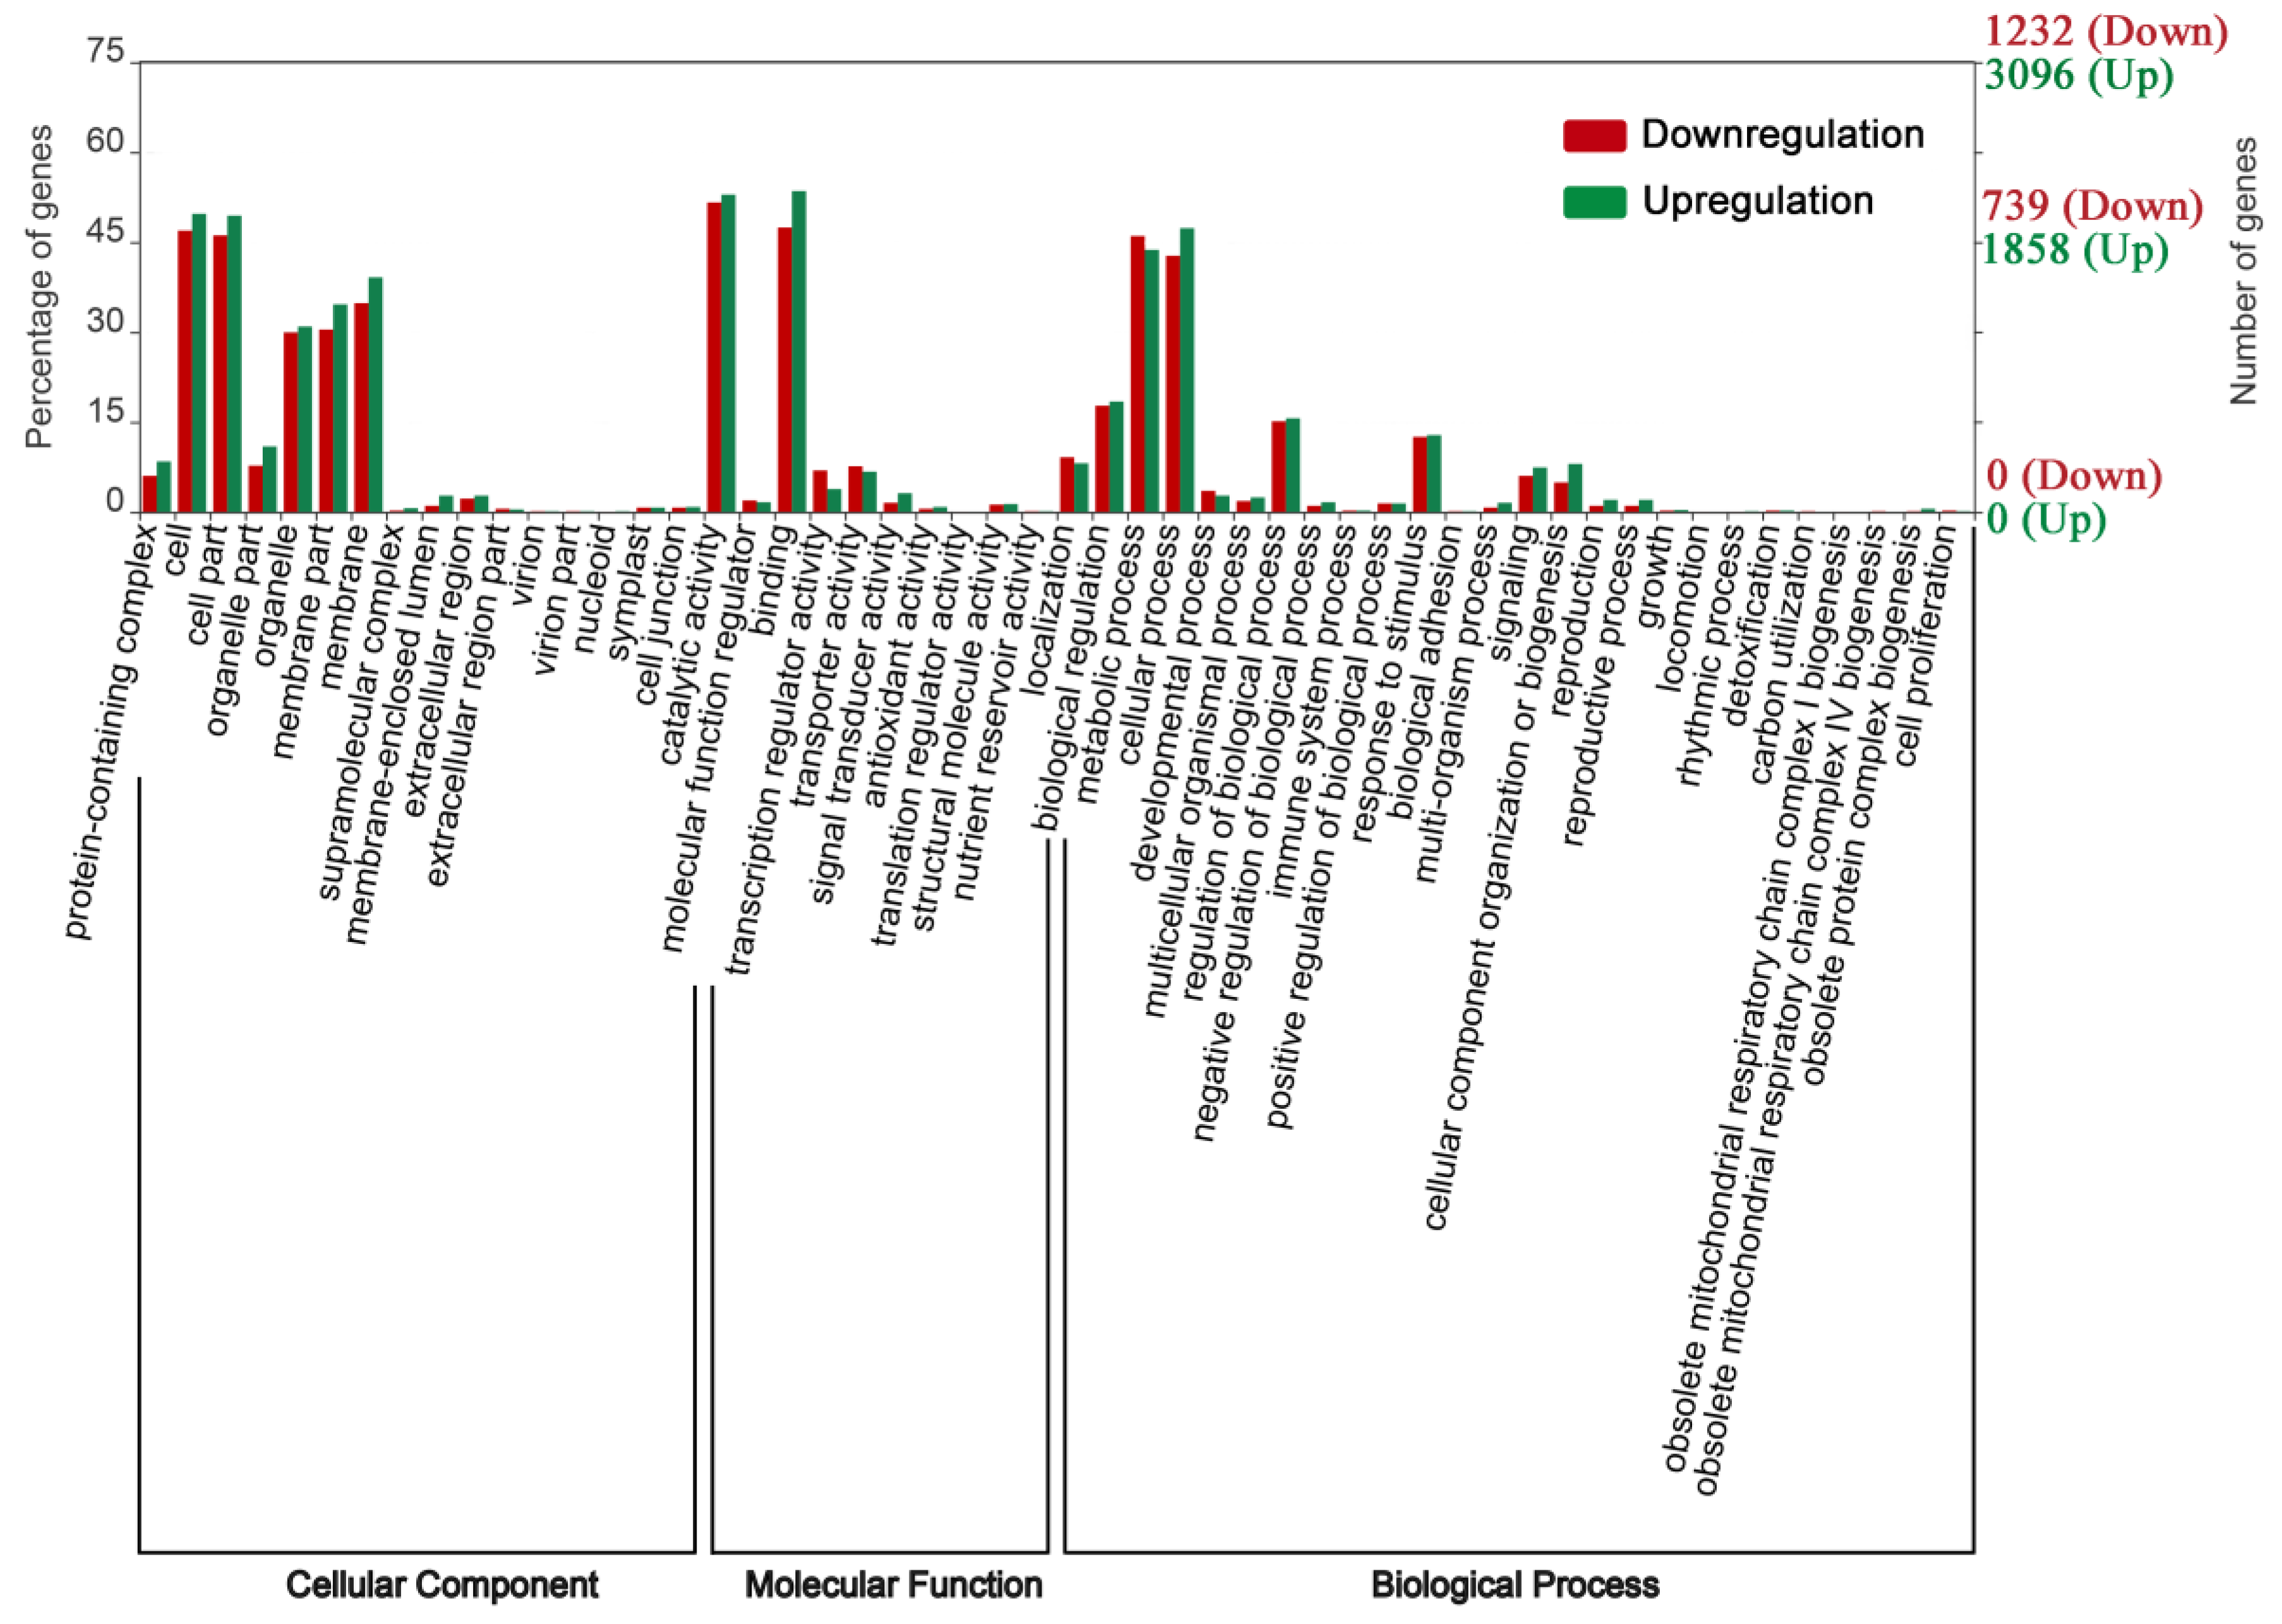
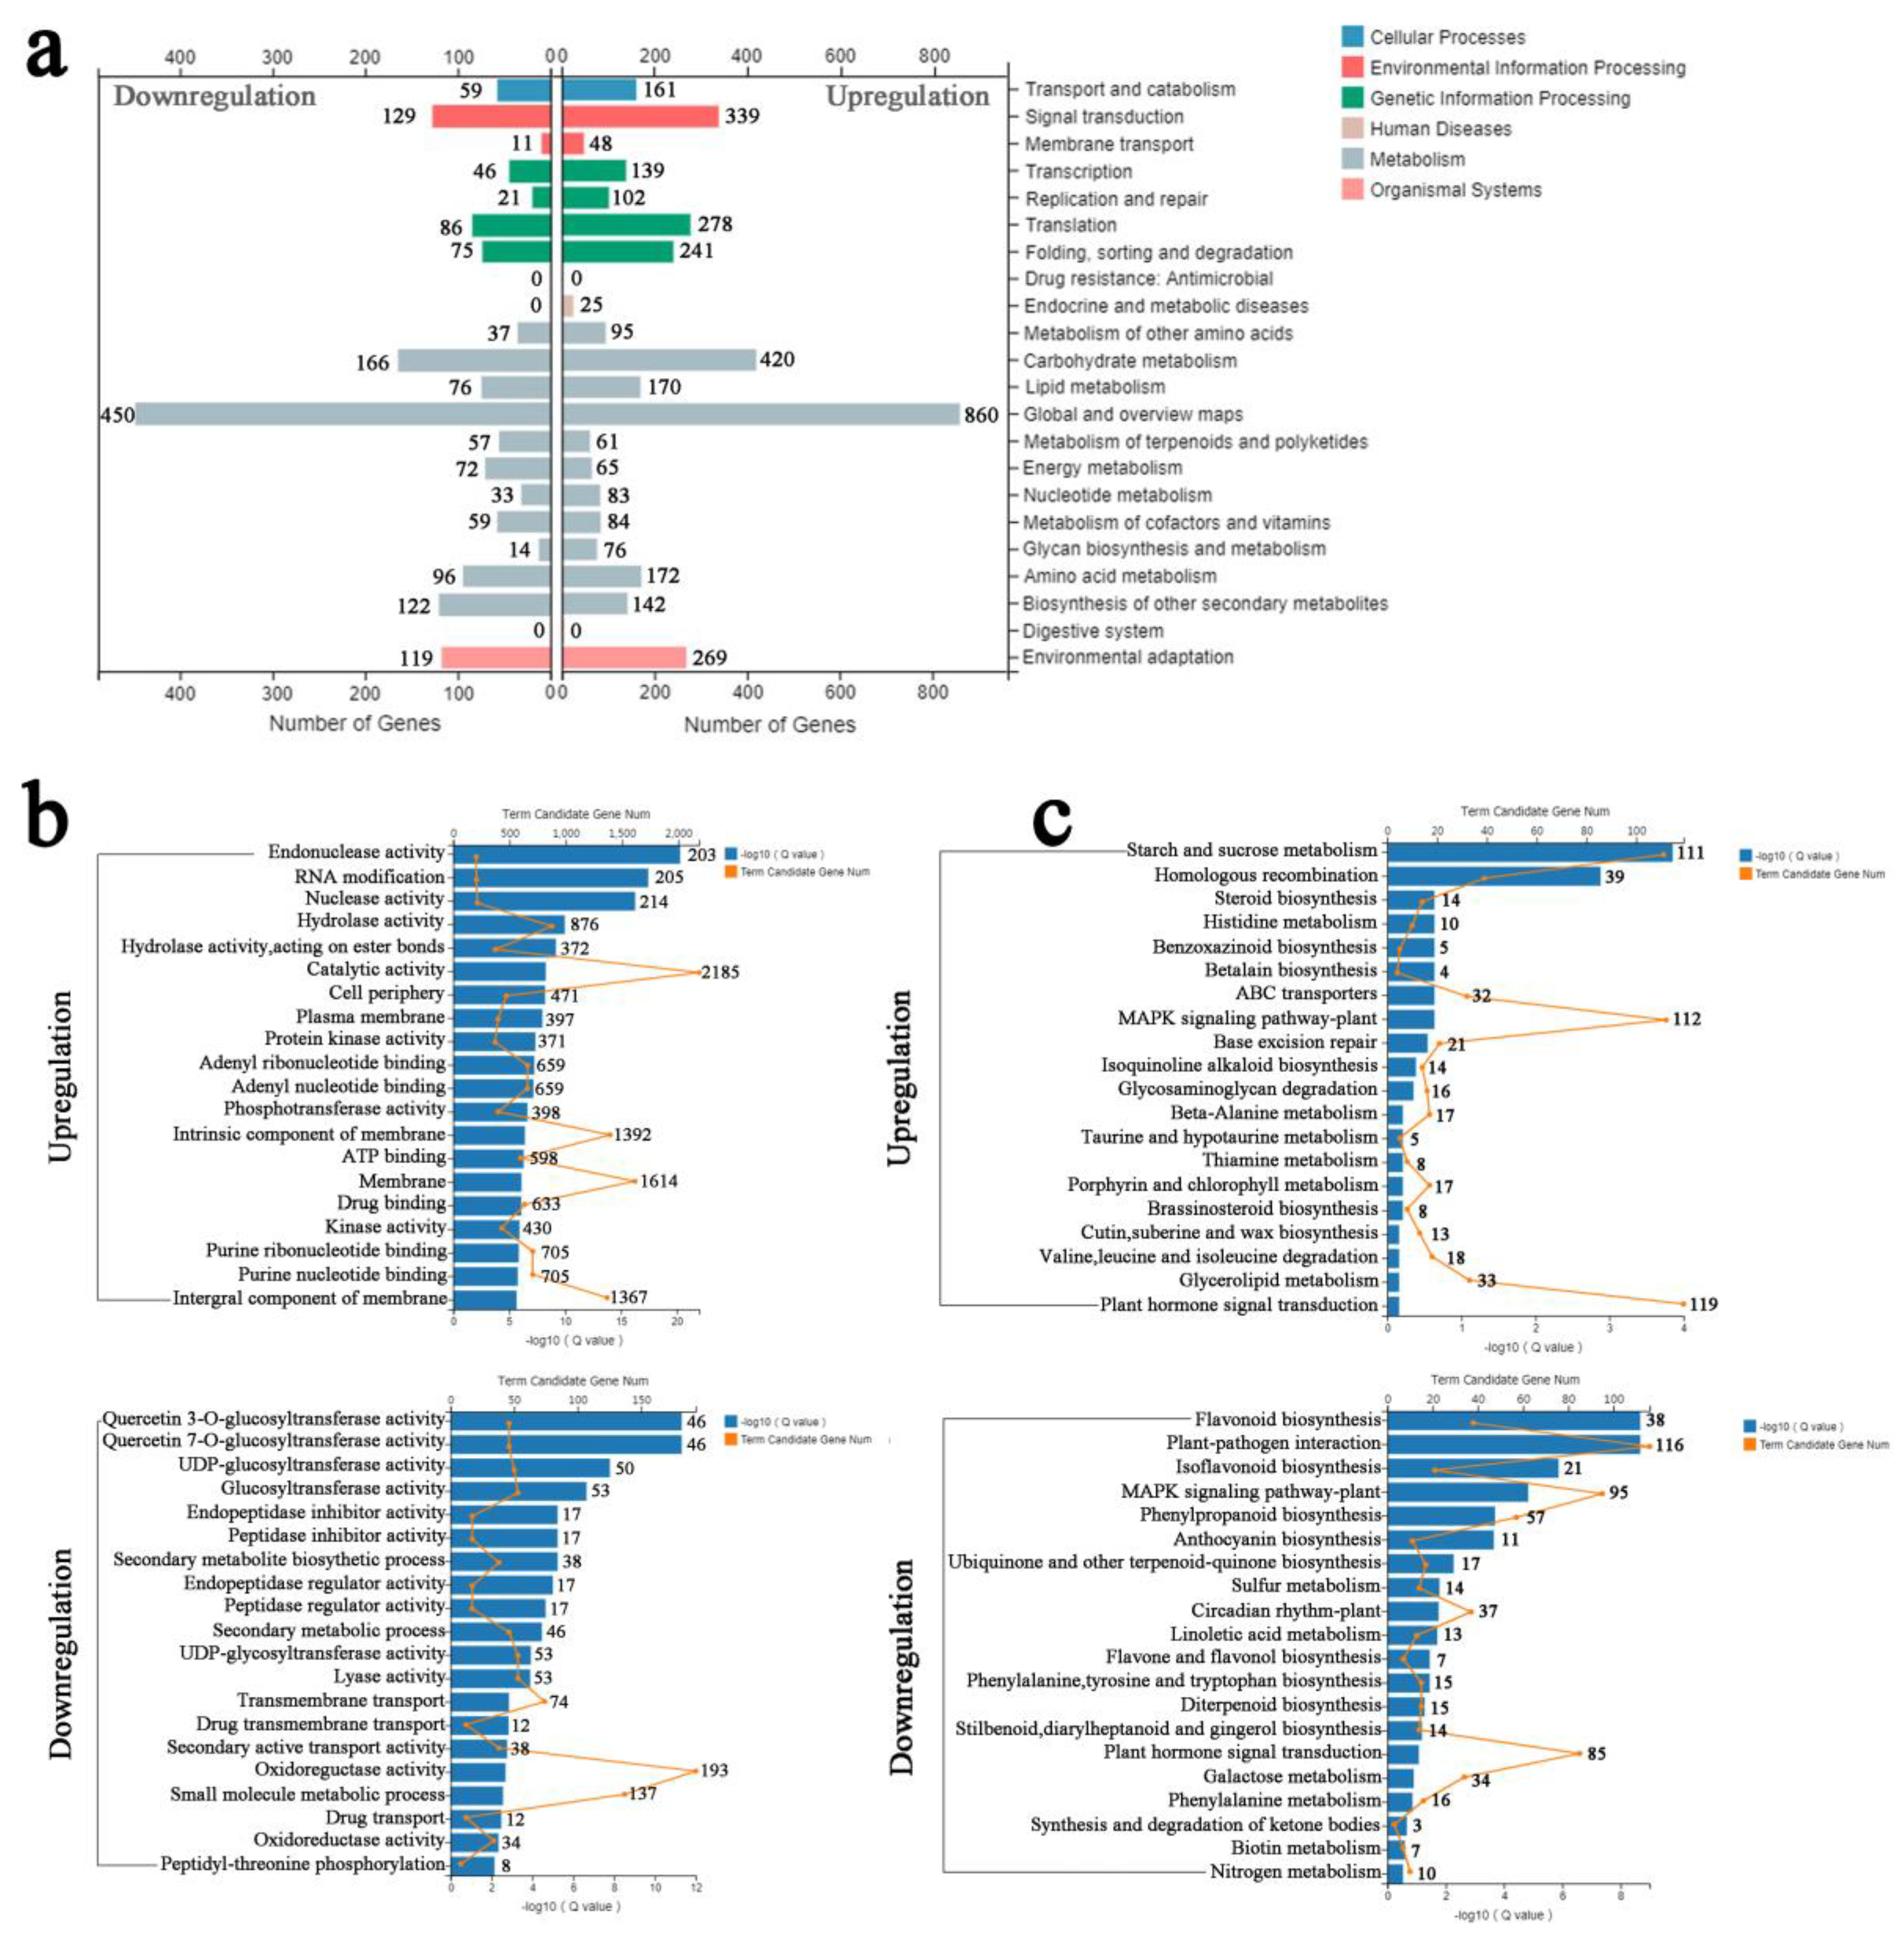
We used hypergeometric testing to determine the results of up- and downregulation of significantly enriched GO categories compared with the genomic background (p ≤ 0.05, after Bonferroni correction) by three ontology categories, including molecular function, cellular components, and biological processes (Figure 4). The top five GO terms for biological processes were “cellular process,” “metabolic process,” “regulation of biological process,” “response to stimulus process,” and “biological regulation” after SA and salt treatment. Most of the cellular components and molecular functions were mapped to the “catalytic activity,” “binding,” “cell,” and “cell part.” To understand the functional classification of DEGs, GO class enrichment analysis was performed using FDR with an adjusted p value ≤ 0.05 as cutoff value. Among the enriched GO terms, “catalytic activity” and “protein kinase activity” have a high number of upregulated DEGs and may play a very important role in regulating signal transduction (Figure 5b). SA pretreatment to alleviate salt stress may be significantly upregulated by the expression of some protein kinase genes, which enhance the ability to catalyze protein phosphorylation, resulting in changes in ion channel proteins and channel gates.
Furthermore, according to the KEGG pathway database, the upregulated and downregulated DEGs were separately classified. A total of 269 upregulated and 119 downregulated DEGs were involved in the “environmental adaptation” approach with 339 upregulated and 129 downregulated DEGs involved in the “signal transduction” pathway, which indicated that many SA-induced genes are involved in signal transduction and environmental stress response in P. euphratica (Figure 5a). When FDR ≤ 0.01, the KEGG term was regarded as significantly enriched. As a result, the upregulated DEGs produced by SA pretreatment were mainly enriched in “starch and sucrose metabolism,” “mitogen-activated protein kinase (MAPK) signaling pathway-plant,” and “plant hormone signal transduction,” indicating that genes related to MAPK signaling and phytohormone signal transduction pathway were significantly upregulated after SA pretreatment. Application of SA may enhance the salt tolerance of plants by regulating the MAPK signaling pathway and plant hormone signaling pathways (Figure 5c).
3.6. Expression of TF Regulates SA to Confer Salt Tolerance
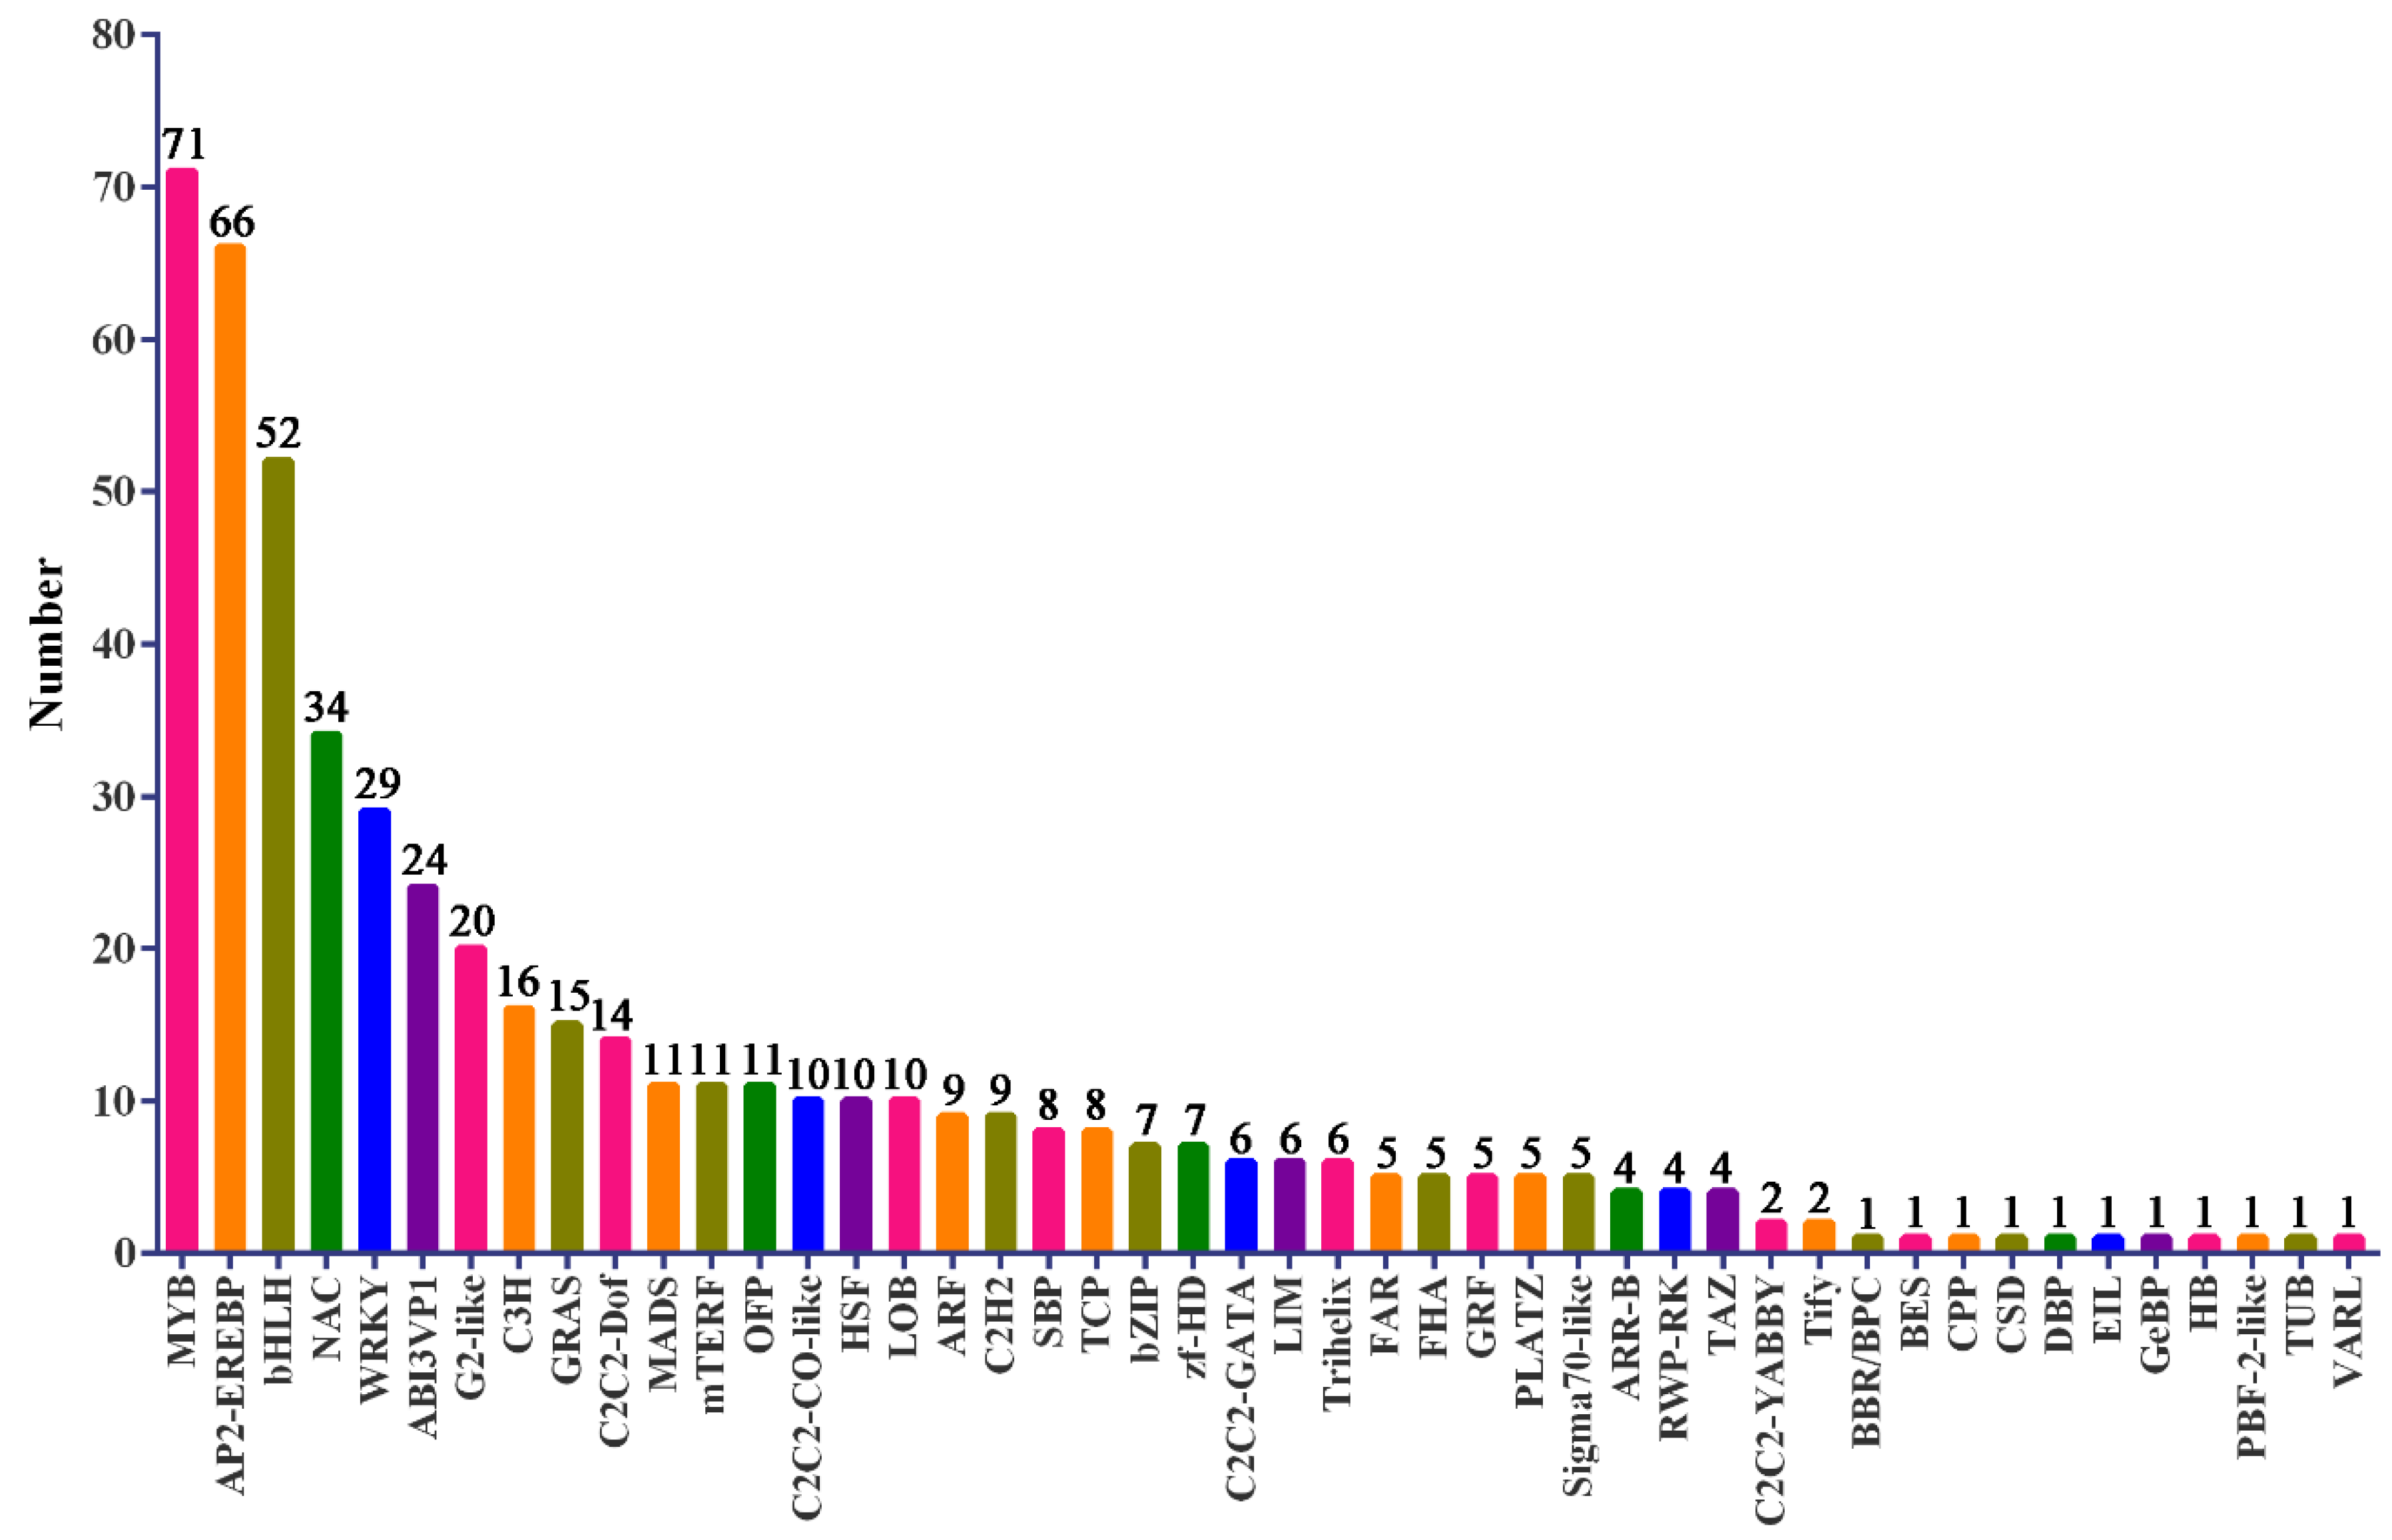
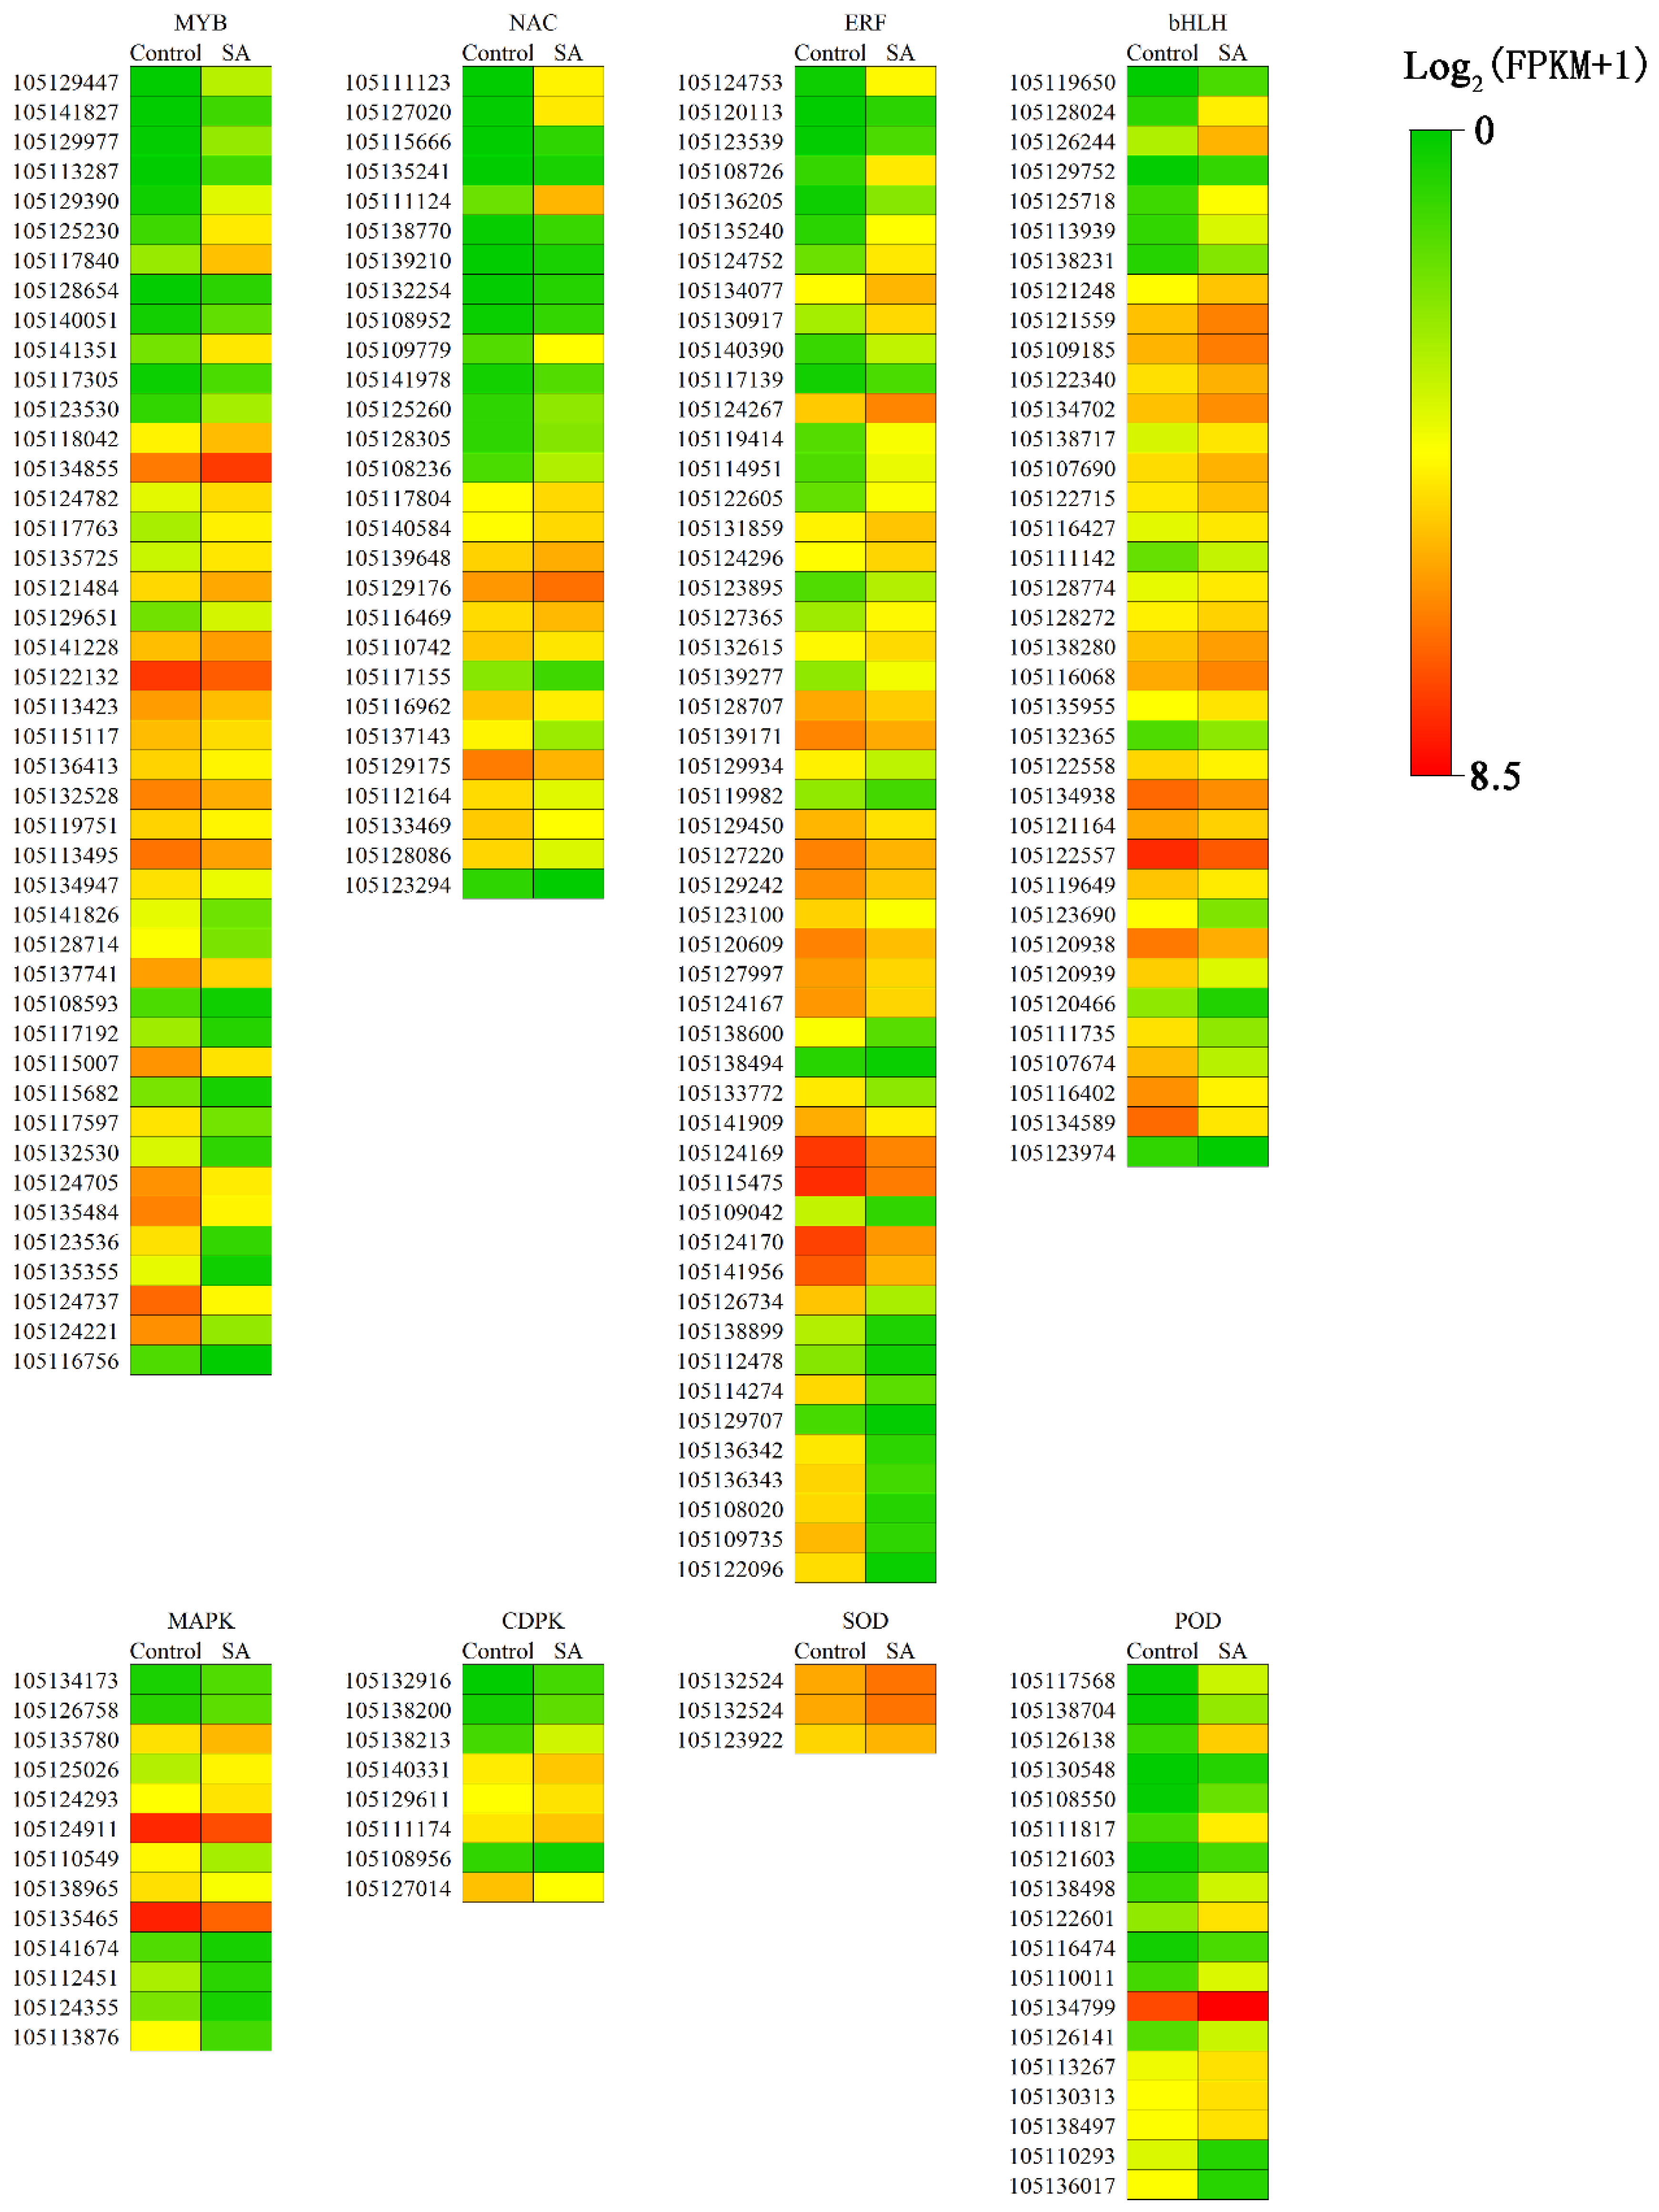
The TF is a trans-acting factor that interacts with cis-factors to enhance or inhibit gene expression and regulates plant growth and development and response to the external environment. Family prediction and classification of TFs revealed that MYB, AP2-EREBP, bHLH, NAC, and WRKY were the top five TF families, accounting for 50% of the total TFs that were differentially expressed between control and SA-pretreated samples (Figure 6). This result indicated that MYB, AP2-EREBP, bHLH, NAC, and WRKY TFs play a leading role in the alleviation of salt stress in P. euphratica by SA. Based on the results of GO and KEGG analysis combined with the analysis of TFs, DEGs under SA treatment were mainly located in pathways related to signal transduction. A heat map analysis was performed on the top 4 TFs, protein kinases, PODs, and ion transport-related genes (Figure 7).
3.7. Confirmation of Differentially Expressed Candidate Genes by qRT-PCR Analysis
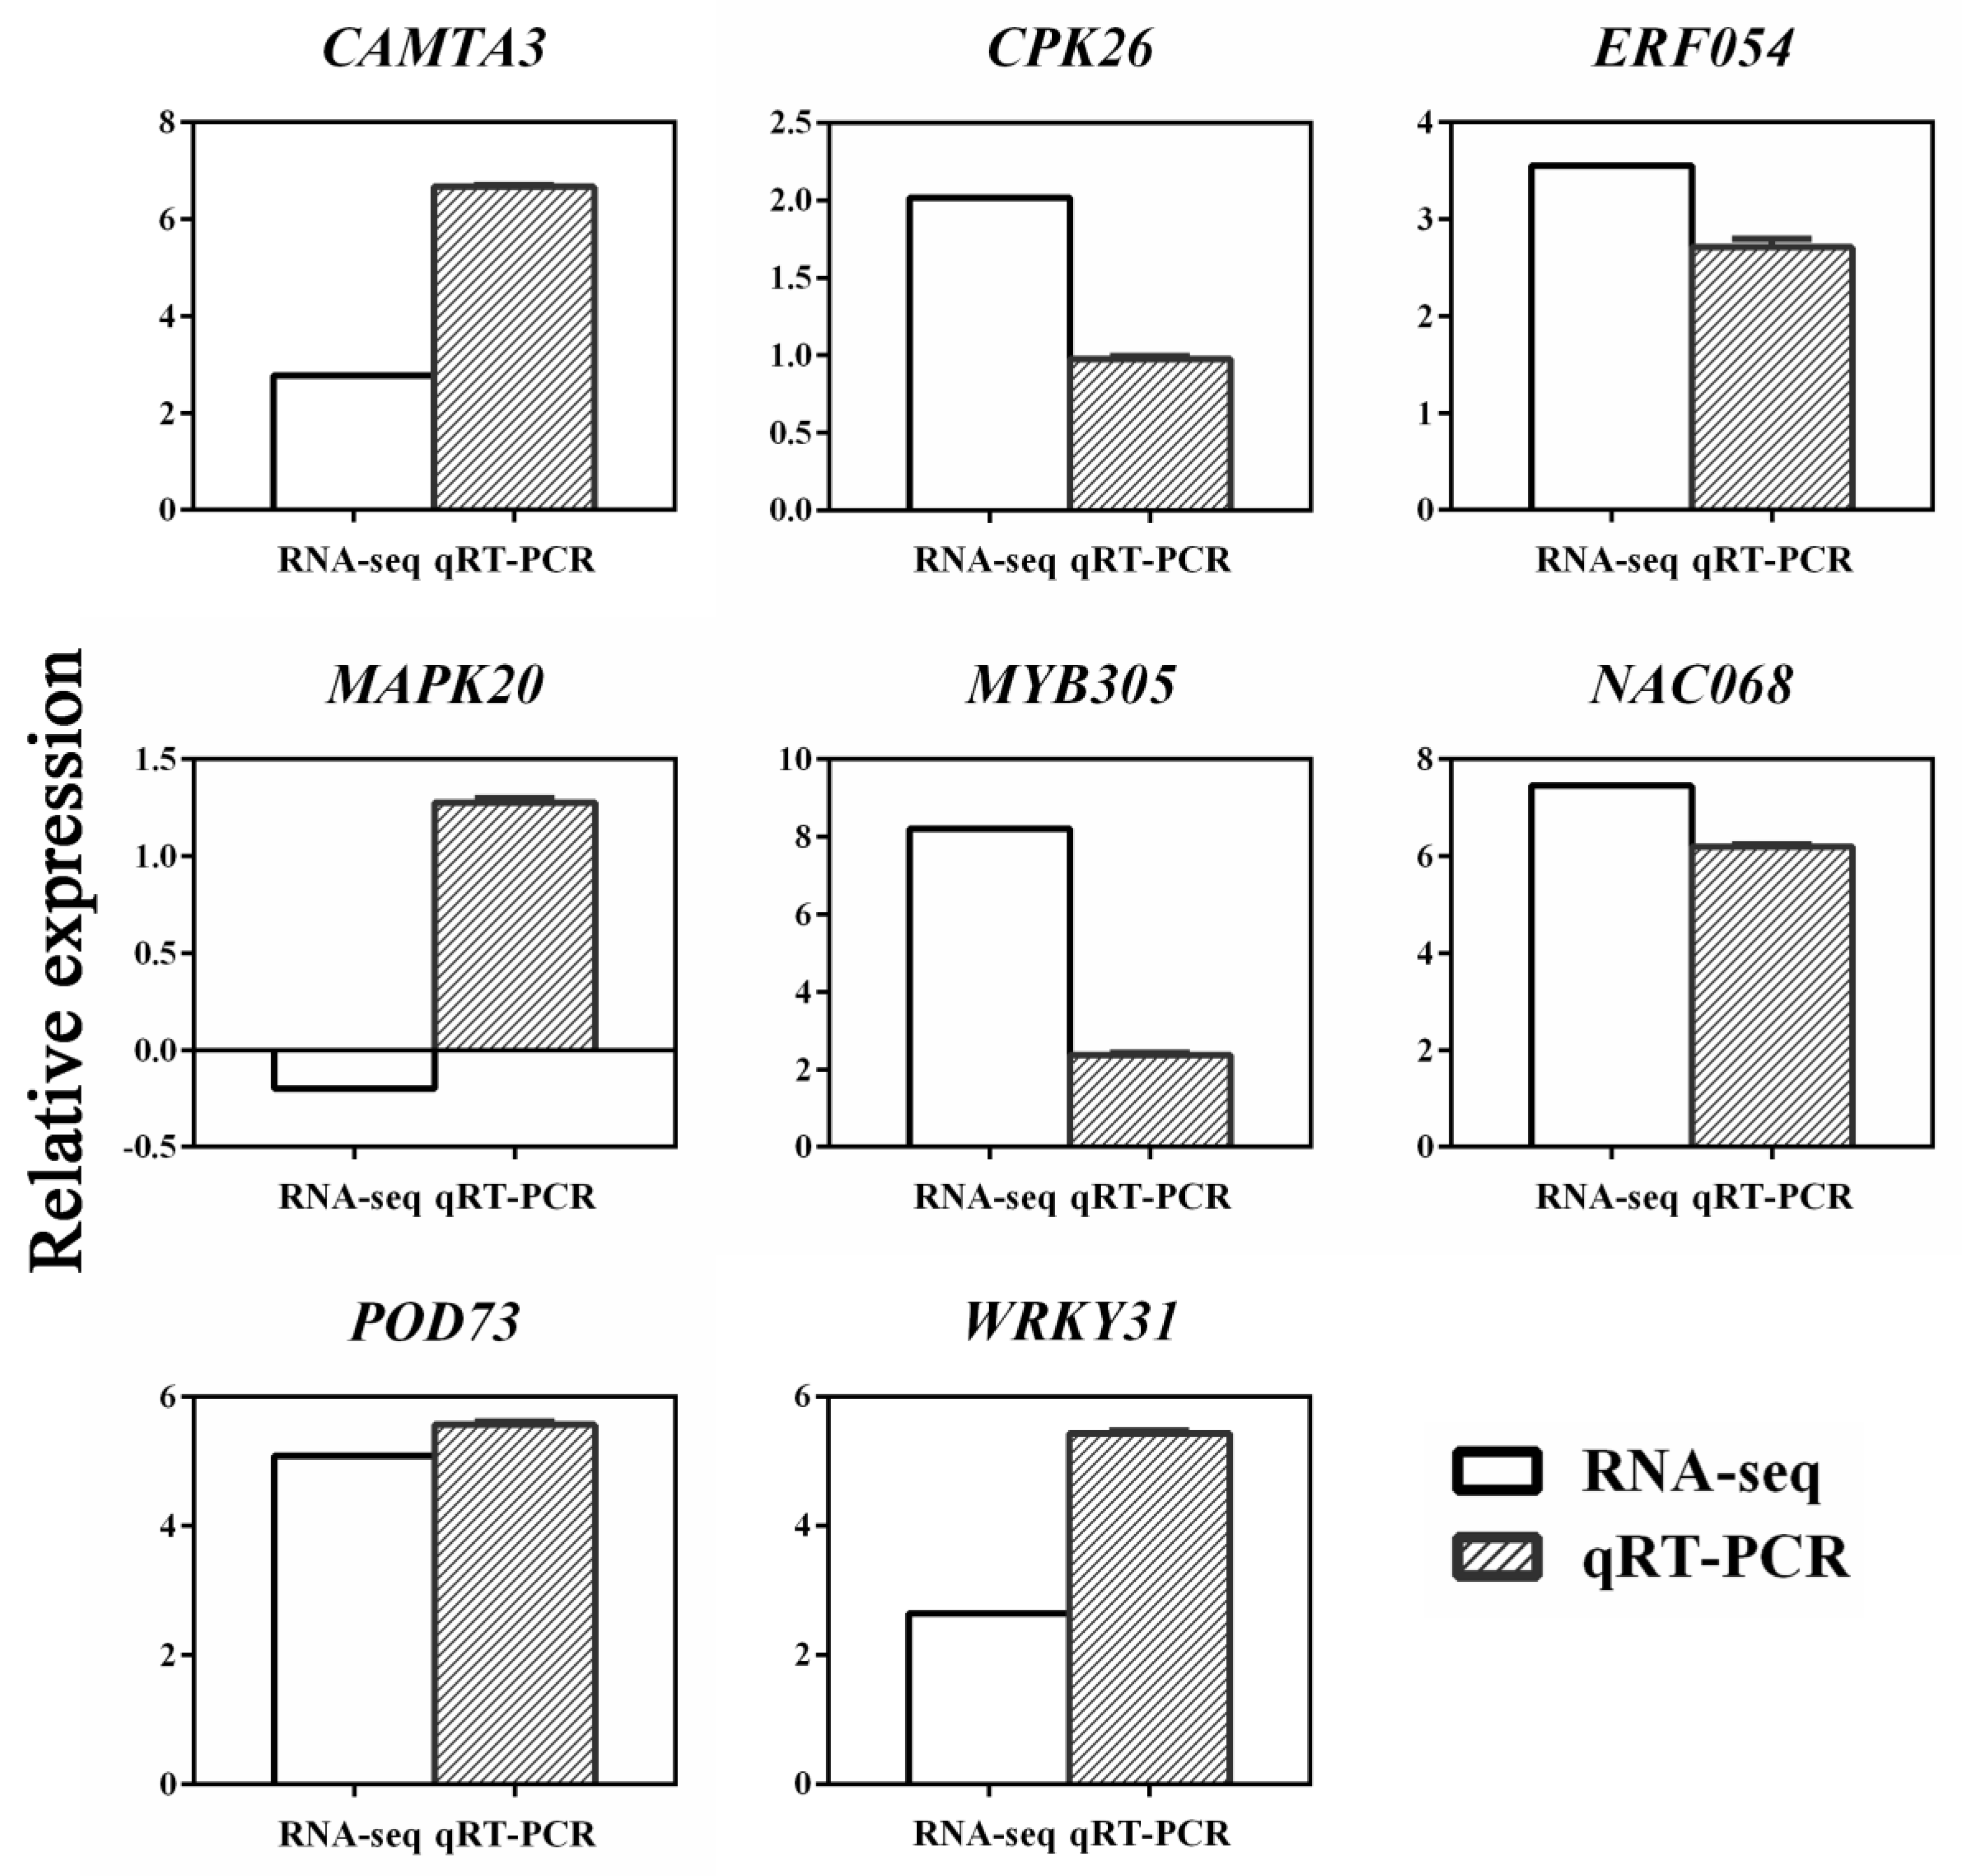
To confirm the reliability of the transcriptomic data, we examined the expression level of eight unigenes by qPCR using the primers listed in Table S3. The qPCR results of the eight unigenes in the 0.4 mM SA pretreatment group were mostly consistent with the RNA-seq data, confirming the reliability of our transcriptome data (Figure 8).
4. Discussion
SA stimulates a wide range of metabolic and physiological response in plants. These responses improve plant growth, transpiration rates, stomatal regulation, and photosynthesis [1]. Recently, an increasing number of researchers have studied the abiotic resistance mechanism of SA in different crops and flowers and found that SA enhances the salt tolerance of tomato and Dianthus superbus mainly by enhancing photosynthesis and alleviating membrane damage [1]. P. euphratica is a model tree widely used to study abiotic stress response mechanisms. However, the influence of SA on salt stress of trees is rarely studied, and the precise function mediated by SA in poplar remains to be elucidated. Therefore, P. euphratica should be used as a material to study the response mechanism of SA involved in abiotic stress. According to a previous study, SA applied beyond a certain range may be detrimental [30]. Thus, the exogenous SA concentrations and the mode of application must be determined as a prerequisite. Here, we evaluated the effects of SA on improving the salt tolerance of P. euphratica under laboratory conditions and further performed transcriptomic analysis at this concentration to gain new insights into the effects of SA in relation to salt resistance endpoints. The results suggested that 0.4 mM SA may be considered as a potential growth regulator to improve salinity stress resistance of poplar, because the application of exogenous SA before salt treatment reduced the adverse effects of salinity and increased the salt resistance of P. euphratica.
Important developmental plant processes, such as photosynthesis, protein synthesis, and carbohydrate, and lipid metabolism, are negatively affected when subjected to salt stress [31]. To deal with salt-induced ionic toxicity, osmotic stress, and secondary oxidative stress, salt-tolerant plant species often develop a variety of strategies to adapt to saline environments, such as detoxifying ROS and regulating ionic homeostasis [32]. ROS is the product of aerobic metabolism. It is a class of important signaling molecules in organism, including superoxide anion Radical O2, hydroxyl (-OH), and hydrogen peroxide (H2O2). Plants may accumulate ROS in the metabolic process during drought and salinity stress conditions [33]. Too much accumulated ROS in plant cells have a widespread toxic effect, causing peroxidation of lipids, and damaging DNA and proteins, eventually leading to cell death [34]. Recent studies have found that salt stress may increase the concentration of H2O2 and O2 in cells, leading to decreased growth of chlorophyll, protein degeneration, cellular dysfunction, or even death [35,36]. Salt stress also leads to a decrease in the ratio of ascorbic acid/dehydroascorbic acid (ASA/DHA) and a reducing of glutathione/oxidized glutathione (GSH/GSSG), which causes redox imbalance [37]. ASA has antioxidant activity and could act as a free radical scavenger to remove ROS [38]. When ASA is oxidized, it is converted into an unstable monodehydroascorbic acid (MDA) and loses its function. MDA can reform ASA after the catalysis of MDA reductase or through recycling from DHA by DHA reductase with glutathione. This pathway of controlling hydrogen peroxide and recycling ASA is known as the Foyer–Halliwell–Asada cycle [39]. In the chloroplast, the Foyer–Halliwell–Asada cycle is directly related to the SOD catalytic reaction that converts O2 to oxygen and H2O2 to form a water–water cycle [40]. Low concentrations of SA may improve plants’ ability to resist dehydration by promoting the activity of antioxidant enzymes, including POD, SOD, and catalase [41,42]. SOD can catalyze the conversion of O2 to H2O2, and POD can convert H2O2 to H2O [43]. Ascorbate peroxidase (APX) is a key enzyme in the ascorbate–glutathione cycle, which uses ASA to reduce H2O2 to H2O. According to our biochemical analysis results, the activity of these enzymes was correspondingly and significantly increased in the cells of P. euphratica after SA induction. Furthermore, our sequencing data indicated that two candidate genes encoding SOD, fifteen genes encoding POD and one gene encoding APX were obviously upregulated after the application of SA (Table S4). Considering that SOD, POD, and APX could function in the scavenging of ROS to improve salt tolerance [44], we speculated that moderate SA could mitigate the salt damage to cells by activating SOD, POD, and APX.
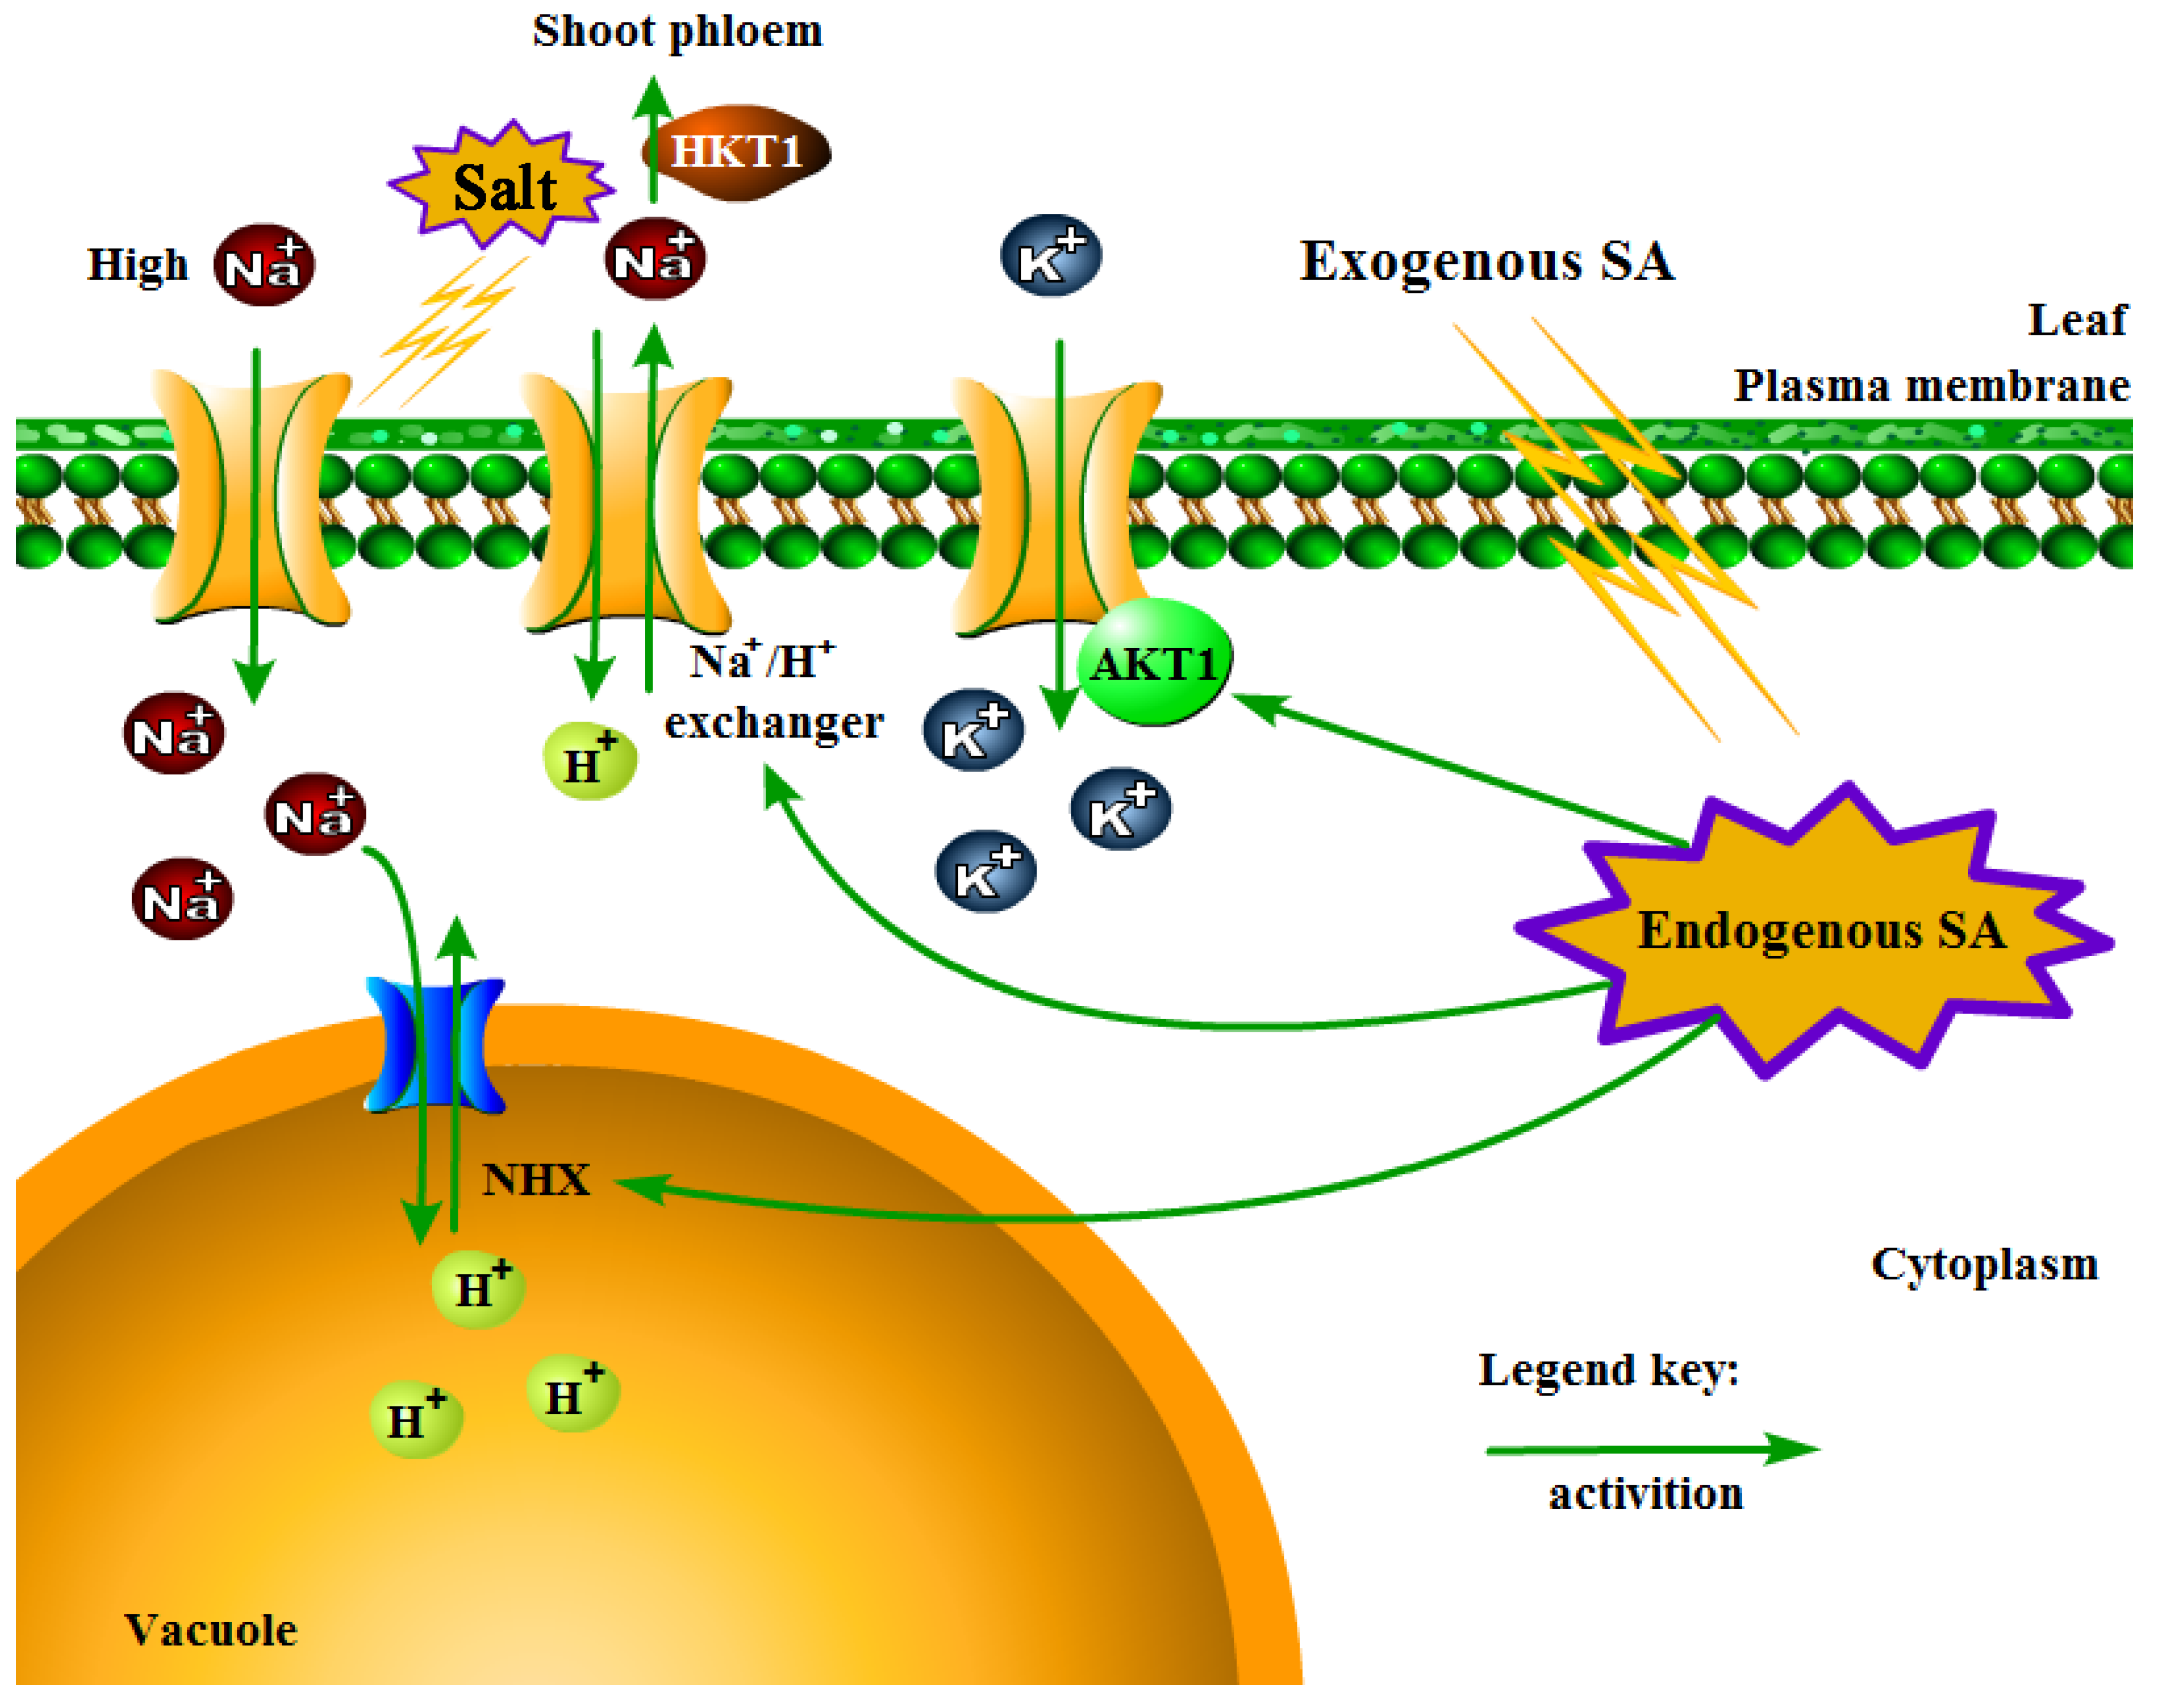
The compartmentalization of Na+ in vacuoles is another important strategy employed by plants to increase salt resistance. However, there are some contrary results in terms of SA involvement in ionic homeostasis under salinity environment. Exogenous SA minimizes Na+ uptake while increasing tissue concentrations of K+ in maize under salinity stress [45]. The application of SA to tomato plants inhibited K+ uptake and increased Na+ uptake [46]. The concentration of Na+ and Cl− in salt-treated spinach was not affected by SA, which seemed to be a neutral result [47]. Thus, it is not easy to draw a conclusion on the role of SA in the maintenance of ionic homeostasis under salinity stress. Here, the regulatory role of SA in the induction of genes regarding membrane transporters controlling K+ homeostasis, Na+ uptake, and Na+ redistribution during salt stress was analyzed. According to our data, SA-treated P. euphratica showed obvious alterations in the transcription of K+ channel and K+ transporter protein genes. Four K+ transporter genes encoding K+ transporter 2/10/11/13 and two K+ channel genes encoding AKT1 homologous genes accumulated after SA administration (Table S5). Further investigation on gene expression related to sodium transport revealed that the HKT1 gene significantly accumulated their transcripts in SA-pretreated P. euphratica compared with the only salt treated control (Table S5). The HKT gene family is a type of Na+ or K+ transporter or Na+–K+ co-transporter associated with salt tolerance stress in plants and plays a decisive role in regulating intracellular Na+/K+ homeostasis [48]. Among them, HKT1 is a high-affinity K+ transporter encoded in roots and leaves mainly by controlling Na+ input in roots [49]. Garriga et al. [50] conducted a functional study of AtHKT1 in the model plant Arabidopsis thaliana L. Heynh and found that AtHKT1, which mediates Na+ transport, increases plant tolerance to salt. The Na+ efflux was dependent on Na+/H+ exchanger/antiporter localized to the plasma membrane. The Na+/H+ exchanger was highly induced in the SA-pretreated group, which indicated that SA pretreatment might help to extrude Na+ of cytoplasm by a plasma membrane-localized Na+/H+ exchanger. In addition to the Na+ efflux, the redistribution of Na+ also plays an important role, mainly relying on the tonoplast-localized Na+/H+ exchanger, such as NHX1. The tonoplast-localized Na+/H+ exchanger could absorb Na+ into the vacuole to regulate intracellular pH and maintain Na+ levels in the cytoplasm [51,52]. Generally, we proposed that SA pretreatment triggered or enhanced the salt response, presumably by regulating the genes related to ionic homeostasis in P. euphratica by a working model indicated by Figure 9. The exogenous SA was supposed to convert into endogenous SA at first. When the subsequent salt treatment conducted, the ion transporting system might be evoked, resulting in an improved performance during salt stress. We could conclude that SA participates in ionic homeostasis in salt stress resistance in P. euphratica at a specific dose, for example, 0.4 mM for P. euphratica.
Identifying the possible candidate genes and the signaling pathways related to abiotic stress resistance is an essential step toward understanding the abiotic stress resistance characteristics of various plants [46,53]. Here, DEG mining and pathway enrichment analysis based on RNA-seq data revealed certain genes were involved in SA-induced salt stress response of P. euphratica. Among the functional genes, TFs play an important role in growth, development, defense, and stress response of plants [54]. Stress-inducible TFs such as MYB, DREB, and WRKY can bind to elements in the promoter region of functional genes, such as rd22, rd29A, and cor15A [55,56]. These TF-regulating responsive genes are important for improving plant defense in salinity, drought, and other stresses in Arabidopsis [57].
In our study, the transcripts of NAC, ERF, MYB, bHLH, and WRKY accumulated in the 0.4 mM SA pretreatment group (Table S6). The NAC family genes are involved in response to salinity and drought stresses [58]. For example, SlNAC1 and SlNAM1 can be induced by salinity [59]. The overexpression of three NAC genes (NAC019, NAC055, NAC072) significantly enhances the tolerance of Arabidopsis to drought [60]. According to our RNA-seq data, 19 members in the NAC gene family were upregulated, which illustrates that the NAC gene family is involved in SA-mediated salt response signal and may be one of the important mechanisms of SA-induced plant resistance to abiotic stress in P. euphratica. AP2-EREBP is a super gene family, including five branches of AP2, EREBP, DREB, ERF, and others. The ERF gene family was highly activated in the SA pretreatment group. ERF3, which is associated with abiotic stresses such as high salinity, drought, and defense against pathogen infection, was significantly upregulated. Studies have shown that GmERF3 is involved in the signaling pathways of SA [61]. We speculated that ERFs are also involved in the process of SA signal transduction for salt defense in P. euphratica. The MYB gene family is another important TF family in abiotic stress defense. The accumulation of flavonoid compounds is an important characteristic for plants to confront abiotic stress. The MYB is widely involved in the regulation of flavonoid metabolic pathways. MYB4 belongs to the R2R3-MYB subclass and is one of the key TFs regulating abiotic stress response. Pasquali et al. [62] transformed Osmyb4 into apple plants, improving the physiological and biochemical adaptability of plants in drought and low-temperature stress. Overexpression of Arabidopsis MYB44 can reduce the expression level of ABA signaling negative regulator phosphatase 2C (PP2C), thereby enhancing the salt tolerance of plants [63]. The bHLH and WRKY gene families are both closely related to plant resistance to salt stress [61]. Considering that the genes in these families were significantly upregulated in the SA pretreatment group, we concluded that SA mediates salt stress defense by regulating specific TF gene families, such as NAC, MYB, ERF, WRKY, and bHLH.
A large number of genes encoding MAPK pathway components were identified in the way of MAPK cascades [64]. The basic MAPK cascade consists of MAPK, MAPK kinase (MAPKK), with the latter activating the former, and MAPK kinase kinase (MAPKKK) that activates MAPKK. This signaling pathway participates in the defense against stresses by transmitting stress signaling and activating the expression of resistance genes [65]. A previous study found that the MAPK cascade is involved in the SA signaling pathway of pathogen resistance, especially in defense responses against bacteria and oomycetes. The MAPK signaling cascade pathway also plays an essential role in abiotic stress response of various plants [59,66]. In Arabidopsis, studies have elucidated the function of MAPK signaling components in abiotic stress response. Both AtMPK4 and AtMPK6 are activated by cold, salt, and drought stresses, and MPKK1–MPKK2–MPK4/MPK6 is activated by cold and salt stresses [67,68]. MAPK9 is specifically expressed in the stomatal pores of Arabidopsis, and its transcriptional expression is upregulated under salt stress and is involved in a series of signal transductions, which significantly increases its salt tolerance [69]. The overexpression of NPK1 can enhance the tolerance of tobacco to drought and salt by activating oxidative stress signaling [70]. MPK4 in the Nicotiana species is involved in responses to ozone treatment through the regulation of stomatal movement [71]. SA rapidly induces the tobacco SIPK, which has high homology with MAPK family genes and contains the characteristic region of MAPK [72]. A recent study suggested that the constitutive expression of MAPK3 would induce strong accumulation of SA in Arabidopsis [73], which indicates the relationship of MAPK3 in participating in SA signaling. Ten putative poplar MAPKK genes (PtMKKs) and 21 putative poplar MAPK genes (PtMPKs) have been identified in the P. trichocarpa genome [74]. MPK4-silenced poplar exhibits high foliar content of free SA and elevated cellular ROS level and antioxidant enzyme activities [75], indicating the function of MAPK genes in cellular ROS/SA homeostasis and water management in woody plant species. However, in contrast to Arabidopsis and Nicotiana, few MAPKs have been functionally characterized, and their role in trees in the regulation of abiotic stresses and the SA pathway remains to be fully elucidated [75]. Our RNA-seq data indicated that many MAPK cascade candidate genes in P. euphratica were upregulated under SA treatment (Table S7). The results indicated that the SA signaling system interacted with the MAPK cascade pathway in P. euphratica. We therefore speculated that SA could trigger the MAPK cascade in response to abiotic stresses in trees.
CDPK is a kind of calcium sensor protein that plays an important role in intracellular Ca2+ signal transduction [76]. The CDPK mRNA often accumulates under various abiotic stresses including drought, salt, and cold and further causes the expression of related genes in plant cells that respond to these abiotic stresses [76,77]. A variety of plant hormones, such as gibberellin, ABA, cytokinin, indole acetic acid, and ethylene, can enhance the activation of CDPK [78]. SA can induce the expression of CDPK genes in a similar manner to mechanical wounding induction in tomato [79]. However, whether SA can enhance plant resistance to salt stress by inducing the differential expression of CDPK genes remains to be elucidated. According to our RNA-seq data, six candidate CDPK genes were upregulated after the application of 0.4 mM SA and salt treatment compared with the non-SA-treated control (Table S8). These genes may participate in processes of salt stress resistance. Thus, we conclude that CDPK genes are involved in a SA-mediated response to abiotic stress in P. euphratica.
5. Conclusions
We have initially provided an answer as to whether and how SA improves salt resistance in P. euphratica. SA minimized the deleterious effect of salt on the adaptation of P. euphratica, which was attributed to the improved growth, higher activity of the antioxidant enzymes and better potassium-sodium balance. Gene mining uncovered the genomic differentially expressed unigenes caused by SA pretreatment that contribute to salt stress adaptation. SA induced the expression level of antioxidant enzymes encoding genes, MAPK, CDPK, and ionic homeostasis genes, allowing P. euphratica to tolerate salt stress. This study is the first to provide insight into the SA function in response of P. euphratica to abiotic stress. A genome-level SA-induced gene expression for P. euphratica would be an important prerequisite for a deeper understanding of SA function in salt stress adaptation in P. euphratica. Furthermore, the specific target genes and their mediated signaling pathways may be involved in the mechanism by which SA mediates salt stress response in P. euphratica. Further research of these genes may unravel the mechanism of salt stress adaptation via SA pathways in trees.
Supplementary Materials
The following are available online at https://www.mdpi.com/1999-4907/10/5/423/s1, Figure S1: Typical MRM chromatogram of internal standards solution of D4-SA and D6-ABA and sample of ABA and SA. The retention times of D4-SA, SA, D6-ABA, ABA were 5.02, 4.99, 5.84, and 5.85 minutes, respectively. Figure S2: The length distribution of transcripts. Figure S3: Correlation analysis of transcriptome data between different treatments. Table S1: The list of up and down regulated DEGs. Table S2: The length distribution of transcripts. Table S3: Genes with regarding primer sequences used for qPCR. Table S4: Differentially expressed unigenes encoding SOD, POD, and APX. Table S5: Differentially expressed unigenes involved in putative sodium and potassium balance. Table S6: Differentially expressed unigenes encoding the top five transcription factors. Table S7: Differential expressed unigenes in MAPK cascade in P. euphratica. Table S8: Differential expressed unigenes in CDPK cascade in P. euphratica.
Author Contributions
J.C. conceived and designed research. C.D. and A.L. conducted experiments. S.R. analyzed data. S.R. and J.C. wrote the manuscript. X.X. and W.Y. revised the manuscript. All authors read and approved the manuscript.
Funding
This research was supported by the National Natural Science Foundation of China (31670610; 31370597).
Acknowledgments
We are grateful to Beijing Forestry University for providing greenhouses to maintain the growth of the seedlings.
Conflicts of Interest
The authors declare no conflict of interest.
References
- Mimouni, H.; Wasti, S.; Manaa, A.; Gharbi, E.; Chalh, A.; Vandoorne, B.; Lutts, S.; Ben Ahmed, H. Does Salicylic Acid (SA) Improve Tolerance to Salt Stress in Plants? A Study of SA Effects On Tomato Plant Growth, Water Dynamics, Photosynthesis, and Biochemical Parameters. Omics-a J. Integr. Biol. 2016, 20, 180–190. [Google Scholar] [CrossRef] [PubMed]
- Clarke, S.M.; Mur, L.A.; Wood, J.E.; Scott, I.M. Salicylic acid dependent signaling promotes basal thermotolerance but is not essential for acquired thermotolerance in Arabidopsis thaliana. Plant J. 2004, 38, 432–447. [Google Scholar] [CrossRef] [PubMed]
- Klessig, D.F.; Malamy, J. The salicylic acid signal in plants. Plant Mol. Biol. 1994, 26, 1439–1458. [Google Scholar] [CrossRef]
- Metwally, A.; Finkemeier, I.; Georgi, M.; Dietz, K.J. Salicylic acid alleviates the cadmium toxicity in barley seedlings. Plant Physiol. 2003, 132, 272–281. [Google Scholar] [CrossRef] [PubMed]
- Raskin, I. Salicylate, a New Plant Hormone. Plant Physiol. 1992, 99, 799–803. [Google Scholar] [CrossRef] [PubMed]
- Delaney, E.J.; Sherrill, R.G.; Palaniswamy, V.; Sedergran, T.C.; Taylor, S.P. A Reinvestigation of the D-Homoannular Rearrangement and Subsequent Degradation Pathways of (11-Beta,16-Alpha)-9- Fluoro-11,16,17,21-Tetrahydroxypregna-1,4- Diene-3,20-Dione (Triamcinolone). Steroids 1994, 59, 196–204. [Google Scholar] [CrossRef]
- Vlot, A.C.; Dempsey, D.A.; Klessig, D.F. Salicylic Acid, a Multifaceted Hormone to Combat Disease. Annu. Rev. Phytopathol. 2009, 47, 177–206. [Google Scholar] [CrossRef]
- Yildirim, E.; Turan, M.; Guvenc, I. Effect of foliar salicylic acid applications on growth, chlorophyll, and mineral content of cucumber grown under salt stress. J. Plant Nutr. 2008, 31, 593–612. [Google Scholar] [CrossRef]
- Sun, W.; Xu, X.; Zhu, H.; Liu, A.; Liu, L.; Li, J.; Hua, X. Comparative transcriptomic profiling of a salt-tolerant wild tomato species and a salt-sensitive tomato cultivar. Plant Cell Physiol. 2010, 51, 997. [Google Scholar] [CrossRef]
- Noreen, S.; Ashraf, M. Alleviation of adverse effects of salt stress on sunflower (Helianthus annuus L.) by exogenous application of salicylic acid: Growth and photosynthesis. Int. J. Bot. 2008, 40, 1657–1663. [Google Scholar]
- Brosche, M.; Vinocur, B.; Alatalo, E.R.; Lamminmaki, A.; Teichmann, T.; Ottow, E.A.; Djilianov, D.; Afif, D.; Bogeat-Triboulot, M.B.; Altman, A.; et al. Gene expression and metabolite profiling of Populus euphratica growing in the Negev desert. Genome. Biol. 2005, 6, R101. [Google Scholar] [CrossRef]
- Jia, H.; Li, J.; Zhang, J.; Ren, Y.; Hu, J.; Lu, M. Genome-wide survey and expression analysis of the stress-associated protein gene family in desert poplar, Populus euphratica. Tree Genet. Genomes 2016, 12, 78. [Google Scholar] [CrossRef]
- Wang, H.L.; Chen, J.H.; Tian, Q.Q.; Wang, S.; Xia, X.L.; Yin, W.L. Identification and validation of reference genes for Populus euphratica gene expression analysis during abiotic stresses by quantitative real-time PCR. Physiol. Plant. 2014, 152, 529–545. [Google Scholar] [CrossRef]
- Chen, J.; Tian, Q.; Pang, T.; Jiang, L.; Wu, R.; Xia, X.; Yin, W. Deep-sequencing transcriptome analysis of low temperature perception in a desert tree, Populus euphratica. BMC Genom. 2014, 15, 326. [Google Scholar] [CrossRef]
- Brinker, M.; Brosche, M.; Vinocur, B.; Abo-Ogiala, A.; Fayyaz, P.; Janz, D.; Ottow, E.A.; Cullmann, A.D.; Saborowski, J.; Kangasjarvi, J.; et al. Linking the salt transcriptome with physiological responses of a salt-resistant Populus species as a strategy to identify genes important for stress acclimation. Plant Physiol. 2010, 154, 1697–1709. [Google Scholar] [CrossRef] [PubMed]
- Zhang, J.; Jia, H.X.; Li, J.B.; Li, Y.; Lu, M.Z.; Hu, J.J. Molecular evolution and expression divergence of the Populus euphratica Hsf genes provide insight into the stress acclimation of desert poplar. Sci. Rep. 2006, 6, 30050. [Google Scholar] [CrossRef] [PubMed]
- Zhang, J.; Xie, P.H.; Lascoux, M.; Meagher, T.R.; Liu, J.Q. Rapidly Evolving Genes and Stress Adaptation of Two Desert Poplars, Populus euphratica and P. pruinosa. PLoS ONE 2013, 8, e66370. [Google Scholar] [CrossRef]
- Ma, T.; Wang, J.; Zhou, G.; Yue, Z.; Hu, Q.; Chen, Y.; Liu, B.; Qiu, Q.; Wang, Z.; Zhang, J.; et al. Genomic insights into salt adaptation in a desert poplar. Nat. Commun. 2013, 4, 2797. [Google Scholar] [CrossRef] [Green Version]
- Madhava Rao, K.V.; Sresty, T.V. Antioxidative parameters in the seedlings of pigeonpea (Cajanus cajan (L.) Millspaugh) in response to Zn and Ni stresses. Plant Sci. 2000, 157, 113–128. [Google Scholar] [CrossRef]
- Wang, N.; Qi, H.; Qiao, W.; Shi, J.; Xu, Q.; Zhou, H.; Yan, G.; Huang, Q. Cotton (Gossypium hirsutum L.) genotypes with contrasting K+/Na+ ion homeostasis: implications for salinity tolerance. Acta Physiol. Plant. 2017, 39, 77. [Google Scholar] [CrossRef]
- Meloni, D.A.; Oliva, M.A.; Martinez, C.A.; Cambraia, J. Photosynthesis and activity of superoxide dismutase, peroxidase and glutathione reductase in cotton under salt stress. Environ. Exp. Bot. 2003, 49, 69–76. [Google Scholar] [CrossRef]
- Becana, M.; Aparicio-Tejo, P.; Irigoyen, J.J.; Sanchez-Diaz, M. Some enzymes of hydrogen peroxide metabolism in leaves and root nodules of Medicago sativa. Plant Physiol. 1986, 82, 1169–1171. [Google Scholar] [CrossRef]
- Cock, P.J.; Fields, C.J.; Goto, N.; Heuer, M.L.; Rice, P.M. The Sanger FASTQ file format for sequences with quality scores, and the Solexa/Illumina FASTQ variants. Nucleic Acids Res. 2010, 38, 1767–1771. [Google Scholar] [CrossRef]
- Kim, D.; Langmead, B.; Salzberg, S.L. HISAT: A fast spliced aligner with low memory requirements. Nat. Methods 2015, 12, 357–360. [Google Scholar] [CrossRef]
- Langmead, B.; Salzberg, S.L. Fast gapped-read alignment with Bowtie 2. Nat. Methods 2012, 9, 357–359. [Google Scholar] [CrossRef] [Green Version]
- Li, B.; Dewey, C.N. RSEM: Accurate transcript quantification from RNA-Seq data with or without a reference genome. BMC Bioinform. 2011, 12, 323. [Google Scholar] [CrossRef]
- Wang, L.; Feng, Z.; Wang, X.; Wang, X.; Zhang, X. Degseq: An r package for identifying differentially expressed genes from rna-seq data. Bioinformatics 2010, 26, 136–138. [Google Scholar] [CrossRef]
- Mistry, J.; Finn, R.D.; Eddy, S.R.; Bateman, A.; Punta, M. Challenges in homology search: HMMER3 and convergent evolution of coiled-coil regions. Nucleic Acids Res 2013, 41, e121. [Google Scholar] [CrossRef]
- Livak, K.J.; Schmittgen, T.D. Analysis of Relative Gene Expression Data Using Real-Time Quantitative PCR and the 2−Schm Method. Methods 2001, 25, 402–408. [Google Scholar] [CrossRef]
- Shakirova, F.M.; Sakhabutdinova, A.R.; Bezrukova, M.V.; Fatkhutdinova, R.A.; Fatkhutdinova, D.R. Changes in the hormonal status of wheat seedlings induced by salicylic acid and salinity. Plant Sci. 2003, 164, 317–322. [Google Scholar] [CrossRef]
- Sereshti, H.; Poursorkh, Z.; Aliakbarzadeh, G.; Zarre, S.; Ataolahi, S. An image analysis of TLC patterns for quality control of saffron based on soil salinity effect: A strategy for data (pre)-processing. Food Chem. 2018, 239, 831–839. [Google Scholar] [CrossRef] [PubMed]
- Ding, M.; Hou, P.; Shen, X.; Wang, M.; Deng, S.; Sun, J.; Xiao, F.; Wang, R.; Zhou, X.; Lu, C.; et al. Salt-induced expression of genes related to Na(+)/K(+) and ROS homeostasis in leaves of salt-resistant and salt-sensitive poplar species. Plant Mol. Biol. 2010, 73, 251–269. [Google Scholar] [CrossRef]
- Miller, G.; Suzuki, N.; Ciftci-Yilmaz, S.; Mittler, R. Reactive oxygen species homeostasis and signalling during drought and salinity stresses. Plant Cell Environ. 2010, 33, 453–467. [Google Scholar] [CrossRef] [PubMed] [Green Version]
- Katarzyna, P.S.; Lidia, P.K.; Małgorzata, L.; Justyna, M.; Grażyna, D. SNF1-Related Protein Kinases SnRK2.4 and SnRK2.10 Modulate ROS Homeostasis in Plant Response to Salt Stress. Int. J. Mol. Sci. 2019, 20, 143–167. [Google Scholar]
- Ashraf, M.A.; Akbar, A.; Parveen, A.; Rasheed, R.; Hussain, I.; Iqbal, M. Phenological application of selenium differentially improves growth, oxidative defense and ion homeostasis in maize under salinity stress. Plant Physiol. Biochem. 2018, 123, 268–280. [Google Scholar] [CrossRef]
- Boscolo, P.R.; Menossi, M.; Jorge, R.A. Aluminum-induced oxidative stress in maize. Phytochemistry 2003, 62, 181–189. [Google Scholar] [CrossRef]
- Bharti, A.; Garg, N. SA and AM symbiosis modulate antioxidant defense mechanisms and asada pathway in chickpea genotypes under salt stress. Ecotoxicol. Environ. Saf. 2019, 178, 66–78. [Google Scholar] [CrossRef] [PubMed]
- Zsigmond, L.; Tomasskovics, B.; Deák, V.; Rigó, G.; Szabados, L.; Bánhegyi, G.; Szarka, A. Enhanced activity of galactono-1,4-lactone dehydrogenase and ascorbate–glutathione cycle in mitochondria from complex III deficient Arabidopsis. Plant Physiol. Biochem. 2011, 49, 809–815. [Google Scholar] [CrossRef]
- Matteo, A.; Sacco, A.; Stefano, R.; Frusciante, L.; Barone, A. Comparative Transcriptomic Profiling of Two Tomato Lines with Different Ascorbate Content in the Fruit. Biochem. Genet. 2012, 50, 908–921. [Google Scholar] [CrossRef] [Green Version]
- Noshi, M.; Hatanaka, R.; Tanabe, N.; Terai, Y.; Maruta, T.; Shigeoka, S. Redox regulation of ascorbate and glutathione by a chloroplastic dehydroascorbate reductase is required for high-light stress tolerance in Arabidopsis. J. Agric. Chem. Soc. Jpn. 2016, 80, 8. [Google Scholar]
- Huang, S.; Van Aken, O.; Schwarzlander, M.; Belt, K.; Millar, A.H. The Roles of Mitochondrial Reactive Oxygen Species in Cellular Signaling and Stress Response in Plants. Plant Physiol. 2016, 171, 1551–1559. [Google Scholar] [CrossRef]
- Rehman, R.U.; Zia, M.; Chaudhary, M.F. Salicylic acid and ascorbic acid retrieve activity of antioxidative enzymes and structure of Caralluma tuberculata calli on PEG stress. Gener. Physiol. Biophys. 2017, 36, 167–174. [Google Scholar] [CrossRef] [PubMed]
- Perry, J.J.; Shin, D.S.; Getzoff, E.D.; Tainer, J.A. The structural biochemistry of the superoxide dismutases. Biochim. Biophys. Acta 2010, 1804, 245–262. [Google Scholar] [CrossRef]
- Ullah, A.; Sun, H.; Hakim; Yang, X.; Zhang, X. A novel cotton WRKY gene, GhWRKY6-like, improves salt tolerance by activating the ABA signaling pathway and scavenging of reactive oxygen species. Physiol. Plant 2018, 162, 439–454. [Google Scholar] [CrossRef]
- Gunes, A.; Inal, A.; Alpaslan, M.; Cicek, N.; Guneri, E.; Eraslan, F.; Guzelordu, T. Effects of exogenously applied salicylic acid on the induction of multiple stress tolerance and mineral nutrition in maize (Zea mays L.). Arch. Agron. Soil Sci. 2005, 51, 687–695. [Google Scholar] [CrossRef]
- Ben Saad, R.; Fabre, D.; Mieulet, D.; Meynard, D.; Dingkuhn, M.; Al-Doss, A.; Guiderdoni, E.; Hassairi, A. Expression of the Aeluropus littoralis AlSAP gene in rice confers broad tolerance to abiotic stresses through maintenance of photosynthesis. Plant Cell Environ. 2012, 35, 626–643. [Google Scholar] [CrossRef]
- Eraslan, F.; Inal, A.; Pilbeam, D.J.; Gunes, A. Interactive effects of salicylic acid and silicon on oxidative damage and antioxidant activity in spinach (Spinacia oleracea L. cv. Matador) grown under boron toxicity and salinity. Plant Growth Regul. 2008, 55, 207–219. [Google Scholar] [CrossRef]
- Hamamoto, S.; Horie, T.; Hauser, F.; Deinlein, U.; Schroeder, J.I.; Uozumi, N. Hkt transporters mediate salt stress resistance in plants: From structure and function to the field. Curr. Opin. Biotechnol. 2015, 32, 113–120. [Google Scholar] [CrossRef]
- Uozumi, N.; Kim, E.J.; Rubio, F.; Yamaguchi, T.; Muto, S.; Tsuboi, A.; Bakker, E.P.; Nakamura, T.; Schroeder, J.I. The Arabidopsis HKT1 gene homolog mediates inward Na + currents in Xenopuslaevis oocytes and Na + uptake in Saccharomyces cerevisiae. Plant Physiol. 2000, 122, 1249–1259. [Google Scholar] [CrossRef]
- Garriga, M.; Raddatz, N.; Véry, A.A.; Sentenac, H.; Rubiomeléndez, M.E.; González, W.; Dreyer, I. Cloning and functional characterization of hkt1 and akt1 genes of fragaria spp.-relationship to plant response to salt stress. J. Plant Physiol. 2017, 210, 9–17. [Google Scholar] [CrossRef]
- Ye, C.Y.; Zhang, H.C.; Chen, J.H.; Xia, X.L.; Yin, W.L. Molecular characterization of putative vacuolar NHX-type Na(+)/H(+) exchanger genes from the salt-resistant tree Populus euphratica. Physiol. Plant. 2009, 137, 166–174. [Google Scholar] [CrossRef]
- Bassil, E.; Tajima, H.; Liang, Y.C.; Ohto, M.A.; Ushijima, K.; Nakano, R.; Esumi, T.; Coku, A.; Belmonte, M.; Blumwald, E. The Arabidopsis Na+/H+ antiporters NHX1 and NHX2 control vacuolar pH and K+ homeostasis to regulate growth, flower development, and reproduction. Plant Cell 2011, 23, 3482–3497. [Google Scholar] [CrossRef]
- Si, J.P.; Sun, Y.; Wang, L.; Qin, Y.; Wang, C.Y.; Wang, X.Y. Functional analyses of Populus euphratica brassinosteroid biosynthesis enzyme genes DWF4 (PeDWF4) and CPD (PeCPD) in the regulation of growth and development of Arabidopsis thaliana. J. Biosci. 2016, 41, 727–742. [Google Scholar] [CrossRef]
- Balazadeh, S.; Riano-Pachon, D.M.; Mueller-Roeber, B. Transcription factors regulating leaf senescence in Arabidopsis thaliana. Plant Biol. (Stuttg) 2010, 10, 63–75. [Google Scholar] [CrossRef]
- Iwasaki, T.; Yamaguchi-Shinozaki, K.; Shinozaki, K. Identification of a cis-regulatory region of a gene in Arabidopsis thaliana whose induction by dehydration is mediated by abscisic acid and requires protein synthesis. Mol. Gen. Genet. 1995, 247, 391–398. [Google Scholar] [CrossRef]
- Yamaguchi-Shinozaki, K.; Urao, T.; Shinozaki, K. Regulation of Genes That are Induced by Drought Stress in Arabidopsis thaliana. J. Plant Res. 1995, 108, 127–136. [Google Scholar] [CrossRef]
- Siahpirani, A.F.; Ay, F.; Roy, S. A multi-task graph-clustering approach for chromosome conformation capture data sets identifies conserved modules of chromosomal interactions. Genome Biol. 2016, 17, 114. [Google Scholar] [CrossRef]
- Zheng, X.N.; Chen, B.; Lu, G.J.; Han, B. Overexpression of a NAC transcription factor enhances rice drought and salt tolerance. Biochem. Biophys. Res. Commun. 2009, 379, 985–989. [Google Scholar] [CrossRef]
- Yang, K.Y.; Liu, Y.; Zhang, S. Activation of a Mitogen-Activated Protein Kinase Pathway is Involved in Disease Resistance in Tobacco. PNAS 2001, 98, 741–746. [Google Scholar] [CrossRef]
- Tran, L.S.; Nakashima, K.; Sakuma, Y.; Simpson, S.D.; Fujita, Y.; Maruyama, K.; Fujita, M.; Seki, M.; Shinozaki, K.; Yamaguchi-Shinozaki, K. Isolation and functional analysis of Arabidopsis stress-inducible NAC transcription factors that bind to a drought-responsive cis-element in the early responsive to dehydration stress 1 promoter. Plant Cell 2004, 16, 2481–2498. [Google Scholar] [CrossRef]
- Zhang, G.Y.; Chen, M.; Li, L.C.; Xu, Z.S.; Chen, X.P.; Guo, J.M.; Ma, Y.Z. Overexpression of the soybean GmERF3 gene, an AP2/ERF type transcription factor for increased tolerances to salt, drought, and diseases in transgenic tobacco. J. Exp. Bot. 2009, 60, 3781–3796. [Google Scholar] [CrossRef] [PubMed]
- Pasquali, G.; Biricolti, S.; Locatelli, F.; Baldoni, E.; Mattana, M. Osmyb4 expression improves adaptive responses to drought and cold stress in transgenic apples. Plant Cell Rep. 2008, 27, 1677–1686. [Google Scholar] [CrossRef]
- Jung, C.; Seo, J.S.; Han, S.W.; Koo, Y.J.; Kim, C.H.; Song, S.I.; Nahm, B.H.; Choi, Y.D.; Cheong, J.J. Overexpression of atmyb44 enhances stomatal closure to confer abiotic stress tolerance in transgenic arabidopsis. Plant Physiol. 2008, 146, 623–635. [Google Scholar] [CrossRef]
- Nakagami, H.; Pitzschke, A.; Hirt, H. Emerging MAP kinase pathways in plant stress signalling. Trends Plant Sci. 2005, 10, 339–346. [Google Scholar] [CrossRef] [PubMed]
- Mizoguchi, T.; Irie, K. A gene encoding a mitogen-activated protein kinase kinase kinase is induced simultaneously with genes for a mitogen-activated protein kinase and an S6 ribosomal protein kinase by touch, cold, and water stress in Arabidopsis thaliana. PNAS 1996, 93, 765–769. [Google Scholar] [CrossRef]
- Asai, T.; Tena, G.; Plotnikova, J.; Willmann, M.R.; Chiu, W.L.; Gomez-Gomez, L.; Boller, T.; Ausubel, F.M.; Sheen, J. MAP kinase signalling cascade in Arabidopsis innate immunity. Nature 2002, 415, 977–983. [Google Scholar] [CrossRef]
- Ichimura, K.; Mizoguchi, T.; Yoshida, R.; Yuasa, T.; Shinozaki, K. Various abiotic stresses rapidly activate Arabidopsis MAP kinases ATMPK4 and ATMPK6. Plant J. 2000, 24, 655–665. [Google Scholar] [CrossRef]
- Teige, M.; Scheikl, E.; Eulgem, T.; Doczi, F.; Ichimura, K.; Shinozaki, K.; Dangl, J.L.; Hirt, H. The MKK2 pathway mediates cold and salt stress signaling in Arabidopsis. Mol. Cell 2004, 15, 141–152. [Google Scholar] [CrossRef]
- Jammes, F.; Yang, X.; Xiao, S.; Kwak, J.M. Two Arabidopsis guard cell-preferential MAPK genes, MPK9 and MPK12, function in biotic stress response. Plant Signal. Behav. 2011, 6, 1875–1877. [Google Scholar] [CrossRef] [PubMed]
- Shou, H.X.; Bordallo, P.; Wang, K. Expression of the Nicotiana protein kinase (NPK1) enhanced drought tolerance in transgenic maize. J. Exp. Bot. 2004, 55, 1013–1019. [Google Scholar] [CrossRef] [Green Version]
- Marten, H.; Hyun, T.; Gomi, K.; Seo, S.; Hedrich, R.; Roelfsema, M.R.G. Silencing of NtMPK4 impairs CO2-induced stomatal closure, activation of anion channels and cytosolic Ca(2+) signals in Nicotiana tabacum guard cells. Plant J. 2008, 55, 698–708. [Google Scholar] [CrossRef]
- Zhang, S.; Klessig, D.F. The tobacco wounding-activated mitogen-activated protein kinase is encoded by SIPK. Proc. Natl. Acad. Sci. USA 1998, 95, 7225–7230. [Google Scholar] [CrossRef] [PubMed] [Green Version]
- Genot, B.; Lang, J.; Berriri, S.; Garmier, M.; Gilard, F.; Pateyron, S.; Haustraete, K.; Van Der Straeten, D.; Hirt, H.; Colcombet, J. Constitutively Active Arabidopsis MAP Kinase 3 Triggers Defense Responses Involving Salicylic Acid and SUMM2 Resistance Protein. Plant Physiol. 2017, 174, 1238–1249. [Google Scholar] [CrossRef] [PubMed]
- Nicole, M.C.; Hamel, L.P.; Morency, M.J.; Beaudoin, N.; Ellis, B.E.; Seguin, A. MAP-ping genomic organization and organ-specific expression profiles of poplar MAP kinases and MAP kinase kinases. BMC Genom. 2006, 7, 223. [Google Scholar] [CrossRef] [PubMed]
- Witon, D.; Gawronski, P.; Czarnocka, W.; Slesak, I.; Rusaczonek, A.; Sujkowska-Rybkowska, M.; Bernacki, M.J.; Dabrowska-Bronk, J.; Tomsia, N.; Szechynska-Hebda, M.; et al. Mitogen activated protein kinase 4 (MPK4) influences growth in Populus tremula L. x tremuloides. Environ. Exp. Bot. 2016, 130, 189–205. [Google Scholar] [CrossRef]
- Chen, J.; Xue, B.; Xia, X.; Yin, W. A novel calcium-dependent protein kinase gene from Populus euphratica, confers both drought and cold stress tolerance. Biochem. Biophys. Res. Commun. 2013, 441, 630–636. [Google Scholar] [CrossRef] [PubMed]
- Wang, L.L.; Yu, C.C.; Xu, S.L.; Zhu, Y.G.; Huang, W.C. OsDi19–4 acts downstream of OsCDPK14 to positively regulate ABA response in rice. Plant Cell Environ. 2016, 39, 2740–2753. [Google Scholar] [CrossRef] [PubMed]
- Sharma, A.; Komatsu, B. Involvement of a Ca2+-Dependent Protein Kinase Component Downstream to the Gibberellin-Binding Phosphoprotein, RuBisCO Activase, in Rice. Biochem. Biophys. Res. Commun. 2001, 290, 690–695. [Google Scholar] [CrossRef]
- Chang, W.J.; Su, H.S.; Li, W.J.; Zhang, Z.L. Expression profiling of a novel calcium-dependent protein kinase gene, LeCPK2, from tomato (Solanum lycopersicum) under heat and pathogen-related hormones. Biosci. Biotechnol. Biochem. 2009, 73, 2427–2431. [Google Scholar] [CrossRef]
Figure 1.
Content of endogenous plant hormones (ABA and SA) in P. euphratica leaf samples after treated with 300 mM NaCl. Data represent the mean ± SD of three independent experiments. X axis represents the treatment time of 300 mM NaCl. Y axis represents the content of endogenous plant hormones. “FW” denotes fresh weight of plant sample. Asterisks indicate a significant hormonal difference between control and salt-stressed plants (n = 3, ** p < 0.01,* p < 0.05, Duncan’ test).

Figure 2.
Phenotypes of P. euphratica seedlings treated with SA and salt stress. (a) Seedling grown under normal condition. (b) Seedling only treated with 300 mM NaCl for 3 d. (c) Seedling treated with 0.4 mM SA (3 d) + 300 mM NaCl (3 d). (d) Seedling treated with 1 mM SA (3 d) + 300 mM NaCl (3 d). (e) Seedling only treated with 300 mM NaCl for 7 d. (f) Seedling treated with 0.4 mM SA (3 d) + 300 mM NaCl (7 d). (g) Seedling treated with 1 mM SA (3 d) + 300 mM NaCl (7 d). (h) Seedling treated with 2 mM SA (3 d) + 300 mM NaCl (7 d).

Figure 3.
Effects of SA on the chlorophyll, fresh weight, MDA, SOD, and POD in P. euphratica grown under salt stress. (a) Chlorophyll content indicated by chlorophyll meter SPAD-502. (b) Fresh weight. (c) Effects of application different concentrations of SA on the malondialdehyde (MDA) content of P. euphratica grown under salt stress. (d) SOD (black) and POD (oblique line): activities of P. euphratica grown under salt stress with or without different concentrations of SA pretreatment. (e) Na+ (black) and K+ (oblique line): contents of leaves with different treatment. (f) K+/Na+ ratio with different treatment. ST means salt treated, 0.4 mM SA+ST, 1.0 mM SA+ST and 2.0 mM SA+ST indicate different concentrations of SA solution plus with subsequent 300 mM salt treatment, respectively. CK refers to P. euphratica grown under natural conditions without any treatments. ST means P. euphratica treated only with 300 mM NaCl. n mM SA+ST stands for P. euphratica which was pretreated with n mM SA and then treated with 300 mM NaCl (n = 0.4, 1, 2). To determine significant differences between treatments, Duncan’s Test was applied. Data indicate mean ± SE (n = 3). The different letters present on the column indicate significant differences at p < 0.05.

Figure 4.
Gene Ontology classification of upregulated and downregulated differential genes. The X axis represents different GO terms. The left Y axis represents the percentage of genes and the right Y axis represents the number of genes. The upper number in the right Y-axis refers to Down-regulation, and the number below represents Up-regulation. Red columns refer to down-regulated genes, green columns refer to up-regulated genes.

Figure 5.
Upregulation and downregulation of GO enrichment and KEGG analysis of differential genes. (a) KEGG classification of upregulated and downregulated DEGs. The left side is the upregulated KEGG analysis, and the right side is the downregulated KEGG analysis. (b) Upregulation and downregulation of GO enrichment analysis of differential genes. (c) Upregulation and downregulation of KEGG enrichment of differential genes. The blue columns are expressed as −log10 (Q value), and the orange line graph represents the number of candidate genes. The gene numbers were indicated after the columns.

Figure 6.
Family of transcription factors differentially expressed between control and SA pretreated salt stressed samples. The X axis represents a different family of transcription factors, and the Y axis represents the number of transcription factors contained in each transcription factor family. The number above the column indicates the number of transcription factors.

Figure 7.
Expression profiles of differentially expressed genes regulated SA to alleviate salt tolerance. Data represent the mean ± SD (Standard Deviation) of three independent experiments. The heat map of each related protein and transcription factor family is represented by the log2 (FPKM + 1) of Control check and SA. Here, the FPKM means fragments per kilobase of transcript per million mapped reads. The range of all values varies from 0 to 8.5. The greener is closer to the minimum value, and the red is closer to the maximum value. The gene ID is on the left side.

Figure 8.
Comparison of expression patterns of 8 candidate genes between RNA-seq (white) and qRT-PCR (oblique line) for selected transcripts. Data represent the mean ± SD of three independent experiments. X axis is the selected gene ID, and Y axis is the log2 Ratio.
Figure 8.
Comparison of expression patterns of 8 candidate genes between RNA-seq (white) and qRT-PCR (oblique line) for selected transcripts. Data represent the mean ± SD of three independent experiments. X axis is the selected gene ID, and Y axis is the log2 Ratio.

Figure 9.
A proposed working model for sodium and potassium transporting in P. euphratica leaves in relation to SA treatment and subsequent salt treatment. The model is based on the cation accumulation result and RNA-seq result. The exogenous SA that sprayed initially was supposed to convert into endogenous SA. When the subsequent salt treatment conducted, the ion transporting system might be evoked as described.

© 2019 by the authors. Licensee MDPI, Basel, Switzerland. This article is an open access article distributed under the terms and conditions of the Creative Commons Attribution (CC BY) license (http://creativecommons.org/licenses/by/4.0/).
Share and Cite
MDPI and ACS Style
Rao, S.; Du, C.; Li, A.; Xia, X.; Yin, W.; Chen, J. Salicylic Acid Alleviated Salt Damage of Populus euphratica: A Physiological and Transcriptomic Analysis. Forests 2019, 10, 423. https://doi.org/10.3390/f10050423
AMA Style
Rao S, Du C, Li A, Xia X, Yin W, Chen J. Salicylic Acid Alleviated Salt Damage of Populus euphratica: A Physiological and Transcriptomic Analysis. Forests. 2019; 10(5):423. https://doi.org/10.3390/f10050423
Chicago/Turabian StyleRao, Shupei, Chao Du, Aijia Li, Xinli Xia, Weilun Yin, and Jinhuan Chen. 2019. "Salicylic Acid Alleviated Salt Damage of Populus euphratica: A Physiological and Transcriptomic Analysis" Forests 10, no. 5: 423. https://doi.org/10.3390/f10050423
Note that from the first issue of 2016, this journal uses article numbers instead of page numbers. See further details here.