Factors Affecting Long-Term Trends in Global NDVI
by
 , ,
, ,
Yujie Yang
1,2,3 ,
,
Shijie Wang
1,3,
Xiaoyong Bai
1,3,*,
Qiu Tan
2,
Qin Li
1,3,
Luhua Wu
1,3,
Shiqi Tian
1,2,
Zeyin Hu
1,3,
Chaojun Li
1,2 and
Yuanhong Deng
1,3 1
State Key Laboratory of Environmental Geochemistry, Institute of Geochemistry, Chinese Academy of Sciences, 99 Lincheng West Road, Guiyang 550081, China
2
School of Geography and Environmental Sciences, Guizhou Normal University, Guiyang 550081, China
3
Puding Karst Ecosystem Observation and Research Station, Chinese Academy of Sciences, Puding 562100, China
*
Author to whom correspondence should be addressed.
Forests 2019, 10(5), 372; https://doi.org/10.3390/f10050372
Submission received: 22 March 2019
/
Revised: 21 April 2019
/
Accepted: 26 April 2019
/
Published: 28 April 2019
(This article belongs to the Section Forest Ecology and Management)
Abstract
:Diagnosing the evolution trends of vegetation and its drivers is necessary for ecological conservation and restoration. However, it remains unclear what the underlying distribution pattern of these trends and its correlation with some drivers at large spatial-temporal scales. Here we use the normalized difference vegetation index (NDVI) to quantify the activity of vegetation by Theil–Sen median trend analysis and the Mann–Kendall test, Pearson correlation analysis and Boosted regression trees (BRT) model. Results show that about 34% of the global continent area has experienced greening in the grid annual NDVI from 1982 to 2015. The major greening areas were observed in the Sahel, European, India and south China. Only 10% of the global continent land areas were browning, and these were observed in Canada, South America, central Africa and Central Asia. BRT model shows that rainfall is the most important factor affecting vegetation evolution (63.1%), followed by temperature (15%), land cover change (8.6%), population (6.5%), elevation (6.4%) and nightlight (0.4%). It’s about 21% of the world’s continent were affected by rainfall, mainly in arid regions such as central Asia and Australia. The main temperature-affected areas accounted for 36%, located near the equator or in high latitudes.
1. Introduction
Vegetation is the main component of terrestrial ecosystems on Earth and is crucial in the water, energy exchange, and biogeochemical cycles of terrestrial surfaces [1,2,3]. Vegetation hugely impacts the terrestrial carbon cycles, ecosystem service value, surface energy exchange and water balance from regional to global [4,5,6,7,8,9]. The NDVI (normalized difference vegetation index) is sensitive to phenology [10] and is often used as the best indicator of vegetation growth and coverage change [11]. The NDVI has also been widely used in the study of vegetation changes at different scales [12,13]. The climate exerts dominant control over the spatial distribution of major vegetation types on a global scale [14]. Vegetation dynamics and the responses to climate changes have been recognised as a core issue of global change in terrestrial ecosystems [1].
The trends and divers of Earth’s vegetation have been in the spotlight of science [15]. Many scholars have extensively analysed the temporal and spatial evolution characteristics and driving factors of the NDVI. Zhu et al. [16] use three long-term satellite leaf area index (LAI) records and 10 global ecosystem models to investigate four key drivers of LAI trends during 1982 to 2009. Brandt et al. [17] found a major increase in growing season vegetation cover from 69% in 1999 to 81% in 2017. Piao et al. [18] use three different satellite-derived LAI datasets for detection as well as five different process-based ecosystem models for attribution. Rising atmospheric CO2 concentration and nitrogen deposition are identified as the most likely causes of the greening trend in China. Song et al. [19] studied the global land change from 1982 to 2016 and found that tree cover increased by 2.24 million km2 during that period. Jong et al. [20] found that the net global figure showed greening from 1981 to 2006.
To understand the long-term NDVI trends (during 1982 to 2015) on a large spatial scale (global) and their influence factors, this study analysed the trends of NDVI by Theil–Sen median trend analysis and the Mann–Kendall test. Climate and socioeconomic factors were included to screen the driving forces for vegetation change using Pearson correlation analysis and BRT model.
2. Materials and Methods
2.1. Data
2.1.1. Global Inventory Modeling and Mapping Studies (GIMMS) NDVI 3g Data
GIMMS NDVI data represent a vegetation product obtained by the Advanced Very High Resolution Radiometer (AVHRR) sensor mounted on the National Oceanic and Atmospheric Adm (NOAA) satellite. It is considered the best dataset available for long-term NDVI trend analysis [16]. Such data are widely used to study the large-scale changes in vegetation phenology at the global and regional levels [21,22]. The data cover the period of 1982–2015 and has a temporal resolution of 16 days and a spatial resolution of 0.072 (8 km) [13,22,23]. In this study, we applied the maximum value composite (MVC) technique to remove any biases caused by atmospheric conditions [24].
2.1.2. Data Sources of Impact Factors
The Climatic Research Unit (CRU) high-resolution gridded dataset is a globally used near-surface climate dataset with a horizontal resolution of 0.5° × 0.5° longitude. This study used the TS 4.00 dataset published by the University of East Anglia CRU (http://www.cru.uea.ac.uk/). The time scale of 1982–2015 was adopted. The global nighttime lights data obtained by the Operational Linescan System (OLS) supported by the Defense Meteorological Satellite Program (DMSP) provide a new tool for large-scale urbanization research. These data exclude the effects of bright clouds and water bodies with a spatial resolution of 1 × 1 km [25]. The Shuttle Radar Topography Mission (SRTM) obtained elevation data on a near-global scale to generate the most complete high-resolution digital topographic database of the Earth. The SRTM is an international project spearheaded by the National Geospatial-Intelligence Agency, the National Aeronautics and Space Administration (NASA) and the Italian Space Agency and the German Aerospace Center. This study uses the 1 km resolution Digital Elevation Model (DEM) data produced by SRTM (http://glcf.umd.edu/data/srtm/). The climate change initiatiue land cover project (CCI-LC) delivers consistent global LC maps at 300 m spatial resolution on an annual basis from 1992 to 2015.
2.2. Methods
2.2.1. Mann–Kendall Mutation Test
The Mann–Kendall mutation test is a method often used in meteorology and climatology [26]. The formula is as follows:
Set the original time series as x1, x2, …, xn, mi is the cumulative number that xi is greater than xj in the ith sample, define the statistic as:
The mean and variance of dk are respectively:
UF statistics is obtained through standardization,
By referring this method to the inverse sequence and calculating another curve, UB, the intersection of the two curves in the confidence interval is determined as the mutation point (And the intersection point is within the critical line of y = ±1.96 (α = 0.05)).
2.2.2. Theil–Sen Median Trend Analysis and Mann–Kendall Test
Theil–Sen median trend analysis is a robust non-parametric statistical method for trend calculation [27,28,29].
when SNDVI > 0, it reflects that NDVI presents a growing trend, and vice versa.
Mann–Kendall is a non-parametric statistical test method used to determine the significance of a trend and are not affected by abnormal values [30,31]. When the Mann–Kendall test is applied to analyze the trend of the sequence, the test statistic is different from the above mentioned (2.2.1). The formulas are as follows:
Set the {NDVIi}, i = 1982, 1983, …, 2015;
Define the Z-statistic as:
where, n is the number of the data in the sequence, NDVIi and NDVIj represent the NDVI values in the ith year and jth year, respectively. Sgn is a sign function. At the given significance level α, when , it indicates the significant change of time series data in the study at the level of α. This study judged the significance of NDVI time-series change trend at the confidence level of a = 0.05.
2.2.3. Pearson Correlation Analysis
For more than a decade, scholars have used NDVI data from different regions, time series and resolutions to study the relationship between vegetation and climate [32,33]. Determining the relationship between vegetation and its driving factors is mainly accomplished by calculating and verifying the correlation coefficients [34]. The formula is presented as follows:
where n is the number of samples; and are the means of variables x and y, respectively; and Rxy is the correlation coefficient between variables x and y. if |R| ≤ 0.296; the correlation between NDVI and its’ divers are insignificant correlation; if 0.296 ≤ |R| ≤ 0.3494, the correlation between NDVI and its’ divers correlate positively or negatively at the p = 0.01 level. If |R| ≥ 0.3494, the correlation coefficients are taken as statistically significant at the p = 0.05 level.
2.2.4. Boosted Regression Trees Analysis (BRT)
The boosted regression tree (BRT) is a quantifiable factor contribution rate and prediction model established by J. Elith et al. [35], and is one of several techniques that aim to improve the performance of a single model by fitting many models and combining them for prediction. BRT uses two algorithms: regression trees (from the classification and regression tree) and boosting builds and combines a collection of models. It is widely used in medicine [36,37].
3. Results
3.1. Global Spatial Distribution of Vegetation
According to the characteristics of global NDVI distribution, we divide the NDVI into four categories, namely, non-vegetation coverage area (NDVI ≤ 0.2), low vegetation coverage area (0.2 < NDVI ≤ 0.5), medium vegetation coverage area (0.5 < NDVI ≤ 0.8) and high vegetation coverage area (NDVI > 0.8) [38]. We found that the medium vegetation coverage area accounted for the largest proportion, reaching 42%, accounting for about half of the global continental area. In addition, the proportion of non-/very low vegetation coverage is the smallest, accounting for only 10%, followed by low vegetation coverage, accounting for 22%, and high vegetation coverage accounting for 26% (Table 1).
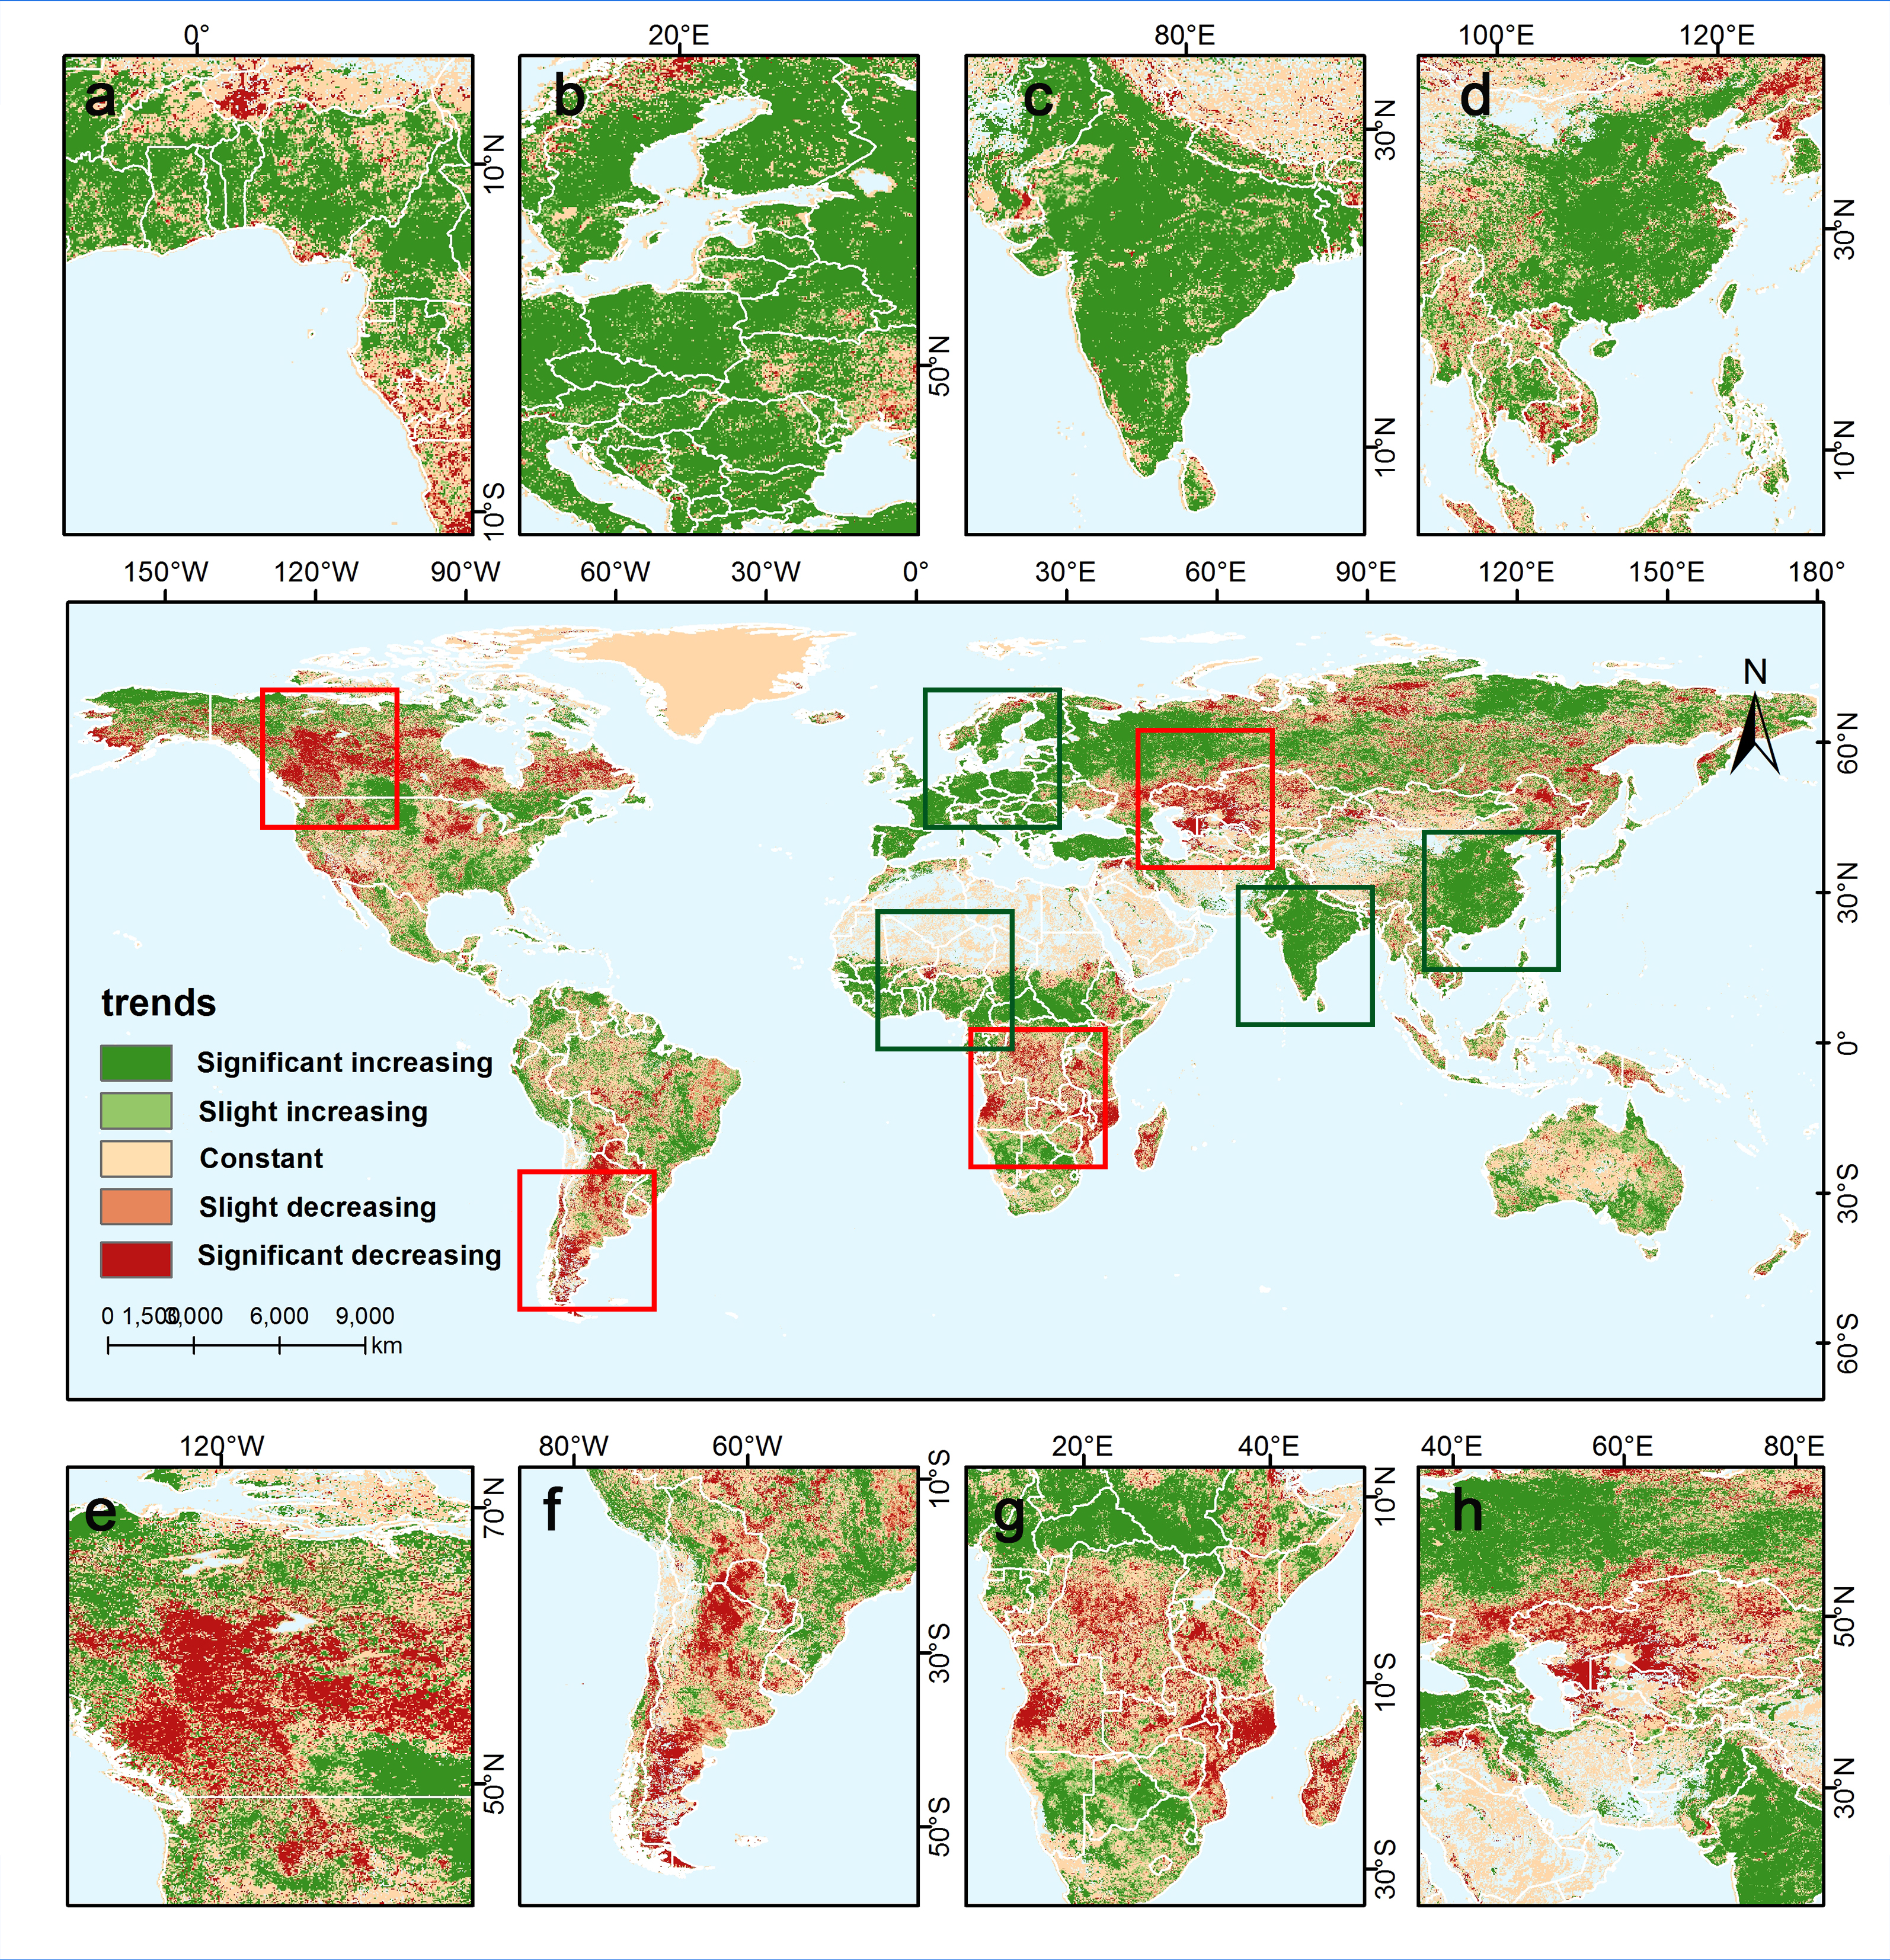
We selected several warp and weft lines (100° W, 20° E, 100° E, 60° N, 30° N, 10° S) with a large distribution of continental area to analyze the spatial distribution characteristics of NDVI values (Figure 1). 100° W meridian line passes through the North America, NDVI values are higher in Canada (with some regions exceeding 0.8 and rising) and lower in the western United States [39]. The 20° E meridian line passes through the higher NDVI value areas such as central Europe and the Africa region, as well as the extremely low NDVI value areas of the Sahara. 100° E meridian line passes through the Asian continent, NDVI value is higher in Asia except for Central Asia. In the north temperate zone where the 60° N parallel passes, the NDVI values are relatively high. In the north temperate zone where the 30° N parallel passes, the distribution of NDVI is very diverse. In the tropics where the 10° S parallel passes, the value of NDVI is higher.
3.2. Time Evolution Trend of Global Vegetation
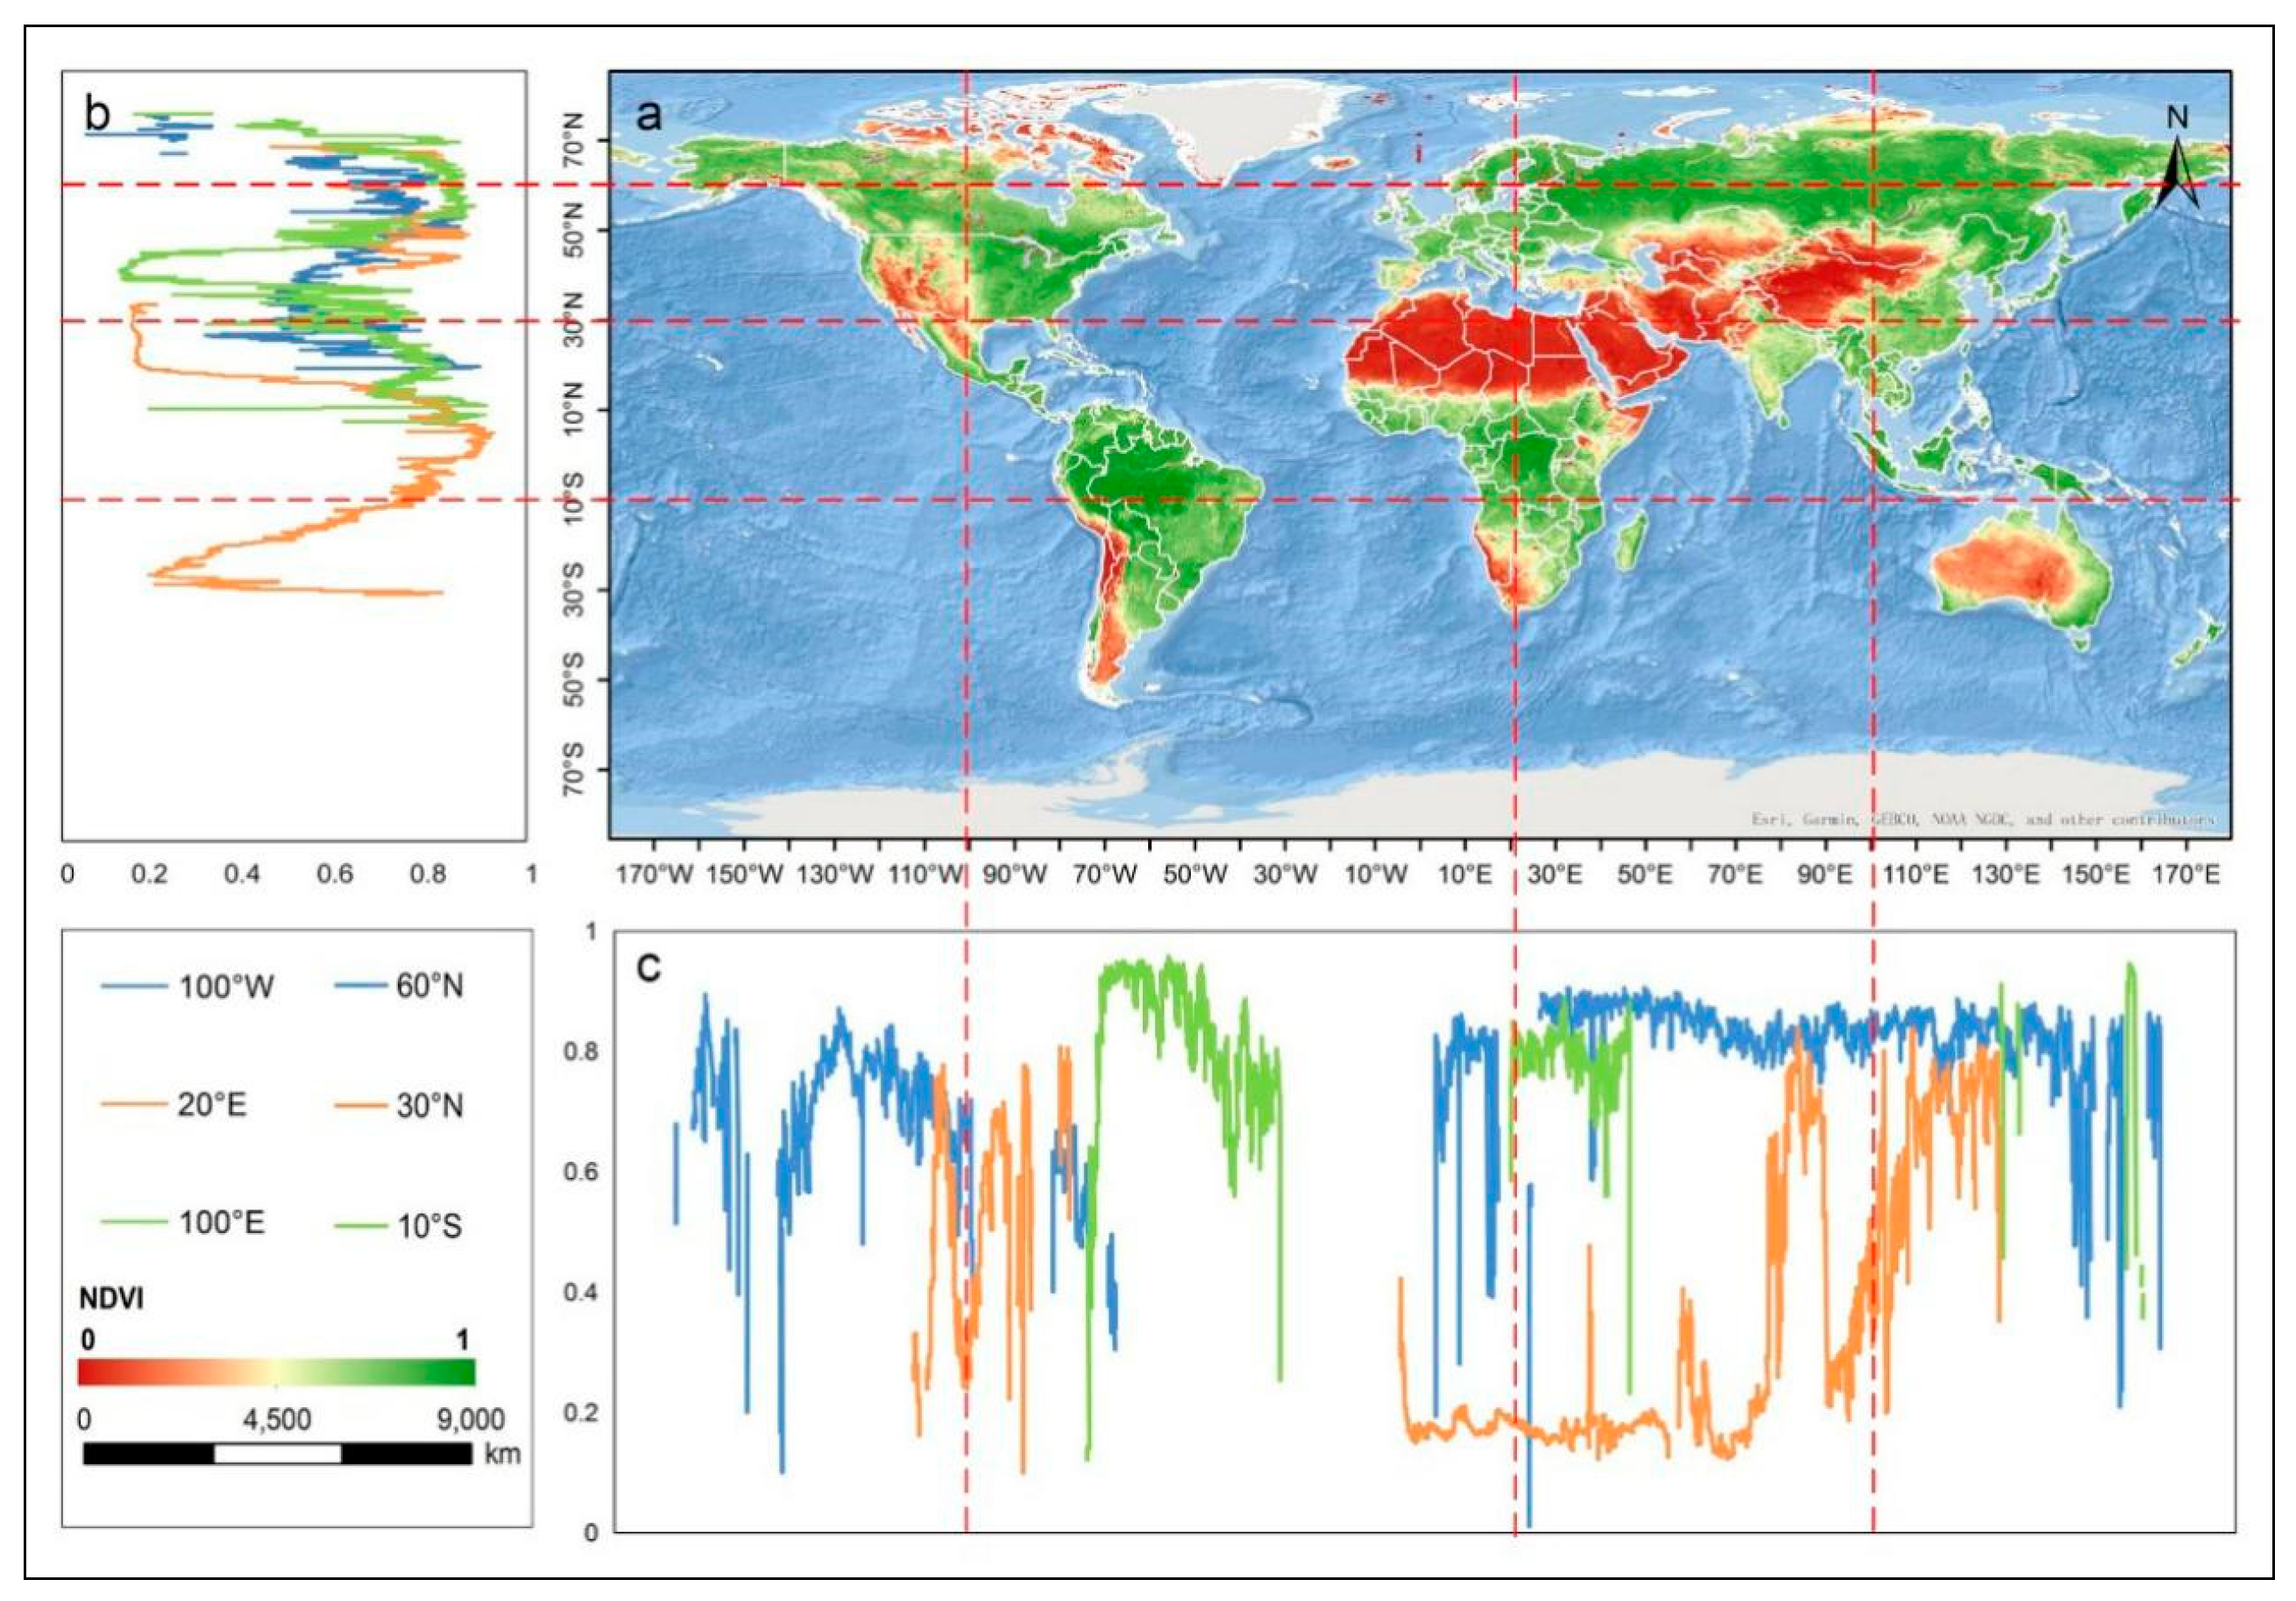
The average annual NDVI from 1982 to 2015 was 0.38. According to the Mann–Kendall mutation test, NDVI mutation occurred in 1989 (Figure 2a), with a significant increasing trend from 1982 to 1989 at a rate of 1.9 × 10⁻³ per year, and a slowly increasing trend from 1990 to 2015. Overall, the global average annual NDVI had been rising at a rate of 4 × 10⁻⁴ per year for 34 years. (Figure 2b)
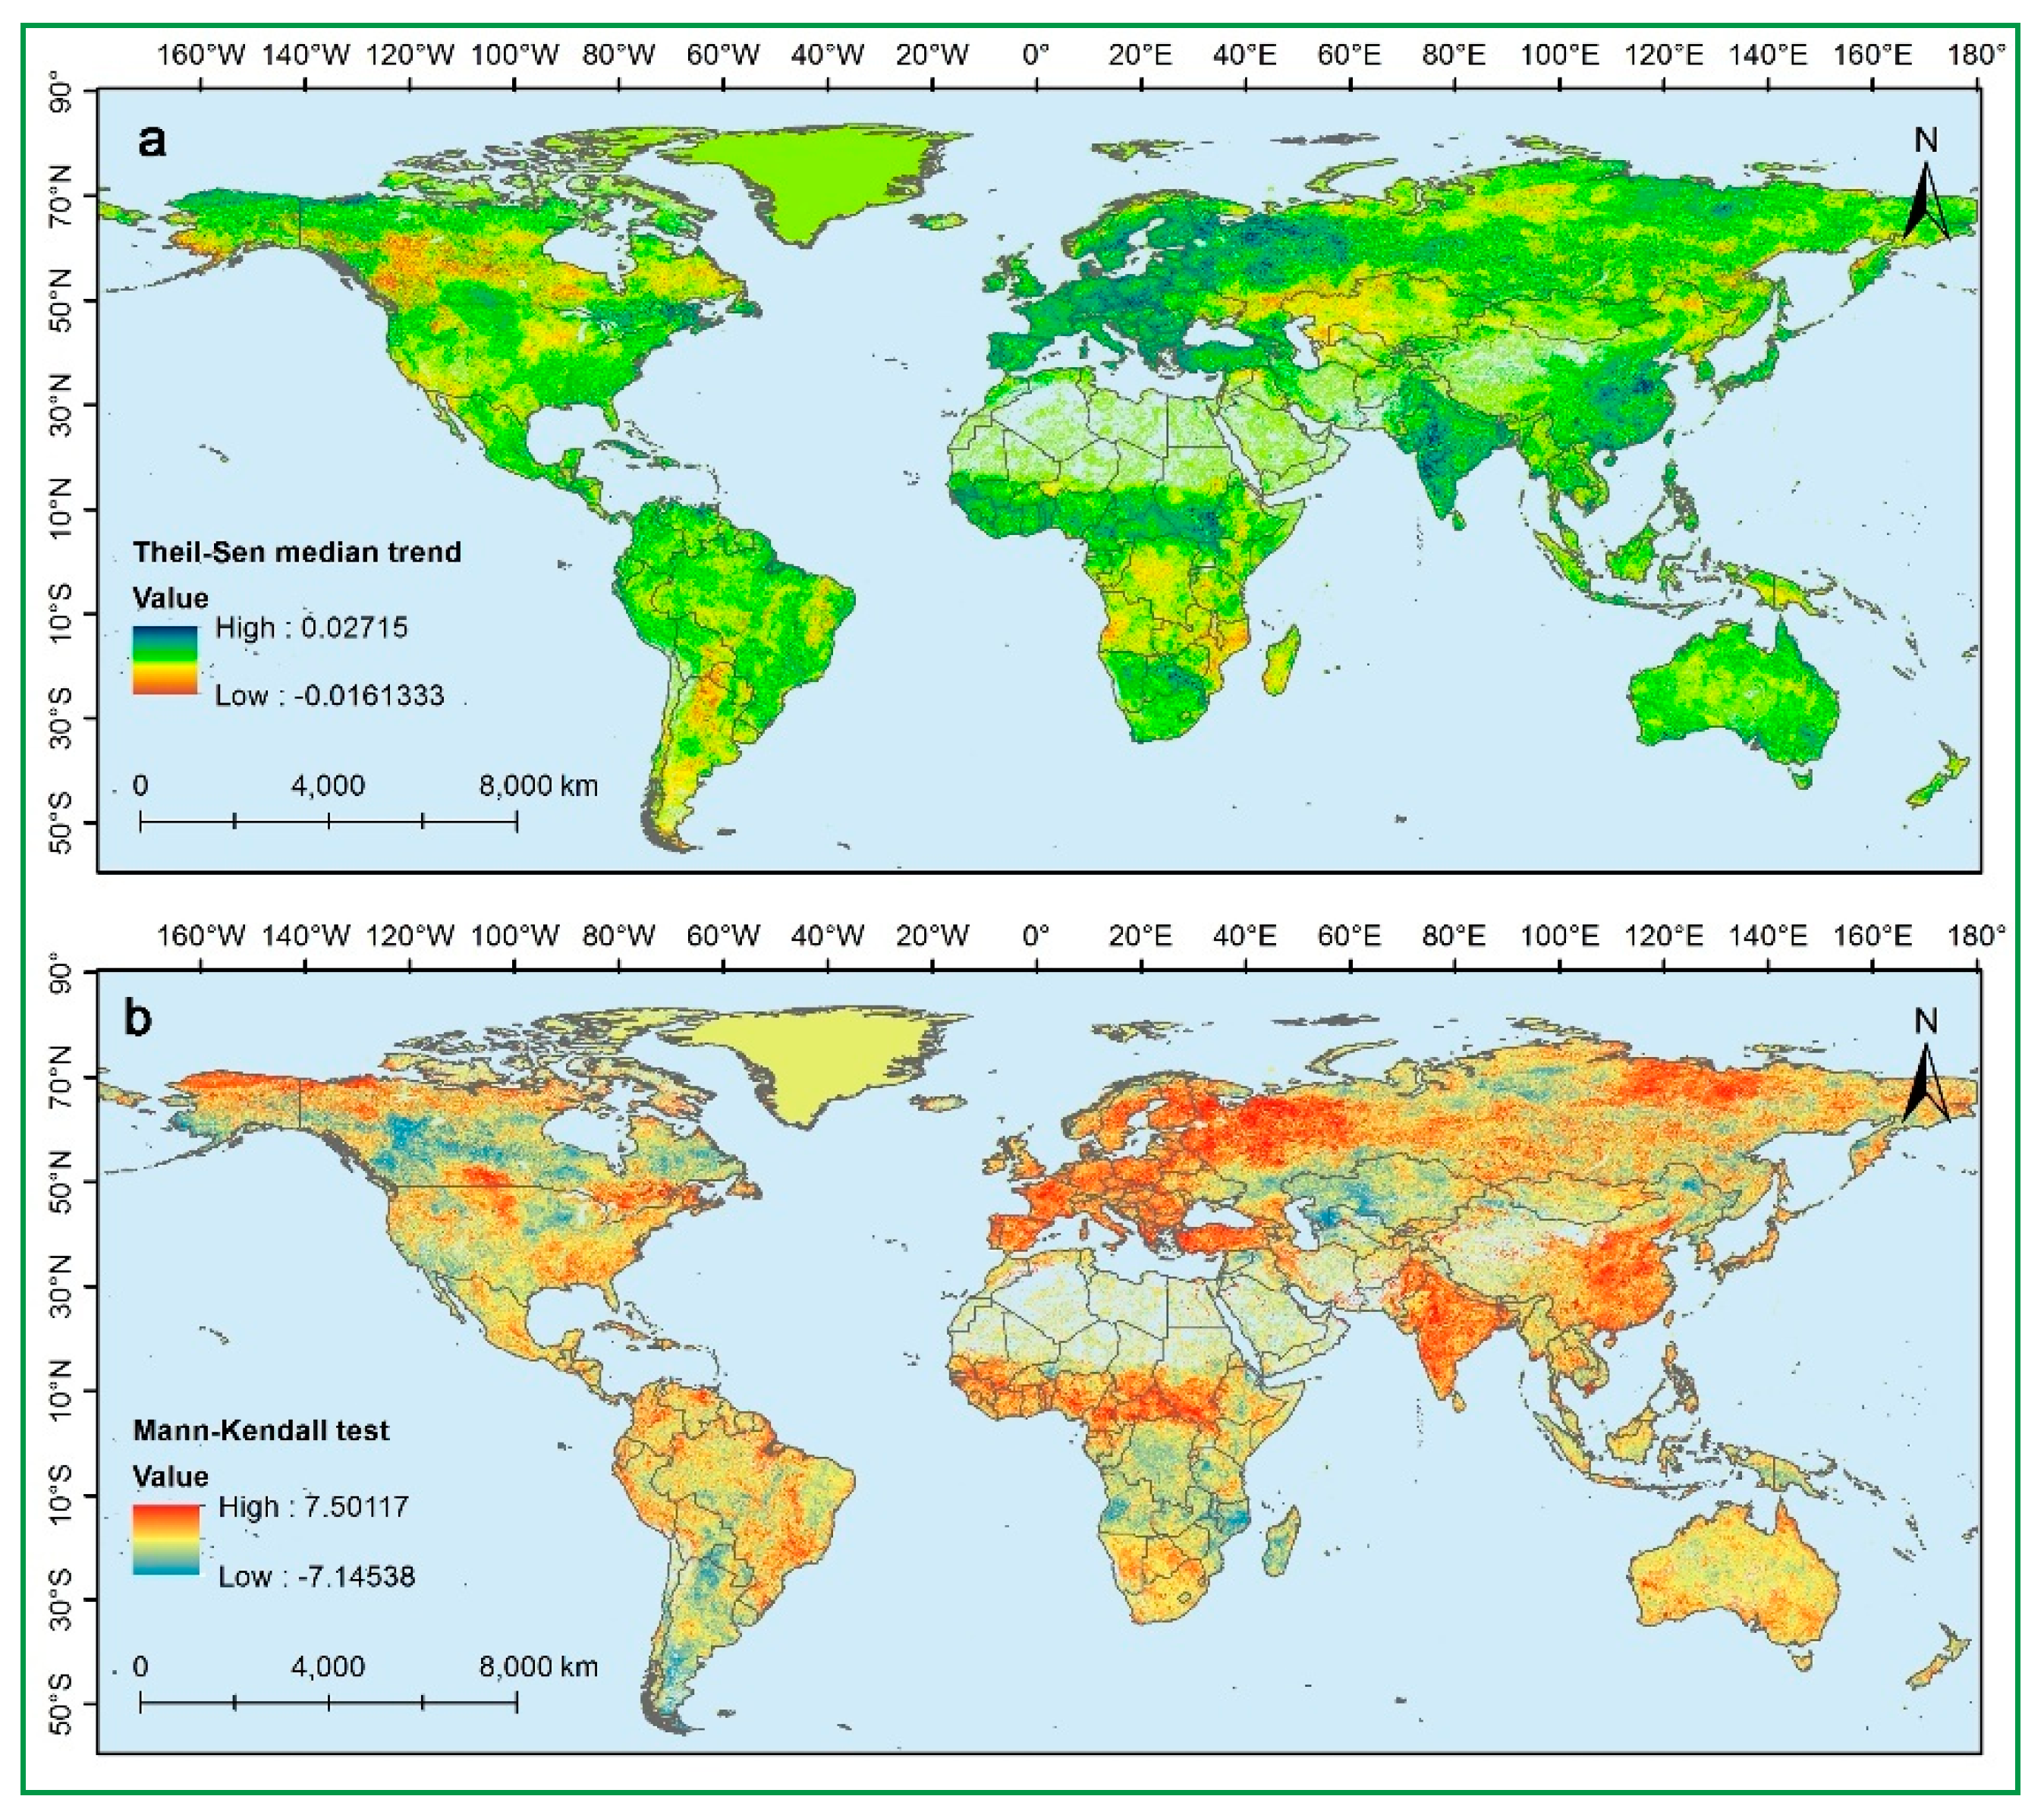
In this study, Theil–Sen median trend analysis and the Mann–Kendall test are combined to reveal the global NDVI change trends from 1982 to 2015 and classify SNDVI. The area where SNDVI ≥ 0.0005 is the increasing area, the area of −0.0005 < SNDVI < 0.0005 is the constant area, and the area of SNDVI < −0.0005 is the decreasing area. The confidence level of the Mann–Kendall test is chosen to be 0.05, and the result is divided into significant changes (Z ≥ 1.96 or Z ≤ −1.96) and the nonsignificant (−1.96 ≤ Z ≤ 1.96). The result shows the two more widely distributed NDVI evolution trend types is “Significant increase” (34%) and “constant” (45%), followed by “Significant decrease” (10%) and “Slight increase” (14%), “Slight increase” (6%), “Slight decrease” (5%). (Figure 3, Table 2)
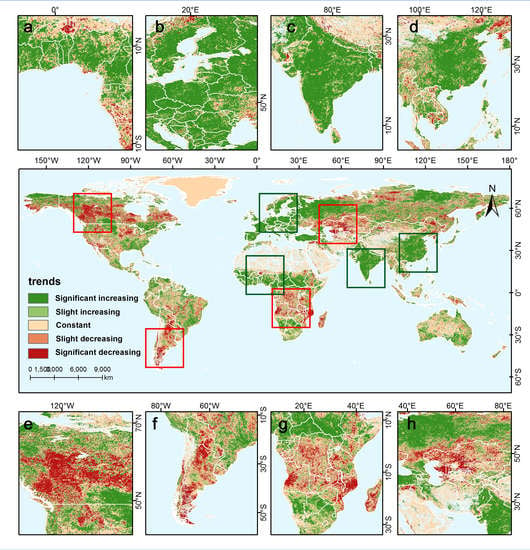
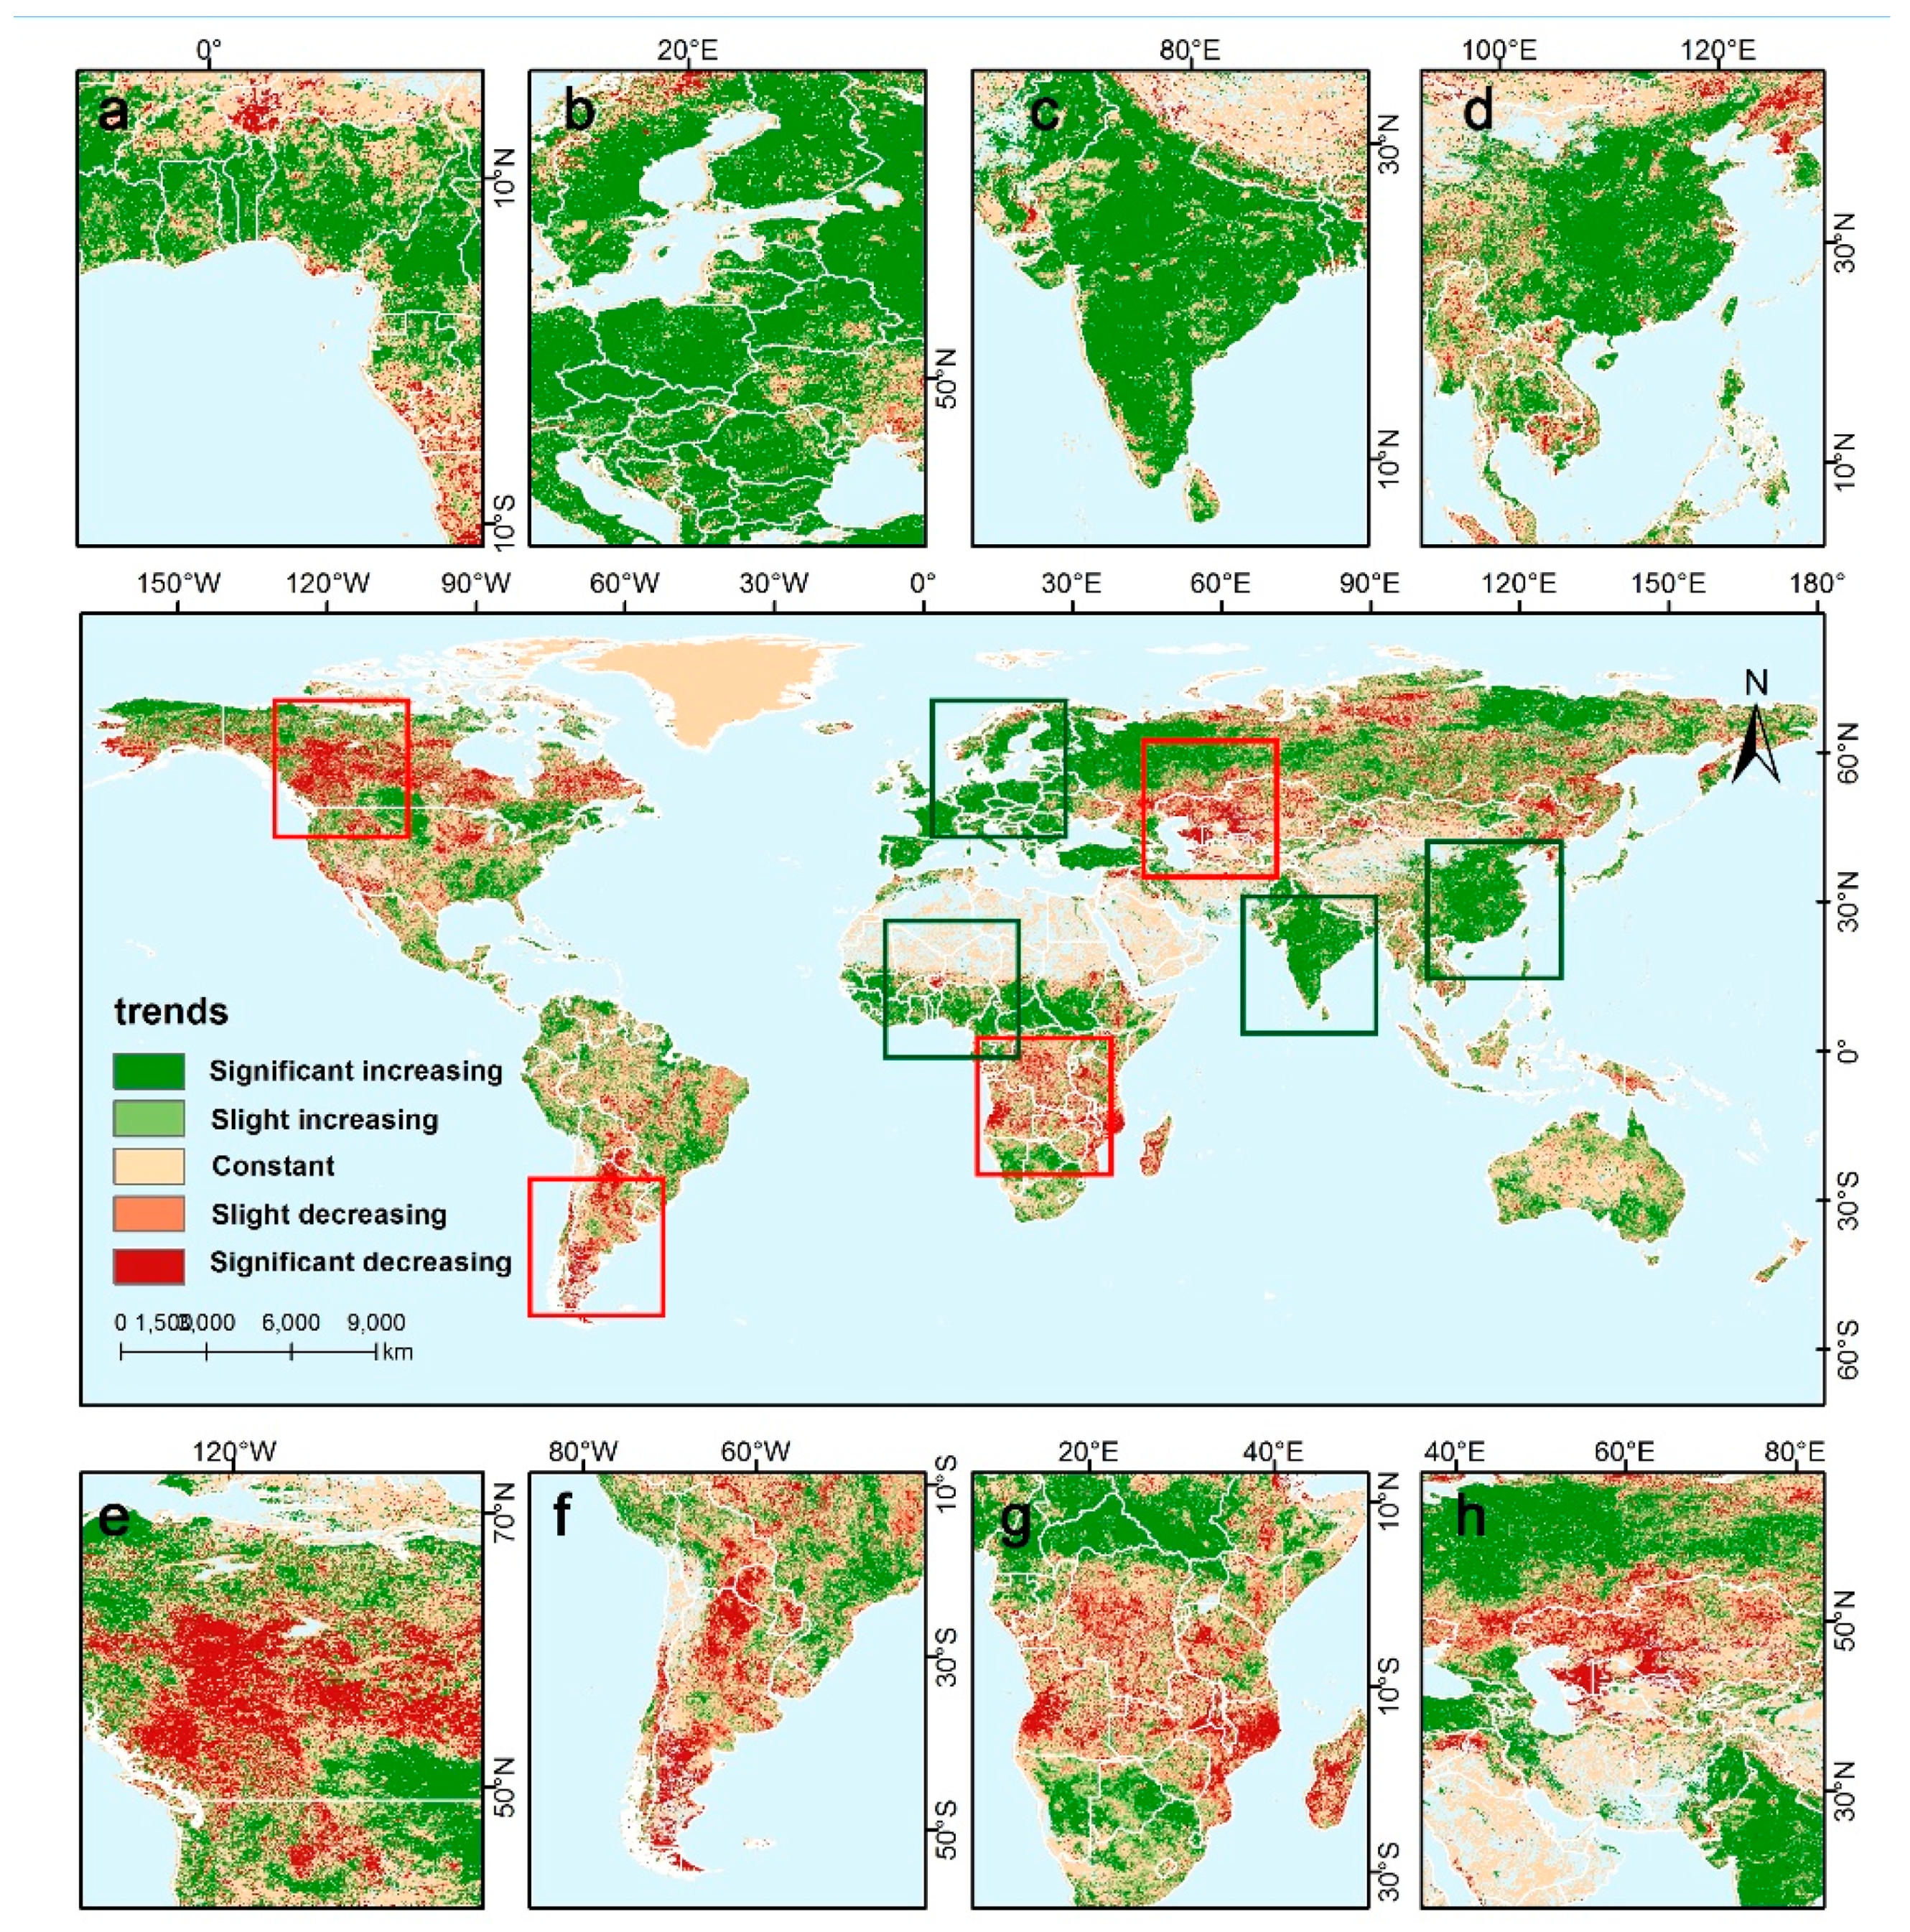
Analyses of the changes in observed GIMMS NDVI 3g data show a widespread greening trend (34% of the continent lands) (Table 2), these are mainly observed in the Sahel (Figure 4a), European (Figure 4b), India (Figure 4c) and south China (Figure 4d) [6]. The data also show decreasing NDVI trend (browning) (10% of the continent lands), and these are observed near Canada (Figure 4e), South America (Figure 4f), central Africa (Figure 4g) and Central Asia (Figure 4h).
3.3. Correlation Analysis between NDVI and Factors
3.3.1. Temperature
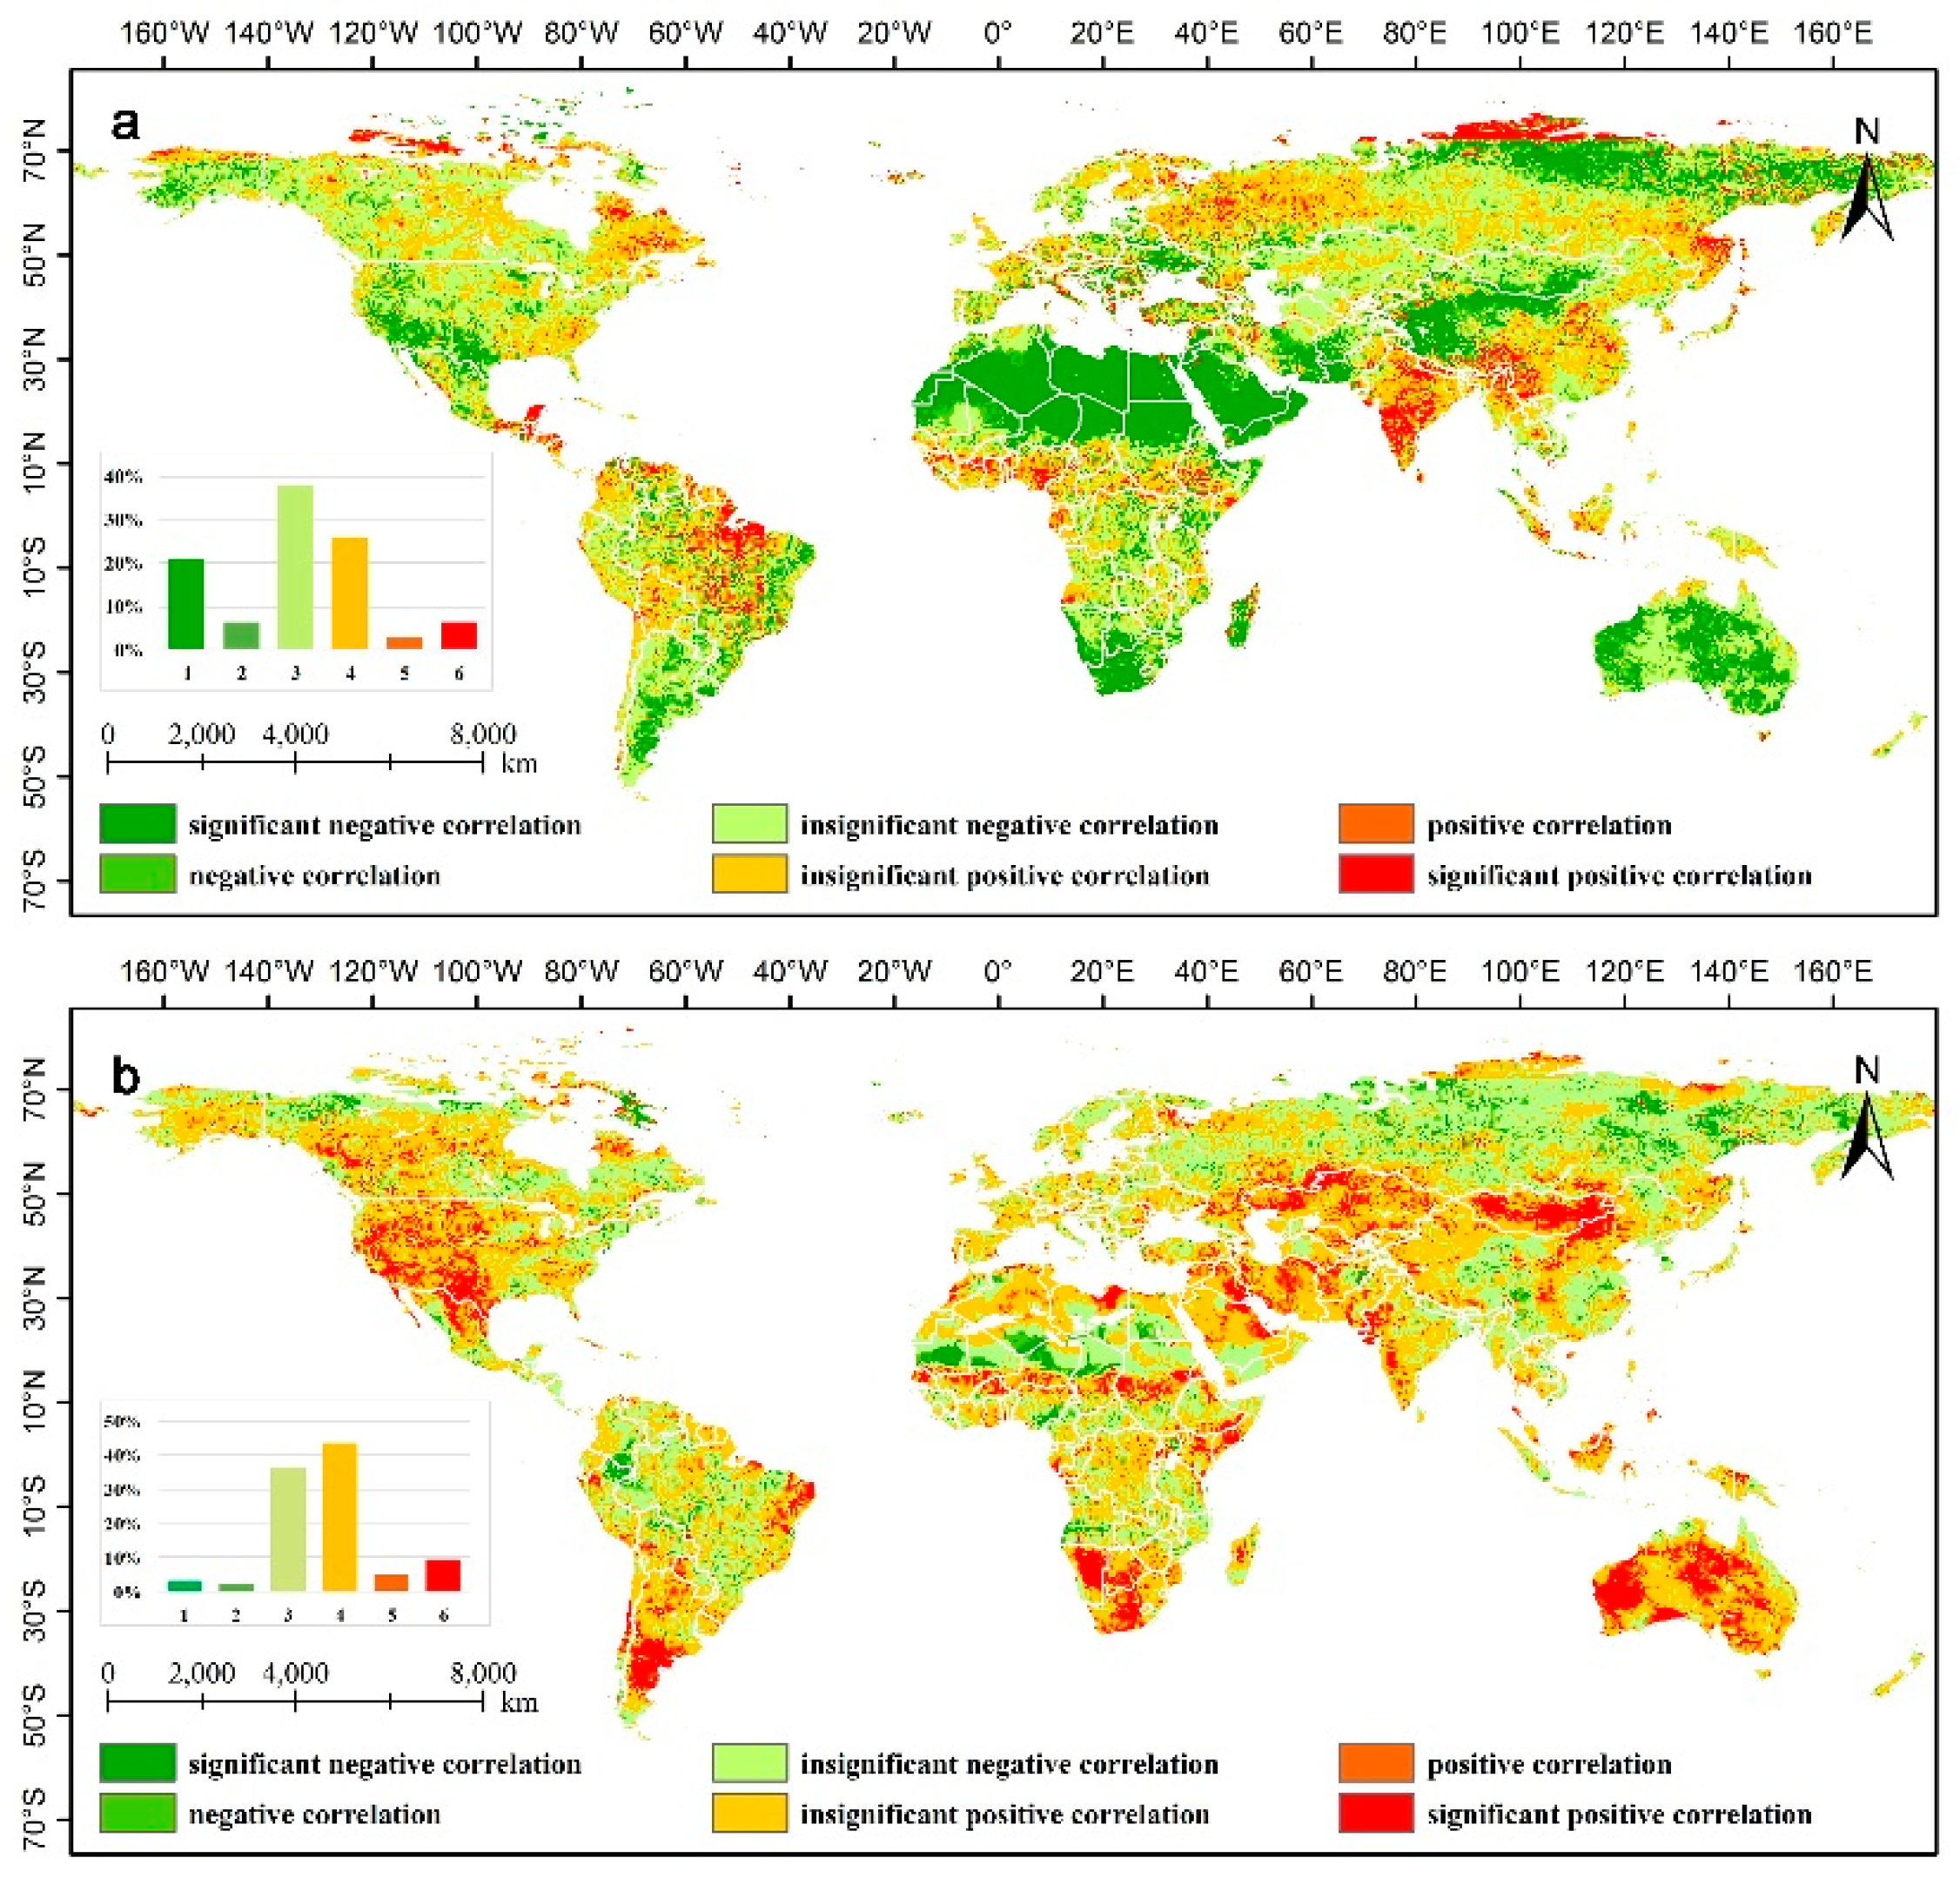
About 36% of the vegetation has experienced a positive and negative correlation with temperature, and among which about 27% is statistically significant. We performed correlation analysis at the temperature and NDVI, and they showed significant negative correlation in the relatively dry areas, such as North America (especially in the southern part of the US), southern Argentina, Sahara Desert, southern Africa, the Middle East, the Arabian Peninsula, northwestern China, northern Russia and Australia; which indicates that the increase in temperature is not conducive to the growth of vegetation in the region. The negative correlation may be caused by an increase in the evaporation of soil moisture resulting from the rise in temperature, which then leads to the decline of soil moisture; in this case, the ‘physiological drought’ of plants occurs and limits the photosynthesis and growth rate of plants [40]. On the equator or low latitude areas, such as the Sino–American isthmus, near the Amazonian estuary, Coast of the gulf of guinea, India and Yarlung Zangbo Grand Canyon [41], the distribution of the NDVI is significant positively correlated with temperature. These indicate that the growth of vegetation in these areas is greatly affected by temperature and increases with the increase of temperature. (Figure 5a)
3.3.2. Rainfall
About 21% of the vegetation has experienced a positive and negative correlation with rainfall, and among which, about 13% is statistically significant. Figure 5b shows that the NDVI showed significant positive correlation with rainfall in the Midwest and Southwest regions of the US, Central Argentina, the northern and southern margins of the Sahara Desert, southern Africa, the Persian Gulf coast, western India, Mongolia and central and western Australia. These areas exhibit a sparse vegetation coverage, which indicates that water is the most important factor that limits the growth of vegetation in the area. The significant negative correlation between the NDVI and rainfall is mainly distributed in the Amazon plain, western Brazilian Plateau, southern Sahara, part of Russia and southern China. These places are usually moist; thus, the growth of vegetation benefits from relatively abundant rainfall. Such excessive rainfall leads to increased cloud cover, reduced incident radiation and increased soil moisture. These conditions lead to the increase of the ground latent heat of evaporation, which in turn results in decreased temperature, reduced photosynthesis ability and unfavourable influence on vegetation growth.
3.3.3. Nighttime Lights Index
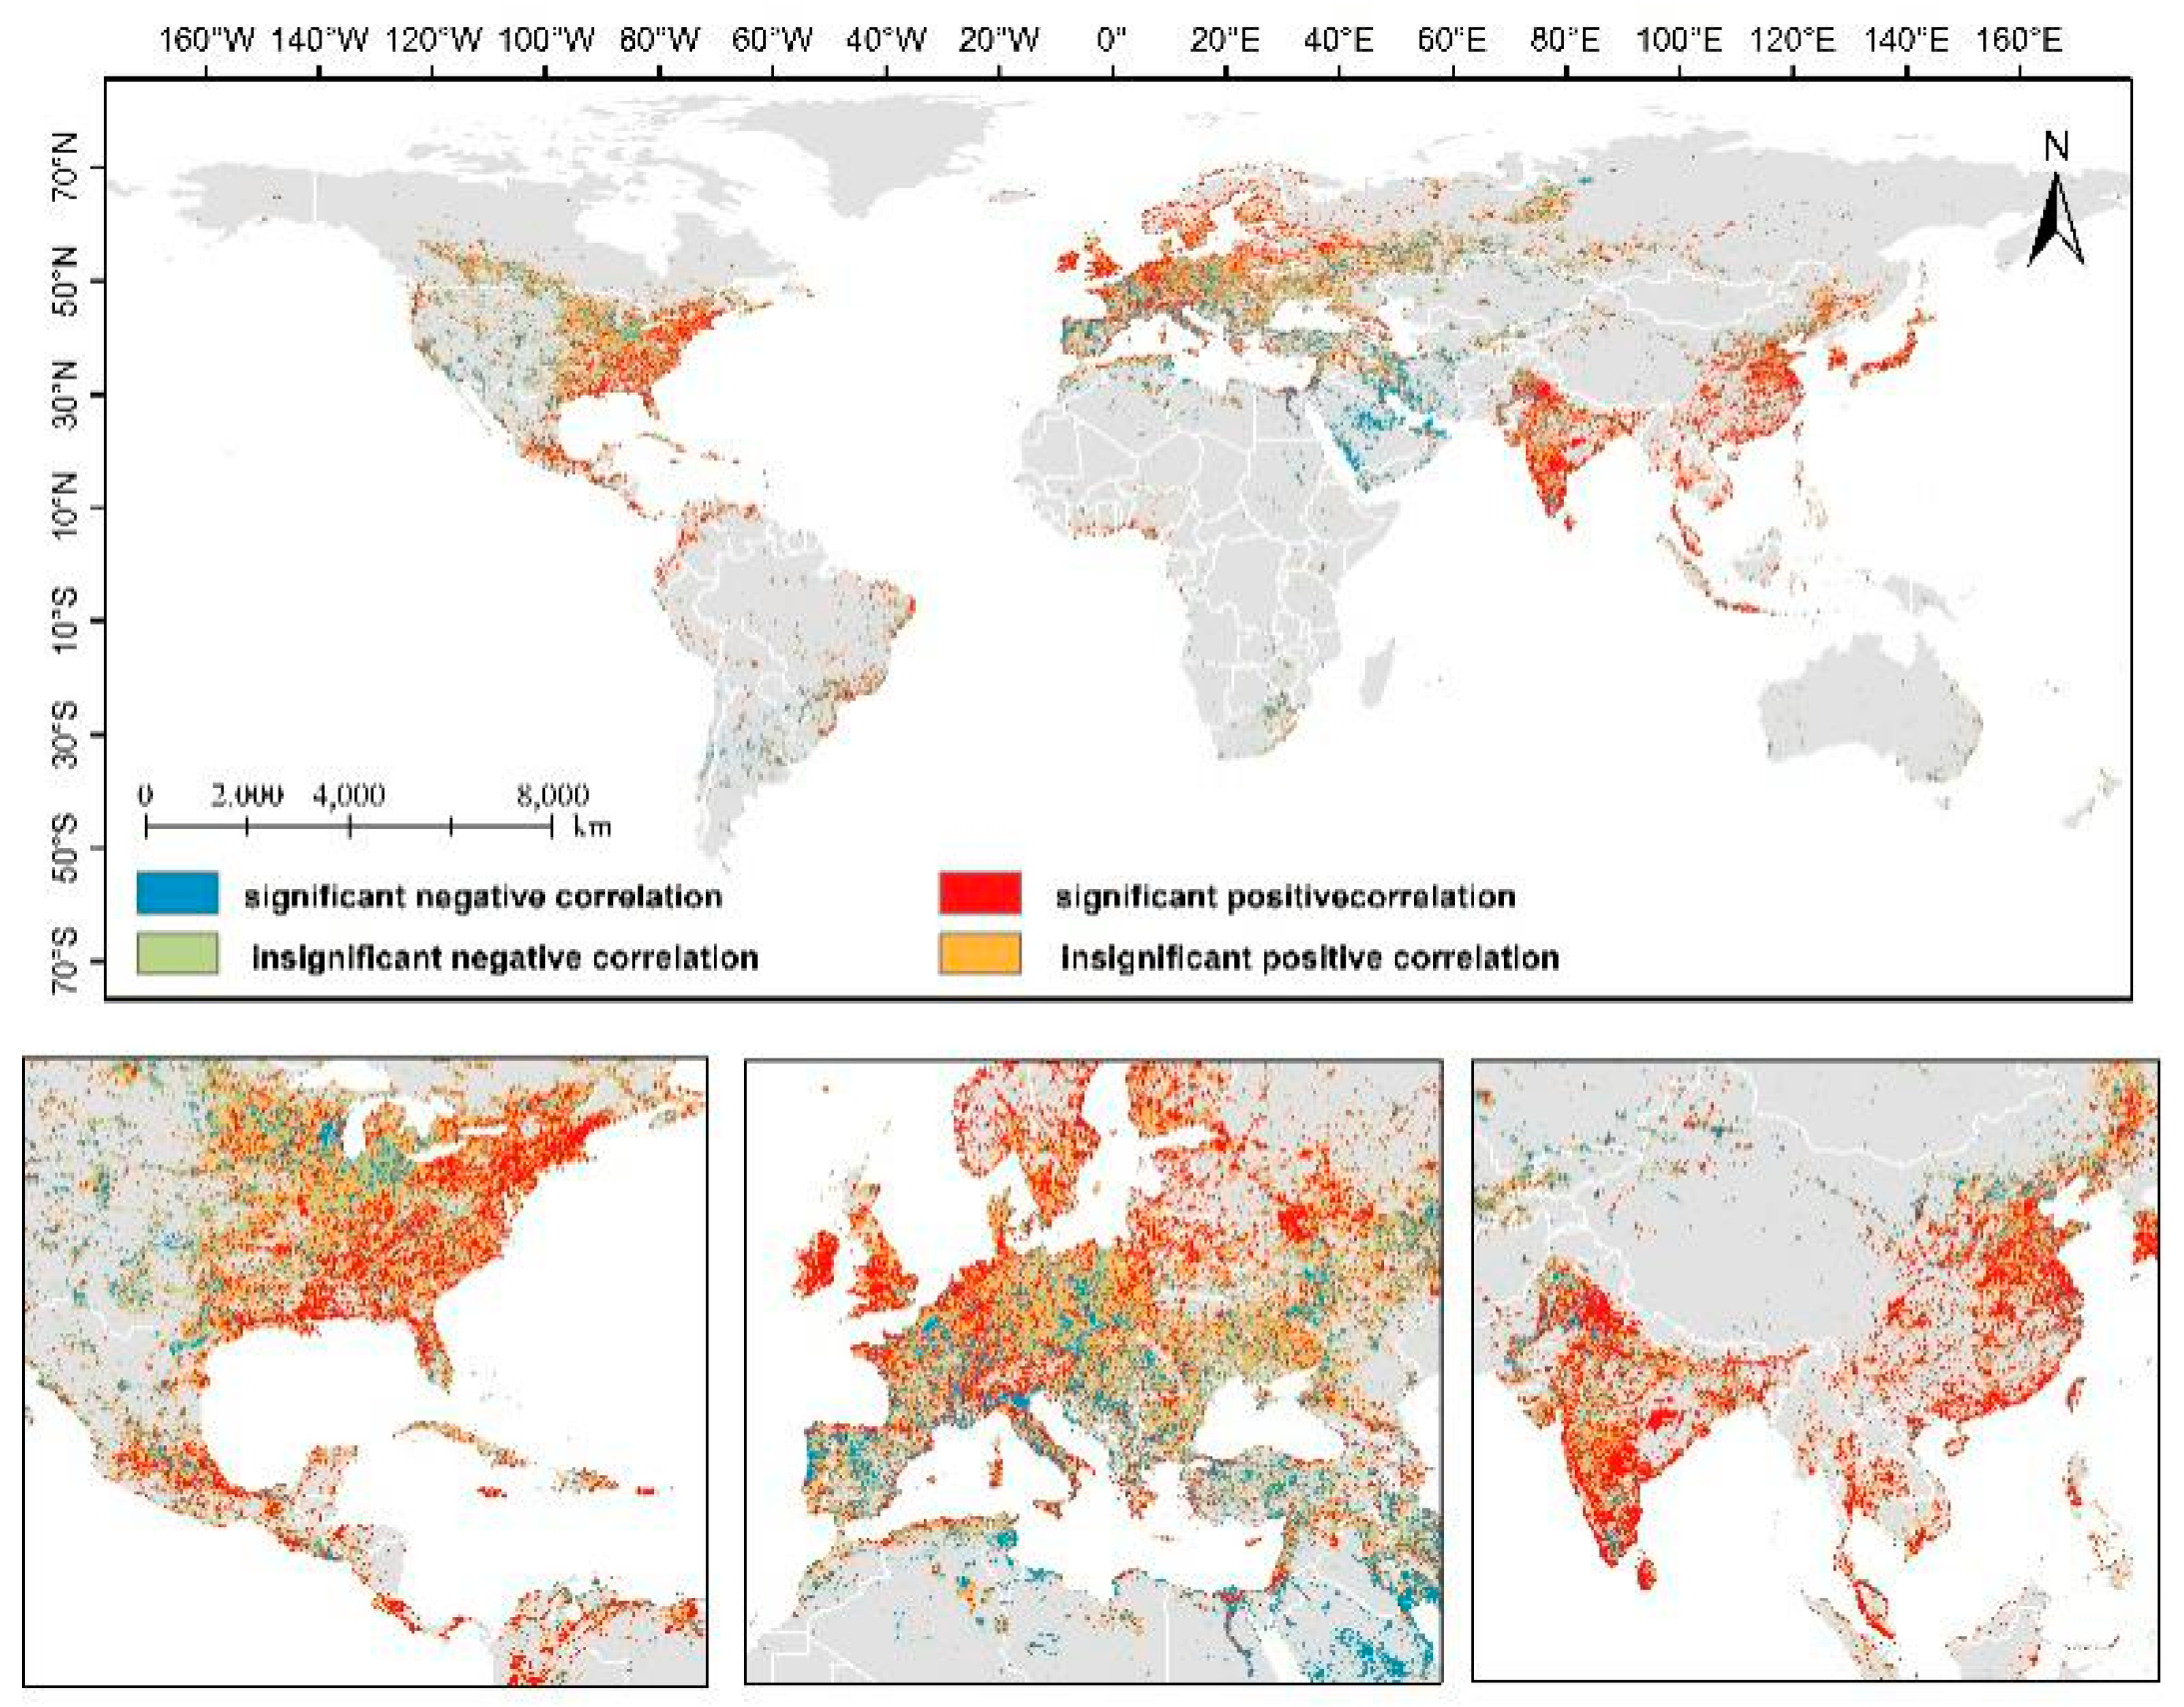
Other studies have shown a negative correlation between nighttime lights index and the NDVI [25,42]. In our study, the NDVI and nighttime lights index are significantly negatively correlated in Eastern Europe, the Middle East, western part of North America and southern Africa. However, in north Europe, southeast America, the east China coast, India, Japan and other densely populated areas, a significant positive correlation is demonstrated. The GIMMS NDVI and nighttime lights index data are also low-resolution data whose unit pixels occupy areas that are so large that we cannot show their correlation in an in-depth manner.
From a low-resolution perspective and from an overall perspective, the regions mentioned above, such as northern Europe, show high vegetation coverage (Figure 6), dense population and high economic development [43]; these regions also include eastern China [44,45,46]. In the Middle East, the dry climate is not conducive to vegetation growth, hence the NDVI value of less than 0.2 per year. A high nighttime lights index exists in developed cities where the NDVI and nighttime lights index show a negative correlation. Moreover, the enlarged view shows that the nighttime lights index and NDVI share a significantly negative correlation, with the correlation coefficient being less than −0.3 in the areas of London, Ganges River in India and other large cities such as the urban agglomerations along the Yangtze River.
3.3.4. Digital Elevation Model (DEM)
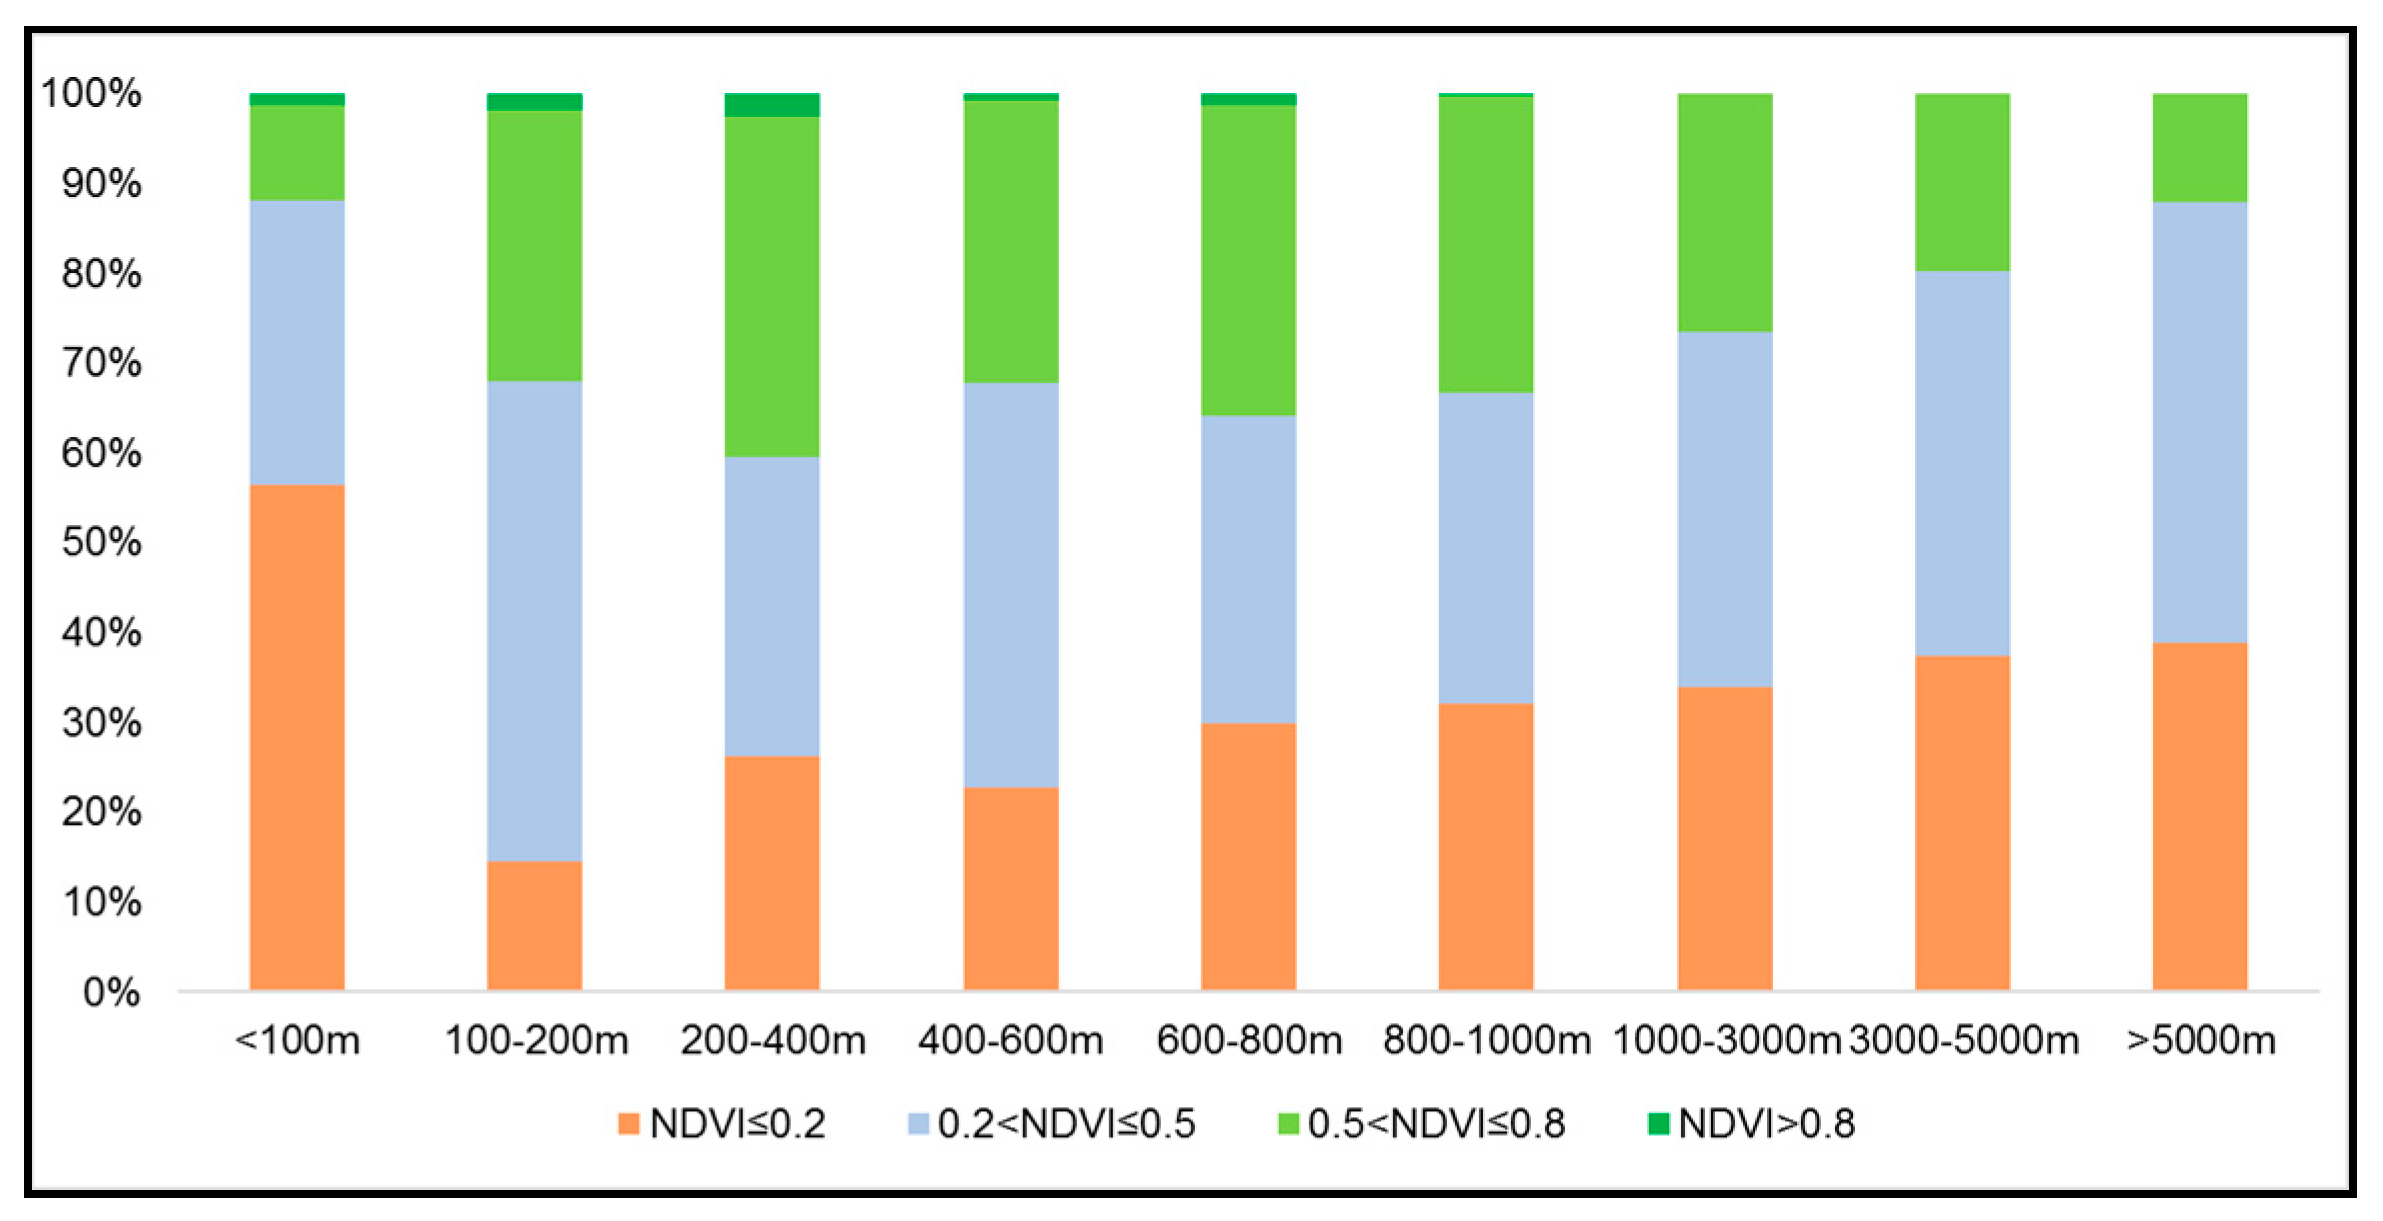
In this study, vegetation coverage and DEM were divided into 4 grades and 9 grades respectively to analyze vegetation distribution regulation at altitude (Figure 7). The results show that, above 100 m, vegetation coverage increases with elevation, and the area of medium vegetation coverage does not change much at each altitude level, which reveal that the growth of vegetation is affected by altitude to a certain extent.
3.4. Contribution of Impact Factors
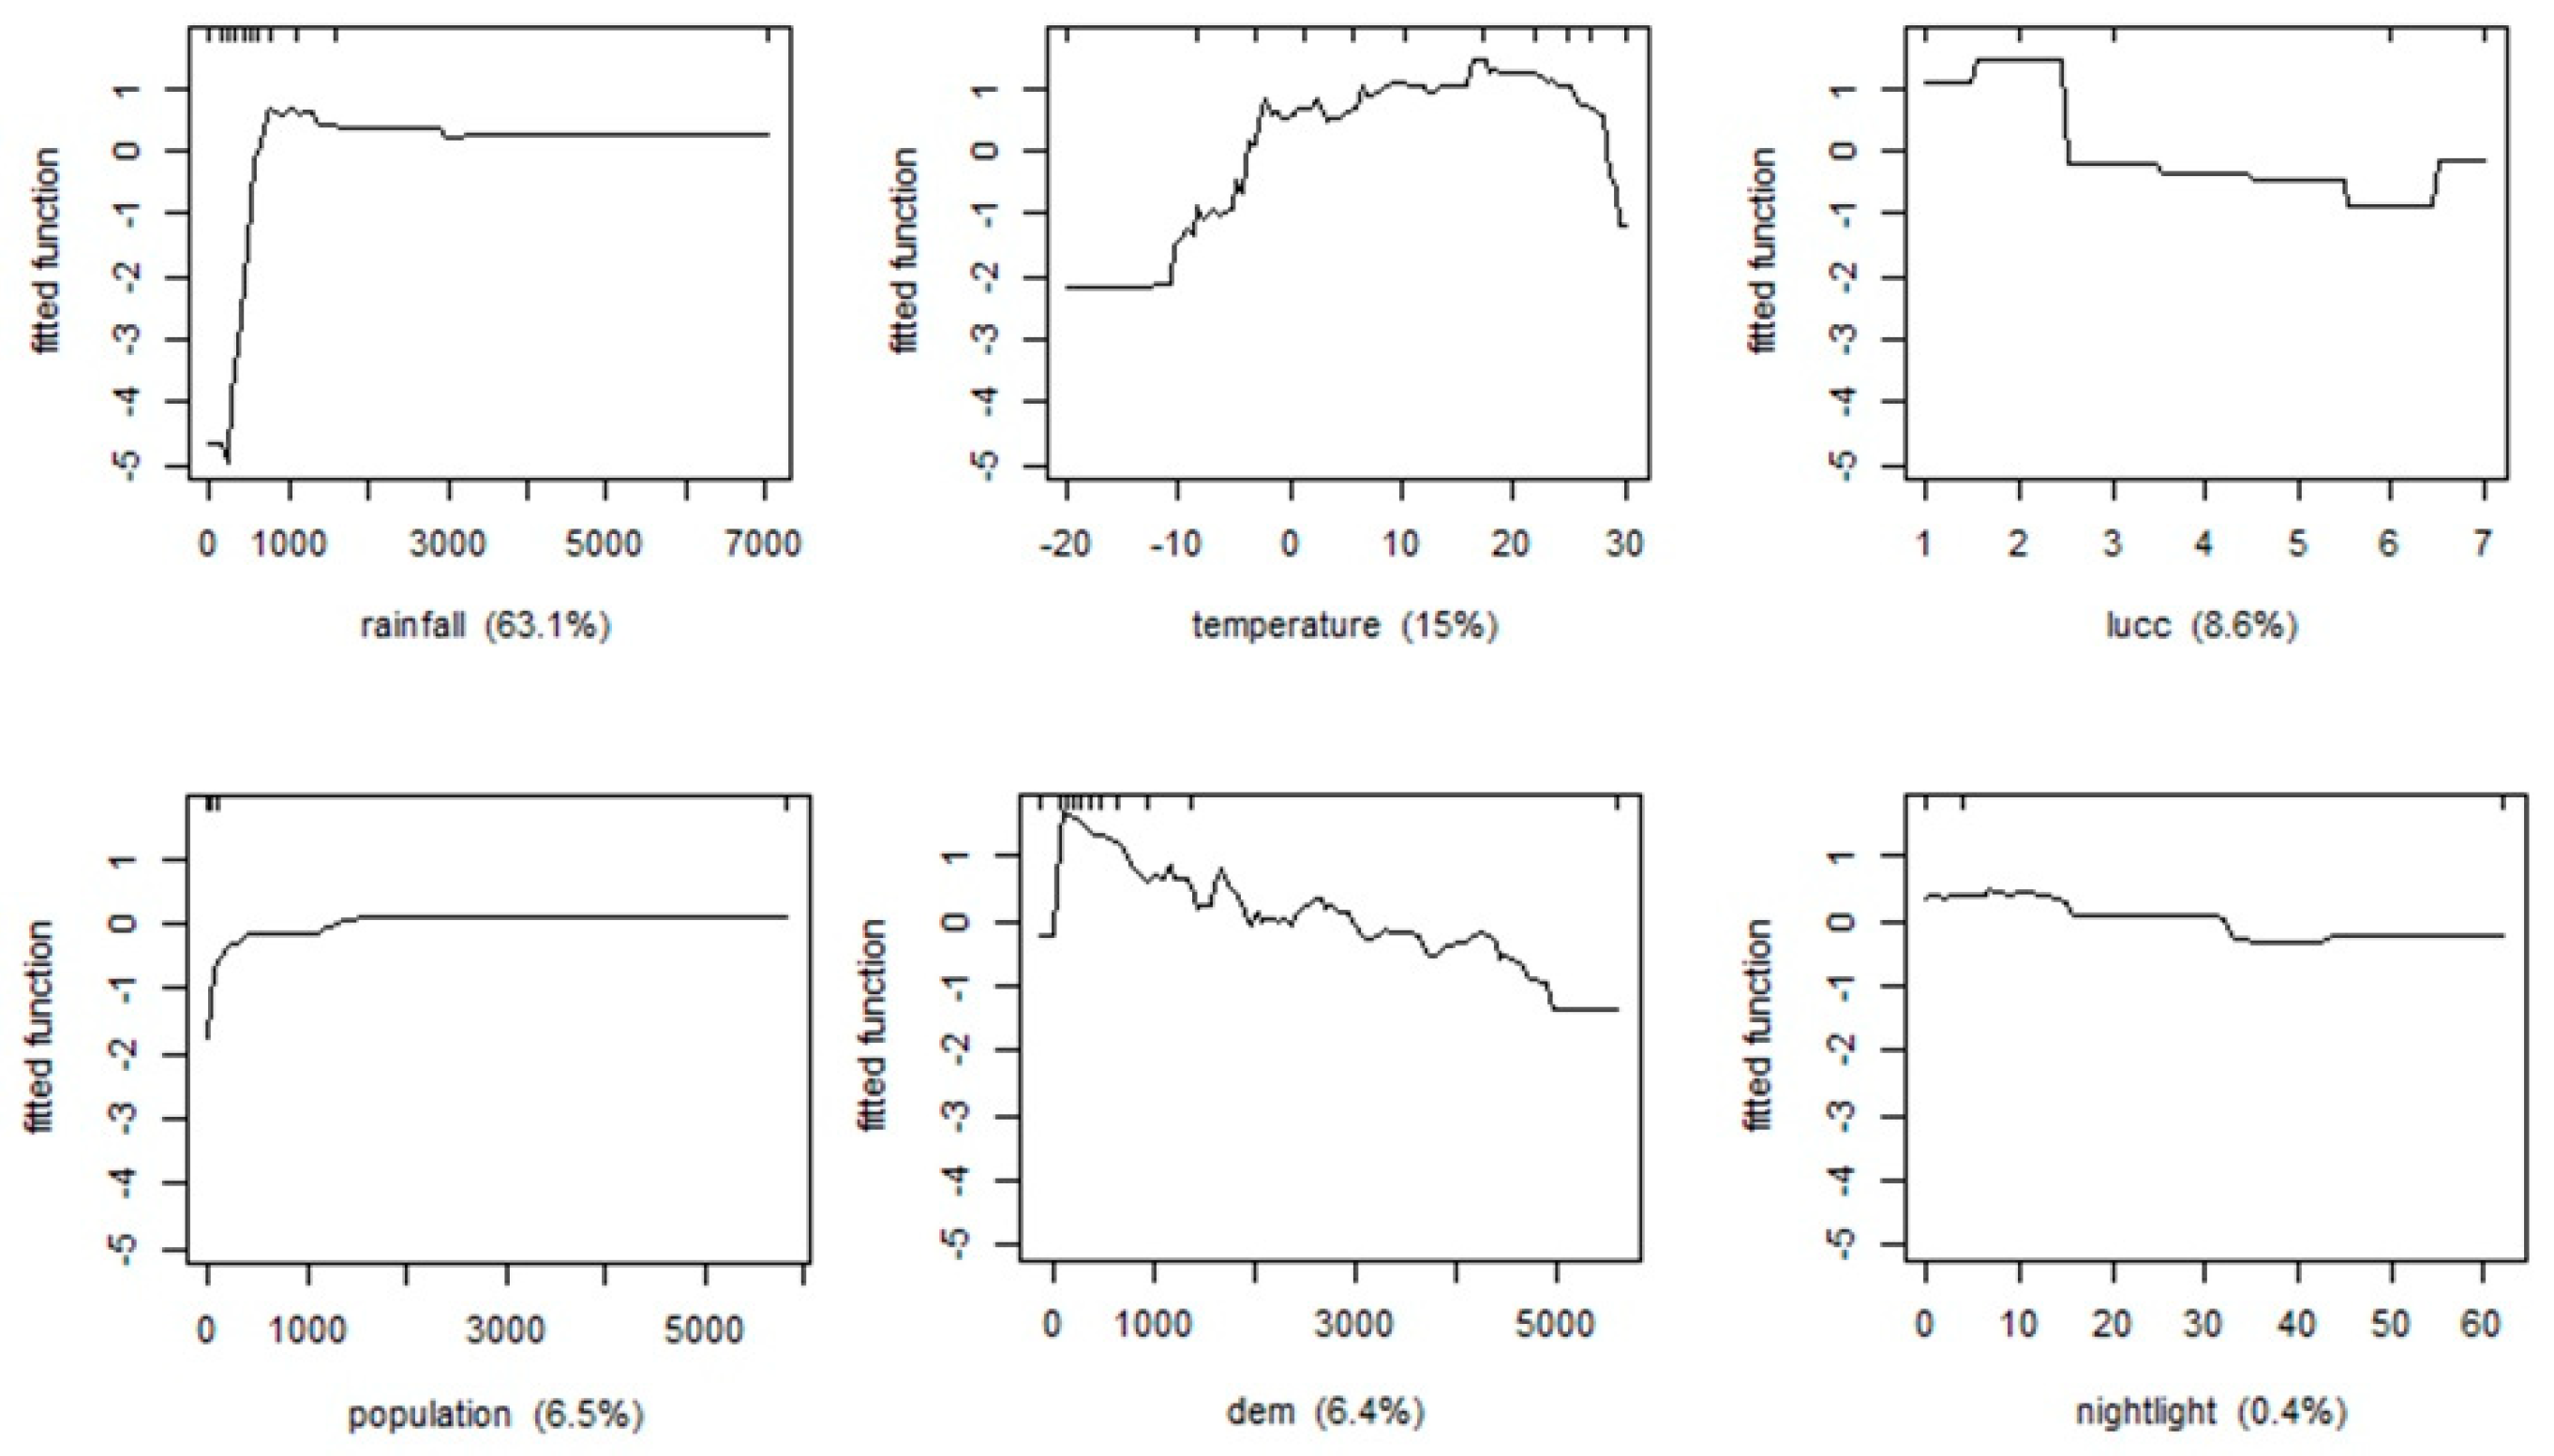
We use the Generalized Boosted Regression Models (GBM) package written by Elith in R language. Set the tree complexity = 5, learning rate = 0.005, and bag fraction = 0.5. In each calculation 50% of the data was extracted, and 5 cross validations was performed. A vegetation influencing factor model consisting of 3450 decision trees was constructed. Figure 8 shows the contribution rate of an independent variable to the influence of the dependent variable, as well as the relationship between the independent variable and the dependent variable when other independent variables remain unchanged or the mean value is taken. The results show that rainfall is the most important factor affecting vegetation evolution (63.1%), followed by temperature (15%), LUCC (8.6%), population (6.5%), DEM/elevation (6.4%) and nightlight (0.4%) (Figure 8).
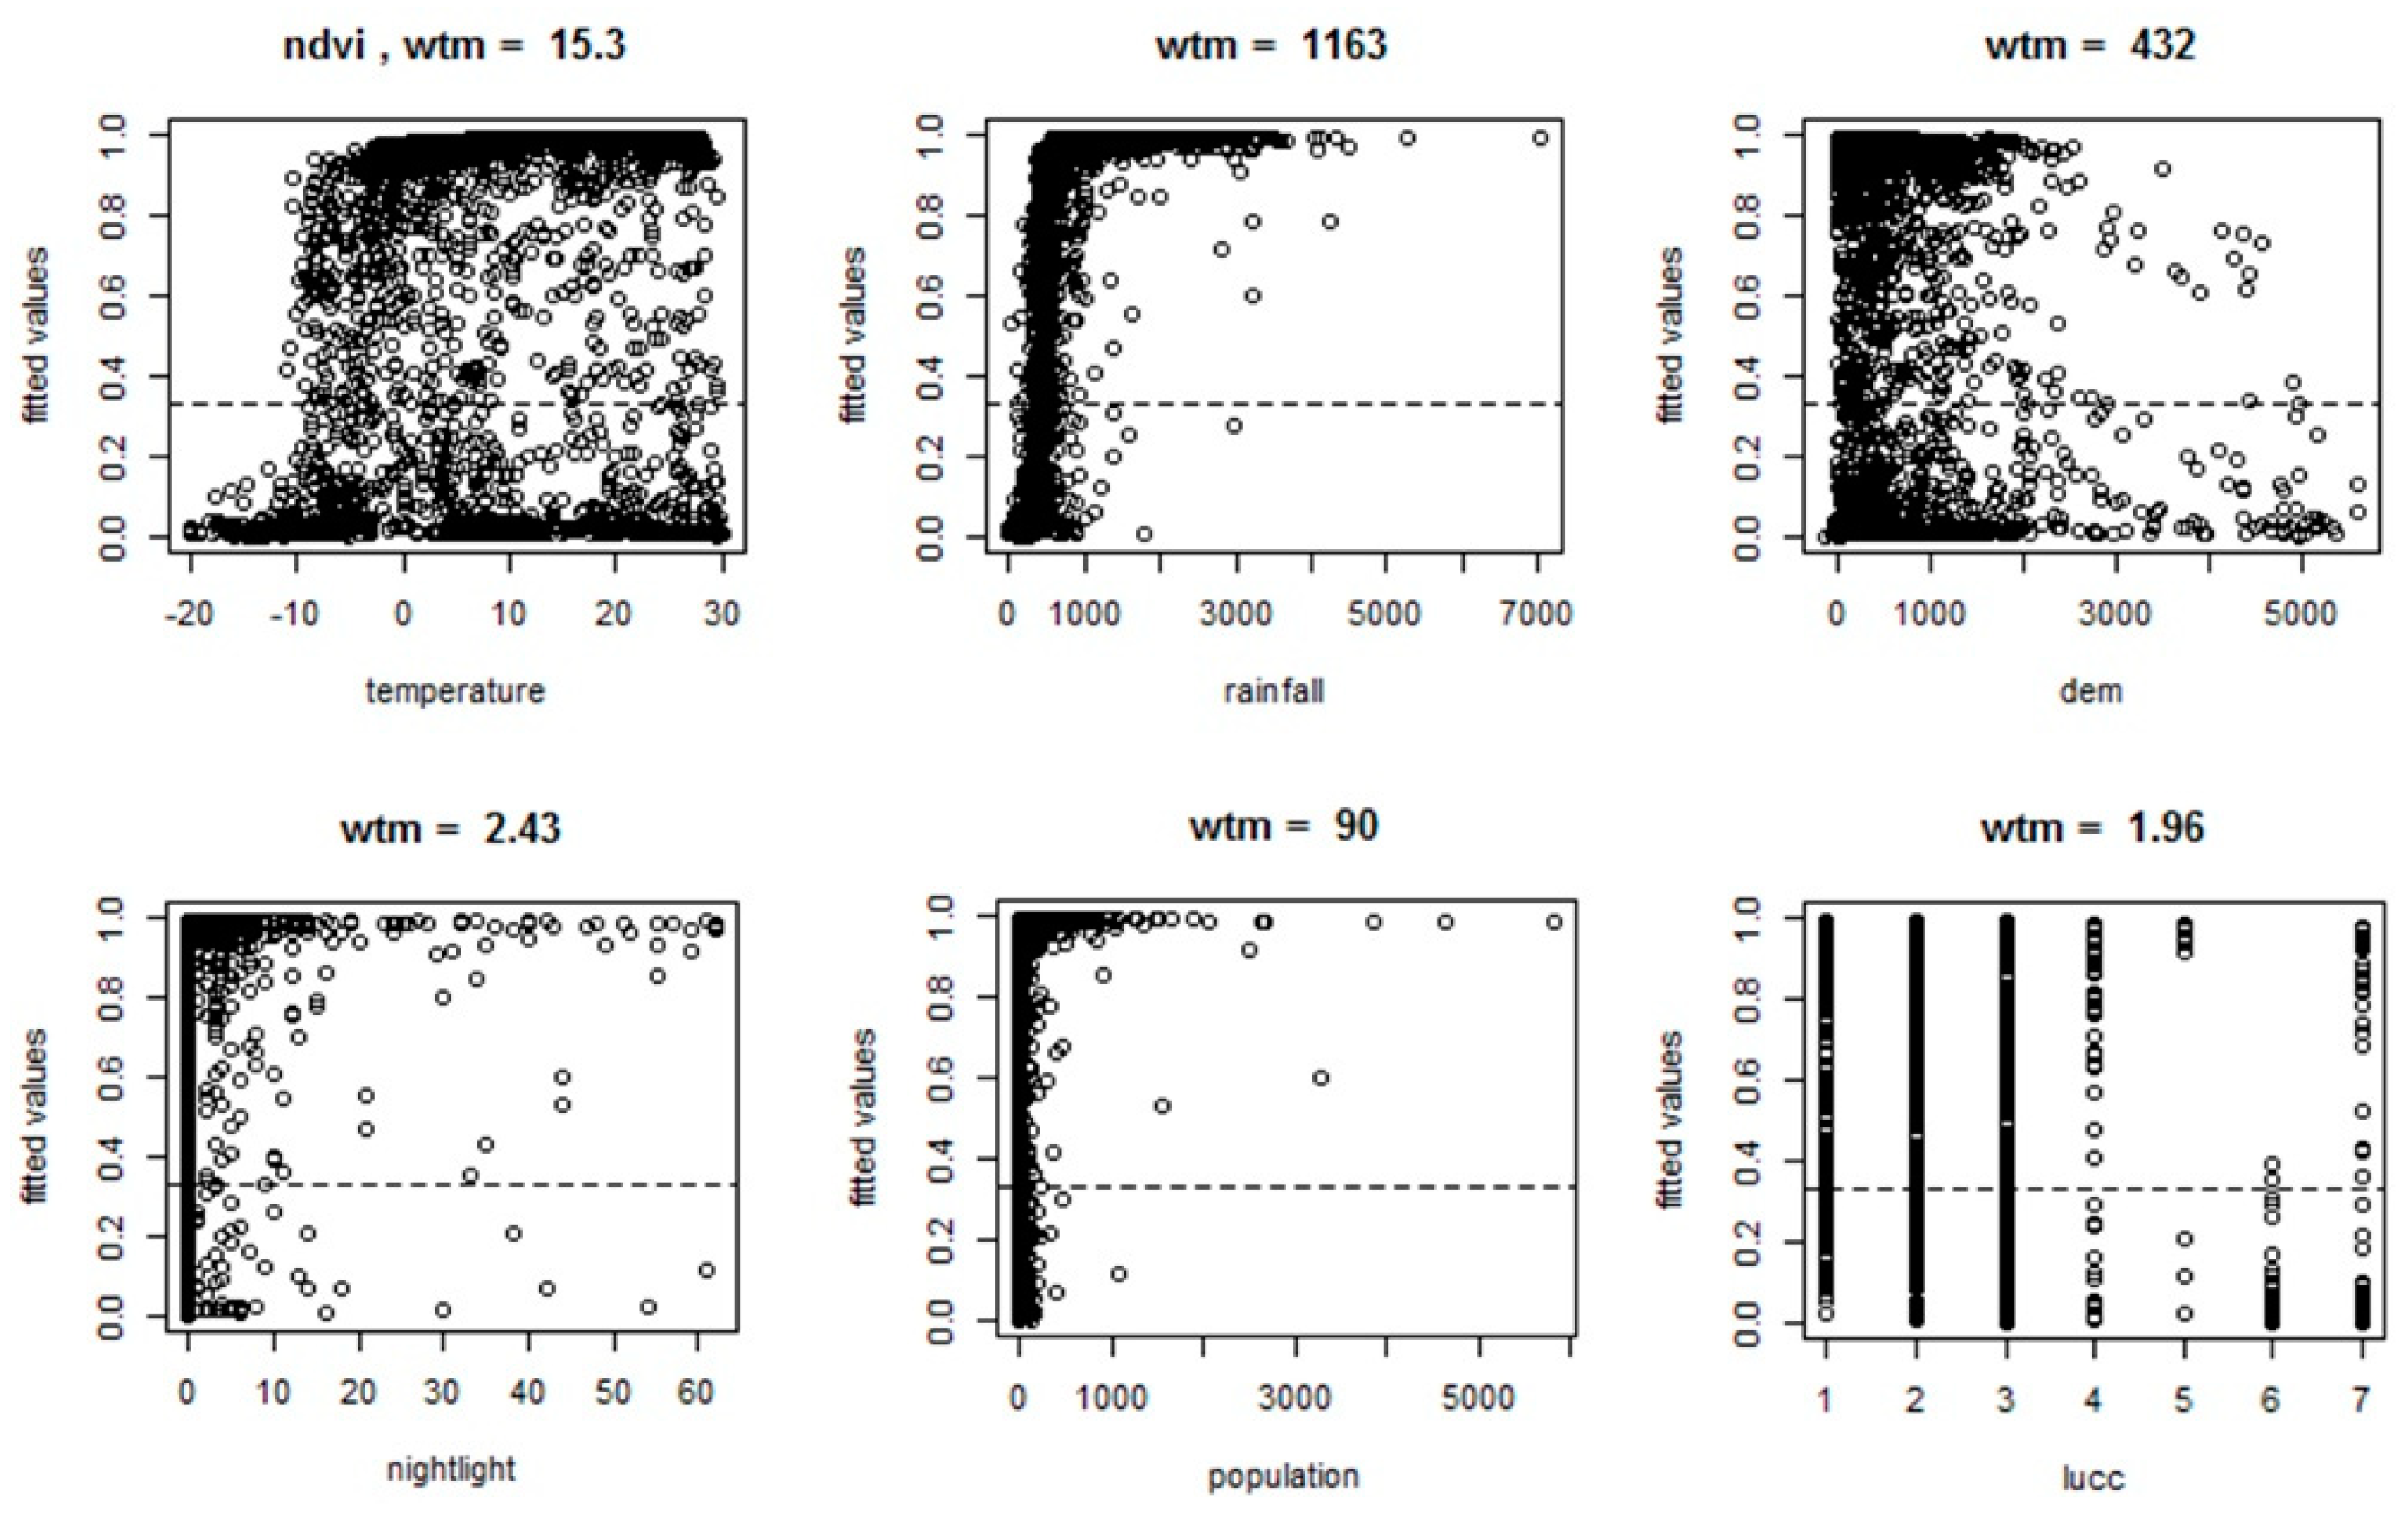
Figure 9 indicate the fitted values in relation to the six predictors used in the model. Areas with high vegetation coverage are concentrated in areas with temperatures greater than 0 °C, rainfall less than 3000 mm, and elevations less than 2000 m. Nightlight and population have less impact on NDVI.
4. Discussion
4.1. The Impact of Land-Use Management
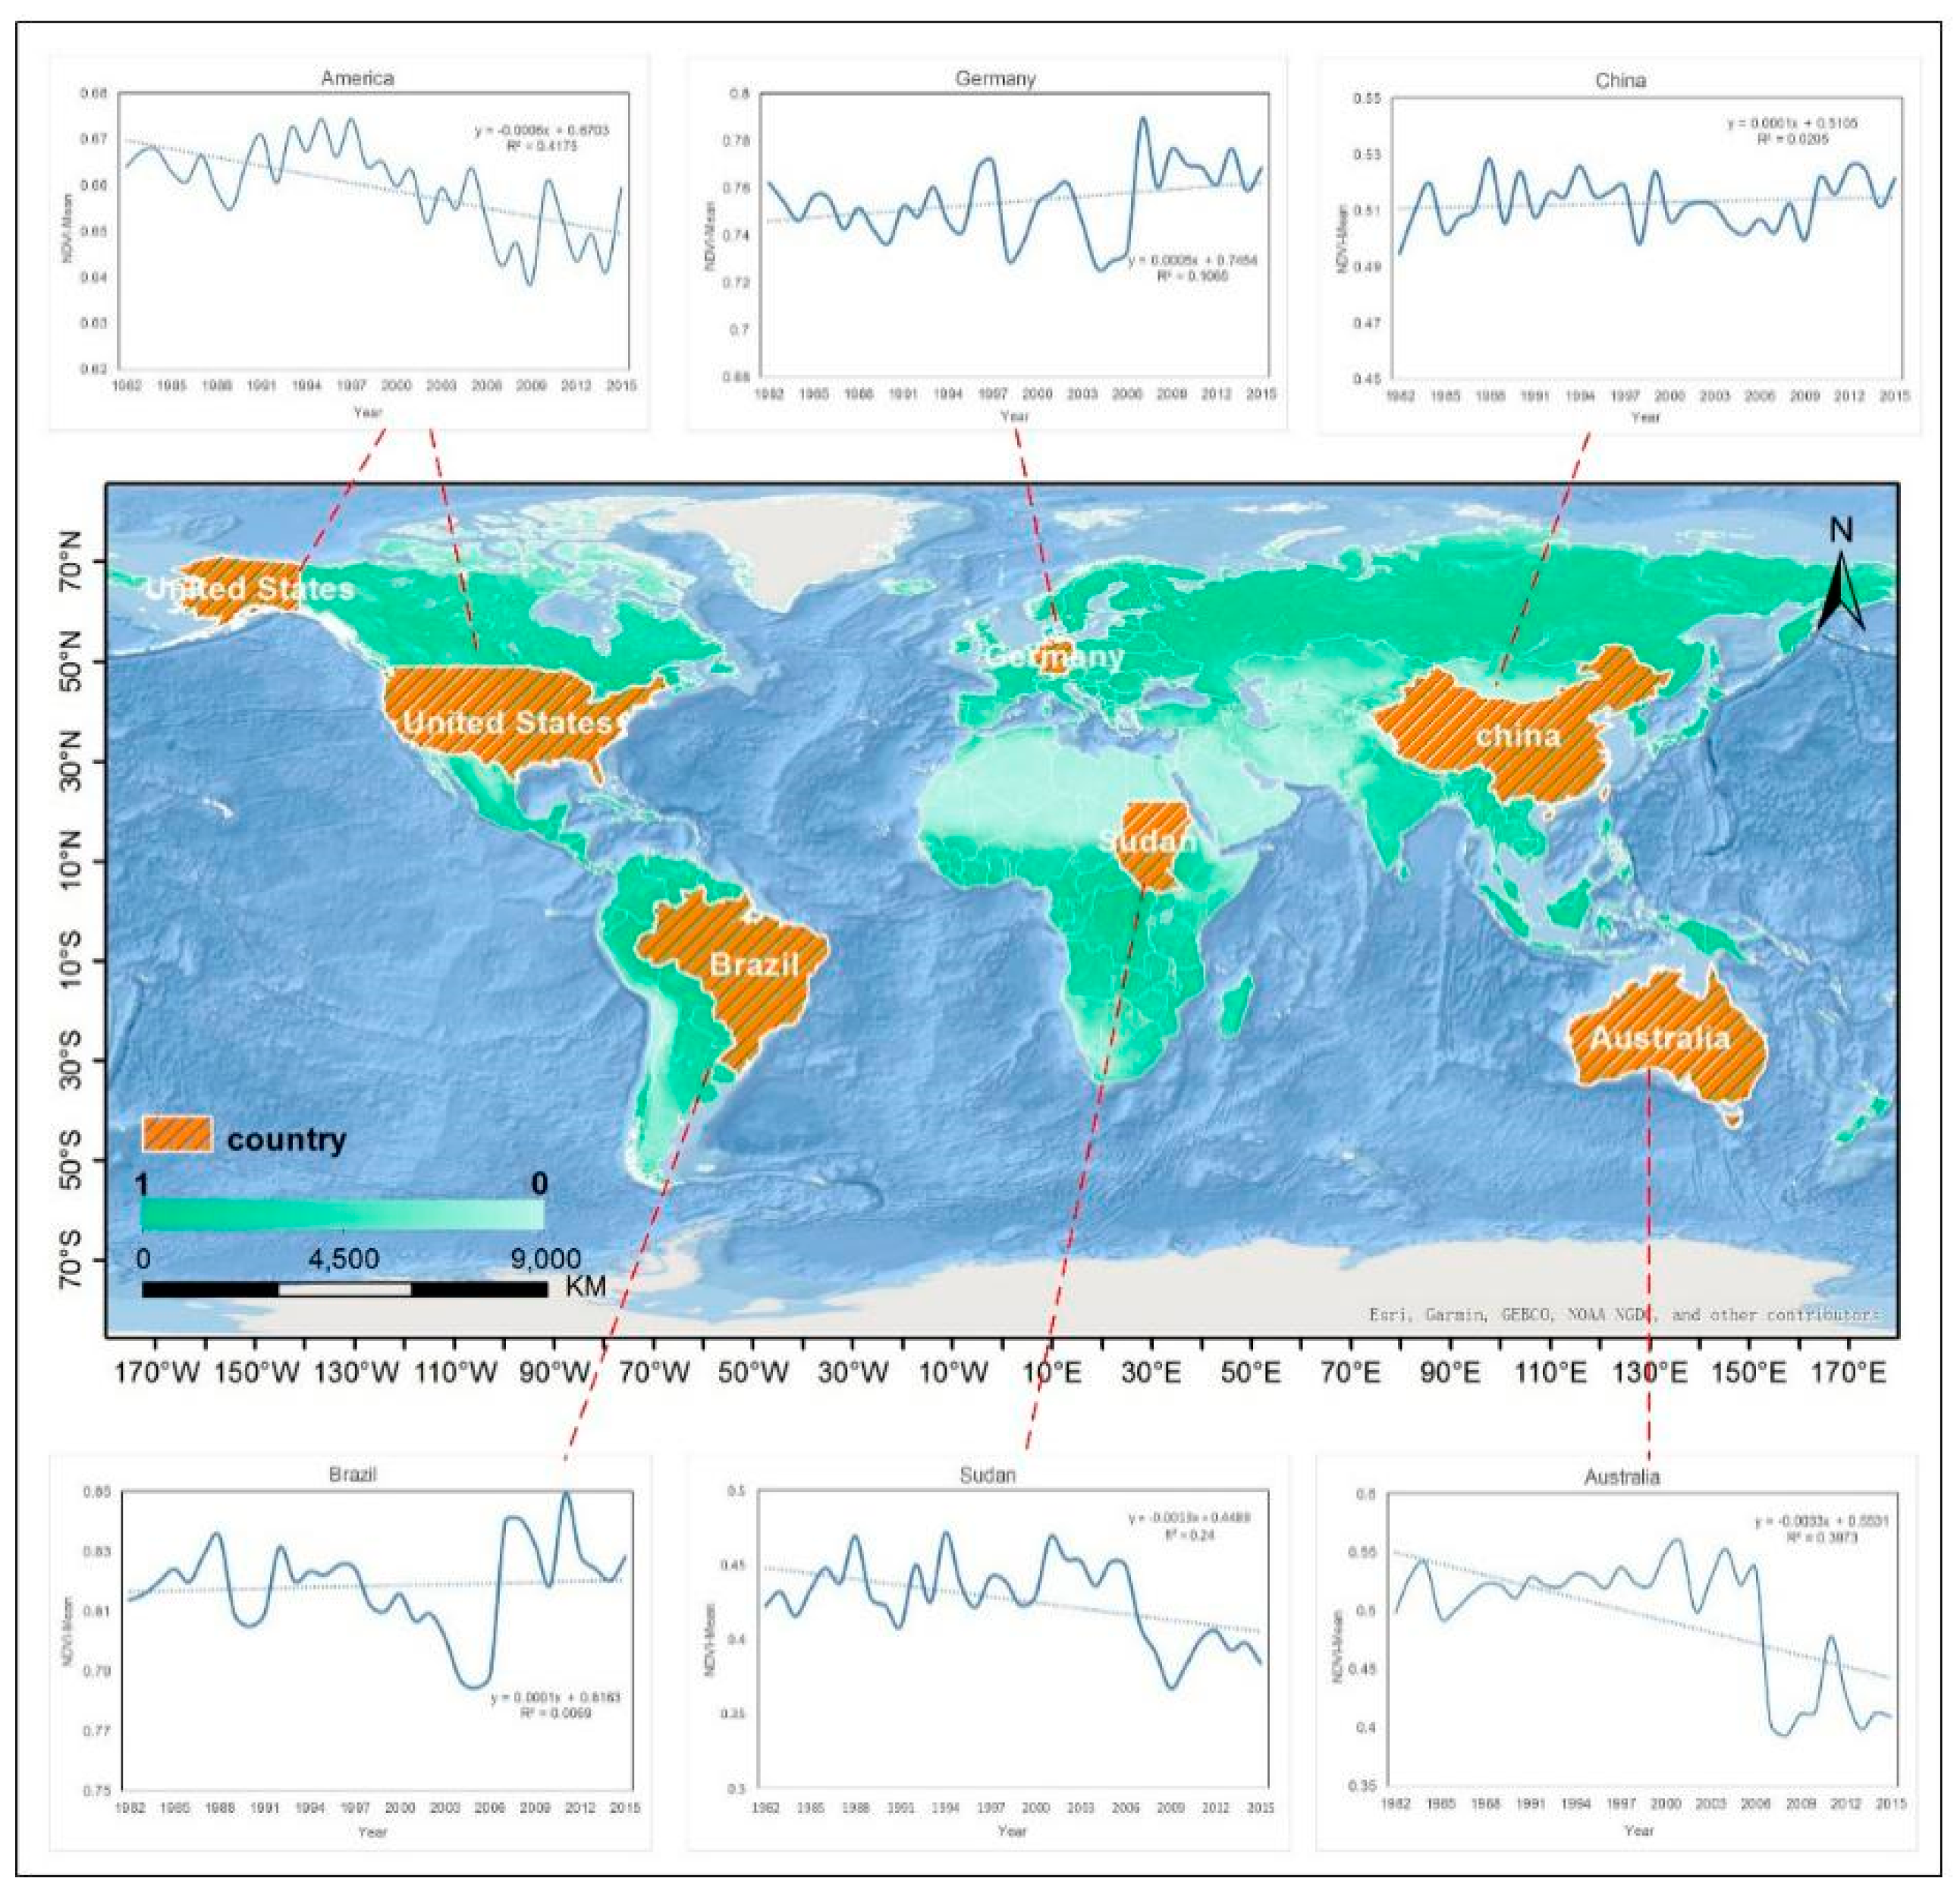
In our study, one typical country was selected from each continent to analyze the evolution trend of vegetation in the country, including the United States, Brazil, Germany, Sudan, China and Australia. We found that NDVI value of the countries on the upward trend were Brazil, China and Germany, while the countries on the downward trend were the United States, Sudan and Australia (Figure 10).
In the United States, the value of NDVI was on the upward trend before 2005, but on the downward trend after 2005, which was consistent with relevant studies [47]; the value of NDVI was showing an upward trend from 1982 to 2005 in North America, due to the severe drought and subsequent recovery, irrigated agriculture expansion, record and subsequent regeneration after insect outbreaks, and forest fire subsequent regeneration.
For Germany, we can see that NDVI showed an upward trend before 2000; in 1995 to 2010, value of NDVI showing a large “W” type fluctuation trend; and showing a small fluctuation trend after 2010. In general, NDVI showed an upward trend in Germany from 1982 to 2015. In the study of Julien [48], we can see that NDVI difference images in Europe are progressively more saturated from 1983 to 1999, and we can see in the picture in the artic that the NDVI of Germany is on the increase condition too.
There’s the world’s largest tropical rainforest in Brazil, the Amazon rainforest, which rainforest is characterized by abundant vegetation, high plant height and high density, so the NDVI value is always higher than other areas. NDVI was showing a trend of increasing slowly from 1982 to 2015, but there was a sharp decline in the vicinity of 2000, which was directly related to deforestation and land reclamation [49,50,51].
Australia is the country with the most significant decline trend among the six countries. Australia’s arid and semi-arid areas reach 75%, mainly distributed in the western and central regions. The desert area is 2.69 million square kilometers, accounting for 35% of the country’s land area. In addition, 5700 thousand hectares of Australia are affected by salinization, mainly in the southeast and southwest corners. Due to the subtropical high pressure and the southeast trade wind, it is easy to accumulate water and cause salinization as Australia has less rainfall and the terrain is flat. In addition, the soil is rich in material and easily degraded [52]. The phenomenon of excessive grazing, mining, and improper introduction of creatures leading to biological invasion [53] also led to serious desertification and low vegetation coverage in Australia [54,55]. A wide range of pests such as aphids are also part of the cause of reduced vegetation coverage [56].
In China, NDVI has experienced a slow upward trend in the past 34 years, especially in recent years, China’s vegetation coverage has experienced the strongest human activities, such as the “Returning Farmland to Forests and Grassland Project”, the “Three-north Forest Protection Project”. Liu [38] analyzed the cumulative afforestation area and NDVI changes in China’s returning farmland to forest project over the years, and found that since the implementation of the project of returning farmland to forests and grassland in 1999, China’s afforestation area has continued to rise, and NDVI has also shown an upward trend. It shows that the implementation of ecological restoration projects in recent years has greatly promoted the increase of vegetation cover in China and achieved good results. This is consistent with related research, Ke Liu and Xianfeng Liu studied the trend of NDVI in China from 1982 to 2012, Li Fei studied the trend of NDVI in China from 1982 to 2006, both indicating that NDVI in China has shown an upward trend over the years [14,57]. Here, we believe that land-use management is one of the important factors affecting vegetation evolution.
4.2. Comparison with Other Studies
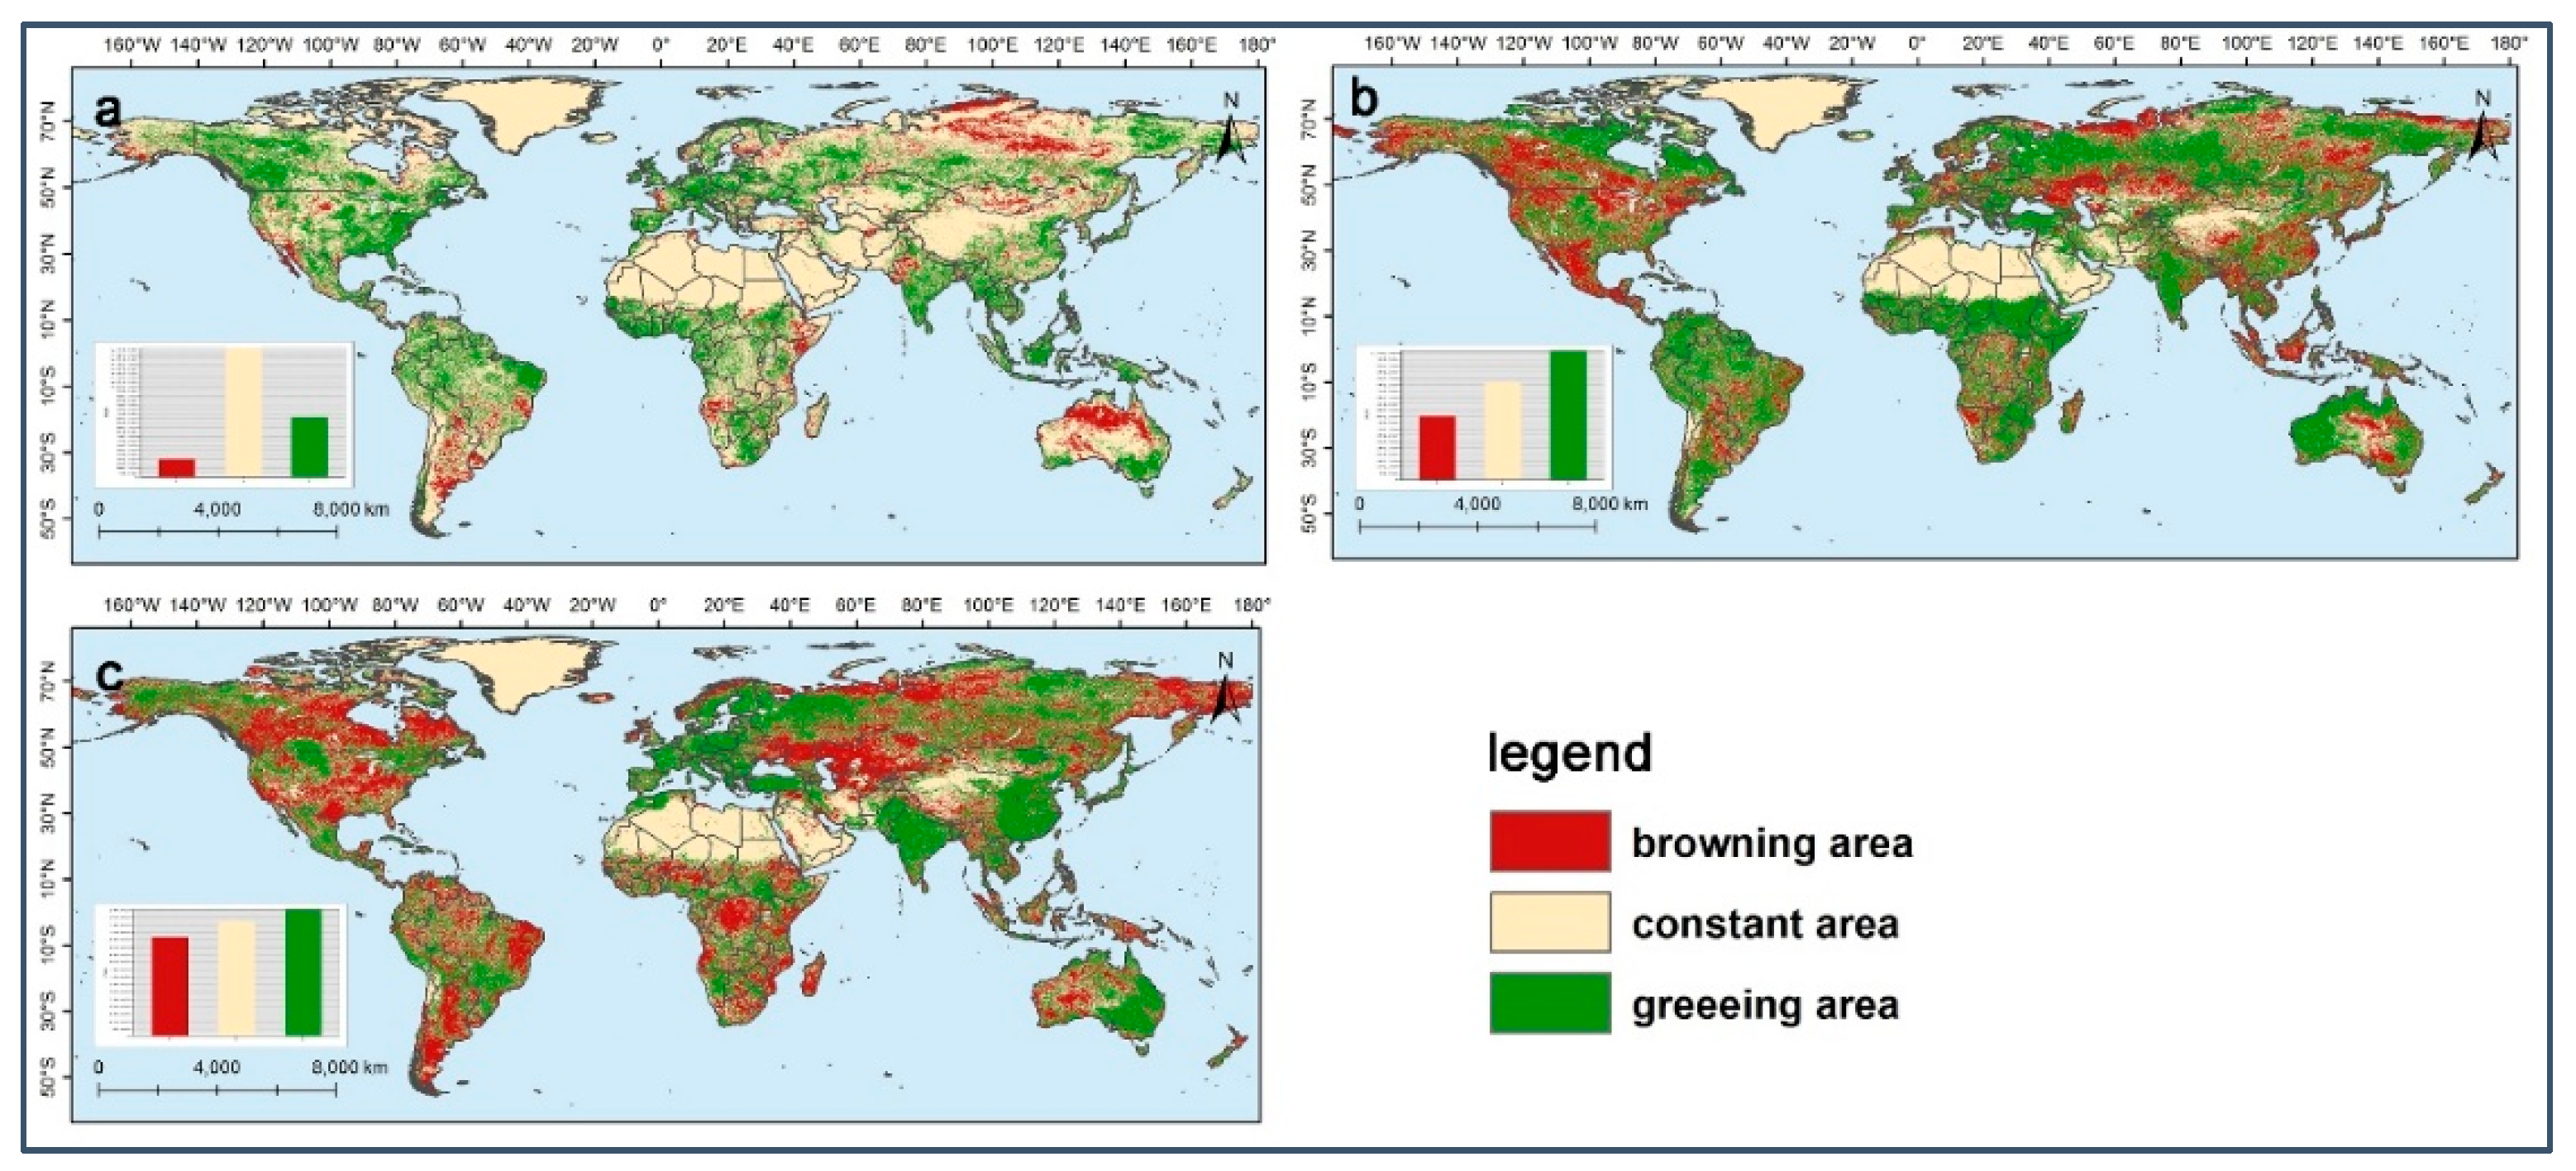
The conclusions of this study are consistent with other studies. We use Theil-Sen median trend analysis to analyze the vegetation trends in the three stages of 1982–1989, 1990–2000 and 2000–2015, all showing greening (Figure 11), which is consistent with the conclusion of Chen et al. (greening in 2000–2017) [6] and Zhu et al. (greening in 1982–2009) [16], which proves that the trend analysis method used in this paper is reasonable.
Meanwhile, this study is different from other studies. Firstly, the periods examined by other studies are relatively short, while this study revealed the vegetation change trend from 1982 to 2015 (all time periods of GIMMS NDVI data), making a new contribution to the vegetation trend analysis of long time series. Secondly, some studies used LAI [6,16,18,58], Fractional Vegetation Cover (FVC) [59], Enhanced Vegetation Index (EVI) [60], and even growth season data [16] to characterize vegetation. In this study, annul of NDVI was used to reveal the evolution trend of vegetation. Finally, this study used the BRT model to analyze the contribution rate of vegetation factor for the first time, and although it has been widely used in the field of medicine [36,37] it is rarely used in vegetation research.
Limitations also exist in this study, such as the lack of analysis on the impact of climate change, carbon dioxide regulation and nitrogen deposition on vegetation [6,16,61]. It is necessary for the future study to considerate more impact factors, and factors with high contribution rate could be screened for the prediction of vegetation change trends, which is more important for the development of vegetation restoration.
5. Conclusions
We analysed the trends of the NDVI and its divers based on the global GIMMS NDVI 3g data from 1982 to 2015. We also investigated the correlation between NDVI distribution and temperature, rainfall, nighttime lights index, DEM, LUCC and population. We clarified the driving factors of the changes and development of the NDVI and then derived the following conclusions:
- Over the past 34 years, the global annual NDVI has increased by 4 × 10⁻⁴/year. About 34% of the global continental area has experienced greening in the grid annual NDVI, the greening areas were observed in the Sahel, European, India and south China. Only 10% of global vegetation land was decreasing, and this was observed in Canada, South America, central Africa and Central Asia.
- BRT model shows that rainfall is the most important factor affecting vegetation evolution (63.1%), followed by temperature (15%), LUCC (8.6%), population (6.5%), DEM (6.4%) and nightlight (0.4%) (Figure 8). About 21% of the world’s continental area were affected by rainfall, mainly in arid regions such as central Asia and Australia. The main temperature-affected areas accounted for 36%, located near the equator or in high latitudes.
- The use of the nighttime lights index to characterise human activities shows that a positive correlation exists between the nighttime lights index and the NDVI in areas with high population density, such as the Ganges and Yangtze River Basins. The use of low-resolution data analysis offers low feasibility, and the improvement of data resolution should help to accurately analyse correlations.
Author Contributions
Conceptualization, S.W., X.B. and Q.T.; Data curation, C.L. and Y.D.; Methodology, Y.Y. and Z.H.; Software, Y.Y., Q.L., L.W. and S.T.; Supervision, X.B.; Visualization, Y.Y.; Writing—original draft, Y.Y.
Funding
This research was funded by the national key research program of China (No. 2016YFC0502300 & 2016YFC0502102), Chinese academy of science and technology services network program (No. KFJ-STS-ZDTP-036) and international cooperation agency international partnership program (No.132852KYSB20170029, No. 2014-3), Guizhou high-level innovative talent training program “ten” level talents program (No.2016-5648), United fund of karst science research center (No. U1612441), International cooperation research projects of the national natural science fund committee (No. 41571130074 & 41571130042), Science and Technology Plan of Guizhou Province of China (No. 2017–2966).
Conflicts of Interest
The authors declare no conflict of interest.
References
- Pan, N.; Feng, X.; Fu, B.J.; Wang, S.; Jie, F.; Pan, S. Increasing global vegetation browning hidden in overall vegetation greening: Insights from time-varying trends. Remote Sens. Environ. 2018, 214, 59–72. [Google Scholar] [CrossRef]
- Peng, J.; Liu, Z.H.; Liu, Y.H.; Wu, J.S.; Han, Y.N. Trend analysis of vegetation dynamics in Qinghai-Tibet Plateau using Hurst Exponent. Ecol. Indic. 2012, 14, 28–39. [Google Scholar] [CrossRef]
- Foley, J.A.; Levis, S.; Costa, M.H.; Cramer, W. Incorporating dynamic vegetation cover within global climate models. Ecol. Appl. 2000, 10, 1620–1632. [Google Scholar] [CrossRef]
- Chu, H.S.; Venevsky, S.; Wu, C.; Wang, M.; Pollard, D. NDVI-based vegetation dynamics and its response to climate changes at Amur-Heilongjiang River Basin from 1982 to 2015. Sci. Total Environ. 2019, 650, 2051–2062. [Google Scholar] [CrossRef]
- Cao, M.K.; Woodward, F.I. Dynamic responses of terrestrial ecosystem carbon cycling to global climate change. Nature 1998, 393, 249–252. [Google Scholar] [CrossRef]
- Chen, C.; Park, T.; Wang, X.H.; Piao, S.L.; Xu, B.D.; Chaturvedi, R.K.; Fuchs, R.; Brovkin, V.; Ciais, P.; Fensholt, R.; et al. China and India lead in greening of the world through land-use management. Nat. Sustain. 2019, 2, 122–129. [Google Scholar] [CrossRef] [PubMed]
- Huang, F.; Xu, S. Spatio-temporal variations of rain-use efficiency in the west of Songliao Plain, China. Sustainability 2016, 8, 308. [Google Scholar] [CrossRef]
- Liu, X.F.; Zhu, X.F.; Pan, Y.Z.; Li, Y.Z.; Zhao, A.Z. Spatiotemporal changes in vegetation coverage in China during 1982–2012. Acta Ecol. Sin. 2015, 35, 5331–5342. [Google Scholar]
- Zhu, L.; Southworth, J. Disentangling the relationships between net primary production and precipitation in southern Africa savannas using satellite observations from 1982 to 2010. Remote Sens. 2013, 5, 3803–3825. [Google Scholar] [CrossRef]
- Ning, T.; Liu, W.; Lin, W. NDVI Variation and Its Responses to Climate Change on the Northern Loess Plateau of China from 1998 to 2012. Adv. Meteorol. 2015, 2015, 1–10. [Google Scholar] [CrossRef]
- Zhao, Y.S. Principles and Methods of Remote Sensing Application Analysis; Science Press: China, Beijing, 2003; pp. 368–369. [Google Scholar]
- Wang, X.; Piao, S.; Ciais, P. Spring temperature change and its implication in the change of vegetation growth in North America from 1982 to 2006. Proc. Natl. Acad. Sci. USA 2011, 108, 1240–1245. [Google Scholar] [CrossRef] [Green Version]
- Tucker, C.J.; Pinzon, J.E.; Brown, M.E.; Slayback, D.A.; Pak, E.W.; Mahoney, R.; Vermote, E.F.; El Saleous, N. An extended AVHRR 8-km NDVI dataset compatible with MODIS and SPOT vegetation NDVI data. Int. J. Remote Sens. 2005, 26, 4485–4498. [Google Scholar] [CrossRef]
- Liu, K.; Du, L.T.; Hou, J.; Hu, Y.; Zhu, Y.G.; Gong, F. Spatiotemporal variations of NDVI in terrestrial ecosystems in China from 1982–2012. Acta Ecol. Sin. 2018, 38, 1885–1896. [Google Scholar]
- Tong, X.W.; Brandt, M.; Yue, Y.M.; Horion, S.; Wang, K.L.; Keersmaecker, W.D.; Tian, F.; Schurgers, G.; Xiao, X.M.; Luo, Y. Increased vegetation growth and carbon stock in China karst via ecological engineering. Nat. Sustain. 2018, 1, 44–50. [Google Scholar] [CrossRef] [Green Version]
- Zhu, Z.C.; Piao, S.L.; Myneni, R.B.; Huang, M.T.; Zeng, Z.Z.; Canadell, J.G.; Ciais, P.; Sitch, S.; Friedlingstein, P.; Arneth, A.; et al. Greening of the Earth and its drivers. Nat. Clim. Chang. 2016, 6, 182. [Google Scholar] [CrossRef]
- Brandt, M.; Yue, Y.M.; Wigneron, J.P.; Tong, X.W.; Tian, F.; Jepsen, M.R.; Xiao, X.M.; Verger, A.; Mialon, A.; Yaari, A.A.; et al. Satellite-Observed Major Greening and Biomass Increase in South China Karst During Recent Decade. Earth’s Future 2018, 6, 1017–1028. [Google Scholar] [CrossRef]
- Piao, S.L.; Yin, G.D.; Tan, J.G.; Cheng, L.; Hung, M.T.; Li, Y.; Liu, R.G.; Mao, J.; Mrneini, R.B.; Peng, S.S.; et al. Detection and attribution of vegetation greening trend in China over the last 30 years. Glob. Chang. Biol. 2015, 21, 1601–1609. [Google Scholar] [CrossRef] [Green Version]
- Song, X.P.; Hansen, M.C.; Stehman, S.V.; Potapov, S.V.; Tyukavina, A.; Vermote, E.F.; Townshend, J.R. Global land change from 1982 to 2016. Nature 2018, 560, 639–643. [Google Scholar] [CrossRef] [PubMed]
- Jong, R.D.; Verbesselt, J.; Schaepman, M.E.; Bruin, S.D. Trend changes in global greening and browning: Contribution of short-term trends to longer-term change. Glob. Chang. Biol. 2012, 18, 642–655. [Google Scholar] [CrossRef]
- Slayback, D.A.; Pinzon, J.E.; Los, S.O.; Tucker, C.J. Northern hemisphere photosynthetic trends 1982–99. Glob. Chang. Biol. 2003, 9, 1–15. [Google Scholar] [CrossRef]
- Zhou, L.; Tucker, C.J.; Kaufmann, R.K.; Slayback, D.; Shabanov, N.V.; Myneni, R.B. Variations in northern vegetation activity inferred from satellite data of vegetation index during 1981 to 1999. J. Geophys. Res. Atmos. 2001, 106, 20069–20083. [Google Scholar] [CrossRef] [Green Version]
- Li, J.; Liu, H.B.; Li, C.Y.; Long, L. Changes of Green-up Day of Vegetation Growing Season Based on GIMMS 3g NDVI in Northern China in Recent 30 Years. Sci. Geogr. Sin. 2017, 37, 620–629. [Google Scholar]
- Jong, R.D.; Bruin, S.D.; Wit, A.D.; Schaepman, M.E.; Dent, D.L. Analysis of monotonic greening and browning trends from global NDVI time-series. Remote Sens. Environ. 2011, 115, 692–702. [Google Scholar] [CrossRef] [Green Version]
- Dong, C.W.; Cao, Y.; Tan, Y.Z. Urban expansion and vegetation changes in Hangzhou Bay area using night-light data. Chin. J. Appl. Ecol. 2017, 28, 231–238. [Google Scholar]
- Zhang, W.Y.; Sun, W.J.; Zhang, Y.L. Wavelet Analysis and Mann-Kendall Test of Mean Air Temperature and Annual Precipitation in Linzhi, Tibet, China from 1960 to 2012. J. Desert Res. 2018, 38, 190–196. [Google Scholar]
- Sen, P.K. Estimates of the Regression Coefficient Based on Kendall’s Tau. Publ. Am. Stat. Assoc. 1968, 63, 1379–1389. [Google Scholar] [CrossRef]
- Tian, Y.C.; Bai, X.Y.; Wang, S.J.; Qin, L.Y.; Li, Y. Spatial-temporal changes of vegetation cover in Guizhou Province, Southern China. Chin. Geogr. Sci. 2017, 27, 25–38. [Google Scholar] [CrossRef]
- Yuan, L.H.; Jiang, W.G.; Shen, W.M.; Liu, Y.H.; Wang, W.J.; Tao, L.L.; Zheng, H.; Liu, X.F. The spatio-temporal variations of vegetation cover in the Yellow River Basin from 2000 to 2010. Acta Ecol. Sin. 2013, 33, 7798–7806. [Google Scholar]
- Fensholt, R.; Langanke, T.; Rasmussen, K.; Reenberg, A.; Prince, S.D.; Tucker, C.; Scholes, R.; Le, Q.B.; Bondeau, A.; Eastman, R.; et al. Greenness in semi-arid areas across the globe 1981–2007—an Earth Observing Satellite based analysis of trends and drivers. Remote Sens. Environ. 2012, 121, 144–158. [Google Scholar] [CrossRef]
- Fang, L.; Wang, W.J.; Jiang, W.G.; Chen, M.; Wang, Y.; Jia, K.; Li, Y. Spatio-temporal Variations of Vegetation Cover and Its Responses to Climate Change in the Heilongjiang Basin of China from 2000 to 2014. Sci. Geogr. Sin. 2017, 37, 1745–1754. [Google Scholar]
- Evans, J.; Geerken, R. Discrimination between climate and human-induced dryland degradation. J. Arid. Environ. 2004, 57, 535–554. [Google Scholar] [CrossRef]
- Hou, G.L.; Liu, D.Y.; Zhang, Z.X.; Guo, D.; Zhang, H.Y. Response of NDVI in different climatic zone toclimate change in Songnen Plain. Chin. J. Agrometeorol. 2012, 33, 271–277. [Google Scholar]
- Zhang, J.H.; Feng, Z.M.; Jiang, L.G.; Yang, Y.Z. Analysis of the Correlation between NDVI and Climate Factors in the Lancang River Basin. J. Nat. Res. 2015, 30, 1425–1435. [Google Scholar]
- Elith, J.; Leathwick, J.R.; Hastie, T. A working guide to boosted regression trees. J. Anim. Ecol. 2008, 77, 802–813. [Google Scholar] [CrossRef] [PubMed] [Green Version]
- Messina, J.P.; Kraemer, M.U.; Brady, O.J.; Pigott, D.M.; Shearer, E.M.; Weiss, D.J.; Golding, N.; Ruktanonchai, C.W.; Gething, P.W.; Cohn, E.; et al. Mapping global environmental suitability for Zika virus. Elife 2016, 5, e15272. [Google Scholar] [CrossRef] [PubMed]
- Ashby, J.; Moreno-Madriñán, M.J.; Yiannoutsos, C.T.; Stanforth, A. Niche Modeling of Dengue Fever Using Remotely Sensed Environmental Factors and Boosted Regression Trees. Remote Sens. 2017, 9, 328. [Google Scholar] [CrossRef]
- Liu, Y.L.; Lei, H.M. Responses of natural vegetation dynamics to climate drivers in China from 1982 to 2011. Remote Sens. 2015, 7, 10243–10268. [Google Scholar] [CrossRef]
- Pouliot, D.; Latifovic, R.; Olthof, I. Trends in vegetation NDVI from 1km AVHRR data over Canada for the period 1985–2006. Int. J. Remote Sens. 2009, 30, 149–168. [Google Scholar] [CrossRef]
- Piao, S.; Friedlingstein, P.; Ciais, P.; Viovy, N.; Demarty, J. Growing season extension and its impact on terrestrial carbon cycle in the Northern Hemisphere over the past 2 decades. Glob. Biogeochem. Cycles 2007, 21. [Google Scholar] [CrossRef] [Green Version]
- Fu, X.F.; Yang, S.T.; Liu, C.M. Changes of NDVI and their relations with principal climatic factors in the Yarlung Zangbo River Basin. Geogr. Res. 2007, 26, 60–66. [Google Scholar]
- Cheng, Z.G.; Yang, X.Y.; Dong, S.Y.; Sun, C.; Wu, Y. Vegetation Coverage Changes in Chengdu Based on DMSP/OLS and SPOT-VEG NDVI. Adv. Meteorol. Sci. Technol. 2016, 6, 14–20. [Google Scholar]
- Kasimu, A. Global Urban Characterization Using Population Density, DMSP Data and MODIS Data. Remote Sens. Inf. 2018, 33, 86–92. [Google Scholar]
- Cui, L.L.; Shi, J.; Xiao, F.J.; Fan, W.Y. Variation Trends in Vegetation NDVI and Its Correlation with Climatic Factors in Eastern China. Resour. Sci. 2010, 32, 124–131. [Google Scholar]
- Hou, M.T.; Hu, W.; Qiao, H.L.; Li, W.G.; Yan, X.D. Application of Partial Least Squares (PLS) Regression Method in Attribution of Vegetation Change in Eastern China. J. Nat. Resour. 2015, 30, 409–422. [Google Scholar]
- Zhu, M.M.; Hou, X.Y.; Wu, T. Spatio-temporal Characters of Vegetation Cover in the Eastern China from 2001 to 2010 based on MODIS NDVI. Remote Sens. Technol. Appl. 2013, 28, 1027–1032. [Google Scholar]
- Neigh, C.S.R.; Tucker, C.J. North American vegetation dynamics observed with multi-resolution satellite data. Remote Sens. Environ. 2008, 112, 1749–1772. [Google Scholar] [CrossRef] [Green Version]
- Julien, Y.; Sobrino, J.A.; Verhoef, W. Changes in land surface temperatures and NDVI values over Europe between 1982 and 1999. Remote Sens. Environ. 2006, 103, 43–55. [Google Scholar] [CrossRef]
- Gurgel, H.C.; Ferreira, N.J. Annual and interannual variability of NDVI in Brazil and its connections with climate. Int. J. Remote Sens. 2003, 24, 3595–3609. [Google Scholar] [CrossRef]
- Melo, M.R.D.S.; Rocha, J.V.; Manabe, V.D.; Rubens, A.C.L. Intensity of land use changes in a sugarcane expansion region, Brazil. J. Land Use Sci. 2018, 13, 1–16. [Google Scholar] [CrossRef]
- Tomasella, J.; Vieira, R.M.S.P.; Barbosa, A.A.; Rodriguez, D.A.; Santana, M.D.O.S.; Sestini, M.F. Desertification trends in the Northeast of Brazil over the period 2000–2016. Int. J. Appl. Earth Obs. Geoinf. 2018, 73, 197–206. [Google Scholar] [CrossRef]
- Donohue, R.J.; Mcvicar, T.R.; Roderick, M.L. Climate-related trends in Australian vegetation cover as inferred from satellite observations, 1981–2006. Glob.Chang. Biol. 2010, 15, 1025–1039. [Google Scholar] [CrossRef]
- Zhang, S.B.; Wu, J.X. Approaches, effects and implications of non-native biological invasions in Australia and the Americas. World’s Agric. 2006, 6, 49–51. [Google Scholar]
- Wu, D.H.; Zhao, X.; Zhao, W.Q.; Tang, B.J.; Xu, W.F. Response of vegetation to temperature, precipitation and solar radiation time-scales: A case study over mainland Australia. Geosci. Remote Sens. Symp. IEEE 2014, 855–858. [Google Scholar] [CrossRef]
- Hu, P.X.; Yang, W.X.; Li, M.X.; Zhou, W.D. The state and control of desertification in Australia. Chin. For. 2002, 6, 37–39. [Google Scholar]
- Miao, J.; Zhao, Z.Q.; Liu, H.L.; Li, L.L.; Xu, Y.Q.; Liu, Q.; Xin, M.Y.; Zhang, L.; Li, G.C.; Pan, J. Using MODIS Data to Monitor Pest Vegetation Index Change in a Large Scale-Take the Locust Plague in Australia in 2010 for Example. Chin. Agric. Sci. Bull. 2015, 31, 148–155. [Google Scholar]
- Wang, Q.; Chen, Y.; Ruan, X.R.; Li, X.D.; Wang, X.L.; Shi, J.Z.; Wang, Z.W. The Changes of NDVI in China from 1982 to 2012 and Its Relationship with Climatic Factors. Acta Agrestia Sin. 2017, 25, 691–700. [Google Scholar]
- Mao, J.F.; Ribes, A.; Yan, B.Y.; Shi, X.Y.; Thornton, P.E.; Séférian, R.; Ciais, P.; Myneni, R.B.; Douville, H.; Piao, S.L.; et al. Human-induced greening of the northern extratropical land surface. Nat. Clim. Chang. 2016, 6, 959–963. [Google Scholar] [CrossRef]
- Zeng, X.; Rao, P.; Defries, R.S.; Hansen, M.C. Interannual Variability and Decadal Trend of Global Fractional Vegetation Cover from 1982 to 2000. J. Appl. Meteorol. 2003, 42, 1525–1530. [Google Scholar] [CrossRef]
- Zhang, Y.L.; Song, C.H.; Band, L.E.; Sun, C.; Li, J.X. Reanalysis of global terrestrial vegetation trends from MODIS products: Browning or greening? Remote Sens. Environ. 2017, 191, 145–155. [Google Scholar] [CrossRef]
- Brandt, M.; Rasmussen, K.; Peñuelas, J.; Tian, F.; Schurgers, G.; Verger, A.; Mertz, O.; Palmer, J.R.B.; Fensholt, R. Human population growth offsets climate-driven increase in woody vegetation in sub-Saharan Africa. Nat. Ecol. Evolut. 2017, 1, 0081. [Google Scholar] [CrossRef] [Green Version]
Figure 1.
Spatial distribution of Global NDVI: (a) NDVI spatial distribution map; (b) NDVI distribution along the meridian; (c) NDVI distribution along the parallel. (Source of global ocean base map: ESRI, Garmin, GEBCO, NOAA NGDC and other contributors).
Figure 1.
Spatial distribution of Global NDVI: (a) NDVI spatial distribution map; (b) NDVI distribution along the meridian; (c) NDVI distribution along the parallel. (Source of global ocean base map: ESRI, Garmin, GEBCO, NOAA NGDC and other contributors).

Figure 2.
Mann–Kendall mutation test (a) and annual NDVI trends from 1982 to 2015 (b).

Figure 3.
Spatial distribution of the SNDVI (a) and Zvalue (b).

Figure 4.
Spatial distribution of the temporal trends in NDVI from 1982 to 2015. ((a–d) is the major greening area in the world; (e–h) is the major browning area in the world).
Figure 4.
Spatial distribution of the temporal trends in NDVI from 1982 to 2015. ((a–d) is the major greening area in the world; (e–h) is the major browning area in the world).

Figure 5.
Global maps of correlation coefficients between annual averages NDVI and temperature (a) and rainfall (b) form 1982–2015.
Figure 5.
Global maps of correlation coefficients between annual averages NDVI and temperature (a) and rainfall (b) form 1982–2015.

Figure 6.
Global maps of correlation coefficients between annual averages NDVI and nighttime lights index form 2000–2013.
Figure 6.
Global maps of correlation coefficients between annual averages NDVI and nighttime lights index form 2000–2013.

Figure 7.
Area ratio of global vegetation distribution and altitude.

Figure 8.
Boosted regression trees (BRT) model analysis of the relationship between NDVI and six factors. (Land cover types: 1. croplands; 2. forests; 3. grasslands; 4. wetlands; 5. urban areas; 6. unused land; 7. water bodies).
Figure 8.
Boosted regression trees (BRT) model analysis of the relationship between NDVI and six factors. (Land cover types: 1. croplands; 2. forests; 3. grasslands; 4. wetlands; 5. urban areas; 6. unused land; 7. water bodies).

Figure 9.
Fitted values in relation to the six predictors used in the model. (Values above each graph indicate the weighted mean of fitted values in relation to each non-factor predictor).
Figure 9.
Fitted values in relation to the six predictors used in the model. (Values above each graph indicate the weighted mean of fitted values in relation to each non-factor predictor).

Figure 10.
Evolution of NDVI in several countries. (United States, Brazil, Germany, Sudan, China and Australia).
Figure 10.
Evolution of NDVI in several countries. (United States, Brazil, Germany, Sudan, China and Australia).

Figure 11.
Trends in GIMMS NDVI 3g from 1982 to 1989 (a), 1990 to 1999 (b) and 2000 to 2015 (c).


Table 1.
Global vegetation coverage distribution of all levels. NDVI: (normalized difference vegetation index).
Table 1.
Global vegetation coverage distribution of all levels. NDVI: (normalized difference vegetation index).
| Degree | NDVI Value | Area (km2) | Percent |
|---|---|---|---|
| Non-vegetation coverage area | NDVI ≤ 0.2 | 18,361,920 | 10% |
| Low vegetation coverage area | 0.2<NDVI ≤ 0.5 | 39,134,272 | 22% |
| Medium vegetation coverage area | 0.5 < NDVI ≤ 0.8 | 76,844,352 | 42% |
| High vegetation coverage area | NDVI > 0.8 | 47,376,128 | 26% |
Table 2.
The statistics of NDVI trends.
| SNDVI | Zvalue | Trend of NDVI | Percentage |
|---|---|---|---|
| S ≥ 0.0005 | Z ≥ 1.96 | Significant increasing | 34% |
| S ≥ 0.0005 | −1.96 < Z < 1.96 | Slight increasing | 6% |
| −0.0005 < S < 0.0005 | −1.96 < Z < 1.96 | Constant | 45% |
| S ≤ −0.0005 | −1.96 < Z < 1.96 | Slight decreasing | 5% |
| S ≤ −0.005 | Z ≤ −1.96 | Significant decreasing | 10% |
© 2019 by the authors. Licensee MDPI, Basel, Switzerland. This article is an open access article distributed under the terms and conditions of the Creative Commons Attribution (CC BY) license (http://creativecommons.org/licenses/by/4.0/).
Share and Cite
MDPI and ACS Style
Yang, Y.; Wang, S.; Bai, X.; Tan, Q.; Li, Q.; Wu, L.; Tian, S.; Hu, Z.; Li, C.; Deng, Y. Factors Affecting Long-Term Trends in Global NDVI. Forests 2019, 10, 372. https://doi.org/10.3390/f10050372
AMA Style
Yang Y, Wang S, Bai X, Tan Q, Li Q, Wu L, Tian S, Hu Z, Li C, Deng Y. Factors Affecting Long-Term Trends in Global NDVI. Forests. 2019; 10(5):372. https://doi.org/10.3390/f10050372
Chicago/Turabian StyleYang, Yujie, Shijie Wang, Xiaoyong Bai, Qiu Tan, Qin Li, Luhua Wu, Shiqi Tian, Zeyin Hu, Chaojun Li, and Yuanhong Deng. 2019. "Factors Affecting Long-Term Trends in Global NDVI" Forests 10, no. 5: 372. https://doi.org/10.3390/f10050372
Note that from the first issue of 2016, this journal uses article numbers instead of page numbers. See further details here.