1. Introduction
Dam break waves cause huge damages, human fatalities, high economic losses, and ecological and environmental issues in the surrounded landscape [
1]. Dam breaks could be modelled as downstream waves that are generated by a sudden release of water stored behind a wall. The resulting wave is defined as surge, if it flows on a dry bed, or a bore, if it propagates on a wet bed. Tsunamis, tidal bores, and the collapse of an artificial embarkment can generate similarly unsteady flows and drastic consequences [
2]. Chanson stated that the behavior of a dam break wave is very similar to a tsunami surge that propagates on a dry coastal plain. In fact, in both cases, the surge front is a shock characterized by a sudden discontinuity and extremely rapid variation of flow depth and velocity [
3]. Only a few studies showed in-field measurement, and often the available data are post-forensic engineering reconstructions of the event. Real field manifestations are indeed rare, and it is very difficult to collect data and visual observations during these occurrences [
2]. Moreover, some regions of the world have not yet experienced tsunamis or dam break waves in recent times, and thus there are no field observations on which policymakers can base and develop safety procedures to protect residences [
4].
Scaled laboratory experiments of dam break waves have a crucial role in understanding hydrodynamic evolution and in validating numerical models. Chanson observed in 2009 that the numerical models implemented were validated by a limited data set [
1]. In the last two decades, several experimental studies have been implemented in order to deeply investigate the flow characteristics [
2,
5,
6]. Nevertheless, even more studies are investigating the interaction between water waves and structures in order to highlight the hydrodynamic behavior and the extent of the forces on the obstacles [
7,
8,
9,
10,
11]. In addition, [
8,
12,
13,
14,
15], among others, investigated the behavior of a dam break flow over an erodible bed. Furthermore, Armanini has conducted several experiments to show the hydrodynamic of a debris flow generated by a dam break event against a structure. Similar experiments have been implemented by [
16,
17,
18] as well.
Firstly, the present study shows the preliminary results of an experimental investigation of a new laboratory channel at the Hydraulic Engineering Laboratory of the University of Naples “Federico II”. Secondly, the preliminary results of a dam break wave against a vertical wall are presented, and thirdly, a comparison with a shallow water numerical model is discussed.
2. Materials and Methods
The channel, realized in Perspex, is a 3.0 m long, 0.4 m wide, and 0.5 m high, and it is divided into two parts by a movable lift gate. The lift gate can be translated up to 0.5 m from the upstream wall in order to change the volume of the reservoir and the downstream length. In these sets of experiment, it was placed in the middle. The water was stored behind the gate, the hydraulic seal was obtained by means of a rubber gasket, and thin strips of a watertight putty were placed all around the gate. The dam break wave was generated by a sudden opening of the gate thanks to a pneumatic system. The pneumatic system was activated by an air compressor Fini, set at seven bars of pressure in order to allow an abrupt gate removal, i.e., 1.35 m/s.
A hydrometric rod was located behind the gate in order to sample the depth of the water stored there.
Two high-speed CCD cameras were used to obtain the wavefront celerity and the free surface profile from image analysis. The cameras were two Iron 250 Kaya Instruments and their key features are 5 MegaPixels of resolution and up to 164 frames per second. The data was acquired by means of two Predator II Frame Grabber. The Grabber received video streams on the CoaXPress link and transmitted it to computer memory through the PCIe interface. This product also provided GPIO with machine control signals, such as triggers, shaft encoders, exposure control, and general I/O, which can be controlled alongside the video stream acquisition. Commercial software, StreamPix, was used to control and synchronize the CCD cameras.
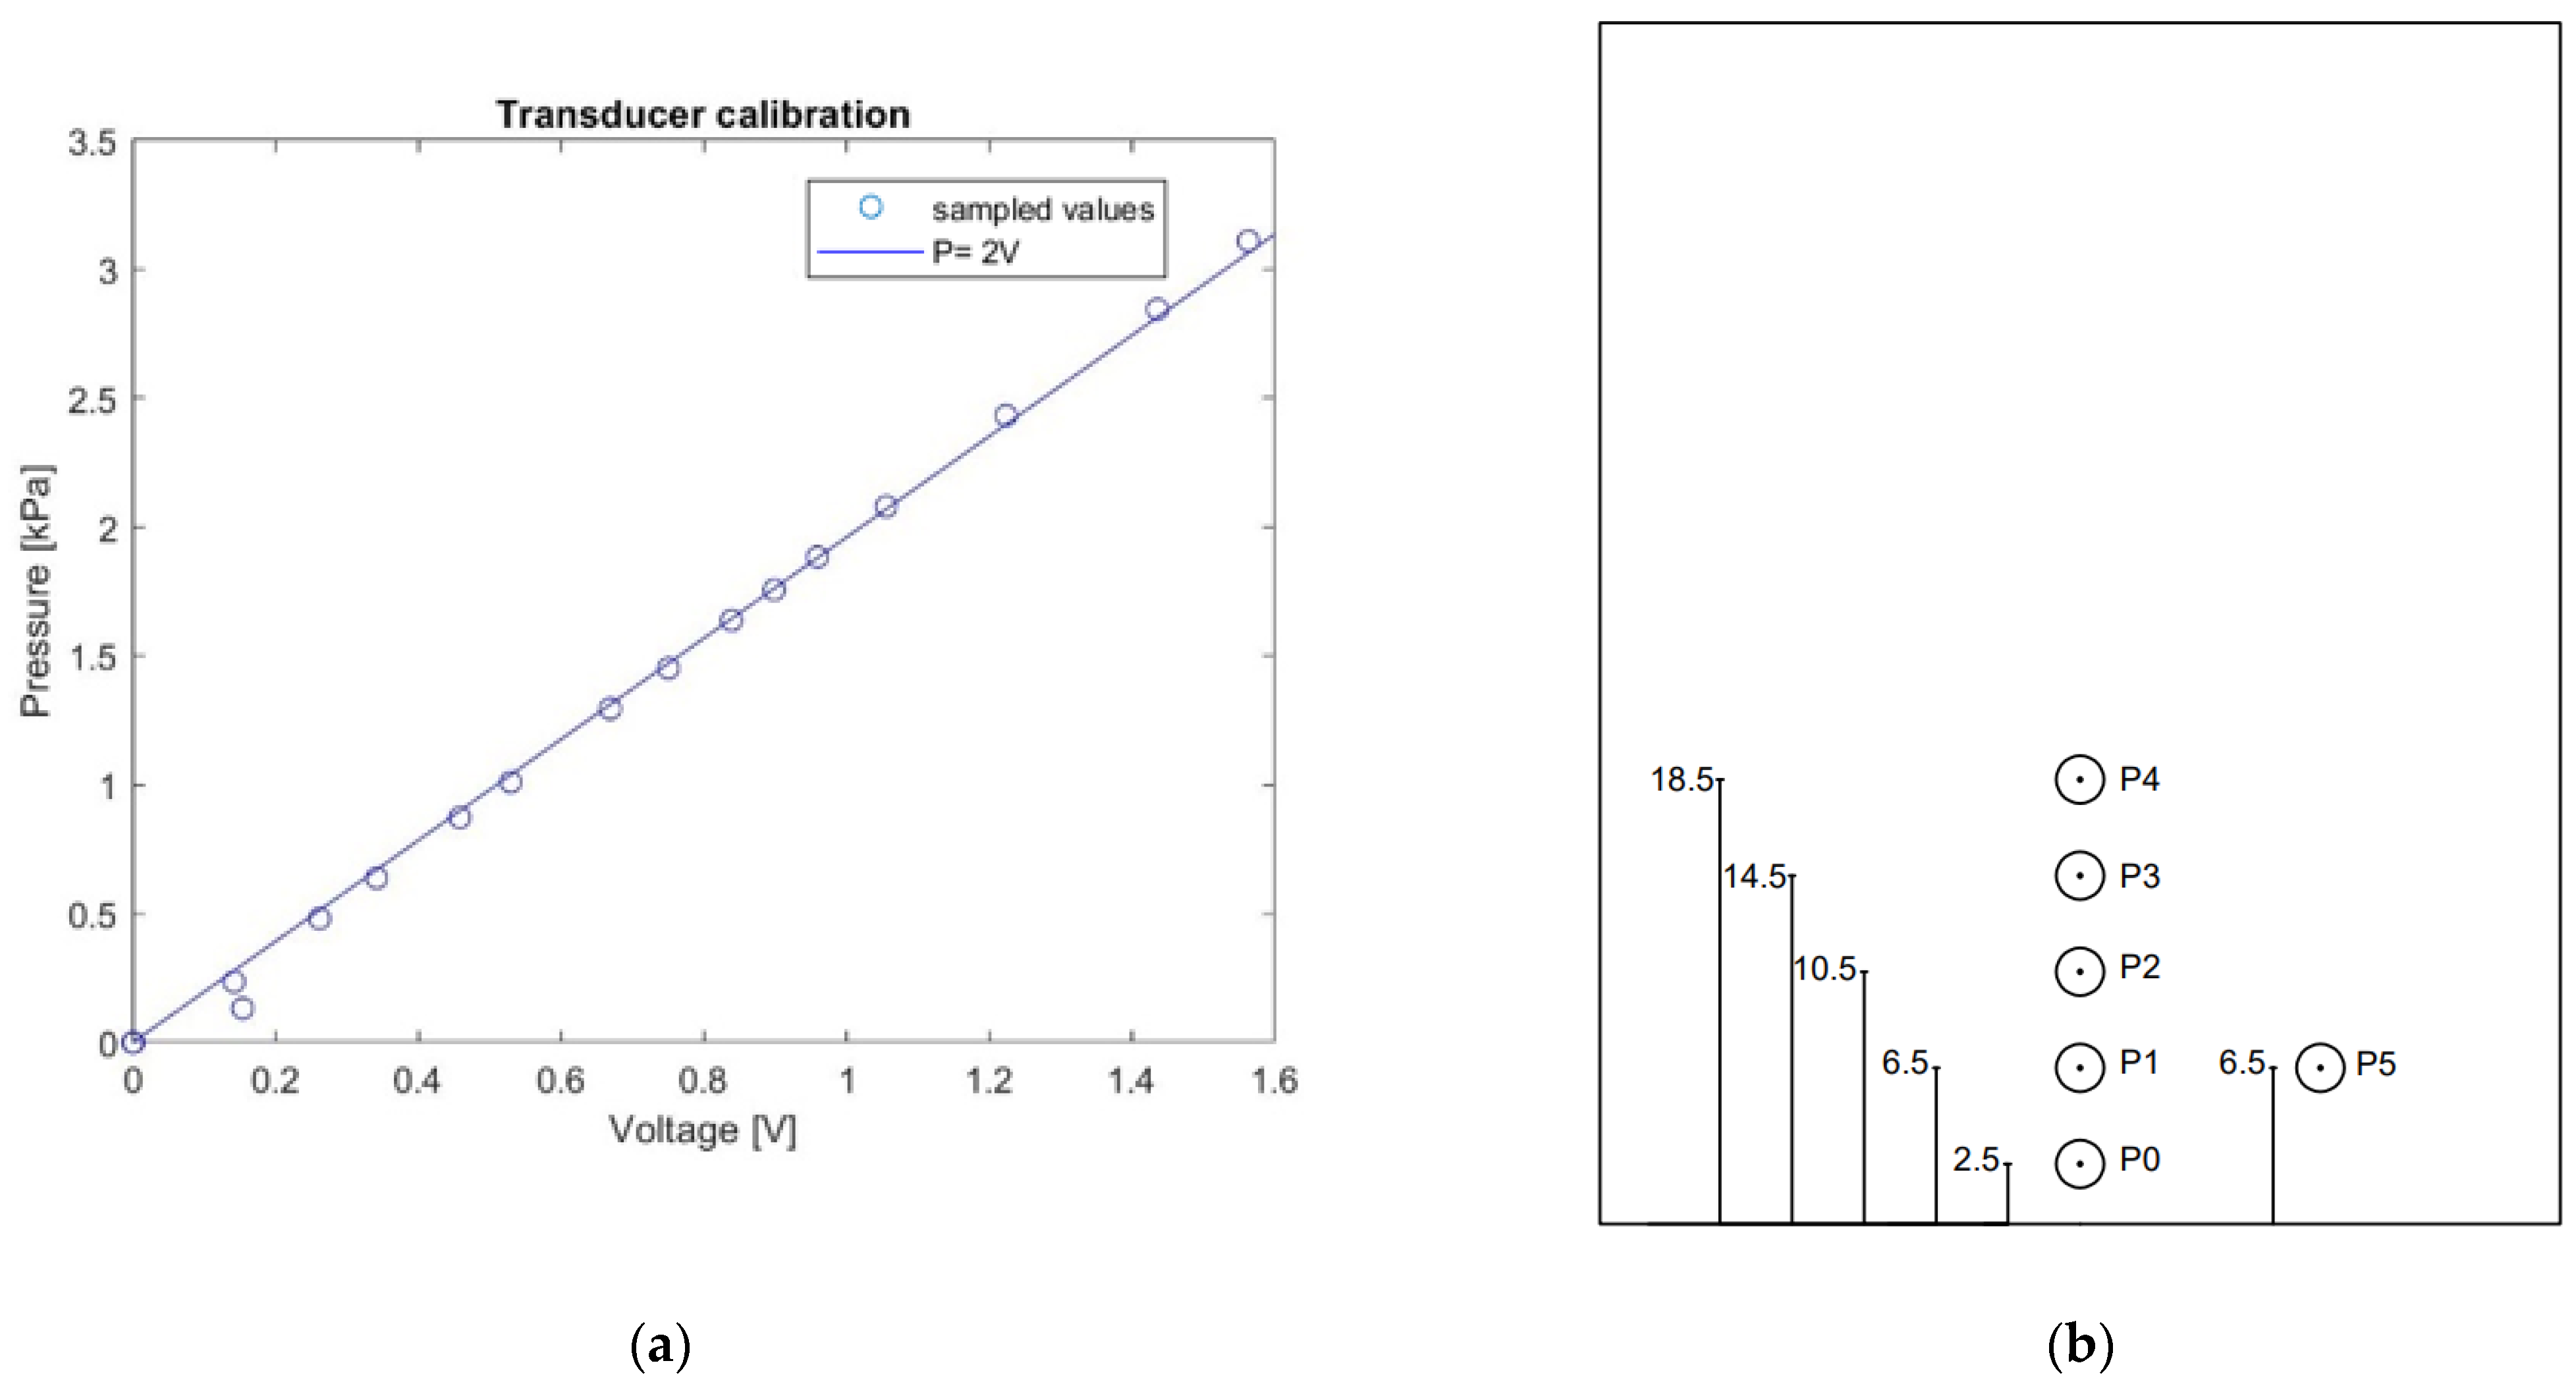
A vertical gate with six pressure transducers, Gefran TSA, was placed at the end of the channel. These had a sampling range from 0.0 to 0.1 bars with an accuracy of the 0.15% on the full-scale output and the maximum acquisition’s frequency was 2000 Hz. They are powered by 10V and communicate with the PC through Labjack. The transducers were managed by means of the open-source software MAtlab. Thanks to MAtlab we were able to set the same acquisition frequency of the camera. Moreover, MAtlab has the same time as the computer, as well as the cameras, so that the two devices were synchronized. The calibration was carried out with hydrostatic pressure, and the calibration curve is shown in
Figure 1a. The placement of the transducers, reported in
Figure 1b, was set in order to obtain as many local measurements of the pressure on the same axis as possible, yet at the same time taking into account the physical size of the single transducer. Transducers
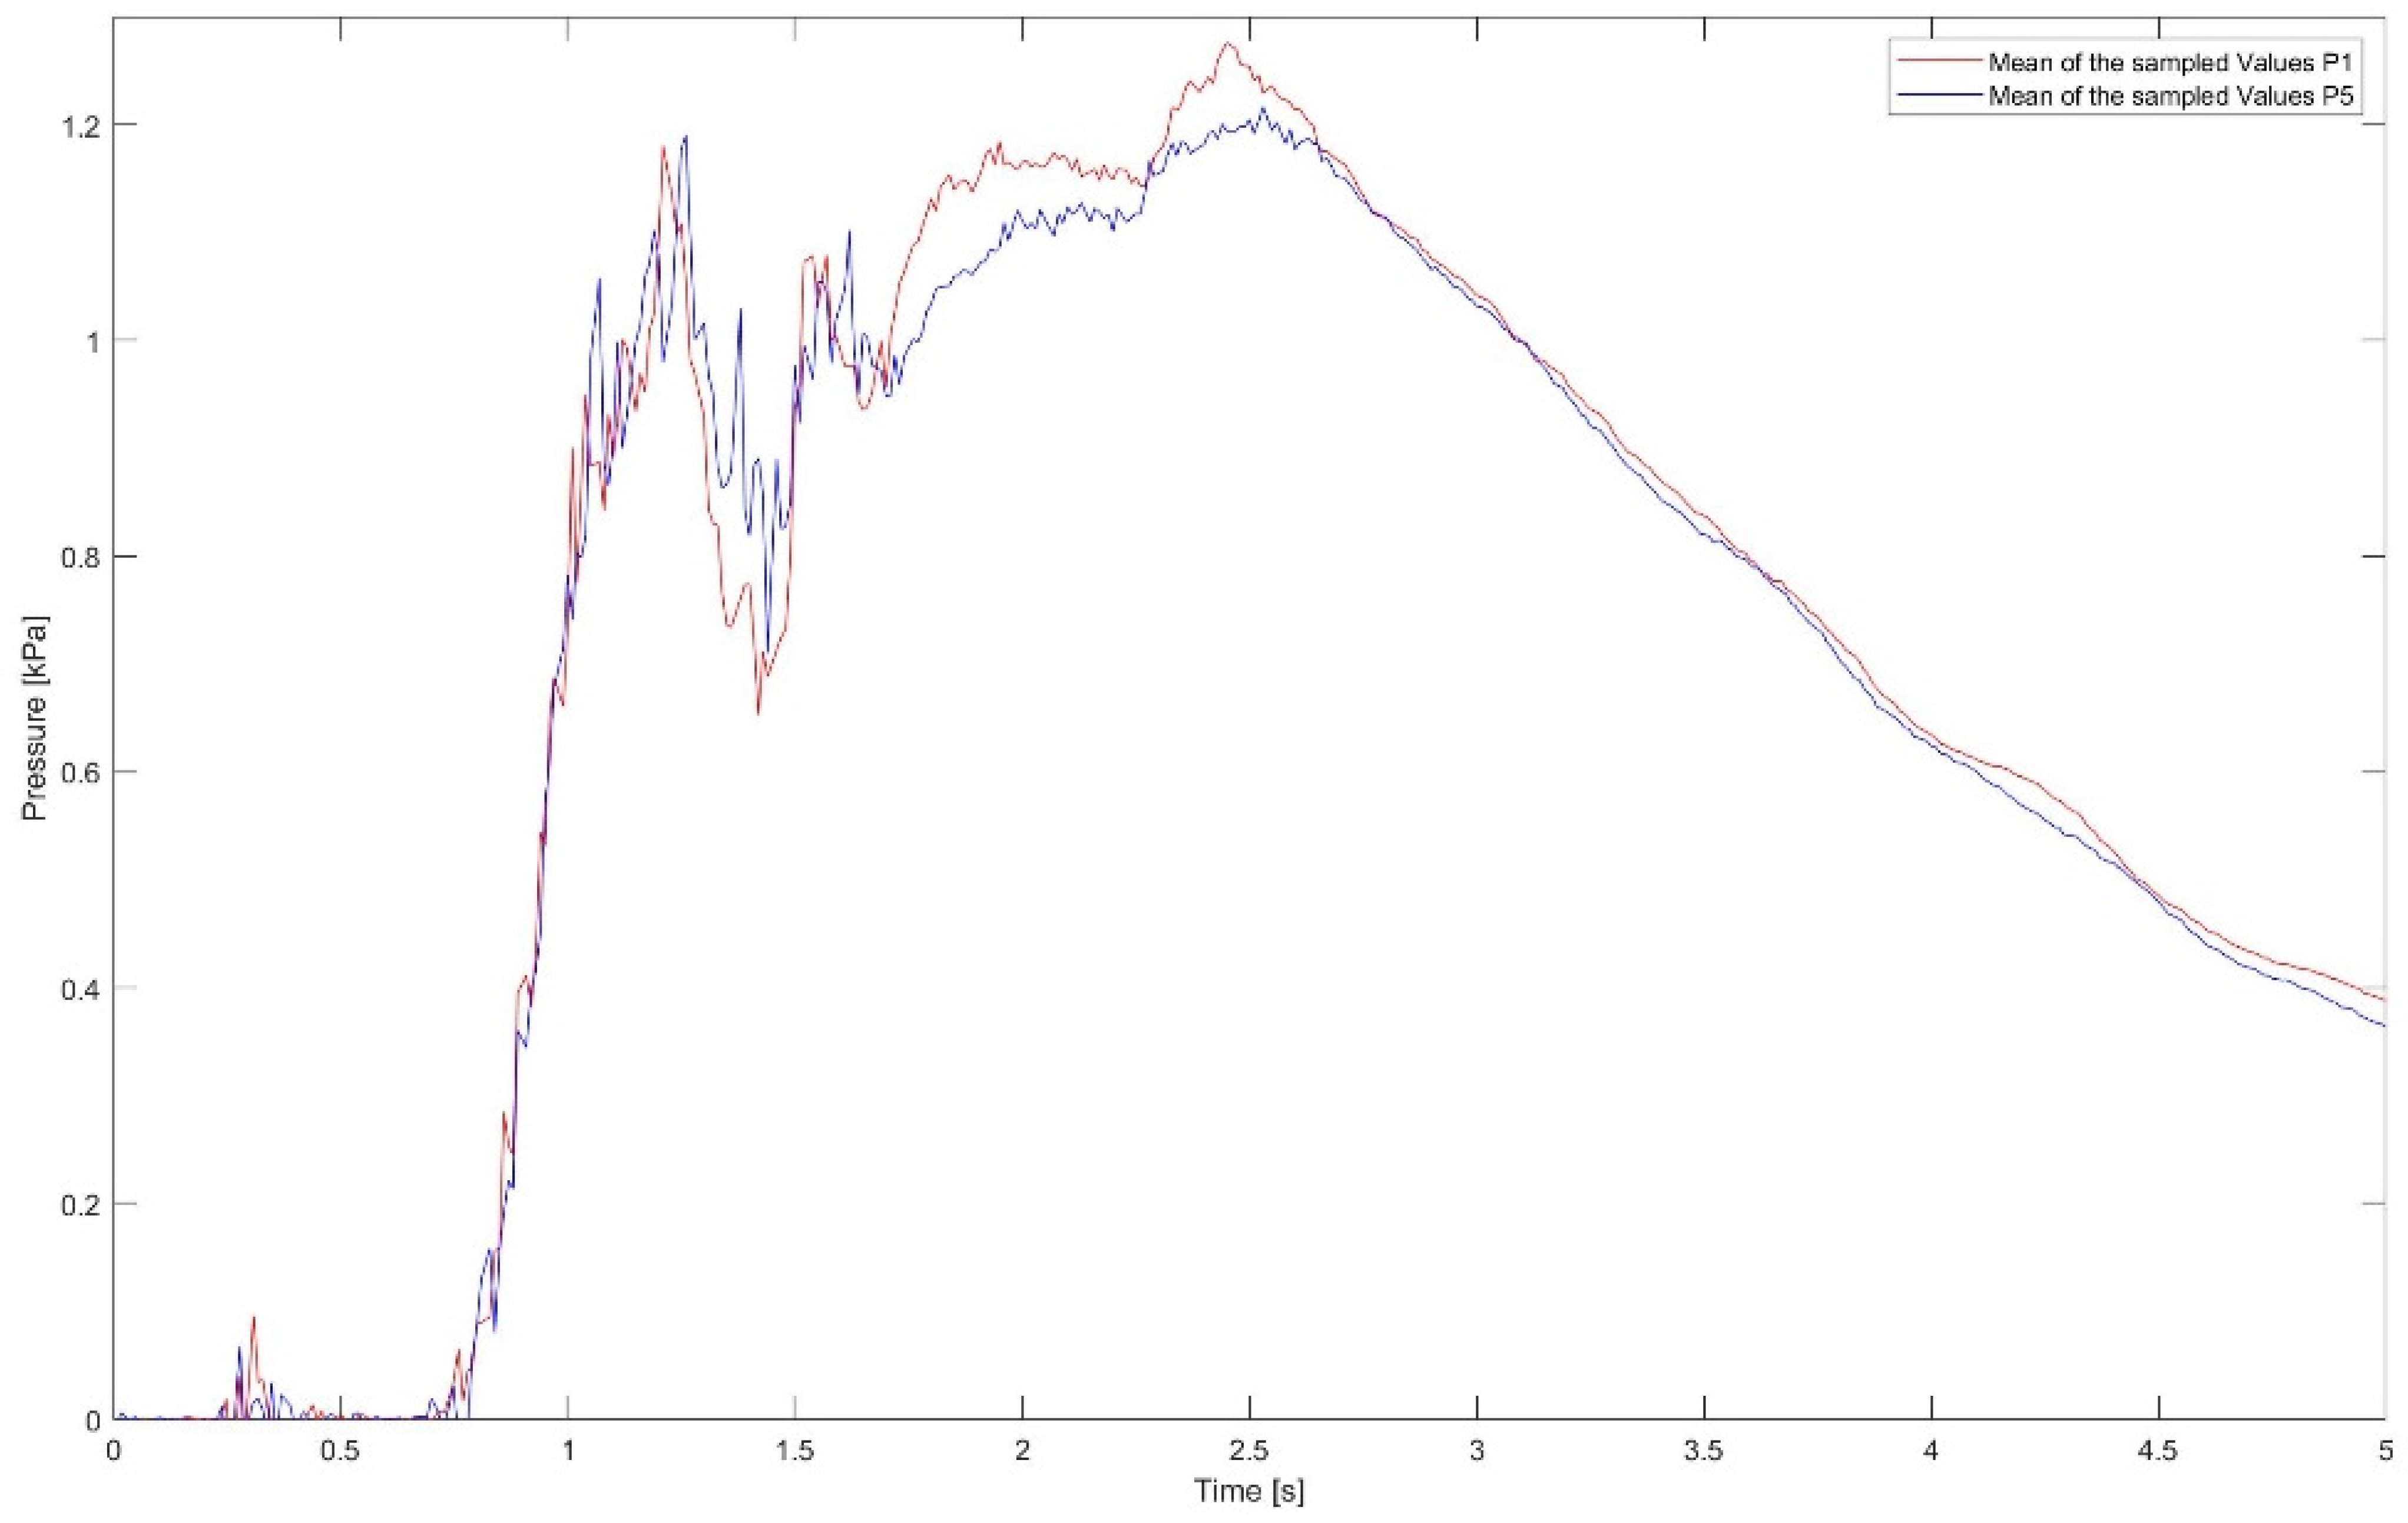
P1 and
P5 were located at the same depth in order to verify the one-dimensionality of the motion (
Figure 2). As
Figure 2 shows, further investigations are needed to understand the effect of the lateral walls on the fluid motion and on the pressure exerted by the water on the down-stream wall.
The pressure transducers measure the local pressure, i.e., at the point in which they are installed. To obtain the instantaneous total force extent on the wall it is necessary to integrate the discrete measurements of the pressure along it.
3. Results
The dam break experiment was carried out by collecting the water surface profile and the extent of the force on the downstream vertical wall. The initial water depth behind the gate was 0.2 m. The velocity of the gate removal was compared with the characteristic time [
5].
where
h0 is the initial water depth and
g is the gravity acceleration. For 0.2 m of water, the removal time, i.e., the time that the gate no longer touches the water [
5], is 0.120 s, whereas the characteristic time is 0.201 s. For this reason, [
5] argues that the phenomenon can be said to be instantaneous since
t <
tc. The lateral wall friction has been neglected due to the ratio between the wight of the channel and the fact that the water depth is at least four at the initial stage of the phenomenon. After the impact, the water depth increased but the waterfront celerity was about 1 m/s, for this reason wall friction can also be neglected in this case. The bottom friction was considered in the simulations of the numerical model.
In order to obtain the water surface profile, the two high-speed cameras were located alongside the channel at the same altitude. Two cameras were used to obtain a 1D record of the flow; in fact, one was located perpendicularly to the gate, whereas the other was located perpendicularly to the final wall. The two images are then joined with MAtlab to obtain a complete view of the channel. They were previously calibrated with a MAtlab toolbox and MAtlab stereo camera calibrator in order to eliminate focal distortion.
No other sensors were needed to obtain the celerity of the propagated front and the water surface. In fact, with this image processing technique, it is possible, if the image is georeferenced, i.e., calculating the pixel–centimeter ratio of the images, to create a water profile. Moreover, knowing the time gap between two consecutive frames, the front celerity can be obtained.
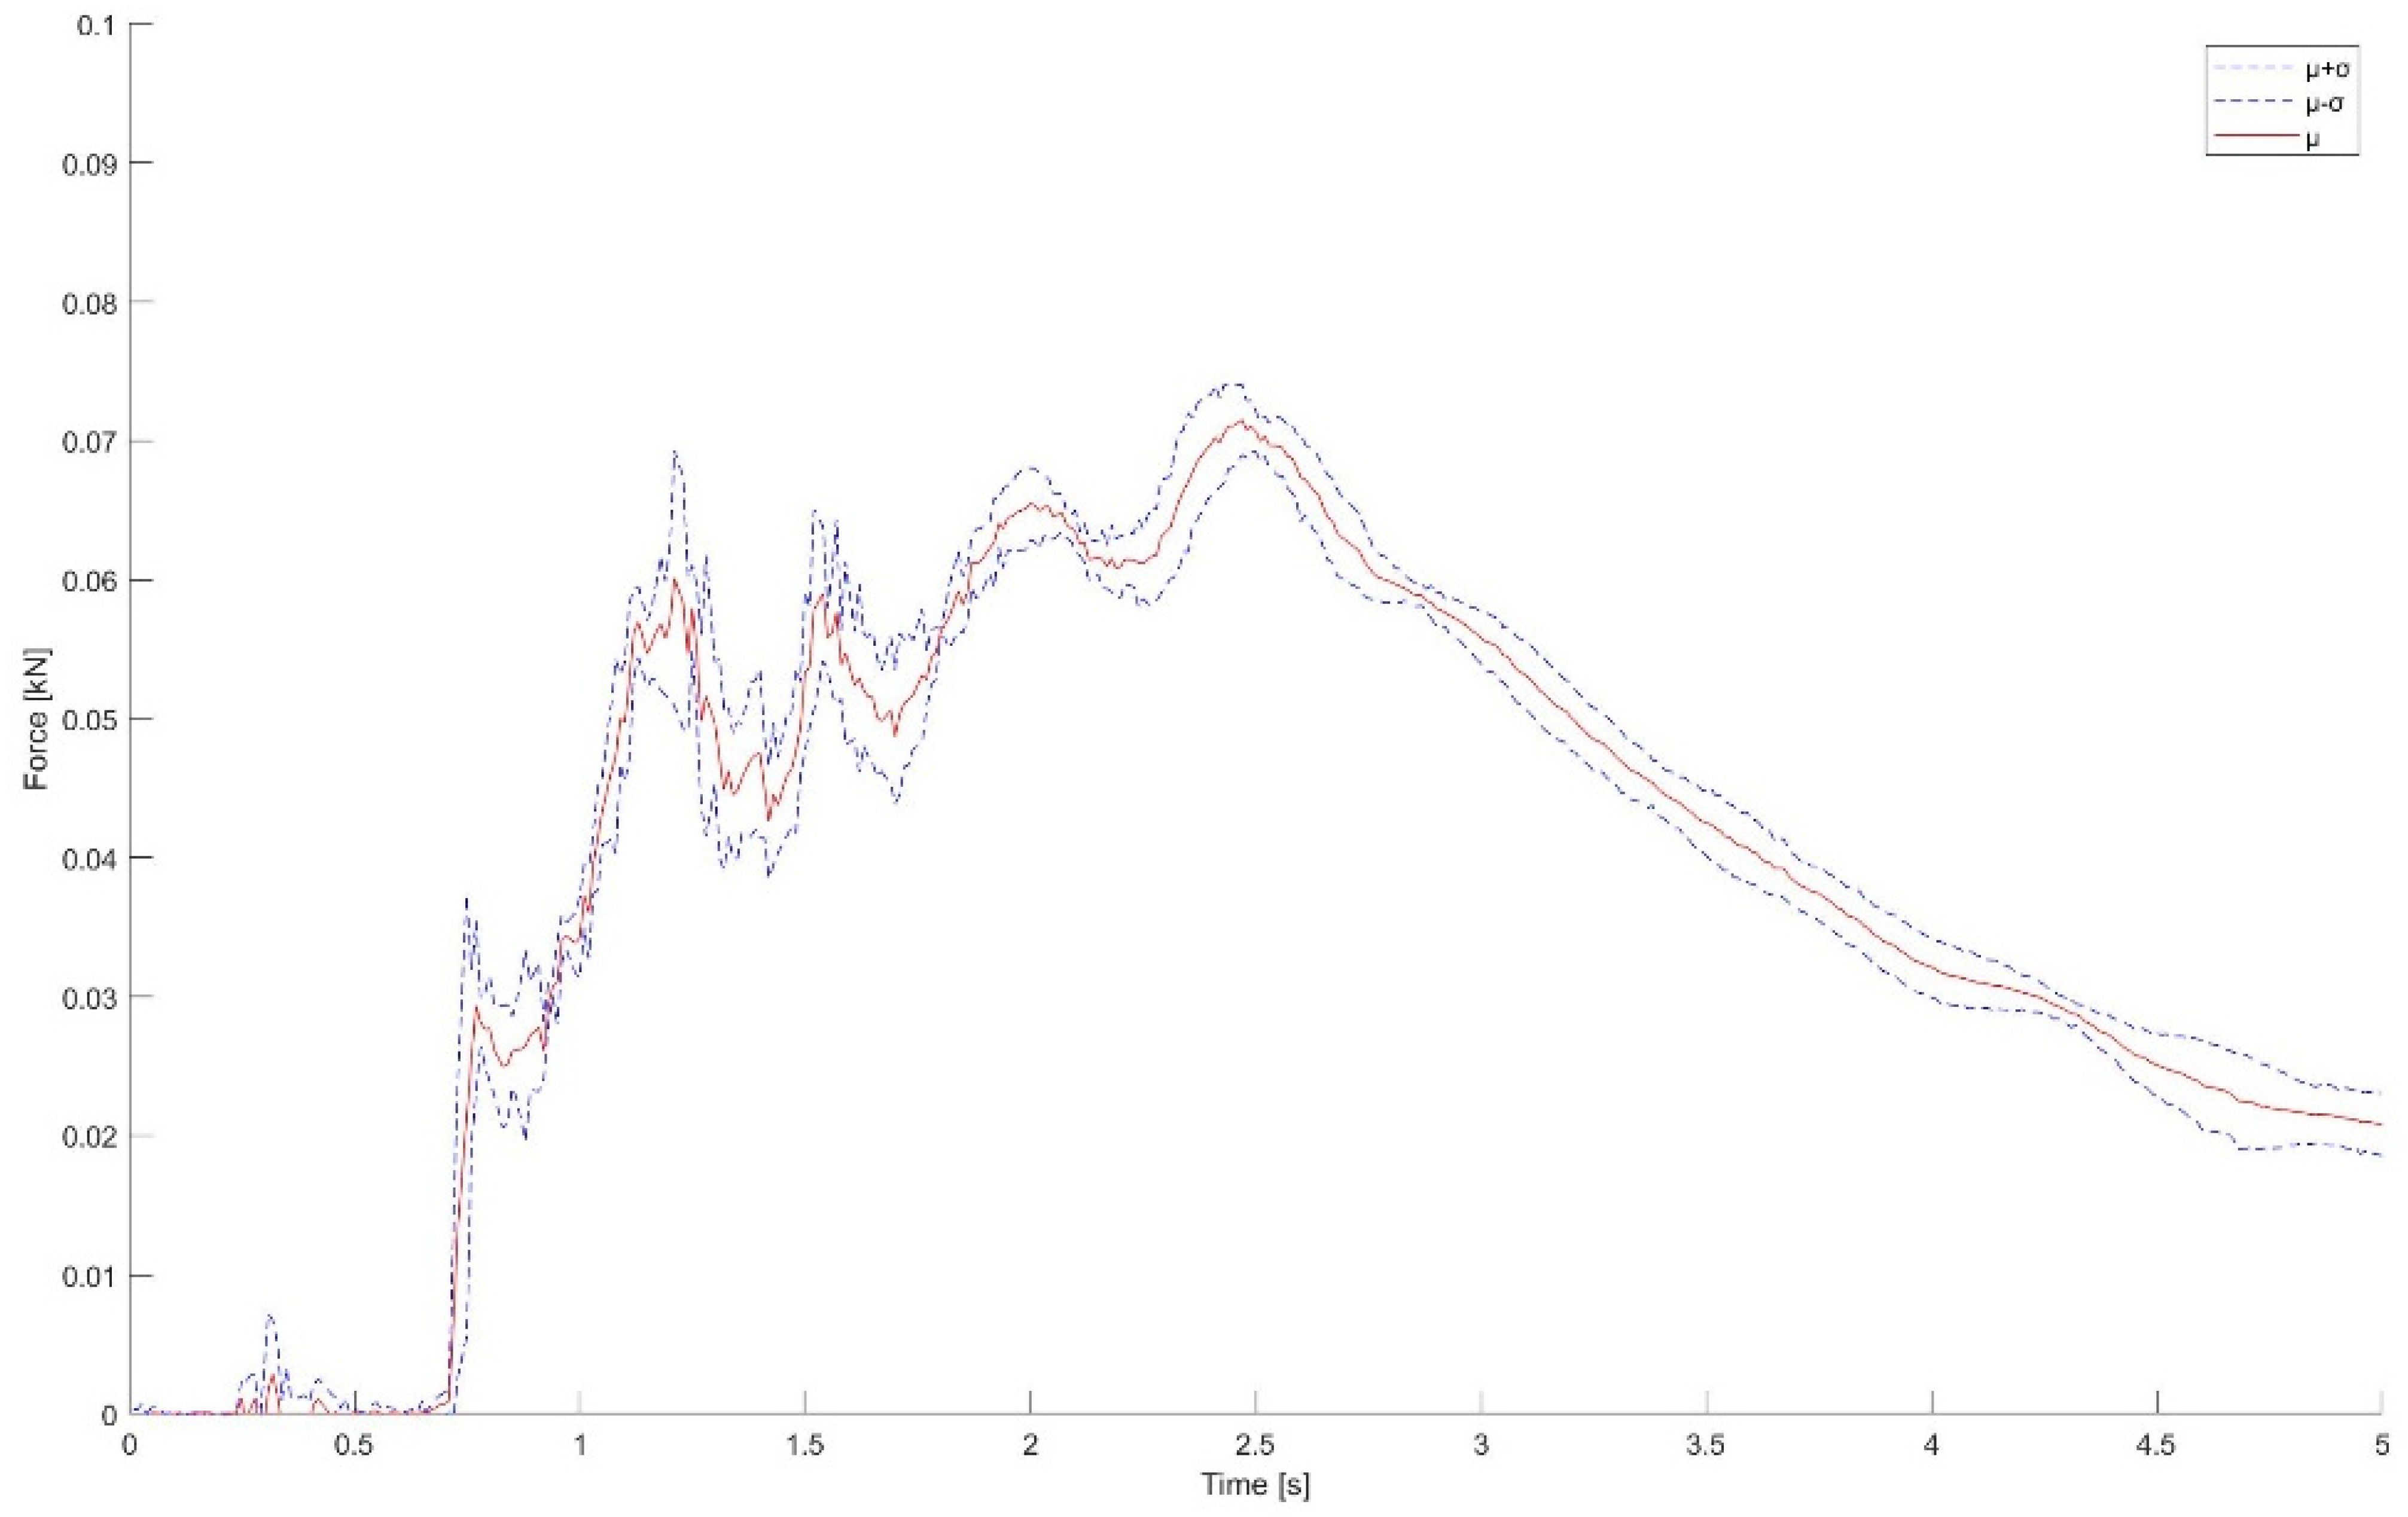
The impact force on the wall is calculated by integrating the pressure values sampled by the transducers. This can be obtained assuming that the phenomena is 1D, thus the values sampled by Pi transducer are extended to a fix influence area and the values sampled by transducer P5 are neglected.
The same experiment was repeated ten times in order to verify its reproducibility. Mean and root mean square values of the ten-time histories of the force were calculated and plotted in
Figure 3.
As can be seen in
Figure 3, there is a good reproducibility of the experiments, with an error of 3.64% on the maximum values of the force.
4. Discussion
The experimental data are compared with the numerical results of a depth-integrated model [
19]. The governing equations are numerically solved with a finite volume scheme, which is second-order accurate in space and total variation diminishing (TVD) and first-order accurate in time. The boundaries conditions imposed at both the upstream and downstream end of the channel are of a solid wall type, which induces a complete wave reflection. This boundary conditions both upstream and downstream of the channel has been implemented through the ghost cells technique [
20]. The roughness of the channel as the dimensionless Chezy coefficient for the steady flow is 22. The lateral wall friction has been neglected.
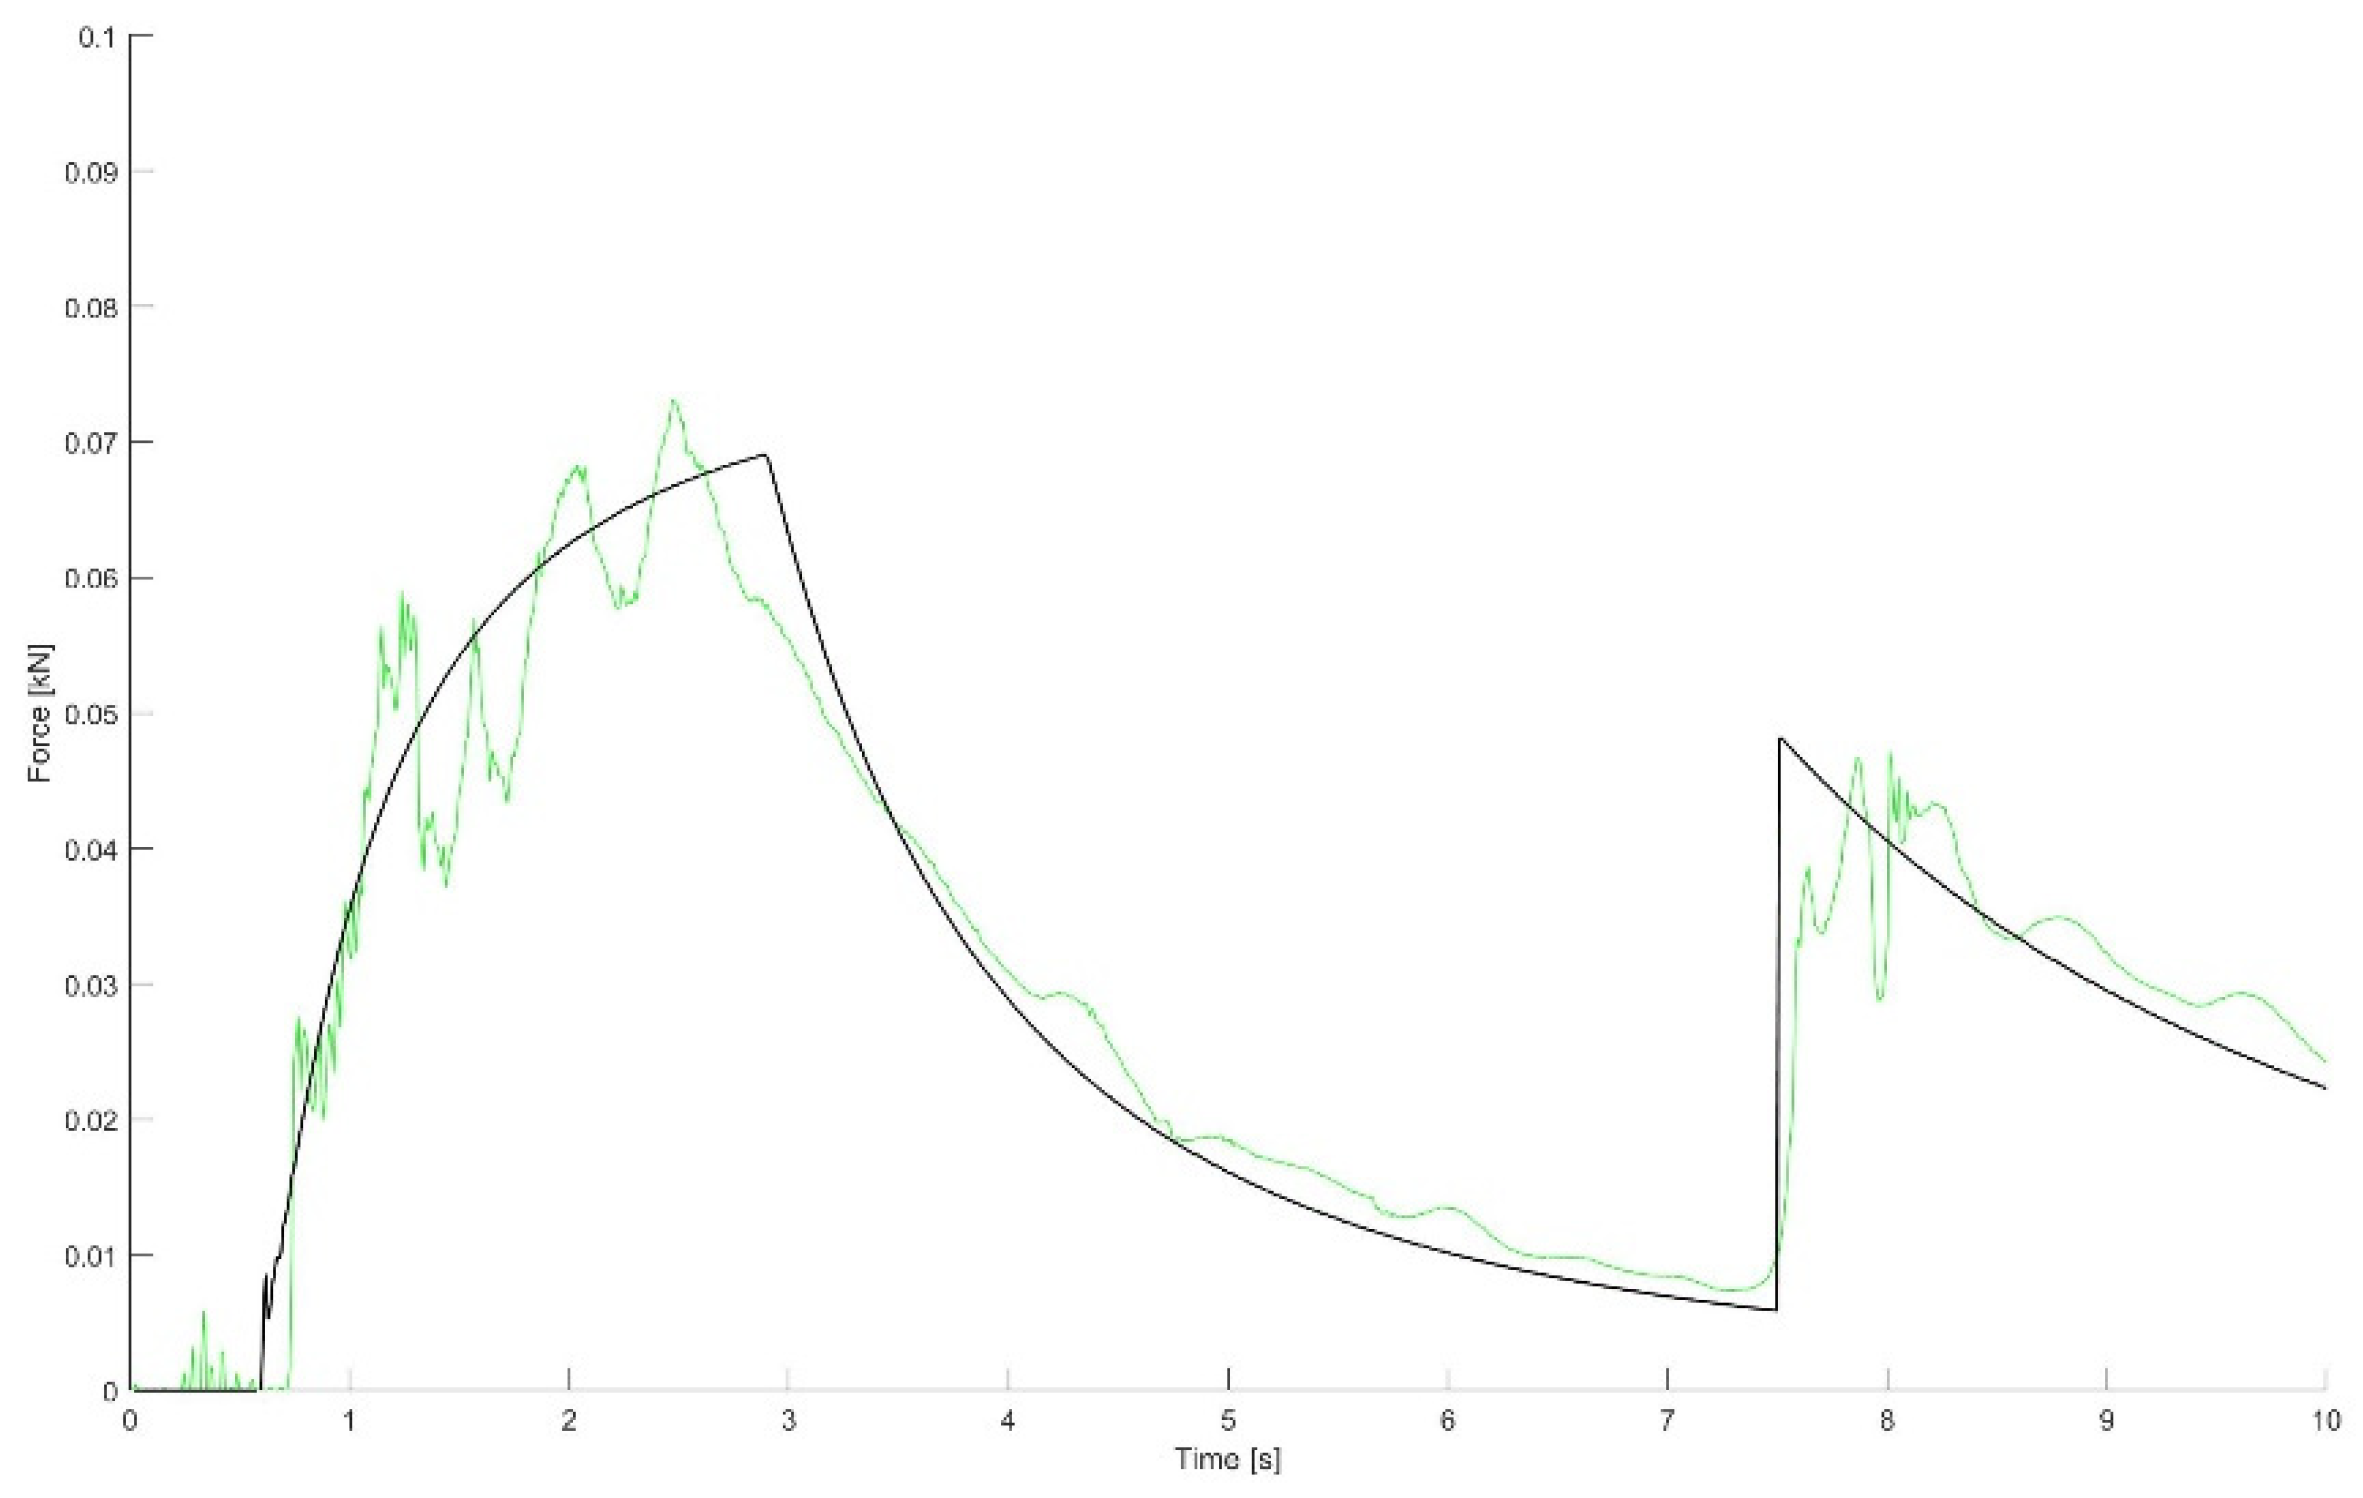
Figure 4 shows the time histories of the measured force extent on the wall. For the sake of the comparison, the numerical predictions are also reported.
Figure 4 shows that the impact of the wave against the downstream wall occurs at
and an abrupt increase of the force is detected. After the impact, the force continues to increase (in not a monotone way), reaching its maximum value (F
m = 0.072 kN) at
. For
the force smoothly decreases and at
a second abrupt increment of the force is detected. Such a force dynamic is essentially due to the formation of a bore at
caused by the wave impact. The bore starts to propagate in the upstream direction, impacts against the upstream wall, and reverses its propagation direction. At
, the bore impact against the downstream wall occurs.
The results shown in
Figure 4 suggests that the depth-integrated model is able to predict with sufficient accuracy the experimental evidence. Indeed, the difference between the calculated and measured value of the maximum of the force is 3.37%.
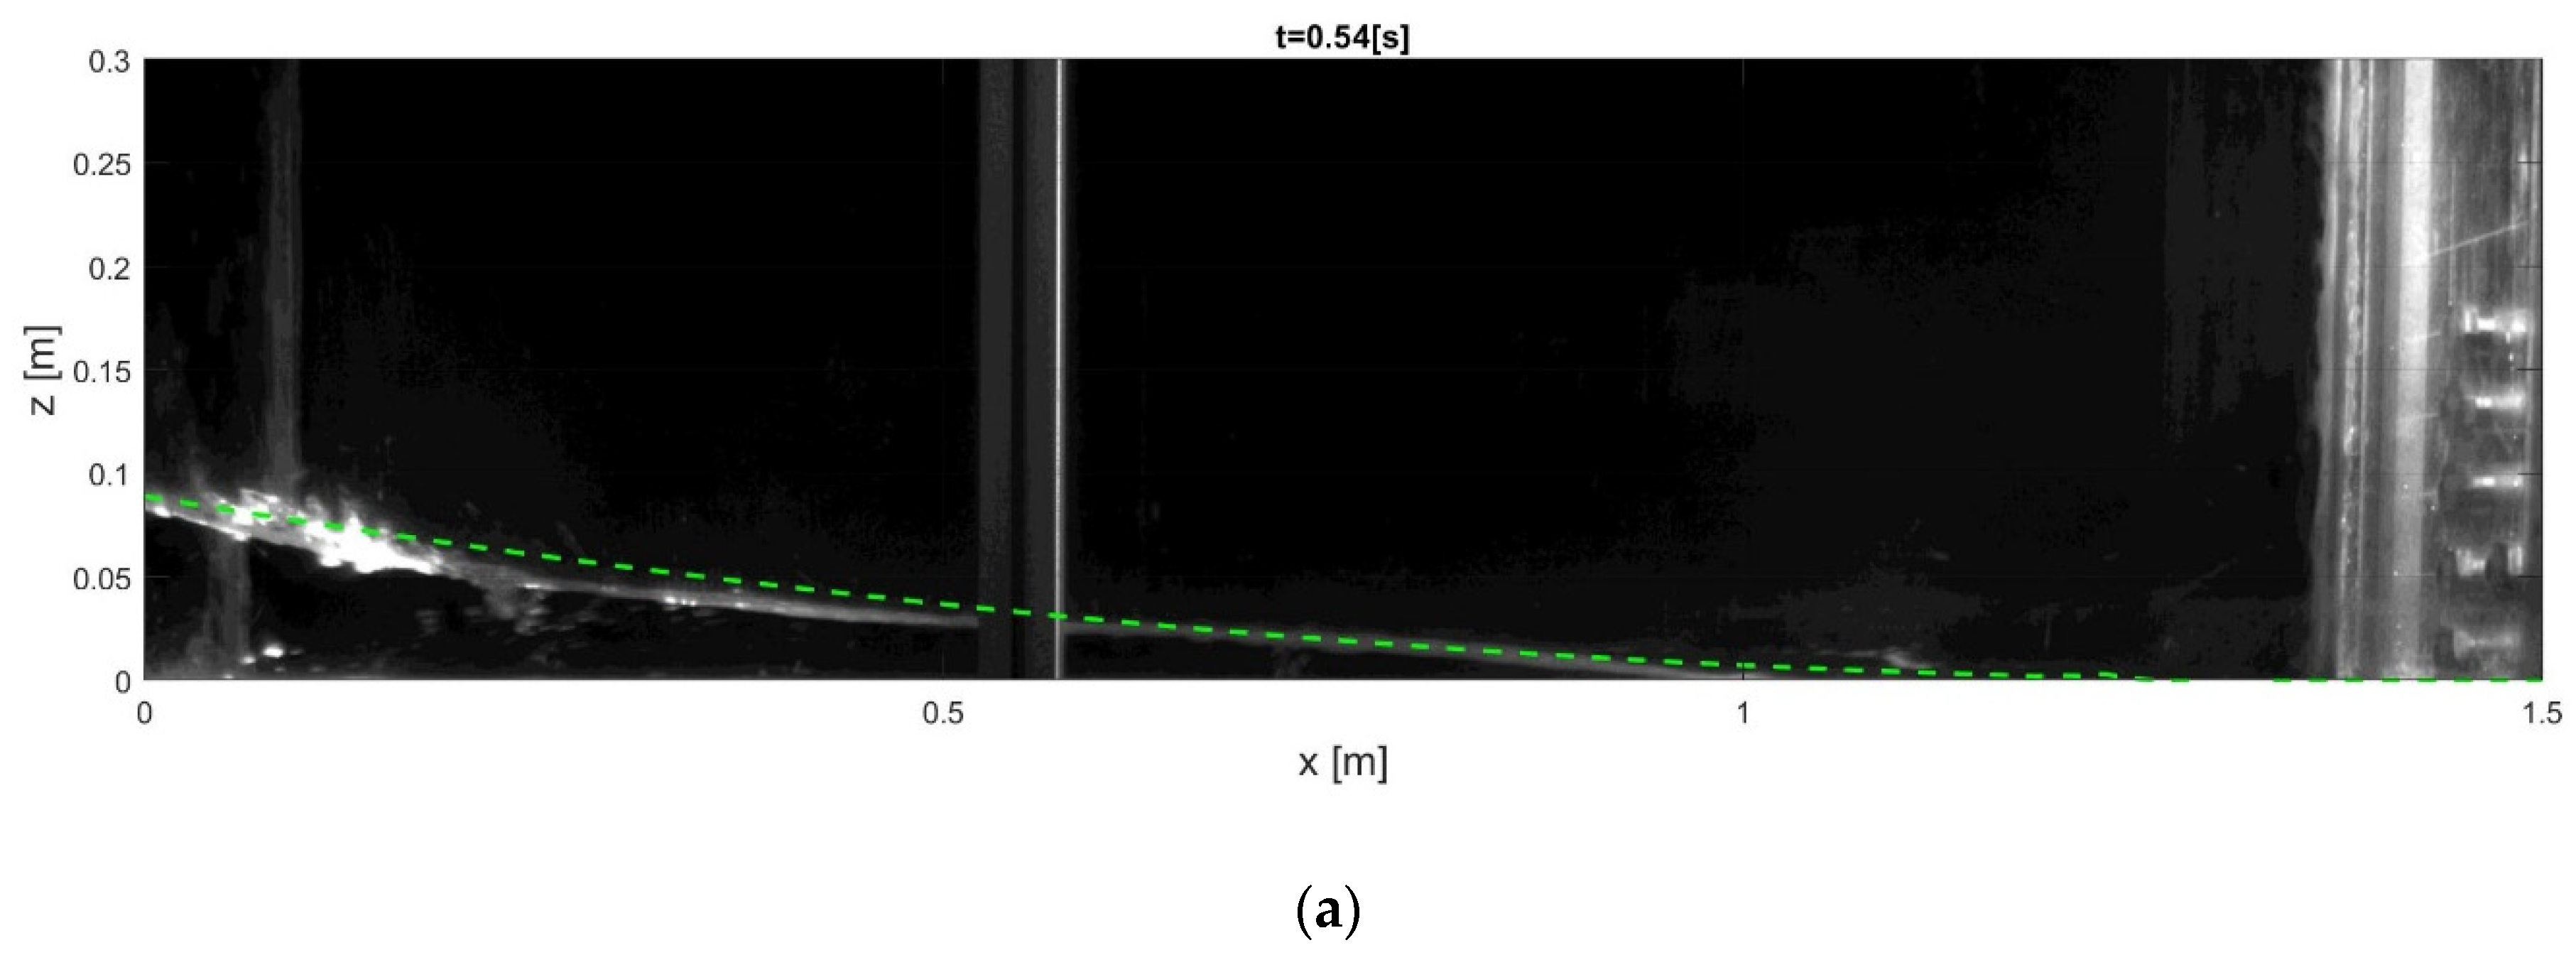
Figure 5 shows the free surface at two instants, i.e.,
t = 0.54 s (a) and
t = 1.38 s (b), from the gate opening, along with the numerical predictions.
Figure 5 suggests that the SW model is able to reproduce with sufficient accuracy even the local features of the process.
5. Conclusions
Our experimental study aims at investigating dam break flows and the interaction of the resulting unsteady flow with structures. For this purpose, five pressure transducers were synchronized with two high speed cameras, and both water surface and forces on the wall were measured. The preliminary results show a good repeatability of the experiments and a good agreement with the numerical model both in terms of forces and free surface; for this reason, the hypothesis made on the wall friction is significant. Indeed, an error amounting to 3.37% was found in the maximum value of the experimental force.
Our preliminary results represent a fundamental starting point from which future studies concerning the interaction between dam break flows and structures will be developed. Future studies will focus on the influence of a movable bed on a dam break flow that impacts against a structure; in particular, the influence of the roughness and of the bed load on the pressures and forces exerted on different types of obstacle.
Author Contributions
Conceptualization, A.D.G. and G.L.F.; methodology, F.D.P., A.V., C.D.C. and A.L.; software, A.L. and G.L.F.; validation, A.V. and C.D.C.; formal analysis, F.D.P., G.L.F., A.V. and C.D.C.; investigation, A.D.G. and G.L.F.; resources, F.D.P. and A.L.; data curation, A.D.G. and G.L.F.; writing—original draft preparation, A.D.G. and A.V.; writing—review and editing, A.D.G., G.L.F., C.D.C., A.V. and F.D.P.; visualization and supervision, C.D.C. and A.V.; project administration, A.D.G.; funding acquisition, A.L. and F.D.P. All authors have read and agreed to the published version of the manuscript.
Funding
“CONTRIBUTI PER LA PERMANENZA NEL MONDO ACCADEMICO DELLE ECCELLENZE”—Attuazione del Programma Operativo della Regione Lazio Fondo Sociale Europeo Programmazione 2014–2020. Asse III—Istruzione e formazione—Priorità di investimento 10 ii)—Obiettivo specifico 10.5.
Institutional Review Board Statement
Not applicable.
Informed Consent Statement
Informed consent was obtained from all subjects involved in the study.
Data Availability Statement
Not applicable.
Conflicts of Interest
The authors declare no conflict of interest.
References
- Chanson, H. Application of the method of characteristics to the dam break wave problem. J. Hydraul. Res. 2009, 47, 41–49. [Google Scholar] [CrossRef] [Green Version]
- Wüthrich, D.; Pfister, M.; Nistor, I.; Schleiss, A.J. Experimental Study of Tsunami-Like Waves Generated with a Vertical Release Technique on Dry and Wet Beds. J. Waterw. Port Coast. Ocean Eng. 2018, 144, 04018006. [Google Scholar] [CrossRef]
- Chanson, H. Tsunami Surges on Dry Coastal Plains: Application of Dam Break Wave Equations. Coast. Eng. J. 2006, 48, 355–370. [Google Scholar] [CrossRef] [Green Version]
- Lynett, P.J. Tsunami Inundation, Modeling of. In Complexity in Tsunamis, Volcanoes, and their Hazards; Tilling, R.I., Ed.; Springer: New York, NY, USA, 2009; pp. 117–133. [Google Scholar] [CrossRef]
- Lauber, G.; Hager, W.H. Experiments to dambreak wave: Horizontal channel. J. Hydraul. Res. 1998, 36, 291–307. [Google Scholar] [CrossRef]
- Soares-Frazão, S.; Zech, Y. Experimental study of dam-break flow against an isolated obstacle. J. Hydraul. Res. 2007, 45, 27–36. [Google Scholar] [CrossRef]
- Robertson, I.N.; Paczkowski, K.; Riggs, H.R.; Mohamed, A. Experimental Investigation of Tsunami Bore Forces on Vertical Walls. J. Offshore Mech. Arct. Eng. 2013, 135, 021601. [Google Scholar] [CrossRef]
- Soares-Frazão, S.; Canelas, R.; Cao, Z.; Cea, L.; Chaudhry, H.M.; Moran, A.D.; El Kadi, K.; Ferreira, R.; Cadórniga, I.F.; Gonzalez-Ramirez, N.; et al. Dam-break flows over mobile beds: Experiments and benchmark tests for numerical models. J. Hydraul. Res. 2012, 50, 364–375. [Google Scholar] [CrossRef]
- Lobovský, L.; Botia-Vera, E.; Castellana, F.; Mas-Soler, J.; Souto-Iglesias, A. Experimental investigation of dynamic pressure loads during dam break. J. Fluids Struct. 2014, 48, 407–434. [Google Scholar] [CrossRef] [Green Version]
- Wüthrich, D.; Pfister, M.; Nistor, I.; Schleiss, A.J. Experimental study on forces exerted on buildings with openings due to extreme hydrodynamic events. Coast. Eng. 2018, 140, 72–86. [Google Scholar] [CrossRef]
- Wüthrich, D.; Pfister, M.; Schleiss, A.J. Effect of bed roughness on tsunami-like waves and induced loads on buildings. Coast. Eng. 2019, 152, 103508. [Google Scholar] [CrossRef]
- Spinewine, B.; Zech, Y. Small-scale laboratory dam-break waves on movable beds. J. Hydraul. Res. 2007, 45, 73–86. [Google Scholar] [CrossRef]
- Zech, Y.; Soares-Frazão, S.; Spinewine, B.; le Grelle, N. Dam-break induced sediment movement: Experimental approaches and numerical modelling. J. Hydraul. Res. 2008, 46, 176–190. [Google Scholar] [CrossRef]
- Biswal, S.K.; Moharana, M.K.; Agrawal, A.K. Effects of initial stage of dam-break flows on sediment transport. Sādhanā 2018, 43, 203. [Google Scholar] [CrossRef] [Green Version]
- Bahmanpouri, F.; Daliri, M.; Khoshkonesh, A.; Namin, M.M.; Buccino, M. Bed compaction effect on dam break flow over erodible bed; experimental and numerical modeling. J. Hydrol. 2021, 594, 125645. [Google Scholar] [CrossRef]
- Zanuttigh, B.; Lamberti, A. Experimental analysis of the impact of dry avalanches on structures and implication for debris flows. J. Hydraul. Res. 2006, 44, 522–534. [Google Scholar] [CrossRef]
- Vagnon, F.; Segalini, A. Debris flow impact estimation on a rigid barrier. Nat. Hazards Earth Syst. Sci. 2016, 16, 1691–1697. [Google Scholar] [CrossRef] [Green Version]
- Ng, C.W.W.; Majeed, U.; Choi, C.E.; de Silva, W.A.R.K. New impact equation using barrier Froude number for the design of dual rigid barriers against debris flows. Landslides 2021, 18, 2309–2321. [Google Scholar] [CrossRef]
- Campomaggiore, F.; di Cristo, C.; Iervolino, M.; Vacca, A. Inlet effects on roll-wave development in shallow turbulent open-channel flows. J. Hydrol. Hydromech. 2016, 64, 45–55. [Google Scholar] [CrossRef]
- Leveque, R.J. Finite Volume Methods for Hyperbolic Problems; Cambridge University Press: Cambridge, UK, 2002; p. 580. [Google Scholar]
| Publisher’s Note: MDPI stays neutral with regard to jurisdictional claims in published maps and institutional affiliations. |
© 2022 by the authors. Licensee MDPI, Basel, Switzerland. This article is an open access article distributed under the terms and conditions of the Creative Commons Attribution (CC BY) license (https://creativecommons.org/licenses/by/4.0/).


 ,
, 


