1. Introduction
Dam-break waves may have catastrophic consequences due to the sudden release of significant water volumes from the upper reservoir. They may represent, therefore, a threat for people living downstream for civil works, such as buildings, bridges, facilities, etc. [
1,
2]. The numerical prediction of free surface profiles, flow depths and velocities, as well as the spatial allocation of inundated areas, is of paramount importance in terms of flood hazard prevention, aiming at reducing human losses and structural damages. The presence of obstacles, e.g., buildings, bridge piers or roads, plays an important role on the water depth distribution, velocity propagation and, more in general, on the flow regime [
3,
4,
5]. The way these works are oriented with respect to the main flow direction also influences the flow peculiarities. Another key aspect is related to the impact force exerted by an approaching dam-break wave [
6,
7].
The literature offers very few contributions regarding experimental investigations on two- and three-dimensional dam-break flows, as the measure of flow parameters under unsteady conditions is not trivial [
8]. In [
9], dam break investigations were carried out in a rectangular channel, comprehending dry and wet conditions for the downstream channel bottom. Cagatay and Kocaman [
10] carried out experiments over a rectangular cross-section channel deriving the free surface profiles by means of digital image processing techniques. More advanced studies, involving an irregular topography with the presence of singularities, such as contractions, have been investigated in [
11,
12,
13]. With reference to three-dimensional (3D) studies, few studies can be found, even more so when involving the presence of a building invested by a dam-break wave [
14,
15].
In the last two decades, dam-break flows have been mainly investigated numerically, thanks to the development of specific procedures and algorithms as well as the continuous increase of computer power. Numerical models based on two-dimensional (2D) shallow-water equations (SWEs) are commonly used, as they allow the simulation of floodplains in a reasonable amount of time often with satisfactory accuracy [
16,
17,
18]. However, SWEs approaches may fail in the presence of singularities as well as steep variations in the bottom topography, as they rely on the hydrostatic distribution along the vertical direction. Therefore, models, either VOF- or FEM-based, in which the Navier–Stokes equations are averaged and solved with a turbulence model, have recently become useful tools in solving such complex rapidly varied and unsteady flow problems [
19,
20,
21].
The present study aims to experimentally and numerically investigate the effects of an isolated building induced onto an approaching dam-break wave. Laboratory measurements consisting of video recordings are compared with the results obtained with the software package FLOW-3D. Results are discussed, then final conclusions are drawn.
2. The Experimental Setup
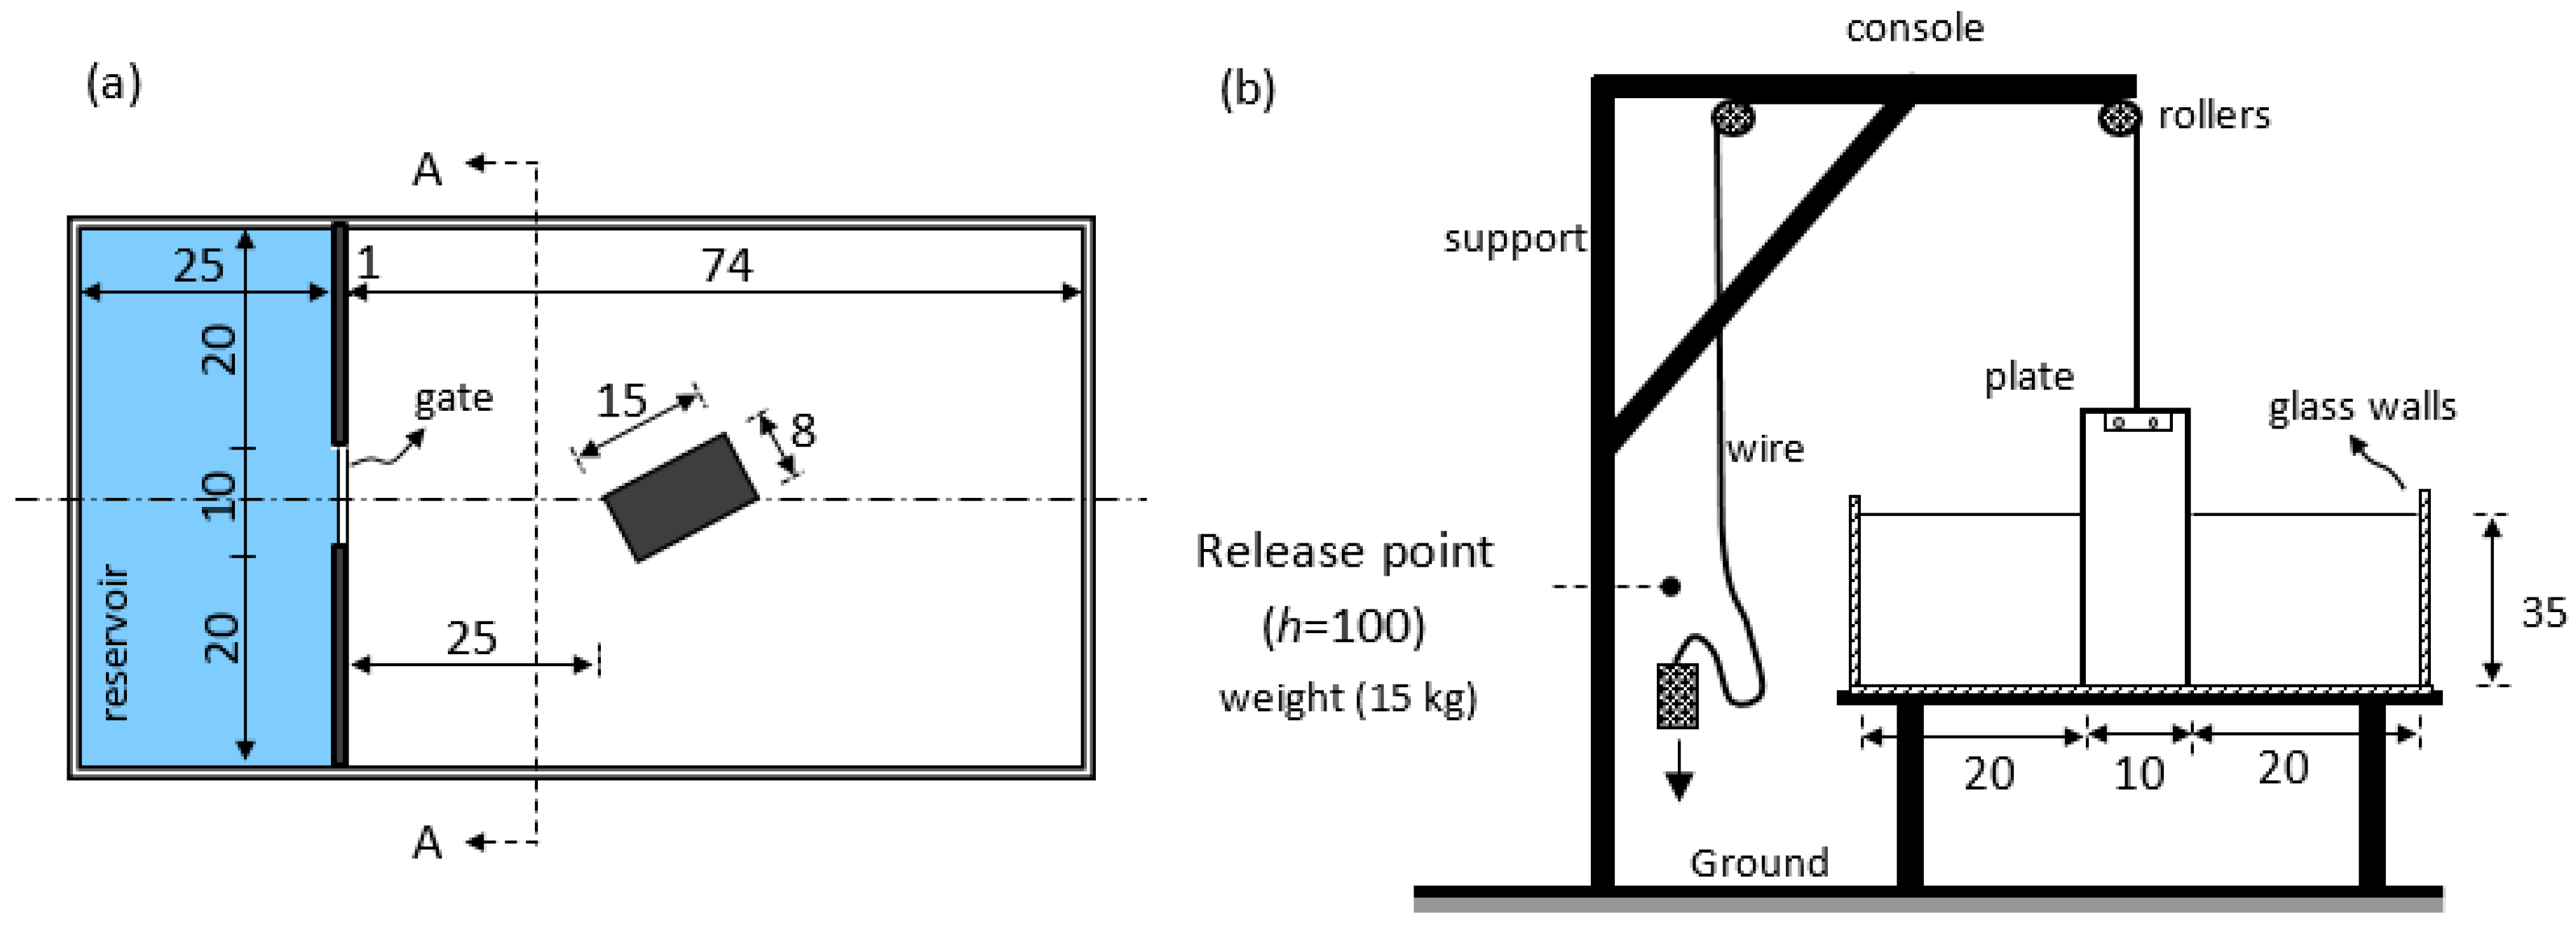
The experiments were performed on a rectangular horizontal channel, 1.00-m-long, 0.50-m-wide, and 0.35-m-high (
Figure 1a). Bottom and lateral walls were made of thick glass. The upstream water domain at rest was 0.25-m-long and h
0 = 0.15-m-high, mimicking the presence of a reservoir. The sluice gate, made of acrylic, 0.10-m-wide and 3-mm-thick, was placed at the center of the channel, its barycenter belonging to the streamwise plan of symmetry (dash-dot line in
Figure 1a). Waterproofing was achieved by using grease oil over the vertical guides.
In order to simulate the abrupt removal of the closing gate, a 15 kg mass connected with a steel rope was set to fall down from an elevation of 1 m, generating a fast and complete gate opening (
Figure 1b). The opening time was about 0.06 s from video recordings, a period smaller than the recommended value, 1.25(h
0/g)
1/2 = 0.15 s, suggested by Lauber and Hager [
9], with g = 9.80665 m/s
2 as the gravity acceleration.
Before performing an experiment, the upstream reservoir was filled with water. Dry bed conditions were realized at the downstream instead. A tall object of prismatic shape, 0.15-m-long and 0.08-m-wide, was located 0.25 m downstream from the plate. The obstacle was placed with a rotation angle of 28.0724° (
Figure 1a) so that one of its diagonals overlaps the streamwise flow direction (
Figure 1a). Other angles of rotations were taken into account, but corresponding results are not presented here for the sake of brevity.
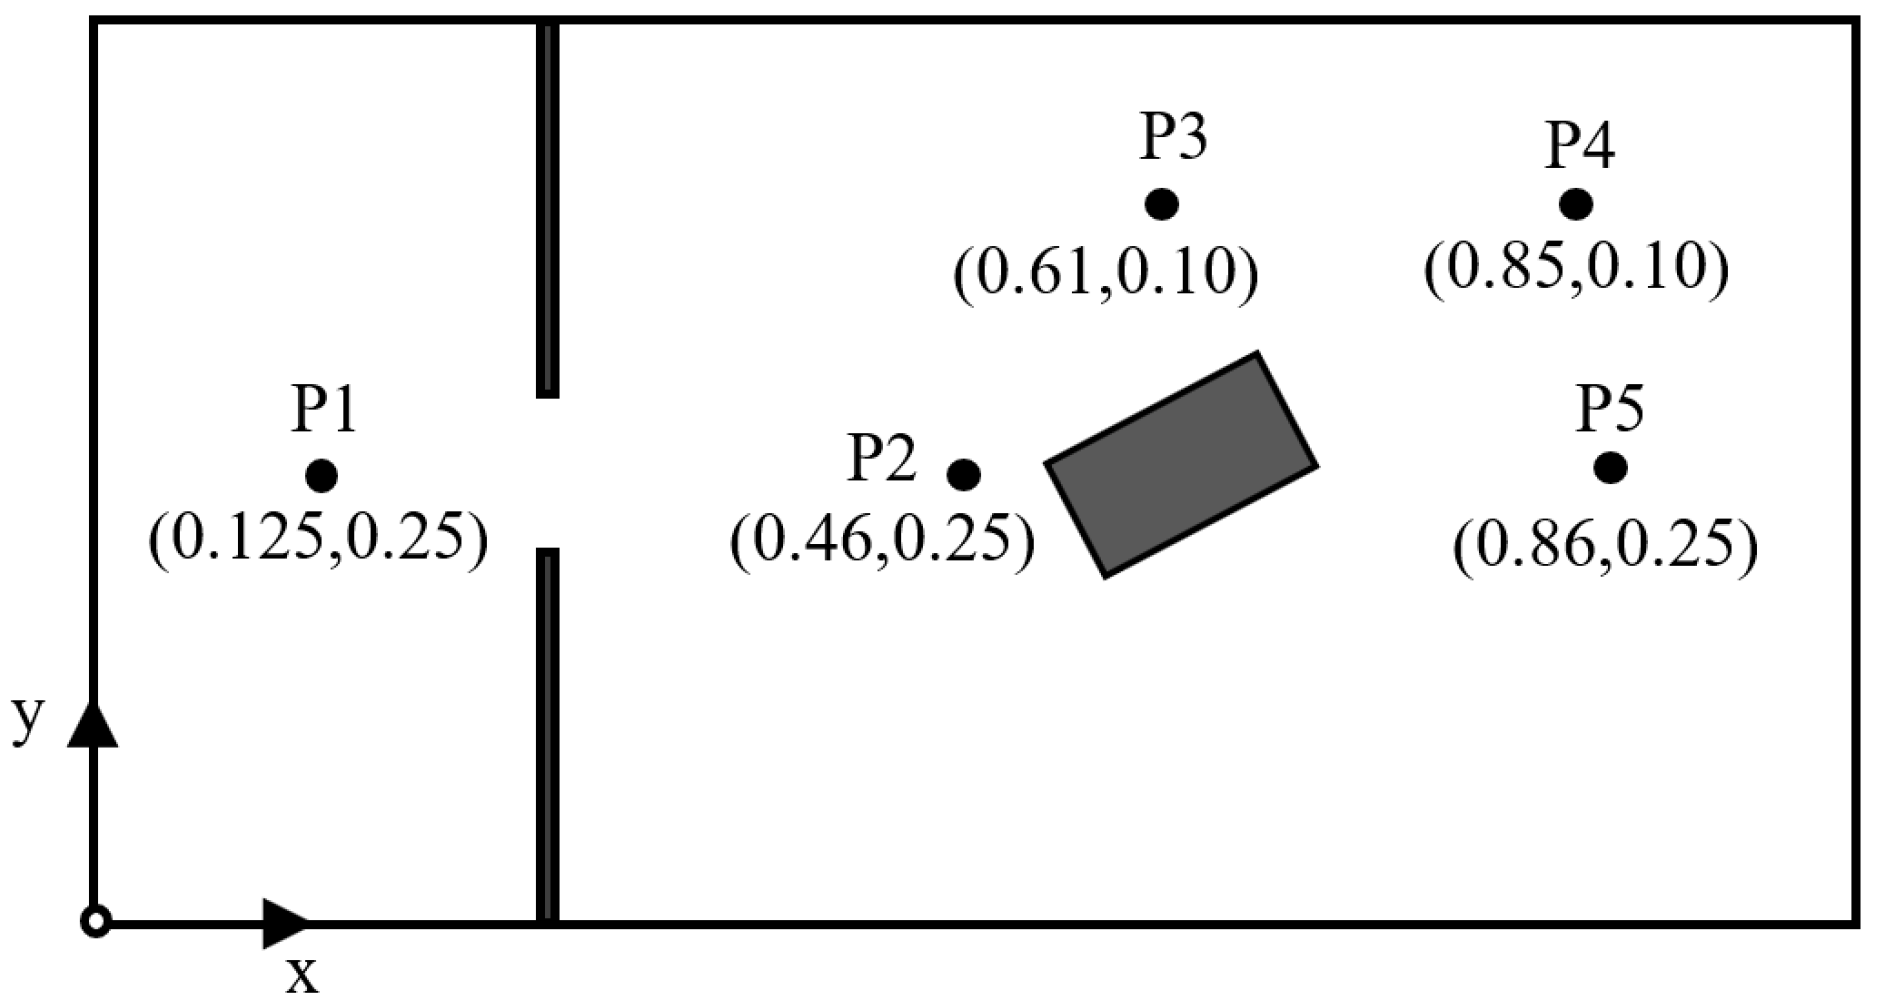
In order to detect fluid movement, dye was added to the water before removing the gate. Water levels were sampled at five locations (
Figure 2) using an ultrasonic sensor microsonic MIC+35/IU/TC, range 65-350 mm, at location P1 and ultrasonic sensor microsonic MIC+25/IU/TC, range 30–250 mm, at locations P2–P5. A high-speed 300 fps CCD camera was used to record the experiments’ evolution. The channel was lightened by fluorescent spotlight from above to better track water interfaces. Camera was placed above as well its position matching the vertical axis of the prismatic object.
3. Numerical Model
The non-stopping increase in computer power allowed the emerging and spread of Computational Fluid Dynamics (CFD) software as predictive tools in the context of hydraulic problems. Here, the software package FLOW-3D developed by Flow Science Inc., Los Alamos, USA, was used [
22] to perform simulations of unsteady flows in the experimental setup described above. Among available turbulence models, k-ε is adopted to close Reynolds-Averaged Navier–Stokes (RANS) equations [
23]. Free surfaces and interfaces are solved with the Volume of Fluid (VOF) method [
24] and the Fractional Area/Volume Obstacle Representation (FAVOR
TM).
VOF is a free-surface numerical technique for tracking and locating free surfaces and other liquid–liquid, liquid–gas interfaces. It belongs to the class of Eulerian methods, which are characterized by a computing mesh either stationary or integral to the moving domain to accommodate the evolving shape of the interfaces. The FAVOR
TM formulation [
25] is a collection of procedures implemented in Flow-3D
® to prevent numerical flow losses. It avoids the “zigzag” approximation of solid boundaries which may occur when the geometry is represented by a Cartesian grid, as in FLOW-3D
®. FAVOR
TM package eliminates zigzag direction changes by smoothly blocking out fractional portions of grid cell faces and volumes. In addition, it is used to compute interfacial areas as well as advecting term along them, wall stresses and to enhance numerical stability.
The computational domain was discretized in a rectangular mesh. The size of grid cells was fixed to Δx = Δy = Δz = 0.05 m, resulting in 200, 100 and 36 cells along the x, y and z directions, respectively. The total number of cells was therefore 720,000. The channel and obstacle surfaces were assumed smooth. Simulations were run for t = 15 s. The time step Δt was determined according to the Courant-Friedrichs-Lewy condition. The run-time was approximately 1 h 50 min on average, on a computer with Intel Core i7 2.8 GHz 16 GB RAM.
4. Results
The present study aims to observe and provide insight for the flow behavior when the dam-break flow encounters an oriented obstacle on its route in a 3D enclosed domain. Towards this aim, new experimental data were obtained using non-intrusive measurement techniques with ultrasonic sensors due to lack of real-case dam-break data and a limited number of experimental data. In addition, the comparison of the obtained results of time-dependent water levels with the results of an RANS-based numerical model, revealed the solution ability of the numerical model to efficiently simulate a complex, rapidly varied unsteady flow caused by a dam break.
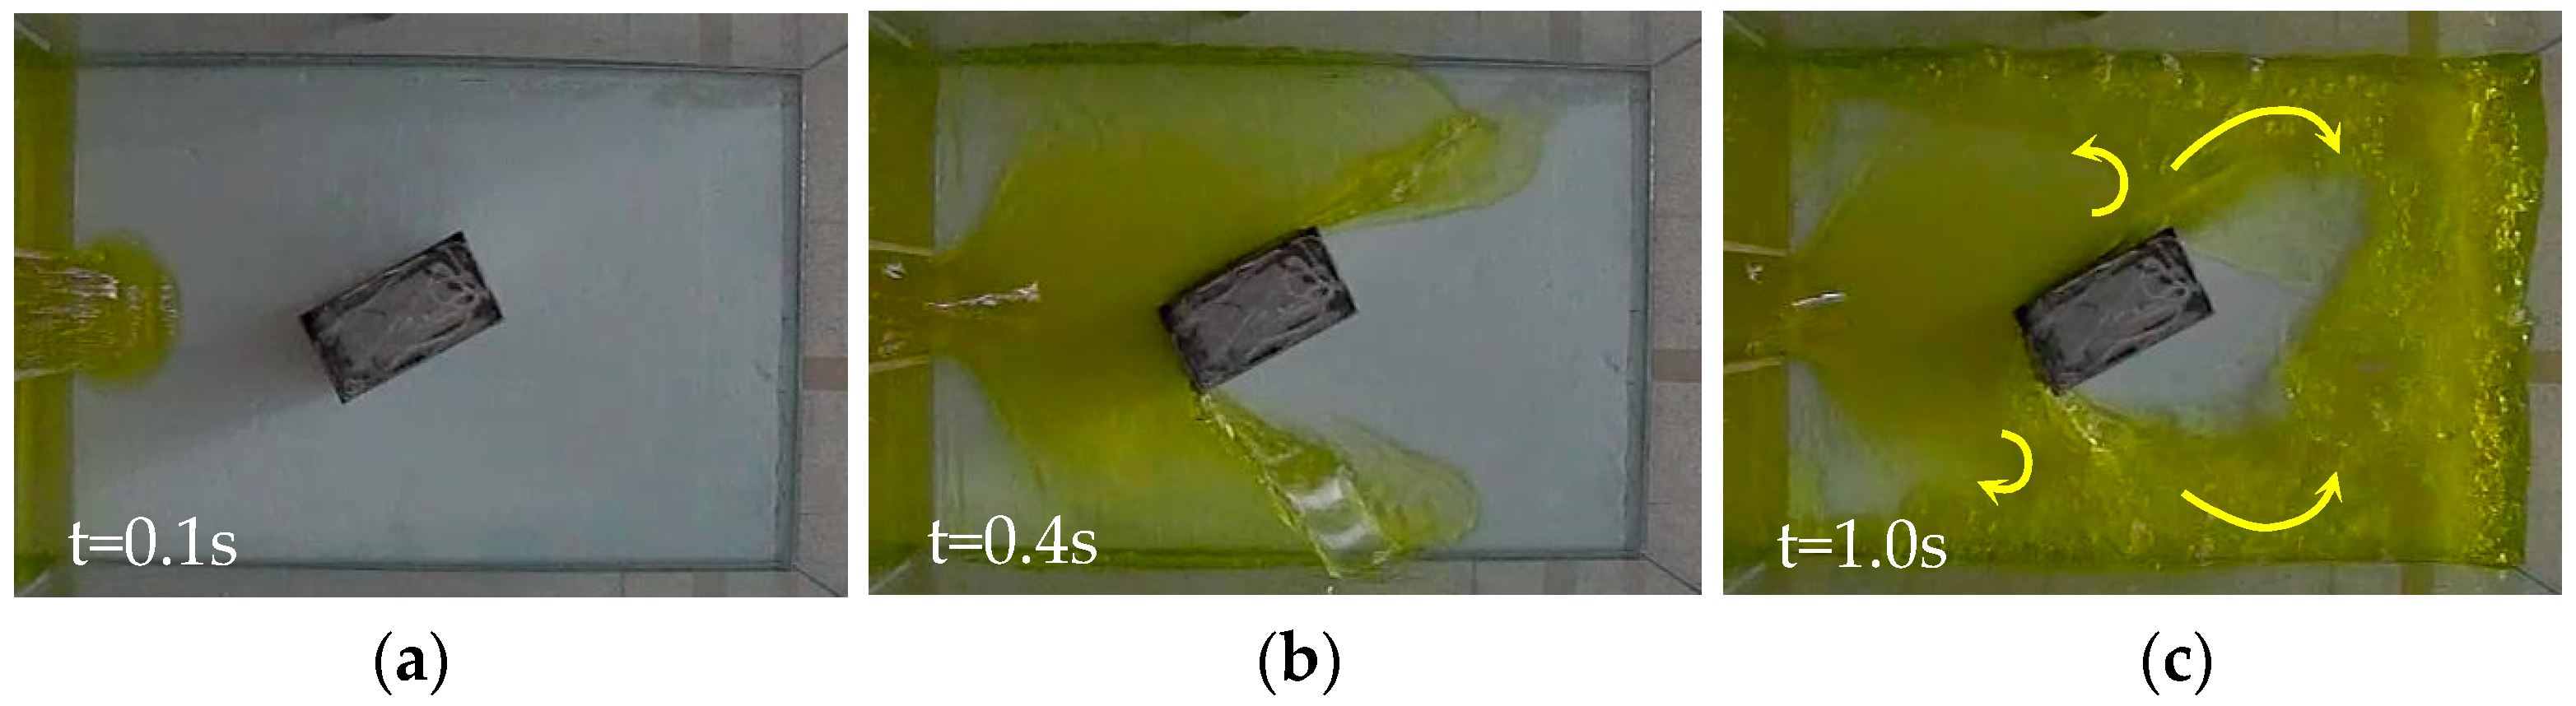
After the sudden removal of the sluice gate, a dam-break wave propagates downwards (
Figure 3a,
t = 0.1 s). As the wave reaches the object, it interacts locally by first increasing the water depth, and the flow separates (
Figure 3b,
t = 0.4 s), then decreasing it as the wave propagation takes place. The flow direction is significantly affected by presence of the object. At the initial and following stages of the dam-break flow, a wake zone occurs behind the object. Re-circulation zones can also be observed between the object and the lateral walls. The surrounded flow over the object reattaches downstream with the formation of negative waves (
Figure 3c,
t = 1.0 s). Object affects the flow conveyance and flow depths increase due to the decrease in the propagation speed of the flood wave. Reflections of the flow from the object, sidewalls and end wall result in oblique hydraulic jumps and lateral jumps, and these increase flow complexity.
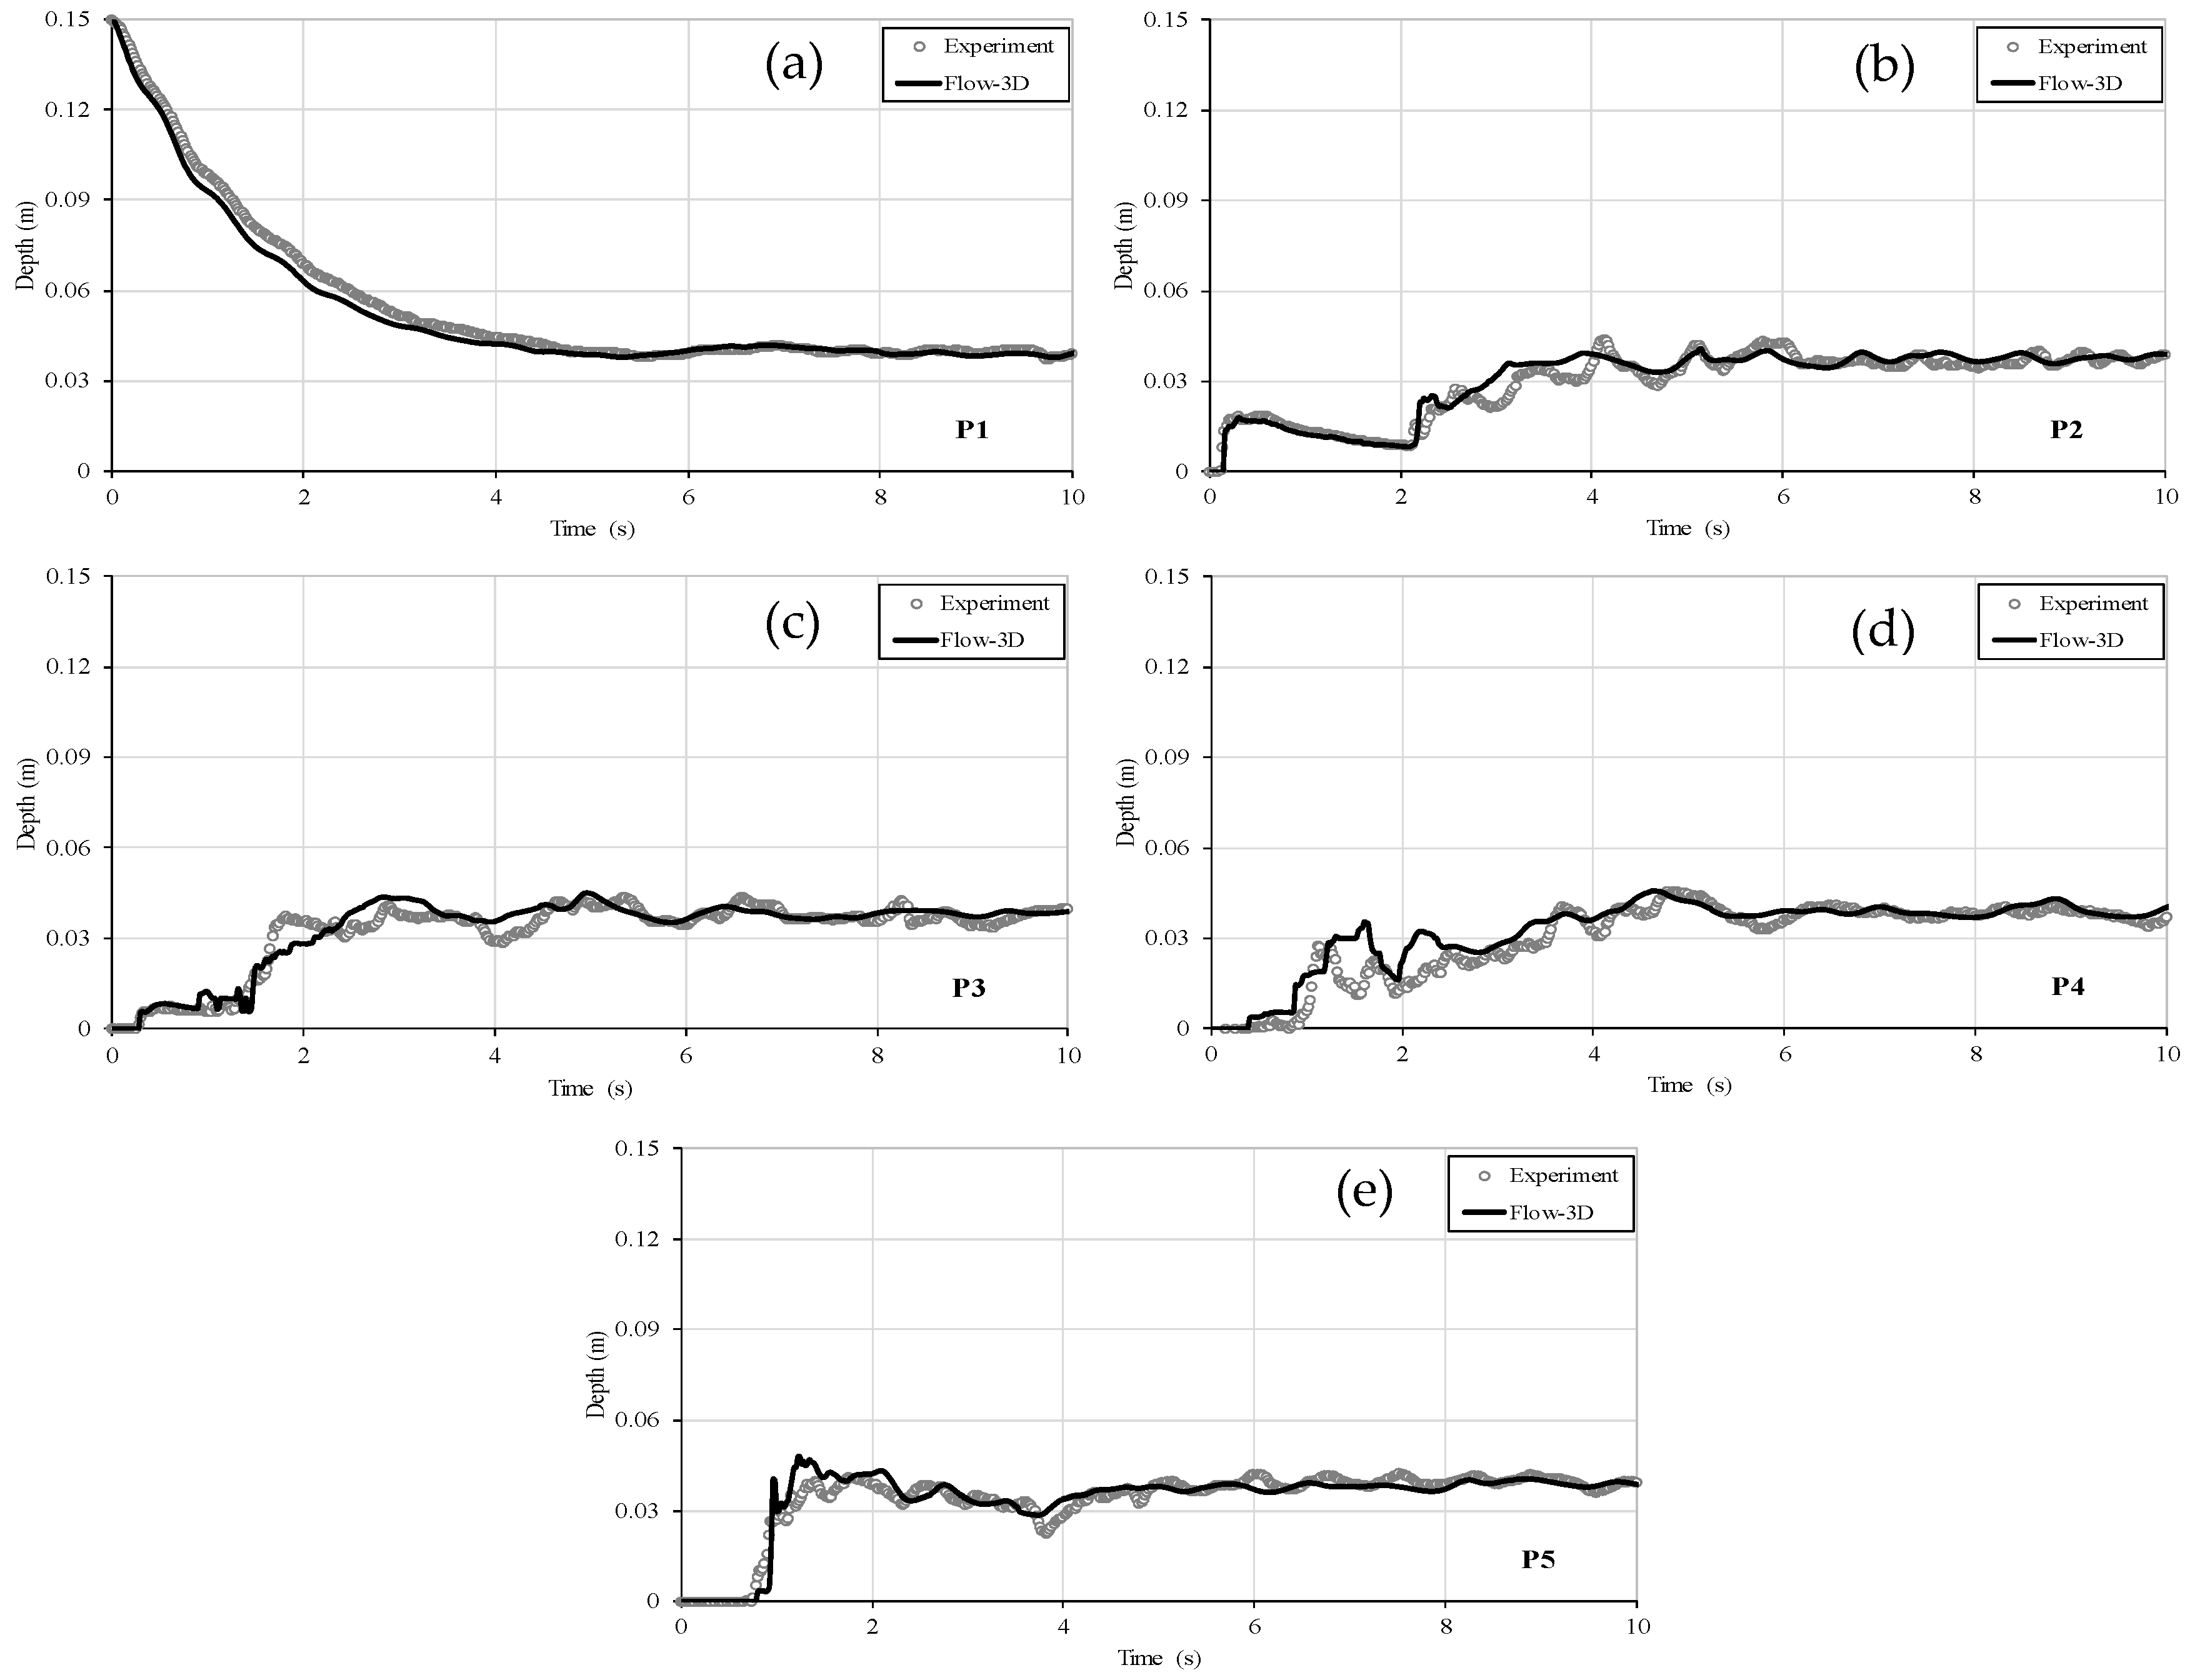
The observed phenomenon is quite complex, involving multiple wave interactions, which can be tackled, however, with 3D numerical methods. In the present study, an RANS scheme was run in FLOW-3D to reproduce the unsteady flow pattern. Acquired water level changes by means of five ultrasonic sensors 10 s after the gate removal are given in
Figure 4. As shown in
Figure 2, the P1 sensor was located in the reservoir to follow its emptying, and the others (P2–P5) were placed around the obstacle. The comparison of the results showed good agreement overall. For P1, the water level progressively decreased as the reservoir empties until
t = 6 s and remained nearly horizontal after
t = 6 s due to the limited reservoir capacity. Small oscillations occurred on the water surface in the reservoir, due to the reach and reflection of the negative wave from the channel upstream end and sidewalls. It is also noticeable that the numerical water level results were somewhat below the experimental level results during the descent in the reservoir. The water level increased rapidly with the arrival of the flood wave at the P3 sensor located upstream of the object. Then, the water level started to decrease slowly due to the decrease in water in the reservoir until
t = 2 s. The water level increased again as soon as the wave reflected from the upstream end of the canal arrives. With the arrival of the reflected wave at other measurement points (P2–P5) downstream of the gate, increasing water level, and undulations on the water surface were noticeable.
In the numerical simulations, the undulations occurring on the water surface are slightly fewer compared to the experimental study. In addition, considering the time taken to reach the measurement points of the incoming wave and the time that the reflected wave passes through these points again, it can be said that the numerical method determines the propagation speed of the wave front well. The main difference between experimental and numerical results was observed immediately after the arrival of the reflected wave. This negative wave also can be considered as a moving hydraulic jump and the flow is truly three-dimensional with air entrainment. The reason for this difference may be that air interference is not taken into account in the numerical model. As a result, FLOW-3D could simulate with reasonable accuracy the behavior of the flow at the initial and further stages of a dam-break event in the presence of an obstacle.
A similar flow behavior was generally observed when the results are compared with the results of [
14]. However, the study of [
14] was carried out in a large-scale prismatic channel with a trapezoidal cross-section with an open downstream end. Resistive gauges were used in that study, which are intrusive and can alter the flow behavior. The present study was conducted, instead, in a small-scale rectangular channel in an enclosed domain and used ultrasonic sensors enabling the non-intrusive measurement of the flow. In this study, a more complicated small-scale current environment was created, with the closed end wall, and good data were obtained to validate numerical studies.
In the study by Soares-Frazão and Zech [
14], the water depth increased significantly in the close region upstream to the obstacle due to the reflection of the flood wave from the longer face (in plan-view) of the rectangular obstacle facing the dam. In the current study, since the obstacle has orientation with the 90-degree sharp corner facing the incoming dam-break wave in plain view, i.e., one of its diagonals overlapping the streamwise flow direction, the reflection of the flow and rise in water level were more limited instead, after the wave impacts the obstacle. When the obstacle is placed at a right angle in relation to the main flow direction, the water level swelling in front of the obstacle is more pronounced.
It is noticeable that (non-intrusive) ultrasonic sensor results have less signal interference compared to (intrusive) wave resistive gage results in [
14]. Comparing the two measurement methods will be useful in future studies.
5. Conclusions
The presence of a single object of prismatic shape, interacting with an upcoming dam-break wave in a rectangular channel, was assessed. Laboratory experiments were carried out, placing the object at the center of the channel. When the flood wave hits the obstacle, the route of the flood wave is changed, the depth of the water increases and a complex flow medium occurs that includes hydraulic jumps moving in different directions due to the obstacle and side walls. Flow pattern was inherently three-dimensional with a complex shape of the free surface near the object. The acquired experimental measurements of water levels taken with five ultrasonic sensors were compared with an RANS-based FLOW-3D numerical simulation software, with a k-ε turbulence model for closure. A good agreement between experimental and computed results was found. The results indicated that FLOW-3D can be a useful tool in simulating dam-break kinds of flow phenomena.
The ultrasonic sensors have also been shown to be used effectively in measuring water levels for rapidly varied unsteady flow such as dam-break.
Due to the limitations of computing power for the detailed solution of large-scale dam-break problems using RANS-based CFD models or particle-based numerical models, like Smoothed Particle Hydrodynamics (SPH) and Lattice Boltzmann (LB), these new experimental data can be used as a case study for model validation.
The obstacle located at different orientation angles with respect to the main flow direction and different tailwater levels and the combination of multiple obstacle configurations can be considered in a future study.


