

Geometry-Based Deep Learning in the Natural Sciences


Department of Biological Sciences, University of South Carolina, Columbia, SC 29208, USA
†
Retired.
Encyclopedia 2023, 3(3), 781-794; https://doi.org/10.3390/encyclopedia3030056
Submission received: 11 May 2023
/
Revised: 25 May 2023
/
Accepted: 19 June 2023
/
Published: 21 June 2023
(This article belongs to the Section Mathematics & Computer Science)
Definition
:Nature is composed of elements at various spatial scales, ranging from the atomic to the astronomical level. In general, human sensory experience is limited to the mid-range of these spatial scales, in that the scales which represent the world of the very small or very large are generally apart from our sensory experiences. Furthermore, the complexities of Nature and its underlying elements are not tractable nor easily recognized by the traditional forms of human reasoning. Instead, the natural and mathematical sciences have emerged to model the complexities of Nature, leading to knowledge of the physical world. This level of predictiveness far exceeds any mere visual representations as naively formed in the Mind. In particular, geometry has served an outsized role in the mathematical representations of Nature, such as in the explanation of the movement of planets across the night sky. Geometry not only provides a framework for knowledge of the myriad of natural processes, but also as a mechanism for the theoretical understanding of those natural processes not yet observed, leading to visualization, abstraction, and models with insight and explanatory power. Without these tools, human experience would be limited to sensory feedback, which reflects a very small fraction of the properties of objects that exist in the natural world. As a consequence, as taught during the times of antiquity, geometry is essential for forming knowledge and differentiating opinion from true belief. It not only provides a framework for understanding astronomy, classical mechanics, and relativistic physics, but also the morphological evolution of living organisms, along with the complexities of the cognitive systems. Geometry also has a role in the information sciences, where it has explanatory power in visualizing the flow, structure, and organization of information in a system. This role further impacts the explanations of the internals of deep learning systems as developed in the fields of computer science and engineering.
1. Background
1.1. Historical Perspective on Geometry
A modern view of the physical world, and likewise in the study of the natural sciences, is dependent on models. The ideal model is written in the precise and reliable language and symbols of mathematics, a practice that allows for theoretical study and generalizing of the physical processes of Nature. This is a predictive capability that leads to knowledge of the physical world that is outside human perceptual experience. The potentiality of mathematics was explored by the philosophers of antiquity, such as Pythagoras and the Pythagoreans in ancient Greece [1]. At this time, arithmetics and geometry were taught as foundational to subsequent instruction in astronomy and music [2]. The strength of this approach was fully realized in Ptolemy’s Almagest, a literary work on the mathematical foundations for explaining the observations and motion of planets across the night sky [3]. His work depended on instruments and precise measurement. This practice led to astronomical charts that are capable of predicting a planet’s position in the night sky. Ptolemy further applied these models as a guide so others could construct a device that corresponds to the design of today’s planetariums [3].
Improvements in mathematics and instrumentation led to the early 17th century works of Galileo and his contributions to knowledge of the physical world, such as the geometry of motion, along with convincing evidence (Galileo, 1610) against the geocentric model, and in favor of the heliocentric model (Copernicus, 1543) of planetary motion [4,5].
By the end of the 17th century, Isaac Newton established classical mechanics by application of mathematical theory and empirical observation [6]. These mathematical models led to a newfound explanatory power on the behavior of objects as observed in the physical world. As observations improved over the subsequent centuries, mathematics and its symbols continued to develop and a language emerged for explanation of the physical processes outside our sensory experience, such as the world of the very large, as with the force of gravity as exerted on an astronomical-sized object, and the world of the very small, such as the atomic forces among the elemental forms of matter [7]. Many of these innovations were based on geometry as an abstract construction of the spatial context of the physical forces of Nature. These geometrical models were first based on three-dimensional space as defined by Euclid [8]: a space with zero curvature. By the 20th century, the physical world was becoming explained by models no longer constrained by zero curvature, such as Hermann Minkowski’s model for a physical world where three-dimensional space and one-dimensional time were combined into a system with a single four-dimensional space–time [9].
1.2. The Explanatory Power of Geometry
These examples show that geometrical objects are descriptive of the properties and processes of Nature. They can also abstractly represent the flow of information, a kind of mechanical process. Geometry is a visual language with reliance on symbols for expression of conceptual knowledge. Therefore, the indescribable processes of Nature can now be visualized as objects of the Mind. This is not just a language as a sequence of symbols, but instead a visual description with the permanence and reliability of a mathematical language. Humans are limited in their capability in the perception of the physical world [10]. For example, the Mind is not capable of forming a visualization of spacetime dynamics as it truly exists in the physical world, but instead as a geometrical model—a mathematical representation that is in a conceptualizable format [11].
The spaces and manifolds of geometry are therefore observable in the Mind and as hypotheses unbounded by our limited conception of reality. This conception is limited by the range of the senses, a phenomenon that is essentially a product of the reflection of objects of the natural world, but not the objects in and of themselves [10,11]. In the case of “seeing” an object, such as a table or a chair, the object is not observed directly, but instead as a reflection of light that is received by an array of molecular sensors in the inner surface of the eye [10]. An outsized portion of the brain is dedicated to processing this information and constructing the percepts, leading to inaccuracies; but, moreover, these visualizations are constrained to a very narrow range of all possible forms of light, hence the reference to this spectrum as the range of “visible light”. Further, this limitation in perception is not a product of chance, but of necessity, as it overlaps with the light spectrum as emitted from the Sun and received at the surface of the Earth.
Geometrical description extends beyond the common objects of the physical world, to use in explanations on the flow of information, a phenomenon also dependent on physical processes [12]. An example is a graph-based description of information that flows between an interconnected system of computing devices. This graph is idealized as a fully connected network [13] (Figure 1). This representation of information and its flow further applies to the artificial neural networks (ANNs) of computer science, a graph consisting of nodes and connections [14]. While pseudocode may be used to describe an ANN, it is not a basis to form generalizations about them. However, the mathematical representations of ANNs, particularly those of geometry, lead to a model-based framework that is adapted for interpretability. Geometrical representations further provide a visualization on the properties of an idealized network, such as observed in a sparsely connected network [15].
In the literature of deep learning, the neural network layers are often presented in a visual format with the flow of information from module to module [16]. This is a similar practice to that which emerged in ecology and study of the large-scale ecological processes, a visualization of processes based on thermodynamics, leading to a paradigmatic shift, ranging from approaches to measuring the influence of microorganisms within an ecosystem to the study of the biogeochemical processes across the biosphere of the Earth [18].
Recent advances in deep learning include that of development of large language models as based on a transformer architecture [16,19]. Central to this architecture is an attention module, a variant of the attention mechanism for use in ANNs [20]. An insightful description of this module is shown as a series of modules [19], beginning from input to a module where the input is representable by a fully connected graph (Figure 1). Each connection of the graph is of equal weight. The transformer subsequently prunes edges that leads to a sparsely connected graph. Pure mathematics is also replete with examples of similar visual explanations of concepts, particularly in the foundational area of linear algebra and high-dimensional computation.
2. Geometrical Explanations of Adaptive Immunity
2.1. Overview
Investigation across the biological sciences is informed by geometry and its representations of natural phenomena. The common examples are in the morphologies of living organisms, where their shape and design may conform to an algorithm as expressed by a mathematical expression. An example is in a clade of invertebrate animals, the mollusks, where the outer surface of their shells form logarithmic spirals, an adaptation for rigidity and strength [21]. At the cellular and molecular levels, the interactions among genes or biomolecules are typically modeled as a network of interactions [22,23]. However, this is often approached as a technique of categorization dependent on measuring associations, while the dynamics of the system are a confounding factor, including in a spatial and temporal context. A dynamic level analysis depends on knowledge from both biology and mathematics, but too often the emphasis is on biology at the molecular level, while the subsequent quantitative analyses and mathematics are relegated to subservient roles, along with rote use of tools [24]. However, the assumptions that quantitative analyses are built upon are important for developing a robust perspective on how to first collect and subsequently process biological data [25]. This introduces mathematical and statistical rigor as an alternative to explanations founded on persuasive speech.
2.2. The Geometry of Molecular Interactions
Molecular immunology is a specific area of study where geometrical thinking has a role. The molecular interactions of the immune system are expected to have a spatial component, such as molecular-level detection of a foreign peptide by jawed vertebrate animals [26,27,28,29]. In this case, the goal is to find a pathogenic infection in the host, regardless of whether the source is a cellular or viral organism. The detection mechanism involves atomic interactions across three-dimensional space; so, in this case, there exists a connection to a geometrical perspective [26,29]. The deep learning methods are capable of modeling these molecular shapes, but are not yet capable of modeling the complex dynamics of these molecules, such as formation of a large complex of molecules, or of molecular motion [30,31].
However, geometrical thinking can extend beyond the forms of life and the molecular interactions of the biological cell. In the case of a higher-scale perspective of biological phenomena, such as in the mechanisms of adaptive immunity [26], there emerge questions about molecular- and population-level processes. Immune cell recognition of peptides is both a cellular- and a population-level phenomenon [32,33]. An immune cell that has a particular role of peptide recognition is encoded with a number of specific receptor proteins along its surface [34]. Typically, each of these cells is specific in its molecular-level recognition of a peptide, or, more precisely, a peptide as bound with another host molecule that facilitates the recognition process [35]. It is also known that recognition of a foreign peptide is a probabilistic event, including in the detection of the peptide and the minimal number of molecular interactions to elicit an immune response [36]. Therefore, instead of the dogma that an immune cell detects a foreign molecule that subsequently leads to an immune response, the idealized perspective is that immunity is a population process at the cellular level that is reliant on mathematical description and a population of cells for eliciting the immune response [29,36].
Further, this process may be represented in an abstract format and visualized as a pathway of immune cell recognition (Figure 2). An example is in the T-cell population, an immune cell involved in peptide recognition [32]. This population has a very large capacity for the generation of diversity in cell surface receptors with a role in peptide recognition [37]. This variation at the molecular level is proximately caused by mechanisms of somatic recombination that occur at the genetic level [29,34].
The T-cell’s receptor mechanism for recognition of peptides is a form of geometrical problem. As the biological perspective of protein structure emerges from three-dimensional analysis of atomic interactions, the mechanism of immune cell recognition is also a phenomenon that occurs in three-dimensional space and is reducible to geometrical abstraction [39,40,41,42,43,44]. Therefore, the interface between molecular surfaces can be represented as an abstraction that has explanatory power as a model (Figure 3). This leads to a large reduction in the complexity of the system and a greater tractability for building generalized models, and leads to mathematical rigor in quantifying the host–pathogen interactions at the molecular level. The alternative approach is to rely on phenomenological approaches that have the appearance of modern science, but lack the power and insight of the best practices for scientific validation [24].
In deep learning, there are models that reflect scientific rigor in capturing the three-dimensional structure and atomic interactions of molecules [31,42,43,44]. They rely on the geometrical representations as formed in the model, but not in a traditional fashion. There are at least two paths of future investigation of this area. One is for increased interpretability in the deep learning models, so that the atomic-level representations as stored in the neural network are disentangled for knowledge on how the model is constructed. Another approach is to discard traditional thinking and instead rely on deep learning for recognition of natural phenomena [19,45,46]. Galactica, a deep learning model for the natural sciences, is an example of a tool to increase efficiency in scientific investigation.
2.3. Deep Learning and Geometrical Modeling
Hu and Buehler [19] describe the capability of deep learning for summarization of unformatted scientific information: “It has been demonstrated that natural language processing could not only efficiently encode materials science knowledge present in the published literature, but also map the unstructured raw text onto structured database entries that allow for programmatic querying—with Matscholar as an example.”
Therefore, the unstructured knowledge across the literature of natural science, including an assortment of methodologies, is potentially tractable for summarization and organization by a deep learning model. The alternative approach is to construct systematic review articles in the areas of interest, but, even in this case, it would require a breadth of knowledge outside the scope of many practitioners of a research area, a limitation as research areas are generally isolated in silos [47]. Another advantage of the deep learning models is a higher resistance to dogmatic thinking [11,48], as per a quote from Opik [48]: “…dogmatism may sometimes induce its followers to misquotation or misrepresentation of the most undisputable facts”. Deep learning models further complement scientific practices in the synthesizing of scientific findings and serve as a tool absent of rhetoric and bias (akin to why statistical methods are often required in published work) [49].
Ideally, there is a hypothesis, a procedure, and lastly a test to evaluate whether the results of a methodology are reliable [50]. Further, these tests are expected to withstand the scrutiny of statistical-based verification. Deep learning, as employed in the Galactica model [45], provides a method for rapid assimilation and summarization of past scientific findings, including the potential for interpretation of published figures and tables, a complement to the other methods in the pursuit of knowledge and a higher efficiency in scientific progress.
Trained on the corpus of science, the Galactica class of models can incorporate data on the three-dimensional structures of proteins [31,51] and other sources of molecular interaction data. This not only allows for models to represent the geometrical arrangement of molecular interactions, but also to connect them with a natural language interpretation [52]. Together, these models replace rote lookup of information across the literature and in scientific databases, including a capability for organizing data from that which is unstructured [19,45]. This database functionality that emerges from these models is akin to using a calculator or spreadsheet in the automation of calculations. The ability to provide human-readable interpretation from the database is a less reliable function, but model prompting practices are a current topic that can improve the generation of output from the deep learning approach [53,54].
These models have application in the practices of immunology. The current perspective is largely based on a reductionist program that relies on molecular-level observation [55]. This is similar to that of traditional ecology, which was mainly based on the observation of organisms and their roles in the environment. As the discipline of ecology transformed from the interpretation of results with natural language and opinion to a scientific rigor based on statistical thinking, ecological practices emerged to explain the complex processes of ecological systems [18]. This scientific revolution has not necessarily transferred to new practices in the other areas of natural science, particularly where empirical sampling is central to scientific discovery, although there are efforts in these research areas to incorporate systems-level thinking.
Immunology is composed of systems, like in the ecological sciences, that involve many interactions between sets of elements. It is likewise adapted to a systems-level approach that models the molecules as elements in a network framework. An example is in the abstract representations of immune cell receptor diversity, particularly the cellular receptors that directly interface with pathogenic molecules [56]. This suggestion would elevate a literature steeped in classification schema as a kind of shorthand for potentially efficient communication, but lacking in the rigors of pure logic. This is largely a problem of biological systems with the properties of high complexity and low tractability, but with the use of deep learning models and “big data”, there is the potential for better tractability and feature discovery in complex systems [19].
The deep learning models are dependent on “big data” for constructing the higher-order representations as stored in the neural network. If there is a very large data set of cell receptor diversity at the molecular level, as generated by the mechanisms of adaptive immunity, then the model can learn the higher-order features as shared among these cellular receptors (Figure 3) [42,43,44]. This corresponds to a higher-order language because the primary protein sequence is a code for the three-dimensional protein structure of these receptors. The model can learn this language, as shown by AlphaFold [31], along with other approaches employed across the natural sciences [19]. Essentially, these models capture the geometrical representations at the molecular surfaces, and, therefore, are applicable to the study of immune cell detection of intracellular pathogens [29,42,43,44]. These representations are the salient features of the molecules that describe the interactions between host and pathogen. Furthermore, there is a mechanism in the jawed vertebrate host for memorizing the immunological interfaces of interest, leading to a stronger response to subsequent pathogenic challenges.
2.4. Perspectives on Deep Learning
Since deep learning models can learn the salient features of the geometry in the molecules of immunity, and that of the corresponding pathogen response at the genetic level, these very large sequence models are expected to store the higher-order representations and form broader predictions on molecular immunity [57]. For example, Lutz et al. [57] constructed a model based on reinforcement learning and tree searching for specifying a generation of “complex protein architectures”. This methodology is akin to DeepMind’s research methods for creating a model that can solve complex board games [58]. Therefore, this methodology [57] is suitable for connecting scientific description in the form of a natural language with the higher-order molecular structures of Nature and their corresponding geometrical representations.
Overall, the deep learning models with scientific applications are constructing population-level knowledge that extends beyond the scope of traditional data sampling and analysis. Likewise, this practice is also dependent on the theory that Nature and matter have organization and structure at the elemental level [59]. Traditionally, the parameter count of these models has ranged from a small number of unspecified parameters to perhaps dozens of parameters, but conventional methods are not necessarily scalable [60]. In comparison, the deep learning models currently extend from billions to hundreds of billions in parameter count. The latter are dependent on “big data”, but as described above, there are techniques for supplementing the corpus of empirical knowledge, bootstrapping that knowledge with theory or other practices, and then building a model with the requisite data samples for achieving a greater level of robustness and predictability.
3. Modeling the Molecular Surfaces of Immunity
The previous section presented an idealized perspective of a host–pathogen interaction at the molecular level. The example was in the adaptive immune system and depends on external knowledge of the three-dimensional structure of molecules that participate in pathogen recognition. However, there is another approach to modeling these molecular interactions of immunity.
In the case of a pathogenic virus and vertebrate host interaction, it is possible to create a predictive model of the molecular interactions of the adaptive immune system. The requirement is the protein sequence data of the virus, including a large sample of the viral variants, along with data on ecological contexts, such as geographical area and sampling date. This kind of sampling procedure has been reported in the case of SARS-CoV-2 [61]. A few viral variants are frequent, while many variants are rare (Figure 4). There is also data on which variants are leading to higher rates of infection and transmissibility. This information is reflective of the viral phenotypes, since it associates the protein sequence (the genotype) with the pathogenicity (the phenotype). Therefore, a deep learning model [16] is potentially capable of learning the genotypic changes in a virus that leads to a pathogenic phenotype. It would also learn which changes do not alter this phenotype.
Further, the model would have the potential for predicting future viral variants and which of these genotypes are expected to escape from host immune detection. This is expected, since the data contain this information from prior sampling. The assumption of this method is that the molecular shapes (a geometrical representation) that participate in the interactions in immunity have molecular-level signatures that are commonly observed in data samples (Figure 3 and Figure 5). In other words, there is predictability in the kinds of protein shapes and properties encountered by the mechanisms of host detection of pathogenic molecules. Moreover, there is a relatively restrictive limit on the number of three-dimensional features of proteins: that there is an empirically based expectation that the total number of protein folds is in the thousands (103) [62]. Therefore, the assumption is expected to hold that the molecular shapes involved in the mechanisms of immunity share three-dimensional features and are generalizable for use in predictive models.
It is also probable that any generalizations on the three-dimensional features of the molecules of immunity are transferrable for application in other virus–host interactions. In this case, the molecular causes of immune escape could be captured as geometrical representations in the deep learning model. This is expected to lead to the capability of a generative model of predicting the viral variants that are capable of escaping from the full effects of a host’s immune response. Although this model will have a level of uncertainty, it is possible to verify the generative model against a relevant viral population that is not yet sampled by the model. This is a simpler and more efficient method than dependence on external knowledge of protein structure, but it is dependent on at least an assumption about the distribution of protein shapes, the effects of protein mutability on adaptive immunity, and robust population-level sampling of protein sequences, along with annotation of ecological information.
At any given point in the evolutionary time of a virus, the viral variant data would have the frequency distribution of viral variants of a viral type (Figure 4 and Figure 6). With another time point in another geographical area, then it is possible to identify which viral variants successfully increase in frequency and migrate, and, therefore, determine the viral protein sequences which facilitate the escape from the mechanisms of host immunity. There are other causes that may lead to falsely asserting this hypothesis of immune escape, such as a small population size of a viral variant, which leads to an increase in its numbers by a process of genetic drift—instead of from the mechanisms of natural selection as the cause of escape from host immunity.
This method is dependent on biological sequence data sampling and their ecological context. This is an approach adapted to deep learning, but without the error associated with an explicit model of protein structure and expectation about the effects of mutation in proteins involved in the host–virus interaction. Further, the approach allows for modeling migration across the viral population and generation of genotypes. Lastly, since the host surveils for evidence of peptides in general, it is probable that data outside that of a viral population of interest are informative and capable of capturing the model of genetic change in a virus that leads to resistance to host immunity.
4. Modeling the Molecular Surface of Proteins
A protein of a biological cell may be described as a three-dimensional arrangement of atoms. Since proteins are central to cellular function in organisms, they frequently interact with other molecules, including other proteins. These interactions, along with the protein shape, depend on low-energy atomic forces across the protein molecule, including hydrophobic [63,64], electrostatic [65], van der Waals, and the interactions with the surrounding molecules of the solvent [66]. In addition, proteins often have a surface region, or regions, across their three-dimensional structure which is inaccessible to solvent molecules and may act as a participant in the binding of other molecules. This is a reference to the molecular surface [66,67]. The shape of the surface may be further classified by a descriptive set of geometrical and chemical characteristics [68].
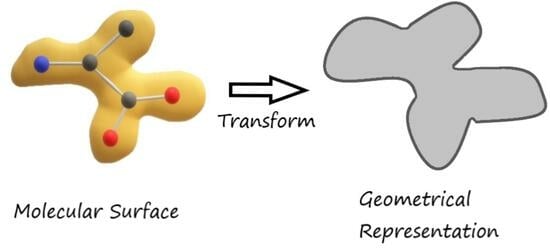
Gainza et al. developed a model of the molecular surface which corresponds to an abstract geometrical object; a mesh composed of vertices, edges, and faces [68]. Therefore, this geometrical object is made up of discrete elements that correspond to the continuous molecular surface [69]. Moreover, the model includes the geometrical and chemical characteristics as mapped along the vertices of the mesh, but this model is not reliant on explicit knowledge of the amino acid sequence nor the folding patterns of the protein. This data is transformed so that it is represented as a one-dimensional array for input to a geometric-based deep learning method. This method can train on and learn the geometrical and chemical characteristics that occur along the molecular surface [68]. The model is dependent on “big data” sampling, since traditional approaches on modeling the molecular surface of proteins is not a tractable problem [70]. Lastly, this model showed improvement over prior approaches for predicting the interactions of sites along the surface [68,71].
Gainza et al. expanded on their original methodology, incorporating “big data” of structures of protein motifs, along with the capability of generating molecular surfaces and their features [70]. This approach to predictive modeling of the molecular surface, its putative sites of interactions, and the interaction with a surface of another molecule were validated with experiments. Therefore, the authors concluded that their method “captures the physical and chemical determinants of molecular recognition” in proteins [70].
The original method by Gainza et al. [68] was extended by Sverrisson et al. [72,73], so that the model of the molecular surface is no longer dependent on construction of a geometric mesh nor the explicit identification of its chemical and geometrical characteristics. Instead, it relies on data of the atomic coordinates of the molecule in three-dimensional space along with the chemical types of the atoms. This approach requires fewer manual preprocessing steps, is highly efficient in computation, and “can compute chemical properties of the protein surface from the underlying atomic point cloud”. They further reported [72] an improvement over the original method [68] in the quality of modeling the molecular surface and the putative sites of binding to another molecule. While these methods demonstrate a capability of modeling the molecular surface, this is an ongoing area of improvement and study of the parameters that contribute to molecular dynamics [69,70,74].
5. Geometrical Explanations of Cognition
A geometrical perspective is applicable to many areas of natural science, but perhaps none as apparent as in the brain and its neural network. Kriegeskorte and Kievit [75] review and present a perspective on geometrical representations in the brain, particularly an idea that applies to the encoding of information in populations of neurons and the patterns imprinted on data as derived from experimentation. These concepts are further extended by deep learning, including insight on the quantification and dynamics of the geometrical shapes as formed and processed by the putative cognitive pathways [76].
There are other studies that utilize deep learning as an experimental toolbox in the study of cognition [77,78,79]. The underlying premise is that both animal cognition and artificial neural networks are based on informational processes that emerge from the physical causes in Nature. Therefore, the relevant findings are expected to converge on the expectations of information theory [80]. For example, internal cognition is expected to be coded for high efficiency and retrieval in any neural network [80]. Moreover, the neural network is definable as a communication system [81], so that by scaling in size it is capable of high complexity in the processing of information, resembling a form of computation. The neural network is also a geometrical object, and the parts of the network, the subnetworks and modules, are representable by geometrical shapes. Likewise, the information encoded and stored in the neural network is also representable by geometry [75,76,81]. These geometrical representations are imprinted with the properties and directions of information flow that occur across the neural network. This is the putative level of study for this phenomenon.
The study of neuronal biology to discover the encoding process of visual objects in the brain is a lower-level molecular phenomenon; one that is not nearly as tractable as an informational approach. It is akin to the inefficiency of studying an artificial neural network by disentangling the mechanical operation of the computational devices that process the vector calculations—leading to a model of exceedingly high computational complexity.
6. Abstractive Models of Complex Systems
In general, a model is a parameterization of data which leads to its applicability in its use for prediction, such as in Newton’s model of gravitation. Areas of study may refer to these concepts by other names, such as in deep learning, where prediction is often referred to as a generation of tokens. In deep learning, there is also a dependence on “big data”, since the typical parameter size of the model is very large. If the data sample size is insufficient for constructing a robust model, then the model is considered underparameterized and is expected to lack in its predictiveness. It is also possible to overspecify the number of parameters, which leads to overparameterization of the model. Overparameterization is expected to lead to overfitting of data to a model and a lack of generalizability.
In the context of natural science, a predictive model is specified to create explanations of natural phenomena. However, a model may be constructed to explain other kinds of phenomena, such as the movement of binary data across a communication network. Both these models may depend on mathematical expression, while the prior data values are a form of information. Therefore, the complex systems of Nature and those designed by engineers are kinds of informational systems. The models of these complex systems may have a geometrical component, so mathematical theory is available to study these systems and derive a set of basic principles for the behavior of these models.
The relevant branch of mathematics is information geometry which “leads to the interpretation of a model as a manifold embedded in the space of data” [82,83]. This approach leverages the methods of information theory and differential geometry for the tractable interpretation of data and models of high dimensionality, such as in the complex systems of molecular biology and genetics [83]. This perspective has led to the insight that models are typically overparameterized; an inefficiency in their design, but which nevertheless leads to a high level of predictiveness by the unintended consequence of “interpolating from the existing data” [83]. This is an insight which suggests further optimization of a model for improvement in its parameterization. These insights by use of information geometry show the power of a geometrical perspective in visualizing and conceptualizing models.
The deep learning models have sometimes analyzed the problems of parameterization using an empirical approach, although these models, particularly the large language models, have often been highly overparameterized [84]. The other problem is the limited availability of large data sets outside of biology and chemistry. For example, the material sciences are contrasted with chemistry in that “while a large variety of datasets and tasks exist for chemistry, there are only a few large datasets for materials—limited to crystalline structures” [74]. However, where “big data” are available, then it is possible to model complex systems of low tractability, such as in the prediction of the folding patterns of cellular proteins [31].
Therefore, the deep learning perspective is juxtaposed with traditional modeling of natural phenomena. In the case of deep learning, the parameters are the weights along the edges of the neural network, so the parameters that are proximate to the model do not map to the phenomenon itself, such as in a physical process. The true parameters of the model are instead entangled among the many weights of the neural network.
7. Conclusions
The human experience as a visual perception of the physical world occurs in a three-dimensional context with an aspect of time. Geometry is a formal language for representing these higher-order phenomena, whether the folding of proteins in a spatial context or the dynamics of information flow for the coding of a percept. This kind of thinking has led to models for explaining the cognitive processes and constructing the higher-order structures of molecules. Many of these molecular surfaces, a type of geometrical manifold, are not very tractable to the reductionist approach of traditional statistics. The deep learning methods have led to models of complex systems and scientific discovery, both in modeling the phenomena of Nature and in connecting models with natural language and human readable interpretation. There is an ongoing expansion of knowledge in designing and testing these generative and deep learning models across the natural sciences. Likewise, it is expected that this approach will be revolutionary for the practice of science and the acceleration of scientific discovery.
Funding
This research received no external funding.
Institutional Review Board Statement
Not applicable.
Informed Consent Statement
Not applicable.
Data Availability Statement
Not applicable.
Conflicts of Interest
The author declares no conflict of interest.
References
- The Stanford Encyclopedia of Philosophy; Stanford University: Stanford, CA, USA, 2019; Available online: https://plato.stanford.edu/entries/pythagoreanism (accessed on 25 April 2023).
- Proust, D. The Harmony of the Spheres from Pythagoras to Voyager. Proc. Int. Astron. Union 2009, 5, 358–367. [Google Scholar] [CrossRef] [Green Version]
- Murschel, A. The Structure and Function of Ptolemy’s Physical Hypotheses of Planetary Motion. J. Hist. Astron. 1995, 26, 33–61. [Google Scholar] [CrossRef]
- Van Helden, A. Galileo, telescopic astronomy, and the Copernican system. In Planetary Astronomy from the Renaissance to the Rise of Astrophysics; Taton, R., Wilson, C., Eds.; Cambridge University Press: Cambridge, UK, 1989. [Google Scholar]
- Settle, T.B. An Experiment in the History of Science: With a simple but ingenious device Galileo could obtain relatively precise time measurements. Science 1961, 133, 19–23. [Google Scholar] [CrossRef]
- Truesdell, C. History of Classical Mechanics (Part I). Naturwissenschaften 1976, 63, 53–62. [Google Scholar] [CrossRef]
- Kleppner, D. A short history of atomic physics in the twentieth century. Rev. Mod. Phys. 1999, 71, S78. [Google Scholar] [CrossRef]
- Hartshorne, R. Geometry: Euclid and Beyond; Springer Science & Business Media: New York, NY, USA, 2013. [Google Scholar]
- Arthur, R.T. Minkowski Spacetime and the Dimensions of the Present. Philos. Found. Phys. 2006, 1, 129–155. [Google Scholar]
- Friedman, R. Themes of advanced information processing in the primate brain. AIMS Neurosci. 2020, 7, 373. [Google Scholar] [CrossRef] [PubMed]
- Waddell, W.W. The Parmenides of Plato; James Maclehose and Sons: Glasgow, UK, 1894. [Google Scholar]
- Barrett, T.W. Conservation of information. Acta Acust. United Acust. 1972, 27, 44–47. [Google Scholar]
- Friedman, R. Detecting Square Grid Structure in an Animal Neuronal Network. NeuroSci 2022, 3, 91–103. [Google Scholar] [CrossRef]
- Linial, N.; London, E.; Rabinovich, Y. The geometry of graphs and some of its algorithmic applications. Combinatorica 1995, 15, 215–245. [Google Scholar] [CrossRef]
- Goswami, S.; Murthy, C.A.; Das, A.K. Sparsity measure of a network graph: Gini index. Inf. Sci. 2018, 462, 16–39. [Google Scholar] [CrossRef] [Green Version]
- Vaswani, A.; Shazeer, N.; Parmar, N.; Uszkoreit, J.; Jones, L.; Gomez, A.N.; Kaiser, L.; Polosukhin, I. Attention is all you need. In Proceedings of the 31st Conference on Neural Information Processing System, Long Beach, CA, USA, 4–9 December 2017; pp. 5998–6008. [Google Scholar]
- Chen, L.; Lu, K.; Rajeswaran, A.; Lee, K.; Grover, A.; Laskin, M.; Abbeel, P.; Srinivas, A.; Mordatch, I. Decision Transformer: Reinforcement Learning via Sequence Modeling. Adv. Neural Inf. Process. Syst. 2021, 34, 15084–15097. [Google Scholar]
- Odum, E.P. Energy flow in ecosystems—A historical review. Am. Zool. 1968, 8, 11–18. [Google Scholar] [CrossRef]
- Hu, Y.; Buehler, M.J. Deep language models for interpretative and predictive materials science. APL Mach. Learn. 2023, 1, 010901. [Google Scholar] [CrossRef]
- Schmidhuber, J. Learning to Control Fast-Weight Memories: An Alternative to Dynamic Recurrent Networks. Neural Comput. 1992, 4, 131–139. [Google Scholar] [CrossRef]
- Omotehinwa, T.O.; Ramon, S.O. Fibonacci Numbers and Golden Ratio in Mathematics and Science. Int. J. Comput. Inf. Technol. 2013, 2, 630–638. [Google Scholar]
- Kelley, R.; Ideker, T. Systematic interpretation of genetic interactions using protein networks. Nat. Biotechnol. 2005, 23, 561–566. [Google Scholar] [CrossRef] [Green Version]
- Boone, C.; Bussey, H.; Andrews, B.J. Exploring genetic interactions and networks with yeast. Nat. Rev. Genet. 2007, 8, 437–449. [Google Scholar] [CrossRef] [PubMed]
- Peng, R. The reproducibility crisis in science: A statistical counterattack. Significance 2015, 12, 30–32. [Google Scholar] [CrossRef] [Green Version]
- Gardenier, J.; Resnik, D. The Misuse of Statistics: Concepts, Tools, and a Research Agenda. Account. Res. Policies Qual. Assur. 2002, 9, 65–74. [Google Scholar] [CrossRef]
- Davis, M.M.; Bjorkman, P.J. T-cell antigen receptor genes and T-cell recognition. Nature 1988, 334, 395–402. [Google Scholar] [CrossRef]
- Germain, R.N. MHC-dependent antigen processing and peptide presentation: Providing ligands for T lymphocyte activation. Cell 1994, 76, 287–299. [Google Scholar] [CrossRef] [PubMed]
- Garstka, M.A.; Fish, A.; Celie, P.H.; Joosten, R.P.; Janssen, G.M.; Berlin, I.; Hoppes, R.; Stadnik, M.; Janssen, L.; Ovaa, H.; et al. The first step of peptide selection in antigen presentation by MHC class I molecules. Proc. Natl. Acad. Sci. USA 2015, 112, 1505–1510. [Google Scholar] [CrossRef] [PubMed] [Green Version]
- Friedman, R. A Hierarchy of Interactions between Pathogenic Virus and Vertebrate Host. Symmetry 2022, 14, 2274. [Google Scholar] [CrossRef]
- Wong, F.; Krishnan, A.; Zheng, E.J.; Stark, H.; Manson, A.L.; Earl, A.M.; Jaakkola, T.; Collins, J.J. Benchmarking AlphaFold-enabled molecular docking predictions for antibiotic discovery. Mol. Syst. Biol. 2022, 18, e11081. [Google Scholar] [CrossRef] [PubMed]
- Jumper, J.; Evans, R.; Pritzel, A.; Green, T.; Figurnov, M.; Ronneberger, O.; Tunyasuvunakool, K.; Bates, K.; Zidek, A.; Potapenko, A.; et al. Highly accurate protein structure prediction with AlphaFold. Nature 2021, 596, 583–589. [Google Scholar] [CrossRef]
- Lythe, G.; Callard, R.E.; Hoare, R.L.; Molina-Paris, C. How many TCR clonotypes does a body maintain? J. Theor. Biol. 2016, 389, 214–224. [Google Scholar] [CrossRef] [Green Version]
- Hie, B.; Zhong, E.D.; Berger, B.; Bryson, B. Learning the language of viral evolution and escape. Science 2021, 371, 284–288. [Google Scholar] [CrossRef]
- Krangel, M.S. Mechanics of T cell receptor gene rearrangement. Curr. Opin. Immunol. 2009, 21, 133–139. [Google Scholar] [CrossRef] [Green Version]
- Schuldt, N.J.; Binstadt, B.A. Dual TCR T Cells: Identity Crisis or Multitaskers? J. Immunol. 2019, 202, 637–644. [Google Scholar] [CrossRef] [Green Version]
- Hodgkin, P.D. Modifying clonal selection theory with a probabilistic cell. Immunol. Rev. 2018, 285, 249–262. [Google Scholar] [CrossRef] [Green Version]
- Alt, F.W.; Oltz, E.M.; Young, F.; Gorman, J.; Taccioli, G.; Chen, J. VDJ recombination. Immunol. Today 1992, 13, 306–314. [Google Scholar] [CrossRef]
- Friedman, R. A Perspective on Information Optimality in a Neural Circuit and Other Biological Systems. Signals 2022, 3, 410–427. [Google Scholar] [CrossRef]
- Rooklin, D.; Wang, C.; Katigbak, J.; Arora, P.S.; Zhang, Y. AlphaSpace: Fragment-Centric Topographical Mapping To Target Protein–Protein Interaction Interfaces. J. Chem. Inf. Model. 2015, 55, 1585–1599. [Google Scholar] [CrossRef] [PubMed] [Green Version]
- McCafferty, C.L.; Marcotte, E.M.; Taylor, D.W. Simplified geometric representations of protein structures identify complementary interaction interfaces. Proteins: Struct. Funct. Bioinform. 2021, 89, 348–360. [Google Scholar] [CrossRef] [PubMed]
- Dai, B.; Bailey-Kellogg, C. Protein interaction interface region prediction by geometric deep learning. Bioinformatics 2021, 37, 2580–2588. [Google Scholar] [CrossRef]
- Montemurro, A.; Schuster, V.; Povlsen, H.R.; Bentzen, A.K.; Jurtz, V.; Chronister, W.D.; Crinklaw, A.; Hadrup, S.R.; Winther, O.; Peters, B.; et al. NetTCR-2.0 enables accurate prediction of TCR-peptide binding by using paired TCRα and β sequence data. Commun. Biol. 2021, 4, 1060. [Google Scholar] [CrossRef]
- Bradley, P. Structure-based prediction of T cell receptor: Peptide-MHC interactions. ELife 2023, 12, e82813. [Google Scholar] [CrossRef] [PubMed]
- Hsu, C.; Verkuil, R.; Liu, J.; Lin, Z.; Hie, B.; Sercu, T.; Lerer, A.; Rives, A. Learning inverse folding from millions of predicted structures. In Proceedings of the 39th International Conference on Machine Learning, Proceedings of Machine Learning Research, Baltimore, MD, USA, 17–23 July 2022; pp. 8946–8970. [Google Scholar]
- Taylor, R.; Kardas, M.; Cucurull, G.; Scialom, T.; Hartshorn, A.; Saravia, E.; Poulton, A.; Kerkez, V.; Stojnic, R. Galactica: A Large Language Model for Science. arXiv 2022, arXiv:2211.09085. [Google Scholar]
- Grezes, F.; Allen, T.; Blanco-Cuaresma, S.; Accomazzi, A.; Kurtz, M.J.; Shapurian, G.; Henneken, E.; Grant, C.S.; Thompson, D.M.; Hostetler, T.W.; et al. Improving astroBERT using Semantic Textual Similarity. arXiv 2022, arXiv:2212.00744. [Google Scholar]
- Stirling, A. Disciplinary dilemma: Working across research silos is harder than it looks. Guardian 2014. Available online: https://www.theguardian.com/science/political-science/2014/jun/11/science-policy-research-silos-interdisciplinarity (accessed on 10 May 2023).
- Opik, E.J. About dogma in science, and other recollections of an astronomer. Annu. Rev. Astron. Astrophys. 1977, 15, 1–18. [Google Scholar] [CrossRef]
- Neyman, J. Frequentist Probability and Frequentist Statistics. Synthese 1977, 36, 97–131. [Google Scholar] [CrossRef]
- Quinn, J.F.; Dunham, A.E. On Hypothesis Testing in Ecology and Evolution. Am. Nat. 1983, 122, 602–617. [Google Scholar] [CrossRef]
- Lin, Z.; Akin, H.; Rao, R.; Hie, B.; Zhu, Z.; Lu, W.; dos Santos Costa, A.; Fazel-Zarandi, M.; Sercu, T.; Candido, S.; et al. Language models of protein sequences at the scale of evolution enable accurate structure prediction. BioRxiv 2022. bioRxiv:2022.07.20.500902. [Google Scholar]
- Brants, T.; Popat, A.C.; Xu, P.; Och, F.J.; Dean, J. Large language models in machine translation. In Proceedings of the 2007 Joint Conference on Empirical Methods in Natural Language Processing and Computational Natural Language Learning (EMNLP-CoNLL), Prague, Czech Republic, 28–30 June 2007; pp. 858–867. [Google Scholar]
- Creswell, A.; Shanahan, M.; Higgins, I. Selection-inference: Exploiting large language models for interpretable logical reasoning. arXiv 2022, arXiv:2205.09712. [Google Scholar]
- Brown, T.; Mann, B.; Ryder, N.; Subbiah, M.; Kaplan, J.D.; Dhariwal, P.; Neelakantan, A.; Shyam, P.; Sastry, G.; Askell, A.; et al. Language Models are Few-Shot Learners. Adv. Neural Inf. Process. Syst. 2020, 33, 1877–1901. [Google Scholar]
- Cappuccio, A.; Jensen, S.T.; Hartmann, B.M.; Sealfon, S.C.; Soumelis, V.; Zaslavsky, E. Deciphering the combinatorial landscape of immunity. Elife 2020, 9, e62148. [Google Scholar] [CrossRef]
- Hou, X.L.; Wang, L.; Ding, Y.L.; Xie, Q.; Diao, H.Y. Current status and recent advances of next generation sequencing techniques in immunological repertoire. Genes Immun. 2016, 17, 153–164. [Google Scholar] [CrossRef]
- Lutz, I.D.; Wang, S.; Norn, C.; Courbet, A.; Borst, A.J.; Zhao, Y.T.; Dosey, A.; Cao, L.; Xu, J.; Leaf, E.M.; et al. Top-down design of protein architectures with reinforcement learning. Science 2023, 380, 266–273. [Google Scholar] [CrossRef]
- Silver, D.; Huang, A.; Maddison, C.J.; Guez, A.; Sifre, L.; Van Den Driessche, G.; Schrittwieser, J.; Antonoglou, I.; Panneershelvam, V.; Lanctot, M.; et al. Mastering the game of Go with deep neural networks and tree search. Nature 2016, 529, 484–489. [Google Scholar] [CrossRef] [PubMed]
- Friedman, R. Tokenization in the Theory of Knowledge. Encyclopedia 2023, 3, 380–386. [Google Scholar] [CrossRef]
- Puy, A.; Beneventano, P.; Levin, S.A.; Lo Piano, S.; Portaluri, T.; Saltelli, A. Models with higher effective dimensions tend to produce more uncertain estimates. Sci. Adv. 2022, 8, eabn9450. [Google Scholar] [CrossRef]
- Pan, Y.; Wang, L.; Feng, Z.; Xu, H.; Li, F.; Shen, Y.; Zhang, D.; Liu, W.J.; Gao, G.F.; Wang, Q. Characterisation of SARS-CoV-2 variants in Beijing during 2022: An epidemiological and phylogenetic analysis. Lancet 2023, 401, 664–672. [Google Scholar] [CrossRef]
- Govindarajan, S.; Recabarren, R.; Goldstein, R.A. Estimating the total number of protein folds. Proteins Struct. Funct. Bioinform. 1999, 35, 408–414. [Google Scholar] [CrossRef]
- Young, L.; Jernigan, R.L.; Covell, D.G. A role for surface hydrophobicity in protein-protein recognition. Protein Sci. 1994, 3, 717–729. [Google Scholar] [CrossRef] [PubMed] [Green Version]
- Jones, S.; Thornton, J.M. Analysis of protein-protein interaction sites using surface patches. J. Mol. Biol. 1997, 272, 121–132. [Google Scholar] [CrossRef] [PubMed]
- Hu, Z.; Ma, B.; Wolfson, H.; Nussinov, R. Conservation of polar residues as hot spots at protein interfaces. Proteins Struct. Funct. Bioinform. 2000, 39, 331–342. [Google Scholar] [CrossRef]
- Richards, F.M. 1977. Areas, Volumes, Packing, and Protein Structure. Annu. Rev. Biophys. Bioeng. 1977, 6, 151–176. [Google Scholar] [CrossRef]
- Bajaj, C.L.; Pascucci, V.; Shamir, A.; Holt, R.J.; Netravali, A.N. Dynamic maintenance and visualization of molecular surfaces. Discret. Appl. Math. 2003, 127, 23–51. [Google Scholar] [CrossRef] [Green Version]
- Gainza, P.; Sverrisson, F.; Monti, F.; Rodola, E.; Boscaini, D.; Bronstein, M.M.; Correia, B.E. Deciphering interaction fingerprints from protein molecular surfaces using geometric deep learning. Nat. Methods 2020, 17, 184–192. [Google Scholar] [CrossRef] [PubMed]
- Isert, C.; Atz, K.; Schneider, G. Structure-based drug design with geometric deep learning. Curr. Opin. Struct. Biol. 2023, 79, 102548. [Google Scholar] [CrossRef]
- Gainza, P.; Wehrle, S.; Van Hall-Beauvais, A.; Marchand, A.; Scheck, A.; Harteveld, Z.; Buckley, S.; Ni, D.; Tan, S.; Sverrisson, F.; et al. De novo design of protein interactions with learned surface fingerprints. Nature 2023, 617, 176–184. [Google Scholar] [CrossRef] [PubMed]
- Porollo, A.; Meller, J. Prediction-Based Fingerprints of Protein–Protein Interactions. Proteins: Struct. Funct. Bioinform. 2007, 66, 630–645. [Google Scholar] [CrossRef] [PubMed]
- Sverrisson, F.; Feydy, J.; Correia, B.E.; Bronstein, M.M. Fast end-to-end learning on protein surfaces. In Proceedings of the IEEE/CVF Conference on Computer Vision and Pattern Recognition, Virtual Attendance, 20–25 June 2021; pp. 15272–15281. [Google Scholar]
- dMaSIF—Fast end-to-end learning on protein surfaces. Available online: github.com/FreyrS/dMaSIF (accessed on 18 May 2023).
- Reiser, P.; Neubert, M.; Eberhard, A.; Torresi, L.; Zhou, C.; Shao, C.; Metni, H.; van Hoesel, C.; Schopmans, H.; Sommer, T.; et al. Graph neural networks for materials science and chemistry. Commun. Mater. 2022, 3, 93. [Google Scholar] [CrossRef]
- Kriegeskorte, N.; Kievit, R.A. Representational geometry: Integrating cognition, computation, and the brain. Trends Cogn. Sci. 2013, 17, 401–412. [Google Scholar] [CrossRef] [Green Version]
- Cohen, U.; Chung, S.; Lee, D.D.; Sompolinsky, H. Separability and geometry of object manifolds in deep neural networks. Nat. Commun. 2020, 11, 746. [Google Scholar] [CrossRef] [Green Version]
- Kriegeskorte, N. Deep Neural Networks: A New Framework for Modeling Biological Vision and Brain Information Processing. Annu. Rev. Vis. Sci. 2015, 1, 417–446. [Google Scholar] [CrossRef] [Green Version]
- Goyal, A.; Bengio, Y. Inductive biases for deep learning of higher-level cognition. Proc. R. Soc. A 2022, 478, 20210068. [Google Scholar] [CrossRef]
- Wen, H.; Shi, J.; Zhang, Y.; Lu, K.H.; Cao, J.; Liu, Z. Neural Encoding and Decoding with Deep Learning for Dynamic Natural Vision. Cereb. Cortex 2018, 28, 4136–4160. [Google Scholar] [CrossRef]
- Fusi, S.; Miller, E.K.; Rigotti, M. Why neurons mix: High dimensionality for higher cognition. Curr. Opin. Neurobiol. 2016, 37, 66–74. [Google Scholar] [CrossRef] [PubMed]
- Avena-Koenigsberger, A.; Misic, B.; Sporns, O. Communication dynamics in complex brain networks. Nat. Rev. Neurosci. 2018, 19, 17–33. [Google Scholar] [CrossRef] [PubMed]
- Amari, S.I. Information geometry and its applications: Convex function and dually flat manifold. In Proceedings of the Emerging Trends in Visual Computing: LIX Fall Colloquium, Palaiseau, France, 18–20 November 2008; Revised Invited Papers, March 2009. pp. 75–102. [Google Scholar]
- Mannakee, B.K.; Ragsdale, A.P.; Transtrum, M.K.; Gutenkunst, R.N. Sloppiness and the geometry of parameter space. In Uncertainty in Biology: A Computational Modeling Approach; Geris, L., Gomez-Cabrero, D., Eds.; Springer International: Cham, Switzerland, 2016. [Google Scholar]
- Hestness, J.; Narang, S.; Ardalani, N.; Diamos, G.; Jun, H.; Kianinejad, H.; Patwary, M.; Ali, M.; Yang, Y.; Zhou, Y. Deep Learning Scaling is Predictable, Empirically. arXiv 2017, arXiv:1712.00409. [Google Scholar]
Figure 1.
A fully connected network. Each node shares a connection with all other nodes. The number of connections in this network increases quadratically with an increase in the number of nodes. This expectation is identical to that which occurs in the attention mechanism of the transformer architecture of deep learning [16,17]. Furthermore, this leads to limits on the computation by a transformer. The cause of this limit may be referred to as a combinatorial explosion as there is a calculation at each edge, and, therefore, the number of calculations potentially exceeds that of an exponential growth rate. (Figure and legend reproduced from [13].)

Figure 2.
A pathway of adaptive immunity in jawed vertebrate animals. The topmost drawing represents the three-dimensional shape of a viral protein; below it is a protein as spliced into a set of amino acid subsequences; the subsequent image is of a viral peptide combining with a host cell receptor; and, lastly, the bottommost drawing is of an immune cell (on the right) with a cell surface receptor which has a function in scanning cells of the host (such as on the left) for evidence of pathogenic peptides. Positive detection of a pathogenic peptide may contribute to a host immune response. (Figure and legend reproduced from [38].)

Figure 3.
Abstract representation of a cellular receptor on the left and a ligand on the right. Each has a molecular surface and sites that contribute to the probability of a binding interaction between the molecules.
Figure 3.
Abstract representation of a cellular receptor on the left and a ligand on the right. Each has a molecular surface and sites that contribute to the probability of a binding interaction between the molecules.

Figure 4.
A chart of populations of viral variants of a viral type and their population sizes in a geographical area. Each rectangular bar represents a viral variant population. It shows that a few of these populations have a large population size, while many others are of smaller size. In other words, the geographical area contains a few viral variants that are frequent and many others that are rare in occurrence.

Figure 5.
A hypothetical population of protein shapes as represented inside the outer circle. Some of the proteins share the same shape, while others have a unique shape. This distribution of protein shapes reflects the hypothesis that some of the three-dimensional features of known proteins are frequently observed while others are rare. An alternative hypothesis is that the distribution of protein shapes is uniform in their occurrence across the population of protein shapes.

Figure 6.
A hypothetical evolutionary tree of lineages of viral variants as sampled in a geographical area over evolutionary time. This tree shows the lineages of variants that persist over time to the present time as a circle, while the lineages of variants that are extinguished before the present time are represented by an X at the lineage tip.

Disclaimer/Publisher’s Note: The statements, opinions and data contained in all publications are solely those of the individual author(s) and contributor(s) and not of MDPI and/or the editor(s). MDPI and/or the editor(s) disclaim responsibility for any injury to people or property resulting from any ideas, methods, instructions or products referred to in the content. |
© 2023 by the author. Licensee MDPI, Basel, Switzerland. This article is an open access article distributed under the terms and conditions of the Creative Commons Attribution (CC BY) license (https://creativecommons.org/licenses/by/4.0/).
Share and Cite
MDPI and ACS Style
Friedman, R. Geometry-Based Deep Learning in the Natural Sciences. Encyclopedia 2023, 3, 781-794. https://doi.org/10.3390/encyclopedia3030056
AMA Style
Friedman R. Geometry-Based Deep Learning in the Natural Sciences. Encyclopedia. 2023; 3(3):781-794. https://doi.org/10.3390/encyclopedia3030056
Chicago/Turabian StyleFriedman, Robert. 2023. "Geometry-Based Deep Learning in the Natural Sciences" Encyclopedia 3, no. 3: 781-794. https://doi.org/10.3390/encyclopedia3030056