
Simple Formulae, Deep Learning and Elaborate Modelling for the COVID-19 Pandemic


1
Department of Applied Mathematics and Theoretical Physics, University of Cambridge, Cambridge CB3 0WA, UK
2
Viterbi School of Engineering, University of Southern California, Los Angeles, CA 90089, USA
3
Mathematics Research Center, Academy of Athens, 11527 Athens, Greece
4
Fourth Department of Internal Medicine, Attikon University Hospital, National and Kapodistrian University of Athens, 12462 Athens, Greece
*
Author to whom correspondence should be addressed.
Encyclopedia 2022, 2(2), 679-689; https://doi.org/10.3390/encyclopedia2020047
Submission received: 16 January 2022
/
Revised: 24 March 2022
/
Accepted: 31 March 2022
/
Published: 6 April 2022
(This article belongs to the Collection Encyclopedia of COVID-19)
Abstract
:Predictive modelling of infectious diseases is very important in planning public health policies, particularly during outbreaks. This work reviews the forecasting and mechanistic models published earlier. It is emphasized that researchers’ forecasting models exhibit, for large t, algebraic behavior, as opposed to the exponential behavior of the classical logistic-type models used usually in epidemics. Remarkably, a newly introduced mechanistic model also exhibits, for large t, algebraic behavior in contrast to the usual Susceptible-Exposed-Infectious-Removed (SEIR) models, which exhibit exponential behavior. The unexpected success of researchers’ simple forecasting models provides a strong support for the validity of this novel mechanistic model. It is also shown that the mathematical tools used for the analysis of the first wave may also be useful for the analysis of subsequent waves of the COVID-19 pandemic.
1. Introduction
The first period of the COVID-19 pandemic in Europe, often referred to as ‘the first wave’, provides an ideal situation for the retrospective study of the various mathematical formulations used for modelling the dynamics of this viral epidemic. Indeed, during this phase, many European countries employed similar measures for combating the spread of the epidemic, and moreover, the pandemic was dominated by a single viral strain. Such a study is not only useful for academic purposes, but also, importantly, could identify an accurate mathematical formalism that could be used in a variety of epidemiological phenomena.
In the framework introduced by Holmdahl and Buckee [1], epidemiological models are broadly divided into two categories: forecasting and mechanistic. The former models fit a specific formula to the data, and then attempt to predict the dynamics of the quantity under consideration. The main limitation of these models is that they usually remain valid for a short period of time, and specifically only if the epidemiological situation remains unchanged. For example, they can be used during a lockdown period, but will not make accurate predictions after the lockdown is lifted. In contrast to forecasting models, mechanistic models can make predictions even when the relevant circumstances change. The main limitation of the forecasting models is the difficulty of determining the parameters specifying them.
In what follows, the researchers first discuss specific forecasting and mechanistic models introduced by the collaborative efforts published in [2,3,4,5,6,7,8]. In particular, the researchers provide an explanation for the remarkable success of researchers’ simple forecasting models for predicting the dynamics of the first wave. The researchers then emphasize that the tools introduced for the analysis of the first wave can also be useful for analyzing subsequent waves of the COVID-19 pandemic. This is illustrated with a brief discussion of the second wave.
2. The Success of the Novel Formulae as Opposed to the Logistic Formula
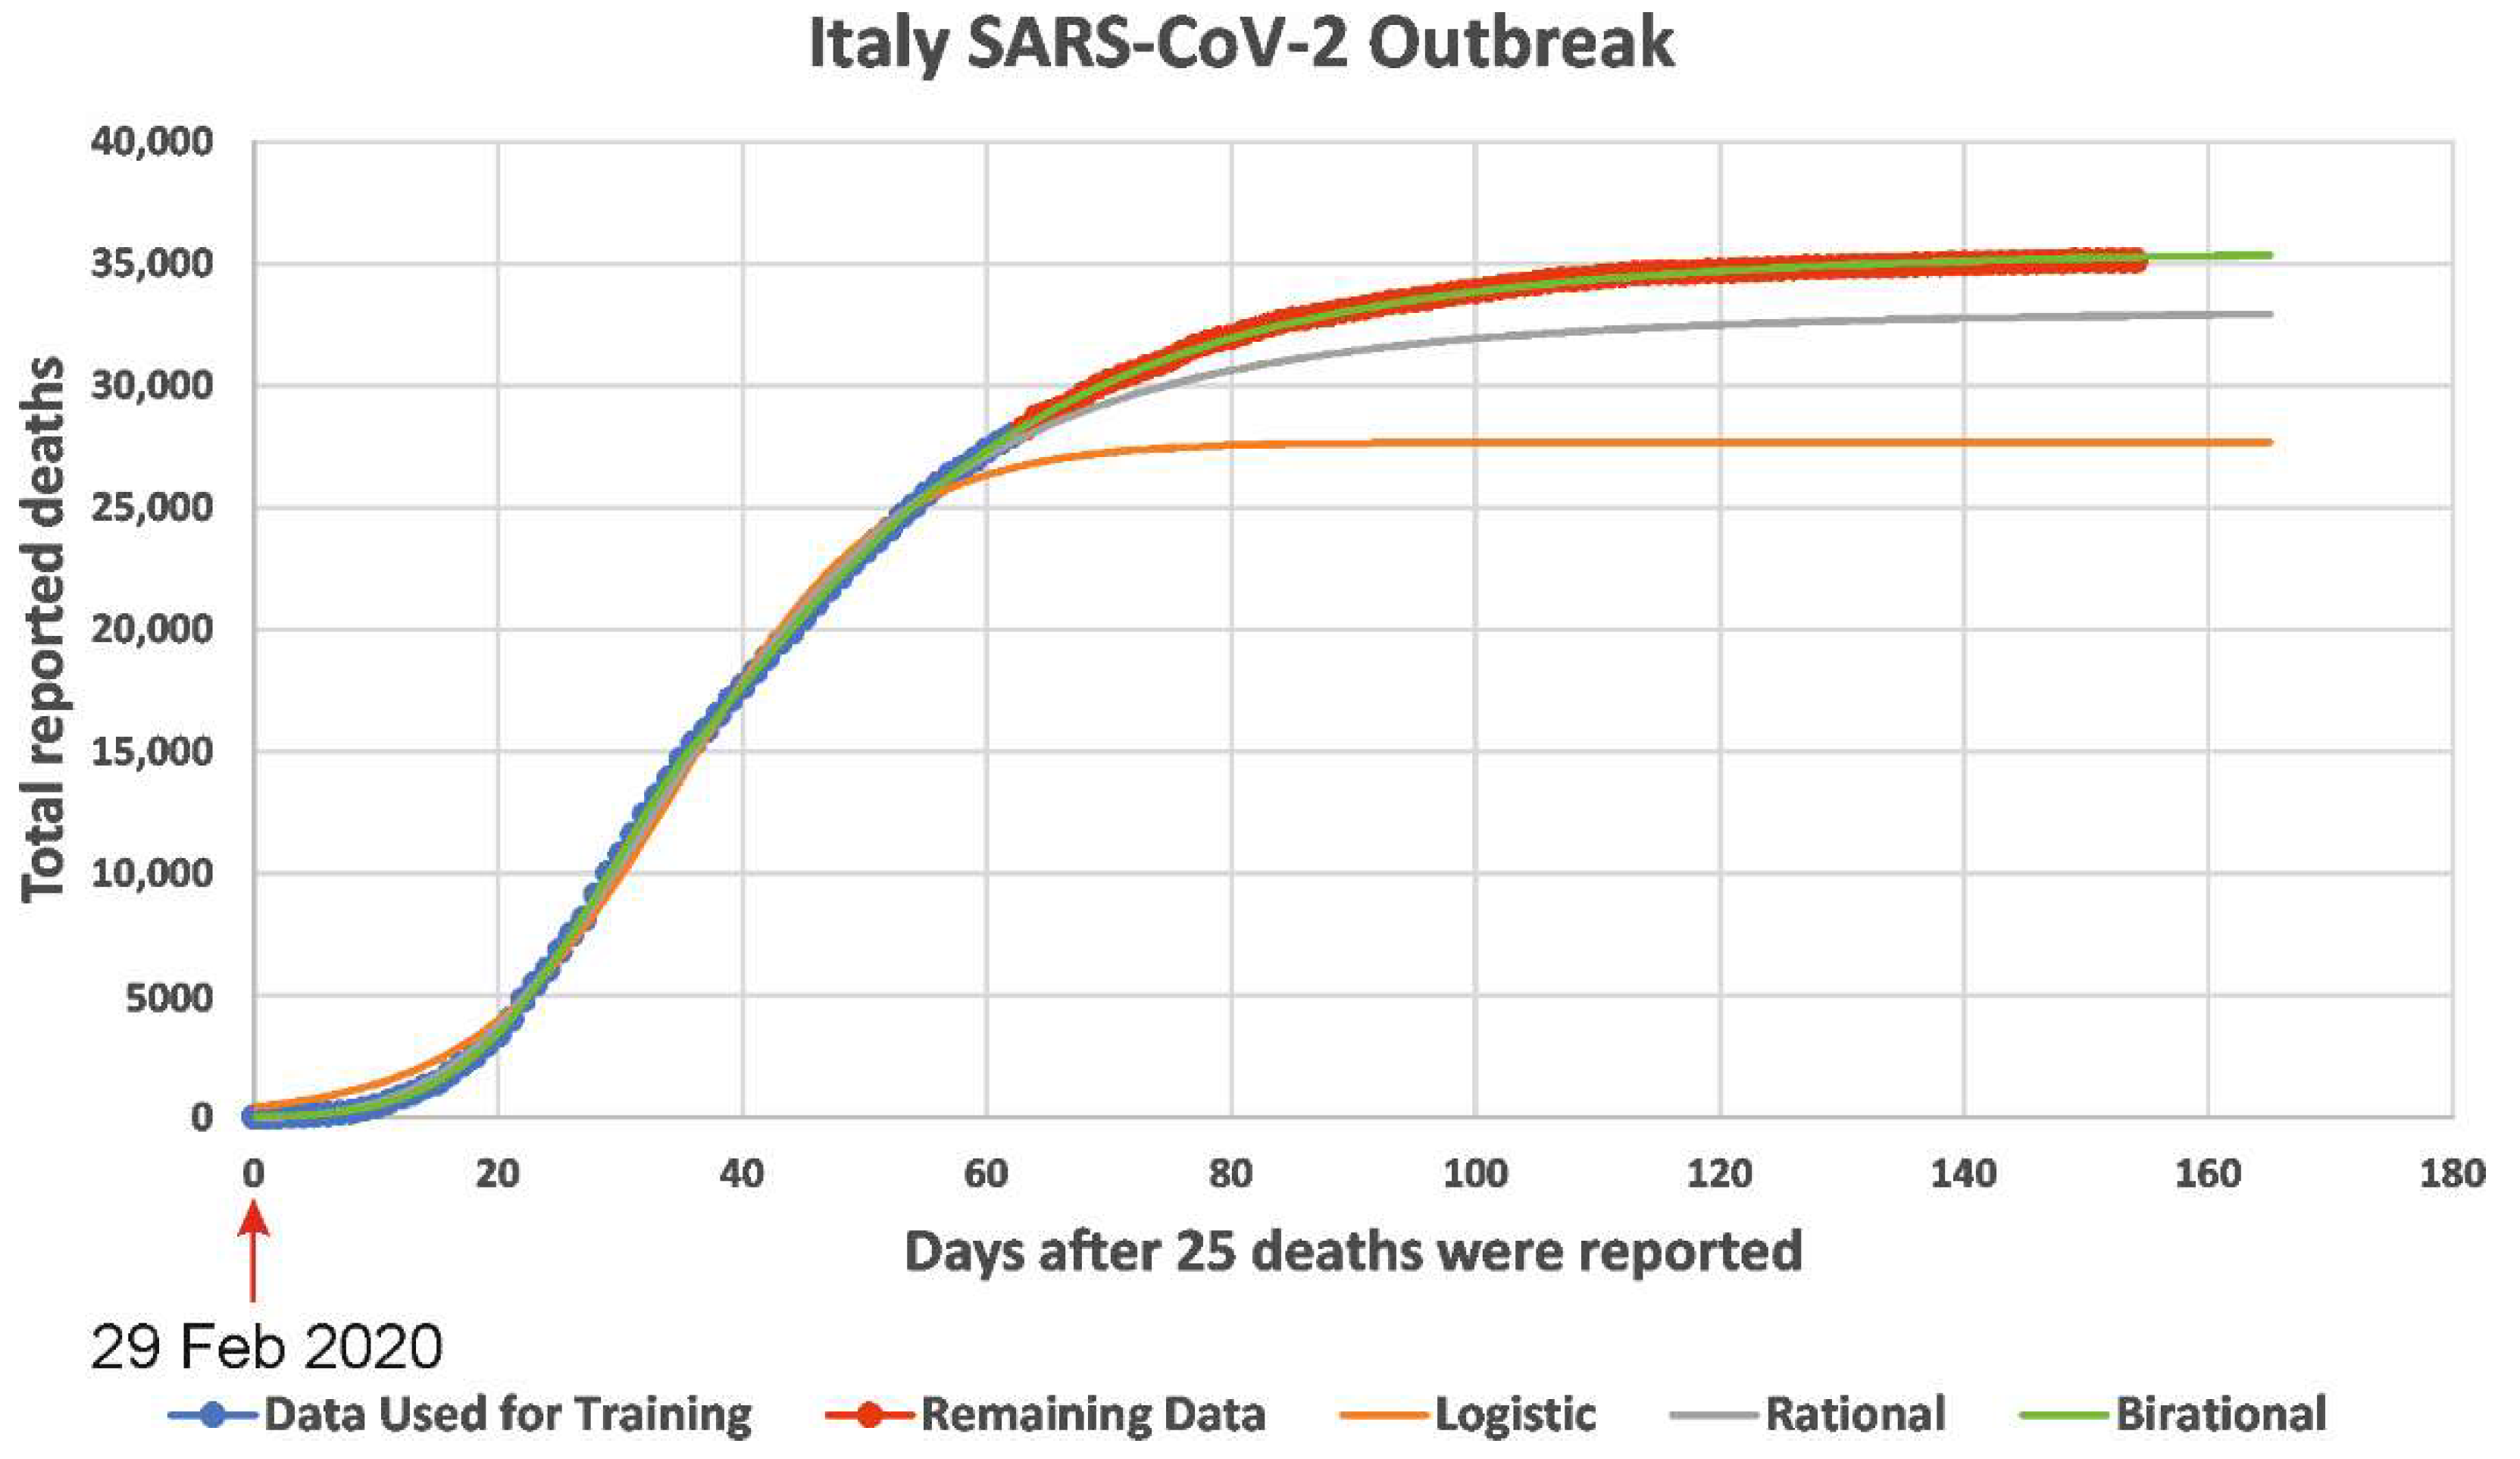
A novel class of forecasting models was presented in [2,3]. Although, as correctly noted in [9], the forecasting models are ‘not well suited for long-term predictions,’ the researchers’ class of forecasting models provided highly accurate long-term predictions both for the number of deaths caused by COVID-19 and the number of reported infected cases. Specifically, by training researchers’ novel formulae (i.e., by fixing the constant parameters appearing in theses formulae) using data for the accumulative number of deaths in a given country until 1 May 2020, it was possible to make predictions for a period of more than 3.5 months. A typical example is shown in in Figure 1: for the COVID-19 epidemic in Italy, it is seen that there was no deviation between the curve depicting the number of deaths and the curve constructed via the model formula. Incidentally, although this formula was trained using dates during the lockdown period, its predictions remained accurate even after the easing of the lockdown conditions; possible explanations for this unexpected fact are discussed in [4].
In researchers’ previous work [2,3], the usual logistic formula used in epidemiology is replaced by a different formula, called the rational formula. The logistic and rational formulae are given, respectively, by
and
In these formulae N(t) denotes the cumulative number of deaths (or reported infected cases) at time t; the parameters Nf, k, β, and d are constants that can be determined by ‘training’ the model using the given data.
In addition to the rational formula, researchers also used a simple variant of this formula, called birational [2,3]. The birational formula is similar to the rational formula, but the associated parameters are different before and after a fixed time point. Both the rational and birational formulae are based on a particular nonlinear ordinary differential equation, called the Riccati equation. This equation is specified by the constant parameter, Nf, denoting the final total number of deceased (or infected individuals), and by a time-dependent function, a(t). Remarkably, although this Riccati equation is a nonlinear equation that involves time-dependent coefficients, it can be solved in closed form. Its solution depends on Nf, a(t), and on a parameter related to the constant that arises in integrating this equation. In the particular case that a(t) is a constant, the explicit solution of the above Riccati equation becomes the classical logistic Formula (1). If a(t) = kd/(1 + dt), then it becomes Formula (2).
3. Deep Learning
In previous work [2], researchers also investigated deep learning algorithms, and in particular, the bidirectional long short-term memory (BiLSTM) network, which is a powerful generalization of recurrent neural networks (RNN) that can capture long-term dependencies while at the same time avoiding the problem of vanishing/exploding gradients. RNN can capture sequential information but cannot learn from long term dependencies. A common problem with RNN, particularly when many hidden layers are used, is the vanishing or the exploding of the gradient in the backpropagation algorithm occurring during the process of updating the weights. Hochreiter and Schmidhuber introduced in [10] the Long Short-Term Memory (LSTM) networks that can capture long term dependencies and at the same time avoid the problem of vanishing/exploding gradients. LSTM networks are a type of RNN, where a memory cell maintains its state over time; they use gates to decide whether to flow information in (keep) or out (forget) of the memory cell.
Graves and Schmidhuber introduced in [11] the BiLSTM networks; this development was motivated by the Bidirectional RNN networks, introduced earlier by Schuster and Paliwal in [12], where the training runs forwards and backwards using two separate RNN. Consequently, the main difference is the training sequence: in the LSTM, the sequence runs backwards, preserving information from the future, whereas in the BiLSTM training, the sequence runs backward and forward, preserving information from both the past and the future. The BiLSTM networks are well suited for time series prediction and can potentially completely capture the contextual information of the time series.
The rational and birational formulae are, in a sense, optimal, since such elaborate deep learning algorithms investigated in [2] could not improve the predictions obtained by using these simple analytic formulae.
What is the critical difference between the logistic and the rational formulae? Although, for large time, t, both the logistic and the rational formulae tend to a constant, Nf, namely, the plateau reached by the epidemic, this constant is approached with exponential and algebraic rates, respectively. Indeed, for large t, Equations (1) and (2) yield the following asymptotic expressions:
and
It is interesting to note that given a set of data, it is always possible to choose the constant parameters that specify these two formulae, so that they can match the given data extremely well. However, when these formulae are used to predict the dynamics of the epidemic, it becomes clear that the curve obtained via the logistic formula immediately begins to deviate from the curve of the real data, whereas the rational formula yields excellent predictions.
Regarding the algebraic decay, it is worth noting the following observation: whereas physical phenomena are often accurately modelled by exponential processes, social phenomena usually require an algebraic formalism.
4. A Typical Susceptible-Exposed-Infected-Recovered (SEIR) Type Model
In summary, the analysis of the real data from several European countries during the first wave of the COVID-19 epidemic suggests that the long-time behavior of the dynamics of the underlying processes is characterized by an algebraic as opposed to an exponential decay. This raises the following important question: do the mechanistic equations used to model these dynamics exhibit large t algebraic decay? This important question is discussed below.
It is well known that the most widely used mechanistic models are the so-called susceptible-exposed-infected-recovered (SEIR) type models. A typical such model was analyzed in [5,6]. This model consists of six ordinary differential equations modelling the number of infected, asymptomatic, sick, recovered, hospitalized, and deceased. Numerous other investigators have analyzed similar models, which include the well know works of [13]. Different SEIR models use different number of ‘compartments,’ but the essential physiological hypothesis used for deriving these models is the same.
The large time asymptotics of the model of [5] are analyzed in [7], where it is shown that this SEIR model exhibits exponential decay. It is natural to expect that all other SEIR type models will exhibit a similar behavior, which is inconsistent with the summary at the beginning of this section.
By modelling in [7] a physiologically important mechanism, which was until recently ignored, an additional nonlinear effect was introduced in the six ordinary differential equations presented in [5]. Remarkably, for large t, the novel model introduced in [7] exhibits algebraic decay, consistent with the decay exhibited by the real data. It is noted that the new physiological mechanism used in [7] was first introduced in [8,14] in connection with a simpler model.
5. From the First to the Second Wave
RNA viruses, as exemplified by influenza, may acquire mutations that can have a significant effect on their biological behavior [15,16]. Viruses’ mutation rates are affected by various factors inherent to their replication such as the polymerase action, or external to the virus itself such as environmental effects. The precise contribution of these effects and how natural selection acts to optimize these rates remains unknown. The novel coronavirus, even before harboring genetic changes like the D614G polymorphism, was already fit enough to cause a pandemic.
The novel pandemic coronavirus SARS-CoV-2 acquired mutations early on [17], which altered some of its essential characteristics, affecting diagnosis [18], disease phenotype and severity [19,20], therapeutic interventions [21], and vaccine efficacy [22].
The exact public health impact of the early mutations remains debatable. By April 2020, strains carrying the D614G mutation [23,24] became prevalent in Europe, the USA, and Canada [23]. In particular, in a study in Houston, Texas, USA, the D614G variant strain gradually fully dominated the local epidemic [25]. The high prevalence of this strain was also confirmed in a UK study involving the analysis of 25,000 genomes [26]. In human infections, this strain was reported to be associated with a fitness advantage, as well as with greater transmissibility [23] and higher viral loads.
A difference in the growth rates between the higher levels of recorded infections and lower levels of respective number of deaths during the evolution of the pandemic, and especially during the second surge of the infection, is evident in the examination of the epidemic curves available from the European Centre for Disease Control [27,28]. A number of different factors may be associated with this ‘paradox,’ including increased testing, better health system capacity, earlier treatment, and increased levels of immunity in local populations. The possibility that the virus—due to structural differences—has evolved to be associated with less virulence, has been reported at the experimental level [29]. In this context, studies investigating the effect of earlier mutations including the D614G polymorphism showed that infections with D614G carrying strains were associated with higher viral loads in the upper respiratory tracts and a fitness advantage, leading to increased transmissibility [23,30,31,32,33,34]. Two large genomic analysis studies suggested otherwise [26,35]; they did not find convincing evidence with regards to infectivity or virulence [26,35]. The question of establishing whether this strain is indeed more infectious or less virulent remains crucial with regards to virus evolution to less virulent forms [36]. In the meantime, the world is faced with the emergence of new variants [37,38,39,40,41,42,43,44,45,46,47,48,49,50].
5.1. Predictions for the Number of Reported Infected Cases and the Number of the Deceased for the Second Wave in Portugal
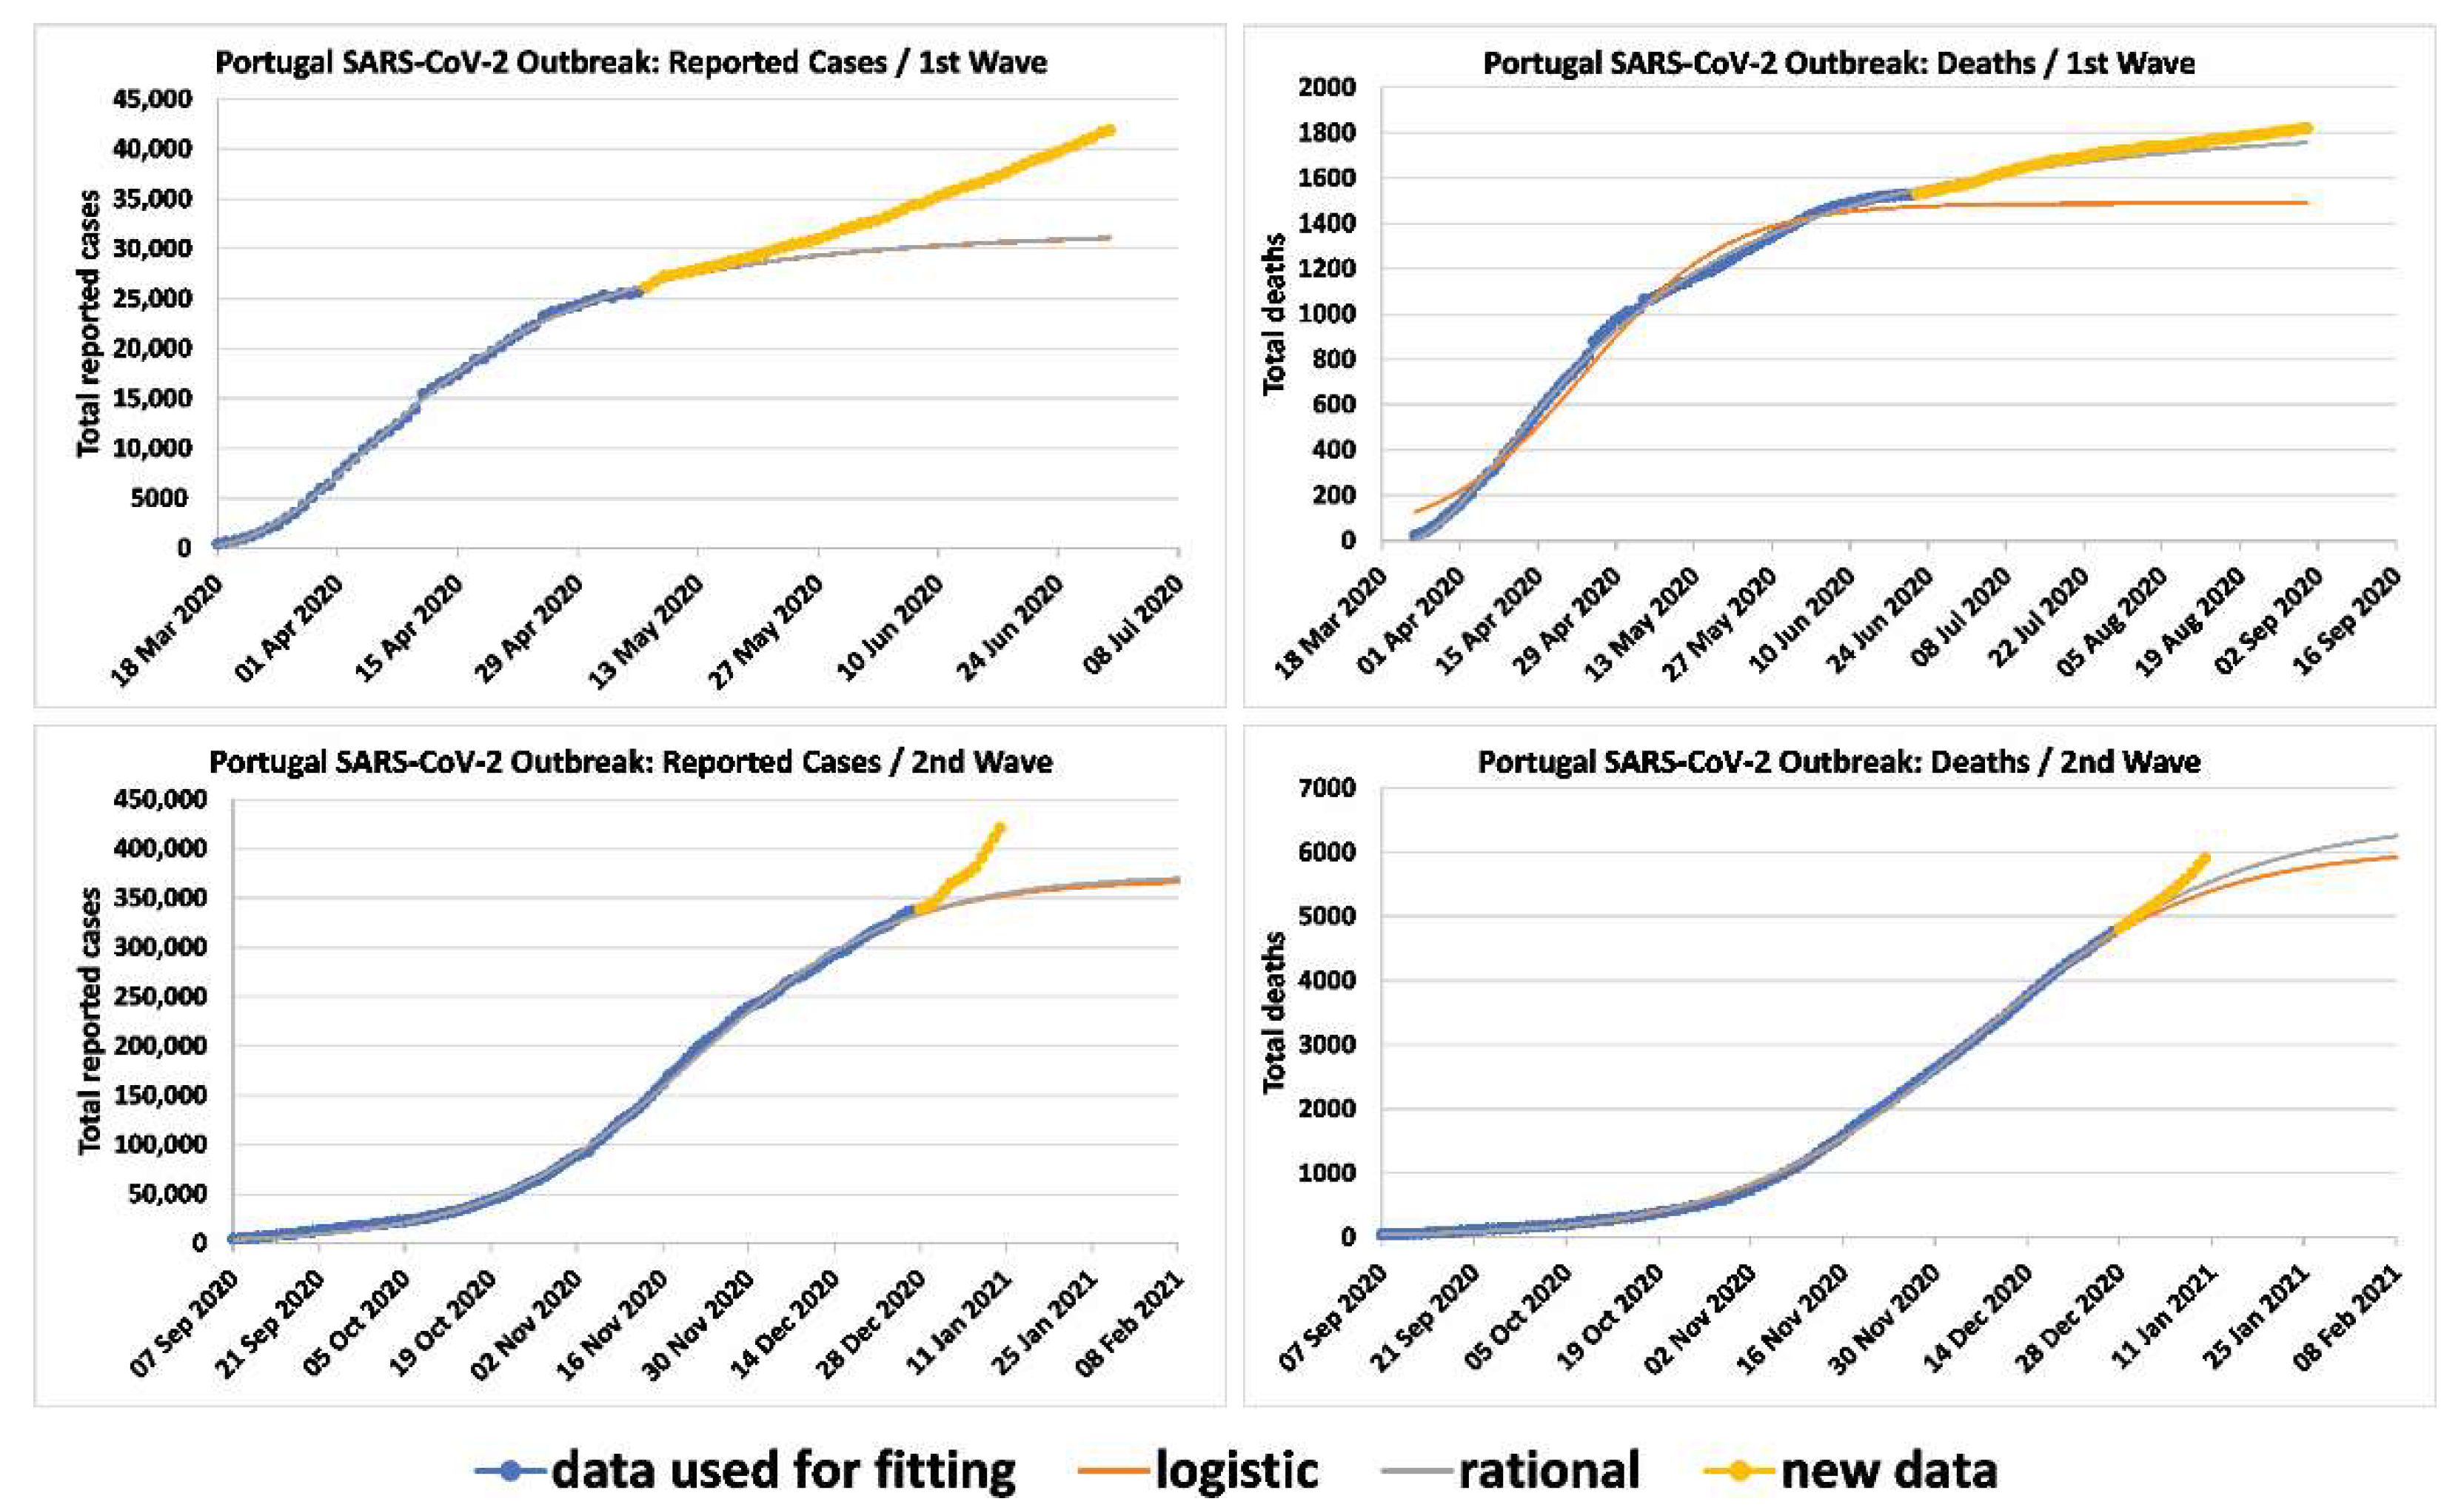
In order to show that the techniques developed for the first wave can also be used for the analysis of subsequent waves, researchers applied the rational and logistic formulae to the cumulative number of deaths and reported infected cases for the second wave of Portugal. These formulae provided accurate predictions for the relevant dynamics (Figure 2). The data were fitted up to 27 December 2020, the last day before the first appearance of the UK lineage. Therefore, the researchers’ curves determine what the plateau for reported cases and deaths would have been without the emergence of the UK lineage. For the number of deaths, the logistic formula predicted a plateau on 21 February 2021 with 6002 deaths for the second wave and 7798 total deaths overall; the rational formula predicted a plateau on 2 March 2021 with 6432 deaths for the second wave and 8228 total deaths overall. The plateau is defined as the point when the rate of deaths for the given wave is 5% of the maximum rate. It should be noted that in order to get accurate predictions, the model should employ data at least up to a short period after the time when the rate of deaths reached a maximum. In Portugal, for the deaths of the second wave, this occurred on 6 December 2020.
For the number of reported infected cases for Portugal, the logistic formula predicted a plateau on 2 February 2021 with 364,526 cases for the second wave and 420,123 total cases overall; the rational formula predicted a plateau on 5 February 2021 with 369,040 cases for the second wave and 424,637 total cases overall. In Portugal, the rate of infections of the third wave reached a maximum on 21 November 2020.
5.2. Higher Infectivity and Lower Virulence
In order to compare the infectivity and virulence of the first two waves, additional techniques are needed. In this regard, first, researchers computed the rates dN/dt directly from the data, where N denotes the number of reported infected, in seven European countries (in order to avoid the noise of the real data, researchers computed these rates by fitting the data for the first and second waves to the rational and the logistic formulae, respectively). Second, researchers computed the function v(t) defined as the ratio of the cumulative number of deaths to the total number of reported infected cases that occurred three weeks prior to the date that the accumulated number of deaths was computed.
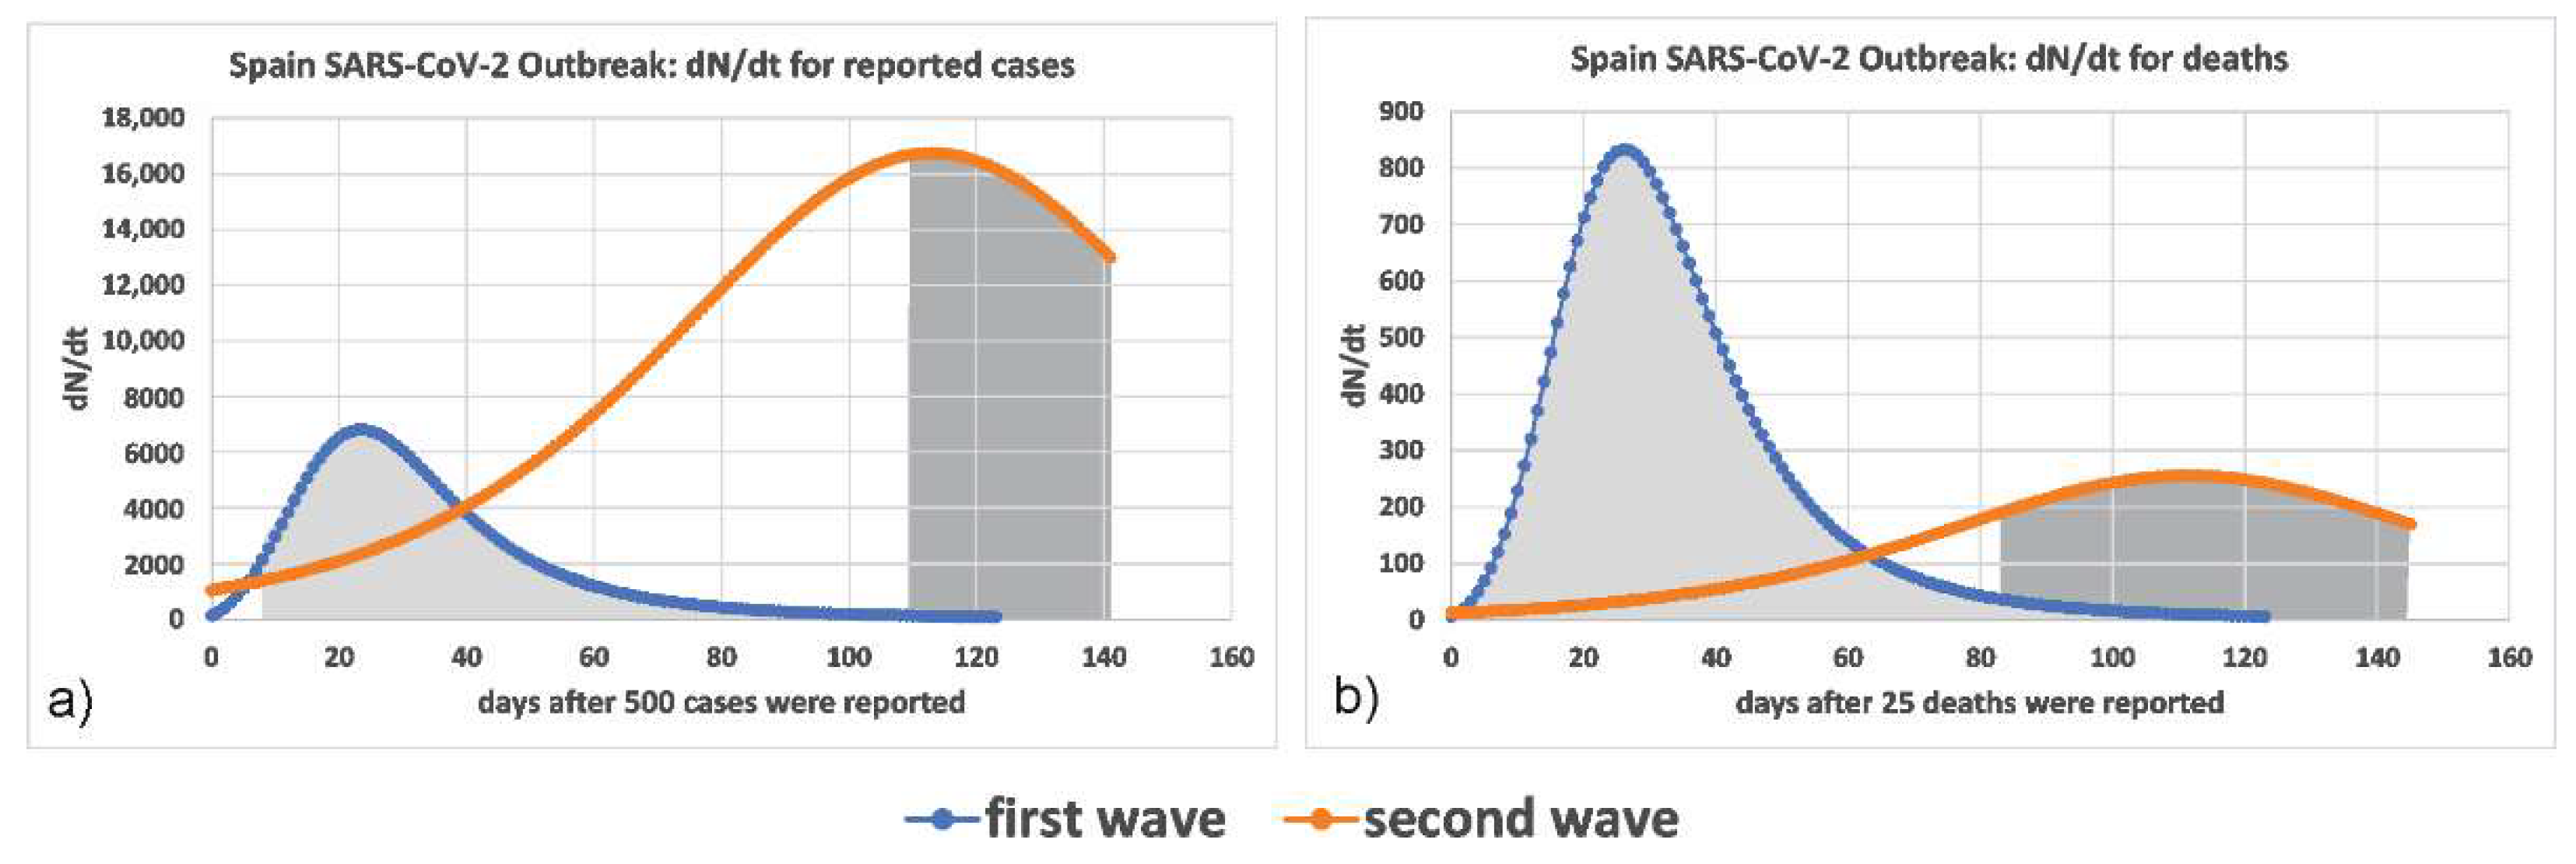
The computed rate of reported infected cases in the seven European countries analyzed was larger in the second wave, which supports the suggestion that the circulating strain of the virus of the second wave was more infectious. Figure 3a presents the relevant curves for Spain, which is prototypical of all cases examined. Similarly, the computed rate of deaths was much lower, seen in Figure 3b.
For the case of Portugal, the rate of deaths can also be computed indirectly by examining the logistic and rational models. By comparing the parameters of the fitted logistic formula for Portugal (Figure 2) between the first and the second waves, it is confirmed that the rate of deaths is lower in the second wave (the parameter k is 0.0778 for the first and 0.0564 for the second, whilst the parameter Nf is 1489 and 6076).
In order to examine whether death rates were slower during the evolution of the pandemic and especially in the last half of 2020, researchers computed v(t) using the following steps. First, researchers separated the reported infected cases and the deaths for each country in the two waves and calculated their plateau. Then, in each wave, researchers computed the function v(t) by dividing the cumulative number of deaths up to a given date, by the cumulative number of reported cases 3 weeks earlier. Researchers chose the period of 3 weeks because individual infections during the last 3 weeks are not expected to greatly affect the number of deaths [51].
The graphs of v(t) for Germany, Greece, Spain, UK, Italy, Czechia, France, and Belgium are shown in Figure 4. The values of v(t) after the situation gets stabilized are shown in Table 1. These results suggest that the pathogenicity of the second Autumn/Winter wave was smaller than the first for these countries. Various factors may affect this suggestion, including increased testing, better health system capacity, earlier treatment, and increased levels of immunity in local populations. Among these factors, perhaps the increased number of testing during the second wave is of particular significance. As shown below, this effect can be quantified.
Indeed, let I and R denote the number of infected and reported infected individuals, and let the subscripts 1 and 2 indicate first and second wave, respectively. In the analysis that follows, the researchers assume that I1 = α1R1 and I2 = α2R2. Differentiating these equations with respect to time and dividing the resulting expressions, the researchers find
Since the number of tests increased during the second wave, α2 < α1.
Thus, the researchers’ conclusions are valid provided that the growth of is sufficiently large so it can compensate for the decrease in . Similarly, let νa, where the superscript ‘a’ denotes ‘actual,’ be defined by . Then, , and hence:
The researchers’ conclusions remain valid, despite the increase in the number of tests during the second wave, provided that the decrease of is sufficiently small to compensate for the growth of . The researchers have been able to find data for the ratio only for Italy and UK; these numbers are quite small, namely 1.40 and 1.65, respectively [52,53]. Researchers speculate that similar rations are valid for the other counties considered in the researchers’ study. Such small ratios will yield slight modifications for the graphs in Figure 4 and the values in the Table 1, but the overall conclusions remain the same.
6. Conclusions
The researchers have reviewed different predictive models used in the collaborative efforts published in [2,3,4,5,6,7,8] and have emphasized that the success of the researchers’ forecasting models is due to the fact that, for large time, they capture the essential behavior of a recently introduced improved mechanistic models. Of course, mathematical modelling is only suggestive and cannot provide definitive proof of the different biological behaviors of the virus. In particular, the number of deaths and the rates of confirmed cases vary significantly across countries and there is significant dependency on the testing performed, as well as significant underreporting [54]. Moreover, the index of the probability of death per case of disease (Infection Fatality Rate) also varies from country to country. This is the result of a variety of factors, including, for example, differences in testing strategies and in case ascertainment. In addition, variance in population characteristics and comorbidities among countries and continents affects the observed morbidity and mortality (e.g., age is the most significant factor associated with increased mortality). Moreover, the percentage of cases involving specific high-risk sub-populations (such as those in nursing homes [55]) varies according to country. Furthermore, differences in timing of measures adopted, as well as differences in targeted control strategies across countries (including targeting the high-risk population like the middle-aged and over), affects death rates. Relating to this observation, the health system quality and capacity widely varies across nations and continents. The saturation of medical facilities may further affect mortality rates, especially in vulnerable high-risk populations.
Researchers have also shown that the mathematical modelling tools used in the first wave, as well as variations of these tools, can be useful for the analysis of subsequent waves. The researchers have illustrated this fact by analyzing the second wave. The researchers suggest that this wave is characterized by higher transmissibility and less virulence than the first wave. However, in these connections, it should be noted that several clinical and physiological factors may affect the disease course towards a better outcome. Among these are the increasing experience of doctors treating the disease and its complications, along with early diagnosis, small hospital volumes in early stages of the second wave that allowed for better care, and the use of new antivirals and immune modulation treatments. All these effects could potentially lead to milder clinical forms of the disease [56,57]. Thus, the value of the ratio proposed herein may tend to underestimate the virulence of new strains.
In conclusion, it should be noted that it is not possible to predict the clinical effect of new mutations. For example, although the second wave apparently involved a less virulent strain than the first, the third wave was more severe. On the other hand, the omicron variant is highly transmittable but also has very low virulence.
Author Contributions
Conceptualization, A.S.F. and S.T.; methodology, A.S.F.; software, N.D. and G.A.K.; formal analysis, N.D. and G.A.K.; writing—original draft preparation, A.S.F. and S.T.; writing—review and editing, A.S.F., S.T., N.D. and G.A.K.; supervision, A.S.F. and S.T. All authors have read and agreed to the published version of the manuscript.
Funding
A.S.F. was supported by EPSRC, UK (RG79707), in the form of a senior Fellowship.
Data Availability Statement
The data presented in this study are publicly available on the various sites cited within the manuscript.
Conflicts of Interest
The authors declare no conflict of interest.
References
- Holmdahl, I.; Buckee, C. Wrong but useful-What Covid-19 epidemiologic models can and cannot tell us. N. Engl. J. Med. 2020, 383, 303–305. [Google Scholar] [CrossRef] [PubMed]
- Fokas, A.S.; Dikaios, N.; Kastis, G.A. Mathematical models and deep learning for predicting the number of individuals reported to be infected with SARS-CoV-2. J. R. Soc. Interface 2020, 17, 20200494. [Google Scholar] [CrossRef] [PubMed]
- Fokas, A.S.; Dikaios, N.; Kastis, G.A. Covid-19: Predictive mathematical formulae for the number of deaths during lockdown and possible scenarios for the post-lockdown period. Proc. R. Soc. A 2021, 477, 20200745. [Google Scholar] [CrossRef] [PubMed]
- Fokas, A.S.; Kastis, G.A. SARS-CoV-2: The Second Wave in Europe. J. Med. Internet Res. 2021, 23, e22431. [Google Scholar] [CrossRef] [PubMed]
- Fokas, A.S.; Cuevas-Maraver, J.; Kevrekidis, P.G. A quantitative framework for exploring exit strategies from the COVID-19 lockdown. Chaos Solitons Fractals 2020, 140, 110244. [Google Scholar] [CrossRef]
- Fokas, A.S.; Cuevas-Maraver, J.; Kevrekidis, P.G. Easing COVID-19 lockdown measures while protecting the older restricts the deaths to the level of the full lockdown. Sci. Rep. 2021, 11, 5839. [Google Scholar] [CrossRef] [PubMed]
- Fokas, A.S.; Oberai, A.A.; Yortsos, Y.C. A novel SEIR type model exhibiting algebraic behavior. in preparation.
- Luhar, M.; Oberai, A.A.; Fokas, A.S.; Yortsos, Y.C. Accounting for Super-Spreader Events and Algebraic Decay in SIR Models. Comput. Methods Appl. Mech. Eng. 2022. submitted. [Google Scholar]
- Zhou, P.; Yang, X.-L.; Wang, X.-G.; Hu, B.; Zhang, L.; Zhang, W.; Si, H.-R.; Zhu, Y.; Li, B.; Huang, C.-L.; et al. A pneumonia outbreak associated with a new coronavirus of probable bat origin. Nature 2020, 579, 270–273. [Google Scholar] [CrossRef]
- Hochreiter, S.; Schmidhuber, J. Long Short-Term Memory. Neural Comput. 1997, 9, 1735–1780. [Google Scholar] [CrossRef]
- Graves, A.; Schmidhuber, J. Framewise phoneme classification with bi-directional LSTM and other neural network architectures. Neural Netw. 2005, 18, 602–610. [Google Scholar] [CrossRef] [PubMed]
- Schuster, M.; Paliwal, K.K. Bidirectional recurrent neural networks. IEEE Trans. Signal Process. 1997, 45, 2673–2681. [Google Scholar] [CrossRef]
- Ferguson, N.M.; Laydon, D.; Nedjati-Gilani, G.; Imai, N.; Ainslie, K.; Baguelin, M.; Ghani, A.C. Impact of Non-Pharmaceutical Interventions (NPIs) to Reduce COVID-19 Mortality and Healthcare Demand. Imperial College, London, March 2020. Available online: https://www.imperial.ac.uk/mrc-global-infectious-disease-analysis/covid-19/ (accessed on 20 March 2020).
- Ramaswamy, H.; Oberai, A.A.; Luhar, M.; Yortsos, Y.C. Understanding the R0 of pademics. In Proceedings of the 42nd Ibero-Latin-American Congress on Computational Methods in Engineering (XLII CILAMCE) and the 3rd Pan American Congress on Computational Mechanics (III PANACM), Rio de Janeiro, Brazil, 9–12 November 2021; p. 9449. [Google Scholar]
- Lauring, A.S.; Andino, R. Quasispecies theory and the behavior of RNA viruses. PLoS Pathog. 2010, 6, e1001005. [Google Scholar] [CrossRef] [PubMed]
- Ghedin, E.; Sengamalay, N.A.; Shumway, M.; Zaborsky, J.; Feldblyum, T.; Subbu, V.; Spiro, D.J.; Sitz, J.; Koo, H.; Bolotov, P.; et al. Large-scale sequencing of human influenza reveals the dynamic nature of viral genome evolution. Nature 2005, 437, 1162–1166. [Google Scholar] [CrossRef]
- Badua, C.; Baldo, K.A.T.; Medina, P.M.B. Genomic and proteomic mutation landscapes of SARS-CoV-2. J. Med. Virol. 2021, 93, 1702–1721. [Google Scholar] [CrossRef]
- Artesi, M.; Bontems, S.; Gobbels, P.; Franckh, M.; Maes, P.; Boreux, R.; Meex, C.; Melin, P.; Hayette, M.P.; Bours, V.; et al. A Recurrent Mutation at Position 26340 of SARS-CoV-2 Is Associated with Failure of the E Gene Quantitative Reverse Transcription-PCR Utilized in a Commercial Dual-Target Diagnostic Assay. J. Clin. Microbiol. 2020, 58, e01598-20. [Google Scholar] [CrossRef]
- Al Khatib, H.A.; Benslimane, F.M.; Elbashir, I.E.; Coyle, P.V.; Al Maslamani, M.A.; Al-Khal, A.; Al Thani, A.A.; Yassine, H.M. Within-Host Diversity of SARS-CoV-2 in COVID-19 Patients With Variable Disease Severities. Front. Cell Infect. Microbiol. 2020, 10, 575613. [Google Scholar] [CrossRef]
- Pandit, B.; Bhattacharjee, S.; Bhattacharjee, B. Association of clade-G SARS-CoV-2 viruses and age with increased mortality rates across 57 countries and India. Infect. Genet. Evol. 2021, 90, 104734. [Google Scholar] [CrossRef]
- Andreano, E.; Piccini, G.; Licastro, D.; Casalino, L.; Johnson, N.V.; Paciello, I.; Monego, S.D.; Pantano, E.; Manganaro, N.; Manenti, A.; et al. SARS-CoV-2 escape from a highly neutralizing COVID-19 convalescent plasma. Proc. Natl. Acad. Sci. USA 2021, 118, e2103154118. [Google Scholar] [CrossRef]
- Amanat, F.; Strohmeier, S.; Rathnasinghe, R.; Schotsaert, M.; Coughlan, L.; García-Sastre, A.; Krammer, F. Introduction of two prolines and removal of the polybasic cleavage site lead to higher efficacy of a recombinant spike-based SARS-CoV-2 vaccine in the mouse model. mbio 2021, 12, e02648-20. [Google Scholar] [CrossRef]
- Korber, B.; Fischer, W.M.; Gnanakaran, S.; Yoon, H.; Theiler, J.; Abfalterer, W.; Hengartner, N.; Giorgi, E.E.; Bhattacharya, T.; Foley, B.; et al. Tracking Changes in SARS-CoV-2 Spike: Evidence that D614G Increases Infectivity of the COVID-19 Virus. Cell 2020, 182, 812–827.e19. [Google Scholar] [CrossRef] [PubMed]
- Mansbach, R.A.; Chakraborty, S.; Nguyen, K.; Montefiori, D.C.; Korber, B.; Gnanakaran, S. The SARS-CoV-2 Spike Variant D614G Favors an Open Conformational State. Sci. Adv. 2021, 7, eabf3671. [Google Scholar] [CrossRef] [PubMed]
- Long, S.W.; Olsen, R.J.; Christensen, P.A.; Bernard, D.W.; Davis, J.J.; Shukla, M.; Nguyen, M.; Saavedra, M.O.; Yerramilli, P.; Pruitt, L.; et al. Molecular Architecture of Early Dissemination and Massive Second Wave of the SARS-CoV-2 Virus in a Major Metropolitan Area. mBio 2020, 11, e02707-20. [Google Scholar] [CrossRef] [PubMed]
- Volz, E.; Hill, V.; McCrone, J.T.; Price, A.; Jorgensen, D.; O’Toole, Á.; Southgate, J.; Johnson, R.; Jackson, B.; Nascimento, F.F.; et al. Evaluating the Effects of SARS-CoV-2 Spike Mutation D614G on Transmissibility and Pathogenicity. Cell 2021, 184, 64–75. [Google Scholar] [CrossRef]
- COVID-19 Situation Update for the EU/EEA, as of Week 7 2021, Updated 25 February 2021. European Center for Disease Control. Available online: https://www.ecdc.europa.eu/en/cases-2019-ncov-eueea (accessed on 1 March 2021).
- COVID-19 Situation Worldwide, as of Week 7 2021, Updated 25 February 2021. European Center for Disease Control. Available online: https://www.ecdc.europa.eu/en/geographical-distribution-2019-ncov-cases (accessed on 1 March 2021).
- Yurkovetskiy, L.; Wang, X.; Pascal, K.E.; Tomkins-Tinch, C.; Nyalile, T.; Wang, Y.; Baum, A.; Diehl, W.E.; Dauphin, A.; Carbone, C.; et al. Structural and Functional Analysis of the D614G SARS-CoV-2 Spike Protein Variant. Cell 2020, 183, 739–751.e8. [Google Scholar] [CrossRef]
- Li, Q.; Wu, J.; Nie, J.; Zhang, L.; Hao, H.; Liu, S.; Zhao, C.; Zhang, Q.; Liu, H.; Nie, L.; et al. The Impact of Mutations in SARS-CoV-2 Spike on Viral Infectivity and Antigenicity. Cell 2020, 182, 1284–1294.e9. [Google Scholar] [CrossRef]
- Plante, J.A.; Liu, Y.; Liu, J.; Xia, H.; Johnson, B.A.; Lokugamage, K.G.; Zhang, X.; Muruato, A.E.; Zou, J.; Fontes-Garfias, C.R.; et al. Spike mutation D614G alters SARS-CoV-2 fitness. Nature 2021, 592, 116–121. [Google Scholar] [CrossRef]
- Hou, Y.J.; Chiba, S.; Halfmann, P.; Here, C.; Kuroda, M.; Dinnon, K.H., III; Leist, S.R.; Schäfer, A.; Nakajima, N.; Takahashi, K.; et al. SARS-CoV-2 D614G variant exhibits efficient replication ex vivo and transmission in vivo. Science 2020, 370, 1464–1468. [Google Scholar] [CrossRef]
- Zhou, B.; Thao, T.T.N.; Hoffmann, D.; Taddeo, A.; Ebert, N.; Labroussaa, F.; Pohlmann, A.; King, J.; Steiner, S.; Kelly, J.N.; et al. SARS-CoV-2 spike D614G change enhances replication and transmission. Nature 2021, 592, 122–127. [Google Scholar] [CrossRef]
- Daniloski, Z.; Jordan, T.X.; Ilmain, J.K.; Guo, X.; Bhabha, G.; tenOever, B.R.; Sanjana, N.E. The D614G mutation in SARS-CoV-2 Spike increases transduction of multiple human cell types. eLife 2021, 10, e65365. [Google Scholar] [CrossRef]
- van Dorp, L.; Richard, D.; Tan, C.C.S.; Shaw, L.P.; Acman, M.; Balloux, F. No evidence for increased transmissibility from recurrent mutations in SARS-CoV-2. Nat. Commun. 2020, 11, 5986. [Google Scholar] [CrossRef] [PubMed]
- Callaway, E. The coronavirus is mutating-does it matter? Nature 2020, 585, 174–177. [Google Scholar] [CrossRef] [PubMed]
- Claro, I.M.; da Silva Sales, F.C.; Ramundo, M.S.; Candido, D.S.; Silva, C.A.M.; de Jesus, J.G.; Manuli, E.R.; de Oliveira, C.M.; Scarpelli, L.; Campana, G.; et al. Local Transmission of SARS-CoV-2 Lineage B.1.1.7, Brazil, December 2020. Emerg. Infect. Dis. 2021, 27, 970–972. [Google Scholar] [CrossRef] [PubMed]
- Dao, M.H.; Nguyen, H.T.; Nguyen, T.V.; Nguyen, A.H.; Luong, Q.C.; Vu, N.H.P.; Pham, H.T.T.; Nguyen, T.N.T.; Thach, D.H.; Nguyen, L.V.; et al. New SARS-CoV-2 Variant of Concern Imported from the United Kingdom to Vietnam, December 2020. J. Med. Virol. 2021, 93, 2628–2630. [Google Scholar] [CrossRef] [PubMed]
- Umair, M.; Ikram, A.; Salman, M.; Alam, M.M.; Badar, N.; Rehman, Z.; Tamim, S.; Khurshid, A.; Ahad, A.; Ahmad, H.; et al. Importation of SARS-CoV-2 Variant B.1.1.7 in Pakistan. J. Med. Virol. 2021, 93, 2623–2625. [Google Scholar] [CrossRef] [PubMed]
- Yadav, P.D.; Nyayanit, D.A.; Sahay, R.R.; Sarkale, P.; Pethani, J.; Patil, S.; Baradkar, S.; Potdar, V.; Patil, D.Y. Isolation and characterization of the new SARS-CoV-2 variant in travellers from the United Kingdom to India: VUI-202012/01 of the B.1.1.7 lineage. J. Travel Med. 2021, 28, taab009. [Google Scholar] [CrossRef]
- Alpert, T.; Brito, A.F.; Lasek-Nesselquist, E.; Rothman, J.; Valesano, A.L.; MacKay, M.J.; Petrone, M.E.; Breban, M.I.; Watkins, A.E.; Vogels, C.B.F.; et al. Early introductions and community transmission of SARS-CoV-2 variant B.1.1.7 in the United States. Cell 2021, 184, 2595–2604.e13. [Google Scholar] [CrossRef]
- Firestone, M.J.; Lorentz, A.J.; Wang, X.; Como-Sabetti, K.; Vetter, S.; Smith, K.; Holzbauer, S.; Meyer, S.; Ehresmann, K.; Danila, R.; et al. First Identified Cases of SARS-CoV-2 Variant B.1.1.7 in Minnesota-December 2020–January 2021. MMWR Morb. Mortal. Wkly. Rep. 2021, 70, 278–279. [Google Scholar] [CrossRef]
- Galloway, S.E.; Paul, P.; MacCannell, D.R.; Johansson, M.A.; Brooks, J.T.; MacNeil, A.; Slayton, R.B.; Tong, S.; Silk, B.J.; Armstrong, G.L.; et al. Emergence of SARS-CoV-2 B.1.1.7 Lineage-United States, December 29, 2020–January 12, 2021. MMWR Morb. Mortal. Wkly. Rep. 2021, 70, 95–99. [Google Scholar] [CrossRef]
- Leung, K.; Shum, M.H.; Leung, G.M.; Lam, T.T.; Wu, J.T. Early transmissibility assessment of the N501Y mutant strains of SARS-CoV-2 in the United Kingdom, October to November 2020. Eurosurveillance 2021, 26, 2002106. [Google Scholar] [CrossRef]
- Pfefferle, S.; Gunther, T.; Kobbe, R.; Czech-Sioli, M.; Nörz, D.; Santer, R.; Oh, J.; Kluge, S.; Oestereich, L.; Peldschus, K.; et al. SARS Coronavirus-2 variant tracing within the first Coronavirus Disease 19 clusters in northern Germany. Clin. Microbiol. Infect. 2021, 27, 130.e5–130.e8. [Google Scholar] [CrossRef] [PubMed]
- European Centre for Disease Prevention and Control. Risk Assessment: SARS-CoV-2-Increased Circulation of Variants of Concern and Vaccine Rollout in the EU/EEA, 14th Update. Available online: https://www.ecdc.europa.eu/en/publications-data/covid-19-risk-assessment-variants-vaccine-fourteenth-update-february-2021 (accessed on 1 March 2021).
- Mwenda, M.; Saasa, N.; Sinyang, N.; Busby, G.; Chipimo, P.J.; Hendry, J.; Kapona, O.; Yingst, S.; Hines, J.Z.; Minchella, P.; et al. Detection of B.1.351 SARS-CoV-2 Variant Strain-Zambia, December 2020. MMWR Morb. Mortal. Wkly. Rep. 2021, 70, 280–282. [Google Scholar] [CrossRef] [PubMed]
- Munoz, M.; Patino, L.H.; Ballesteros, N.; Paniz-Mondolfi, A.; Ramírez, J.D. Characterizing SARS-CoV-2 genome diversity circulating in South American countries: Signatures of potentially emergent lineages? Int. J. Infect. Dis. 2021, 105, 329–332. [Google Scholar] [CrossRef] [PubMed]
- Maggi, F.; Novazzi, F.; Genoni, A.; Baj, A.; Spezia, P.G.; Focosi, D.; Zago, C.; Colombo, A.; Cassani, G.; Pasciuta, R.; et al. Imported SARS-COV-2 Variant P.1 Detected in Traveler Returning from Brazil to Italy. Emerg. Infect. Dis. 2021, 27, 1249–1251. [Google Scholar] [CrossRef]
- Collier, D.A.; De Marco, A.; Ferreira, I.; Meng, B.; Datir, R.P.; Walls, A.C.; Kemp, S.A.; Bassi, J.; Pinto, D.; Silacci-Fregni, C.; et al. Sensitivity of SARS-CoV-2 B.1.1.7 to mRNA vaccine-elicited antibodies. Nature 2021, 593, 136–141. [Google Scholar] [CrossRef]
- Coronavirus (COVID-19) Infection Survey Technical Article: Waves and Lags of COVID-19 in England, June 2021. Available online: https://www.ons.gov.uk/peoplepopulationandcommunity/healthandsocialcare/conditionsanddiseases/articles/coronaviruscovid19infectionsurveytechnicalarticle/wavesandlagsofcovid19inenglandjune2021 (accessed on 15 August 2021).
- Traini, M.C.; Caponi, C.; Ferrari, R.; De Socio, G.V. SARS-CoV-2 unreported cases in Italy: Analysis of serological survey and vaccination scenarios. Infect. Dis. Model. 2021, 6, 909–923. [Google Scholar] [CrossRef]
- How Many Cases of Covid-19 Are There? A Q&A. Available online: https://www.nuffieldtrust.org.uk/news-item/how-many-cases-of-covid-19-are-there-a-q-a (accessed on 15 August 2021).
- Campolieti, M. COVID-19 deaths in the USA: Benford’s law and under-reporting. J. Public Health 2021, fdab161. [Google Scholar] [CrossRef]
- Team, E.P.H.E.; Danis, K.; Fonteneau, L.; Danis, K.; Fonteneau, L.; Georges, S.; Daniau, C.; Bernard-Stoecklin, S.; Domegan, L.; O’Donnell, J.; et al. High impact of COVID-19 in long-term care facilities, suggestion for monitoring in the EU/EEA, May 2020. Eurosurveillance 2020, 25, 2000956. [Google Scholar]
- Horwitz, L.I.; Jones, S.A.; Cerfolio, R.J.; Francois, F.; Greco, J.; Rudy, B.; Petrilli, C.M. Trends in COVID-19 Risk-Adjusted Mortality Rates. J. Hosp. Med. 2021, 16, 90–92. [Google Scholar] [CrossRef]
- Gandhi, M.; Rutherford, G.W. Facial Masking for Covid-19-Potential for “Variolation” as We Await a Vaccine. N. Engl. J. Med. 2020, 383, e101. [Google Scholar] [CrossRef]
Figure 1.
Predictions for the number of deaths in Italy. Comparison of the predictions of researchers’ formulae for the number of reported deaths using data only until 1 May 2020, versus the actual data until 1 August 2020 (predictions for 92 days). The thick blue data-points depict the data used for calibrating the formulae and the red data-points depict the data used for checking the predictions of the 3 formulae.

Figure 2.
Comparisons between the actual reported cases and actual deaths for the first and second waves in Portugal vs. the fitted logistic and rational formulae. The data were fitted up to 27 December 2020, the last day before the first appearance of the UK lineage. The third wave in Portugal began on 28 December 2020.

Figure 3.
The rate of the (a) reported infected cases and (b) total number of deceased (dN/dt) for the first and second waves in Spain. The shaded areas indicate the lockdown periods.
Figure 3.
The rate of the (a) reported infected cases and (b) total number of deceased (dN/dt) for the first and second waves in Spain. The shaded areas indicate the lockdown periods.

Figure 4.
The function v(t) for the entire population of Germany, Greece, Spain, UK, Italy, Czechia, France, and Belgium for the first and second waves.
Figure 4.
The function v(t) for the entire population of Germany, Greece, Spain, UK, Italy, Czechia, France, and Belgium for the first and second waves.


Table 1.
Stabilization values for the function v(t) for the first and second waves, for various countries, for all population.
Table 1.
Stabilization values for the function v(t) for the first and second waves, for various countries, for all population.
| All Population | 1st Wave | 2nd Wave | ||
|---|---|---|---|---|
| Date | v(t) (%) | Date | v(t) (%) | |
| Germany | 30/June/2020 | 4.86 | 26/November/2020 | 1.50 |
| Greece | 04/July/2020 | 6.18 | 02/January/2021 | 3.95 |
| Spain | 30/June/2020 | 11.72 | 25/December/2020 | 1.49 |
| UK | 30/June/2020 | 15.24 | 19/September/2020 | 2.55 |
| Italy | 30/June/2020 | 14.77 | 22/December/2020 | 2.54 |
| Czechia | 15/July/2020 | 3.33 | 31/December/2020 | 2.04 |
| France | 15/July/2020 | 18.62 | 18/December/2020 | 1.46 |
| Belgium | 14/July/2020 | 15.77 | 19/December/2020 | 1.78 |
Publisher’s Note: MDPI stays neutral with regard to jurisdictional claims in published maps and institutional affiliations. |
© 2022 by the authors. Licensee MDPI, Basel, Switzerland. This article is an open access article distributed under the terms and conditions of the Creative Commons Attribution (CC BY) license (https://creativecommons.org/licenses/by/4.0/).
Share and Cite
MDPI and ACS Style
Fokas, A.S.; Dikaios, N.; Tsiodras, S.; Kastis, G.A. Simple Formulae, Deep Learning and Elaborate Modelling for the COVID-19 Pandemic. Encyclopedia 2022, 2, 679-689. https://doi.org/10.3390/encyclopedia2020047
AMA Style
Fokas AS, Dikaios N, Tsiodras S, Kastis GA. Simple Formulae, Deep Learning and Elaborate Modelling for the COVID-19 Pandemic. Encyclopedia. 2022; 2(2):679-689. https://doi.org/10.3390/encyclopedia2020047
Chicago/Turabian StyleFokas, Athanassios S., Nikolaos Dikaios, Sotirios Tsiodras, and George A. Kastis. 2022. "Simple Formulae, Deep Learning and Elaborate Modelling for the COVID-19 Pandemic" Encyclopedia 2, no. 2: 679-689. https://doi.org/10.3390/encyclopedia2020047