Review

Progress of Space Charge Research on Oil-Paper Insulation Using Pulsed Electroacoustic Techniques

1
College of Engineering and Technology, Southwest University, Beibei, Chongqing 400715, China
2
School of Electronics and Computer Science, University of Southampton, Highfield Campus, Southampton SO17 1BJ, UK
3
State Grid Chongqing Electric Power Corperation Chongqing Electric Power Research Institute, Chongqing 401123, China
*
Author to whom correspondence should be addressed.
Energies 2016, 9(1), 53; https://doi.org/10.3390/en9010053
Submission received: 19 November 2015 / Revised: 22 December 2015 / Accepted: 12 January 2016 / Published: 18 January 2016
(This article belongs to the Special Issue Power Transformer Diagnostics, Monitoring and Design Features)

Abstract

:
This paper focuses on the space charge behavior in oil-paper insulation systems used in power transformers. It begins with the importance of understanding the space charge behavior in oil-paper insulation systems, followed by the introduction of the pulsed electrostatic technique (PEA). After that, the research progress on the space charge behavior of oil-paper insulation during the recent twenty years is critically reviewed. Some important aspects such as the environmental conditions and the acoustic wave recovery need to be addressed to acquire more accurate space charge measurement results. Some breakthroughs on the space charge behavior of oil-paper insulation materials by the research team at the University of Southampton are presented. Finally, future work on space charge measurement of oil-paper insulation materials is proposed.

1. Introduction

High Voltage Direct Current (HVDC) systems have been used for energy transmission since the 1950s. In comparison with the conventional transformers used in HVAC transmission systems, converter transformers have a more complex structure and operate under more severe conditions. These severe conditions include the overvoltage from lightning and switching, the combined AC and DC voltage, and the polarity reversal applied at the DC side windings.
The reliability and the sustainable operation of the converter transformer are of great significance. The reason is that the failure of the converter transformer could lead to the breakdown of the power supply, resulting in large economic losses. The main insulation of the converter transformer normally consists of insulation oil and cellulose paper. The aging of insulation materials cannot be avoided under the complex operation conditions mentioned above. According to reports, half of transformer failures result from the insulation aging phenomenon [1,2]. The space charge density is closely related to the aging status of the insulation material. Therefore, the amount of space charge could be an indicator of the aging status of insulation materials. The space charge formation could lead to the distortion of the electric field distribution and speed up the aging rate. Considering the space charge serves an important role correlated with the conduction and breakdown phenomena, therefore, the topic of space charge is widely studied.
In this paper, firstly, the recent twenty years of research progress have been critically reviewed. Secondly, some aspects have been proposed with special attention on how to achieve more accurate measurements of space charge dynamics in oil-paper insulation materials. Thirdly, recent researches conducted by the University of Southampton on oil-paper insulation materials has been critically analyzed. Finally, future work will be proposed to predict the future research trends of space charge behavior in the oil-paper insulation materials.

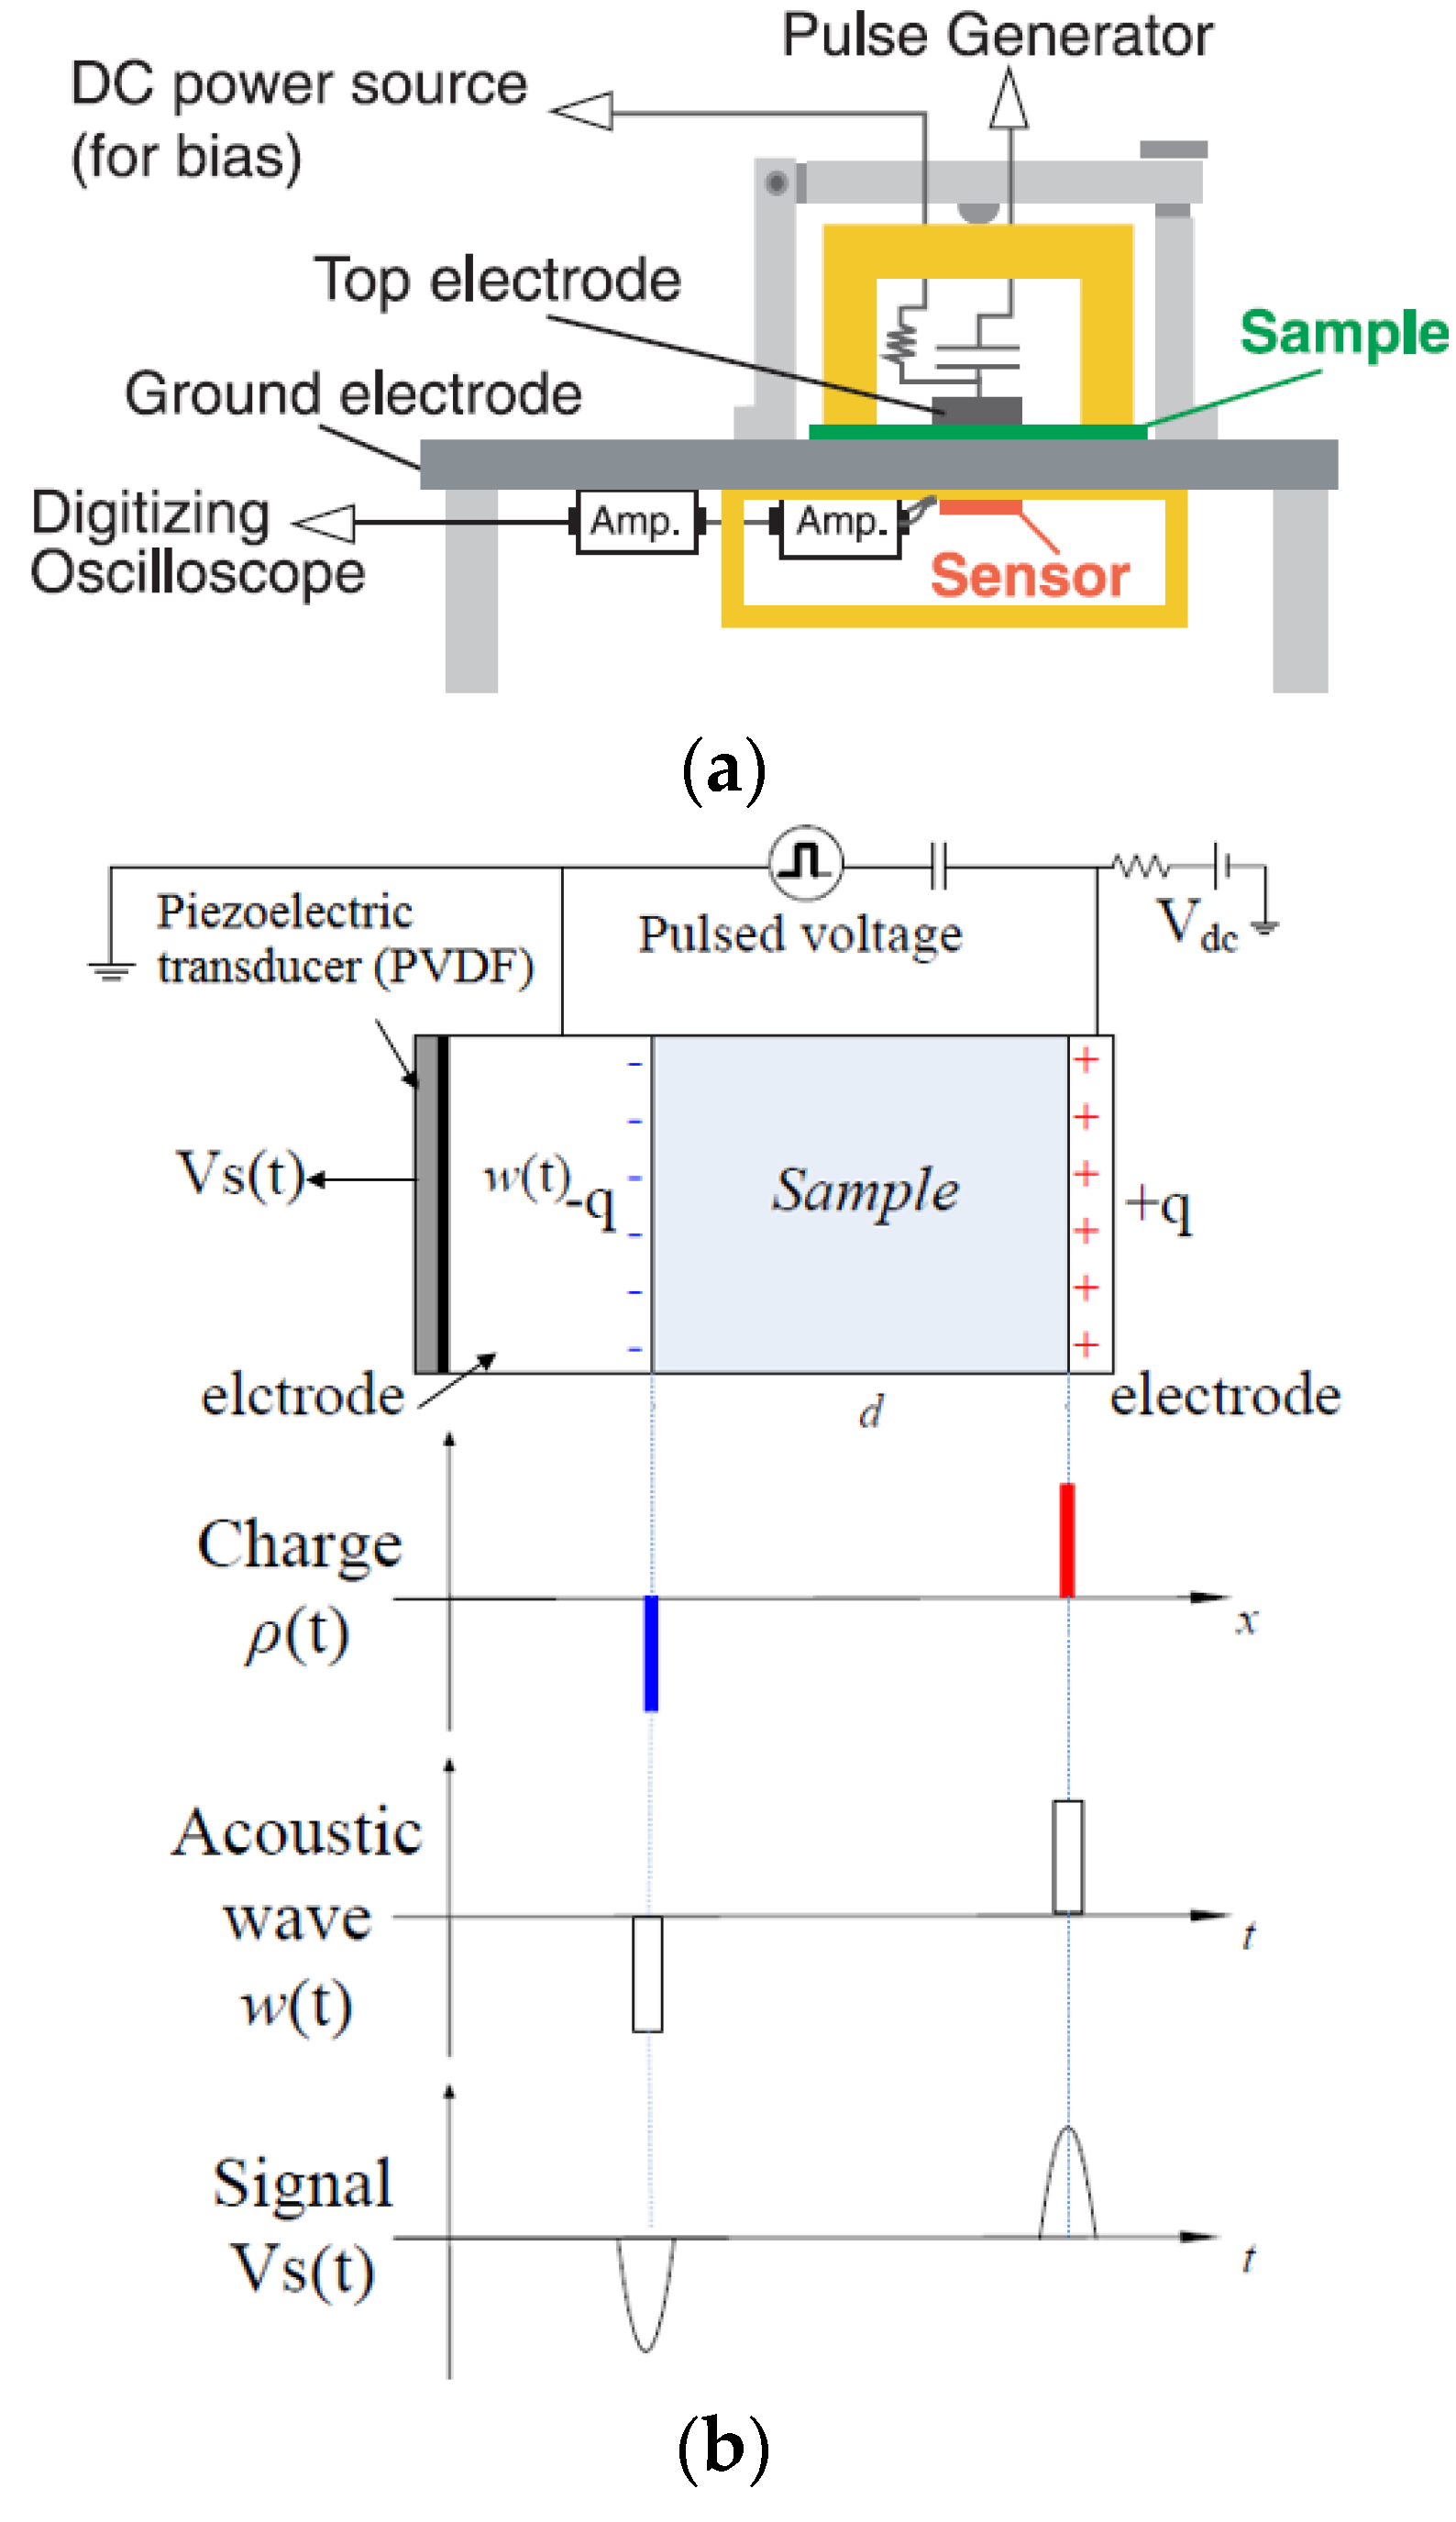
2. PEA Technique in Space Charge Test

The pulsed electroacoustic (PEA) technique was developed in the 1980s. It can measure the space charge behavior during the poling process, i.e., under the stress of the electric field, or during depolarization, i.e., after the removal of the electric field. Therefore, it can provide essential information on space charge dynamics within the insulation materials [3]. In comparison to other traditional methods, the PEA method offers a nondestructive way to observe charge behavior in dielectric materials, making it possible to understand the physical processes behind the phenomena and to minimize the risks of partial discharge and electrical breakdown of insulation materials. Therefore, it could serve as a possible method to select better insulation materials with the consideration of surface states.
The details of a PEA system can be found in the literature [4], and the basic set-up and schematic diagram are shown in Figure 1. Generally speaking, after the application of the electric pulse on the insulation materials between two electrodes, acoustic waves are produced at charge locations at both electrodes and inside the test material. The acoustic signals are detected by a piezo-electric sensor at the back side of one electrode. The electric signal obtained in the time domain represents the charge distribution [5]:
V s ( t ) = K [ σ 1 + σ 2 + v sa × T × ρ ( x = v sa × t ) ] × e P
where σ 1 and σ 2 are the surface charges at the electrodes, v sa is the sound velocity through the material, T is the pulse width, ρ ( x ) is the bulk charge and e P is the pulse amplitude.
Figure 1. Basic set-up (a) and schematic diagram (b) of PEA method.
Energies 09 00053 g001

3. Research Progress

The earliest studies on space charge in oil-paper insulation were performed by the ABB Corporate Research Center in Sweden in 1994. Experiments were performed by using the pressure wave propagation (PWP) method. However, the research results were not so good because of the limitations of the test equipment available at that time [6,7,8]. Since 1997, a few studies have been performed on the space charge in oil-paper insulation using the PEA method. Morshuis and Jeroense [9] made some important space charge tests and discussions on oil-impregnated insulation paper. Ciobanu in 2002 suggested that the evolution of PEA derived parameters, such as charge density, apparent trap-controlled mobility and variation of trap depth distribution, can be successfully used for promoting criteria for the best choice of oil-paper insulation technology for DC cable applications [10]. Since 2008, much more research on space charge behaviors in oil-paper insulation has been reported. Therefore, the research progress in recent years has been critically reviewed from the applied voltage, temperature, moisture, aging, interfaces, polarity reversal, and AC electric field perspectives.

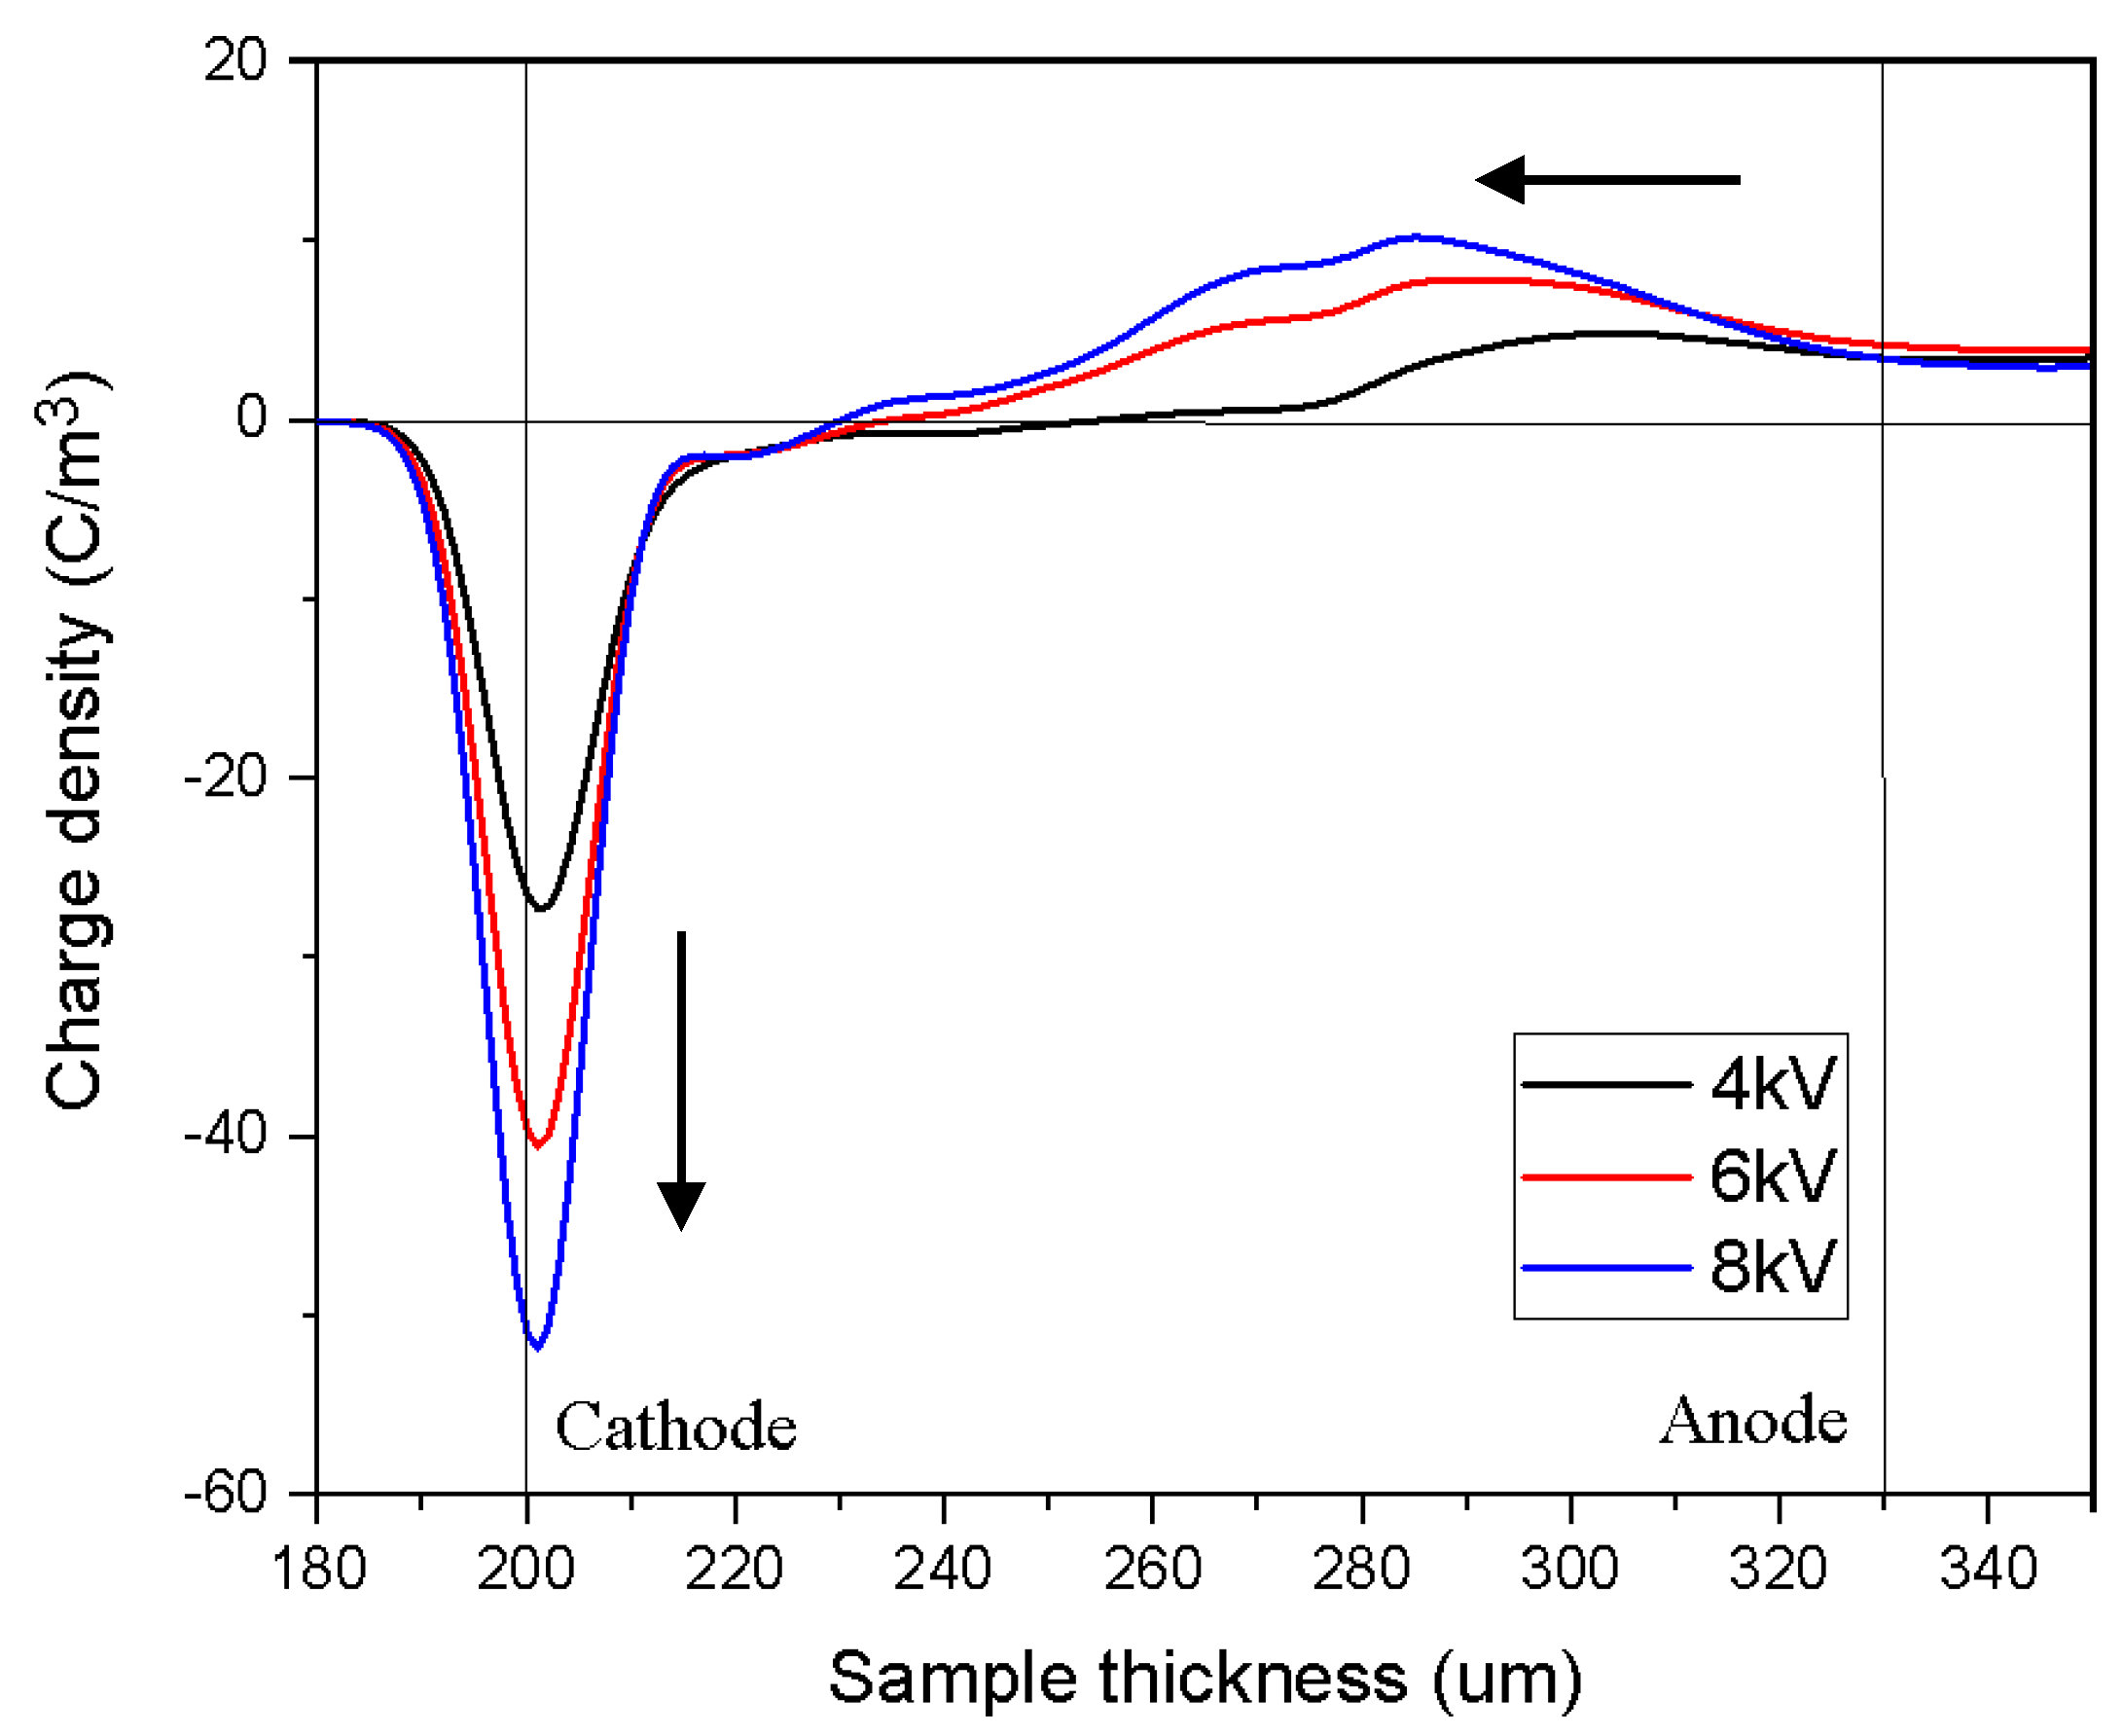
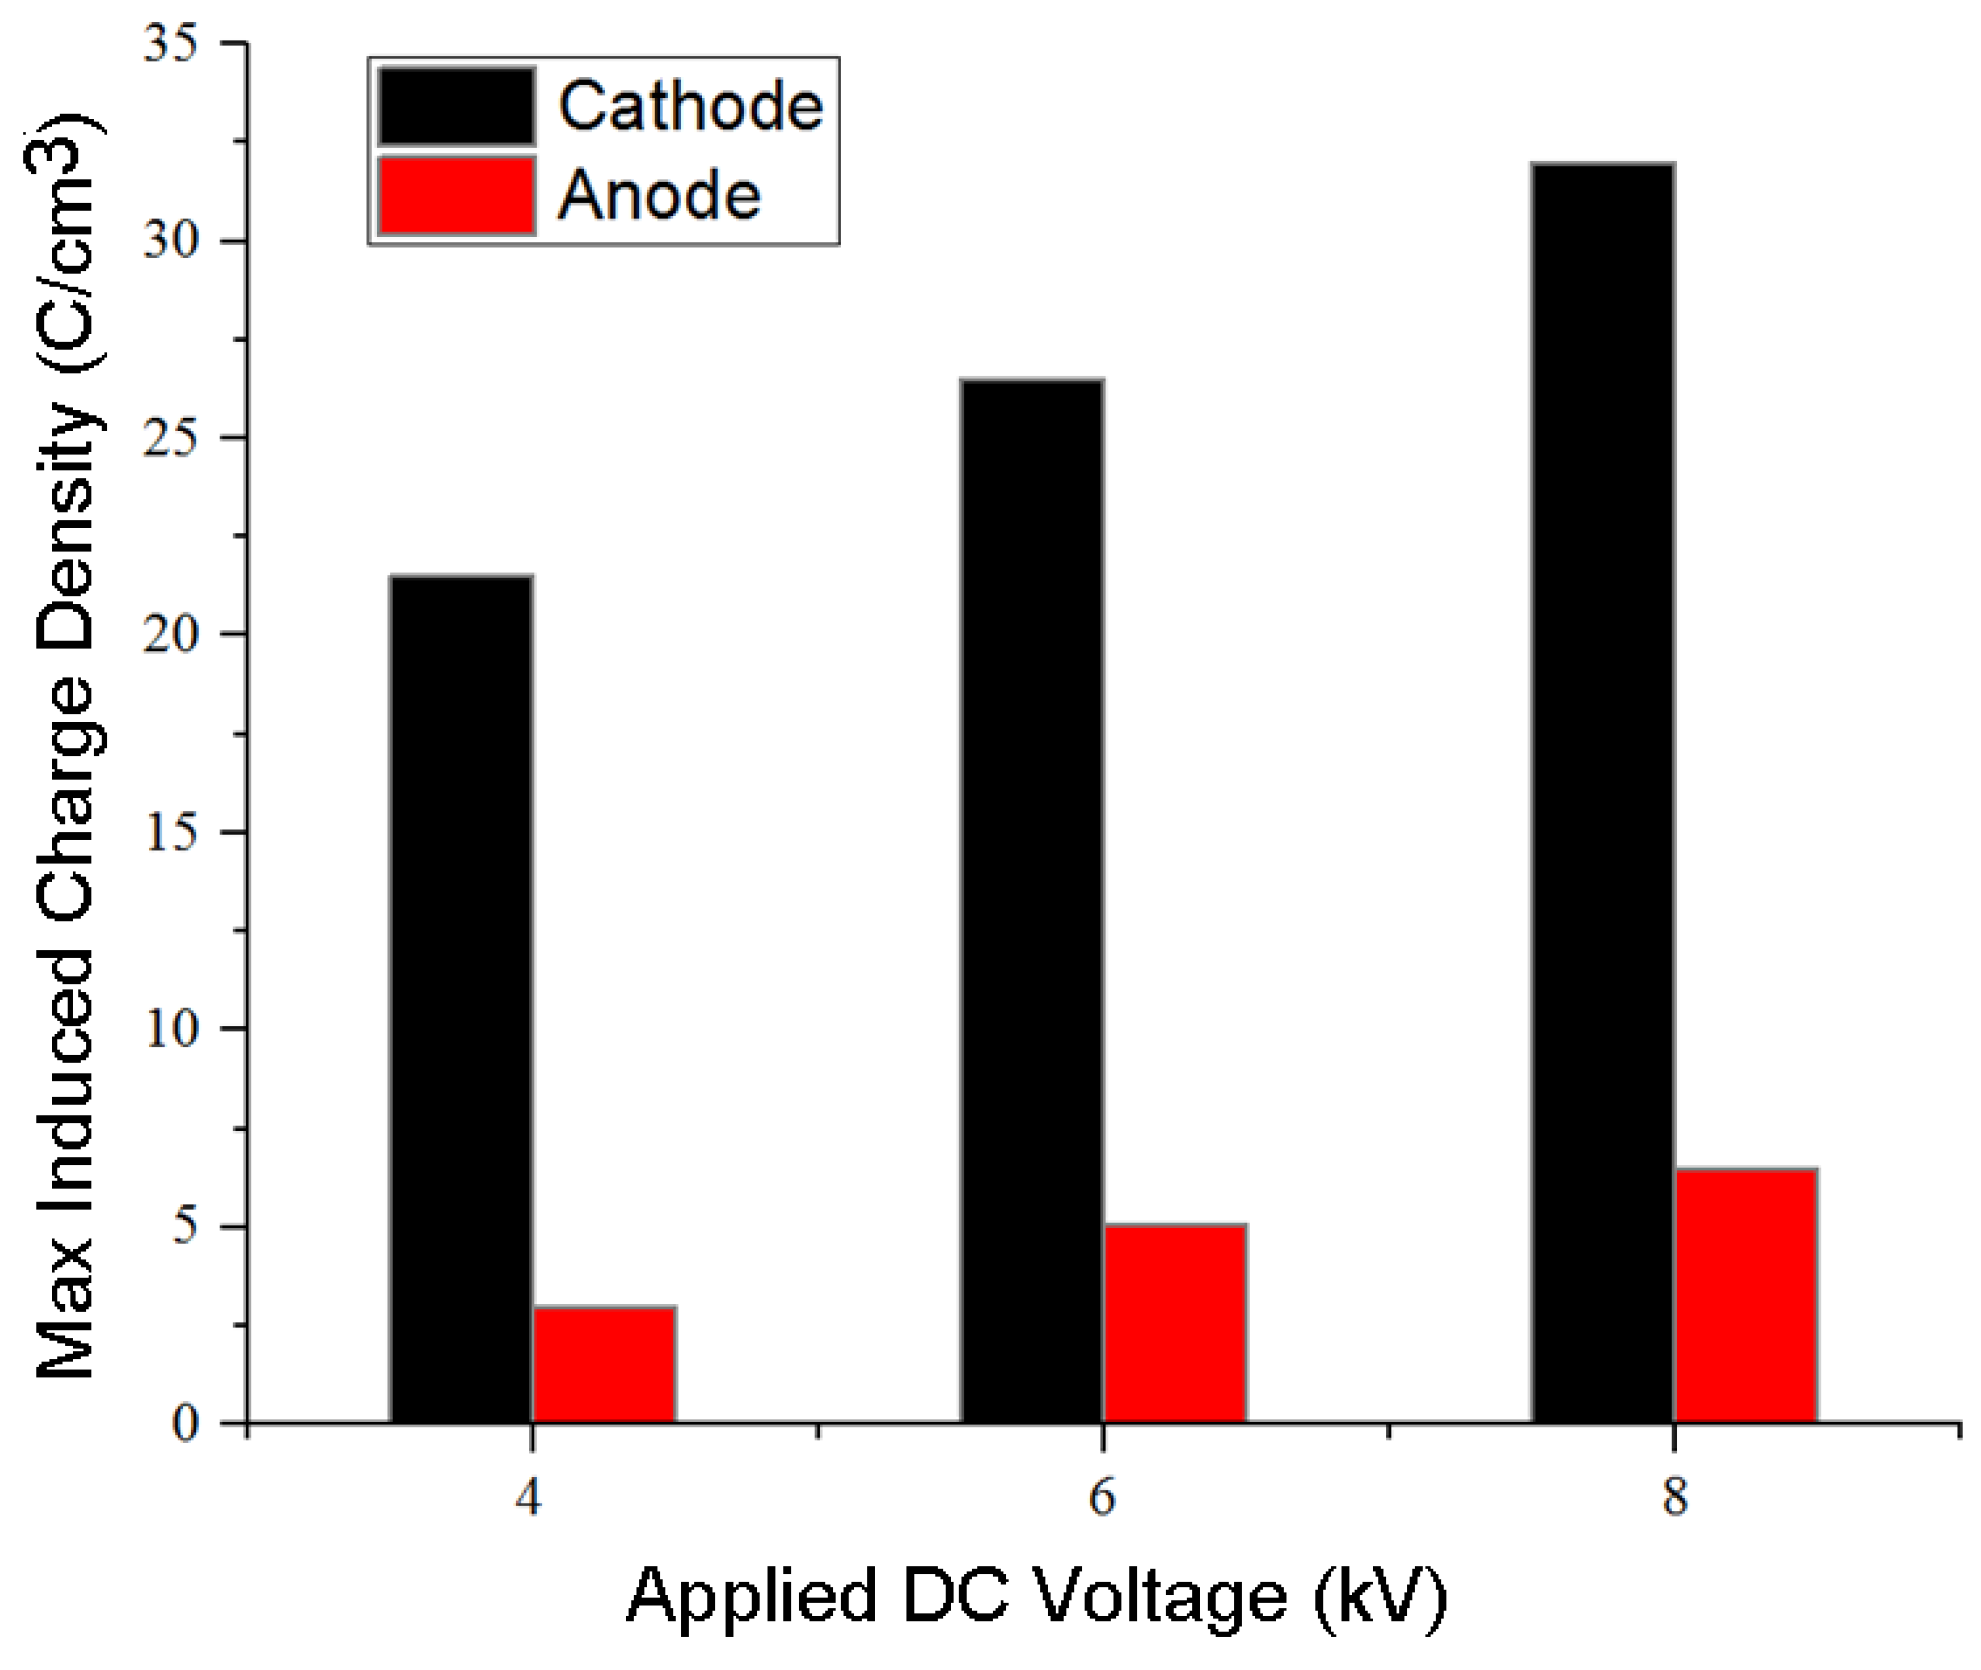
3.1. Applied Voltage

In general, at a relatively low temperature (20 °C), the applied DC voltage had a great influence on the amount of charge density as well as the depth of charge injection (Figure 2). With the increase of applied DC voltage, the amount of charge density and charge injection depth increase within the bulk sample.
Figure 2. Space charge dynamics at different DC electric fields (volt-on 30 min at 20 °C, three layers, about 130 μm in total sample thickness).
Energies 09 00053 g002
The volt-off tests (instantaneous power off under different applied DC voltages) verified that with the increase of the applied voltage, a large amount of charges at the electrodes were induced by the higher amount of homo-charge injection (Figure 3). Moreover, the real injection charges also had an increasing trend with the increase of the applied voltage.
Figure 3. Max induced charge density on the electrodes after instantaneous power off under different DC voltages at 20 °C (volt-off).
Energies 09 00053 g003

3.2. Test Temperature

A series of measurements were carried out where an oil-paper insulation system was subjected to different test temperatures (from 15 °C to 60 °C) [11,12,13,14]. The results showed that the temperature had a limited effect on the threshold voltage of the space charge. Under different test temperatures (less than 60 °C), space charges injection took place at nearly the same voltage level. However, the temperature can have a greater influence on the distribution and mobility of space charge within oil-paper samples. The higher temperature could lead to higher space charge injection mobility and injection depth. The space charge decay process also satisfies the previous rule.
Besides, comparing the peak value of charge density at the cathode under different DC voltages and temperatures (Figure 4), it was clear that both the applied voltage and testing temperature have a great effect on charge density at the cathode, which might occur at the anode as well. When the temperature came to 60 °C and the applied DC voltage was 8 kV (about 60 kV/mm), the charge density at the cathode reached the maximum value. This indicated that the combination of a high temperature and a high level of electric stress may result in fatal impacts to the performance of the oil-paper insulation system.
Figure 4. Max charge density on the negative electrode under different DC voltages and temperatures (three layers, about 130 μm in total thickness).
Energies 09 00053 g004

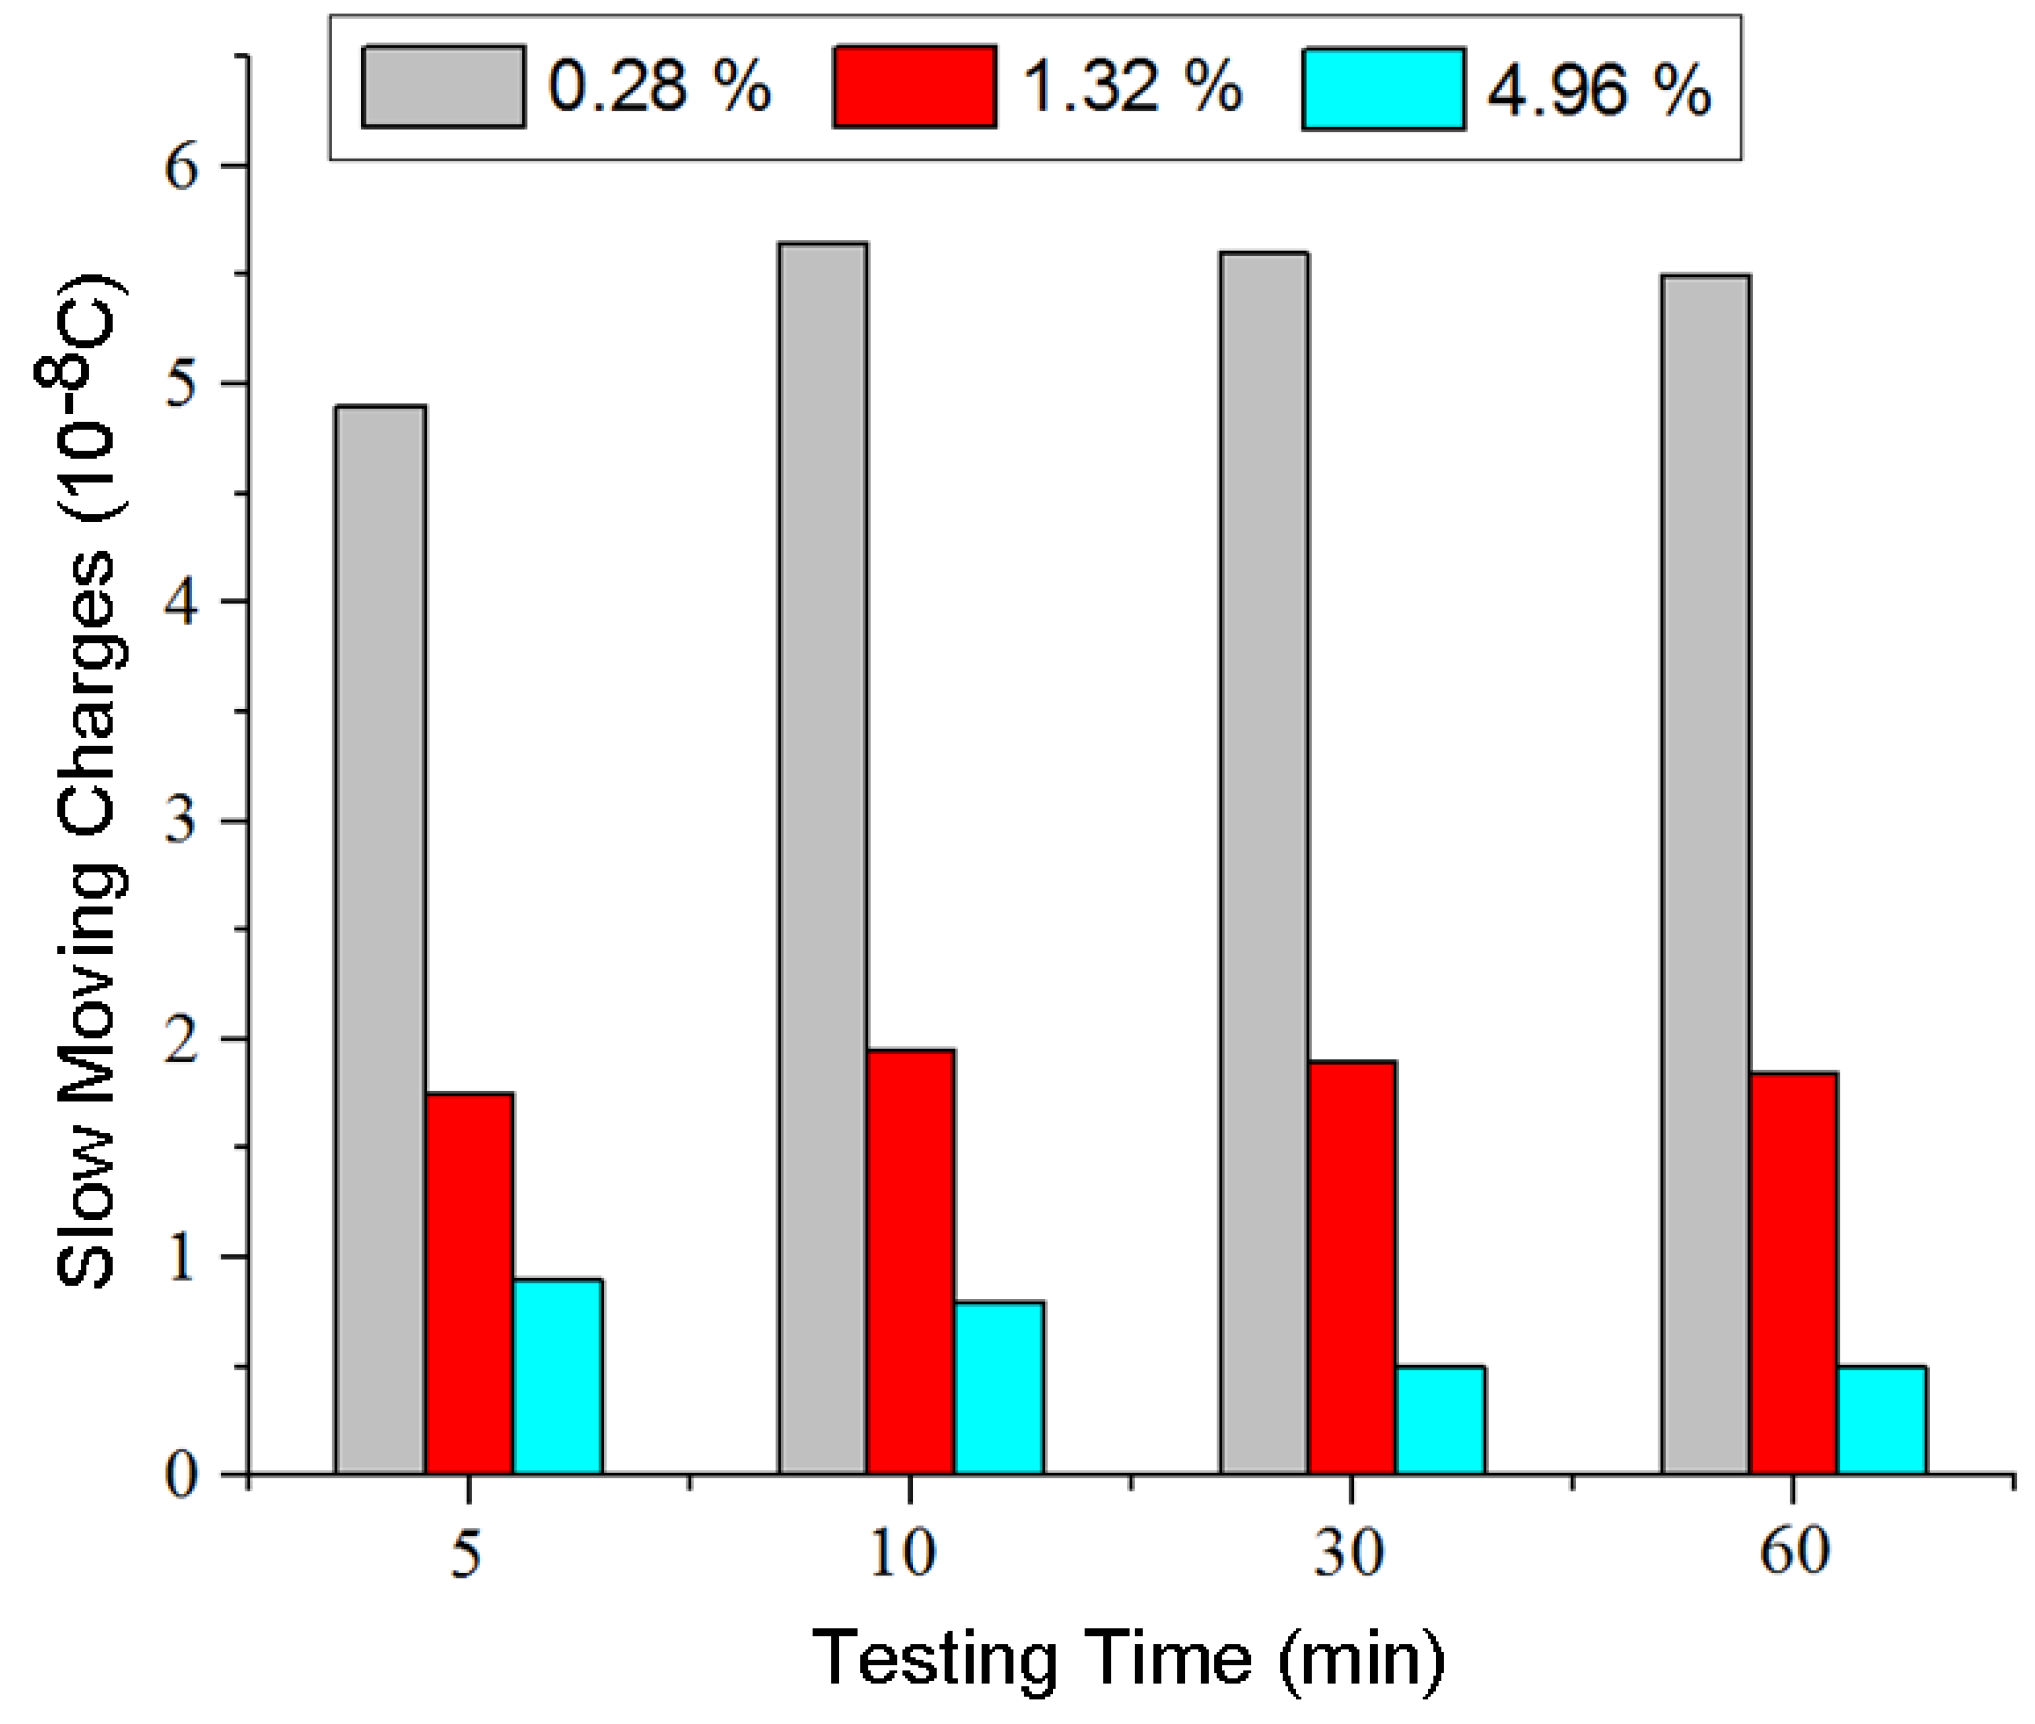
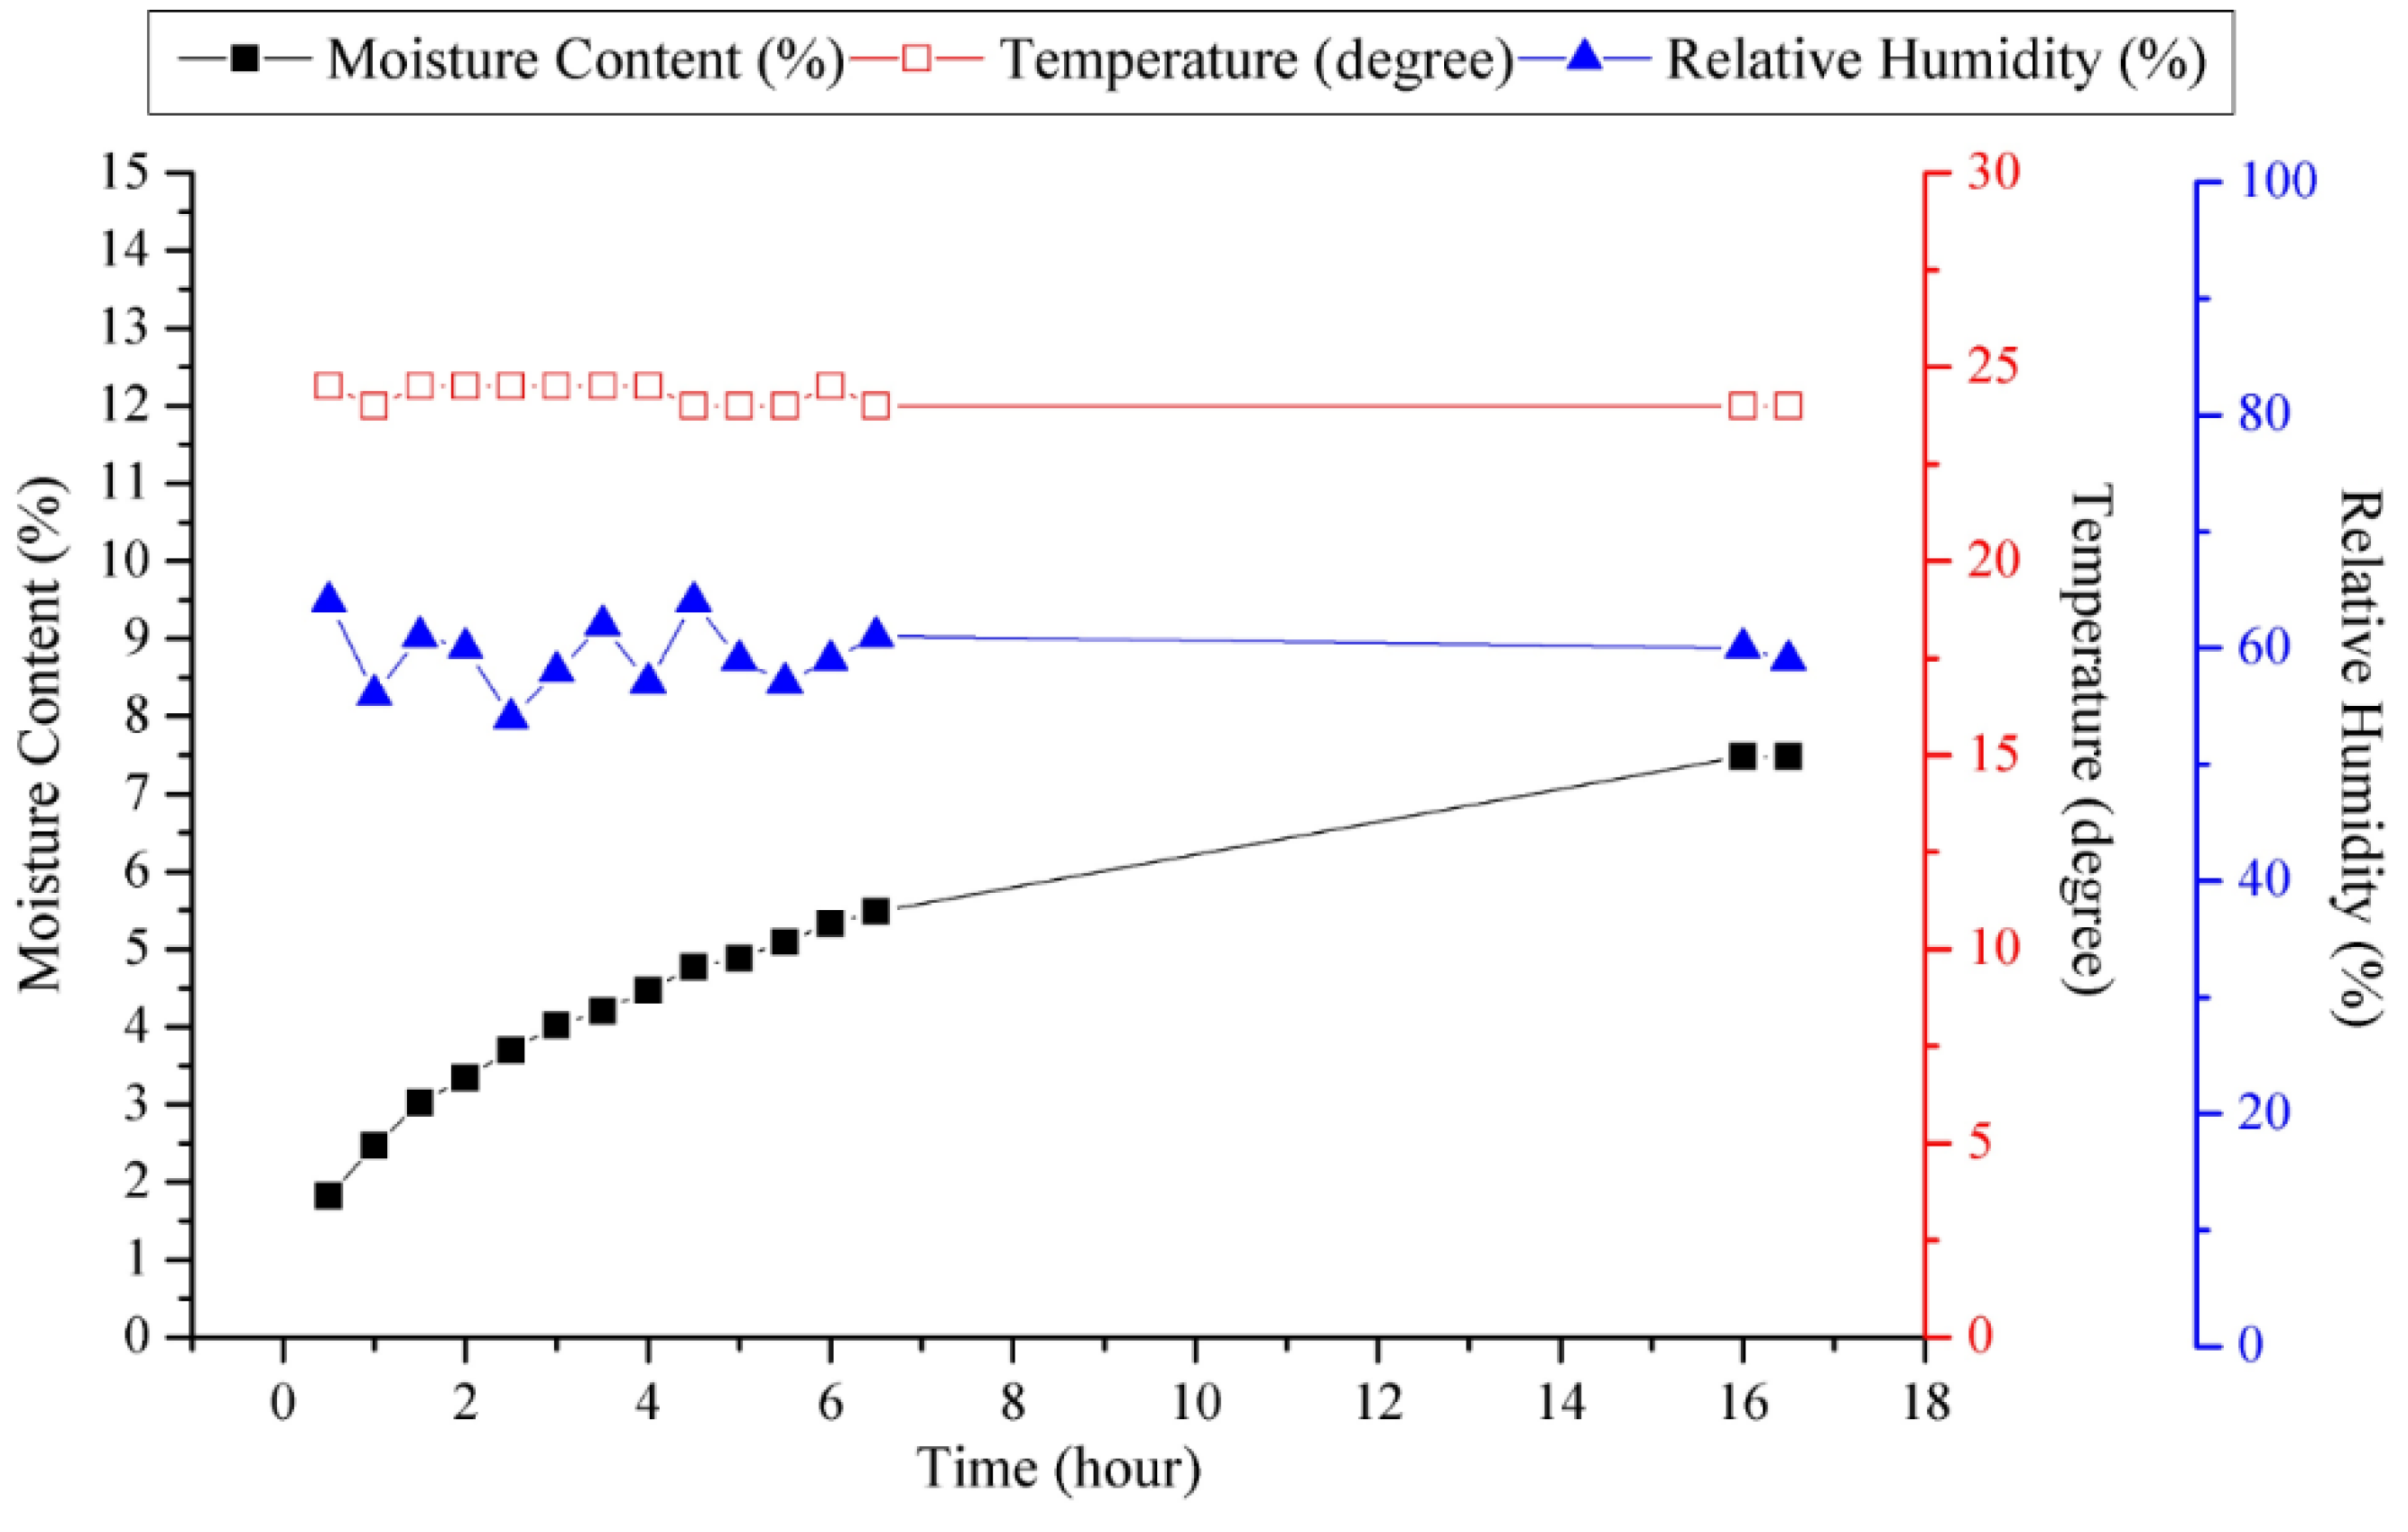
3.3. Moisture Content
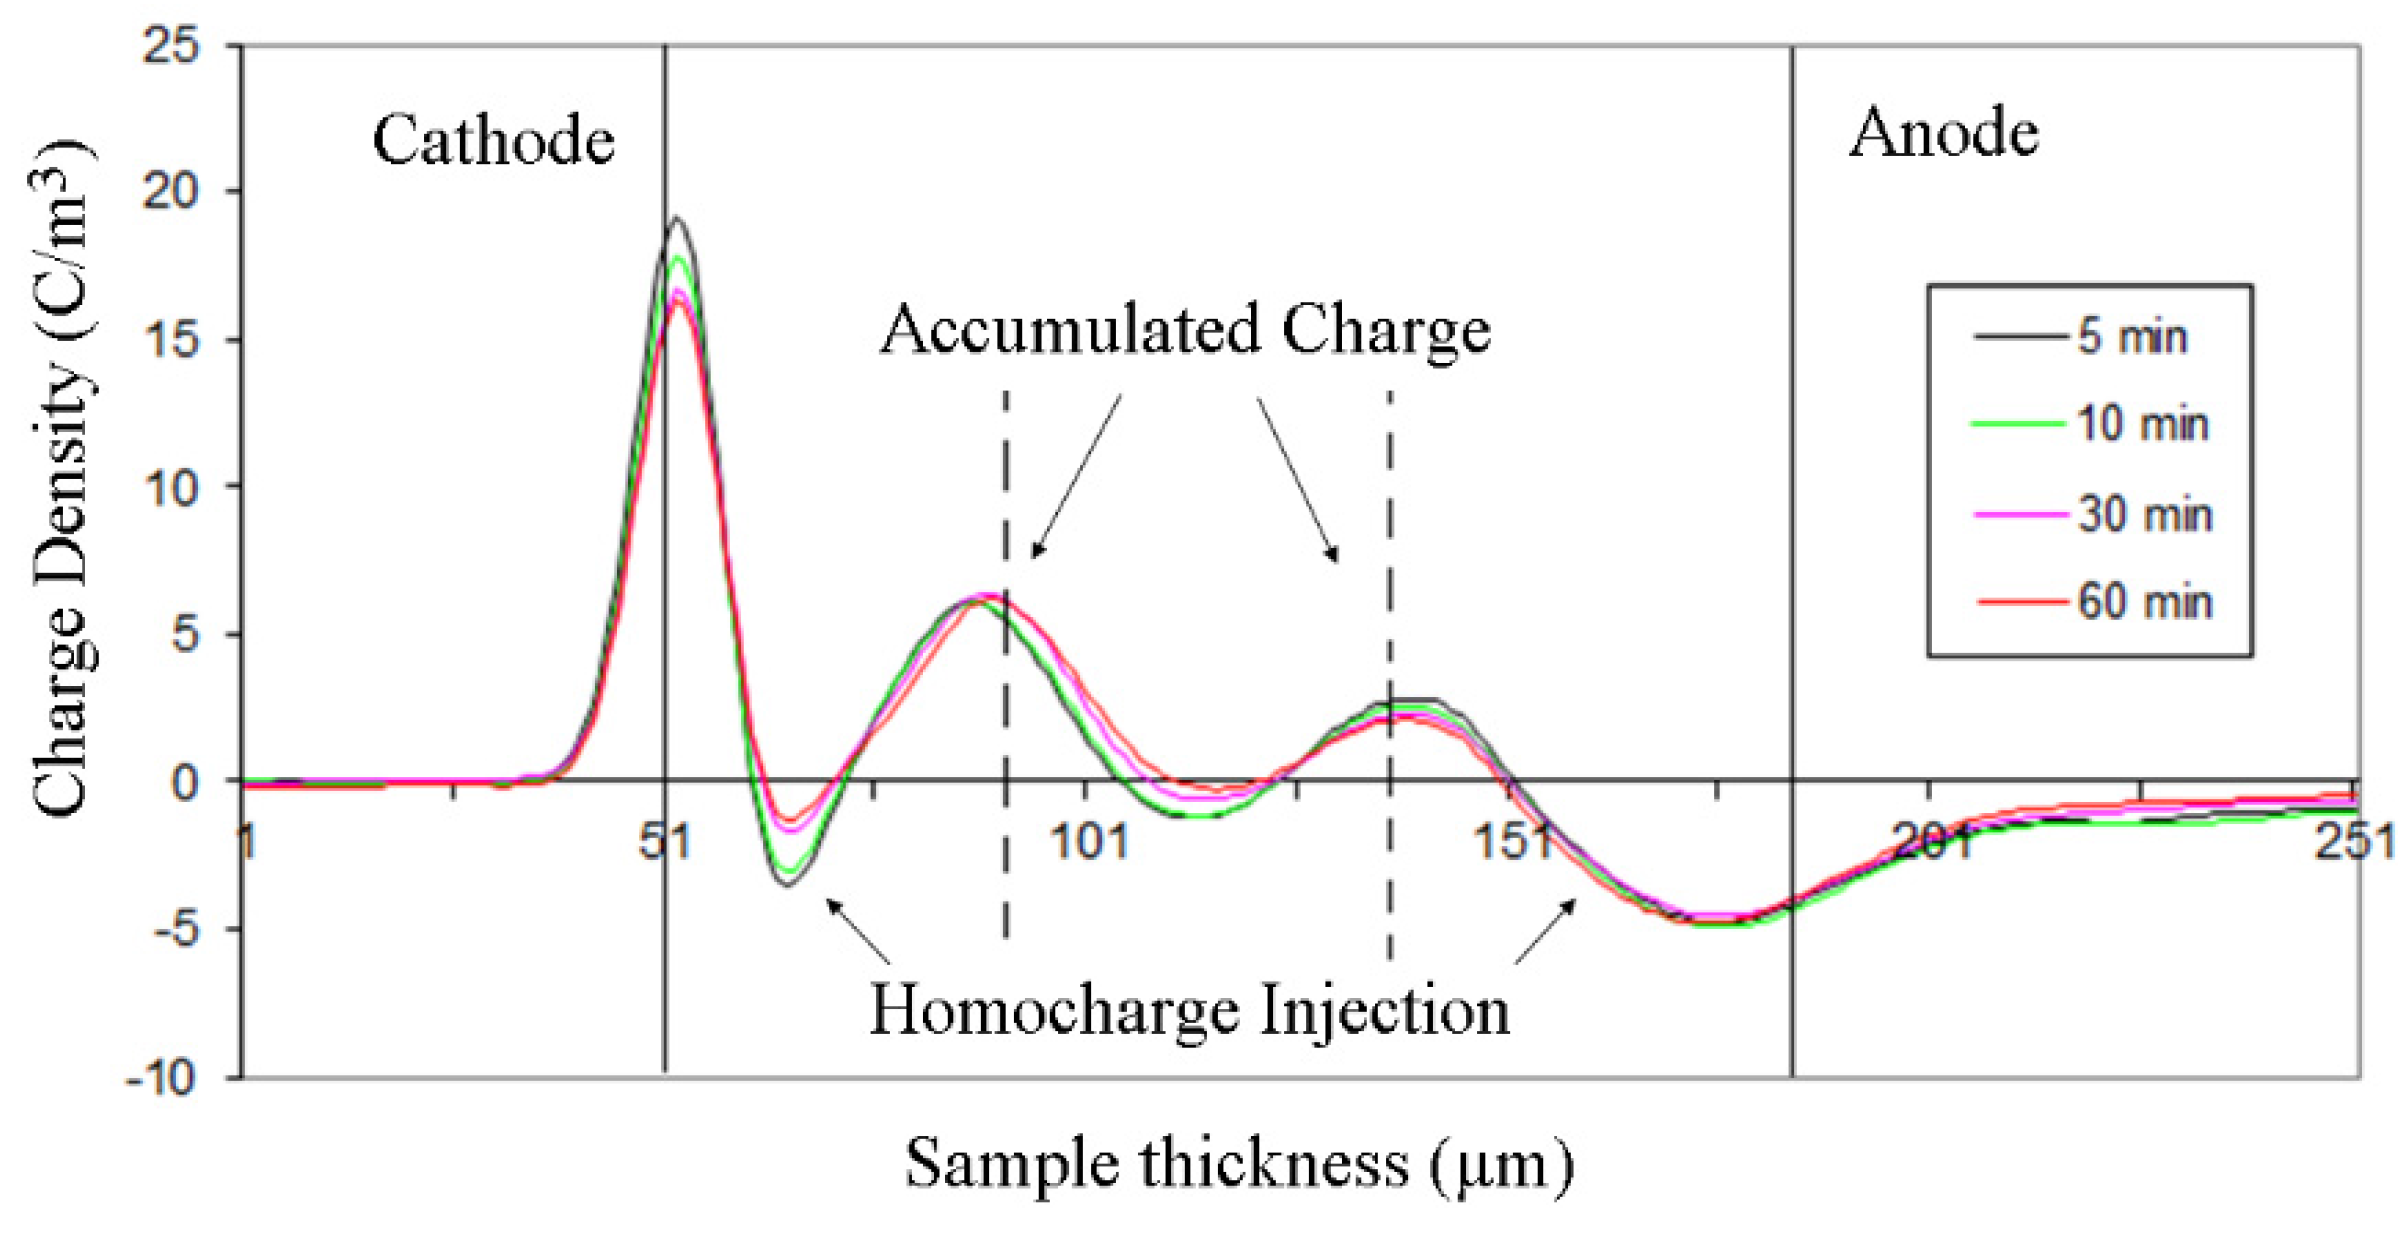
Normally, in industrial applications, the moisture content in oil-paper insulation in power transformers should be controlled to quite a low level like less than 0.5% by weight by vacuum drying and preprocessing of the oil and paper. The main reason is that moisture is one of the most important parameters which influences the properties of transformer insulation. It has a detrimental effect on oil-paper insulation life by lowering the electrical breakdown strength and thermal endurance, resulting in an increased risk of dielectric breakdown. Moisture is recognized as “enemy number one” after the temperature [4].
The space charge dynamics varied in three layers of the oil-paper insulation system with three different moisture concentrations (0.28%, 1.32% and 4.96%), which were investigated using the PEA technique under 6 kV (about 28.5 kV/mm) [15]. Within the frequency range from 10−2 Hz to102 Hz, the oil conductivity of oil-impregnated paper increased significantly with the increase of moisture content. It has been proved that the moisture has a great effect on the charge distribution in a multi-layer oil-paper insulation system. A higher moisture content of the oil-paper sample could lead to a larger positive and negative charge injection. There are fewer slow moving charges trapped in the sample due to higher conductivity (Figure 5). Besides, the total absolute amount of fast moving charges in the sample also has a close relation with the moisture content.
Figure 5. Total absolute amount of slow moving charges in the oil-paper sample with different moisture content under the volt-off condition (6 kV) at 15 °C.
Energies 09 00053 g005
Zhou studied five kinds of oil-paper with moisture concentrations of 1%, 3%, 5%, 7% and 9% at 25 °C (10 kV/mm) [16]. Figure 6 illustrates the space charge distribution profiles of unaged samples with different moisture concentrations at 30 min of polarization. It is suggested that the effect of moisture changes with the variation of contents itself, when the moisture concentration was less than 7%, a higher moisture concentration was helpful for the equilibrium establishment of space charge, while if it were larger than 9%, it would affect results contrarily [16].
Figure 6. Space charge distribution curves of unaged samples with different moisture concentrations at the end of 30 min polarization [16].
Energies 09 00053 g006

3.4. Ageing

Insulation life is normally determined by measuring the time from the beginning of service to final breakdown. During operation, a deterioration in the chemical, physical and electrical properties of an insulation material is termed as ageing, which reduces the operation life of the insulation material. For years, the single thermal stress ageing (accelerated ageing) test procedures have proved to have been useful and can be performed in the laboratory to deduce the lifespan of liquid and solid insulation systems [17,18]. Thus, based on the ageing experiment, the effects of material ageing on space charge behaviors were investigated.

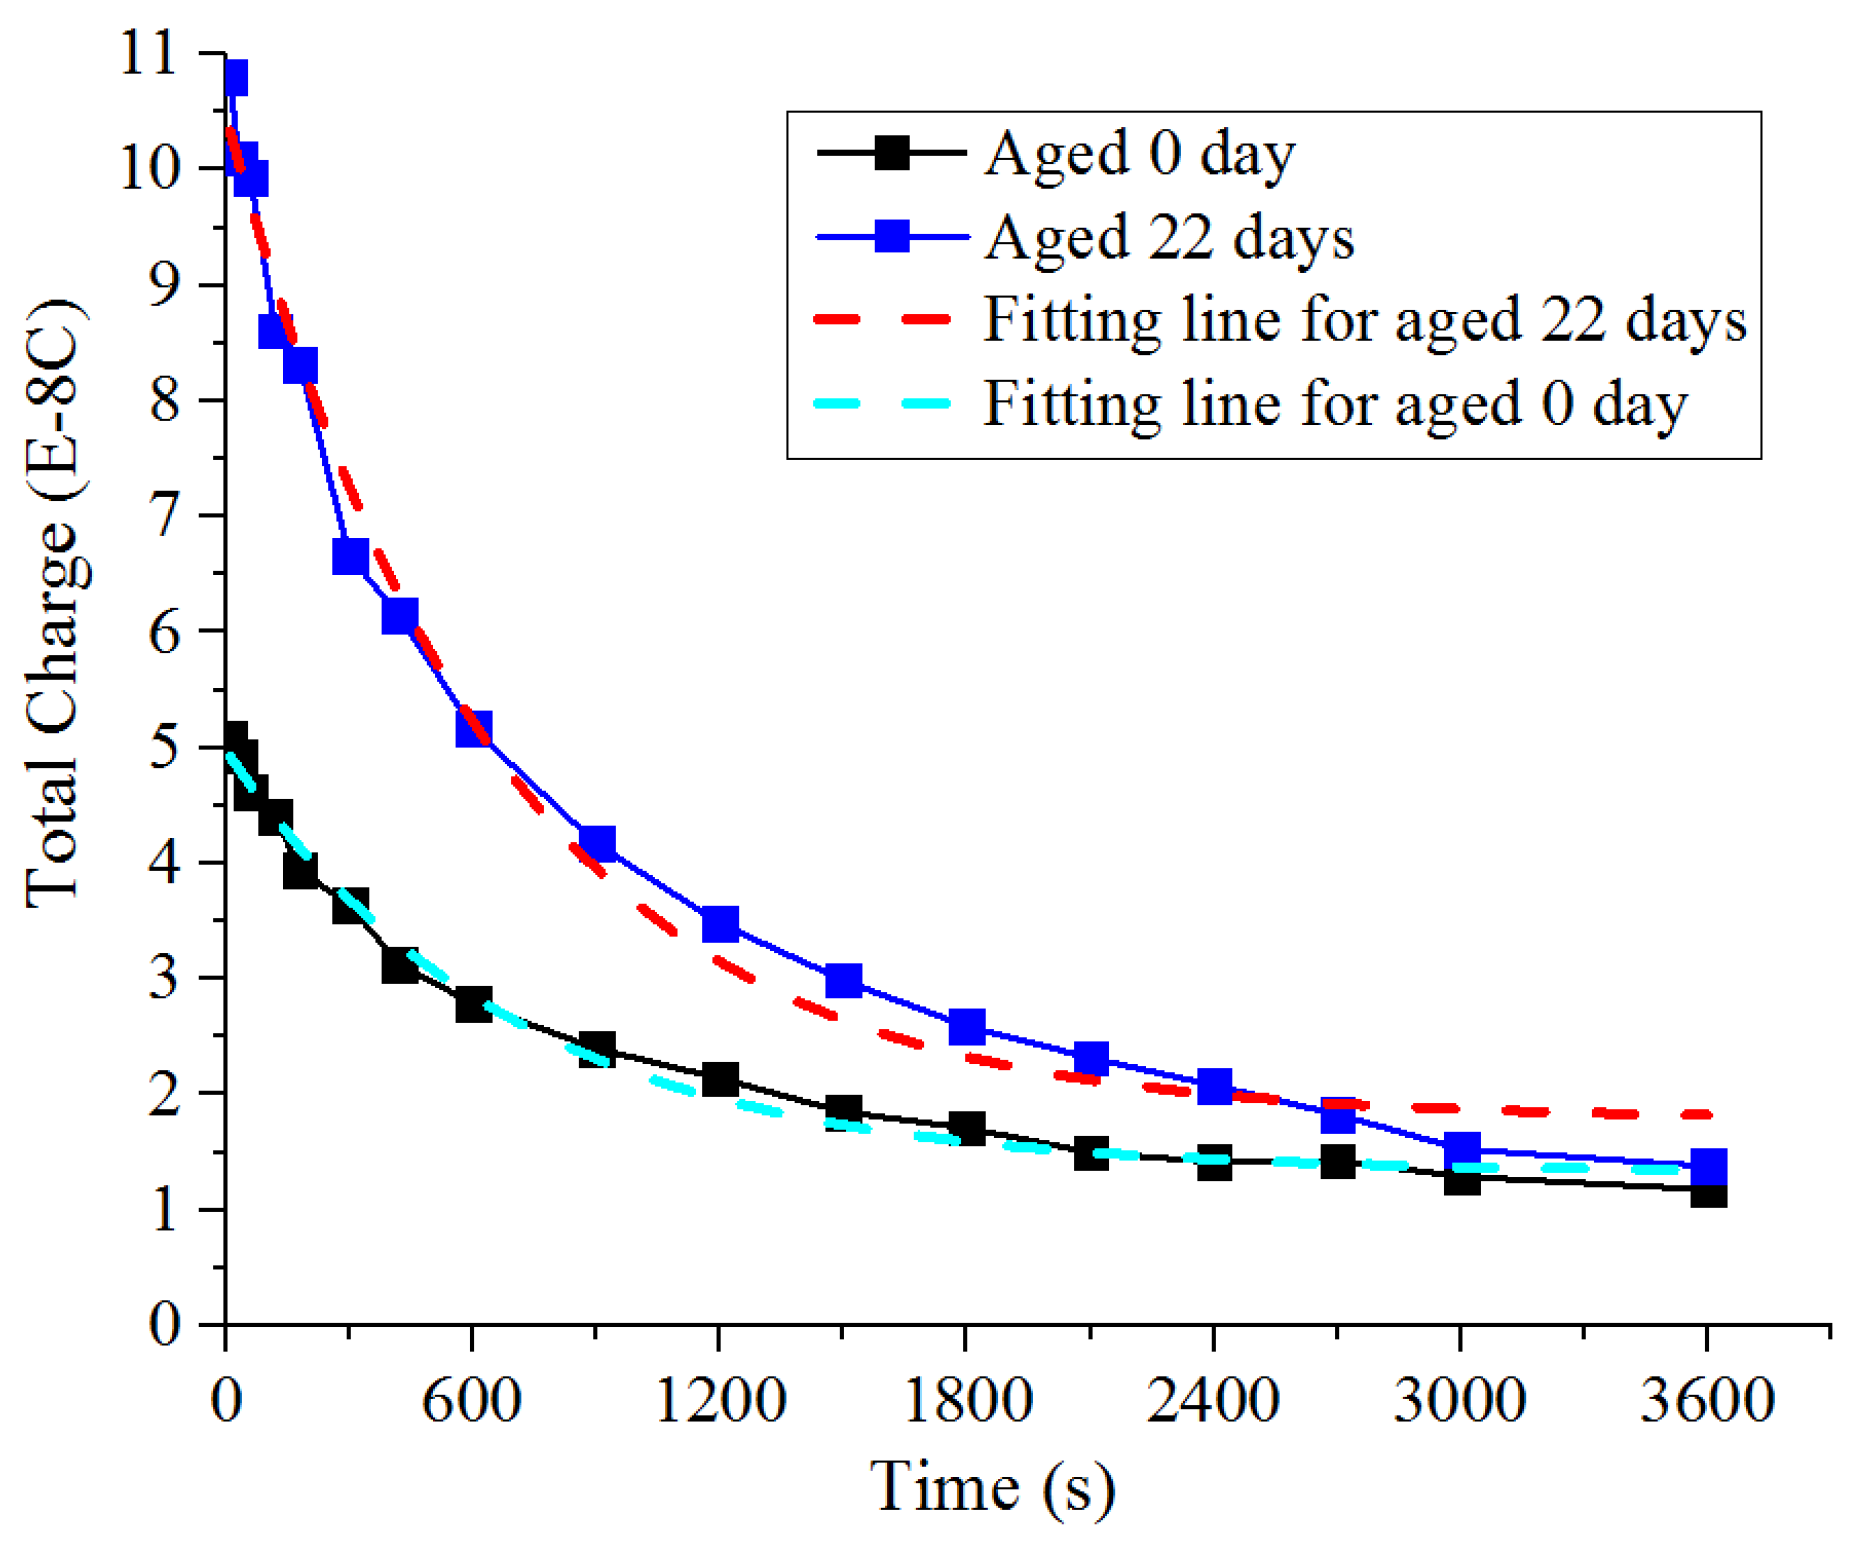
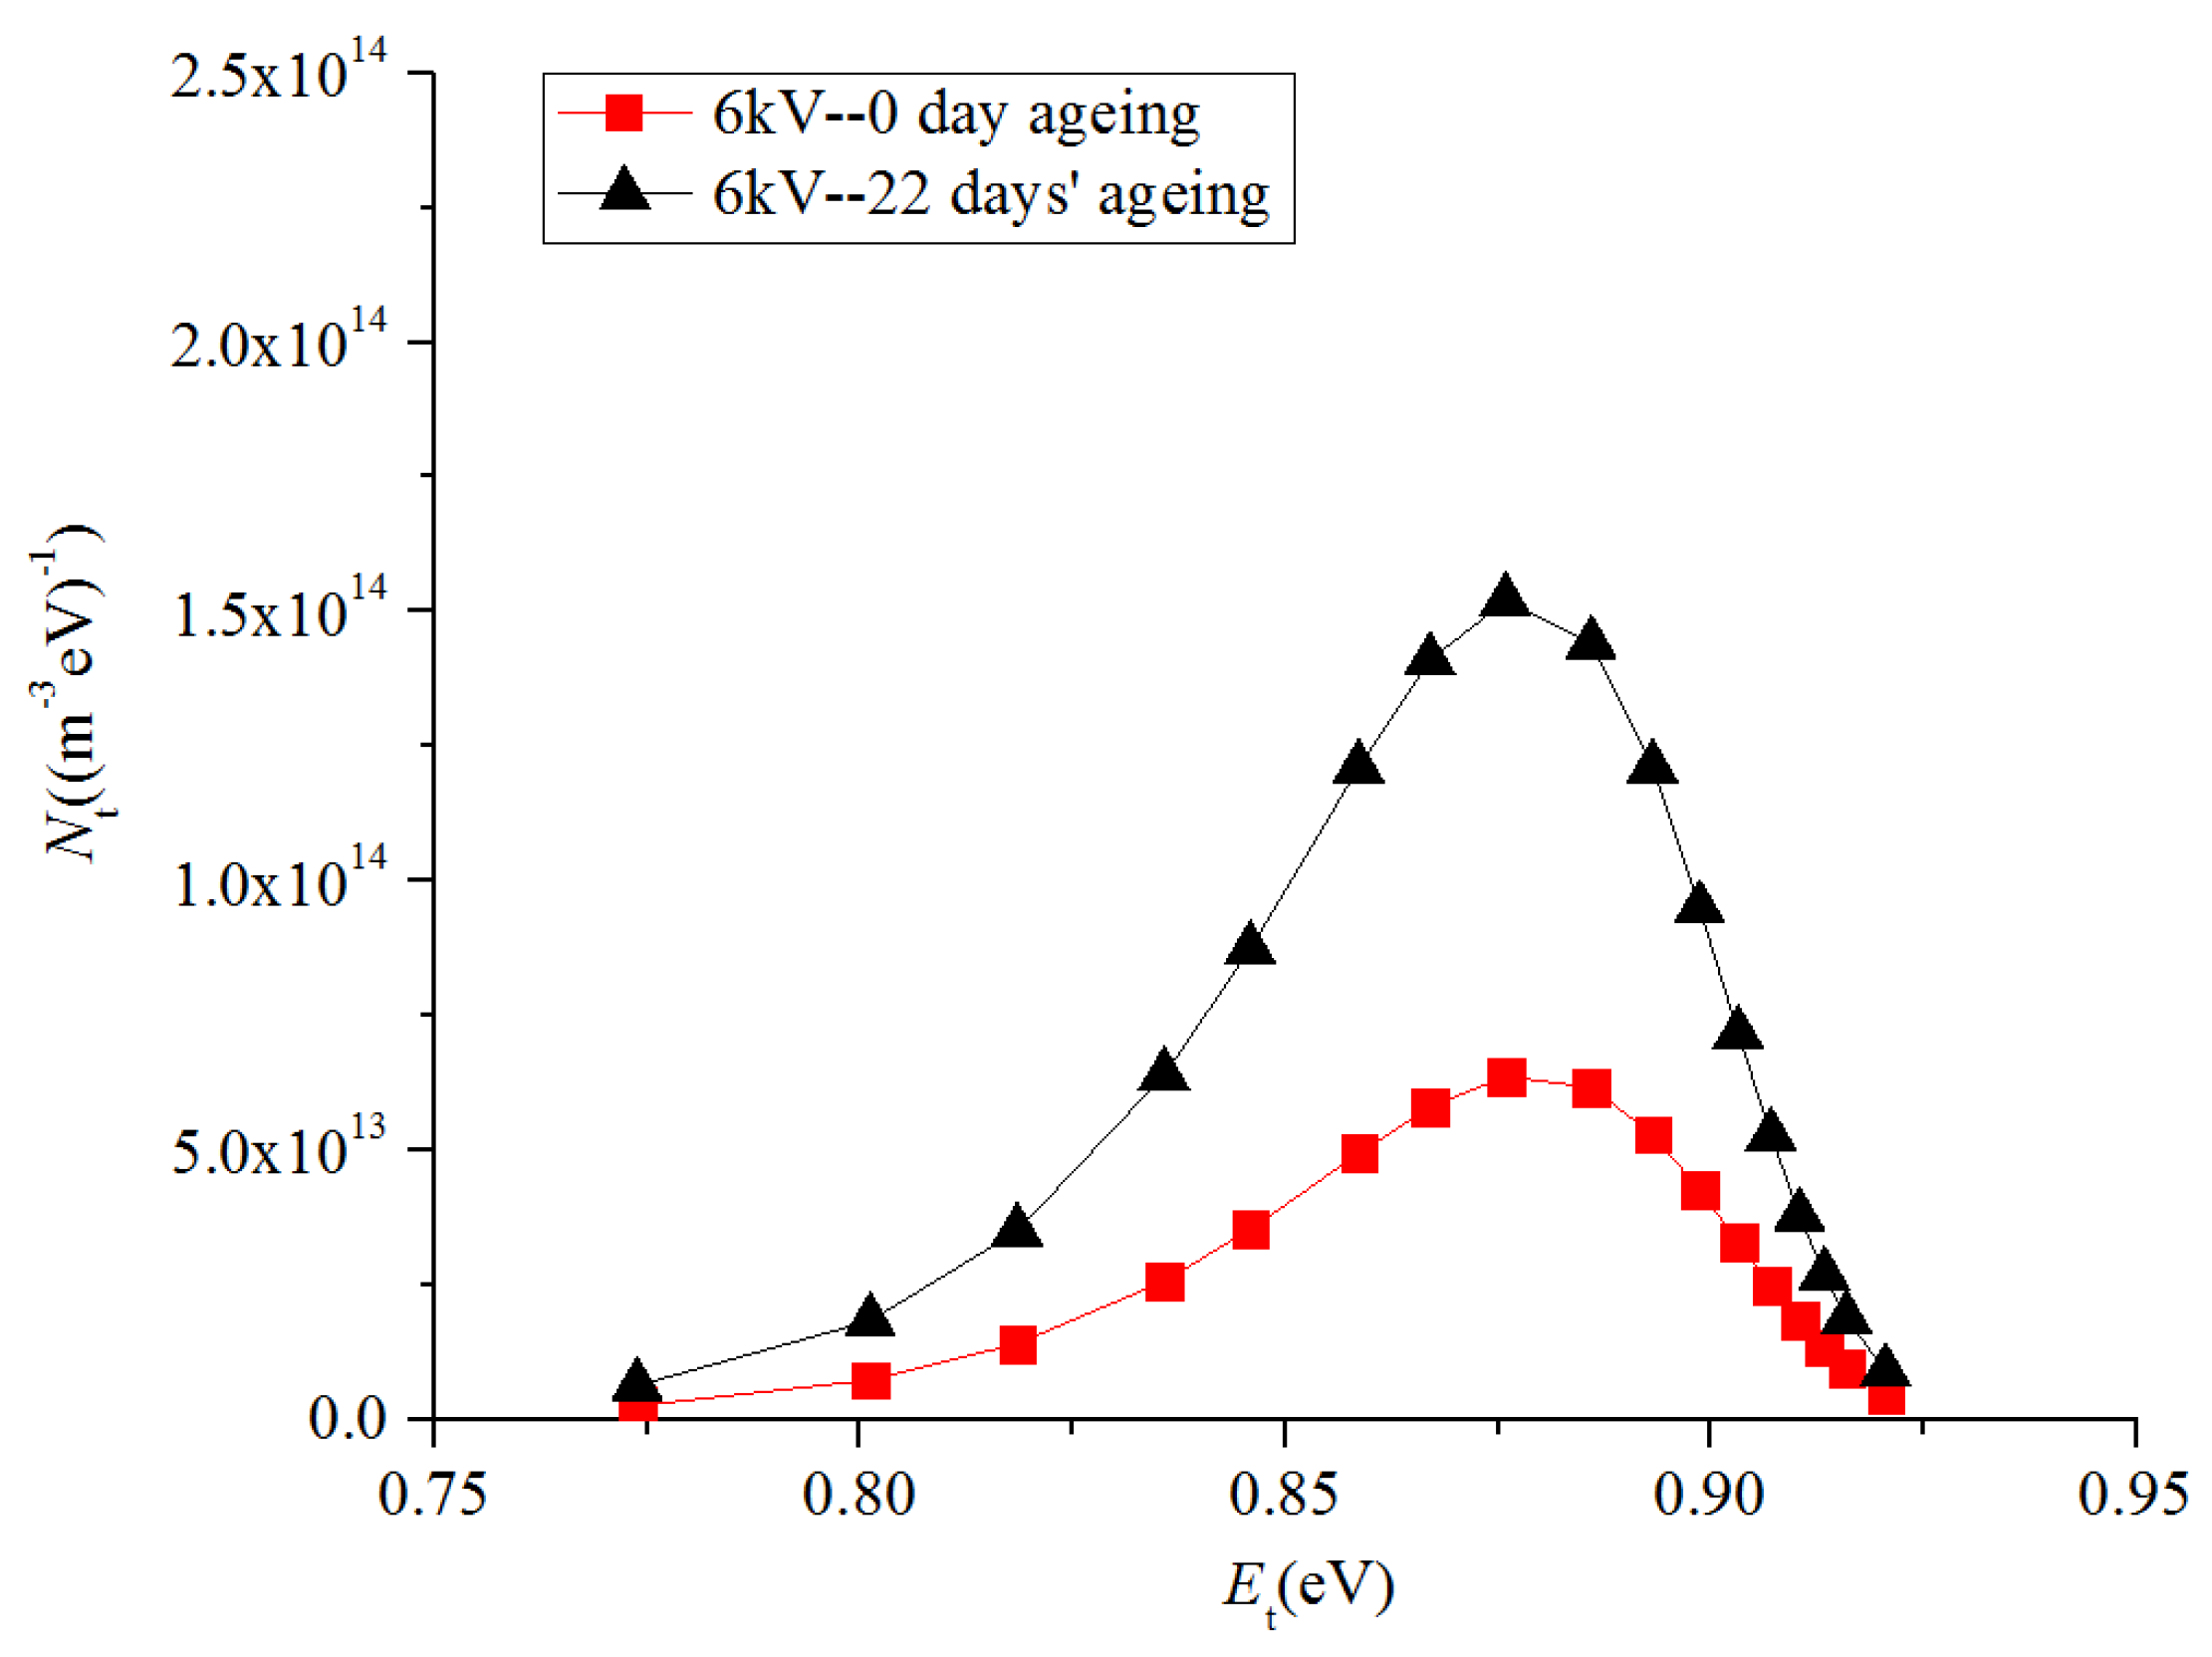
3.4.1. Aged Paper + New Oil

To investigate the effect of paper ageing on space charge behavior, an accelerated thermal ageing experiment of mineral oil immersed paper at 130 °C was conducted for 18 days (single layer with a thickness of 50 μm) [19]. After that, the paper samples were impregnated with new mineral oil in a sealed oven under vacuum conditions, in preparation for the space charge tests (30 kV/mm). The DP of paper was less than 600 after 10 days’ ageing, which represents the mid-term status of the insulation lifespan, and less than 300 after 18 days’ ageing, which was close to the end of service life.
The results showed that as the ageing time increased, the polar or conductive byproducts increased, which made space charge injection into the bulk sample easier. With further deterioration of the paper, the larger amount of charge density observed at the anode and in the bulk led to a higher total amount of charges accumulated in the oil-paper sample (Figure 7 and Figure 8). Compared with the unaged oil-paper sample, the maximum value of electrical field strength for seriously aged (18 days) oil-paper samples was more than 70% higher than the average electrical field strength [19].
Figure 7. The charge density of the charges accumulated at the anode and in the middle position of the paper [19].
Energies 09 00053 g007
Figure 8. Total amount of charges in the oil-paper insulation with paper aged for different days under the electrical field of 30 kV/mm [19].
Energies 09 00053 g008

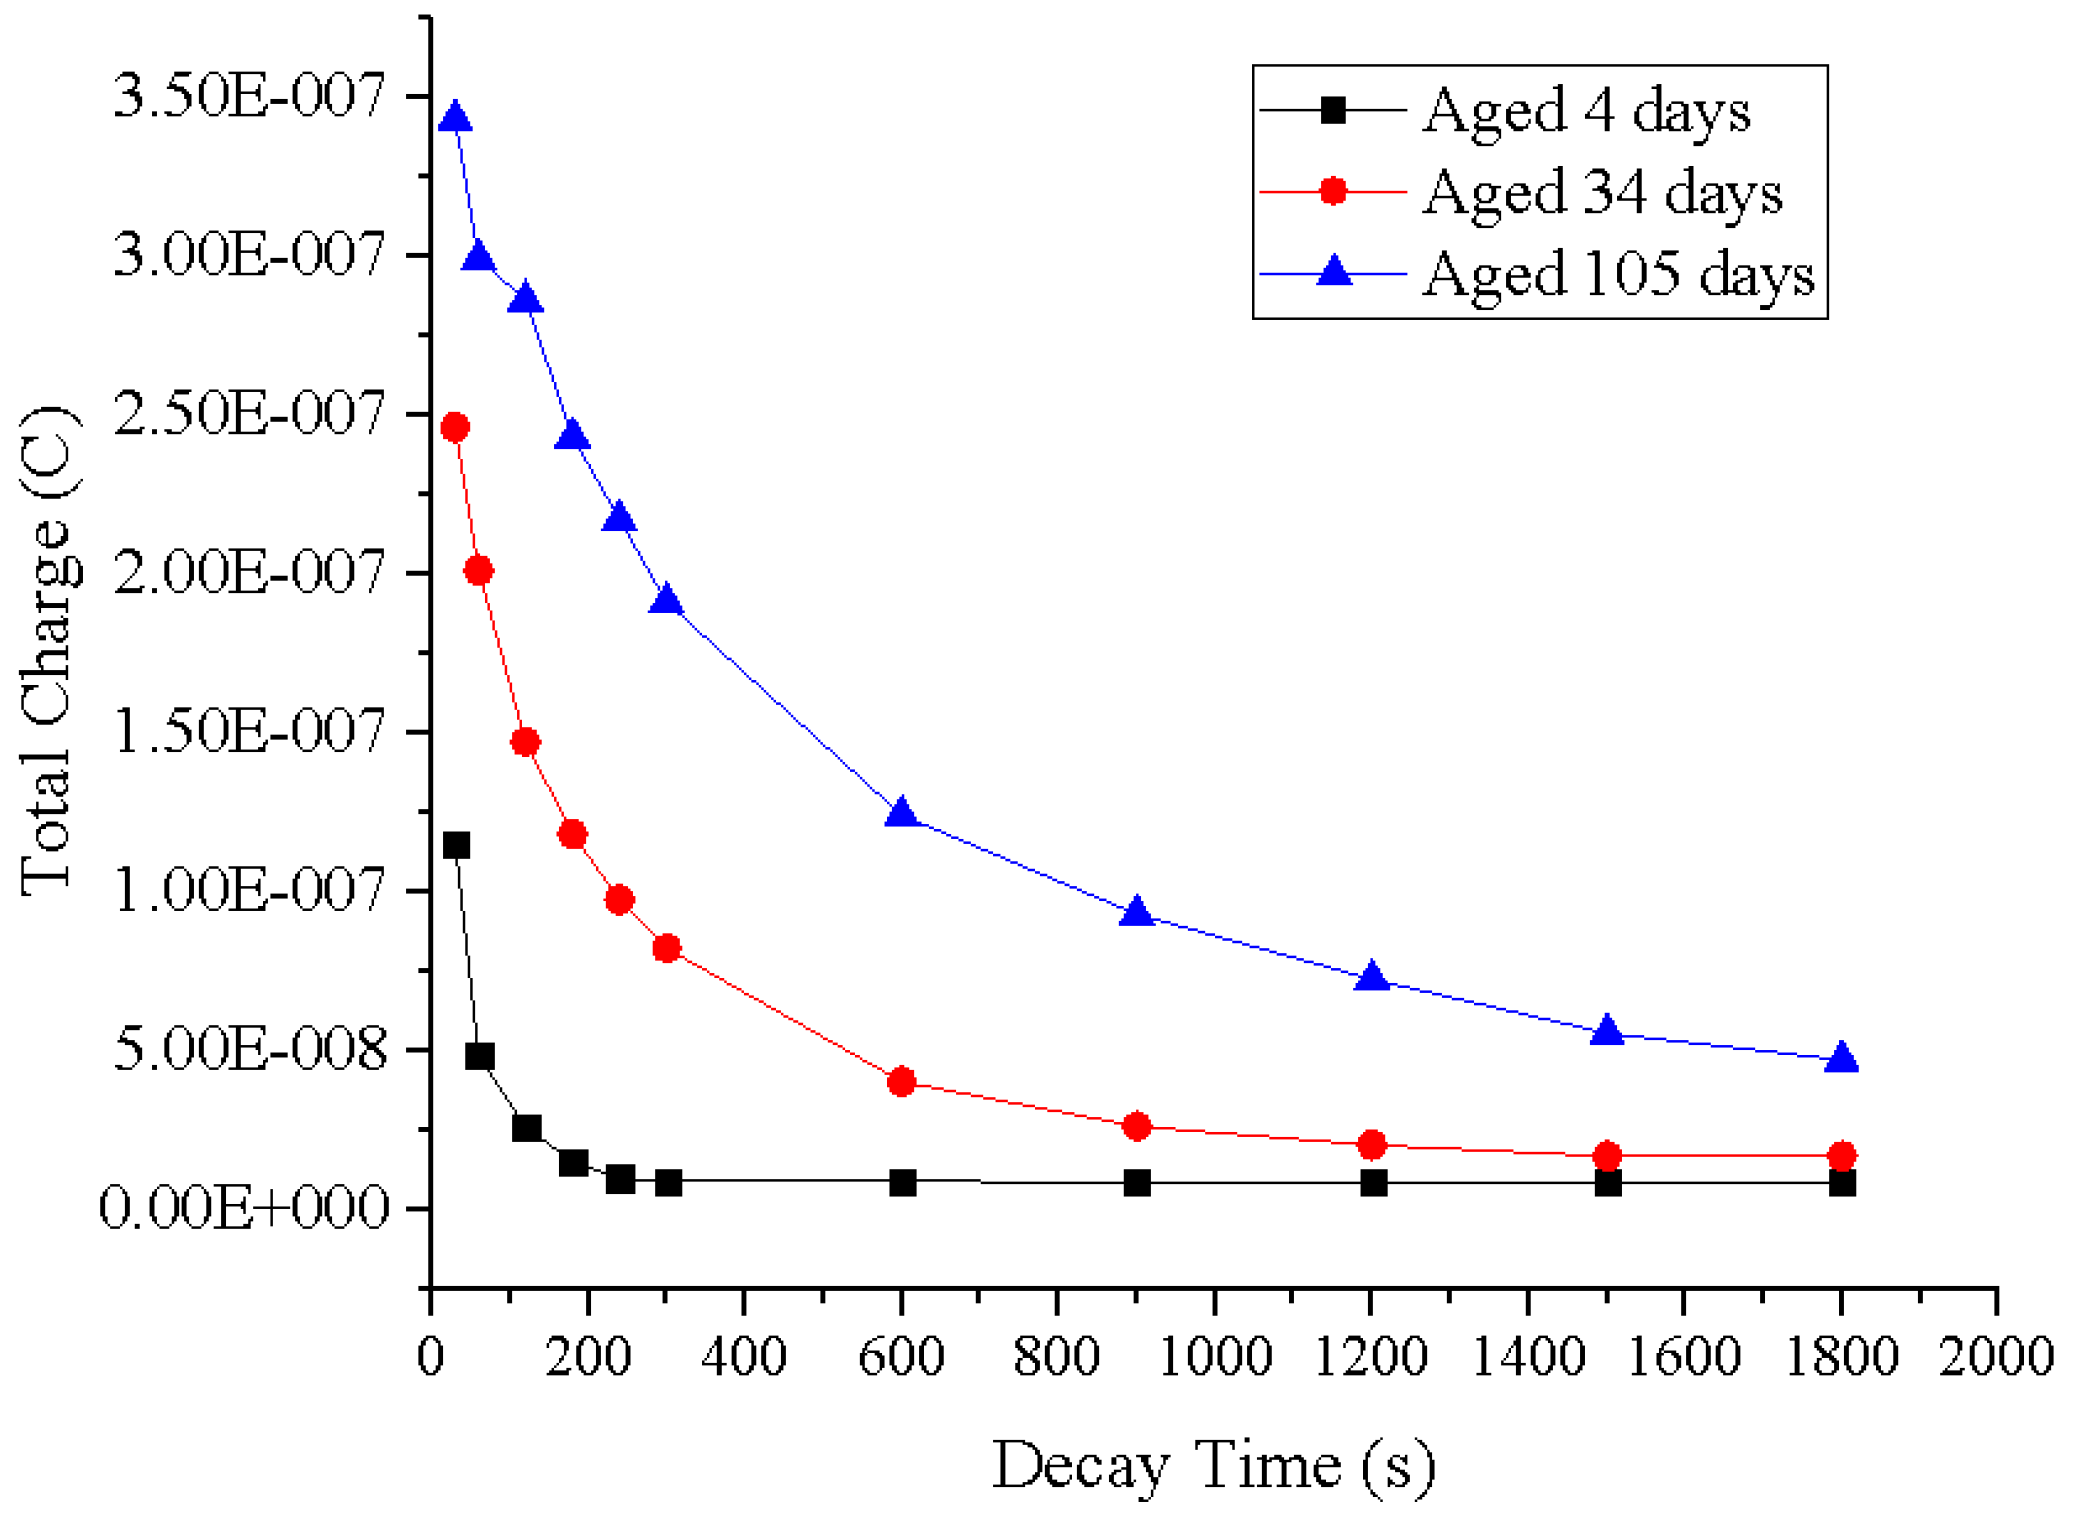
3.4.2. Aged Oil + New Paper

Another topic of great significance is to investigate the influence of oil ageing on the space charge characteristics of oil-paper insulation. In Southampton, Gemini X mineral oil was thermally aged at 130 °C for up to 22 days, and then, preprocessed unaged paper samples were impregnated with oil of different ageing status to form a series of oil-paper insulation samples. After that, the space charge dynamics of these oil-paper samples were investigated using the PEA technique under DC 6 kV (three layers, 210 μm in thickness, 30 kV/mm) [20].
The results showed that the oil properties could have a significant effect on the space charge behavior of the oil-paper samples. With the deterioration resulting from oil ageing, the oil acidity increased. The polar/conductive byproducts generated led to easier charge injection and more charge accumulation in the bulk of the sample. The maximum charge density of both negative charges trapped in the vicinity of the cathode and positive charges trapped at the paper-paper interface near the cathode increased with the increase of oil deterioration. Besides, the trap energy density of the paper sample with seriously aged oil was much higher than that with new oil, and the amount of slow moving charges trapped in the paper sample with oil aged for 22 days was more than two times that seen with new oil. Therefore, it resulted in an increase of the total amount of slow moving charges, and a more serious electric field distortion (Figure 9 and Figure 10). The maximum percentage of electric field enhancement during volt-on process under 6 kV is 55% after 14 days’ ageing and 25% after 22 days’ ageing, respectively.
Figure 9. Charge decay in samples with new and 22 days’ aged oil under 6 kV [20].
Energies 09 00053 g009
Figure 10. Trap energy distributions for samples with new oil and seriously aged oil under different voltages at 15 °C [20].
Energies 09 00053 g010

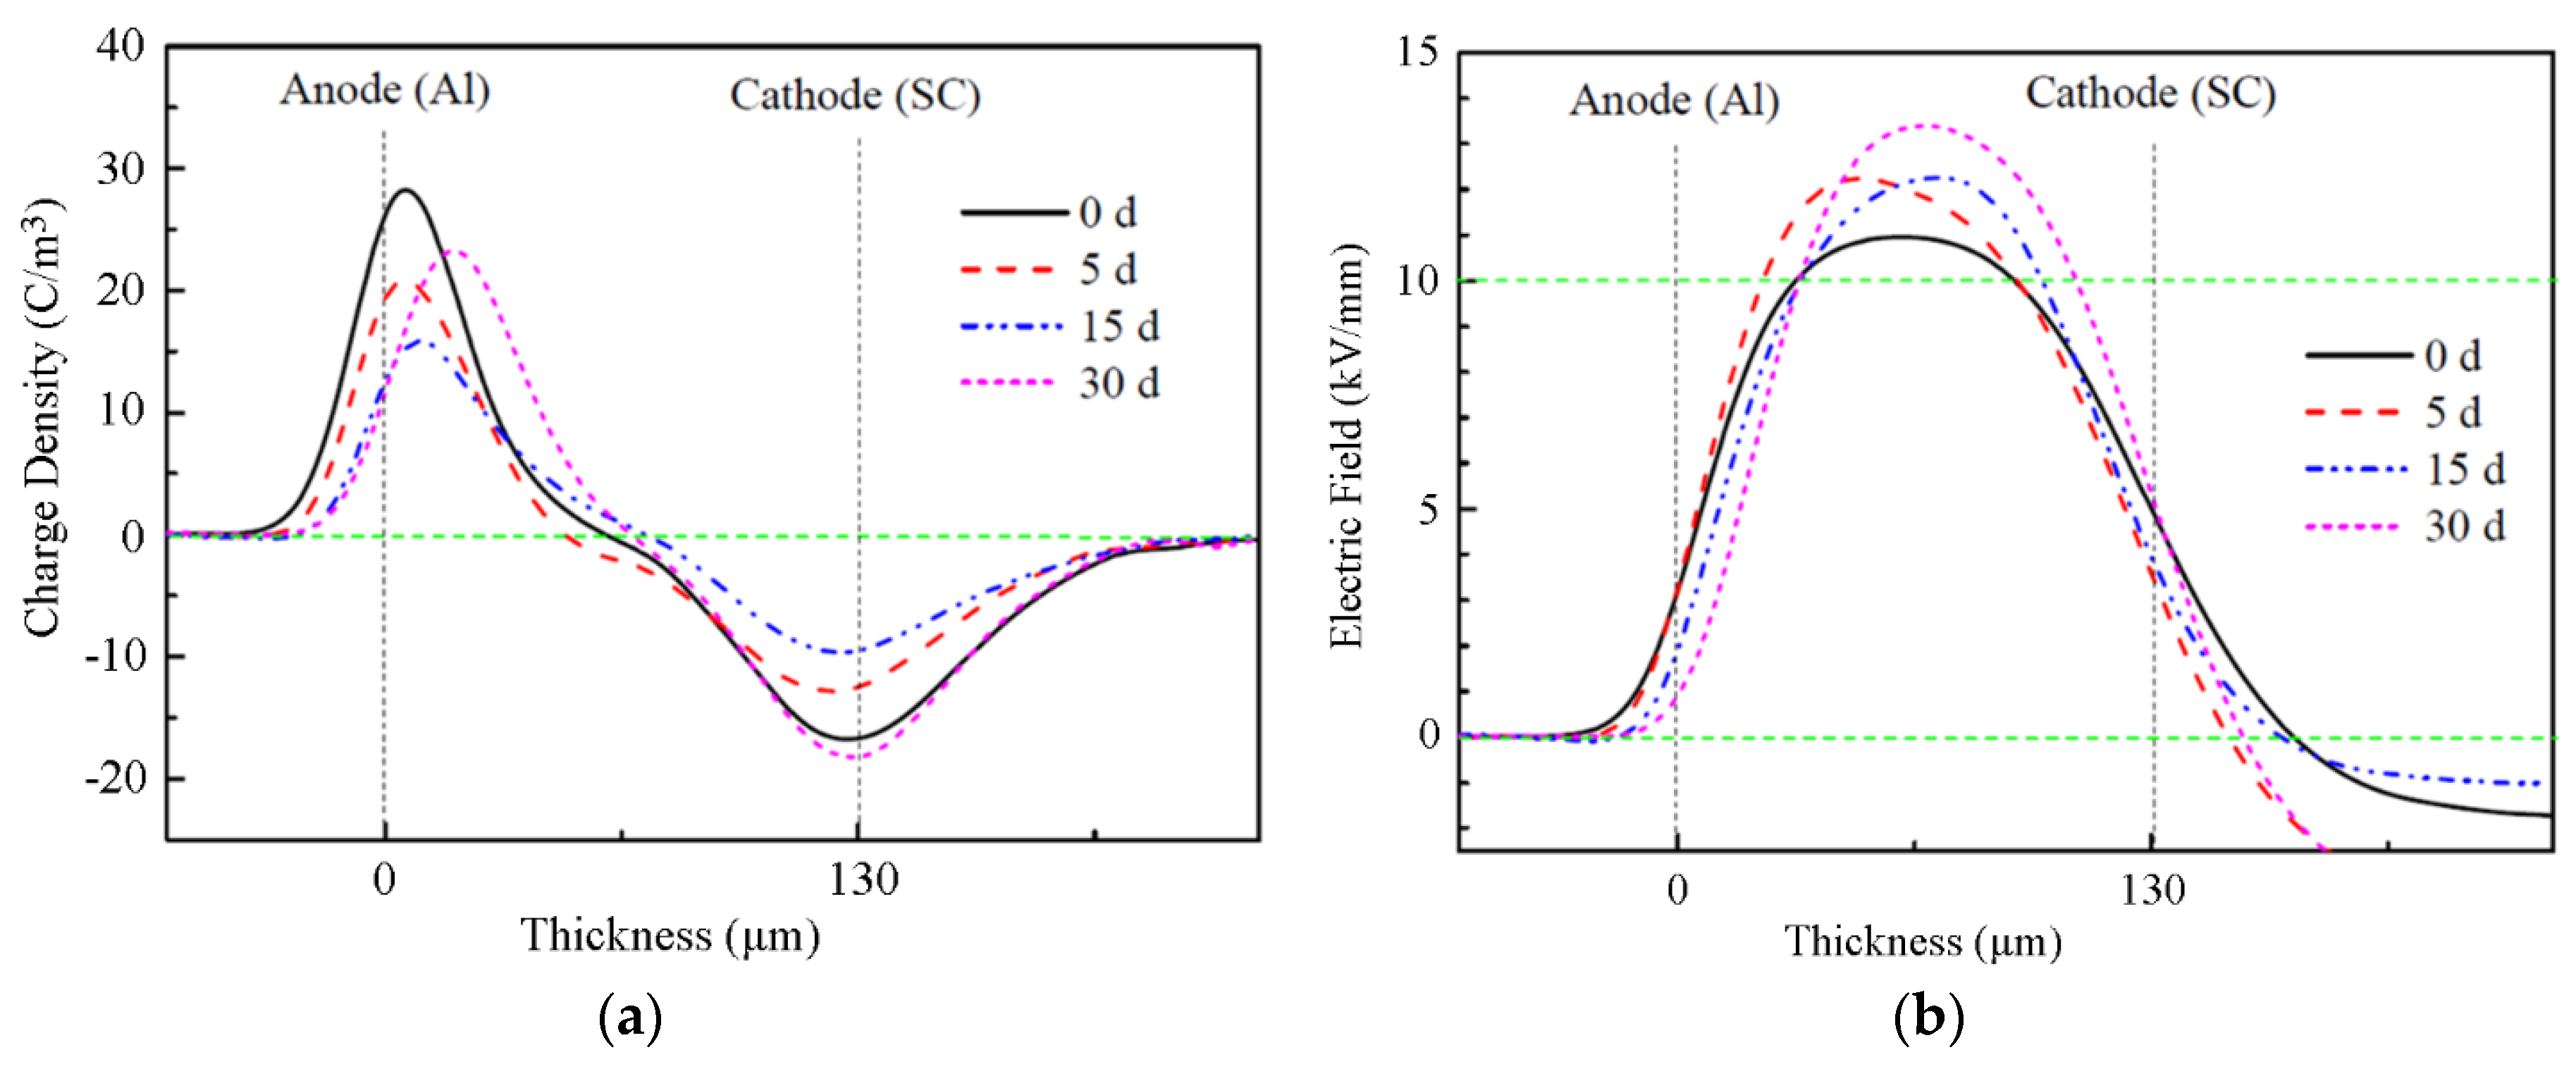
3.4.3. Aged Oil-Paper
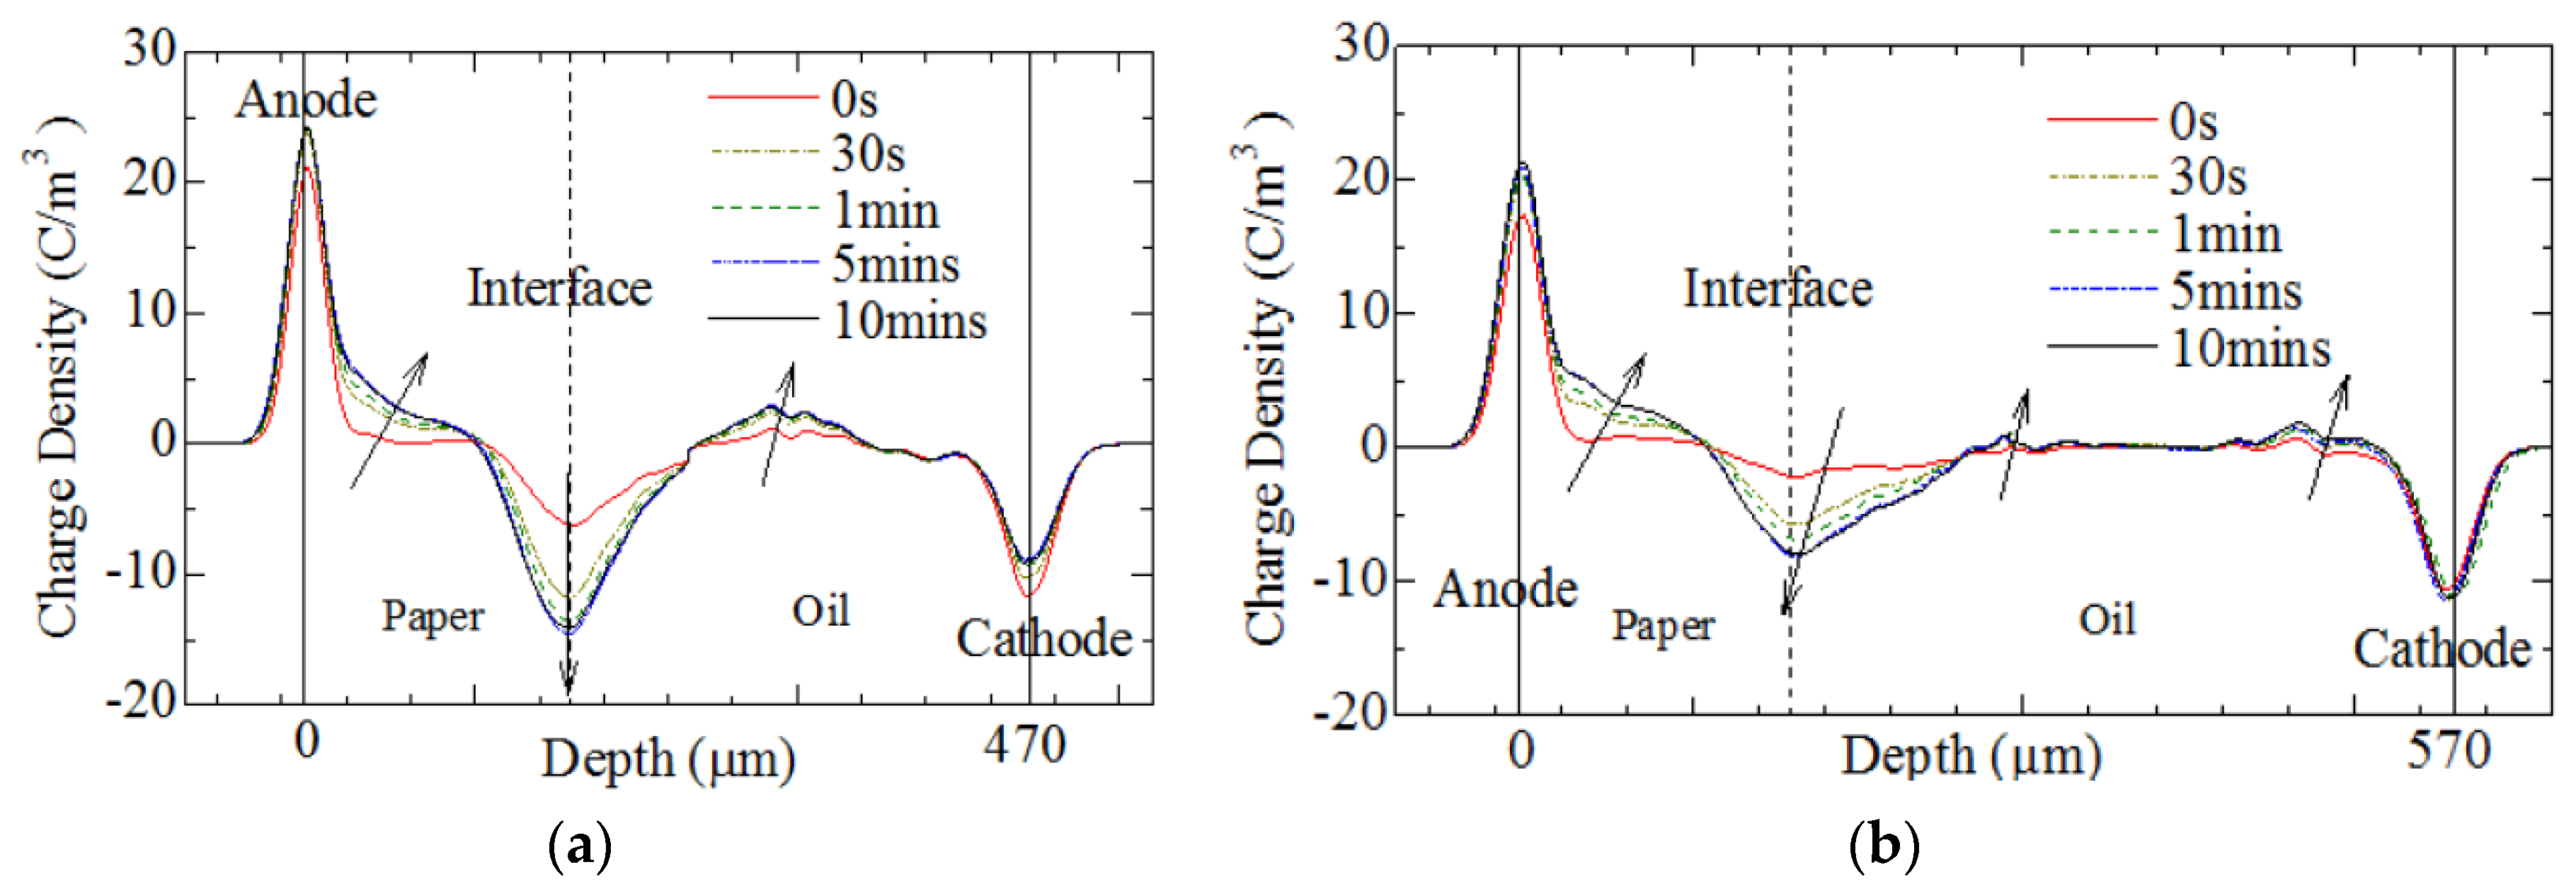
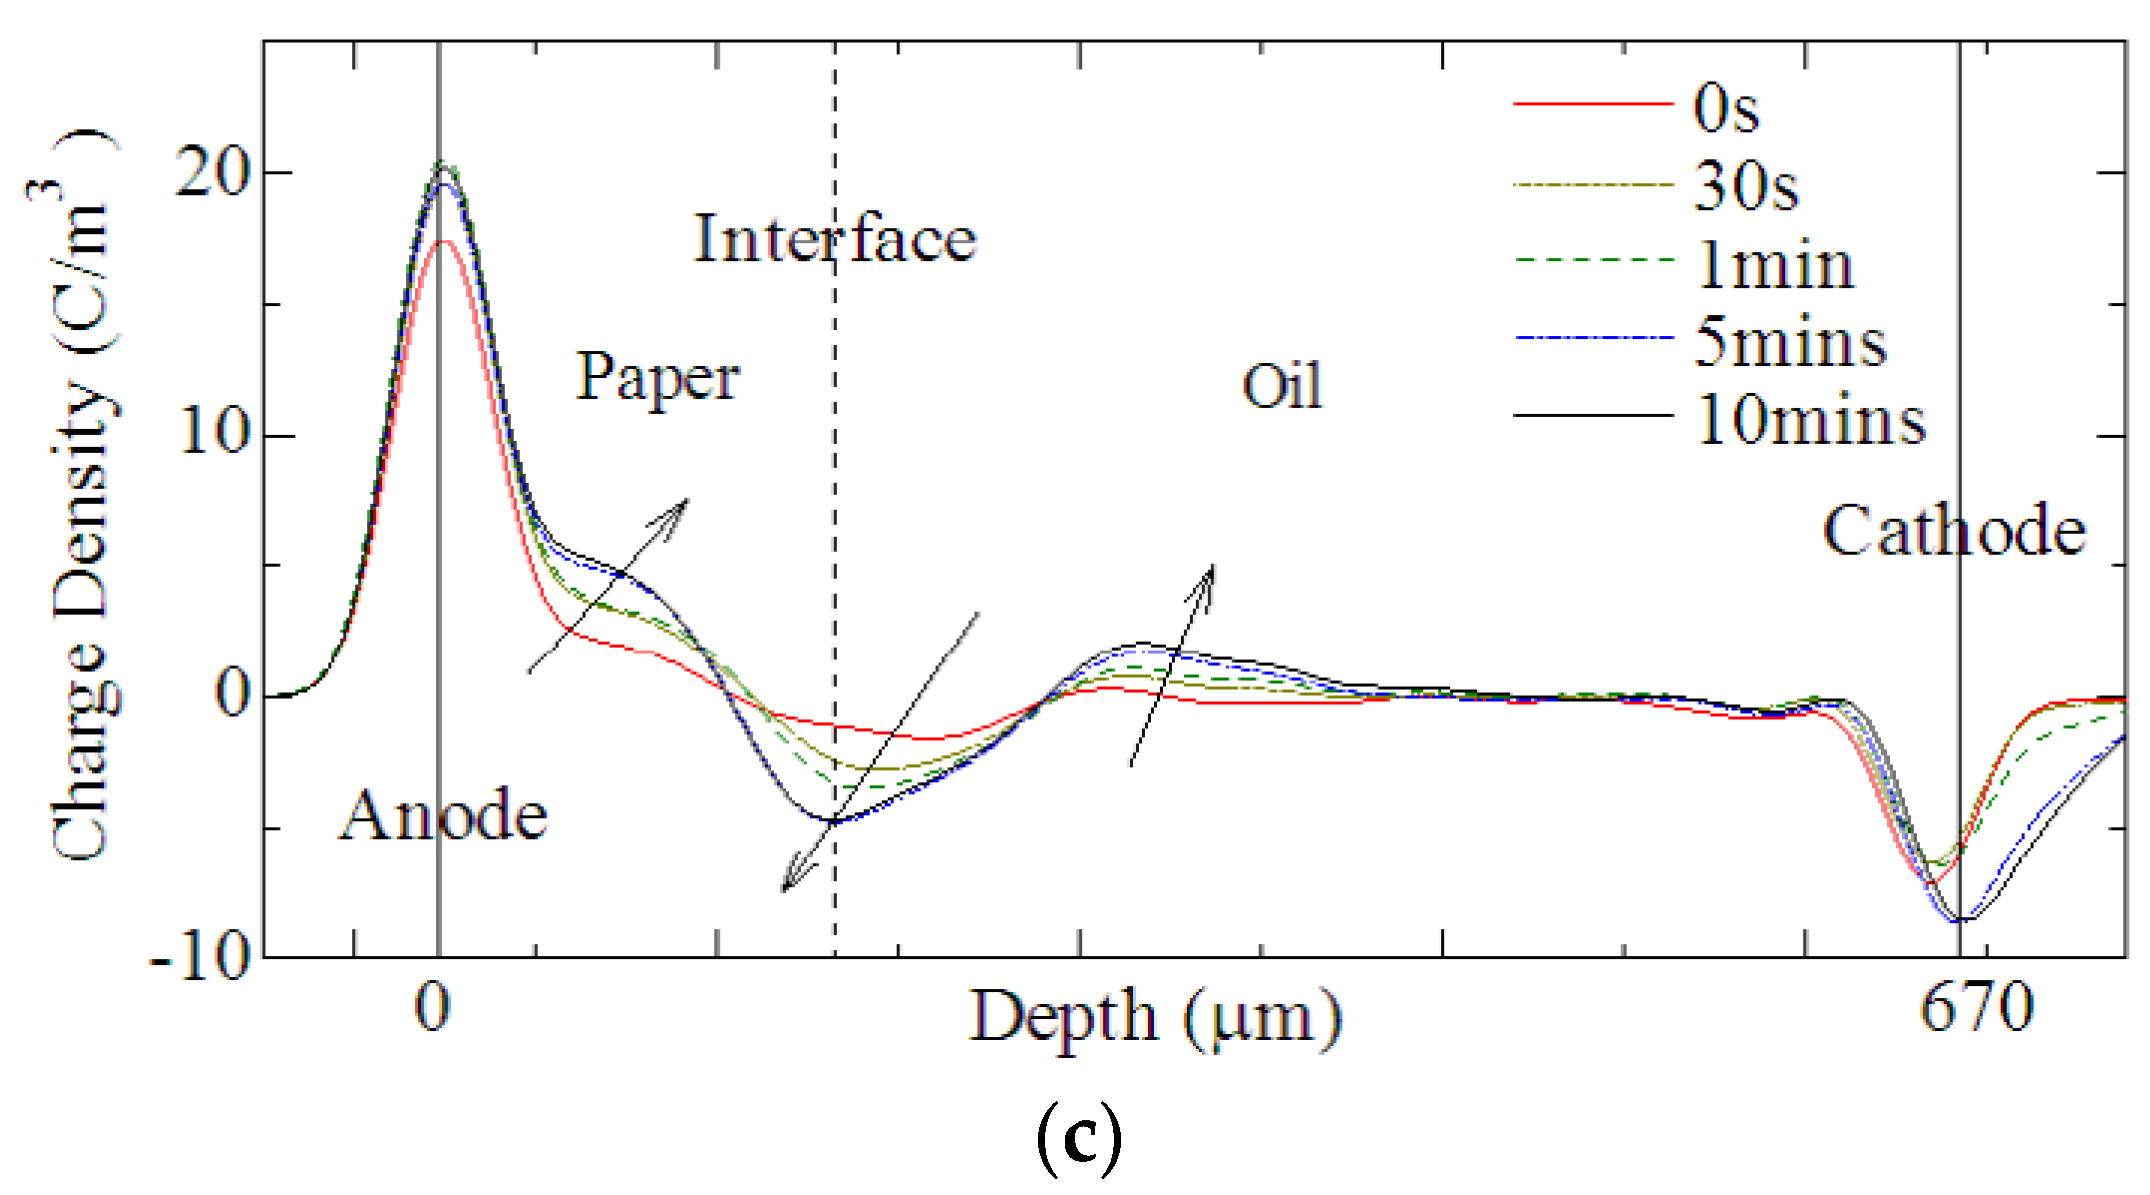
In 2004, Ciobanu tried to identify the evolution of space charges and fields in thermally aged oil-paper systems using the PEA method. The measurements were carried out with oil-immersed paper specimens, with a thickness of 70 μm and 0.43% mineral content, submitted to a poling field of about 80% of breakdown strength [21]. The conclusions showed that homo-charge injection was clearly noticed, and the charge packet formation was triggered by the thermal stress, in conjunction with the value of the applied field.
The experiment results from the University of Southampton in 2008 (three layers, about 220 um in thickness, 35 kV/mm) showed that as the ageing time increased, the threshold voltage decreased which made the charge injection easier, the charge density increased and the total charge amount inside oil-paper increased as well. A clear exponential law was observed for the charge decay process, as shown in Figure 11 [22].
Figure 11. Total charge amount inside oil-paper with different ageing degrees.
Energies 09 00053 g011
In 2015, the most recent studies by Zhou et al. (single layer, 130 μm, 10 kV/mm) showed that the formation of space charge by unaged and aged oil-paper were consequently different under low electric field conditions [23]. Along with the degradation of cellulose, more traps inside paper samples were generated, more charge (especially positive charges) was trapped, and the electric field distortion was more severe as the ageing progressed (Figure 12).
Figure 12. Space charge (a) and corrected electric field distribution profiles (b) of oil-paper aged for different days, measured at the end of 30 min polarization under 10 kV/mm electric field [23].
Energies 09 00053 g012

3.5. Interfaces

In HV insulation systems, there are different kinds of dielectric interfaces, such as solid-solid (cable accessories, insulation paper with paper, and paper with metallic conductor), solid-gas (gas-insulated high-voltage switchgear—GIS) and solid-liquid (insulation paper with oil). In the interface regions, the difference in permittivity and conductivity of the dielectric materials across the interface may lead to interfacial polarization and space charge formation [24,25]. Here, two kinds of interfaces that are closely associated with power transformers are discussed.

3.5.1. Paper-Oil Interface

The tests in Southampton reported that an interfacial charge peak was quickly formed at the interface between oil and pressboard upon the external voltage application [26]. However, the dynamics of interfacial charges in fresh oil and aged oil samples were quite different, which resulted from the difference in moisture content and oil conductivity. The PEA test research results from samples with a 500 μm oil gap and 200 μm fresh oil-impregnated insulation pressboard indicated that the charge decay rate was much slower than in single layer oil-immersed paper. The interface provided deeper traps and made it difficult for the trapped charges to dissipate [27]. However, compared with the new oil gap and oil-impregnated pressboard insulation, a higher charge migration rate was clearly observed in aged oil gap and oil-impregnated pressboard. There were nearly no charges observed in the sample after five mins of decay time (Figure 13). The main reason could be due to the higher conductivity of the aged samples.
Figure 13. Space charge decay of new oil gap and oil impregnated pressboard ((a) new oil with 0.68% water content, (b) aged oil with 3.83% water content) [27].
Energies 09 00053 g013
A further study made by Wu et al. on the space charge properties of oil-immersed-paper with different oil gap thicknesses, revealed some rules of charges accumulation. The charges with the same polarity as the oil side electrode were accumulated at the interface and gradually increased with the increase of applied voltage (Figure 14). The amount of interface charge decreased with the increase of oil layer thickness because of the charge recombination in oil [28]. The results showed that interfaces have a direct effect of restraining charge migration inside the oil-paper insulation, which would lead to the electric field distortion. The interfacial charges proved to have the same polarity with the electrode close to the oil layer [28].
Figure 14. Space charge development under an average field of 20 kV/mm with different thickness of oil [28]. (a) 0.17 mm oil-immersed-paper with 0.3 mm oil (b) 0.17 mm oil-immersed-paper with 0.4 mm oil; (c) 0.17 mm oil-immersed-paper with 0.5 mm oil.
Energies 09 00053 g014aEnergies 09 00053 g014b
Moreover, the electric field measurement in the oil and oil/solid composite can be directly compared to an electro-optical measurement. The Kerr electro-optic effect has been applied to measure the electric field in insulation liquid since 1983 [29] and measured the oil/solid dielectrics composite insulation system in transformer under dc voltage in 1997 [30]. It offers a way to validate the PEA results and reveal the inner mechanism of charge behavior.

3.5.2. Paper-Paper Interface

As for the topic of paper-paper interface, these are interfaces in the multi-layer oil immersed paper without the tiny oil gap being taken into consideration. the space charge behaviors of up to four paper layers were tested at Southampton in 2008, using the PEA method [22]. The results (Figure 15) showed that homo-charge injections were observed in all cases considering the physical-chemical properties of oil-paper itself. In most conditions, space charges were accumulated at the interfaces, which indicated that the paper-paper interfaces have a significant effect on slowing down space charge migration (Figure 16). The interfacial charges were mainly supposed to be formed by ionic charges and polarization charges mainly.
Figure 15. Space charge behaviour of oil-paper insulation with different layers under volt-on condition ((a) one layer, (b) two layers; (c) three layers; (d) four layers).
Energies 09 00053 g015aEnergies 09 00053 g015b
Figure 16. Space charge behaviour of oil-paper insulation with three layers under Volt-off condition.
Energies 09 00053 g016
The polarity of the applied DC voltage would affect the polarity of charge trapped at the interfaces. Under negative voltage, the negative charge accumulated at the interface. The positive charge could accumulate at the interface under the positive voltage, and the same phenomenon could be found in the literature [31,32,33]. Different from the oil-paper interfaces mentioned above, when homo-charge injection takes place, the polarity of charge accumulated in the paper-paper interface is usually opposite to the polarity of the nearest electrode in the vicinity of the PVDF sensor.

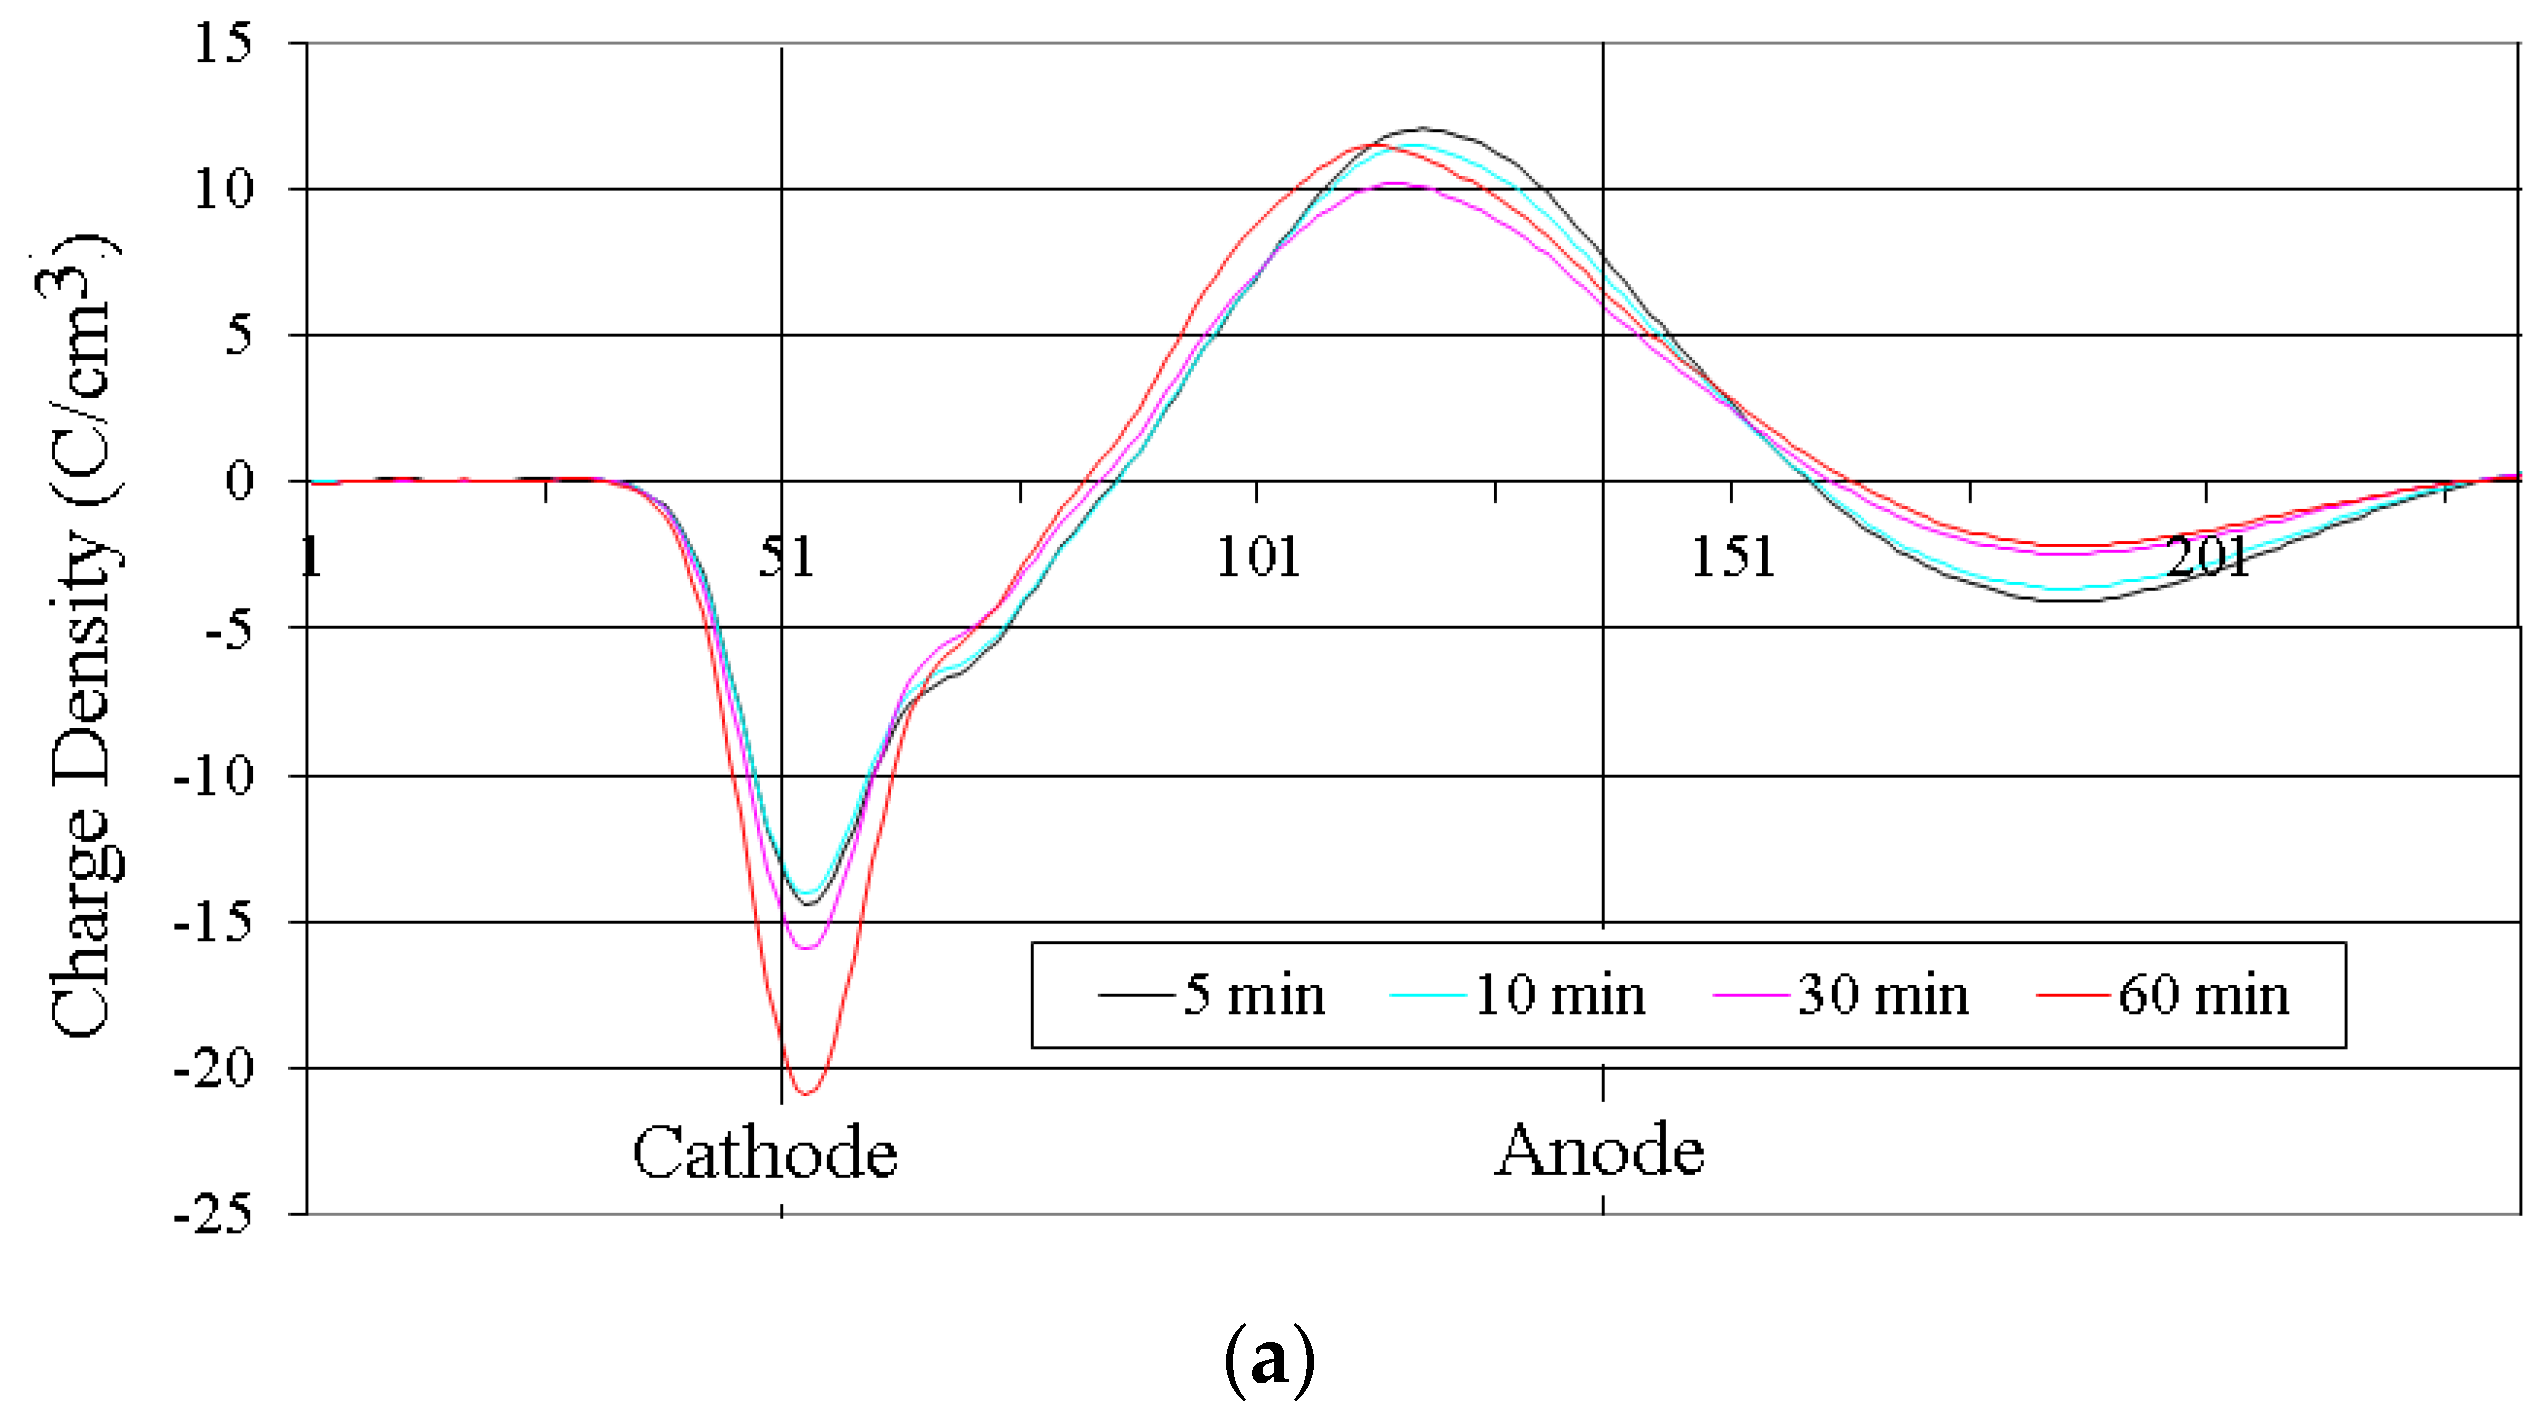
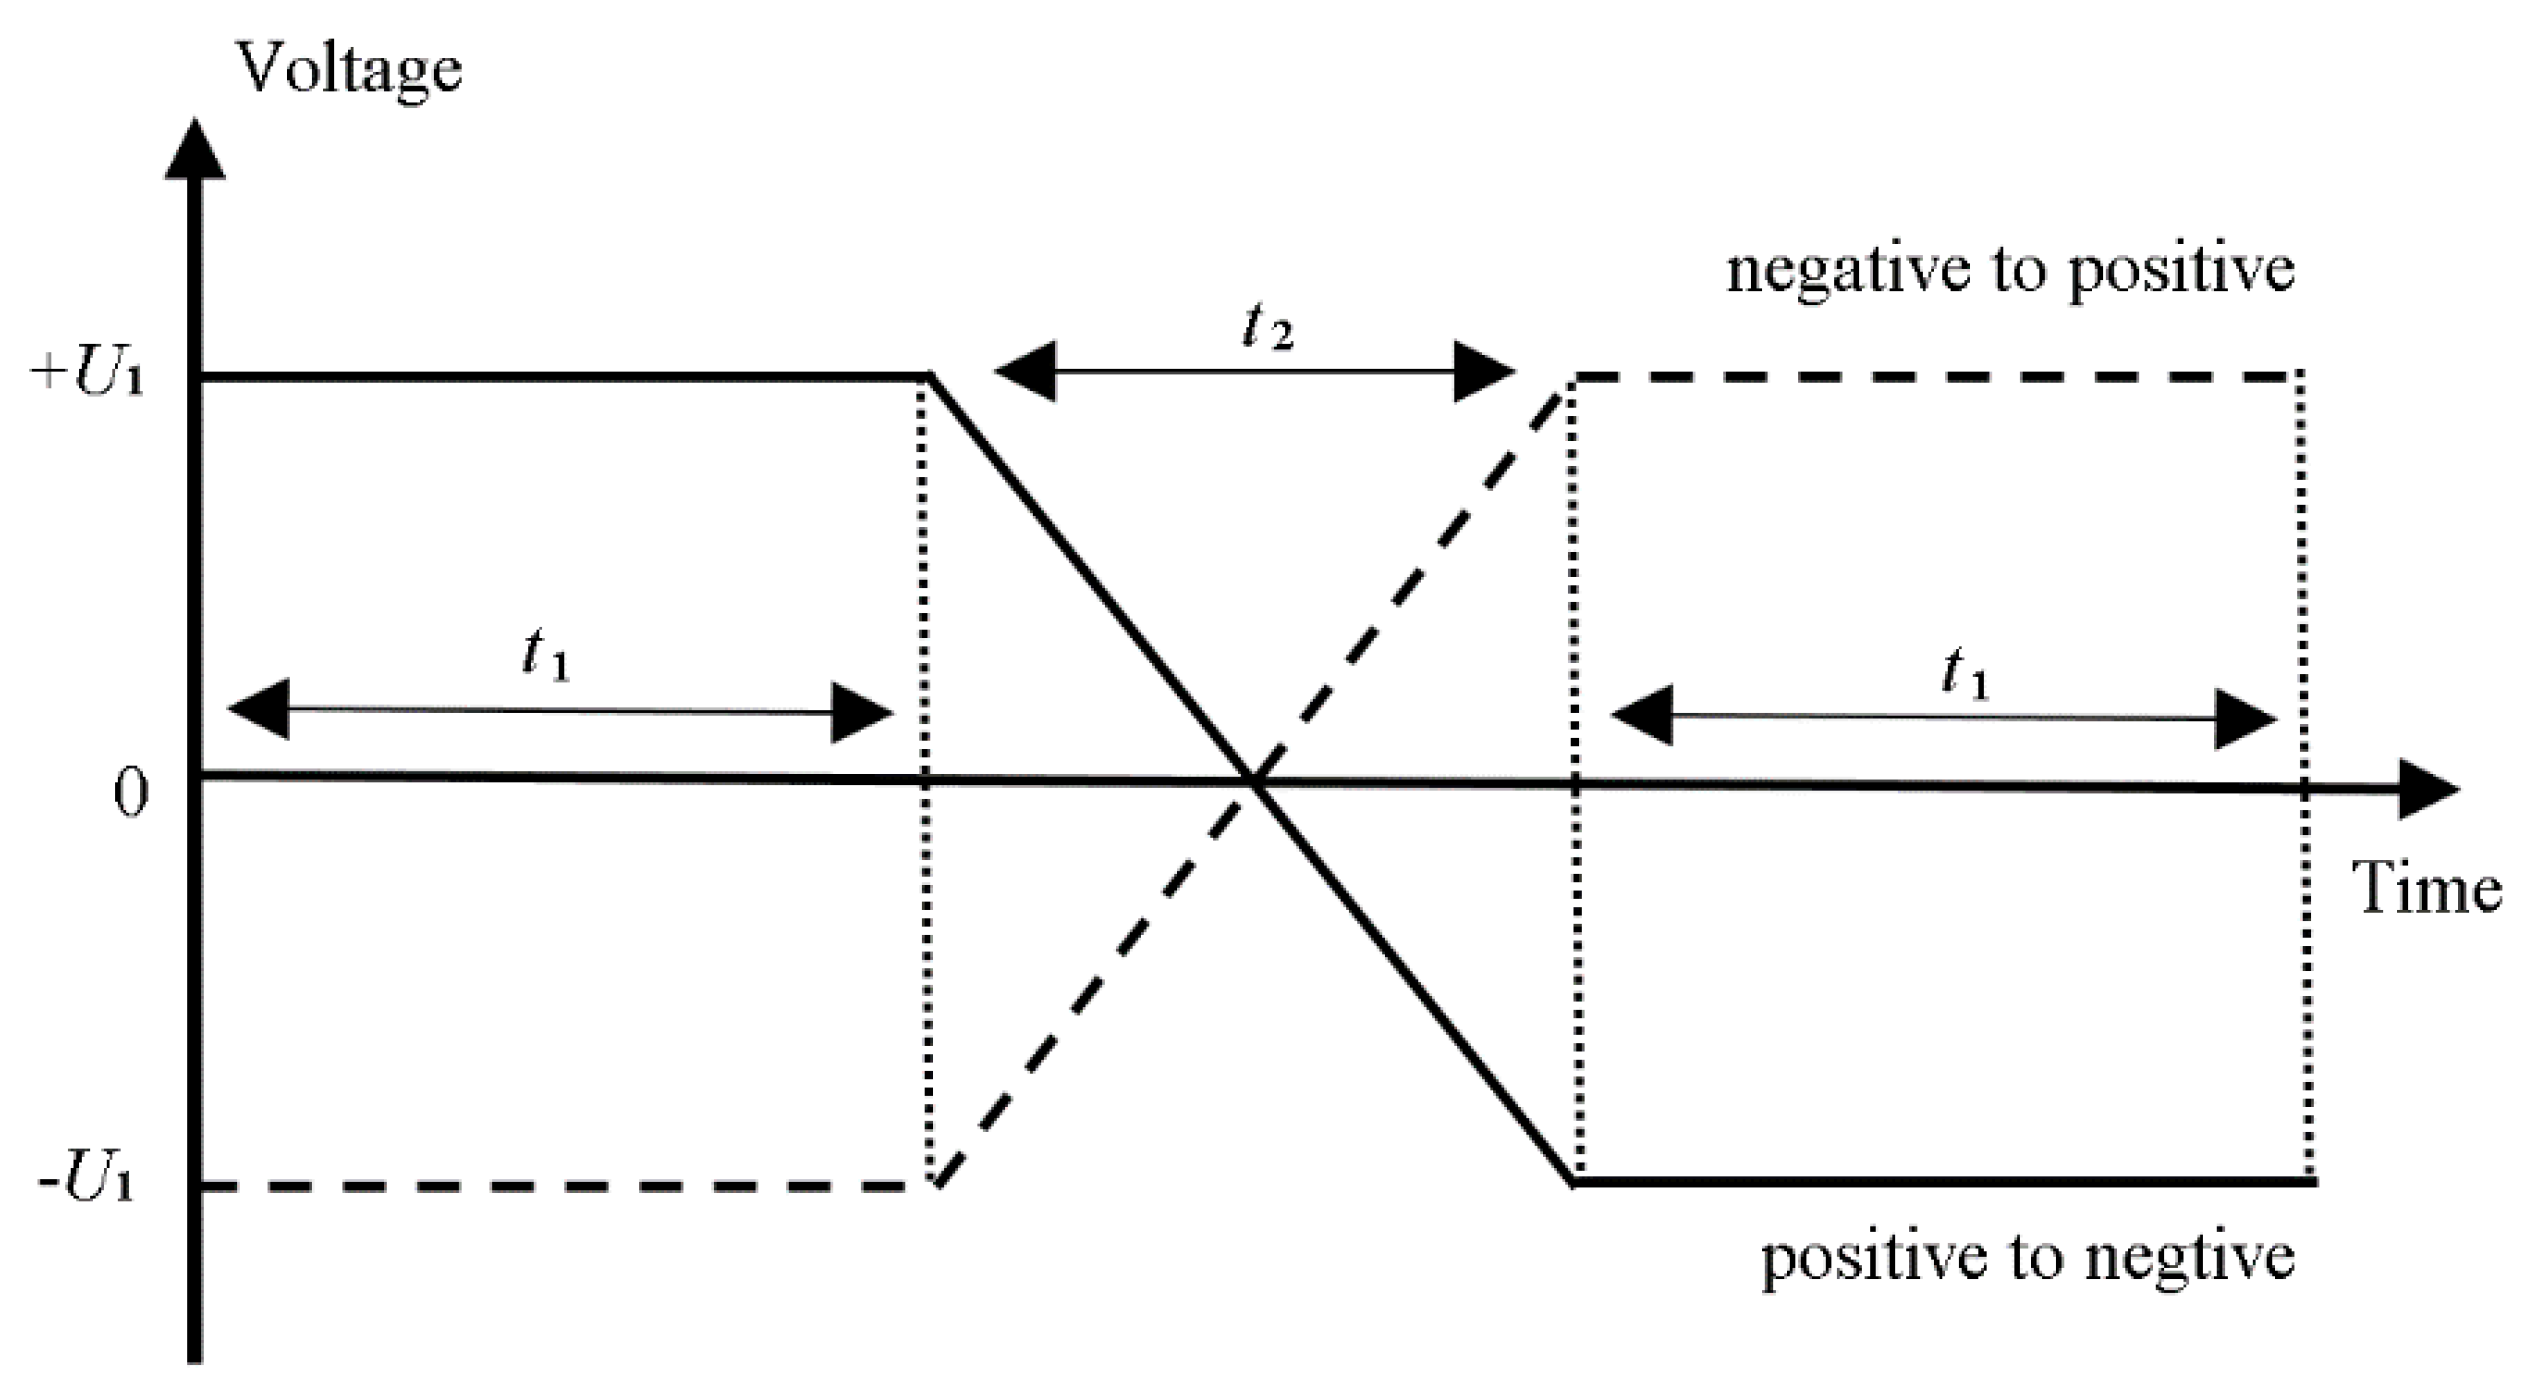
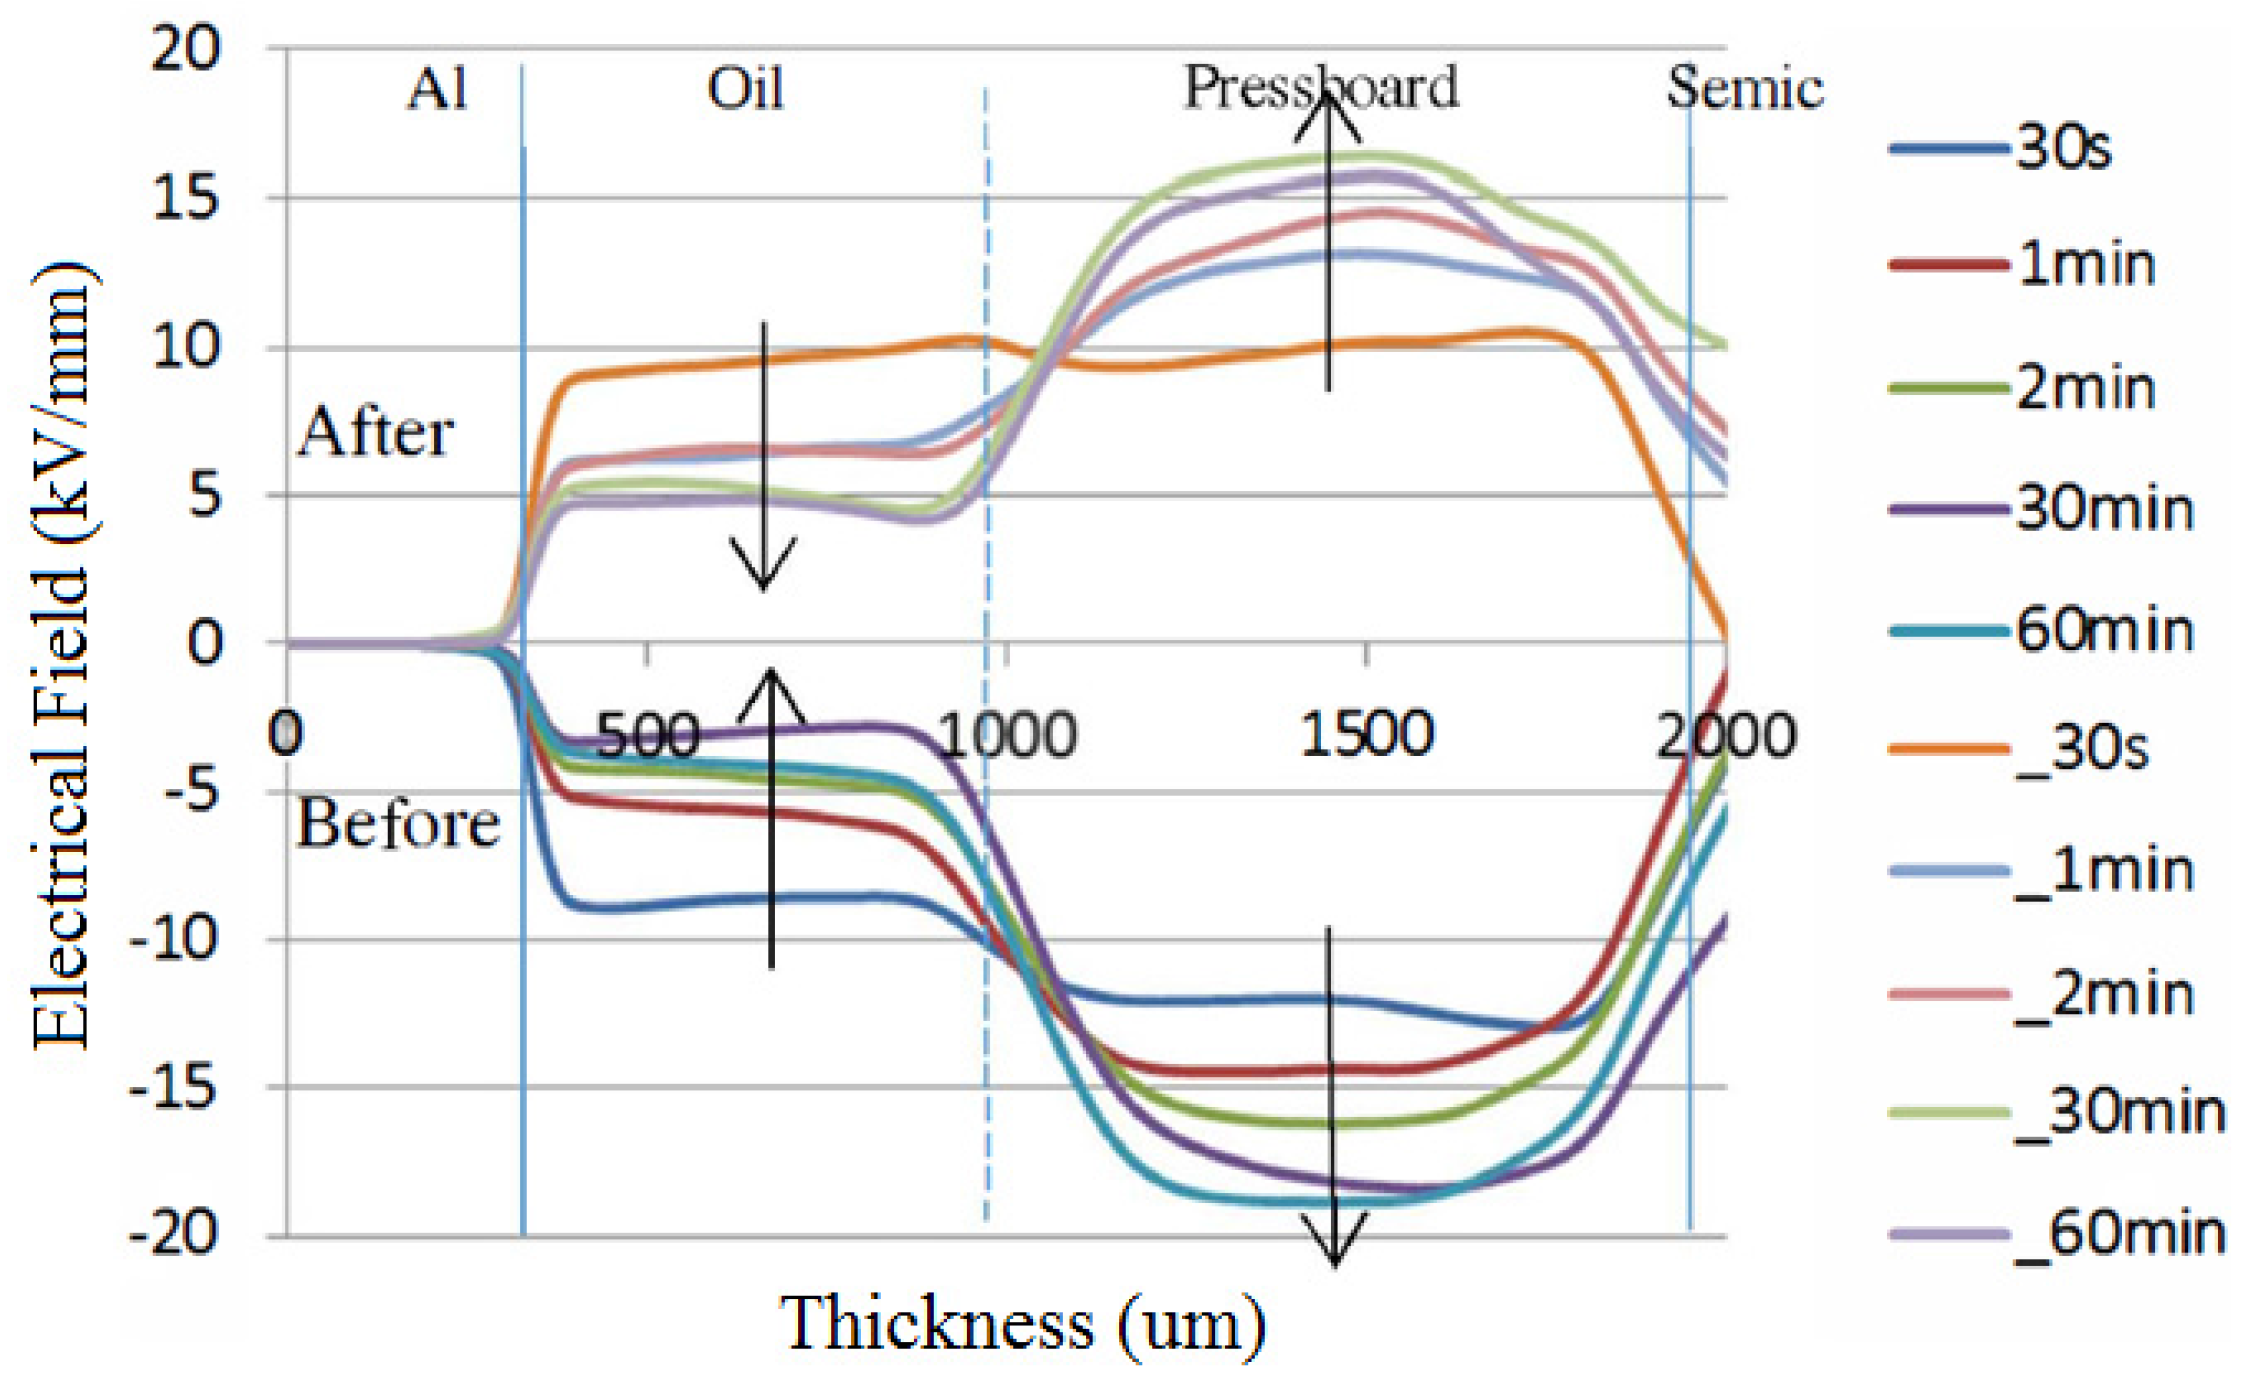
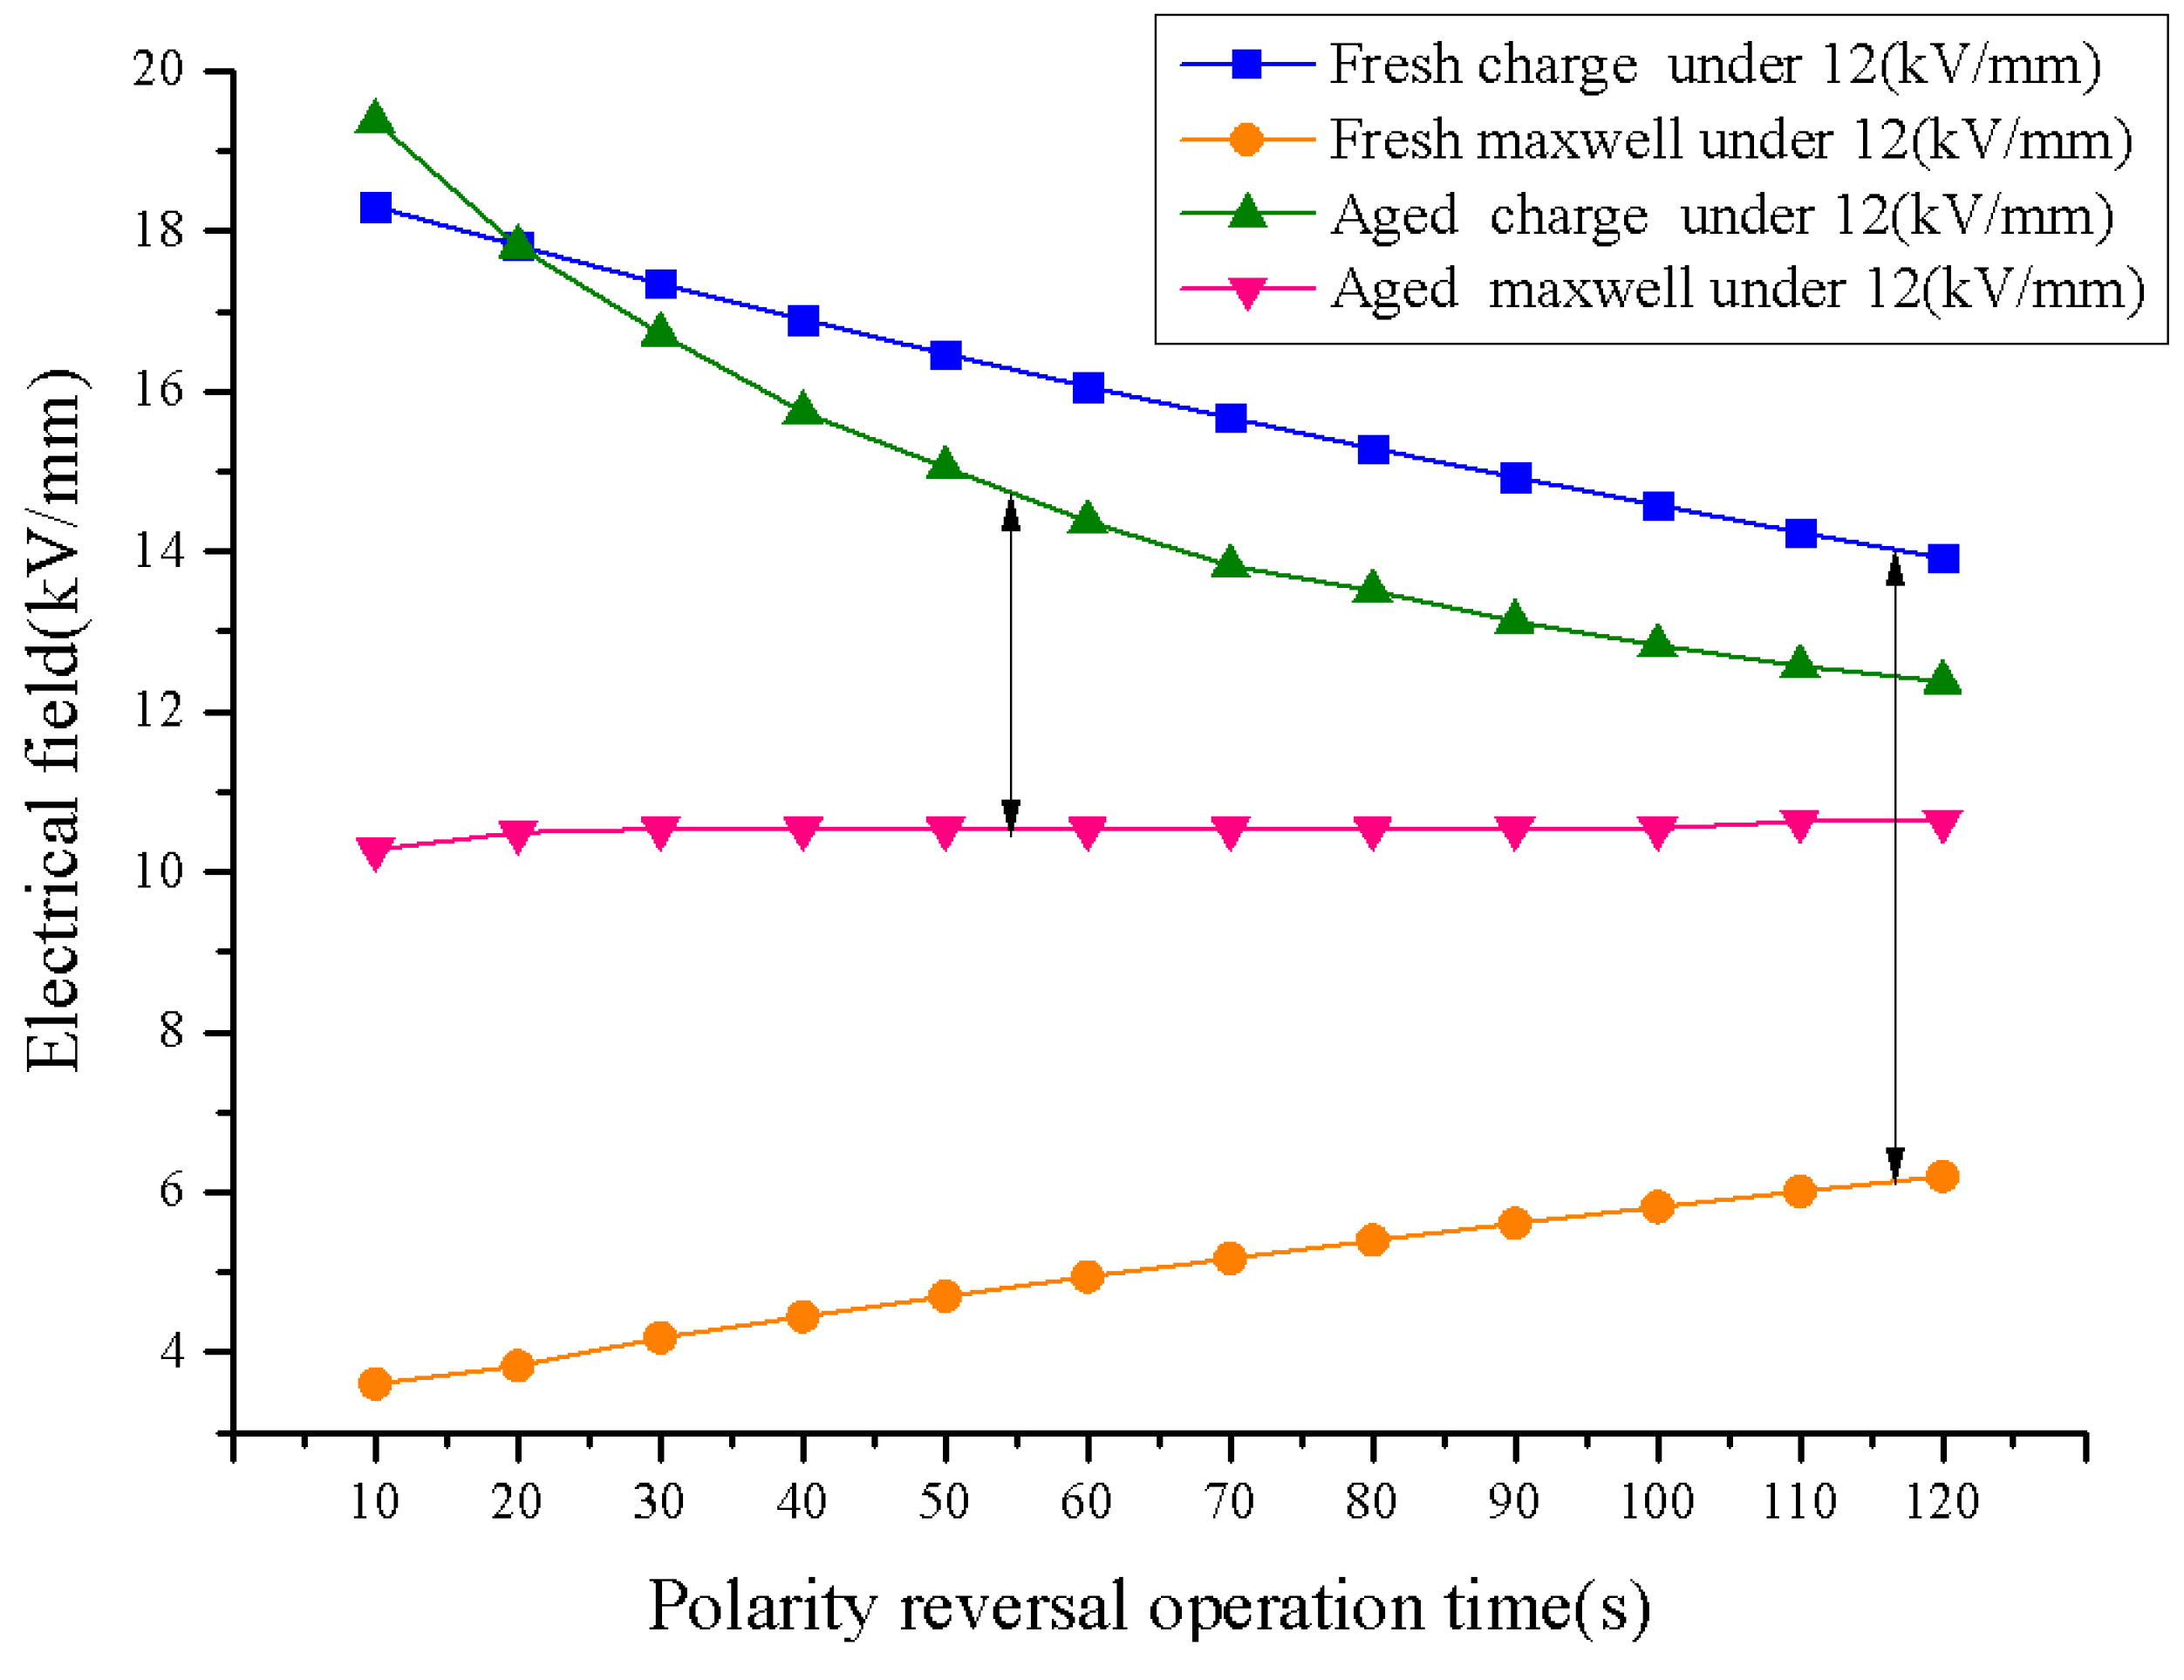
3.6. Polarity Reversal

The polarity reversal of DC voltage is an important operation in HVDC transmission (especially in the converter transformer) to control the direction of power flow (Figure 17). It is believed that a transient electric field enhancement within the oil happens immediately after the voltage reversal, as the accumulated charges in oil has the opposite polarity compared to the cellulose pressboard. This temporary voltage distribution is governed by the conductivity and permittivity of the dielectrics, which may also be affected by the value of applied voltage, moisture, temperature and so on. Early in 1995, Liu investigated the charge storage and transport in oil-impregnated pressboard (1 mm in thickness, ±15 kV) at polarity reversal under HVDC by using the pressure wave propagation (PWP) technique [34], and significant field distortion was observed when the polarity reversal occurs. In recent years, researchers have paid more attention to the charge dynamics under polarity reversal voltage in single layered oil impregnated paper/pressboard [35,36,37].
Figure 17. Polarity reversal of DC voltage.
Energies 09 00053 g017
Space charge dynamics in oil gap and thick pressboard combined system (l mm thick pressboard with a 0.5 mm thick oil film) under polarity reversal voltage were researched in Southampton [35]. Three kinds of oil, which were fresh, medium aged and severely aged oil were used. Compared with the fresh and medium aged oil, the charge injection enhanced greatly in the severely aged oil samples. The electric field was significantly distorted during the first stage of DC stressing process for the aged oil. After polarity reversal, most of the space charges had dissipated. Therefore, only a small electric field enhancement in the oil could be observed. Then significant homo-charge injection occurred again and the “mirror image effect” was observed (Figure 18).
Figure 18. The “mirror image effect” of electric field distribution [35].
Energies 09 00053 g018
Further investigation of the impacts caused by the duration of polarity reversal process was performed on both the fresh oil immersed paper sample and the aged oil immersed paper sample. For the fresh oil sample, the electric field enhancement in the oil gap is smaller than 10% immediately after the application of the reversed voltage. Therefore, the polarity reversal durations have limited influence on the electric field enhancement. For the aged oil sample, the electric field across the oil gap could be significantly enhanced by voltage polarity reversal. A shorter reverse period could lead to a higher the electric stress enhancement (Table 1). The same conclusions could be found in [36], which indicates that the reversal period (reversal time) is proved to have an effect on space charge accumulation.
Table 1. Impacts of the duration of polarity reversal process in the aged oil sample under 20 kV/mm.
Duration t2 (Min)Peak value of the Ground Electrode (C/m3)Maximum Electric Field (kV/mm)Field Enhancement in the Oil Gap (%)
0.51542.1110.5
29.327.236
58.526.633

3.7. AC Electric Field

Due to the complexity of the testing and the hardware restriction, the research on the space charge characteristics of insulating materials under AC stressing lags quite behind that under DC conditions. Especially for the oil-paper insulation, it has not been widely carried out, though it is quite an interesting and important topic and has been investigated in Southampton since 2010.
The sample was oil-impregnated insulation paper aged for 22 days, under an AC electric field of 60 kV/mm (peak to peak). According to the research results shown in Figure 19, the amount of space charge accumulated in the oil-paper insulation sample under sinusoidal AC conditions was reduced significantly compared to that under DC conditions [38]. However, there were some positive charges observed to accumulate in the paper layer near the Al electrode. The oil properties had an obvious impact on the charge distribution. The severe deterioration of the oil could lead to a larger amount of charges injected into the oil-impregnated insulation paper [39].
Figure 19. AC volt-on space charge behaviour in a sinusoidal cycle at 120 min for oil immersed paper sample (60 kV/mm, peak-peak) [36]. (a) new oil immersed paper; (b) 22 days’ aged oil immersed paper.
Energies 09 00053 g019

4. Key Points for Space Charge Testing of Oil-Paper Insulation Systems

The PEA method was originally developed to measure space charge behaviors in polymer materials, and it has been applied to a broad variety of substances, such as XLPE, LDPE, polyimide and oil-paper, most of which are homogeneous solid materials [40,41,42,43,44]. However, for oil-paper insulation material, due to its loose, porous and hygroscopic structure, as well as multi-layer application, the space charge measurements are much more complicated than those in polymers. When discussing the possible errors that may occur in using the PEA method, much more attention must be paid to the test conditions, the charge density calibration, signal processing, waveform recovery, and charge distribution calculation. Here, some special concerns relating the key points of space charge tests on oil-paper insulation are discussed.

4.1. Test Condition Control

The oil-paper insulation consists of insulation paper (pressboard) and oil, which have high moisture absorption ability and their space charge behavior are strongly influenced by temperature. It is vitally important to control the space charge test conditions strictly so as to ensure the accuracy and reproducibility of test results. The test conditions include, on one hand, the environment parameters of short term testing which may last for hours to days, on the other hand, the relative uniformity of long term testing (from weeks to months).

4.1.1. Relative Humidity (Moisture Content)

For the space charge tests using PEA, the test procedure for one sample usually involves 30 min to 3 h of voltage stressing plus 30 min to 1 h decay, which makes the whole process take hours. Although the oil-paper sample is covered by theupper and lower electrodes, the commonly open to air PEA test cell of the oil-paper sample will not prevent the moisture absorption from the environment, especially for some kinds of oil with a high moisture saturation (Table 2). In that case, the moisture content inside the oil-paper will increase during the test process and cause some inaccuracy in the test results.
Table 2. The maximum moisture content in some kinds of insulating oils.
Karamay 25#Gemini XMIDEL 7131BIOTEMP
Maximum moisture content≥50 ppm≥50 ppm≥1000 ppm≥150 ppm
In most laboratory experiments, oil and paper samples are pre-processed to limit the moisture content to be consistent with a real transformer. However, during the experiment, insulation paper (pressboard) and oil will rapidly absorb moisture until they reach equilibrium with the ambient relative humidity. A simple test on the moisture absorbing ability of preprocessed insulation paper (Weidmann, transformer board TIV/IEC, 1 mm in thickness with an original moisture content of less than 0.5%) placed in an uncovered beaker in the laboratory is shown in Figure 20. It suggests that once open to the air, the dry paper sample would quickly absorb moisture, and the moisture content increases rapidly within the first few hours. The same goes for oil and oil-paper though the distribution and equilibrium inside oil-paper are quite complicated. The unexpected increase of moisture in oil-paper during the test will influence the signal processing and subsequent analysis of space charge behavior.
Figure 20. The moisture absorbing ability of pre-processed insulation paper.
Energies 09 00053 g020

(1) Influence on the space charge behavior

Results from Southampton in [14] show that the moisture content, even within 5%, has a great influence on the charge injection, movement and accumulation. The higher the moisture content of the oil-paper sample, the higher the mobility of the charges, and more positive charge injection and negative charge injection were observed. Moreover, the higher mobility of the charges leads to less slow moving charges trapped in the sample with higher moisture content. While for the sample with 4.96% moisture content, due to its higher conductivity, the charges injected in the sample could transport to the opposite electrode rapidly, thus fewer charges were trapped and could be measured. According to Figure 20, under room temperature and a normal relative humidity, the time for the preprocessed insulation paper sample to reach a moisture content of 5% is less than 6 h. Therefore, more attention should be paid to the influence of an unexpected increase in moisture content.

(2) Influence on the signal processing of space charge test

In the PEA test, an electric pulse is applied to the test sample, resulting in a perturbation force at the space charge location, which generates an acoustic wave. The final output space charge information is calculated from the voltage signal provided by the piezoelectric sensor, which is originally transferred by the detected acoustic wave. Therefore, the propagation of the acoustic wave inside the specimen, the oil-paper insulation, in this case, should be carefully investigated.
In general, the acoustic velocity V in solids and liquids (one dimensional) are given by the Newton-Laplace equation:
V solid = E / ρ ,   V fluid = K / ρ
where E is the Young’s modulus, K is the bulk modulus of the fluid.
The relationship between acoustic velocity V (m/s) in mineral oil and water content P (%) is given below:
V = a 0 + a 1 P
where, a 0 and a 1 are constant for a specific fluid under a certain temperature.
As it can be seen in Equations (2) and (3), the variation in moisture content also has an influence on the acoustic velocity in the oil-paper insulation material. A higher water content can lead to a higher acoustic velocity. Therefore, the moisture will lead to a variation of space charge distribution in the time domain.

4.1.2. Environment Temperature

For scientific work, room temperature is normally taken to be about 20 °C to 26 °C with an average of 23 °C. In the uncontrolled environment of the indoor laboratory, the temperature variation from lowest to highest in a test period could reach 15–20 °C. For example, a long term ageing experiment (which may last for months) implies a long duration of the space charge tests on samples with different degrees of ageing. Therefore, the relative humidity and the variation in temperature have an influence on both the space charge behavior and the signal processing of space charges in oil-paper.
The speed of sound in mineral oil in the pressure range of 0–1400 bar and the temperature range of 10–121 °C is shown in Figure 21 [45]. An increase in temperature could lead to a decrease of the magnitude of the acoustic wave within the test sample. Besides, the PVDF, which is used as an important component in the PEA test cell to convert the acoustic signal into electrical signal is also sensitive to temperature variations. For example, the pyro-electrical coefficient for a biaxially oriented PVDF film is −24 μC/m2·K [46]. Though the PVDF characteristics have improved a lot in recent years, the influence of conversion efficiency for PVDF caused by the variation of temperature may still require more attention.
Figure 21. The speed curve of sound in mineral oil [45].
Energies 09 00053 g021

4.2. Signal Processing and Recovery

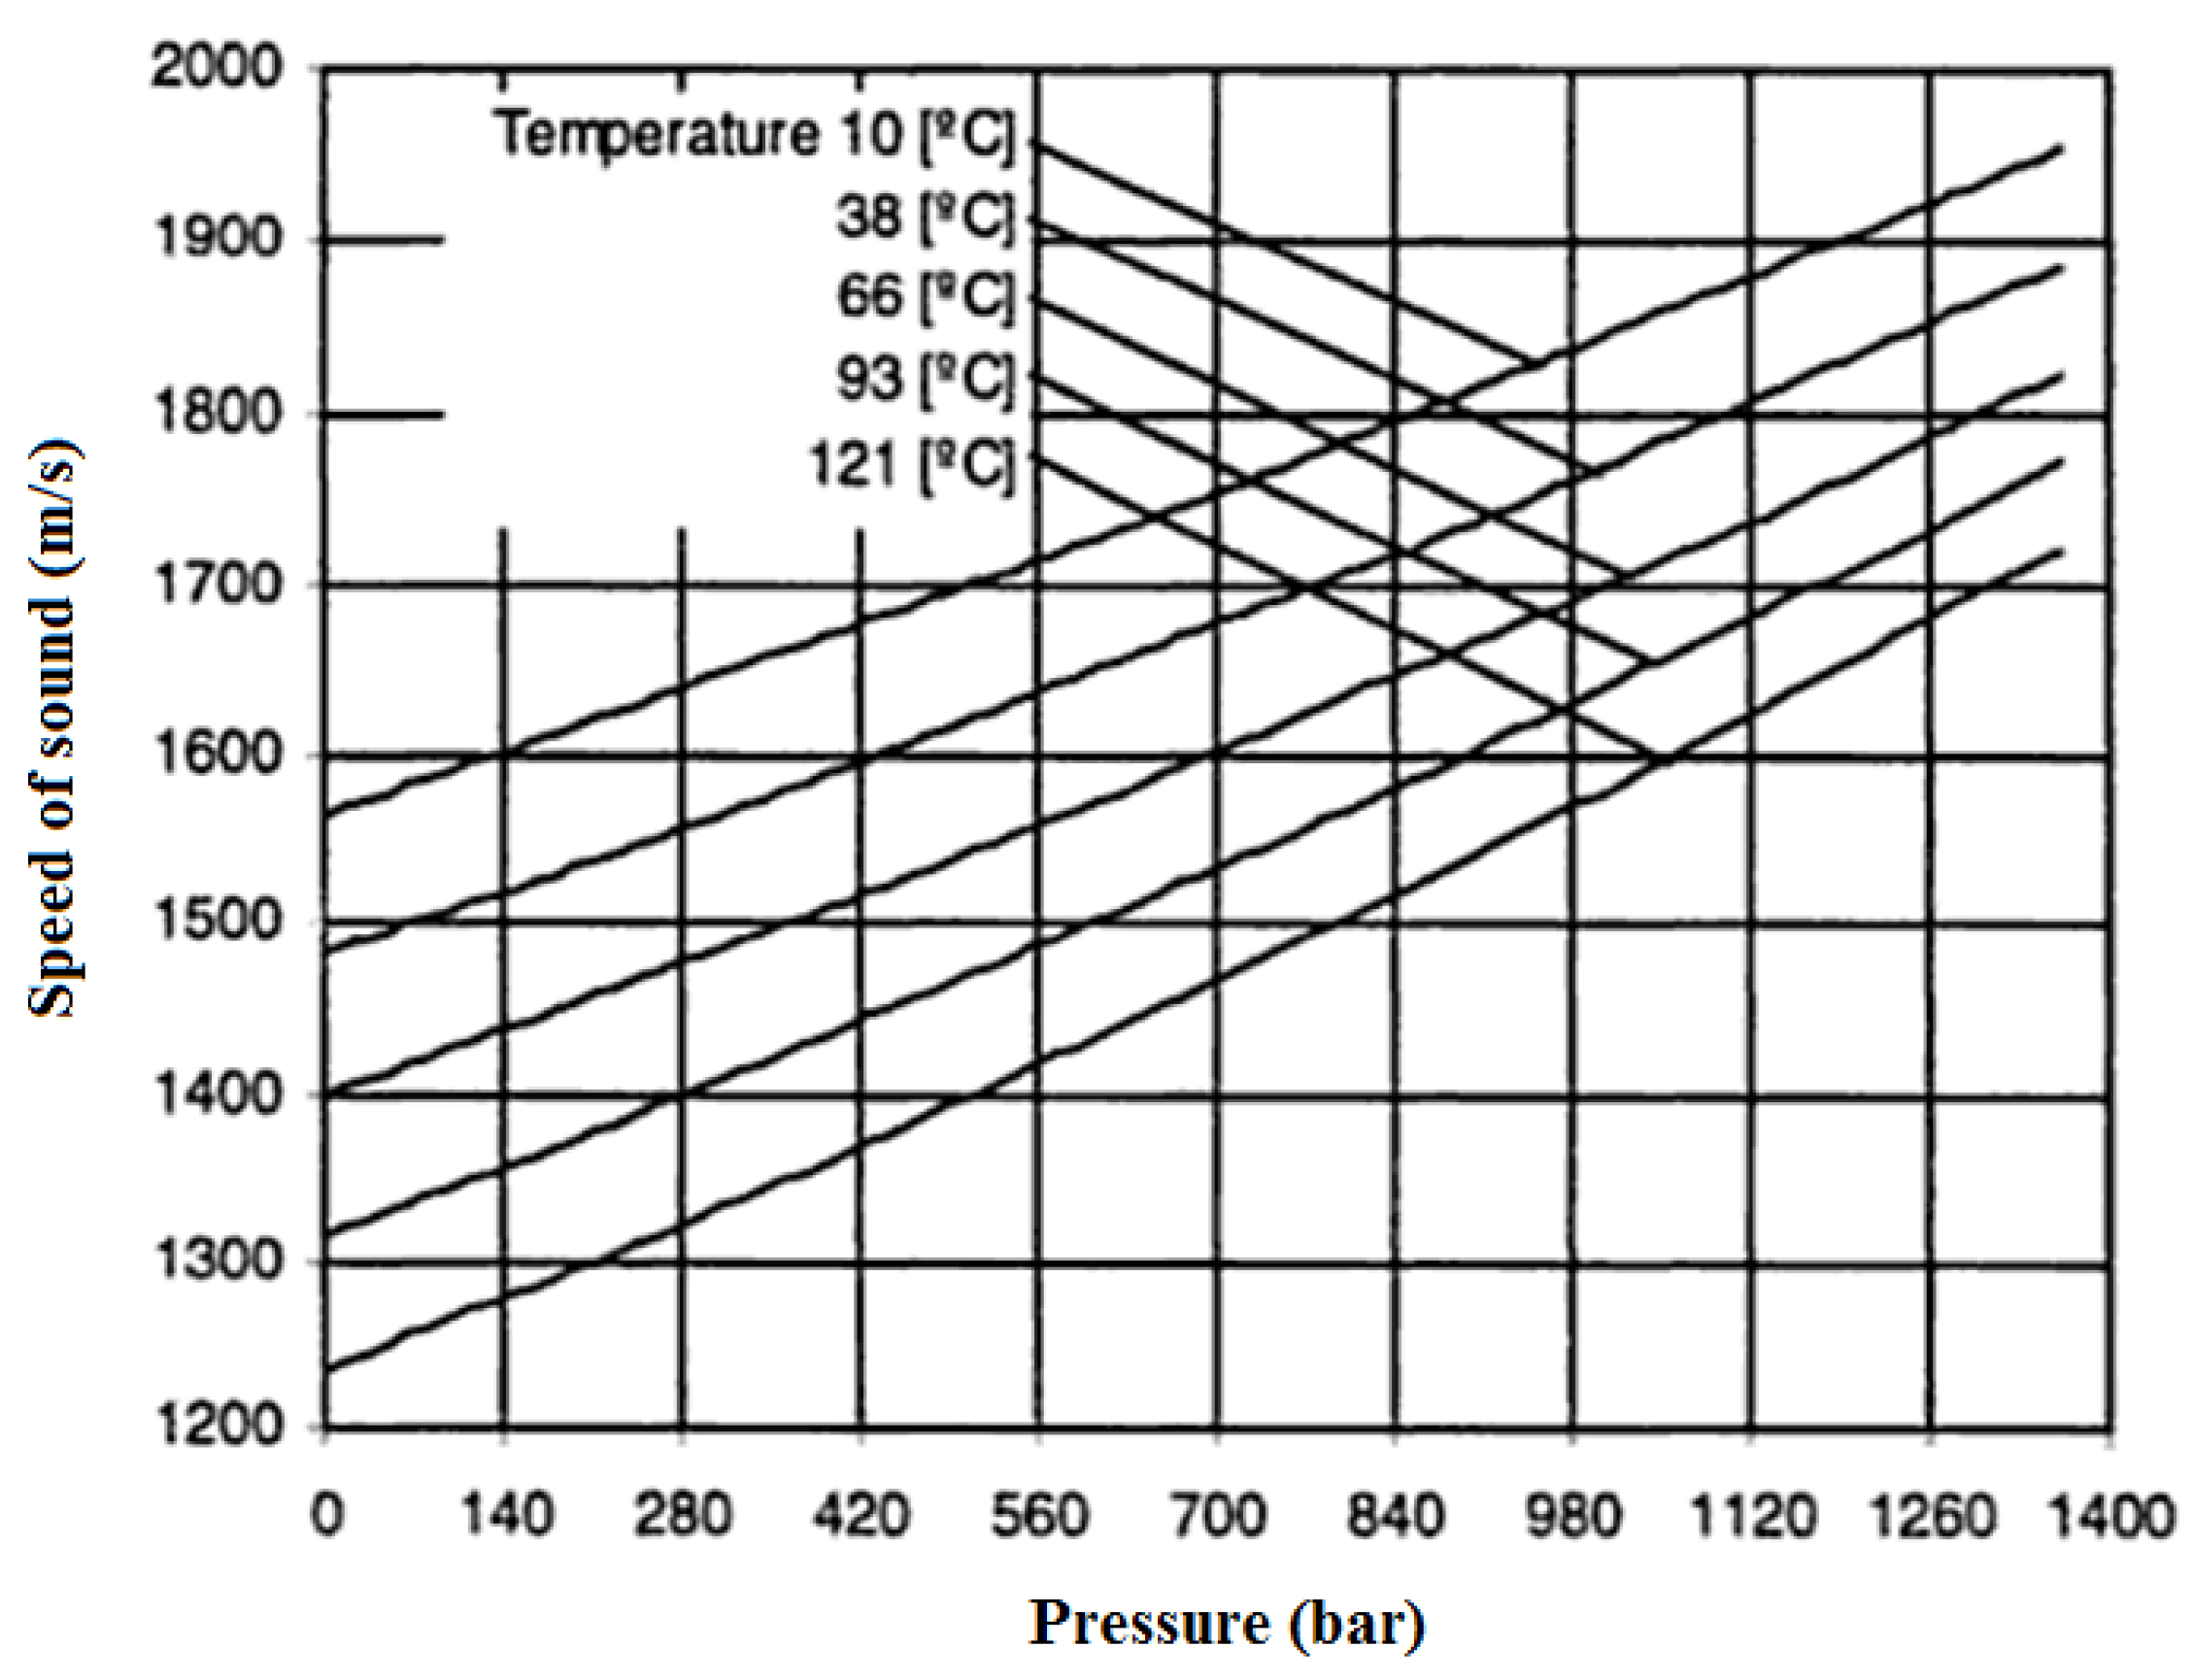
4.2.1. Acoustic Impedance

The PEA method is based on the generation and propagation of acoustic waves [47]. In the case of different sample layers or multi-layers, a key point is the acoustical mismatching, which is the difference between acoustic impedances of the materials contacted with each other. This needs to be paid more attention in the calculation of wave generation, transmission and reflection. Particularly, to evaluate the space charge distribution in a multi-layer dielectric using the PEA method the relation between the detected acoustic and the attenuation of acoustic propagation must also be taken into consideration. The attenuation could be divided into two kinds, one happens when the acoustic wave transmits through the interface (from one dielectric to another dielectric, or from one layer to another layer), the other happens during the propagation of the acoustic wave inside the dielectric material.
When an acoustic pulse generates and propagates in the material, it is reflected from the boundary of different layers. The acoustic impedance Z, which is the characteristic property of a material when an acoustic pulse travels through, is defined as:
Z = ρ × V
where, ρ is the material density, V is the acoustic velocity in the material.
Considering the waves traveling through the multi-dielectric as planar waves, the generation coefficient G, the transmission coefficient T and reflection coefficient R can be calculated as [48]:
G i j = Z j Z i + Z j
T i j = 2 × Z j Z i + Z j
R i j = Z j Z i Z i + Z j
where, “i” is the medium from which the wave comes from, “j” is the medium toward which the wave is traveling.
Therefore, the greater the impedance mismatch, the larger the percentage of the sound wave energy that will be reflected at the interface or boundary between one layer and another. Especially for oil and paper, the difference in acoustic impedance between oil and paper is the main reason for the wave attenuation. Furthermore, the change of speed sound will lead to the change of acoustic impedance in different material, which will affect the transmission coefficient and the space charge signal eventually.

4.2.2. Sound Wave Propagation in Multi-Layer Oil-Paper

As mentioned above, besides the interface, when sound travels through a medium, its intensity (energy of the sound wave) decreases as the distance increases. In idealized materials, sound pressure (signal amplitude) is only reduced by the spreading of the wave. As for natural materials, however, all produce an effect that further weakens the energy of the sound wave. This kind of further weakening results from scattering and absorption of the medium during sound wave propagation. Scattering is the reflection of the sound in directions other than its original propagation direction in porous materials, and absorption is the conversion of the sound energy to other forms due to the energy loss of heat conduction and viscosity. The combined effect of scattering and absorption is called attenuation, which can be calculated by the decay rate of the wave as it propagates through the material. Here, taken the sample with two layers (one oil immersed paper layer and one oil layer, Figure 22) for an example, the sound wave propagation and the calculation of attenuation and dissipation are presented.
Figure 22. Sound wave propagation in oil and oil immersed paper.
Energies 09 00053 g022
When the attenuation and dissipation are ignored, the pressure wave P 0 (expansion wave or compression wave) generated at the position 1 ( x = 0 ) travels through layer A (insulation paper), layer B (insulating oil), electrode 2 (layer C, EL 2), and finally reaches the PVDF (layer D), the final pressure wave P 1 received by PVDF can be calculated by:
P 1 = P 0 × T AB × T BC × T CD
where, T AB is the transmission coefficient from layer A to B, T BC is the transmission coefficient from layer B to C, T CD is the transmission coefficient from layer C to D.
The amplitude change of a decaying plane wave can be expressed as considering attenuation factor:
A = A 0 e α x
where A0 is the unattenuated amplitude of the propagating wave at the initial location ( x = 0 ). The amplitude a is the reduced amplitude after the wave has traveled a distance x from that initial location. The quantity is the attenuation coefficient of the wave traveling in the x-direction. The term e is the exponential (or Napier’s constant) which is equal to approximately 2.71828.
Then the pressure wave P 1 which received by PVDF after attenuation can be calculated by:
P 1 = P 0 × e α A x × T AB × e α B x × T BC × e α C x × T CD
where, α A is the attenuation factor of layer A, α B is the attenuation factor of layer B, α C is the attenuation factor of layer C.
If the dispassion factor is taken into consideration, the final pressure wave P 1 can be calculated as follows:
P 1 = P 0 × e α A x × e A x × T AB × e α B x × e B x × T BC × e α C x × e C x × T CD
where, β A is the dispassion factor of layer A, β B is the dispassion factor of layer B, β C the dispassion factor of layer C.
In fluids, the classical equation for calculation of attenuation factor is:
α = 2 π 2 f 2 ρ V 3 [ 4 3 η + ( γ 1 ) k c P ]
where, f is the frequency of sound wave, ρ is the density of material, V is the speed of sound, η is the shear viscosity of material, γ is the ratio of specific heat capacities, k is heat conductivity, and c P is the constant-pressure specific heat.
The calculation of dispassion factor is [49]:
( f ) = 2 π f V
In general, to calculate the space charge revolution inside oil-paper precisely, the attenuation and dissipation of acoustic wave propagation should be taken into consideration, and the transmission attenuation at the interface as well. When a temperature gradient exists between the two electrodes, this will be quite complicated since the density of the material is not homogeneous anymore and the acoustic velocity is not a constant but varies with the temperature gradient. This will be presented in future work.

5. Recent Research Results

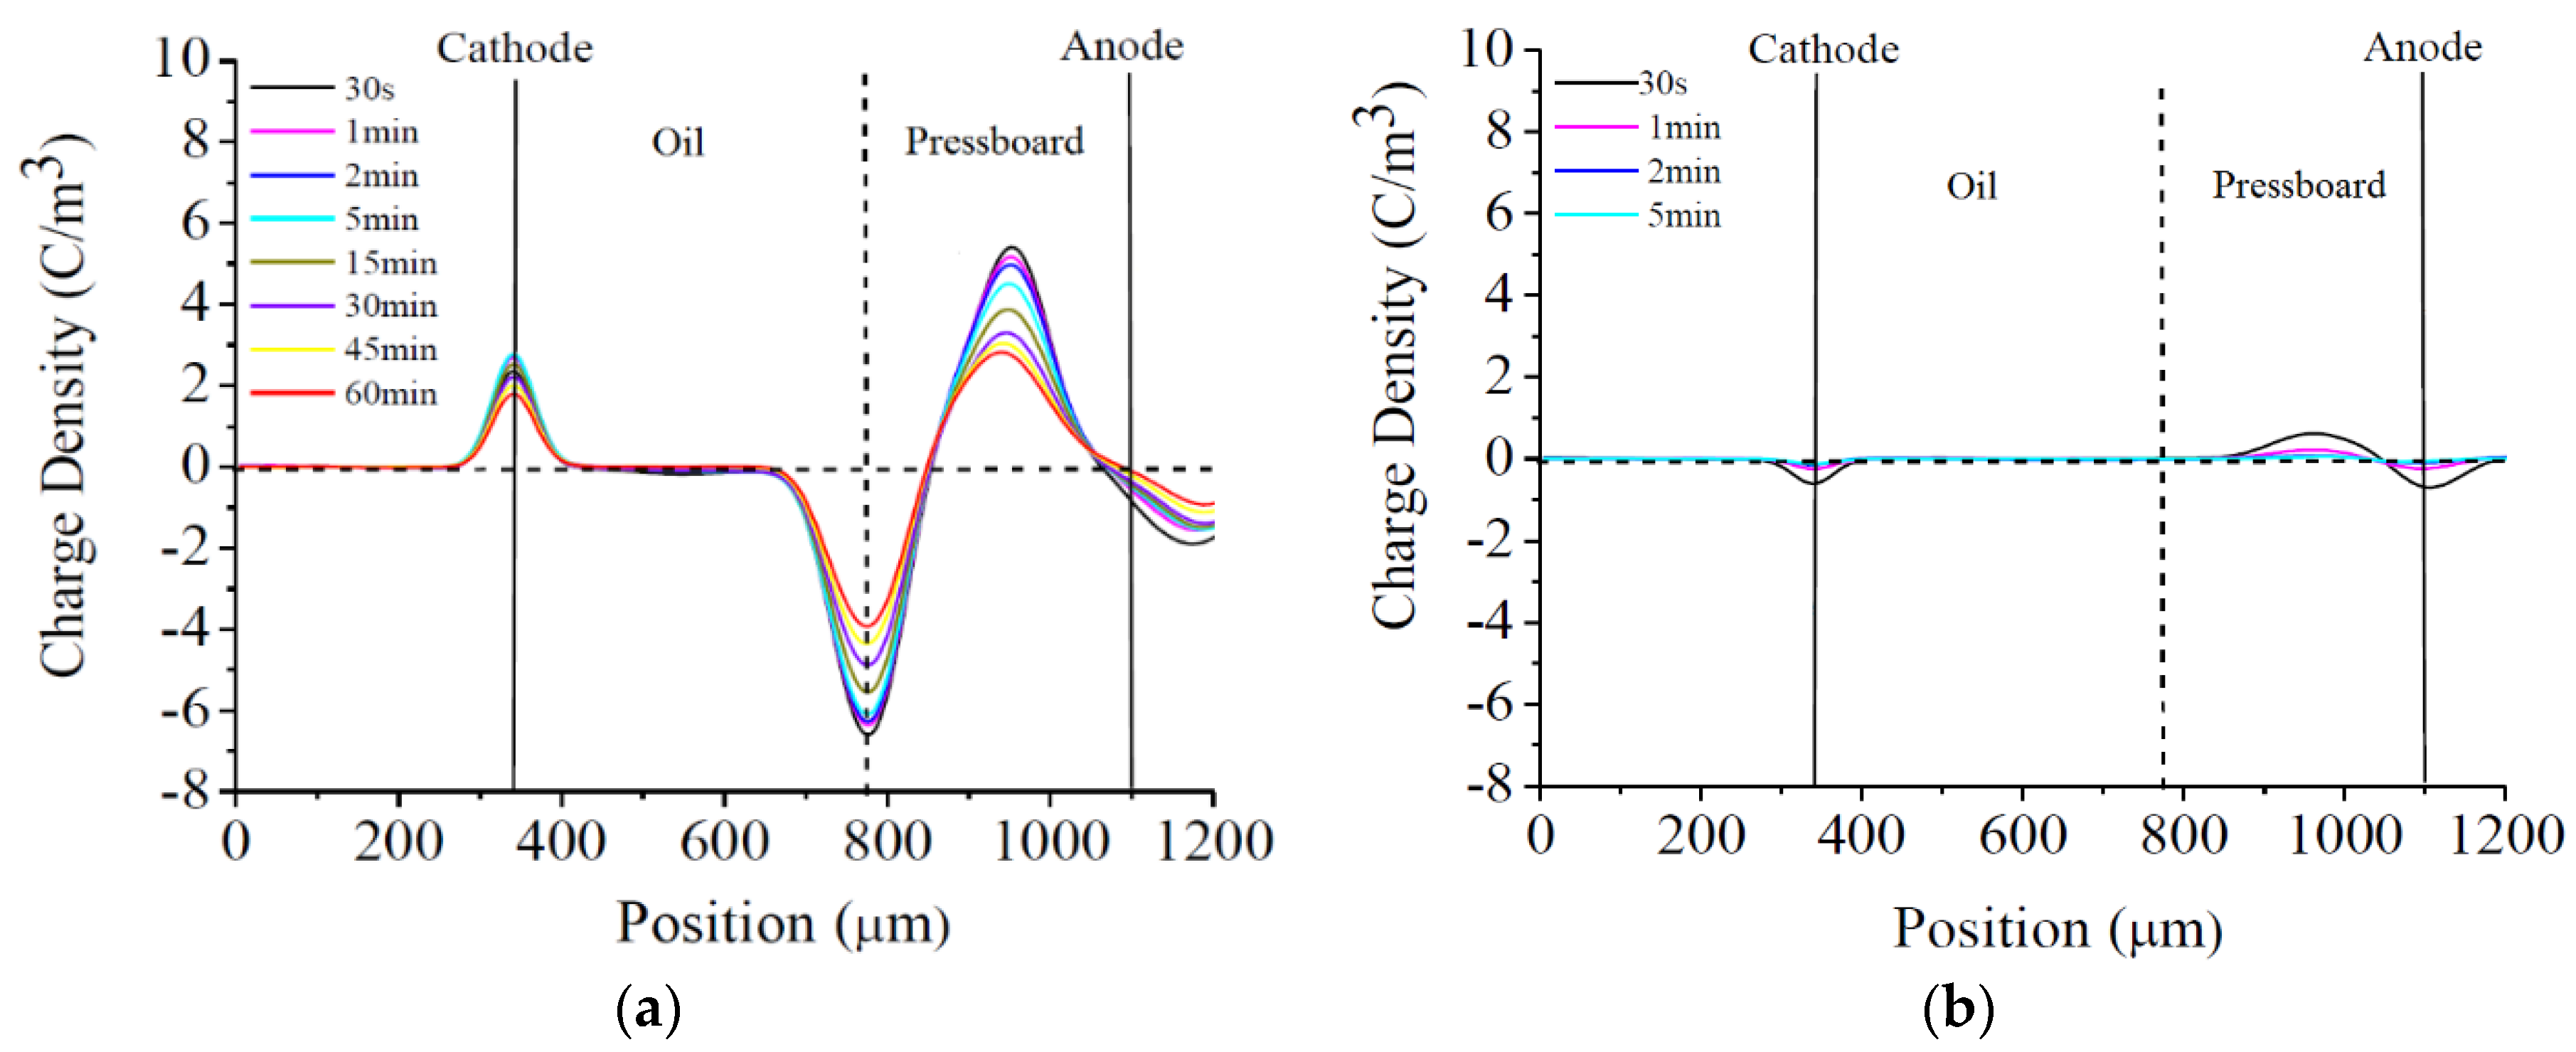
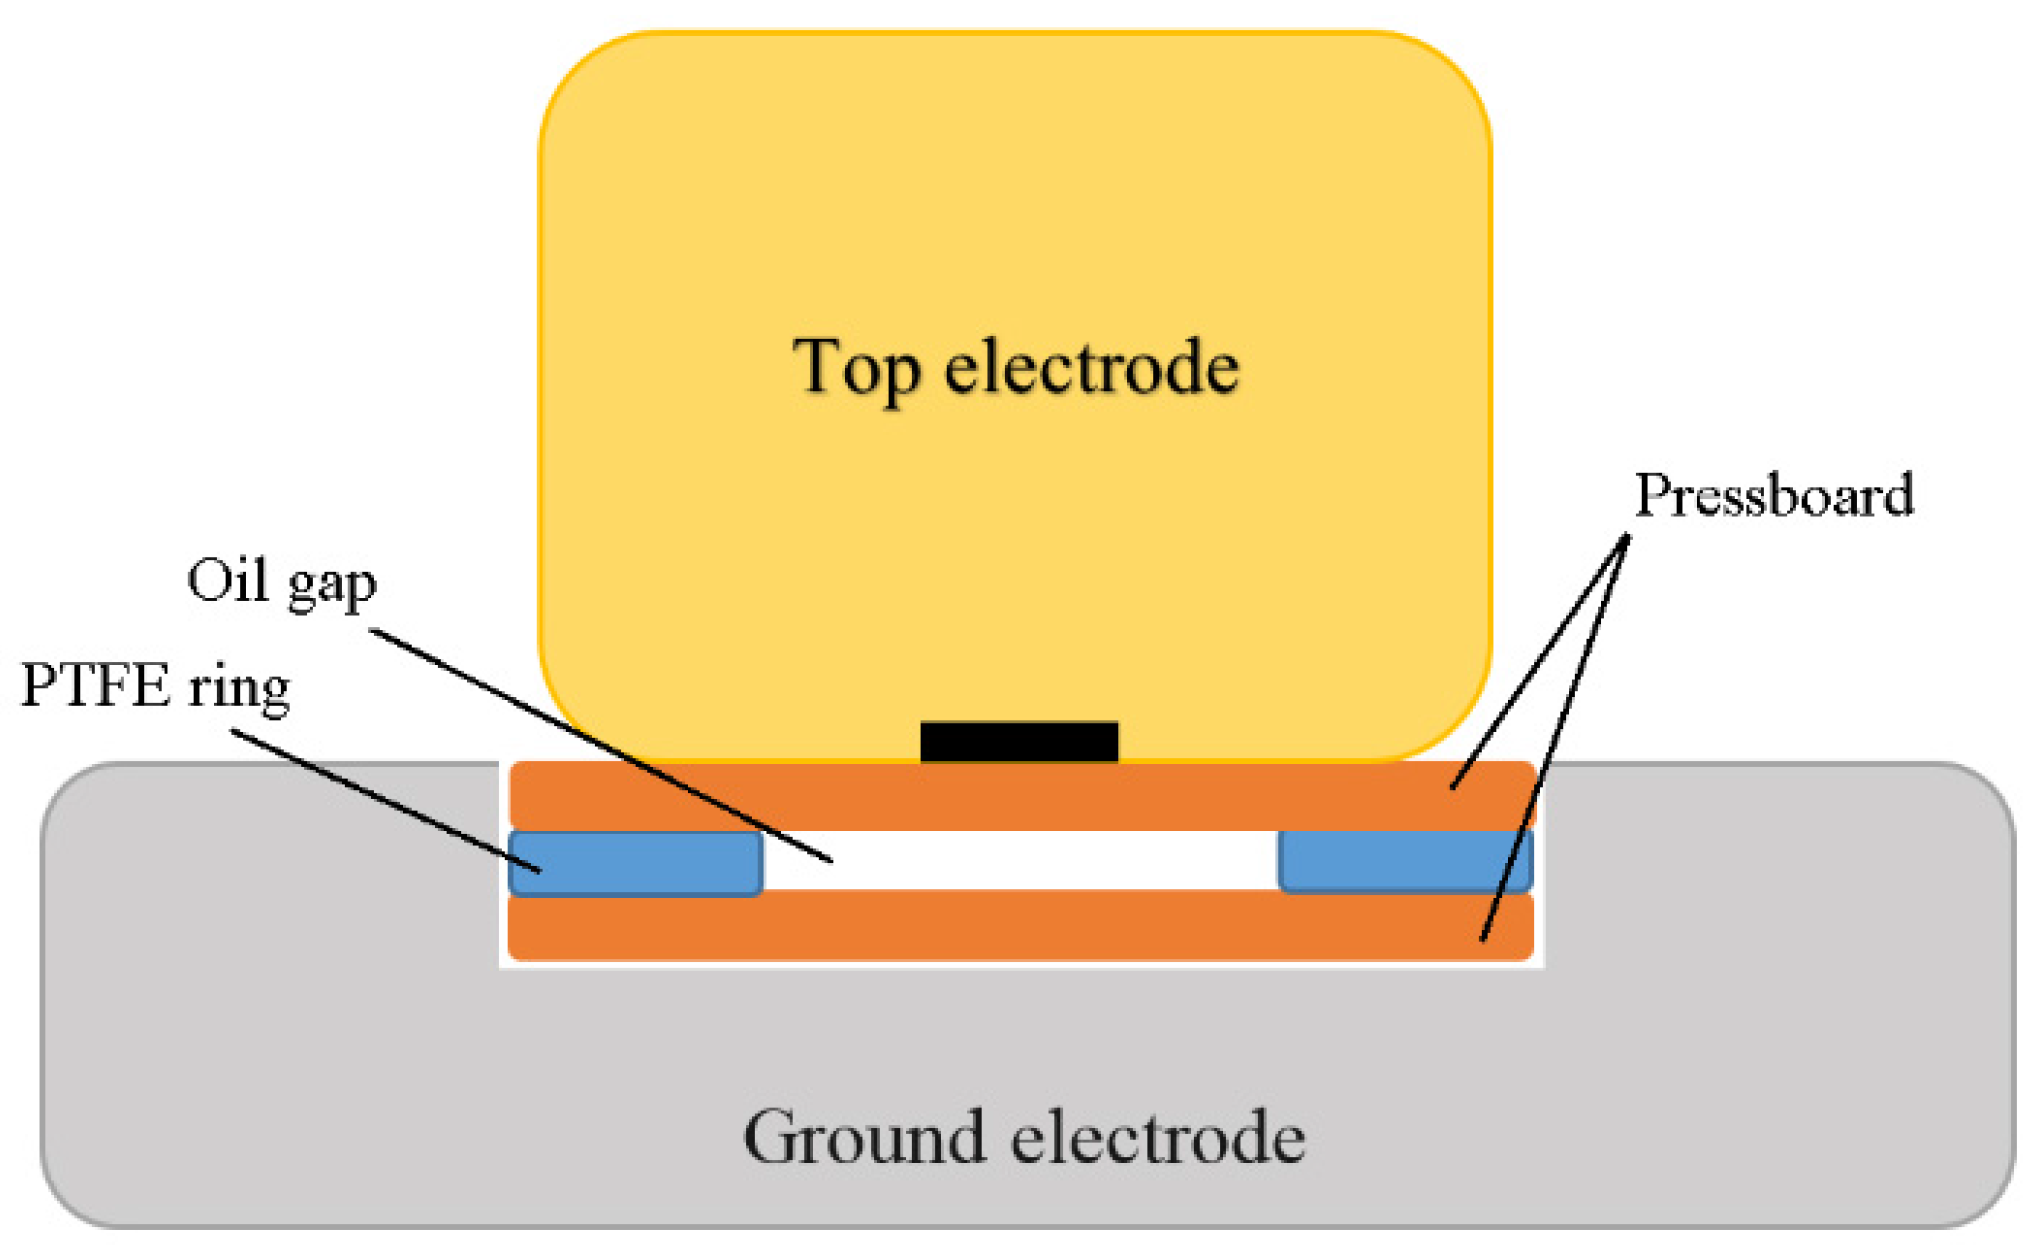
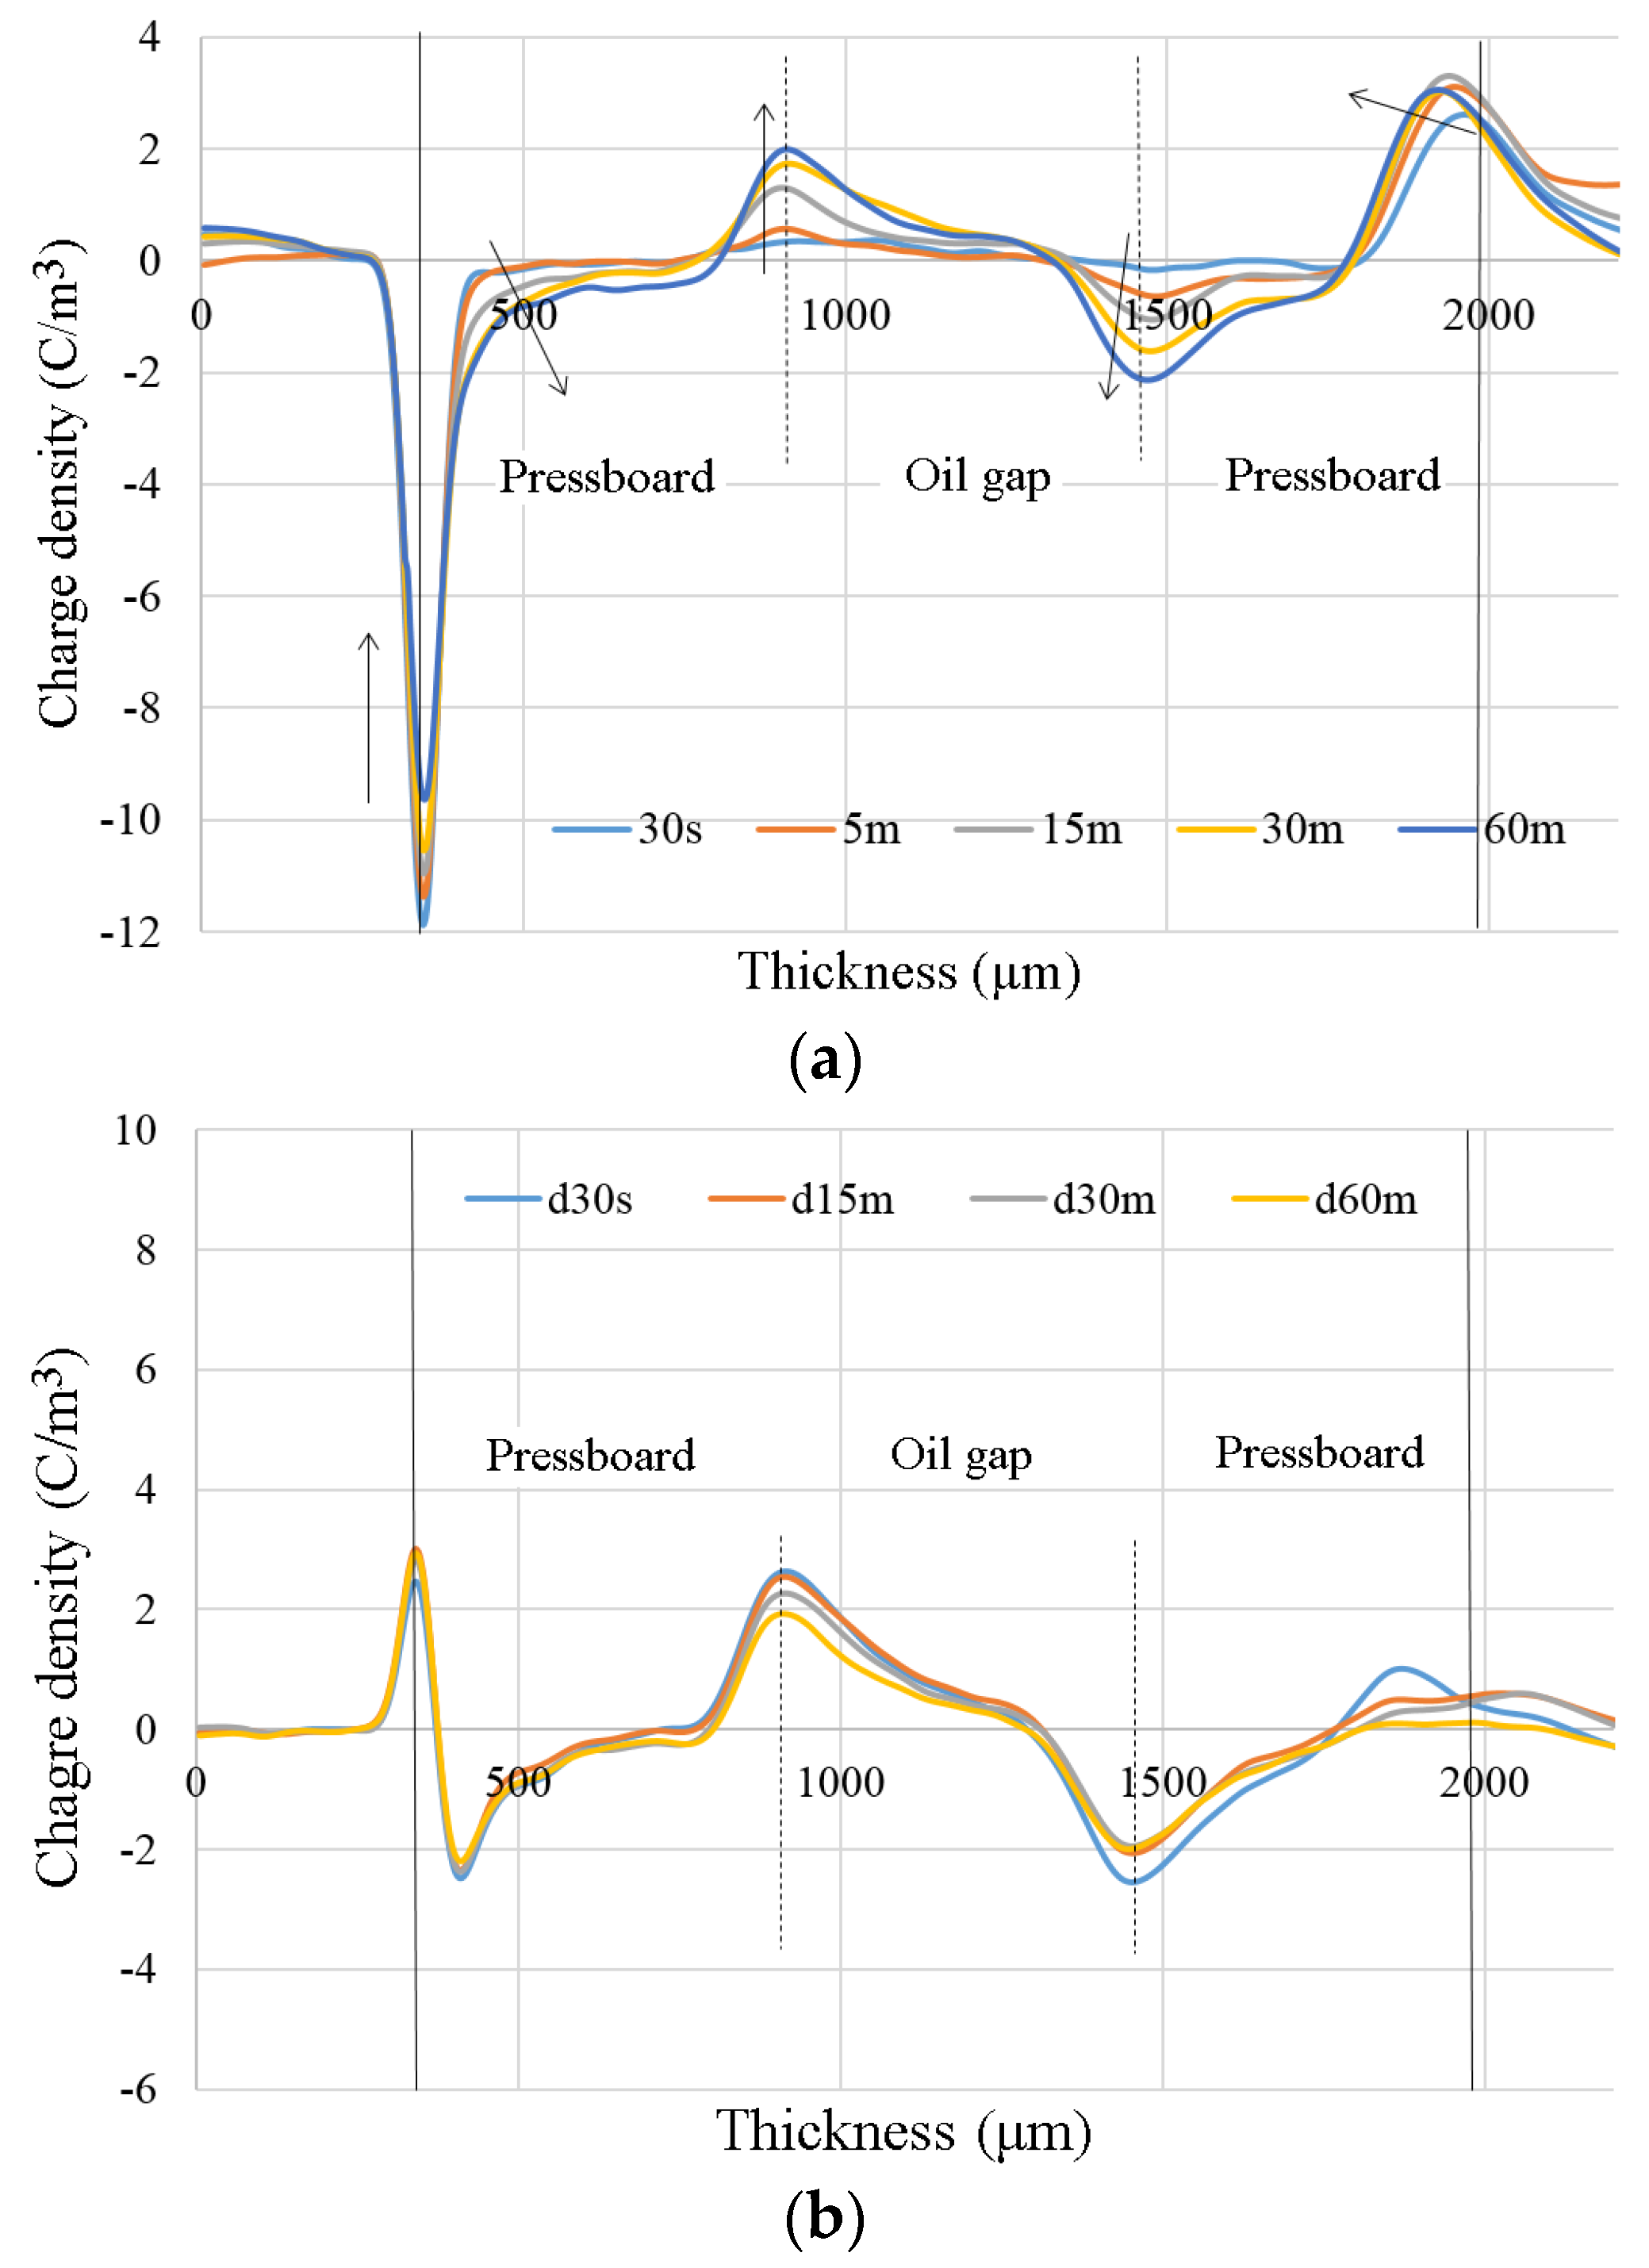
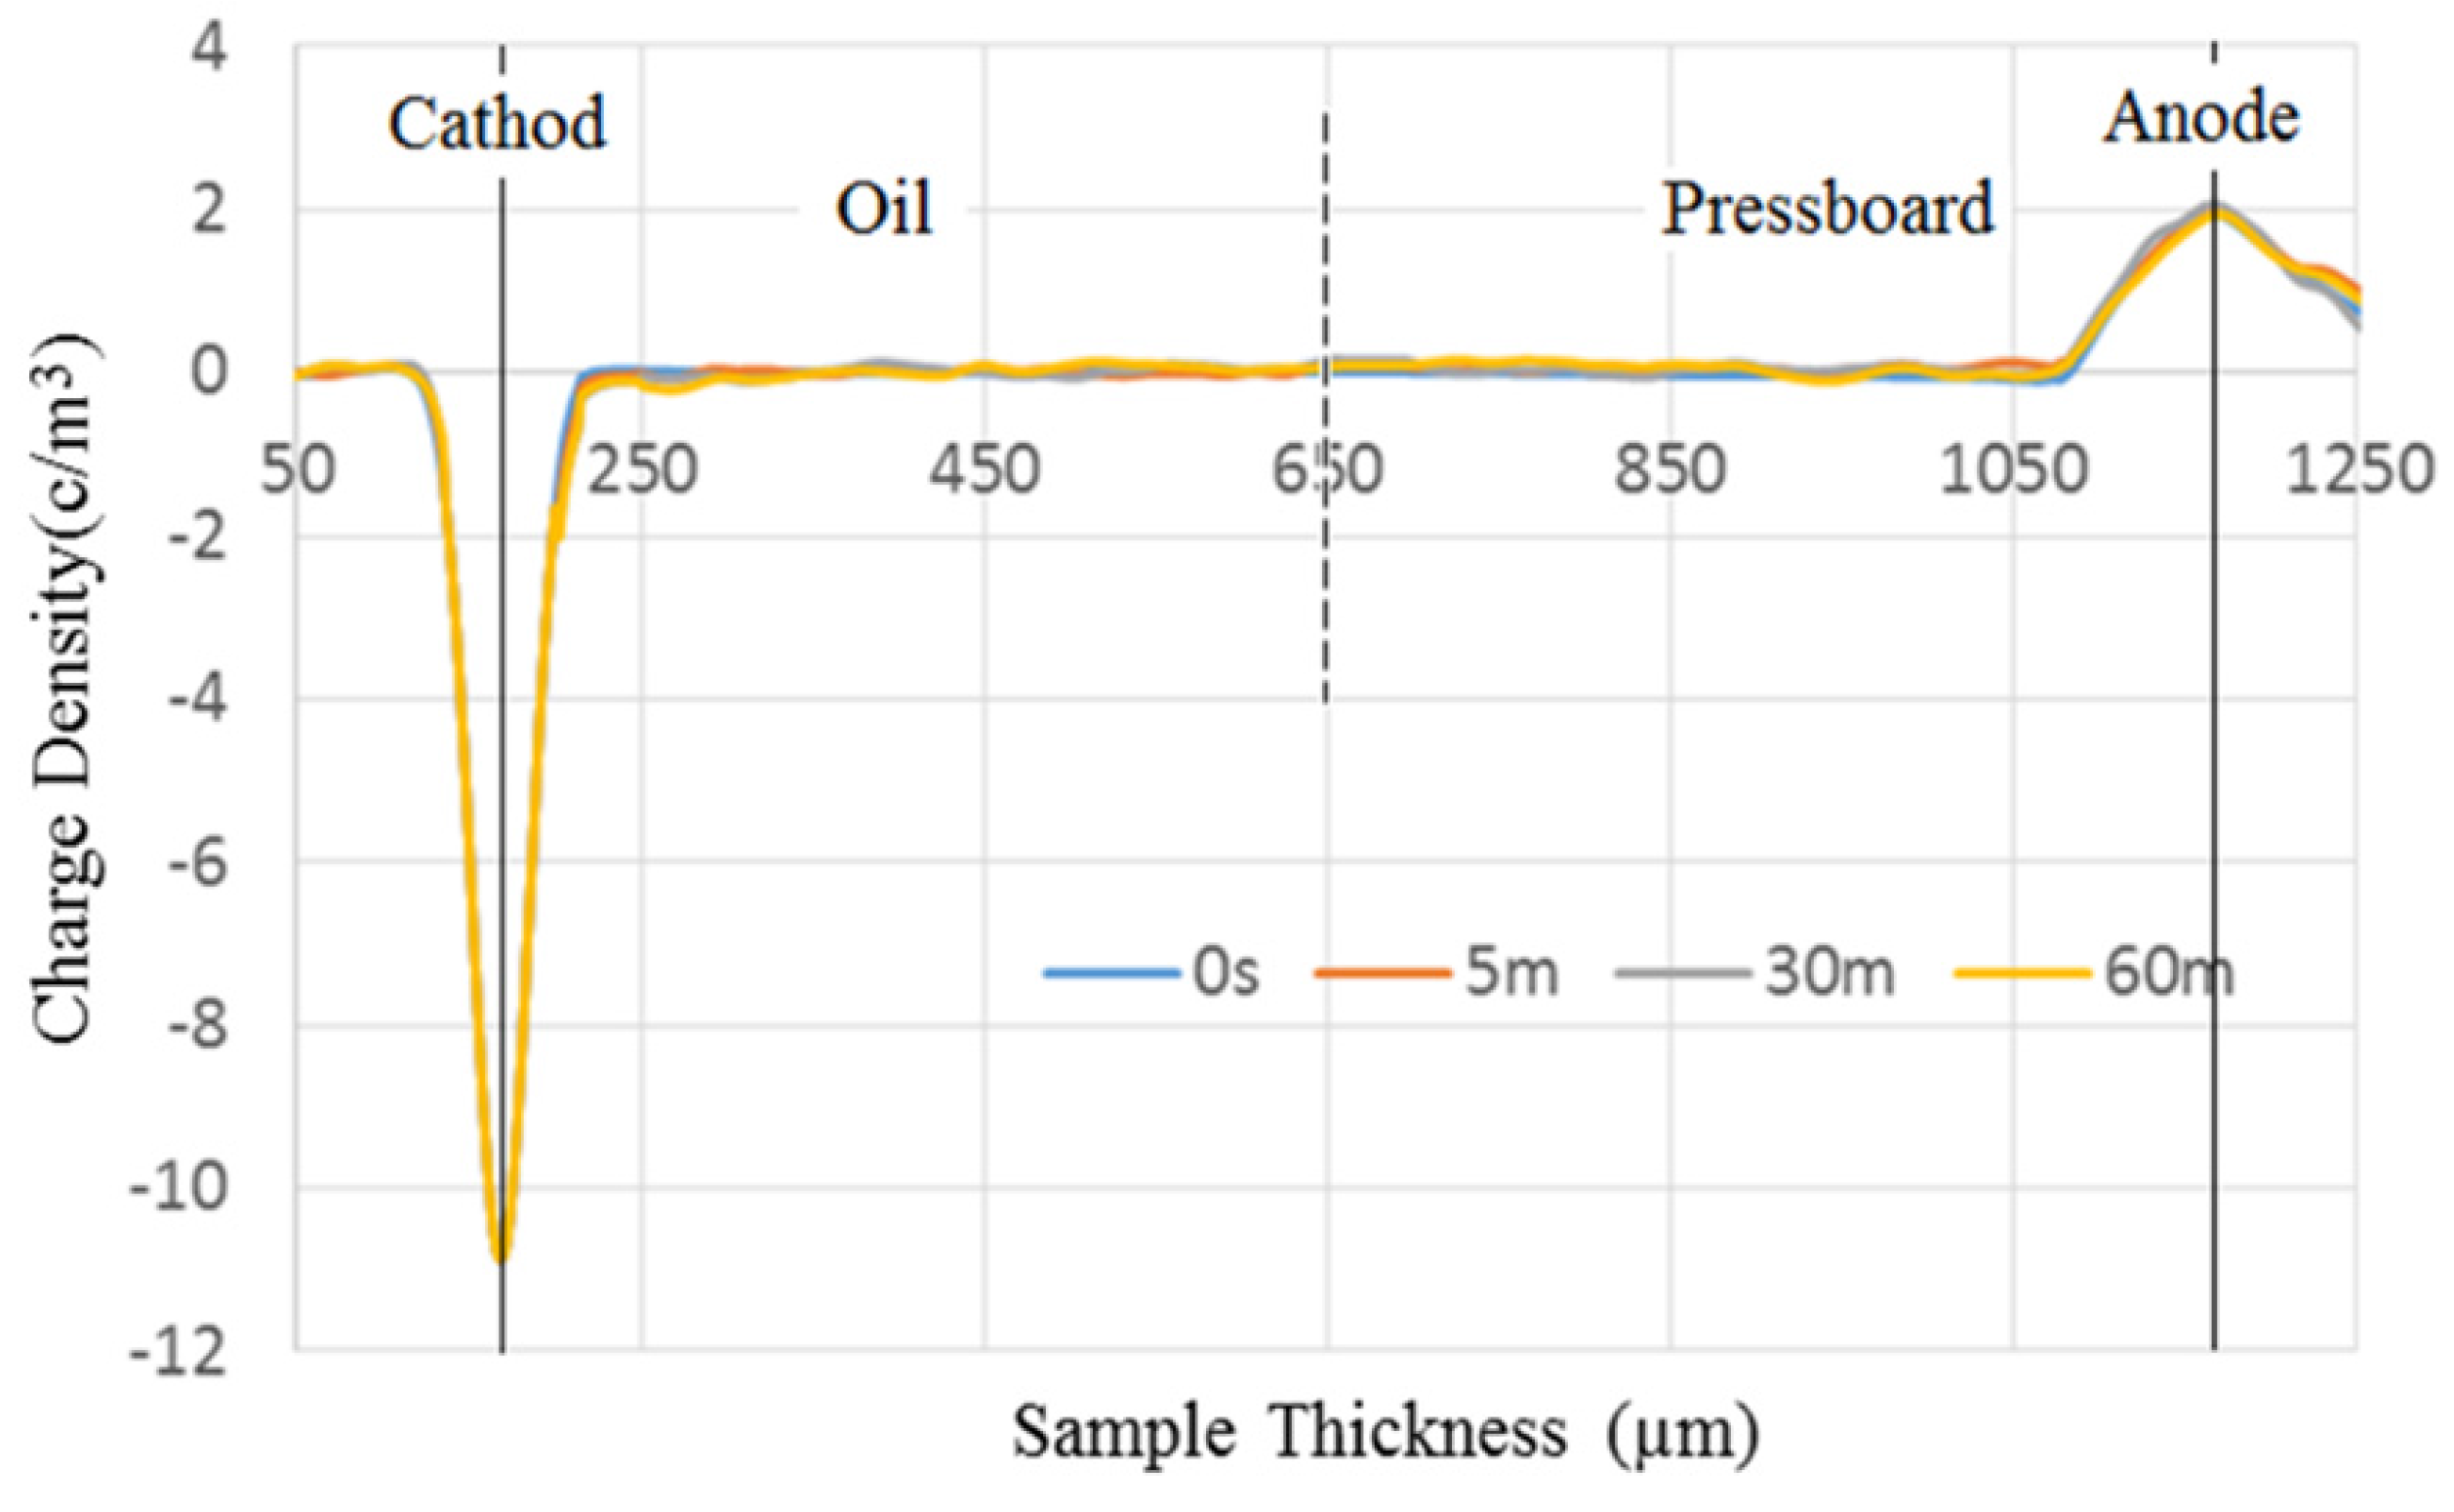
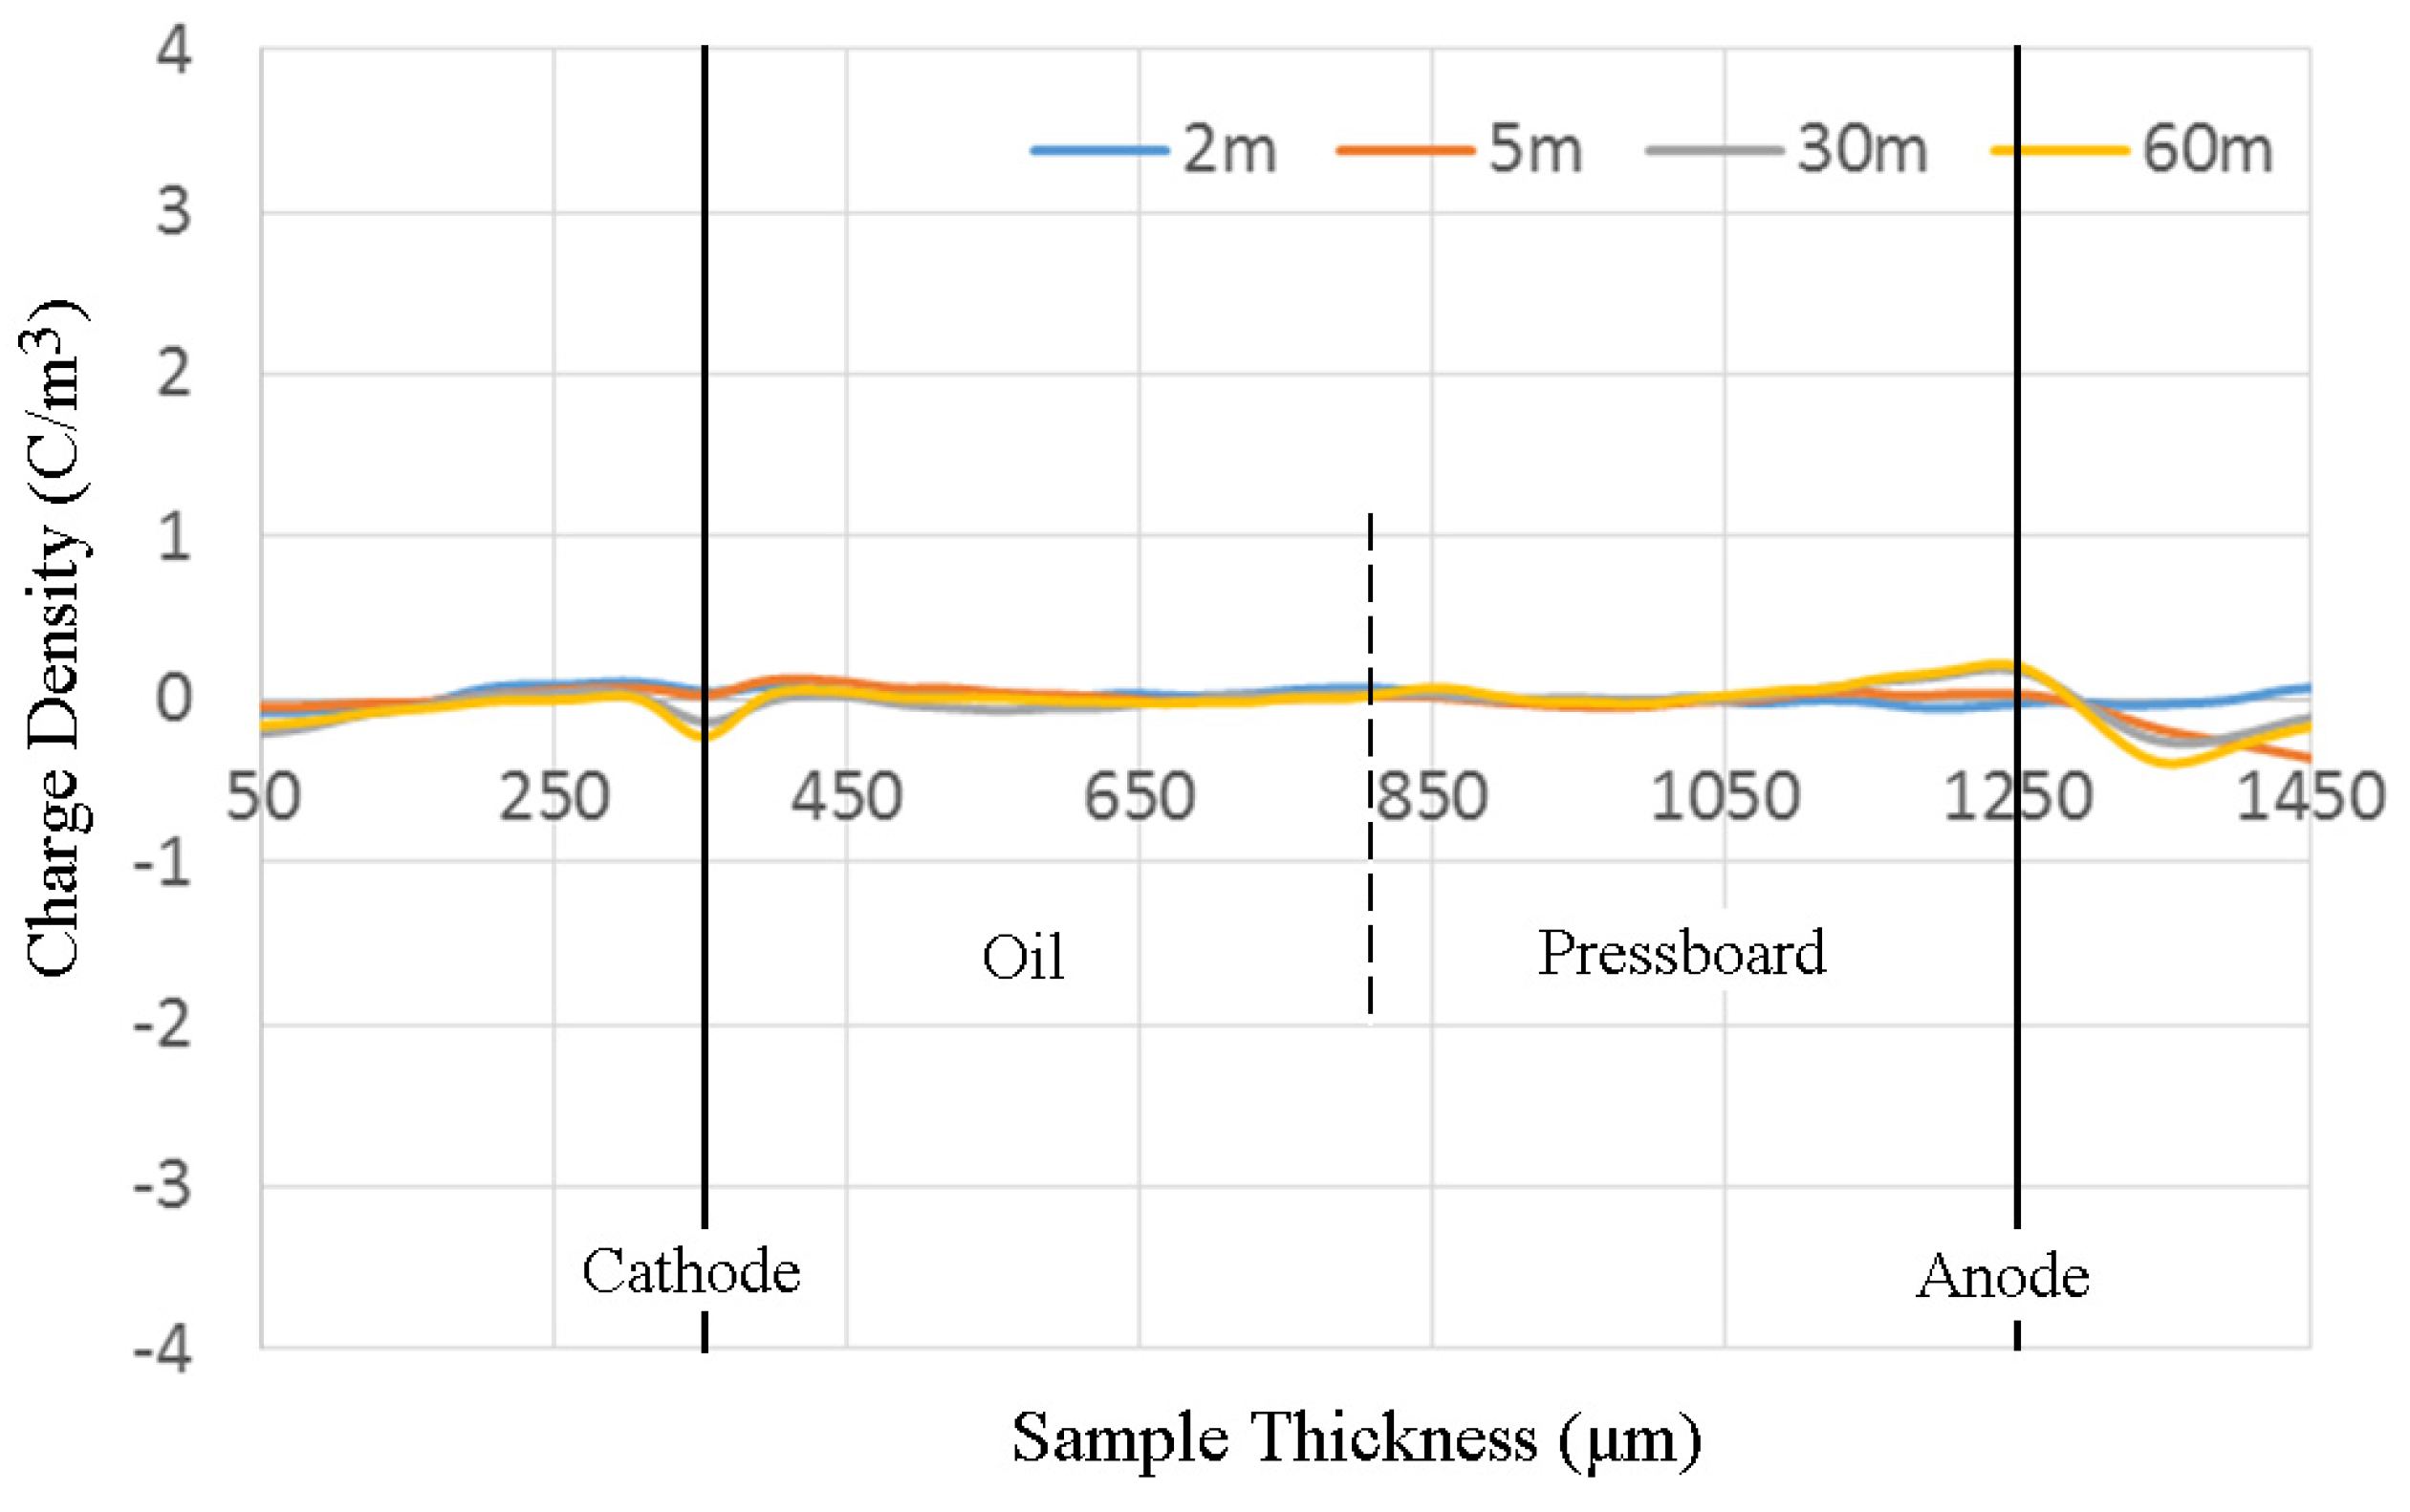
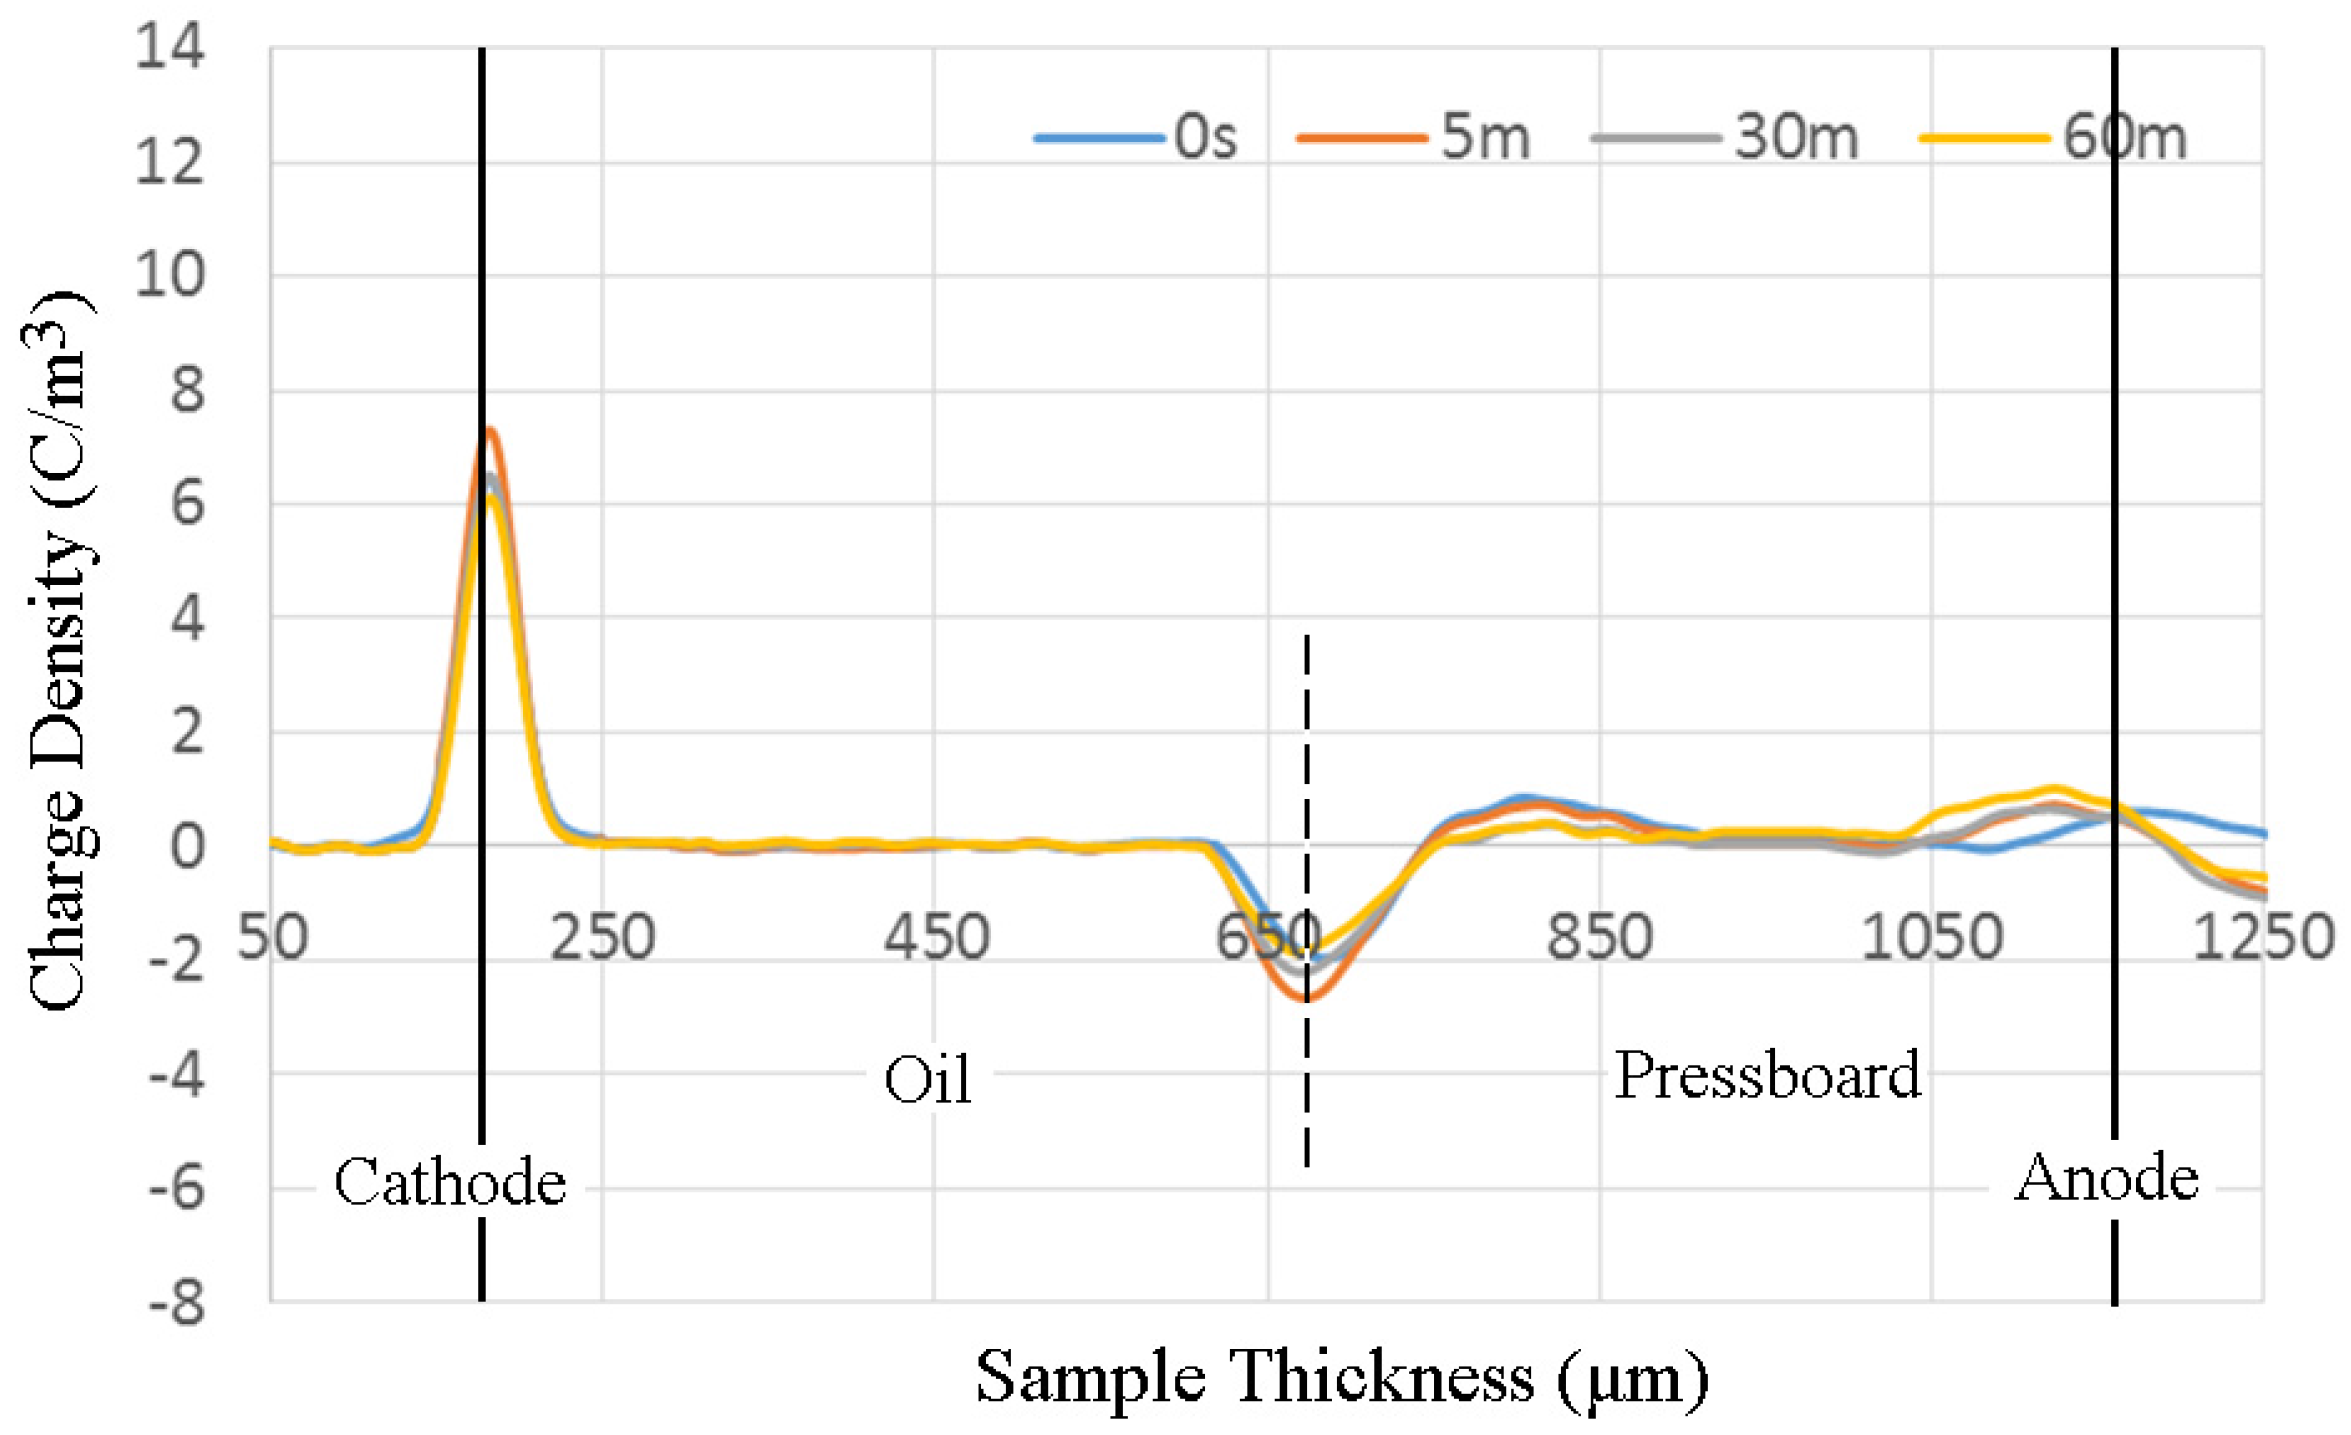
5.1. Space Charge Dynamics in Pressboard-oil-pressboard Multilayer System

In the research at the University of Southampton, the space charge behavior of a sandwiched structure consisted of two layers of 0.5 mm impregnated pressboards and one layer of 0.5 mm mineral oil gap (Figure 23) is under investigation. It is used to simulate the space charge behavior within the multilayers configuration of the real converter transformer. The space charge characteristics are investigated by a purpose built PEA system at room temperature [50].
Figure 23. The structure of insulation system and electrode system [48].
Energies 09 00053 g023
Once the DC voltage is applied, charges accumulate at the interfaces between oil gap and pressboards gradually (Figure 24a). Positive charges accumulate at the first interface between the oil gap and the first layer of the pressboard, whilst negative charges accumulate at the other interface between the oil gap and the second layer of the pressboard. It satisfies the Maxwell-Wagner polarization that charges could form at the interfaces on the condition that there was discontinuity of permittivity and conductivity for different materials. The decay experiments are realized by removing the external voltage. The results reveal the real space charge profile within the insulation. As shown in Figure 24b, with one hour of depolarization time, the accumulated charges decrease slowly, suggesting the mobility of the accumulated charges is small in multilayer fresh oil and oil-impregnated pressboard.
Figure 24. Volt-on (20 kV/mm) (a) and decay (b) results in multilayer oil and oil-impregnated pressboard [50].
Energies 09 00053 g024
It is worth noting that in insulation liquid (insulation oil), the concept of mobility is limited [51]. The limitations are largely due to fluid motion and the range of species that can be positive and negative carriers. Therefore, from charge mobility perspective, more attention should be paid to the analysis in insulation liquid.

5.2. Space Charge Dynamics of Oil-Paper and Oil Gap under Combined AC and DC Voltages

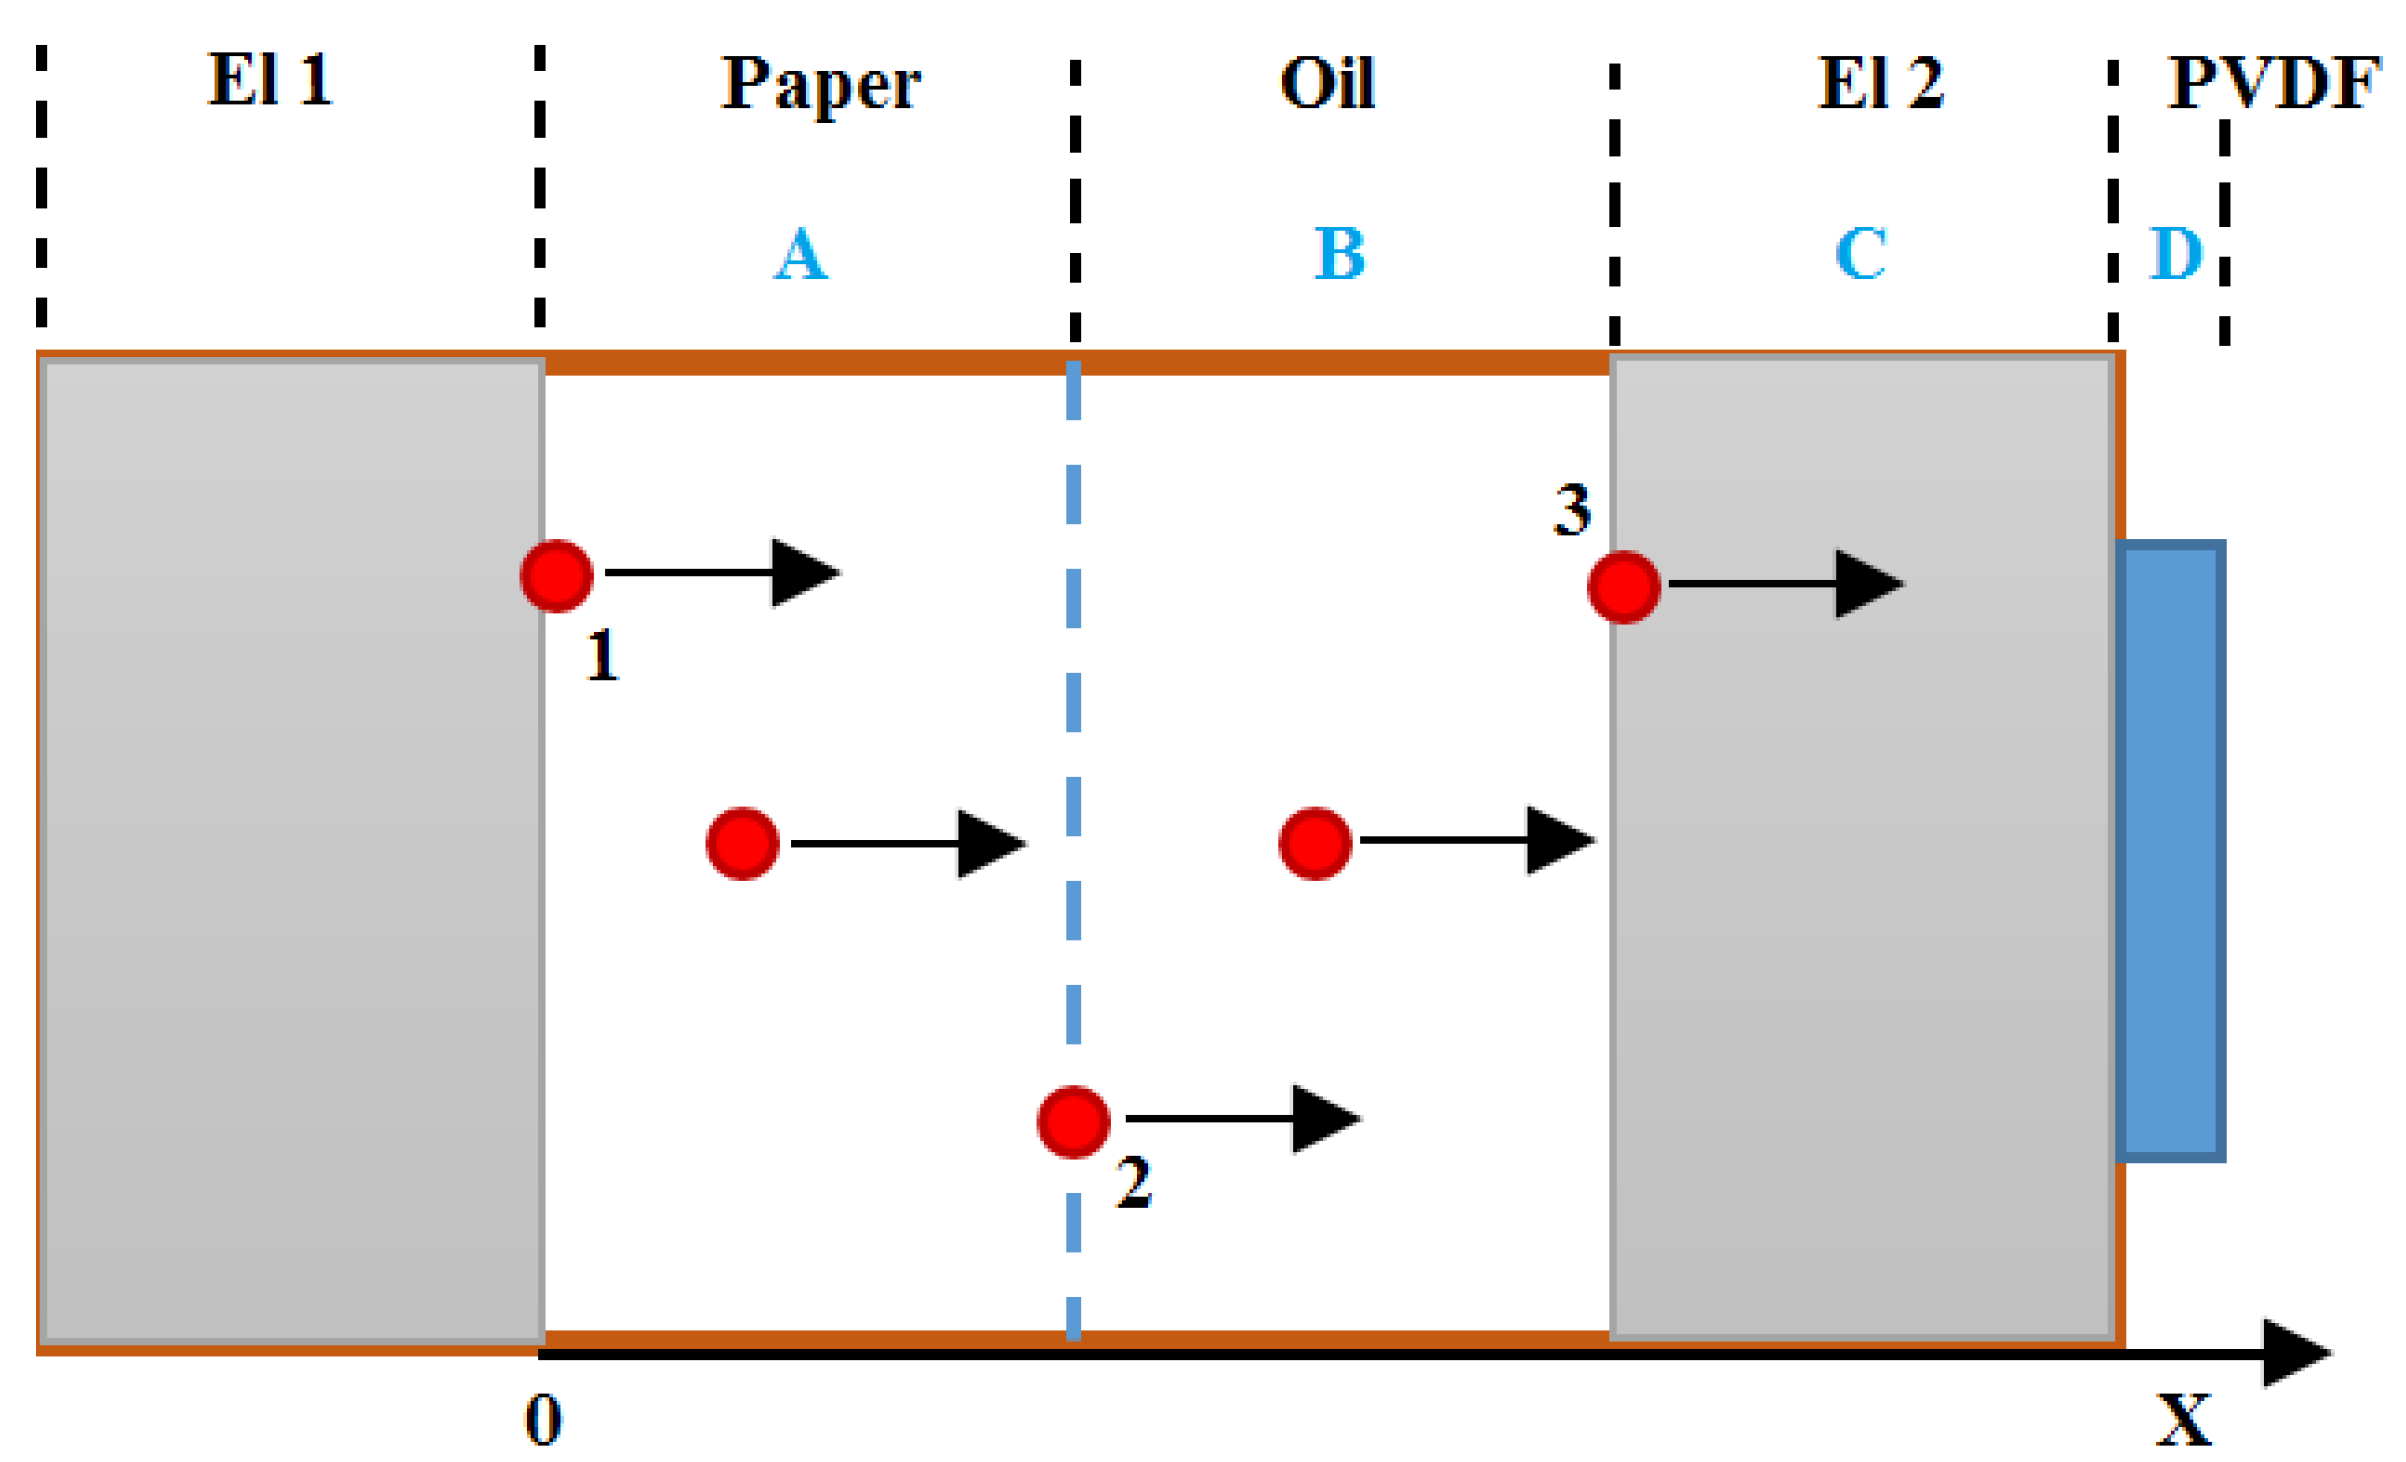
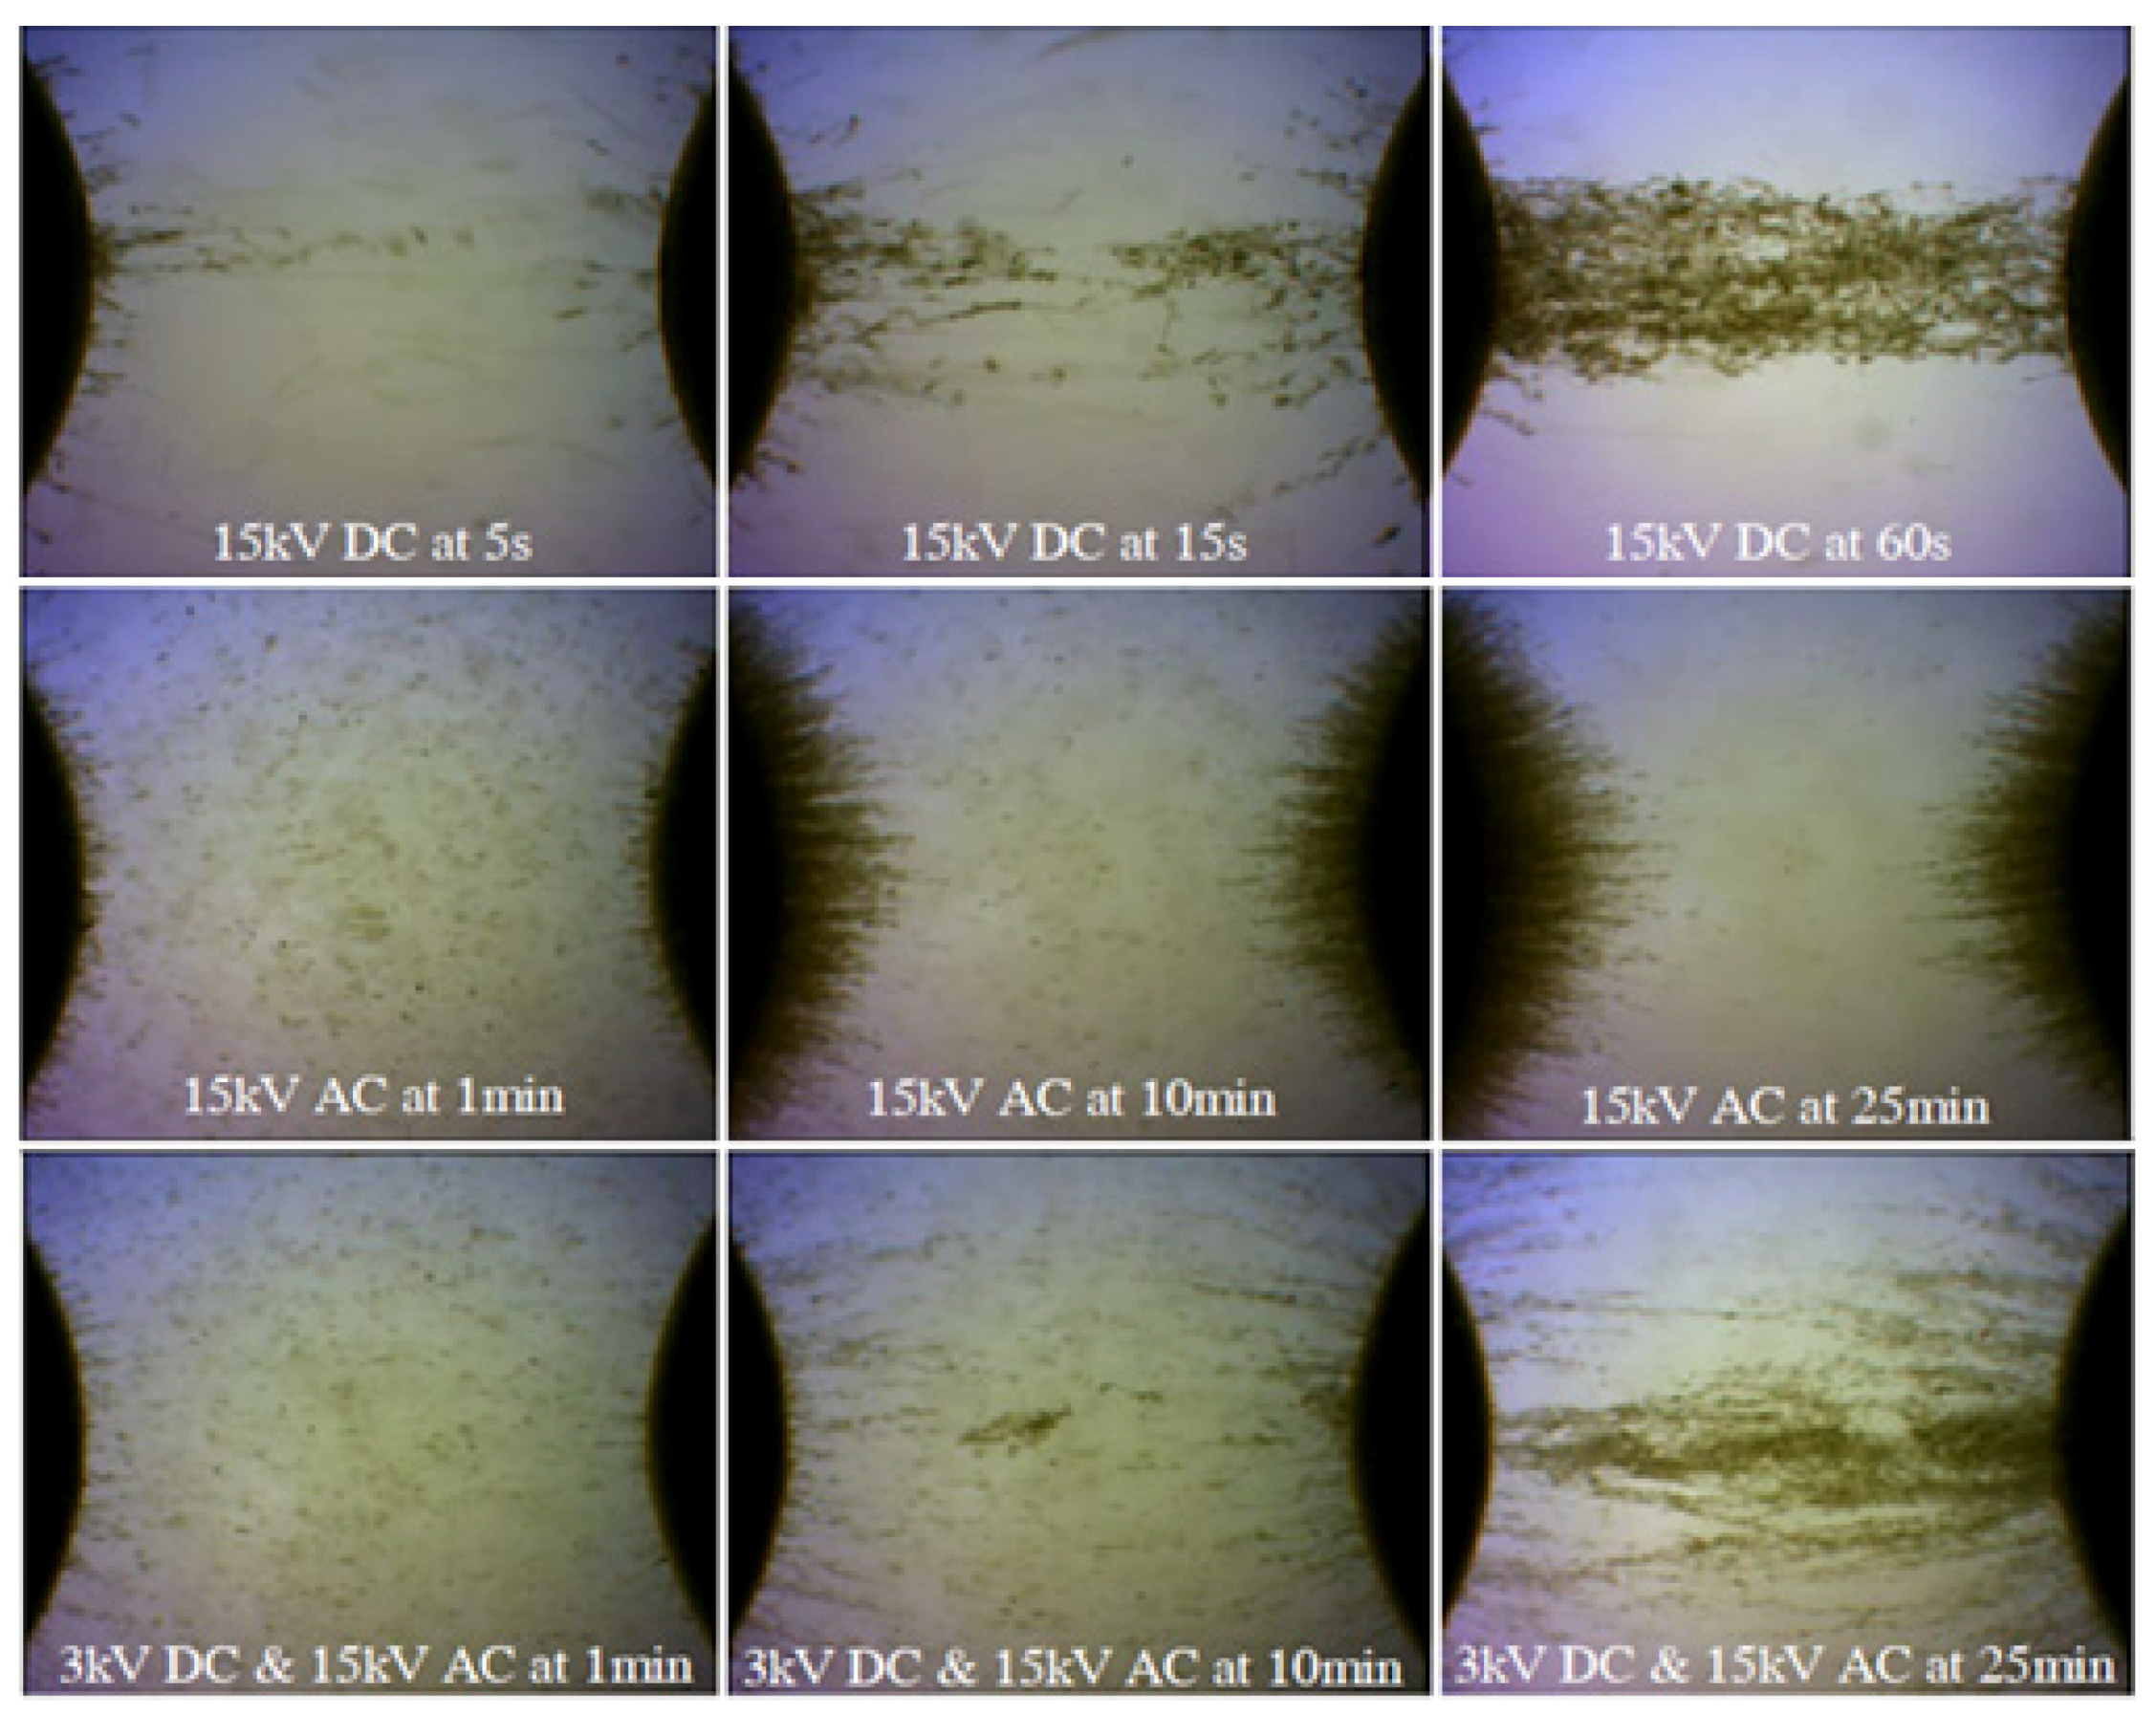
5.2.1. Cellulose Particles

Before further presenting the space charge dynamics, a series of tests performed at the University of Southampton which were about the cellulose particles accumulation in mineral oil under AC, DC and DC combined AC electric field are introduced. The results shown in Figure 25 are quite interesting and illustrate the bridge formation and electric field distribution between electrodes [52].
A pair of spherical brass electrodes with 13 mm diameter are used for the experiments. The distance between the electrodes is kept constant at 10 mm. Once the 15 kV DC voltage is applied to the sample, the particles start to become polarized. Moreover, the fiber particles align themselves parallel to external electric field lines. After 60 s, a thick bridge is created.
Under 15 kV AC voltage, it is clearly seen that the particles accumulate evenly on the surface of the electrodes. This is mainly attributed to the alternation of the electric field. When the particles make contact with the electrodes, they become charged. Other particles may also attach to these charged particles. Therefore, particle chains are elongated and distribute parallel to external electric field lines.
Figure 25. Optical microscopic images for bridging under influence of DC, AC and DC biased AC tests [52].
Energies 09 00053 g025
Under 3 kV DC combined 15 kV AC, a complete bridge was formed between electrodes after 10 min. Although the particle accumulation and the bridging process is much slower compared to the pure 15 kV DC electric field, the formed bridges are denser under the combined voltage.

5.2.2. Oil-Paper and Oil Gap

To correlate with particle movement under AC, DC, and DC combined AC voltage, the space charge profiles in mineral oil gap and oil-impregnated pressboards are also investigated under AC, DC, and DC combined AC voltage conditions [53]. Under 50 Hz AC voltage at room temperature, the sample consists of 0.5 mm pressboard and 0.5 mm oil gap. The results (Figure 26) indicate that no accumulated space charge can be observed in the insulation system. There are only oscillations within the insulation bulk. This may be due to the relatively low AC field, which is only 9.6 kV/mm in r.m.s. It is proved that the space charge injection and accumulation under AC is far less than that under DC. Under AC conditions, when the oil gap is applied, in which both positive charges and negative charges are believed to drift much faster than in the pressboard. Therefore, the injected charges may keep drifting within the oil gap rather than being trapped by the oil/pressboard interface. Moreover, from the cellulose particles experiment, the particles under AC voltage accumulated at the surface of electrodes instead of forming the bridge with the oil gap. That may be the reason that there is no obvious charge injection within the oil and pressboard insulation system.
Figure 27 shows the space charge after instantaneous removal of the applied voltage. In the fresh oil sample, no obvious space charge accumulation can be observed in the insulation bulk under such a low electric field, only a small amount of the positive charges were located in the vicinity of the interface between the top electrode and the pressboard.
For the converter transformer, the valve winding stands the superposition of both AC and DC voltages in the HVDC transmission system. The dielectric performance under combined AC and DC stress is usually obtained by combining the calculation of AC and DC components separately [54]. However, this may not be accurate as the dielectric materials are usually non-linear systems. In fact, the research in [55] has shown the significant space charge accumulation under the superimposed electric fields in the LDPE, which was quite different compared with the sum of the DC impact and AC impact separately.
Figure 26. Volt-on results of space charge in fresh oil combined with impregnated pressboard insulation system under 9.6 kV/mm AC field at 81° [53].
Energies 09 00053 g026
Figure 27. Volt-off results of space charge in fresh oil combined with impregnated pressboard insulation system under 4.8 kV/mm DC field.
Energies 09 00053 g027
The space charge behavior in the one layer oil impregnated pressboard with the one layer oil under superimposed electric field (+4.8 kV/mm DC stress combined with 9.6 kV/mm AC stress) was investigated. As shown in Figure 28, the amount of space charge at a phase angle of 81° is greatly increased after the combination of the AC and DC stress. When a small DC stress +4.8 kV/mm (much smaller than the threshold) is combined with as AC stress of 9.6 kV/mm, the presence of large amounts of interfacial negative charges is observed at the oil/pressboard interface. This negative interfacial charge density increases quickly to the maximum value (about 4.3 C/m3) within the first 5 min, and that value is much higher in comparison to the space charge under pure DC voltage conditions. Then the peak value keeps decreasing which may result from the neutralization by the positive charges injected from the top electrode. Correspondingly, as shown in Figure 29 (the space charge dynamics at a phase angle of 261°), the peak value of the ground electrode increases to the maximum value (about 7.3 C/m3) for 5 min then gradually decreases to about 6.1 C/m3 at 60 min. The high amount of space charge on the ground electrode may result from significant negative charge accumulated as the interface. The negative interfacial charge could induce the positive charge on the ground electrode. Moreover, with the addition of the capacitive charge on the ground electrode, the maximum charge density occurs at 5 min on the ground electrode. After that, the decrease of the charge on the ground correlates with the charge neutralization at the interface between oil and the pressboard. It may also indicate that the electric field distributed across the oil gap could be greatly enhanced for 5 min. After that, this enhancement starts to decrease.
Figure 28. Volt-on results of space charge in fresh oil combined with impregnated pressboard insulation system under AC/DC combined stresses at 81°.
Energies 09 00053 g028
Figure 29. Volt-on results of space charge in fresh oil combined with impregnated pressboard insulation system under AC/DC combined stresses at 261°.
Energies 09 00053 g029
The previous results indicate that the amount of space charge generated from the superimposition of the DC and AC electric field is higher than the simple addition of space charge generated from the individual DC and AC components. This indicates the space charge dynamics can be accelerated by the superposition of the DC and AC components for the fresh oil and oil-impregnated pressboard sample.

5.3. New Oil-Paper Combination

Apart from the previous understanding of the space charge behavior in traditional oil-paper insulation materials, other methods of reducing the space charge injection, accumulation, and improving the insulating properties, are also under investigation. There are two methods. One is the optimization of insulation combination. The other one is the application of new modified insulation material, including the modified cellulose pressboard and the new types of insulating oil.

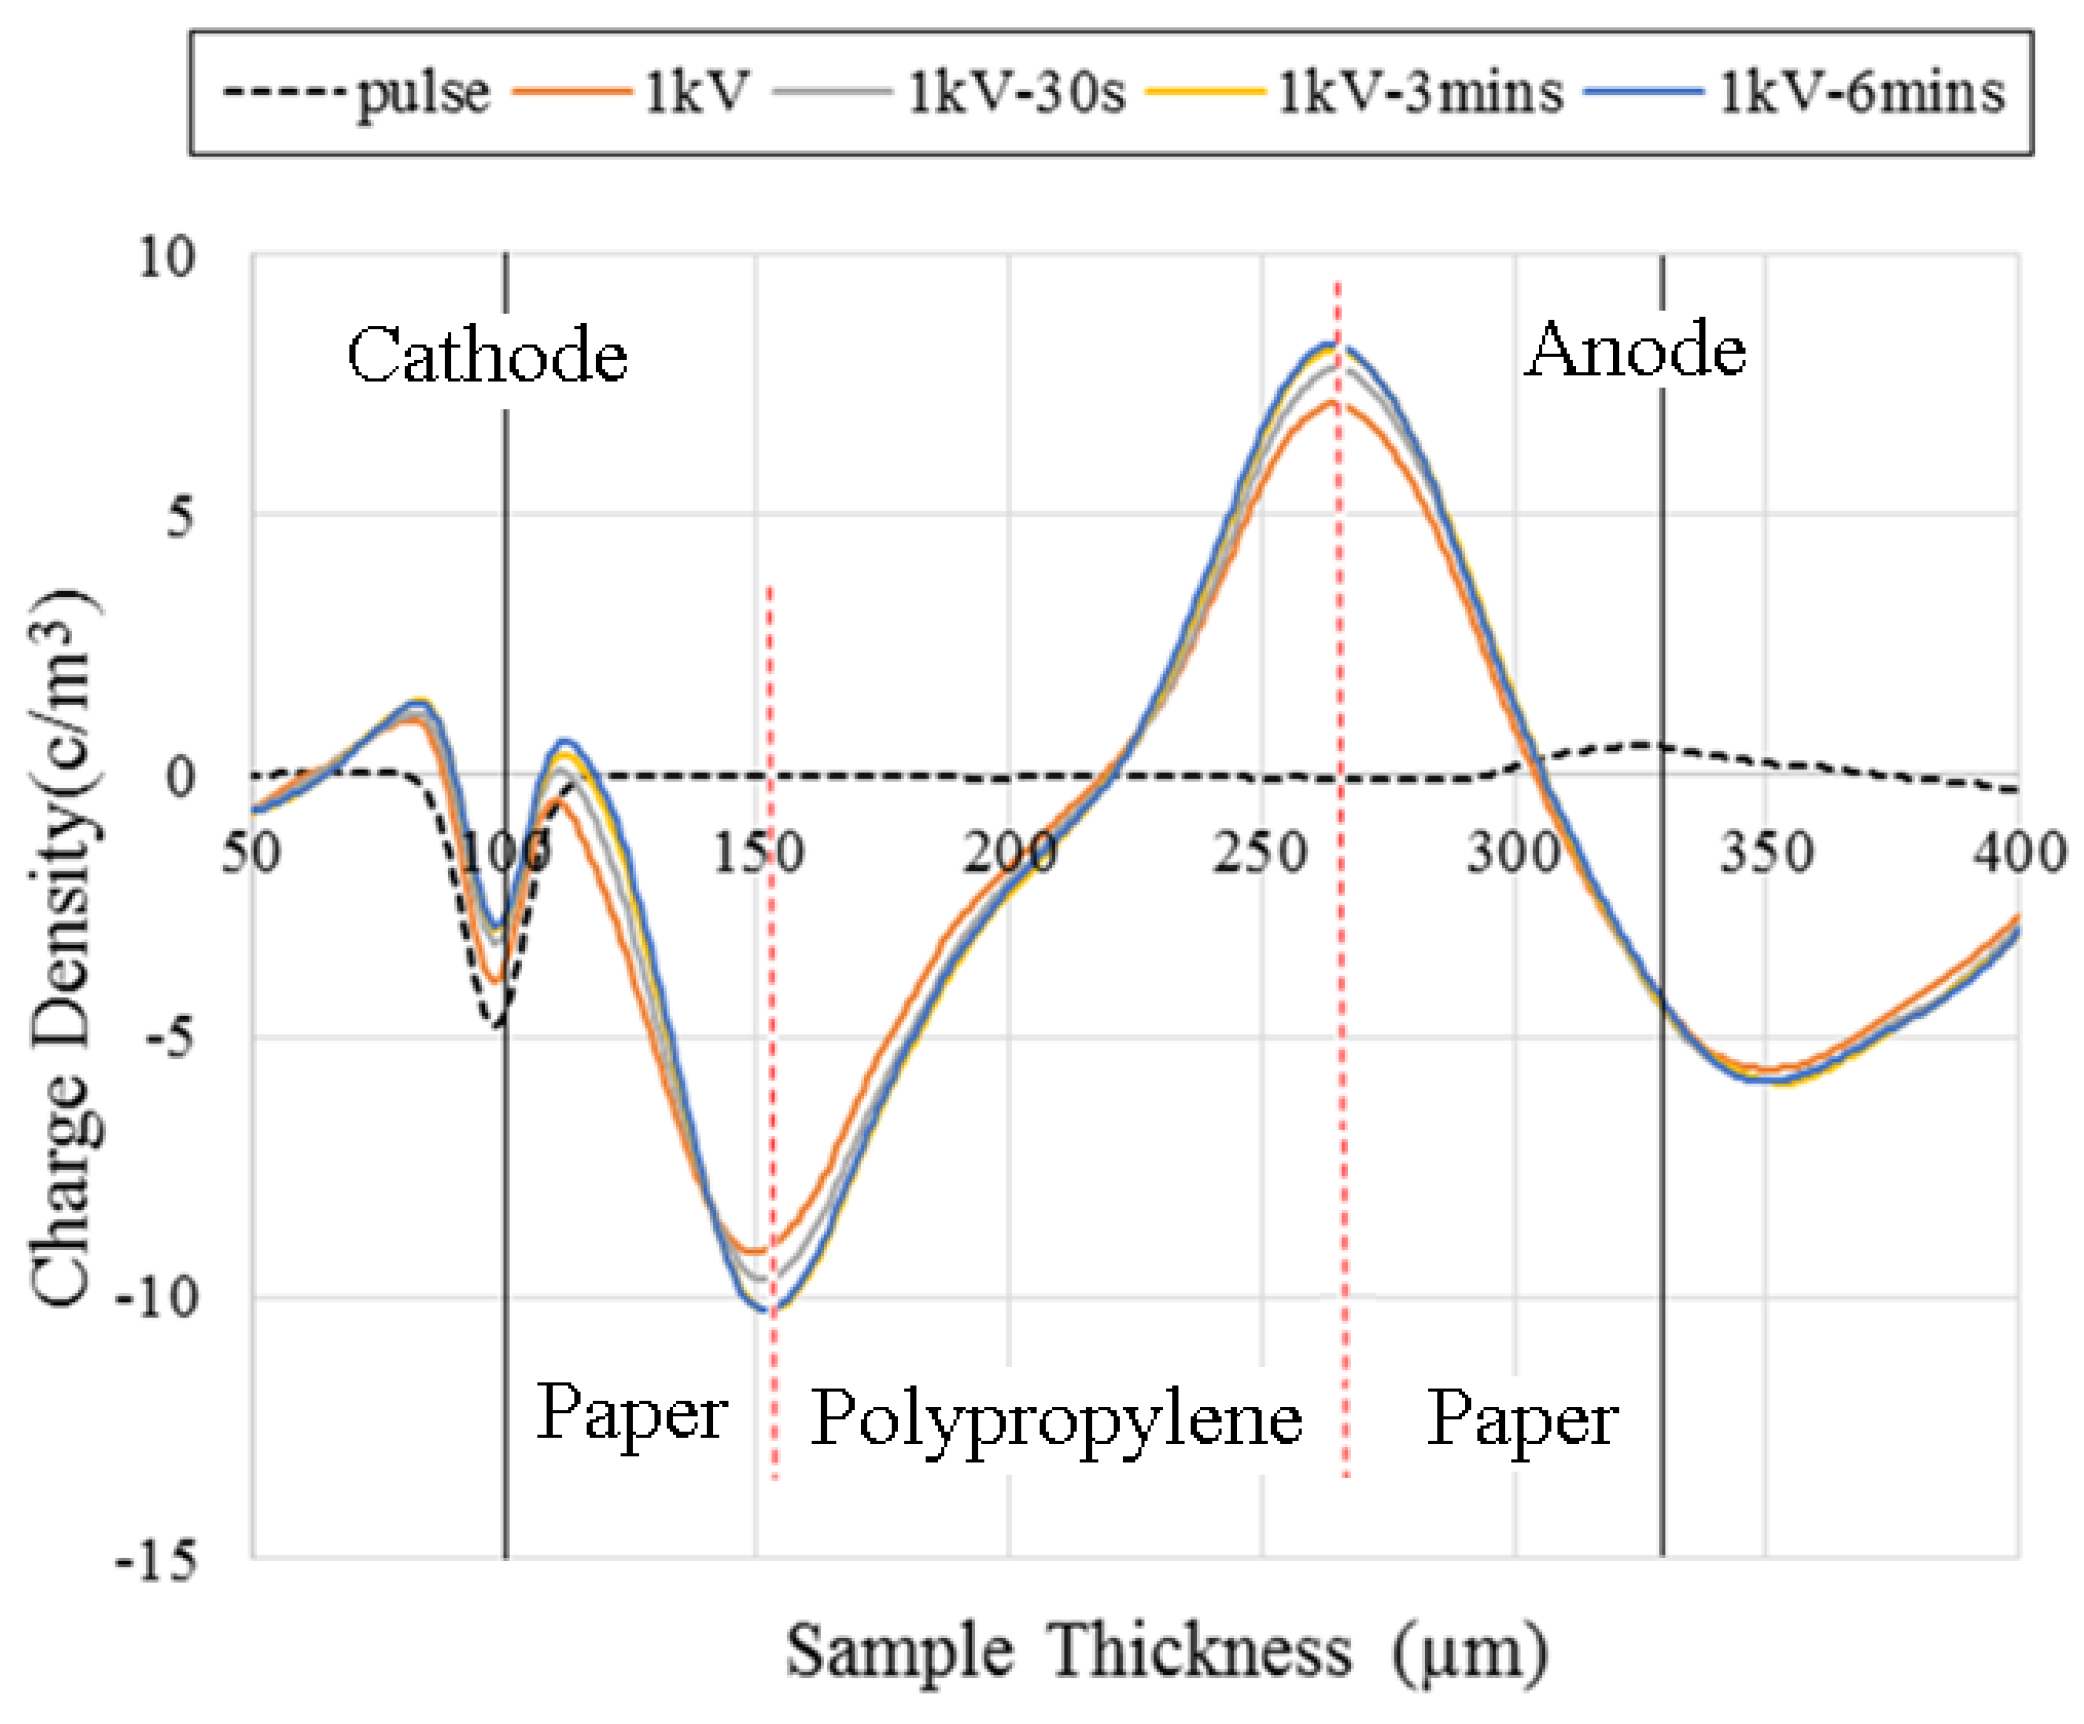
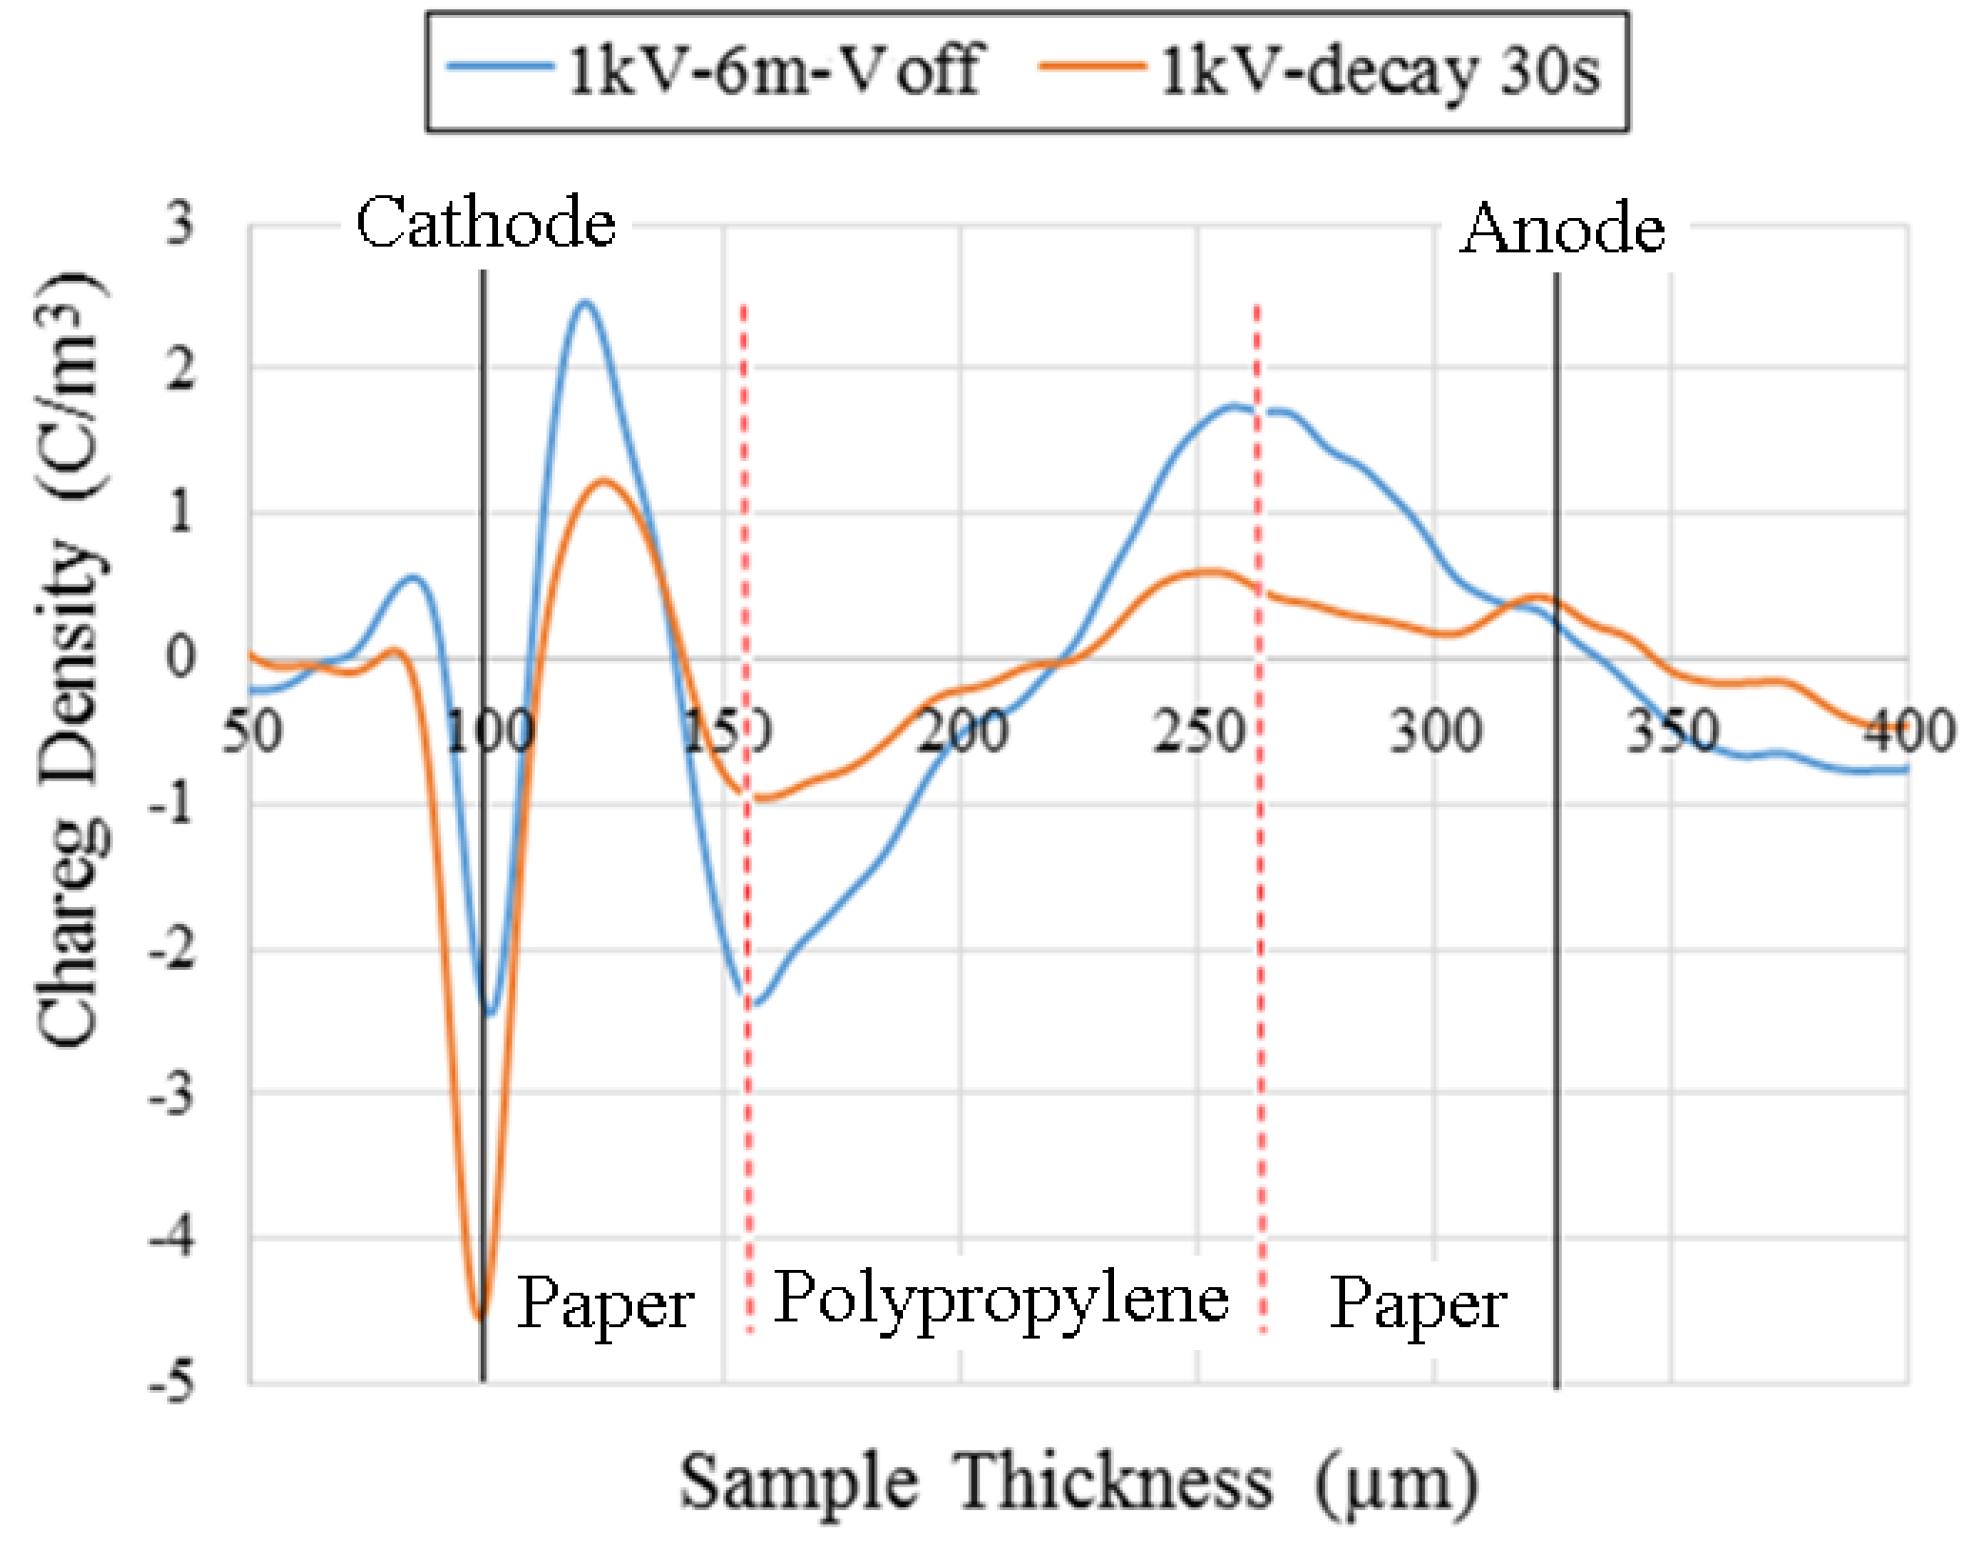
5.3.1. Space Charge in the Polypropylene Laminated Paper (PPLP)

Polypropylene Laminated Paper (PPLP) has been used in some commercial HVDC projects such as underground transmission cables [56,57]. The advantages of using PPLP are higher AC and DC breakdown strength and lower dielectric loss advantage compared to standard Kraft paper. However, the mechanism that leads to this phenomenon is still unknown. Therefore, at the University of Southampton, the lapped PPLP has been investigated to analyze the space charge behavior.
Figure 30 shows the space charge distribution in a PPLP sample (220 um in total thickness) under an applied voltage of 1 kV. The dashed line is the signal of the sample under the pulse electric field, which can give the location of the cathode and the anode. The negative peak captured from the cathode was very small after 1 kV was applied. The expected positive peak at the anode cannot be observed. This is not simply due to the attenuation of the paper. The net charge captured by PEA is the resultant charge from the injected homo-charge, electrode induced charge and possible ions caused by the applied electric field. The obvious negative and positive peaks in the bulk are believed to be the charge accumulated in the interface zone between the Kraft paper and polypropylene.
Figure 30. Space charge distribution in PPLP film under 1 kV applied voltage (Volt-on).
Energies 09 00053 g030
Volt-off results after 6 min of 1 kV applied voltage are shown in Figure 31. It shows the information about space charges that remain in the sample. More importantly, the interface regions and charge polarity close to the electrodes can be clearly seen as the capacitive charge due to elimination of the applied voltage. Hetero-charges can be found in the lower paper area next to the cathode.
Figure 31. Space charge distribution in PPLP film under 1 kV applied voltage (volt-off).
Energies 09 00053 g031
The same space charge distribution can be observed from Figure 32 and Figure 33 which are the results measured under 8 kV. Charge injection from the electrode takes place at the very low field when the Kraft paper is in contact with the electrode. The ionization in the Kraft paper is also a major concern for the lapped sample. The interfacial zones in the lapped samples can trap/slow down charge resulting in electric field enhancement in PP film.
Figure 32. Space charge distribution in PPLP film under 8 kV applied voltage (volt-on).
Energies 09 00053 g032
Figure 33. Space charge distribution of PPLP sample under 8 kV applied voltage (volt-off).
Energies 09 00053 g033

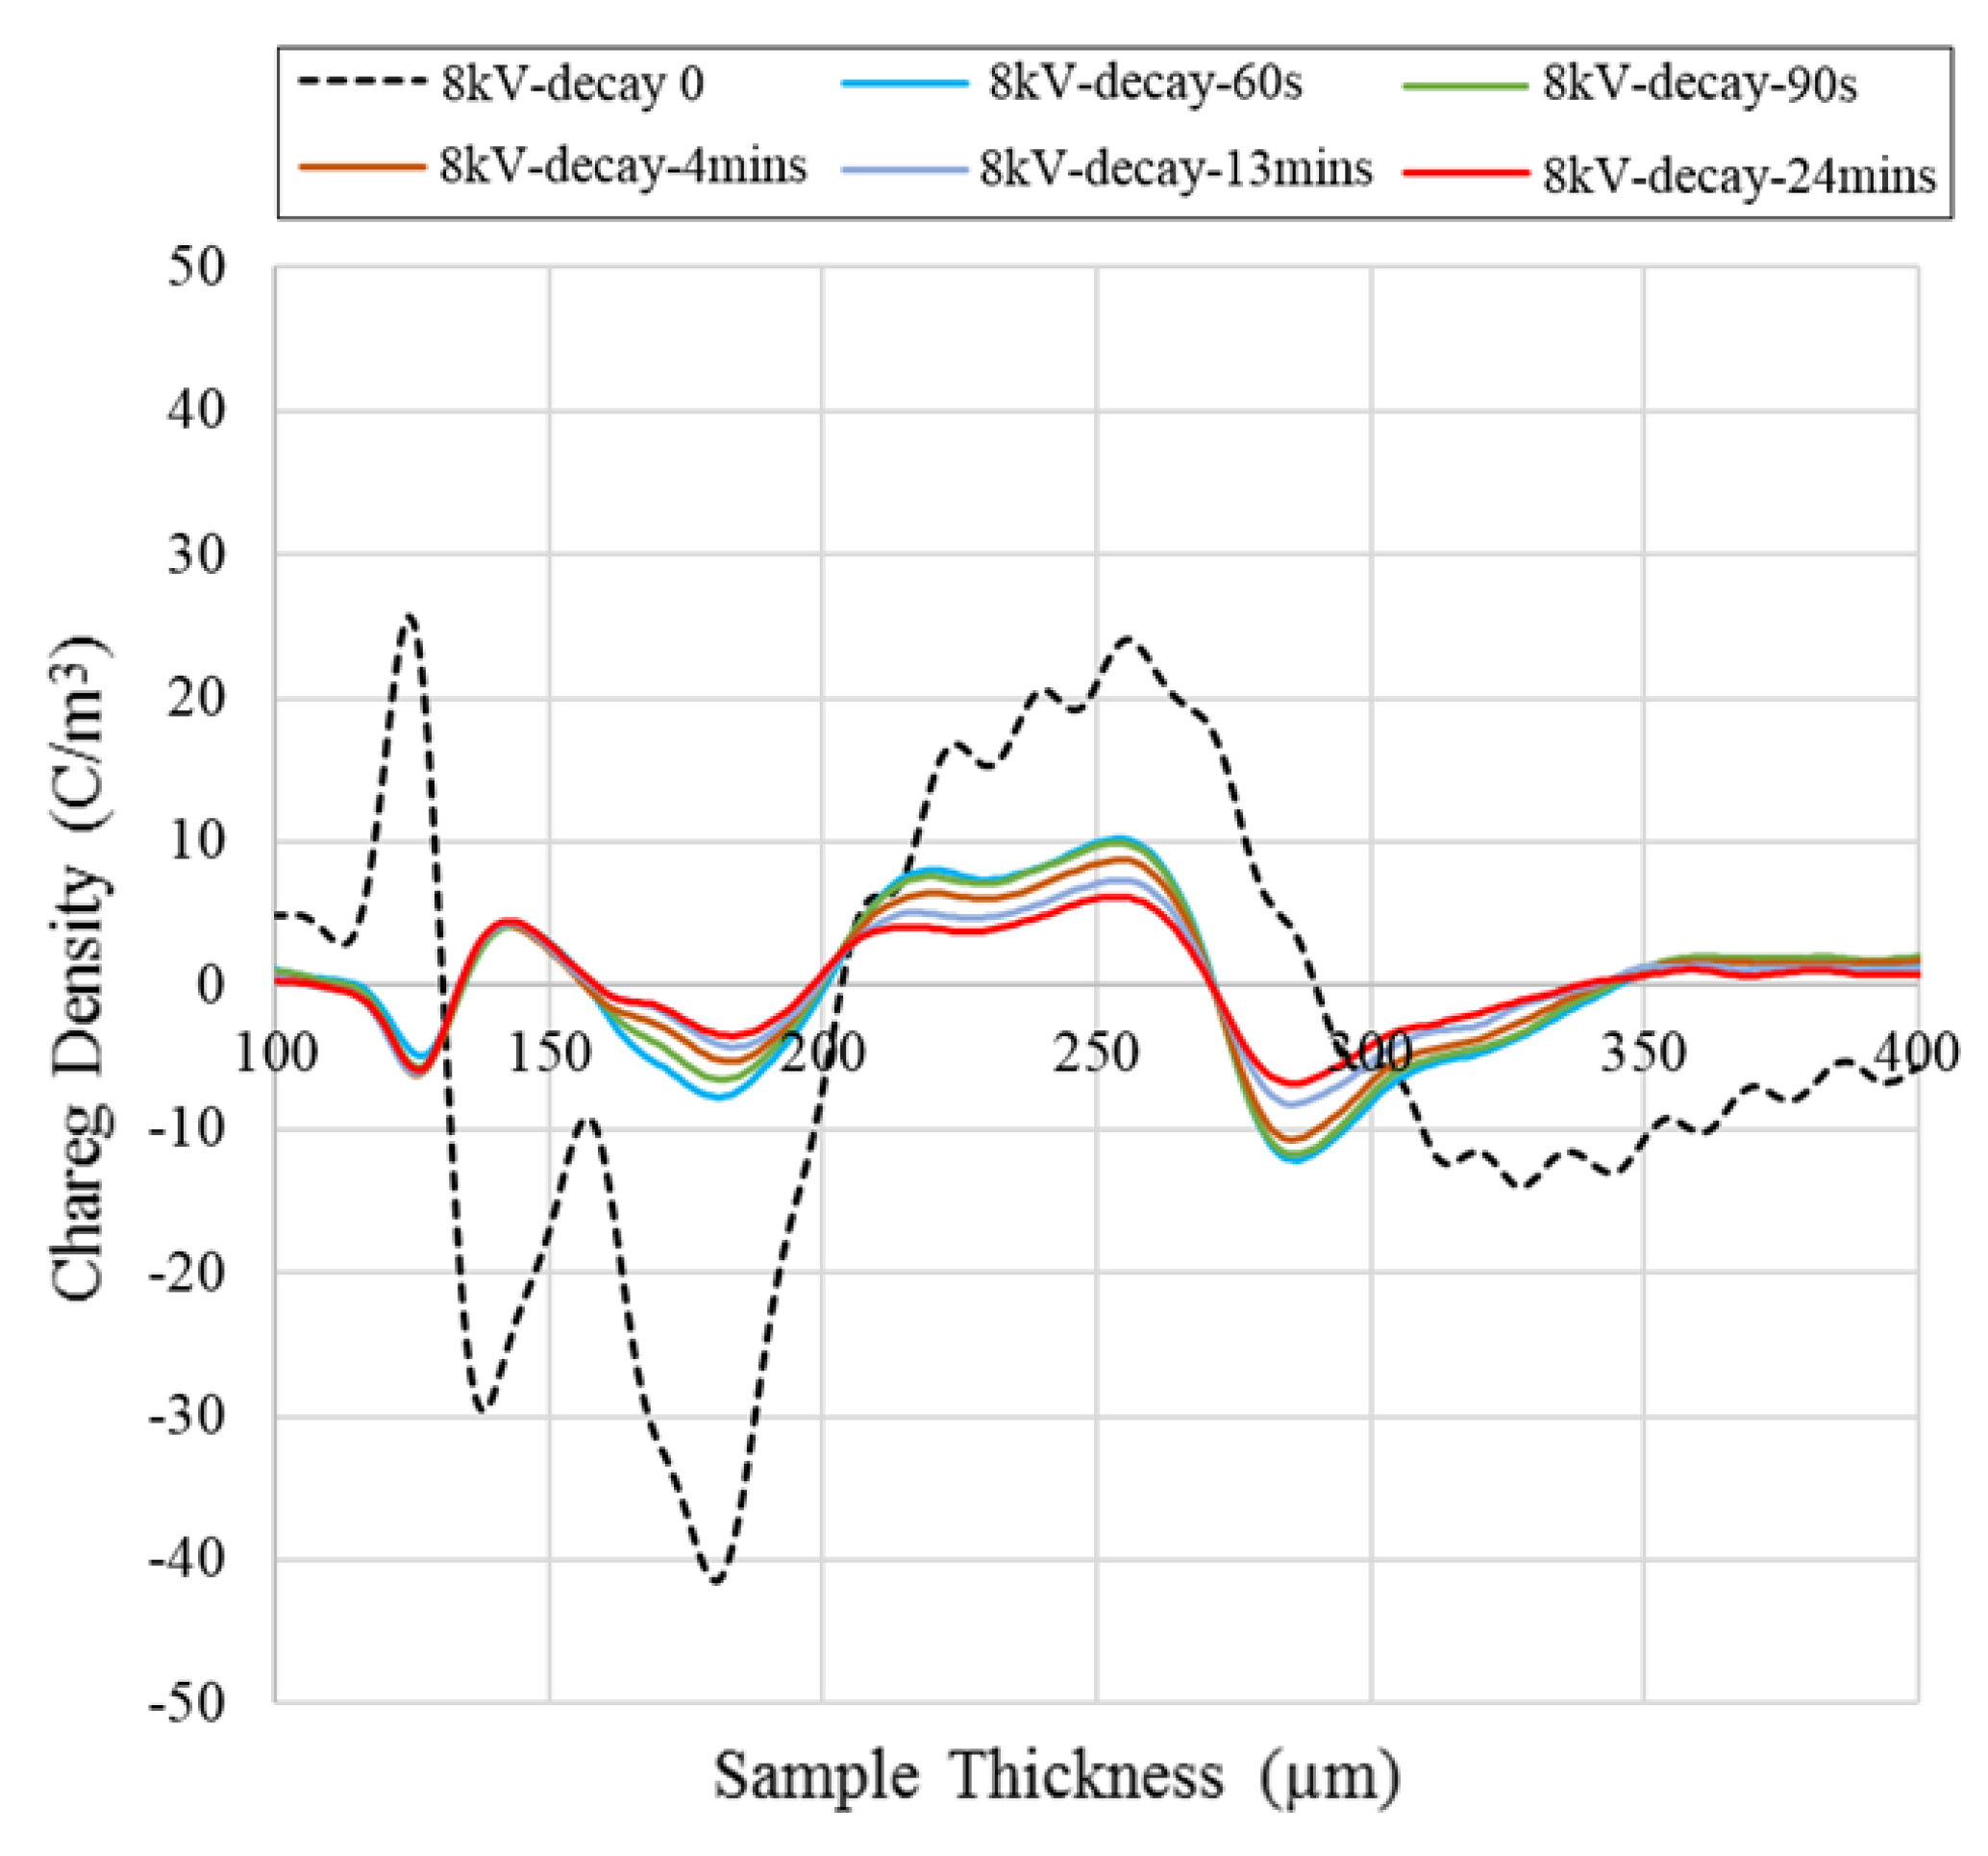
5.3.2. Space Charge on Nano-TiO2 Modified Cellulose Paper

To improve the accumulation and dissipation properties of space charge in oil-paper insulation, Lv et al. modified cellulose insulation paper using nano-TiO2 [58]. The accumulation and dissipation characteristics of space charge of oil-paper were tested using PEA. The results show that there is no negative space charge accumulation near the anode of the nano-TiO2 mixed sample observed under 10 kV/mm and 30 kV/mm. The reason could be the addition of nano-TiO2 enhanced the threshold voltage of charge injection from the cathode and then slowed down the movement of electrons.
Under 10 kV/mm, the ratios of electrical field distortions of P0 (without the nano-TiO2), P1 (with a nano-TiO2 mass fraction of 1%) and P2 (with a nano-TiO2 mass fraction of 3%) were 50%, 20%, and 10%, respectively. While under 30 kV/mm (Figure 34), the ratios were 60%, 20%, and 10%. We may reach the conclusion that the addition of nano-TiO2 to insulation paper is quite effective in improving the accumulation and dissipation properties of space charge, relieving the electric field distortion, though further research is still required.
Figure 34. Space charge distribution of samples P0 (a), P1 (b) and P2 (c) under 30 kV/mm applied electric field [58].
Energies 09 00053 g034

5.4. Simulation

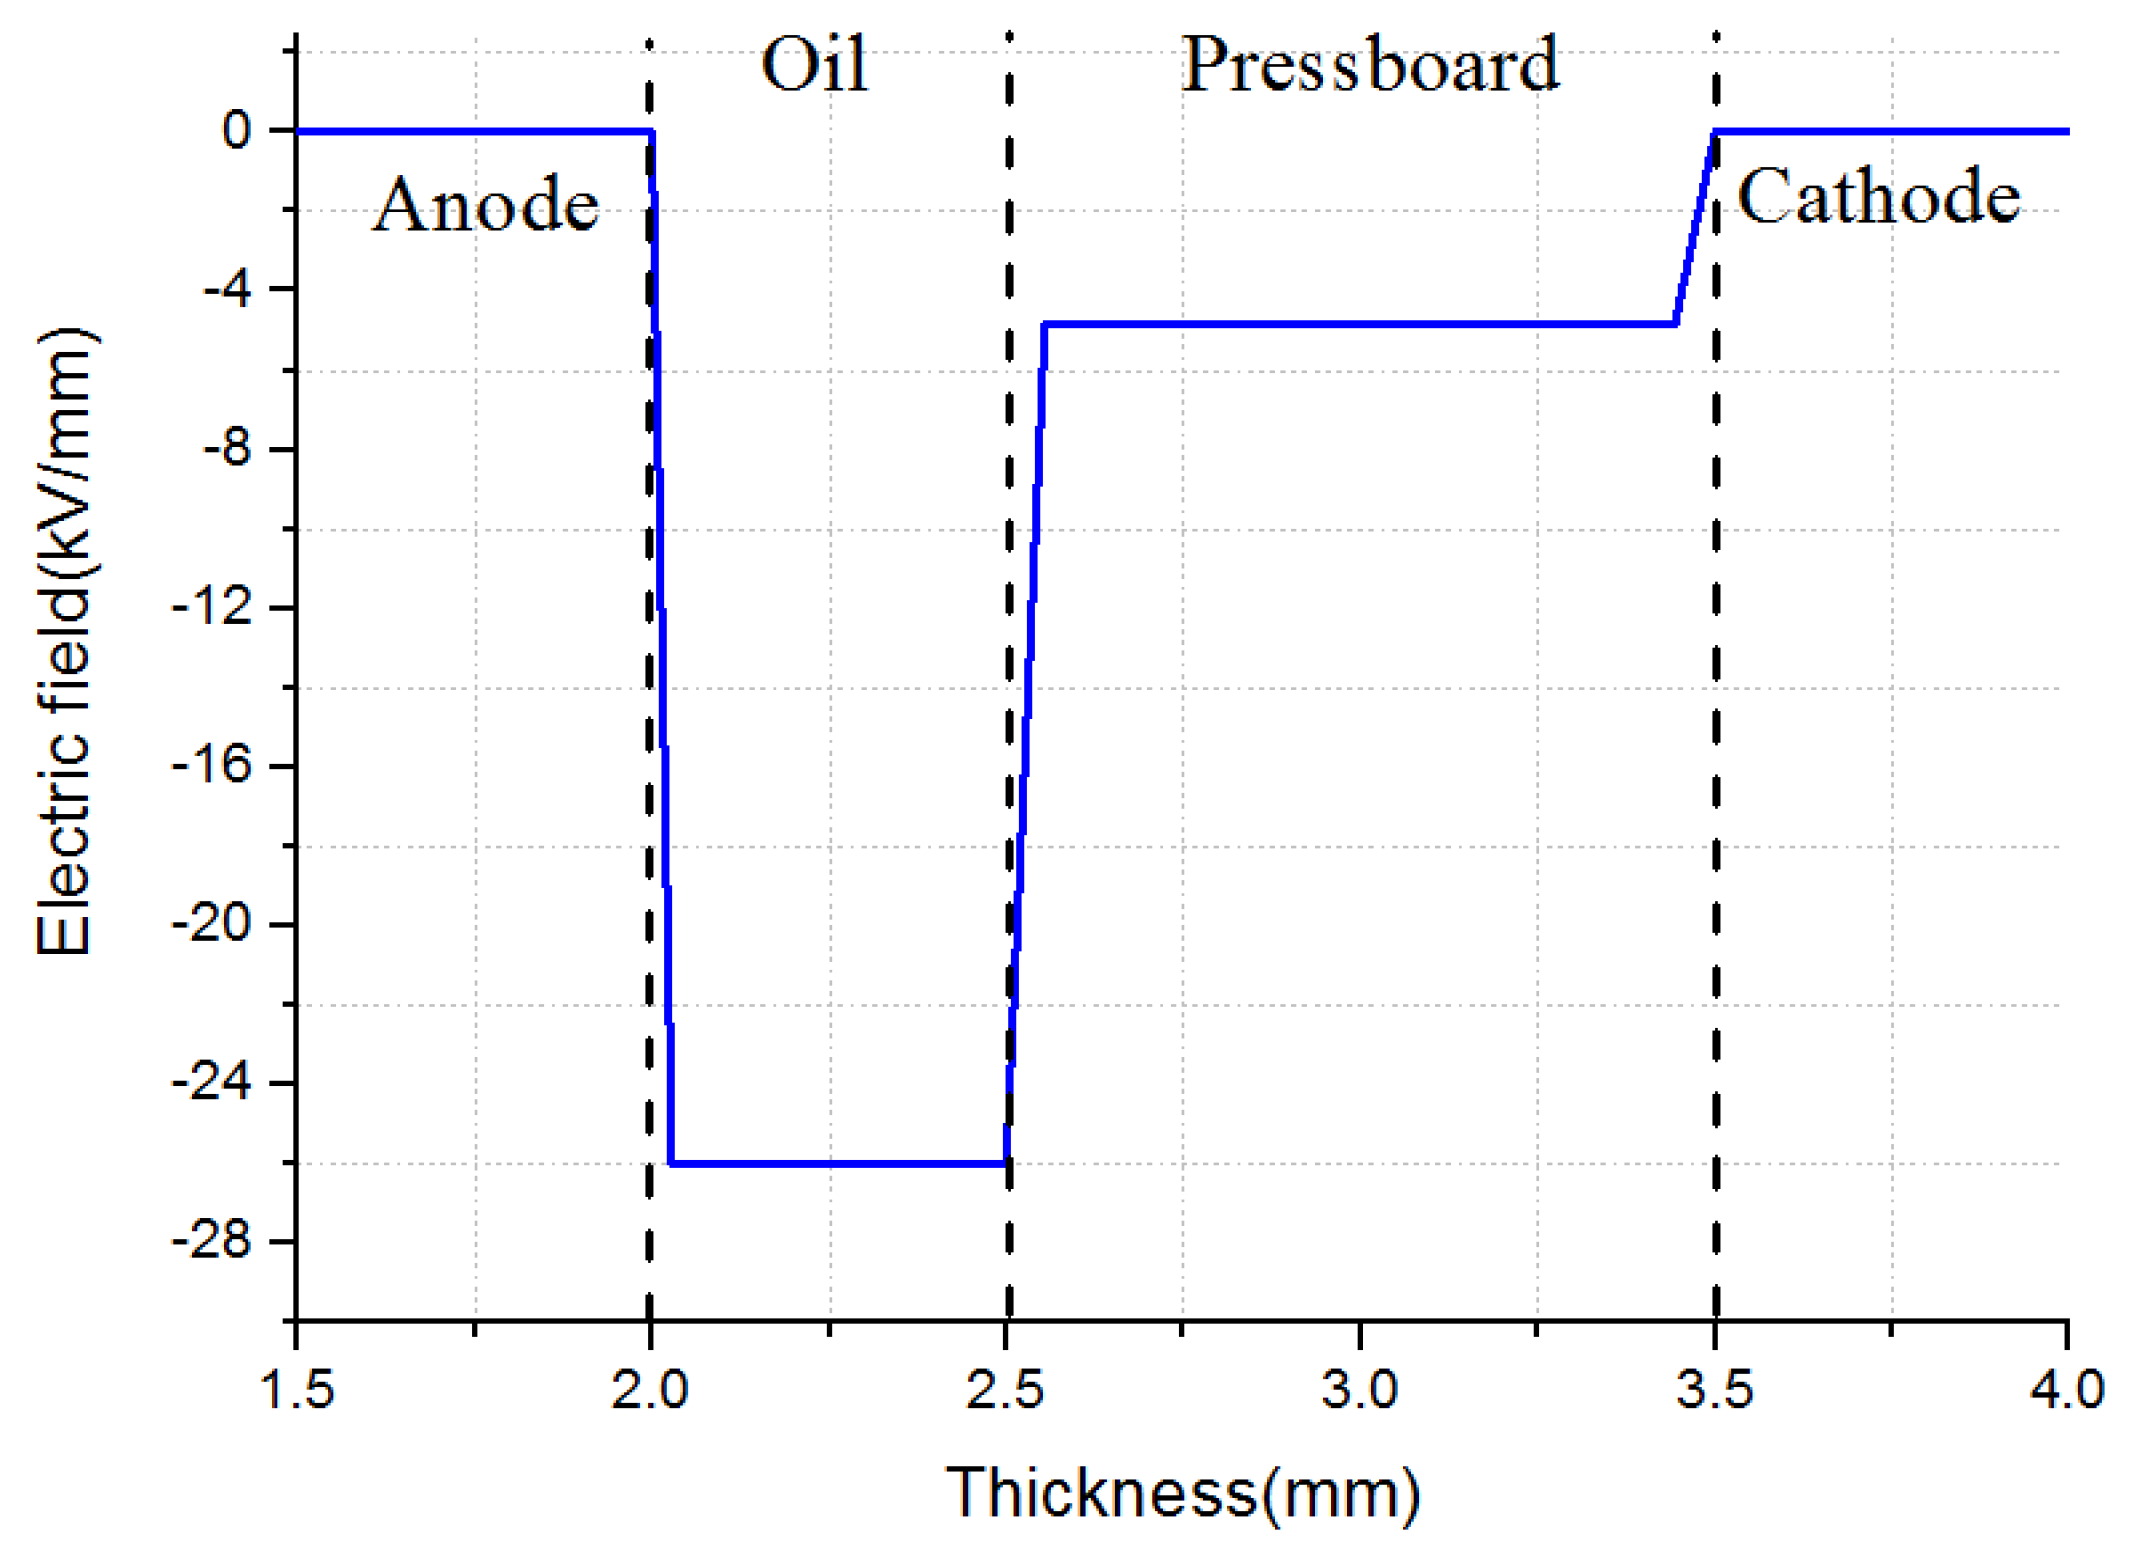
5.4.1. COMSOL for Electric Field Simulation

As the converter transformer may experience polarity reversal in operation, it is necessary to simulate the electric field of the oil and oil-impregnated pressboard with the emphasis on the polarity reversal operation. Traditionally, the electric field simulation is based on the Maxwell-Wagner theory. However, considering the existence of charge traps and surface states, an accurate method is required to introduce the space charge effect on the electric field estimation. The electric field caused by the space charge was simulated at Southampton for different polarity reversal operation times using the COMSOL software.
For circuit representation of Maxwell-Wagner theory, the oil and oil-impregnated pressboard could be regarded as a parallel configuration of the resistor and capacitor. The electric field and voltage distribution could be calculated based on the equations below. U1 and U2 are the applied voltage for pressboard and oil, R1 and R2 are the resistance of the pressboard and oil. C1 and C2 are the capacitance of the pressboard and oil, respectively:
U 1 ( t ) = R 1 U R 1 + R 2 + ( C 2 C 1 + C 2 R 1 R 1 + R 2 ) U × e t τ
E 1 ( t ) = R 1 U ( R 1 + R 2 ) d 1 + ( C 2 C 1 + C 2 R 1 R 1 + R 2 ) U d 1 × e t τ
U 2 ( t ) = R 2 U R 1 + R 2 + ( C 1 C 1 + C 2 R 2 R 1 + R 2 ) U × e t τ
E 2 ( t ) = R 2 U ( R 1 + R 2 ) d 2 + ( C 1 C 1 + C 2 R 2 R 1 + R 2 ) U d 2 × e t τ
τ = C 1 + C 2 1 R 1 + 1 R 2
To interpolate the space charge into the COMSOL software, the oil and oil-impregnated pressboard are divided into different layers for adding to the space charge [59]. After the interpolation of the space charge into the COMSOL software, the electric field within the oil and oil-impregnated pressboard could be simulated based on the Poisson equation:
E = 0 d ρ ε 0 ε r dx
Figure 35 shows the electric field of oil and oil-impregnated pressboard based on the Maxwell-Wagner theory. After the polarity reversal operation time of 60 s, the transient electric field distribution meets the capacitive distribution. From the Equations (15), the transient electric field of the pressboard is proportional to the capacitance of the oil, leading to the lower electric field of pressboard due to the lower permittivity of the oil.
Figure 35. Electric field distribution for fresh oil and oil-impregnated pressboard based on the Maxwell-Wagner theory for polarity reversal operation time of the 60 s.
Energies 09 00053 g035
After the interpolation of the space charge, the electric field distribution within the oil and oil-impregnated pressboard is shown in Figure 36. It is noticed that there is a concave region for the electric field of the oil-impregnated pressboard. The electric field in the vicinity of electrode and interface of the oil-impregnated pressboard is enhanced. There are two reasons. Firstly, the homo-charge injection within pressboard could be converted into hetero-charge after the polarity reversal operation. The electric field for two sides of pressboard caused by the hetero-charge is added to the external electric field, leading to the electric field enhancement. Moreover, the hetero-charge could induce the same polarity charge compared to the electrode, which could also enhance the electric field for two sides of the oil-impregnated pressboard. For the oil part, the electric field distribution could be attributed to the existence of the space charge, the charge injection previously could be converted into homo-charge leading to the electric field enhancement in the center.
Figure 36. Electric field of fresh oil and oil-impregnated pressboard adding space charge for polarity reversal operation time of the 60 s.
Energies 09 00053 g036
The electric field caused by space charge and Maxwell-Wagner theory after the different polarity reversal operation time could be summarized in Figure 37. Both fresh and aged oil-impregnated pressboards are considered. It has been found that electric field caused by the space charge is higher in comparison to the electric field calculated from the Maxwell-Wagner theory, and the difference between them is higher for the fresh sample compared to the aged sample. The electric field based on the Maxwell-Wagner theory increases while the electric field caused by the space charge decreases after a longer polarity reversal operation time. Moreover, the electric field of the aged sample caused by the space charge decreases faster compared to the fresh sample, which results from fast space charge dissipation rate of the aged sample. After the comparison between the electric field resulted from space charge after polarity reversal operation and the electric field based on the Maxwell-Wagner theory for the steady-state condition, it is suggested that the current 2 min polarity reversal operation time could be safely reduced for both fresh and aged oil and oil-impregnated pressboard samples.
Figure 37. Electric field distribution of both fresh and aged oil-impregnated pressboard caused by space charge and Maxwell theory for different polarity reversal operation time.
Energies 09 00053 g037

5.4.2. Molecular Simulation for Material Modification

Molecular simulation technology can explain the mechanism of cellulose’s thermal ageing improvement from the perspective of interactions between molecules. Quite a few works have showed that the molecular simulation method is a research field with great potential in the study of microscopic mechanisms [60,61,62]. However, few studies on nanomaterial-modified insulation paper cellulose using a molecular simulation method have been reported.
Nano-Al2O3 particles have been used to modify insulation paper fiber, and molecular simulation and experimental methods were utilized to analyze the changes in the mechanical properties of the modified insulation paper after addition of the nano-Al2O3. We also compare microscopic molecular simulation results and macroscopic experiment results, and explore the mechanism of nano-Al2O3 modification of the thermal ageing of insulation paper, and thus provide some theoretical support for further study of nano-modified insulation paper (Figure 38).
Figure 38. Unmodified cellulose model (a) and modified cellulose model (b) with addition of nano- AI2O3 [60].
Energies 09 00053 g038
From Figure 39, after adding nano-Al2O3 particles to paper fiber, the rate of decrease of the degree of polymerization of insulation paper is obviously slower than that of unmodified insulation paper. This may also indicate that the addition of 1% nano-Al2O3 particles can improve the mechanical strength and also decrease the rate of aging of insulation paper. This improvement may also correlate with the increase of hydrogen bonds surrounding the cellulose. The nano-Al2O3 particles fill some voids in the amorphous region of cellulose, forming hydrogen bonds surrounding the cellulose. As the result of more hydrogen bonds attached to the cellulose chain, the reaction intensity of cellulose chain is modified and it becomes less compared to the unmodified model. Therefore, this could decrease the rate of the degree of polymerization of insulation paper and also the ageing rate. The space charge behavior using both unmodified cellulose and modified cellulose paper to verify its polymerization degree (DP) characteristics property will be presented in the future work.
Figure 39. Variation of polymerization degree (DP) of insulation paper with ageing time.
Energies 09 00053 g039

6. Conclusions and Prospects

It has been more than half century since in 1950 a 400 kV electrical power transformer was first introduced in a high voltage electrical power system. The fast expansion of HVDC networks nowadays requires more secure and stable DC power equipment. Oil-paper is used as the main insulation material of the key DC power equipment, and its space charge behavior is proved to have a great influence on the insulating properties, therefore, the research on space charge behaviors of oil-paper is vitally important for the sustainable operation of power grids as well as the improvement of the physical-chemical properties and electrical performances of insulation materials.
This paper focuses on PEA technology, where research on space charge in oil-paper insulation in the past twenty years have been classified and reviewed. Oil-paper insulation is subject to the combined stresses of electrical, thermal and mechanical, possesses complex physical and chemical properties, and exhibits complicated and various insulation structures inside the power transformer, all of which make research on space charge evolution in oil-paper insulation a difficult topic to study.
Our reviewing of the existing research indicates that temperature (both environmental and test), moisture content, and applied voltage have a great influence on the space charge evolution inside oil-paper. The connections between space charge and other electrical parameters such as permittivity, conductivity, partial discharge, breakdown voltage and so on are still not so clear. The mechanisms behind the observed phenomena need further investigation. For all that, some points that need special attention are emphasized below:
(1)
Control of the test environment. As PEA was not designed for oil-paper in the first place, it is essential to ensure a uniform test environment through all the experimental procedures, which means that space charge testing should be conducted under the same temperature, humidity, and the consistent pressure from the upper electrode to the sample.
(2)
Precise signal and data processing. As for multilayer oil-paper, the traditional signal process and recovery methods have some defects because of the attenuation, dissipation, recovery algorithm and so on. Thus, a further study on the progress of sound wave propagation and the signal recovery algorithm are quite important.
(3)
Conformity to practical operation situations. The normal working temperature in a converter transformer is usually around 70 °C, which may also dramatically increase to a higher value due to the variable loads. Besides a high temperature, temperature gradients also exist in converter transformers from the conductor to the cooling system. Furthermore, metal ions such as copper, iron, zinc and so on, which exist in the real transformer with a certain degree will affect the space charge behavior. Therefore, to acquire scientific and useful results, the experimental conditions should be consistent with the practical operation situation.
(4)
PEA test set-up. There is still some room for hardware improvement to achieve a better signal, especially for complicated combinations of oil and paper. Besides, the development of simulations provides another way to better understand of the kinetics of space charge within oil and oil-impregnated paper/pressboard. The space charge simulations could be further interpolated into the COMSOL software for the electric field simulation, which will be beneficial for the electric field simulation for multi-layers and even the whole converter transformer.
According to the research results, an electric field distortion results from the space charge accumulation in oil-paper insulation, and the thermal effects caused by fast charge transportation inside the material are the main reason for electrical faults. To reduce the influence of space charge, decrease the charge accumulation, limit the fast charge transportation and even the charge distribution inside oil-paper could predict the trends of the future research.

Acknowledgments

The authors wish to thank the editors of Energies, and Issouf Fofana for their kind invitation to present this feature article. One of the authors, Chao Tang, wishes to thank the National Natural Science Foundation of China (Project for Young Scientists Fund, Grant No. 51107103), the Fundamental Research Funds for the Central Universities (Grant No. XDJK2014B031) and the CSC Scholarship (Grant No. 201406995060) for their financial support.

Author Contributions

Chao Tang and Bo Huang completed writing of the manuscript. George Chen and Jian Hao reviewed and edited the manuscript. Zhiqiang Xu and Miao Hao were involved in conceiving the aims, objectives, scope and structure of the paper. All authors have therefore been involved in the preparation and have approved the submitted manuscript.

Conflicts of Interest

The authors declare no conflict of interest.

References

  1. JWG A2/B4. 28. HVDC Converter Transformers Design Review, Test Procedures, Ageing Evaluation and Reliability in Service. 2010. Availible online: http://www.e-cigre.org/Publications/file.asp (accessed on 18 November 2015).
  2. Heathcote, M.J. J & P Transformer Book, 13th ed.; Elsevier Ltd.: Oxford, UK, 2007. [Google Scholar]
  3. Mazzanti, G.; Montanari, G.C.; Alison, J.M. A space-charge based method for the estimation of apparent mobility and trap depth as markers for insulation degradation-theoretical basis and experimental validation. IEEE Trans. Dielectr. Electr. Insul. 2003, 10, 187–197. [Google Scholar] [CrossRef]
  4. Chen, G.; Chong, Y.L.; Fu, M. Calibration of the pulsed electroacoustic technique in the presence of trapped charge. Meas. Sci. Technol. 2006, 17, 1974–1980. [Google Scholar] [CrossRef]
  5. Li, Y.; Yasuda, M.; Takada, T. Pulsed electroacoustic method for measurement of charge accumulation in solid dielectrics. IEEE Trans. Dielectr. Electr. Insul. 1994, 1, 188–195. [Google Scholar]
  6. Liu, R.; Tornkvist, C.; Johansson, K. Space charge distribution in composite oil cellulose insulation. In Proceedings of the IEEE Annual Report of the Conference on Electrical Insulation and Dielectric Phenomena (CEIDP), Arlington, VA, USA, 23–26 October 1994; pp. 316–321.
  7. Liu, R.; Wahlstrom, G. Measurements of the DC electric field in liquid impregnated pressboard using the pressure wave propagation technique. In Proceedings of the Conference Record of the IEEE International Symposium on Electrical Insulation (ISEI), Pittsburgh, PA, USA, 5–8 June 1994; pp. 103–106.
  8. Liu, R.; Tornkvist, C.; Gafvert, U. Pressure wave propagation technique to measure the space charge distribution in pressboard impregnated with aged transformer oil. In Proceedings of the 4th International Conference on Properties and Applications of Dielectric Materials (ICPADM), Brisbane, Australia, 3–8 July 1994; pp. 139–142.
  9. Morshuis, P.; Jeroense, M. Space charge measurements on impregnated paper: A review of the PEA method and a discussion of results. IEEE Trans. Dielectr. Electr. Insul. 1997, 13, 26–35. [Google Scholar] [CrossRef]
  10. Ciobanu, R.; Schreiner, C.; Pfeiffer, W.; Baraboi, B. Space charge evolution in oil-paper insulation for DC cables application. In Proceedings of the IEEE 14th International Conference on Dielectric Liquids (ICDL), Graz, Austria, 7–12 July 2002; pp. 321–324.
  11. Tang, C.; Chen, G.; Fu, M.; Liao, R. Space charge behavior in multi-layer oil-paper insulation under different DC voltages and temperatures. IEEE Trans. Dielectr. Electr. Insul. 2010, 17, 775–784. [Google Scholar] [CrossRef]
  12. Wang, D.; Wang, S.Q.; Lei, M.; Mu, H.B.; Zhang, G.J. Temperature effect on space charge behavior in oil-impregnated paper insulation. In Proceedings of the 2011 International Conference on Electrical Insulating Materials (ISEIM), Kyoto, Japan, 6–10 September 2011; pp. 378–382.
  13. Hao, J.; Liao, R.J.; Yang, L.J. Space charge dynamics in oil-paper insulation under the combination influence of moisture and temperature. In Proceedings of the 2012 International Conference on High Voltage Engineering and Application (ICHVE), Shanghai, China, 17–20 September 2012; pp. 294–297.
  14. Judendorfer, T.; Muhr, M.; Andritsch, T.; Smit, J.J. Assessment of space charge behavior of oil-cellulose insulation systems by means of the PEA method. In Proceedings of the IEEE International Conference on Solid Dielectrics (ICSD), Bologna, Italy, 30 June–4 July 2013; pp. 401–404.
  15. Hao, J.; Chen, G.; Liao, R.J.; Yang, L.J.; Tang, C. Influence of moisture on space charge dynamics in multilayer oil-paper insulation. IEEE Trans. Dielectr. Electr Insul. 2012, 19, 1456–1464. [Google Scholar] [CrossRef]
  16. Zhou, Y.X.; Huang, M.; Chen, W.J.; Jin, F.B. Space charge behavior of oil-paper insulation thermally aged under different temperatures and moistures. J. Electr. Eng. Technol. 2015, 10, 1124–1130. [Google Scholar] [CrossRef]
  17. Fofana, I.; Borsi, H.; Gockenbach, E.; Farzaneh, M. Aging of transformer insulating materials under selective conditions. Eur. Trans. Electr. Power Eng. 2007, 17, 450–470. [Google Scholar] [CrossRef]
  18. Fofana, I.; Bouaïcha, A.; Farzaneh, M. Characterization of ageing transformer oil–pressboard insulation using some modern diagnostic techniques. Eur. Trans. Electr. Power 2011, 21, 1110–1127. [Google Scholar] [CrossRef]
  19. Fu, J.; Hao, J.; Liu, H.; Li, K.; Cui, H.; Zhang, W. Influence of paper ageing on space charge dynamics in oil impregnated insulation paper under DC electric field. In Proceedings of the International Symposium on Electrical Insulating Materials (ISEIM), Chuo-ku Niigata City, Japan, 1–5 June 2014; pp. 385–388.
  20. Hao, J.; Tang, C.; Fu, J.; Chen, G.; Wu, G.L.; Wang, Q. Influence of oil aging on the space charge dynamics of oil-immersed paper insulation under a DC electric field. IEEJ Trans. Electr. Electron. Eng. 2015, 10, 1–11. [Google Scholar] [CrossRef]
  21. Ciobanu, R.; Prisecaru, I.; Schreiner, C. Space charge evolution in thermally aged cellulose materials. In Proceedings of the IEEE International Conference on Solid Dielectrics (ICSD), Toulouse, France, 5–9 July 2004; pp. 221–224.
  22. Tang, C. Studies on the DC space charge characteristics of oil-paper insulation materials. Ph.D. Thesis, Chongqiang Univeristy, Chongqing, China, 2010. [Google Scholar]
  23. Zhou, Y.; Huang, M.; Chen, W.; Lu, L. Space charge behavior evolution with thermal aging of oil-paper insulation. IEEE Trans. Dielectr. Electr. Insul. 2015, 22, 1381–1388. [Google Scholar] [CrossRef]
  24. Bodega, R.; Morshuis, P.H.F.; Smit, J.J. Space charge measurements on multi-dielectrics by means of the pulsed electroacoustic method. IEEE Trans. Dielectr. Electr. Insul. 2006, 13, 272–281. [Google Scholar] [CrossRef]
  25. Bodega, R.; Morshuis, P.H.F.; Redjosentono, E.; Smit, J.J. Dielectric interface characterization by means of space charge measurements. In Proceedings of the Annual Report Conference on Electrical Insulation and Dielectric Phenomena (CEIDP), Albuquerque, NM, USA, 19–22 October 2003; pp. 728–733.
  26. Hao, M.; Zhou, Y.; Chen, G.; Wilson, G.; Jarman, P. Space charge behaviour in oil and impregnated pressboard combined insulation system. In Proceedings of the IEEE International Conference on Liquid Dielectrics (ICLD), Bled, Slovenia, 29 June–3 July 2014; pp. 1–4.
  27. Hao, J.; Fu, J.; Tang, C.; Wu, G.; Wang, Q.; Yao, Q. Space charge characteristics of oil gap and pressboard mixed insulation based on the pulsed electro-acoustic measurement. In Proceedings of the International Conference on High Voltage Engineering and Application (ICHVE), Poznan, Poland, 8–11 September 2014; pp. 1–4.
  28. Wu, K.; Zhu, Q.; Wang, H.; Wang, X.; Li, S. Space charge behavior in the sample with two layers of oil-immersed-paper and oil. IEEE Trans. Dielectr. Electr. Insul. 2014, 21, 1857–1865. [Google Scholar] [CrossRef]
  29. Kelley, E.F.; Robert, E.H. Electro-optic measurement of the electric field distribution in transformer oil. IEEE Trans. Power Appar. Syst. 1983, 102, 2092–2097. [Google Scholar] [CrossRef]
  30. Okubo, H.; Shimizu, R.; Sawada, A.; Kato, K.; Hayakawa, N.; Hikita, M. Kerr electro-optic field measurement and charge dynamics in transformer-oil/solid composite insulation systems. IEEE Trans. Dielectr. Electr. Insul. 1997, 4, 64–70. [Google Scholar] [CrossRef]
  31. Zhou, Y.X.; Huang, M.; Sun, Q.H.; Sha, Y.C.; Jin, F.B.; Zhang, L. Space charge characteristics in two-layer oil-paper insulation. J. Electrostat. 2013, 71, 413–417. [Google Scholar] [CrossRef]
  32. Huang, M.; Zhou, Y.X.; Sun, Q.H.; Sha, Y.C.; Zhang, L. Effect of interface on space charge behavior in multi-layer oil-paper insulation. In Proceedings of the IEEE Conference on Electrical Insulation and Dielectric Phenomena (CEIDP), Montreal, QC, Canada, 14–17 October 2012; pp. 654–657.
  33. Huang, M.; Zhou, Y.X.; Chen, W.; Lu, L.C.; Jin, F.; Huang, J.W. Space charge dynamics at the physical interface in oil-paper insulation under DC voltage. IEEE Trans. Dielectr. Electr. Insul. 2015, 22, 1739–1746. [Google Scholar] [CrossRef]
  34. Liu, R.S.; Tornkvist, C. Charge storage and transport in oil-impregnated pressboard at polarity reversal under HVDC. In Proceedings of the Conference on Electrical Insulation and Dielectric Phenomena (CEIDP), Virginia Beach, VA, USA, 22–25 October 1995; pp. 33–36.
  35. Hao, M.; Zhou, Y.; Chen, G.; Wilson, G.; Jarman, P. Space charge dynamics in oil and thick pressboard combined system under polarity reversal voltage. In Proceedings of the IEEE Conference on Electrical Insulation and Dielectric Phenomena (CEIDP), Des Moines, IA, USA, 19–22 October 2014; pp. 867–870.
  36. Huang, M.; Zhou, Y.X.; Chen, W.J.; Sha, Y.C.; Jin, F.B. Influence of voltage reversal on space charge behavior in oil-paper insulation. IEEE Trans. Dielectr. Electr. Insul. 2014, 21, 331–339. [Google Scholar] [CrossRef]
  37. Wang, D.; Wang, S.Q.; Lei, M.; Mu, H.B.; Zhang, G.J. Space charge behavior in oil-paper insulation under polarity reversed voltage. In Proceedings of the IEEE International Conference on Condition Monitoring and Diagnosis (CMD), Bali, Indonesia, 23–27 September 2012; pp. 265–268.
  38. Hao, J.; Chen, G.; Wu, G.L.; Fu, J.; Wang, Q.; Yao, Q.; Peng, H.D. Space charge characteristics of oil impregnated insulation paper under the power frequency voltage. In Proceedings of the IEEE Conference on Electrical Insulation and Dielectric Phenomena (CEIDP), Shenzhen, China, 20–23 October 2013; pp. 1314–1317.
  39. Wu, G.L.; Hao, J.; Wang, Q.; Fu, J.; Yao, Q. Influence of oil property on space charge dynamics in oil-paper insulation under DC and AC electric field. In Proceedings of the IEEE Conference on Electrical Insulation and Dielectric Phenomena (CEIDP), Shenzhen, China, 20–23 October 2013; pp. 218–221.
  40. Holé, S.; Ditchi, T.; Lewiner, J. Non-destructive Methods for Space Charge Distribution Measurements: What are the Differences? IEEE Trans. Dielectr. Electr. Insul. 2003, 4, 670–677. [Google Scholar] [CrossRef]
  41. Tanaka, Y.; Takada, T.; Shinoda, C. Temperature dependence of space charge distribution in XLPE cable. In Proceedings of the IEEE Conference on Electrical Insulation and Dielectric Phenomena (CEIDP), Arlington, VA, USA, 23–26 October 1994; pp. 334–339.
  42. Dissado, L.A.; Mazzanti, G.; Montanari, G.C. The role of trapped space charges in the electrical aging of insulating materials. IEEE Trans. Dielectr. Electr. Insul. 1997, 4, 496–506. [Google Scholar] [CrossRef]
  43. Chen, G.; Banford, H.M.; Davies, A.E. Influence of radiation environments on space charge formation in γ-irradiated LDPE. In Proceedings of the International Symposium on Electrical Insulating Materials (ISEIM), Toyohashi, Japan, 27–30 Sepember 1998; pp. 113–116.
  44. Chen, G.; Davies, A.E.; Xi, B. Charge formation and decay in γ-irradiated low-density polyethylene. In Proceedings of the 6th International Conference on Properties and Applications of Dielectric Materials (ICPADM), Xi’an, China, 21–26 June 2000; pp. 443–446.
  45. Trostmann, E. Tap Water as a Hydraulic Pressure Medium, 1st ed.; CRC Press: Boca Raton, FL, USA, 2000; p. 63. [Google Scholar]
  46. Nalwa, H.S. Ferroelectric Polymers: Chemistry: Physics, and Applications; CRC Press: Boca Raton, FL, USA, 1995; p. 208. [Google Scholar]
  47. Bodega, R.; Morshuis, P.H.F.; Smit, J.J. Space charge signal interpretation in a multi-layer dielectric tested by means of the PEA method. In Proceedings of the IEEE International Conference on Solid Dielectrics (ICSD), Toulouse, France, 5–9 July 2004; pp. 240–243.
  48. Blitz, J. Fundamentals of Ultrasonic, 2nd ed.; Butterworths: London, UK, 1967; p. 100. [Google Scholar]
  49. Li, Y.; Murata, K.; Tanaka, Y.; Takada, T.; Aihara, M. Space charge distribution measurement in lossy dielectric materials by pulsed electroacoustic method. In Proceedings of the 4th International Conference on Properties and Applications of Dielectric Materials (ICPADM), Brisbane, Australia, 3–8 July 1994; pp. 725–728.
  50. Fu, M.; Luo, B.; Hou, S.; Liao, Y.; Hao, M.; Chen, G. Space charge dynamics in pressboard-oil-pressboard multilayer system under DC voltages. In Proceedings of the IEEE 11th International Conference on the Properties and Applications of Dielectric Materials (ICPADM), Sydney, Australia, 19–22 July 2015; pp. 112–115.
  51. Michael, B.; Michael, D.C. Conduction and breakdown mechanisms in transformer oil. IEEE Trans. Plasma Sci. 2006, 34, 467–475. [Google Scholar]
  52. Mahmud, S.; Chen, G.; Golosnoy, I.; Wilson, G.; Jarman, P. Experimental studies of influence of DC and AC electric fields on bridging in contaminated transformer oil. IEEE Trans. Dielectr. Electr. Insul. 2015, 22, 152–160. [Google Scholar] [CrossRef]
  53. Hao, M.; Zhou, Y.; Chen, G.; Wilson, G.; Jarman, P. Space charge dynamics in oil-impregnated pressboard under AC electric field. In Proceedings of the Annual Report Conference on Electrical Insulation and Dielectric Phenomena (CEIDP), Des Moines, IA, USA, 19–22 October 2014; pp. 1–4.
  54. The International Electrotechnical Commission (IEC). IEC 61378-3: Converter Transformers Part 3 : Application Guide, 2nd ed.; IEC: Geneva, Switzerland, 2015. [Google Scholar]
  55. Zhao, J.; Chen, G.; Zhong, L. Space charge in polyethylene under combined AC and DC voltages. IEEE Trans. Dielectr. Electr. Insul. 2014, 21, 1757–1763. [Google Scholar] [CrossRef]
  56. Nakagawa, T. Measurement of space charge accumulation in PPLP. In Proceedings of the IEEE 13th International Conference on Dielectric Liquids (ICDL), Nara, Japan, 20–25 July 1999; pp. 533–536.
  57. Kim, W.J.; Kim, S.H.; Kim, H.J.; Cho, J.W.; Lee, J.S.; Lee, H.G. The fundamental characteristics of PPLP as insulating material for HTS DC cable. IEEE Trans. Appl. Superconduct. 2013, 23, 3–6. [Google Scholar]
  58. Cheng, L.; Ruijin, L.; Weiqiang, W.; Tuan, L. Influence of nano-TiO2 on DC space charge characteristics of oil-paper insulation material. High Volt. Eng. 2015, 2, 417–423. [Google Scholar]
  59. Huang, B.; Hao, M.; Chen, G.; Hao, J.; Fu, J.; Wang, Q. Space charge characteristics and the electric field distortion after polarity reversal operation in two layers of oil-impregnated paper and oil. In Proceedings of the 19th International Symposium on High Voltage Engineering (ISH), Pilsen, Czech Republic, 23–28 August 2015; pp. 1–4.
  60. Liao, R.J.; Zhu, M.Z.; Yang, L.J. Analysis of interaction between transformer oil and cellulosic insulation paper using molecular simulation method. High Volt. Eng. 2011, 37, 268–275. [Google Scholar]
  61. Liao, R.J.; Zhu, M.Z.; Zhou, X. Molecular dynamics simulation of the diffusion behavior of water molecules in oil and cellulose composite media. Acta Phys. Chim. Sin. 2011, 27, 815–824. [Google Scholar]
  62. Cheng, Y.H.; Xie, X.J.; Chen, X.L. Research on dielectric properties at ultra-high temperature based on molecular simulation technique. Trans. China Electrotech. Soc. 2006, 21, 1–6. [Google Scholar]

