
Fluctuations of Natural Gas Prices for Households in the 2017–2022 Period—Polish Case Study


Faculty of Economics and Management, Opole University of Technology, Luboszycka 7, 45-036 Opole, Poland
*
Author to whom correspondence should be addressed.
Energies 2023, 16(4), 1824; https://doi.org/10.3390/en16041824
Submission received: 28 December 2022
/
Revised: 25 January 2023
/
Accepted: 9 February 2023
/
Published: 12 February 2023
(This article belongs to the Special Issue Sustainable Development, Energy Economics and Economic Analysis)
Abstract
:The considerable share of natural gas in the aggregated gross available energy clearly indicates the resource’s importance for the energy security of EU states. Natural gas shortages caused by energy crises result in the resource’s price increases in foreign markets. The condition of the global energy system translates directly to the prices of natural gas for households. The main research objectives were the analysis of prices of household natural gas in the EU, and identification of key factors affecting the prices of household natural gas in Poland and their effect on the prices established in domestic tariffs. The secondary data analysis method (desk research) was used in the research. The 2017–2022 data were acquired from Eurostat, the Polish distributor’s (PGNiG SA) tariffs, the Energy Regulatory Office and exchange information. The paper fills a research gap in the disparity of prices of natural gas supplied to final individual recipients in the EU. It was established that the sudden increases in natural gas purchase prices on energy resource exchanges translated into a similarly dynamic increase in the household gas fuel prices. The price data concerning Poland were compared to analogous data from other EU member states. It was established that in the period between the first half of 2021 and the first half of 2022, gas prices in the EU increased by over 34% on average (maximum of 150%). It was concluded that the household natural gas prices in Poland, established in the officially approved distribution tariffs of PGNiG SA, are substantially affected by two factors: energy resource purchase prices on the Polish Power Exchange (TGE), and purchase prices on foreign markets. The main reason for price increases was the unforeseen substantial changes in the conditions of conducting business activity by PGNiG SA in terms of gas fuel trading, resulting from the increase in high-methane natural gas purchase price at the TGE. On the other hand, the increases in purchase price of natural gas imported from EU or EFTA member states by 2021 have moderately translated into increases in prices established in officially approved tariffs. A similar effect of household natural gas price increase has also occurred in other EU member states but was not uniform. The effect depended on the volume of gas production and consumption in the given country, and on the diversity of gas sources that determined the resource’s purchase price.
1. Introduction
The global power system is currently facing the greatest challenges in the last 50 years, i.e., since the 1970s energy crisis. At that time, the fuel crisis reached all highly industrialised countries dependent on petroleum supplies. The direct cause of the crisis was the sudden increase in the prices of petroleum in the global markets, resulting from the embargo imposed by the states associated in the Organization of Arab Petroleum Exporting Countries. The crude oil barrel price suddenly increased to USD 35, while amounting to USD 2 per barrel in 1970. The changes ended the period of carefree consumption of petroleum as a cheap strategic resource. However, the oil crisis of 1973 was not the only crisis in the resources market. Other crises took place in 1979 (Iranian Revolution), 1990 (Gulf War) and in 2007 (global financial crisis). The oil market reacted with price increases to any crisis that affected resource producers.
The cause of the current power crisis is the natural gas shortage and the related price increases. Similarly, to oil crises, the sharp supply reduction is not an effect of gas source depletion, but of the geopolitical situation. The sanctions imposed on Russia due to its aggression in Ukraine caused gas supply minimisation from the previous main gas supplier to European states. In effect, the natural gas shortage and increasing prices upset the states’ power security [1,2,3,4].
According to the Eurostat statistical methodology [5], the most important aggregate in the states’ energy balance is the Gross Available Energy, because it represents the energy required to satisfy all of a country’s energy needs. Gross Available Energy is the combined energy supply for all activities within the given country. It covers the energy demand for energy processing (including electricity production from combustible fuels), supporting the energy sector’s operations, transmission and distribution losses, final energy consumption (industry, transport, households, services, agriculture) and using fossil fuel products for non-energy purposes. It also encompasses fuel purchased internally for external use (services provided abroad). According to the Eurostat methodology this aggregate is calculated with the use of the following formula [6]:
where:
- GAE—Gross available energy;
- PPRD—Primary production;
- RCV_RCY—Recovered and Recycled products;
- IMP—Imports;
- EXP—Export;
- STK_CHG—Stock changes.
Theorem 1.
Gross Available Energy calculation method.
The trends identified for the main energy resources used in primary energy production, import and export, Gross Available Energy and final energy consumption in Europe are identified largely based on Eurostat statistics [7,8]. Listings are developed based on annual data from each member state and constitute a review of the EU’s energy economy.
The Gross Available Energy listing (Table 1), developed as part of a simplified energy balance, contains data concerning the components associated with the total energy production in EU states.
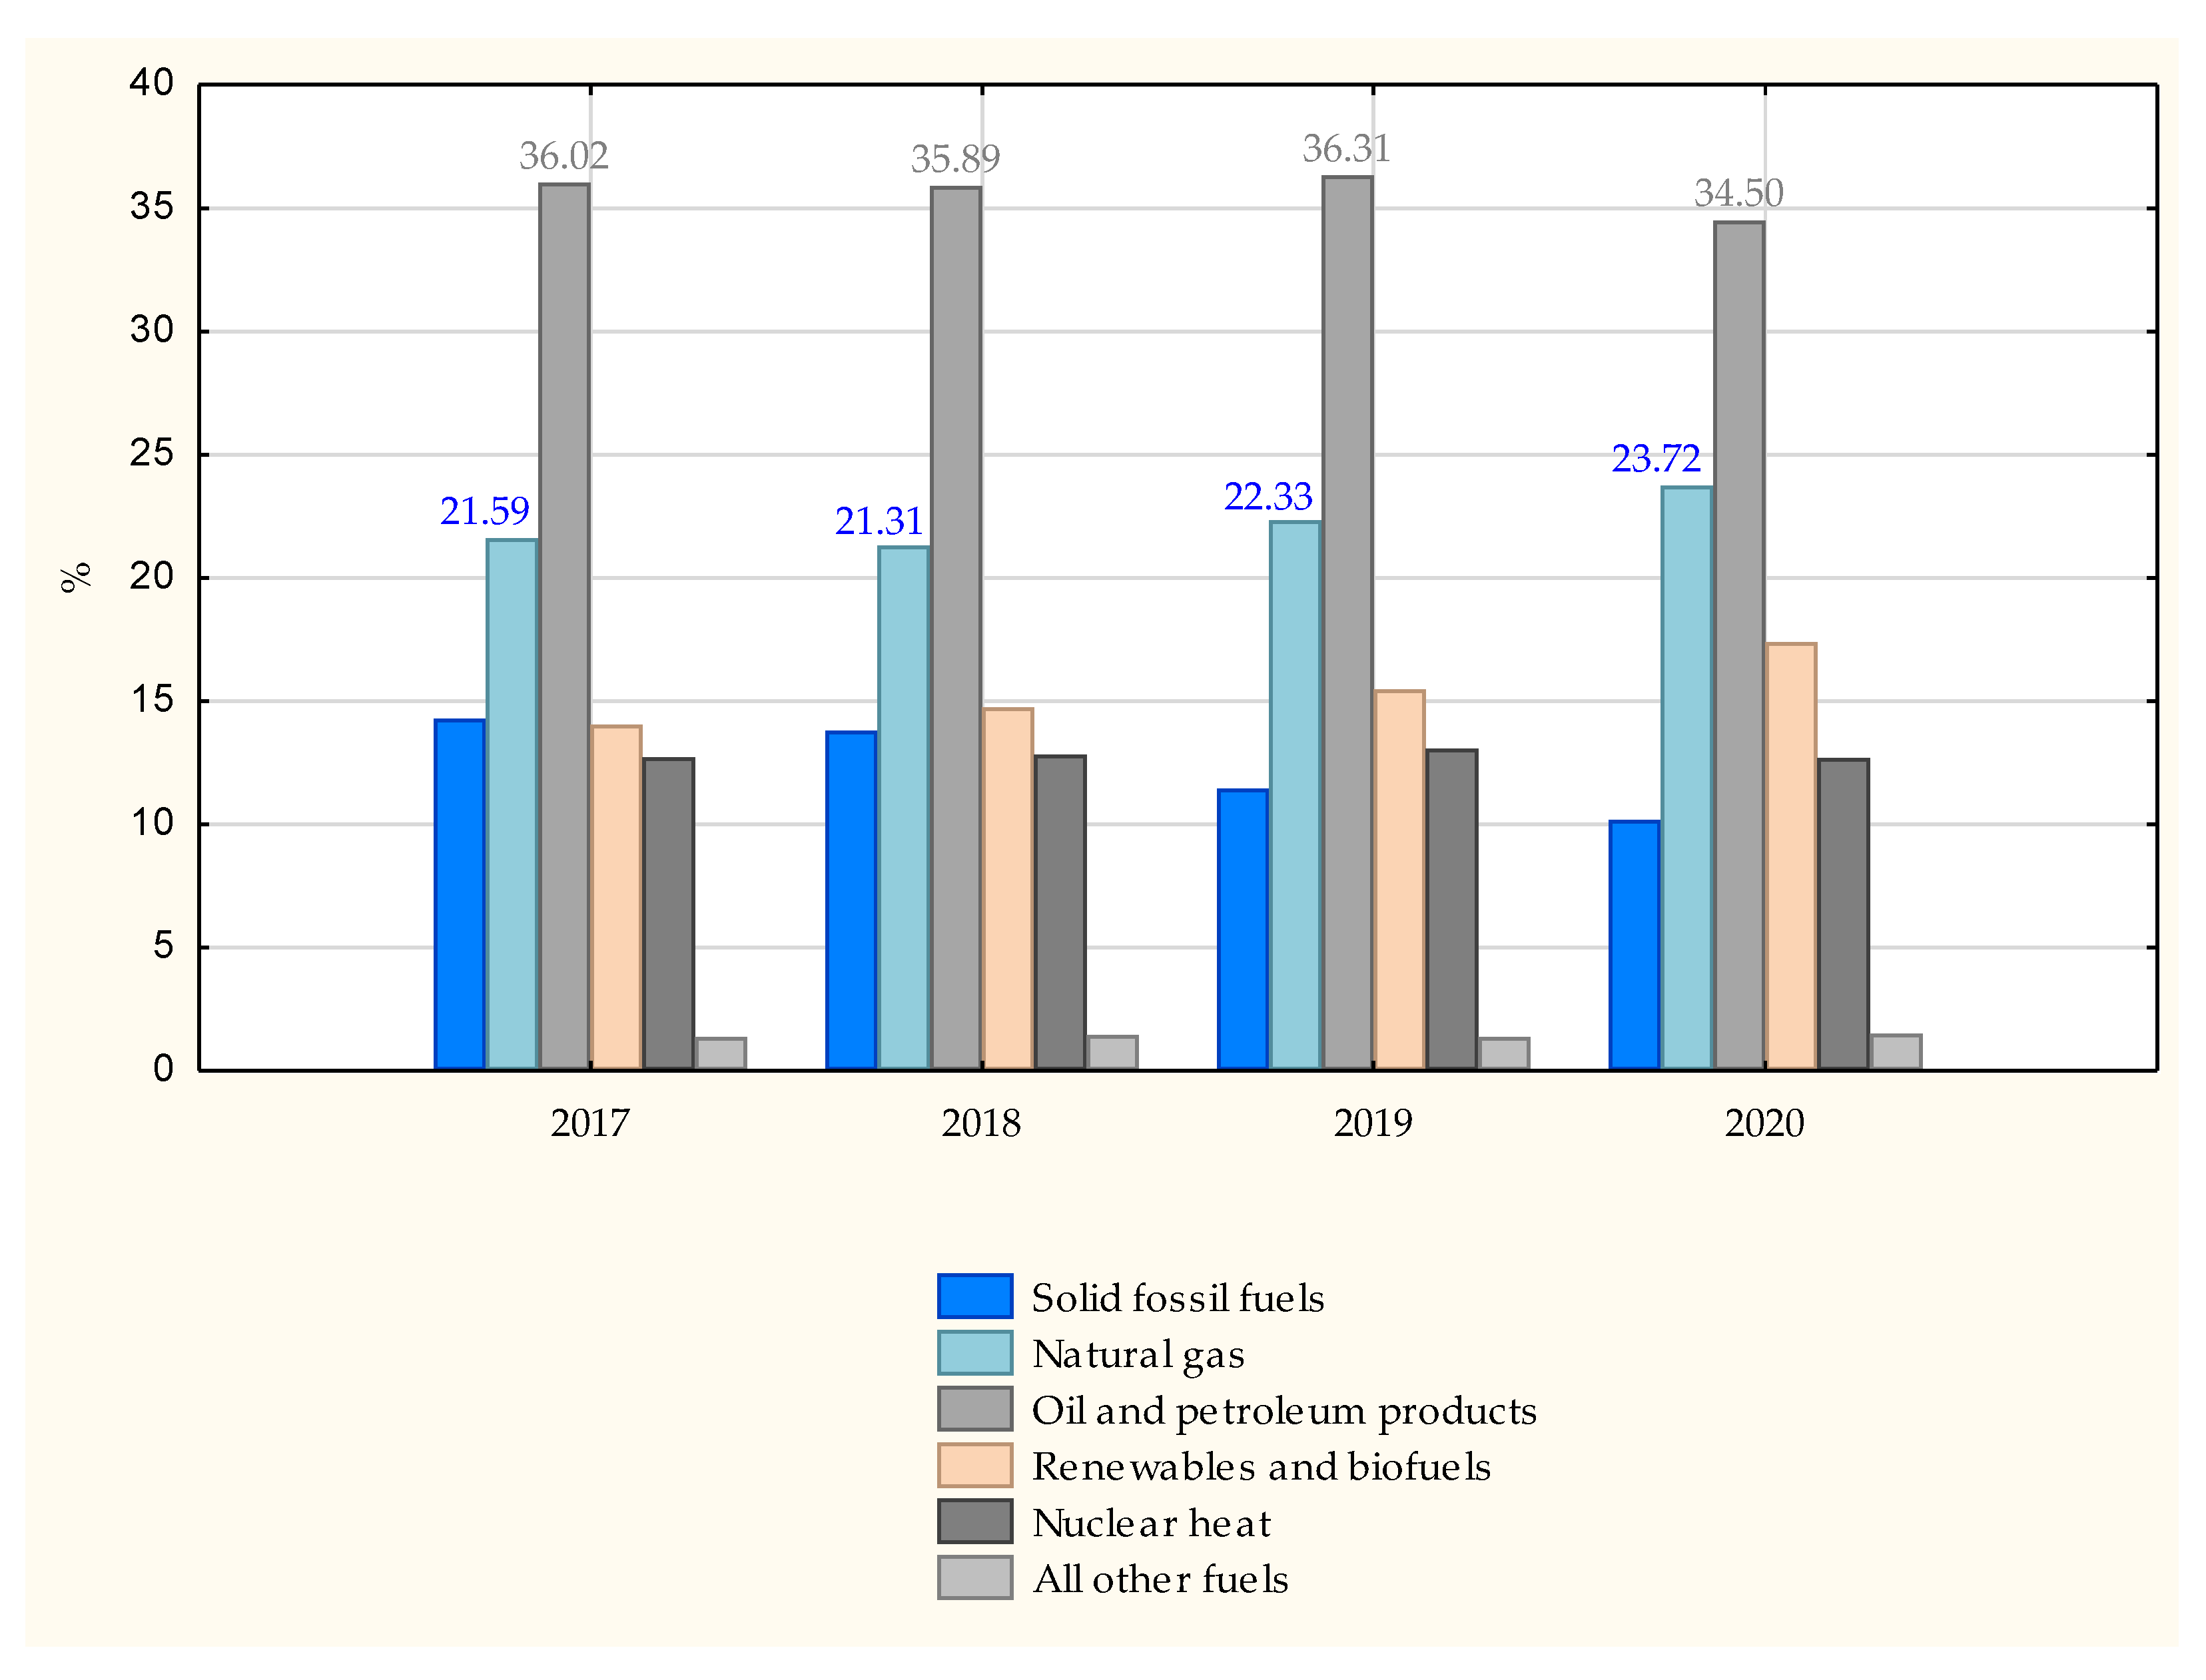
Similar to previous years, in the 2017–2020 period petroleum and petroleum-derivatives were still the most important energy source for the European economy, while natural gas remained the second energy source in terms of volume. Even though the volume of those two components decreased and the share of renewable energy sources increased, the importance of these components has not decreased. In the EU, natural gas constituted 21.59% (2017), 21.31% (2018), 22.33% (2019) and 23.72% (2020) of energy fuels, accordingly (Figure 1).
During an energy crisis there is an increasing demand for alternative energy sources [10]. Taking into account the reduction in emissions of greenhouse gases generated as result of fossil fuel burning, renewable energy sources play a crucial role in the decarbonisation of the economy [11]. Solar, wind, biomass and geothermal energies are gaining importance [12,13,14,15]. Renewable energy sources are not without their drawbacks. Some forms of energy generation are not fully environmentally friendly, because they interfere with the environment (e.g., wind force absorption by wind power plants) or take up large areas in relation to the energy generated (e.g., photovoltaic farms) [12,16]. Energy generation from renewable sources requires new technologies and investments, while dependence on forces of nature and the related performance fluctuations result in generated power instability. On the other hand, natural gas, as opposed to renewable energy sources, allows for energy production as needed, and not as allowed by current atmospheric conditions [17] Therefore, as in the case of alternative sources, natural gas remains relevant as it is a perfect supplement to energy production from renewable sources [18]. Biomass, available in various forms and states of matter, is becoming one of the more important renewable energy sources in energy generation. Biomass is the primary raw material source of biofuels that contribute to improved energy security and reduced carbon dioxide emissions [16,19]. It can play an important role as a renewable energy source with great potential in biofuel production for transport, electricity and heat (Table 1) [20].
The share of the energy source material in the total energy mix depends mainly on a country’s geographic location. In the case of natural gas, countries have different capacities to maintain specific gas reserves and different means of importing it, e.g., access to gas pipelines or infrastructure required to service liquefied gas. Nevertheless, the considerable share of natural gas in the aggregated Gross Available Energy clearly indicates the resource’s importance for the energy security of EU states. The condition of the global energy system translates directly to the prices of natural gas for Polish households. Natural gas shortages caused by energy crises result in the resource’s price increases in foreign markets, which constitute one of the main sources of this resource for Poland. Natural gas is supplied to the Polish market from two sources: domestic production (2021—17.6%) and import; however, the main source of natural gas is supplies from abroad (2021—52.6% from Russia, 29.8% from other markets). Until 2022 the import structure was dominated by supplies from Russia and Germany [21]. The main objectives of the research were the identification of key factors affecting the prices of household natural gas in Poland and their effect on the prices established in PGNiG’s tariffs, as well as an analysis of household natural gas prices in the EU and Poland’s position compared to other member states. The research issue was focused on studying the prices in two aspects: the domestic and EU dimension. In terms of the domestic dimension, it included an analysis of the average annual prices as part of tariffs designated (in terms of gas fuel trade) by the leading Polish distribution company Polskie Górnictwo Naftowe i Gazowe (PGNiG) [22]. The Polish scientific literature does not specify a commonly accepted catalogue of factors that affect natural gas prices in both local and global markets. For research purposes the study featured identification of two factors that affect gas fuel prices established in officially approved PGNiG tariffs: purchase prices of natural gas imported to Poland from EU and other states, as well as purchase prices of natural gas on gas fuel sales markets The basis for their isolation was the analysis of the official report on the activity of the President of the Energy Regulatory Office for 2021, in which the President commented on the main reasons for natural gas price increases in Poland in 2021 [23]. In Poland, market transactions are concluded at the Polish Power Exchange (TGE). The price studies did not consider the prices of gas imported from Russia due to missing relevant data (contract confidentiality). In terms of the EU dimension, the analysis encompassed the price dynamics of household natural gas in Poland compared to the EU.
The following research hypotheses were proposed:
Hypothesis 1 (H-1).
The household natural gas prices, established in the Polish distribution companies’ tariffs, are substantially affected by two factors: resource purchase prices in foreign markets and purchase prices at the Polish Power Exchange (TGE);
Hypothesis 2 (H-2).
The increase in natural gas prices is not uniform across all countries, as it depends on the volume of gas production and consumption in the given country and on the volume of gas purchased in various quantities from various sources for different prices.
2. Materials and Methods
2.1. Methods
The article utilised subject literature analysis and the secondary data analysis methods (desk research). The data were acquired from PGNiG’s official website [22], the Polish Energy Regulatory Office’s (URE) website [24,25,26], and from Eurostat [27,28]. To maintain the comparability of the results, the analysis covered statistical data for the 2017–2022 period. In the first phase of study, the analysis of the prices of natural gas for Polish households was conducted based on the example of PGNiG’s officially approved tariffs. The tariff asking prices (without the excise tax) of gas fuel for direct consumption by households were considered. The analysis encompassed the Company’s tariff prices from 2017–2022. Due to the price fluctuations in subsequent years, the calculations firstly encompassed the average annual gas fuel prices without the excise tax, with a zero-excise tax rate or with excise tax exemptions. Then, prices expressed in gr/KWh were converted to prices in EUR/KWh. Then, the following dependencies were presented:
- The impact of the average annual purchase prices of natural gas from EU member states and other states on the household natural gas prices according to the PGNiG tariff;
- The impact of the purchase prices of natural gas from gas fuel sales markets, conducted by the TGE, on the household natural gas prices according to the PGNiG tariff.
The data on average natural gas purchases prices from EU member states or EFTA member states (parties to the Agreement on the European Economic Area) were acquired from the Energy Regulatory Office’s official website [24].
The analysis of the purchase price of natural gas in the Polish gas fuel sales market included TGE market transactions: on the Gas Day-Ahead and Intraday Market (RDNiBg) and the Gas Commodity Futures Market (RTTg). The annual weighted mean (trade volume) prices of the RDNiBg contracts and of the contracts including supply to the RTTg were taken into account. Weighted mean values dependent on the trade volume of annual contract prices were acquired by analysing the Annual TGE Reports for 2017–2021, made available on TGE’s website [25].
For research purposes, natural gas prices expressed in Polish zlotys (PLN) or American dollars (USD) were converted to Euros (EUR). The bases for the conversion were the weighted mean foreign exchange rates in PLN, published on the National Bank of Poland’s (NBP) website [29]. The second phase of study featured an analysis of the prices of natural gas for Polish households, and their comparison to the prices applicable to households in other EU states.
The Statistica software was used to analyse the data.
2.2. Analysis of the Issue–Literature Review
The current international and domestic literature features a clear research gap regarding the issue of household natural gas prices.
International publications feature deliberations on gas prices that especially encompass the following: analysis of the impact of natural gas prices on the European electricity prices, analysis of the natural gas demand in households as well as analysis of the European price-related and income-related flexibility of the demand for energy, including natural gas. In the first group of publications, the authors are mainly analysing the mechanisms that enable natural gas prices to affect the prices and settlements on electricity markets [30,31,32,33]. As part of the analysis of the natural gas demand in households, the studies contain analyses of the demand in selected countries, e.g., Switzerland [34], Bulgaria [35], Germany [36]. The last direction of studies contains an analysis of the price-related and income-related flexibility of the demand for energy, in which the natural gas parameters are usually treated as a component of energy studies [37,38,39,40]. In these publications, the authors emphasise the impact of the demand’s price-related and income-related flexibility on the state’s effective energy policy designing. It is possible to distinguish the publication that analyses the energy market situation from the point of view of households in the 2010–2020 period in selected EU states and indicates the differences in gas prices in specific countries after taking taxes and fees into account [41].
On the other hand, domestic publications on natural gas prices are dominated by analyses for the 2000–2009 period, covering the household natural gas prices, established in tariffs of distribution companies. The identified publications are often fragmented or are focused solely on a selected aspect [42,43,44,45,46]. The current deliberations in the domestic doctrine are especially focused on analyses of the following issues:
3. Results
3.1. Household Natural Gas Prices in Poland
The household natural gas prices are regulated prices, meaning that they are calculated in officially approved tariffs. The prices are established with consideration of the regulations of the Act of 10 April 1997–Energy Law [56] and of the Ordinance of the Minister of Energy of 15 March 2009on the detailed rules of establishing and calculating tariffs and settlements in gas fuel trade [57]. The tariff ordinance standardised the detailed rules of establishment and calculation of prices and fee rates for gas fuels supplied to tariff recipients. The ordinance introduces into the Polish law the regulations of the EU gas directive—Directive of the European Parliament and of the Council no. 2009/73/EC of 13 July 2009 concerning common rules for the internal market in natural gas and repealing Directive 2003/55/EC [58]. Internally, the European Union adopted numerous legal acts that affect the EU gas market’s functioning, while Directive 2009/73/EC is the most important legal act in this regard as it affects, among others, the competitiveness of natural gas prices in the European market [59,60,61]. According to the general natural gas pricing rules, the EU member states are obligated to designate a single regulatory body to establish or approve gas fuel transmission and distribution tariffs [62,63]. In Poland, the Energy Regulatory Office (URE) is the body provided by licensed energy companies with tariffs for approval. These tariffs specify the prices and fee rates for gas fuels delivered to various recipient groups. The sale of gas fuel by PGNiG to household recipients is based on annual gas fuel trade tariffs approved by the URE President. These tariffs apply to settlements with recipients who draw gas fuel for their personal use in the household. PGNiG is obligated to calculate the prices in a manner that balances two objectives: on one hand, taking into account the costs necessary to perform the duties related to the conducted gas fuel trade activity and, on the other hand, taking into account the protection of gas recipients’ interests as a social good [64]. These calculations translate into the prices of gas fuel delivered to households.
From 2017, the prices of gas fuel for households have been steadily increasing [65,66,67]. This trend continued until 2019, when a nearly two-year period of price decreases has started [68,69,70]. In the first half of 2021, the prices of gas fuel for households again started to increase and this time the increases was rapid (Table 2) [71,72].
3.1.1. Impact of Average Annual Purchase Prices of Natural Gas in European Markets on the Prices of Natural Gas for Households According to the PGNiG Tariff
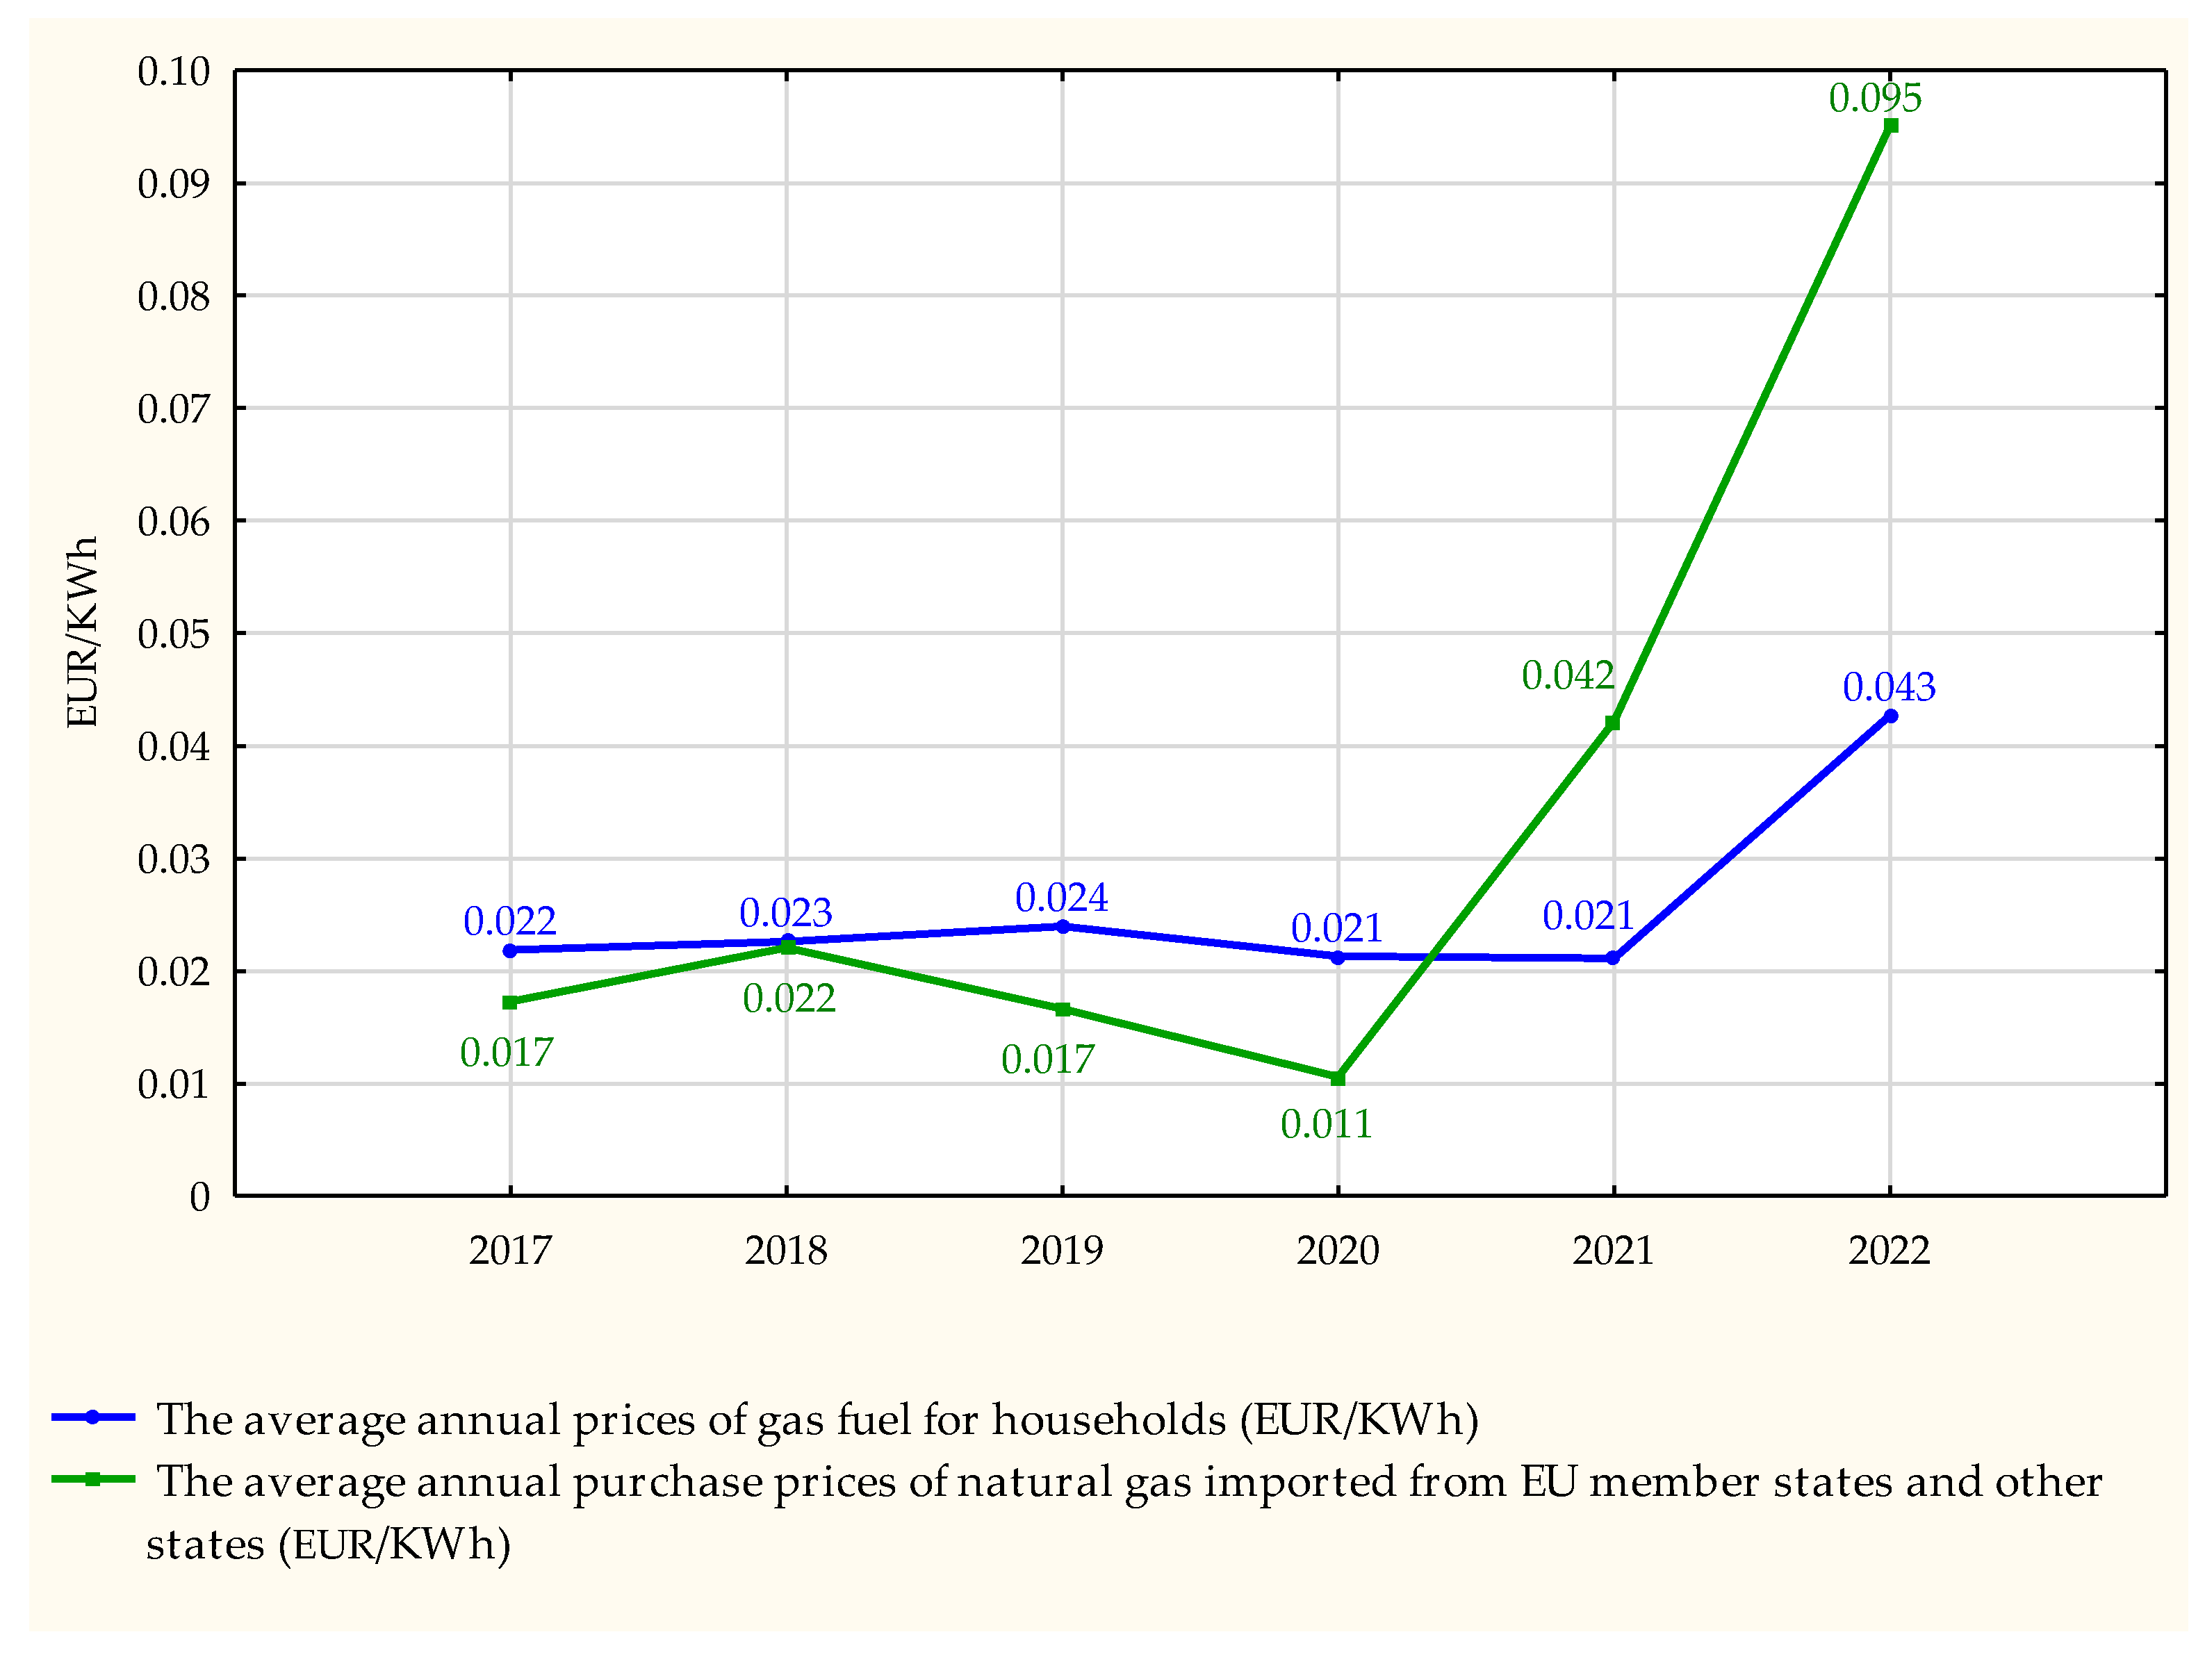
Foreign supplies are the main source of gas supply for the Polish market. Until 2021, the average annual prices of gas fuel specified for households according to PGNiG’s officially approved tariffs have shown slight variation when compared to the average annual purchase prices of natural gas imported from EU member states and other states. The period of rapid wholesale gas fuel price increases, which started in 2021, resulted from prices increases on European exchanges [73]. The average annual purchase prices of natural gas imported from EU member states and other states are shown in the Table 3.
The relation between the average annual gas fuel prices established in PGNiG’s officially approved tariffs and the average annual purchase prices of natural gas imported from EU member states and other states is presented in Figure 2.
3.1.2. Impact of the Purchase Prices of Natural Gas from Gas Fuel Sales Markets, Conducted by the TGE, on the Price of Natural Gas for Households According to the PGNiG Tariff
In Poland, the sale and purchase of gas fuels in the wholesale market takes place in the exchange market administered by the TGE, and by the RTG and OTF as part of the TGE. The exchange market participants mainly include gas fuel trade enterprises and the biggest final recipients that can act independently following the conclusion of a relevant agreement. TGE administers two gas fuel sales markets: the Gas Day-Ahead and Intraday Market (RDNiBg) and the Gas Commodity Futures Market (RTTg). Intraday and day-ahead transactions are sport transactions that reflect the investors’ short-term situation evaluation and are an answer to direct demand. The subject of the trade is equal gas supply during each hour of the supply date. It is a base type of instrument, and a single contract corresponds to the supply of 1 MWh of gas during each hour of the supply date (intraday or day-ahead timeframe). Trade takes place for one day preceding the supply date as part of continuous trading taking place every day using hourly instruments [74]. On the other hand, the futures market features futures contracts with physical gas supply in an established continuous period. It offers weekly, monthly, quarterly, and annual instruments. RTTg trade takes place as part of continuous trading and auctions [75].
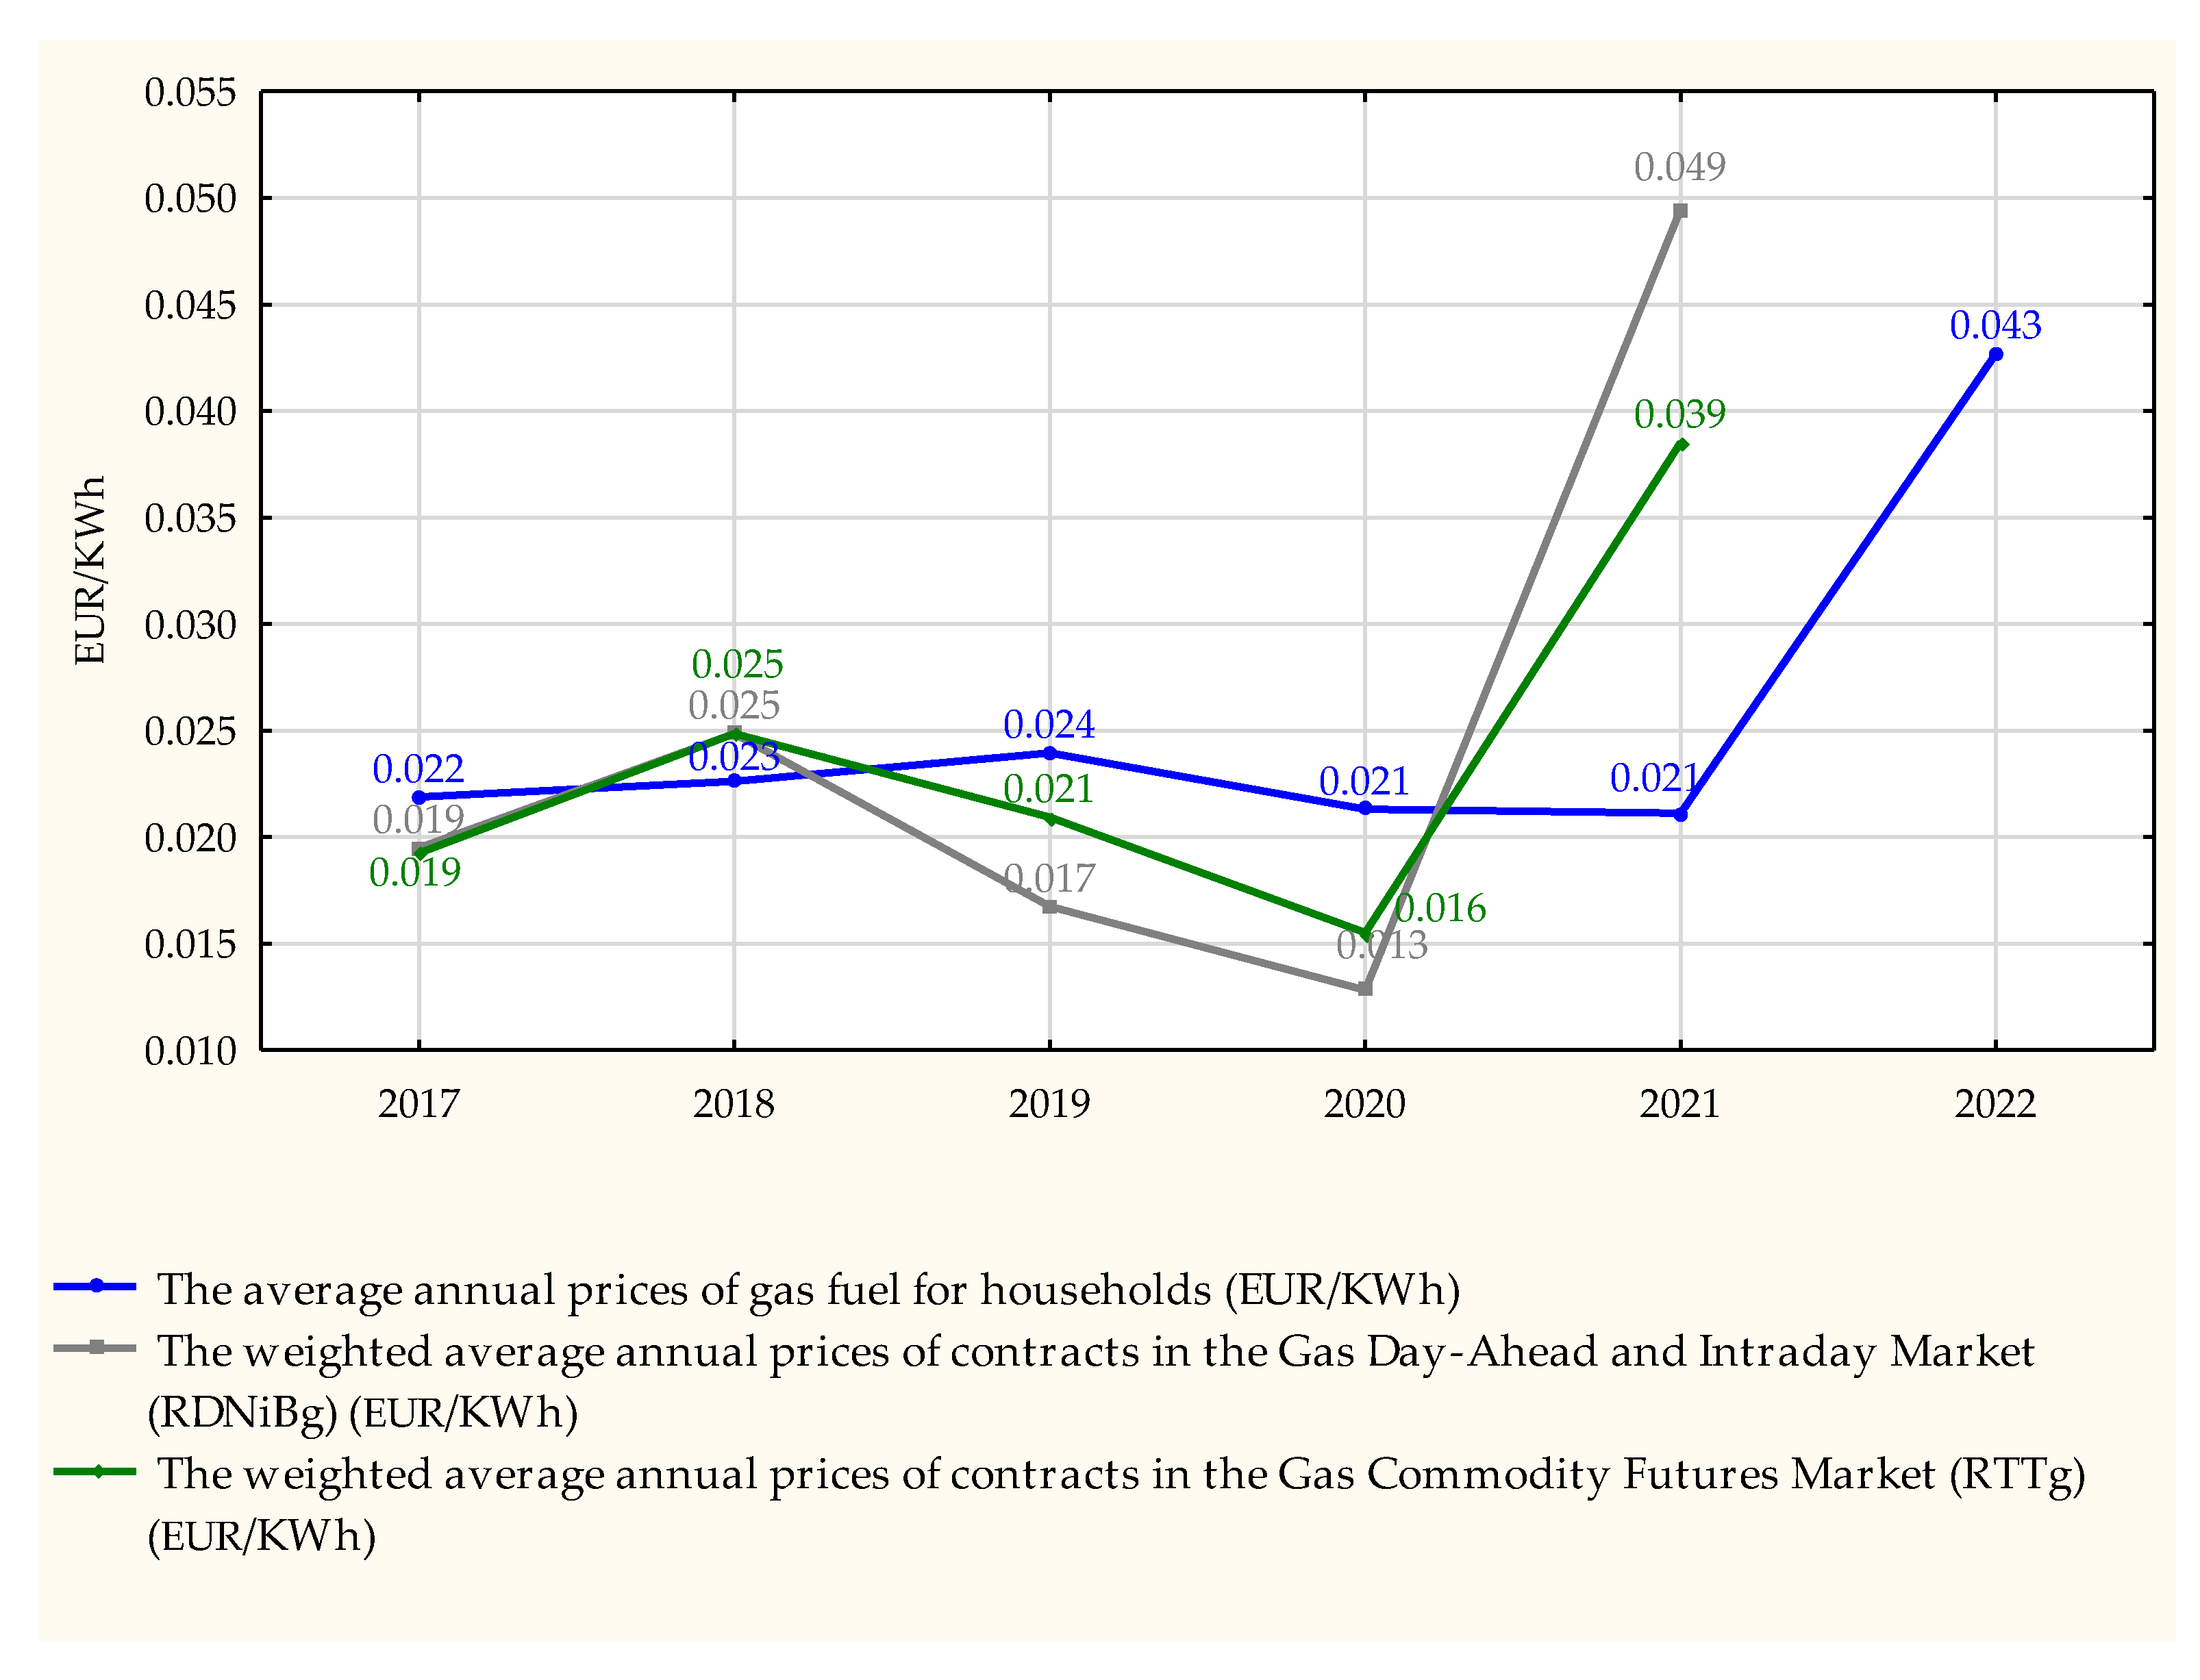
Until the end of 2019, slight natural gas purchase price increases and decreases on the TGE have slightly translated to increases and decreases in the prices established in the PGNiG’s tariffs. The first price increase on the TGE occurred in 2020; however, it did not cause substantial increases in the prices established in the PGNiG’s tariffs. The increase can only be observed from 2021. When trying to justify the price increases in the tariffs, PGNiG pointed directly to the unforeseen substantial change in the terms of conducting gas fuel trade activity. This change resulted from the increased costs of purchasing high-methane natural gas at the TGE, which exceeded the costs adopted for the calculation of the current tariffs [65,66,67]. The relation between the average annual prices of natural gas established in PGNiG’s officially approved tariffs and the average annual natural gas purchase prices on the TGE markets is presented in Figure 3.
Comments:
- No data available on the average annual gas fuel prices after II Q 2022;
- No data available on the average annual prices of futures contracts (RTTg) after 2021.
3.2. Natural Gas Production and Consumption in Selected EU Countries
The European Union’s own energy resources are small when compared to the gas consumption demand in EU states, which is the main reason for gas shortages. Gas production and consumption in the EU are presented in Table 4 and Figure 4.

Table 4.
Natural gas production and consumption in European Union, 2017–2021 (billion m3).
| Year | 2017 | 2018 | 2019 | 2020 | 2021 |
|---|---|---|---|---|---|
| Production | 76.8 | 68.8 | 61.1 | 47.8 | 44.0 |
| Consumptions | 385.2 | 378.1 | 391.8 | 380.3 | 396.6 |
| Deficit | 308.4 | 309.3 | 330.7 | 332.5 | 352.6 |
Comments:
- No data available after 2021;
- 1 billion m3 = 109 m3.
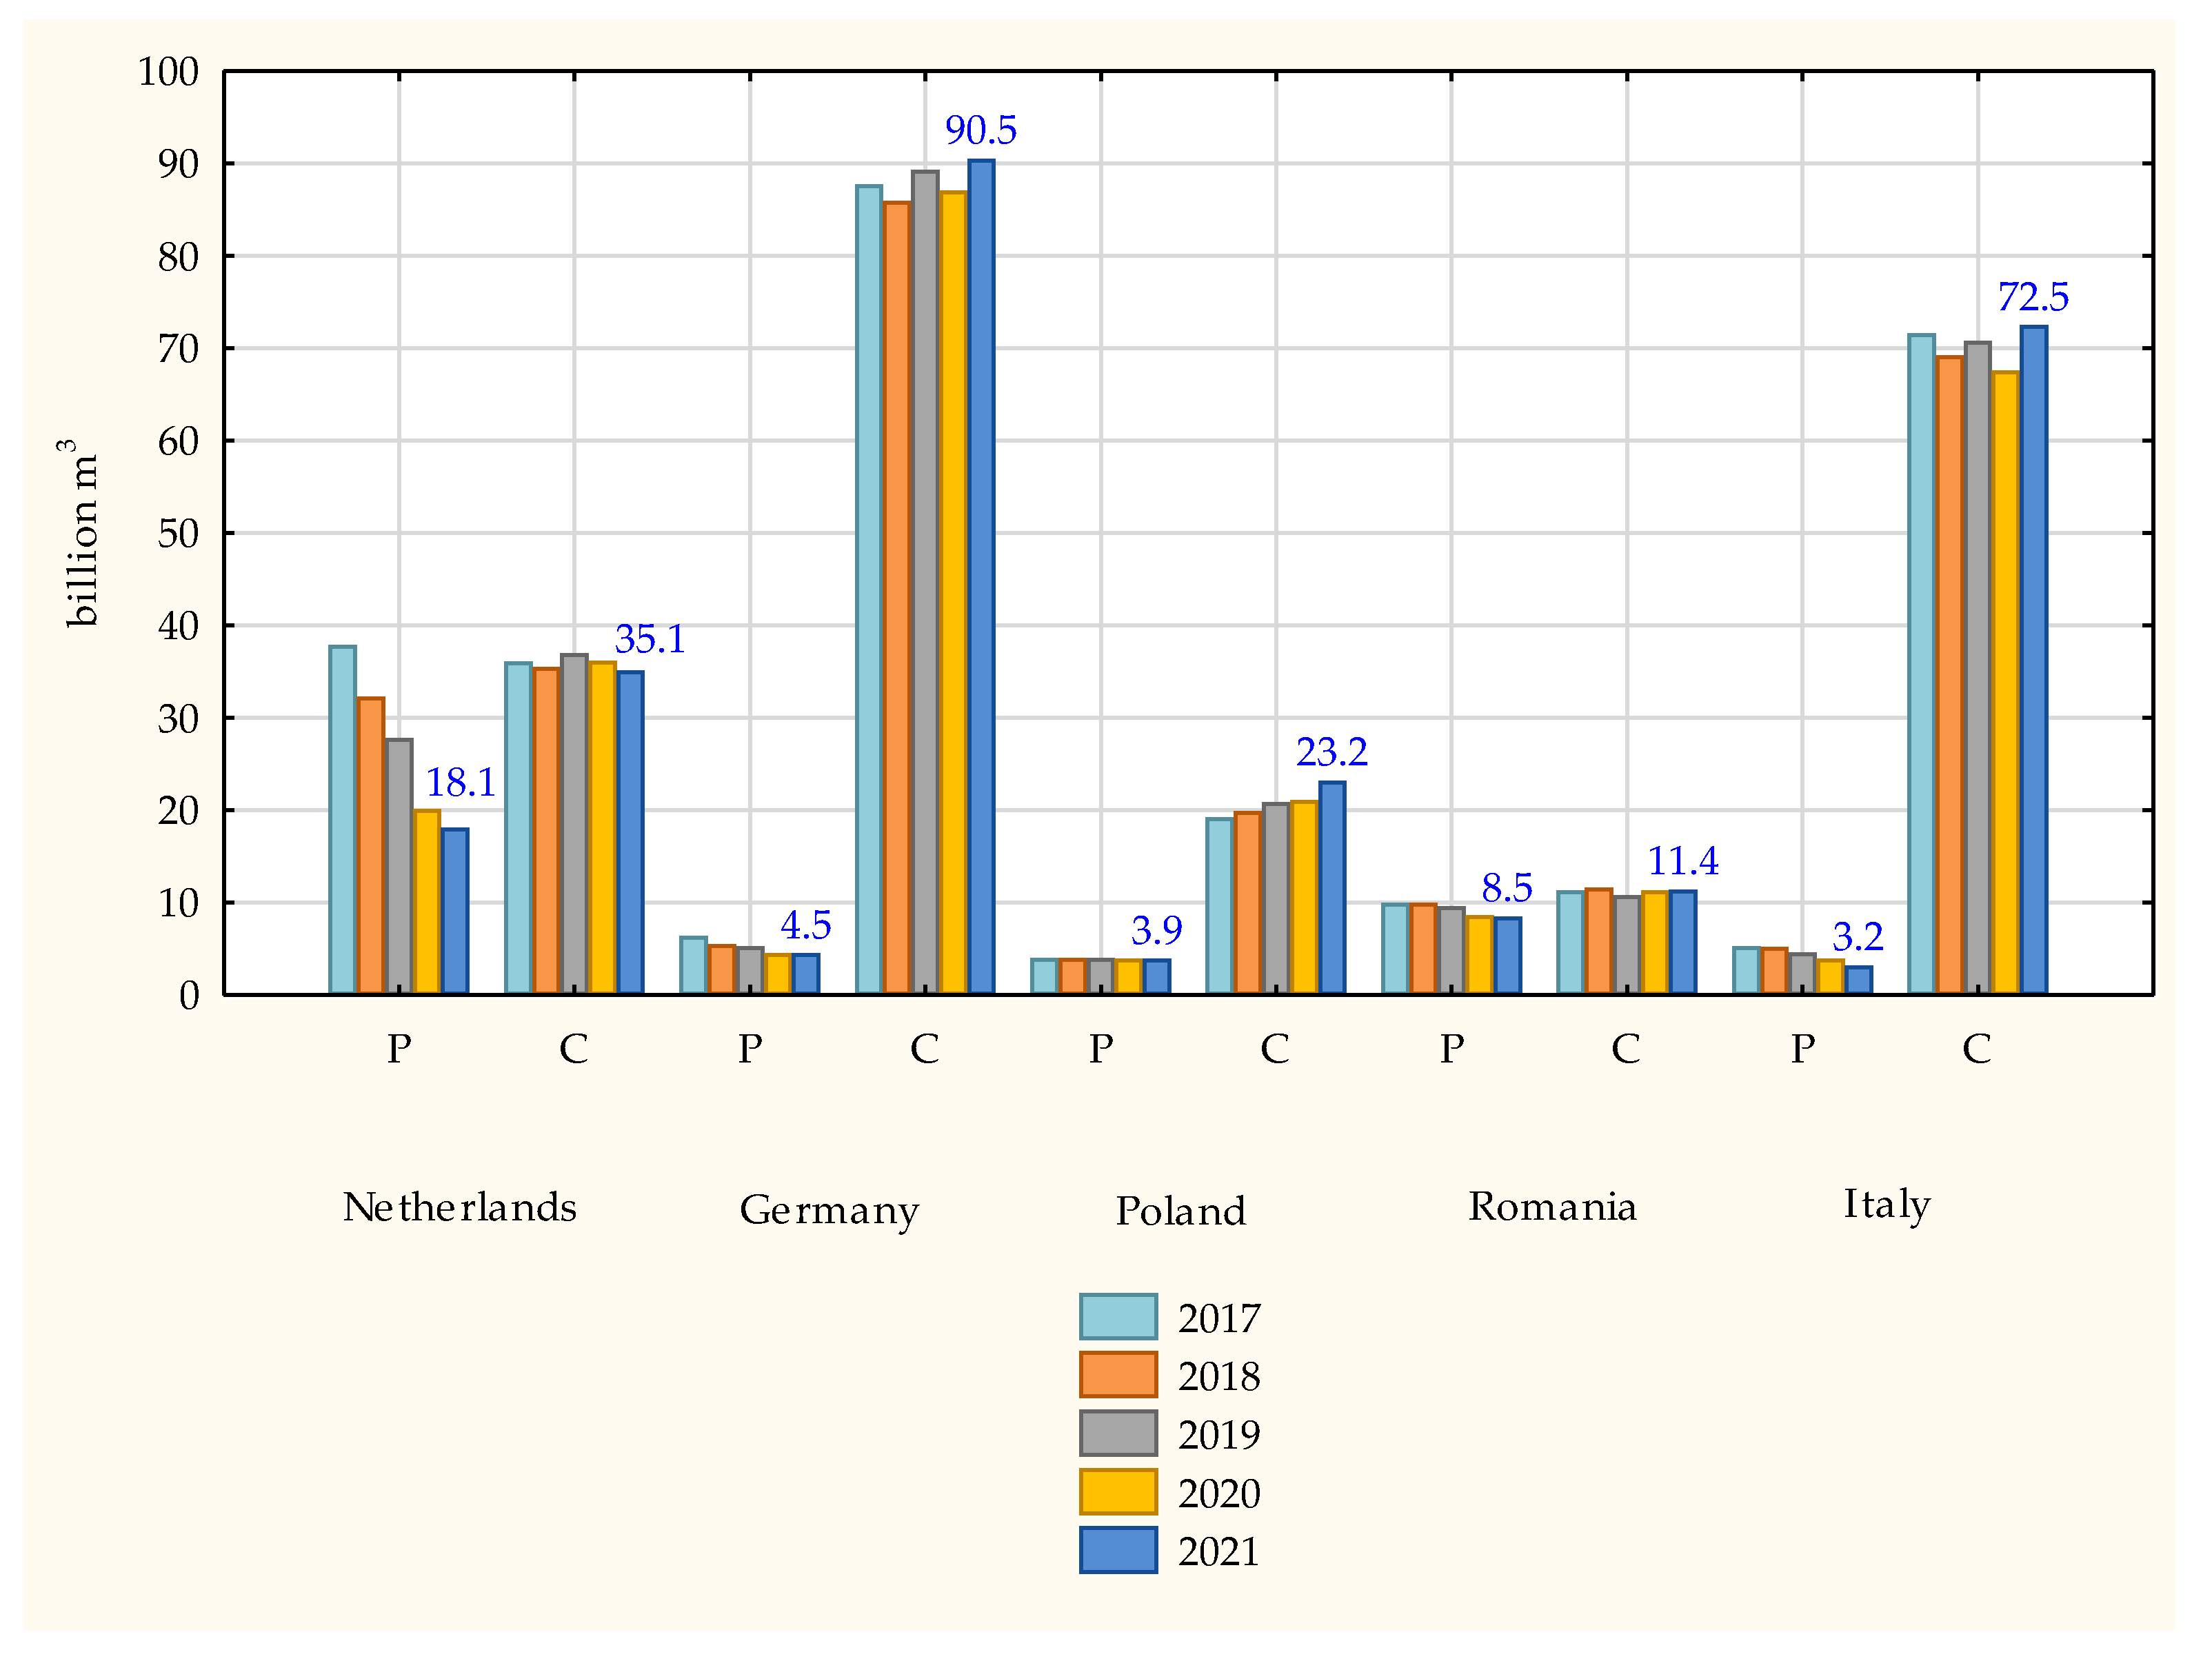
In the 2017–2021 period the EU’s gas production decreased substantially by 32.8 billion m3 (by 57.3% for boundary years). On the other hand, the demand and consumption substantially exceeded production year by year. This shows the extent of the precious resource’s shortage, which amounted to 352.6 billion m3 in 2021. Gas shortages are not even for each EU country and highly vary. The reason for this is the varied level of production and consumption (Figure 4).
Figure 4.
Natural gas production (P) and consumption (C) in selected countries EU, 2017–2021 (billion m3).
Figure 4.
Natural gas production (P) and consumption (C) in selected countries EU, 2017–2021 (billion m3).

Comments:
- No data available after 2021;
- 1 billion m3 = 109 m3.
The highest natural gas shortage is in Germany and Italy, where the consumption exceeds production many times (over 20 times in Germany and over 22 times in Italy in 2021). Poland is also among the biggest natural gas consumers, and its consumption also substantially exceeds production; however, this difference is smaller (by nearly 6 times in 2021).
Because natural gas consumption substantially exceeds its production in specific countries, EU states acquire this resource from other countries through pipeline networks or LNG storage at gas terminals. In 2020, gas was one of the main energy products imported and its share in the EU’s energy import exceeded 27%. Other products included petroleum-derivatives, including petroleum [76].
Russia is the EU’s main natural gas supplier. In 2021, the gas import volume from Russia to EU states amounted to 155 billion m3 [27]. This year, the EU imported 88.9% of gas consumed by it and approx. 45% of the imported gas was supplied by Russia. The share of Russian gas in the EU’s demand coverage usually amounts from several to several dozen percent, depending on the country; however, some EU states are 100% depend on Russian gas.
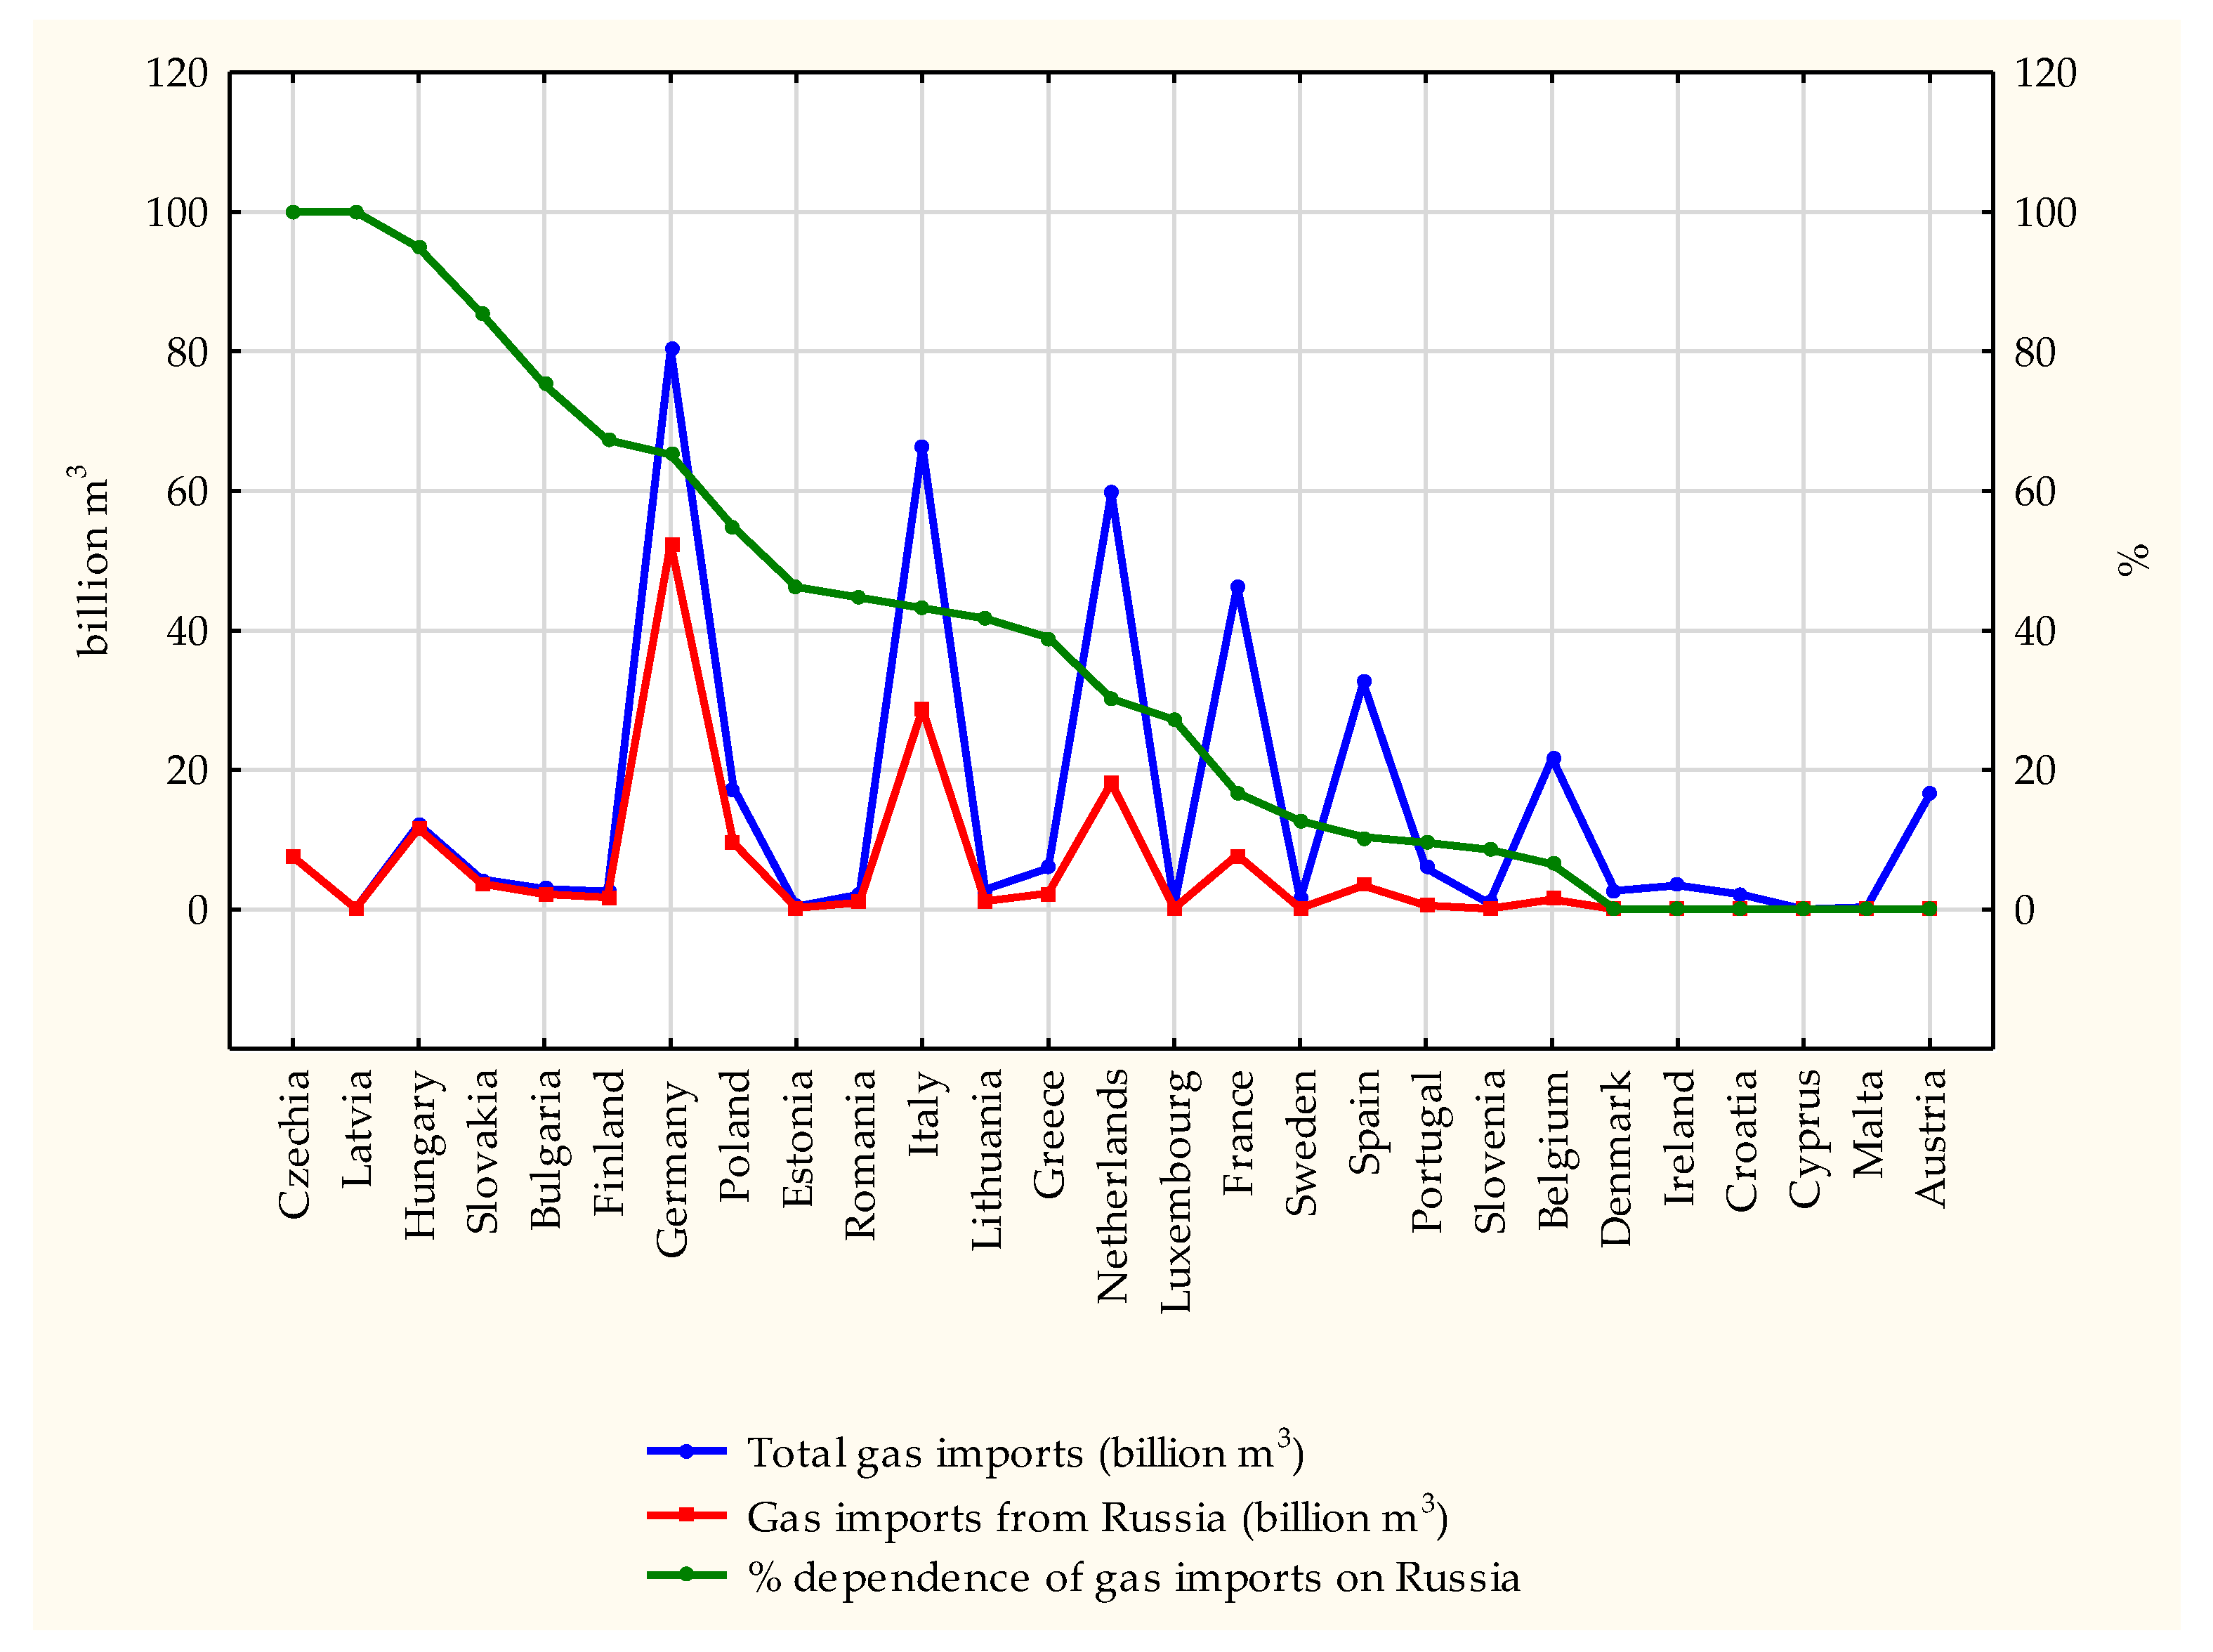
Similar conclusions regarding the natural gas import volume from Russia by EU states are derived from Eurostat’s data for 2020 (Figure 5) [27].
In some states, the share of Russian gas exceeded half of their entire import in 2020. Czechia and Latvia can be distinguished in this regard, as Russian gas constituted 100% of their entire gas import, Hungary 94.9%, Slovakia 85.4%, Bulgaria 75.2%, Finland 67.3%, Germany 65.2% and Poland 54.9% (9.5 billion m3).
Russian gas supplies were implemented based on multiannual contracts; therefore, the resource’s prices were relatively low and stable in longer periods, with benefit to the target states. Taking into consideration that EU’s gas consumption amounted to 396.6 billion m3 in 2021, the share of Russian gas in total consumption amounted to approx. 40%.
The European Union has been trying to become independent from Russian gas for several years, and Russia’s invasion of Ukraine has accelerated this process. In May 2022 the European Commission presented a plan for member states to become independent from Russia’s fossil fuels—REPowerEU, which is focused on energy savings, green energy production and energy supply diversification [77].
3.3. Prices of Natural Gas for Households in the EU
Many factors affect the prices of natural gas in Europe, and the current situation in the gas market was caused by both supply and demand factors.
In terms of demand, one of the factors is the increasing gas demand caused by the economic recovery following the pandemic-related stagnation. Gas demand increased mainly in residential heating, industry and power industry. Weather conditions also affect the demand. In the first quarter of 2021, a chilly winter caused an increased gas demand in the EU. On the other hand, heat contributed to greater use of air-conditioning in the second and third quarters of 2021.
Supply shortages started to occur along with the increased demand. Even before the war in Ukraine, Russia has substantially limited its natural gas supplies to Europe, thereby reducing gas reserves in all European states. The reserves became reduced even more when Russia was sanctioned and resulted in Gazprom ceasing its supply of gas to many EU countries. The need to replenish these reserves meant a higher natural gas import just months before the heating season, thereby resulting in even higher gas prices. Additionally, approx. one fifth of electricity is produced from natural gas in the EU, as gas provides stable energy as opposed to wind or solar power plants. In effect, higher wholesale gas prices exert disproportionately more pressure on electricity prices than price increases in gas for direct consumption.
Furthermore, in the past years (from 2005), natural gas prices in long-term gas supply contracts in the EU were strictly related to petroleum prices. Only about 20% of natural gas supplies have such relations currently, while other supplies are priced based on the current market prices, thereby making gas price fluctuations in Europe much greater.
The increase in natural gas prices forces some economies, in which the resource is one of the main components of energy production for the industry, to face serious issues related to production costs. However, households, which constitute gas recipients as both consumers of energy produced from gas fuel and final recipients of the resource intended for personal use (heating, cooking), are a special group. High resource prices not only translate into energy price increases, but also into severe household gas price increases. The price increase in these commodity groups is a substantial burden that contributes to a reduced living standard of retail consumers.
The first household natural gas price increases in Europe occurred in the second half of 2021, when the gas fuel price, averaged for the entire EU, increased by as much as 35% when compared to the same period year prior. Gas prices continue to increase from that time. However, the price increase is not equal in each EU state, because specific states were and are still purchasing natural gas in different volumes, from various sources and at different prices.
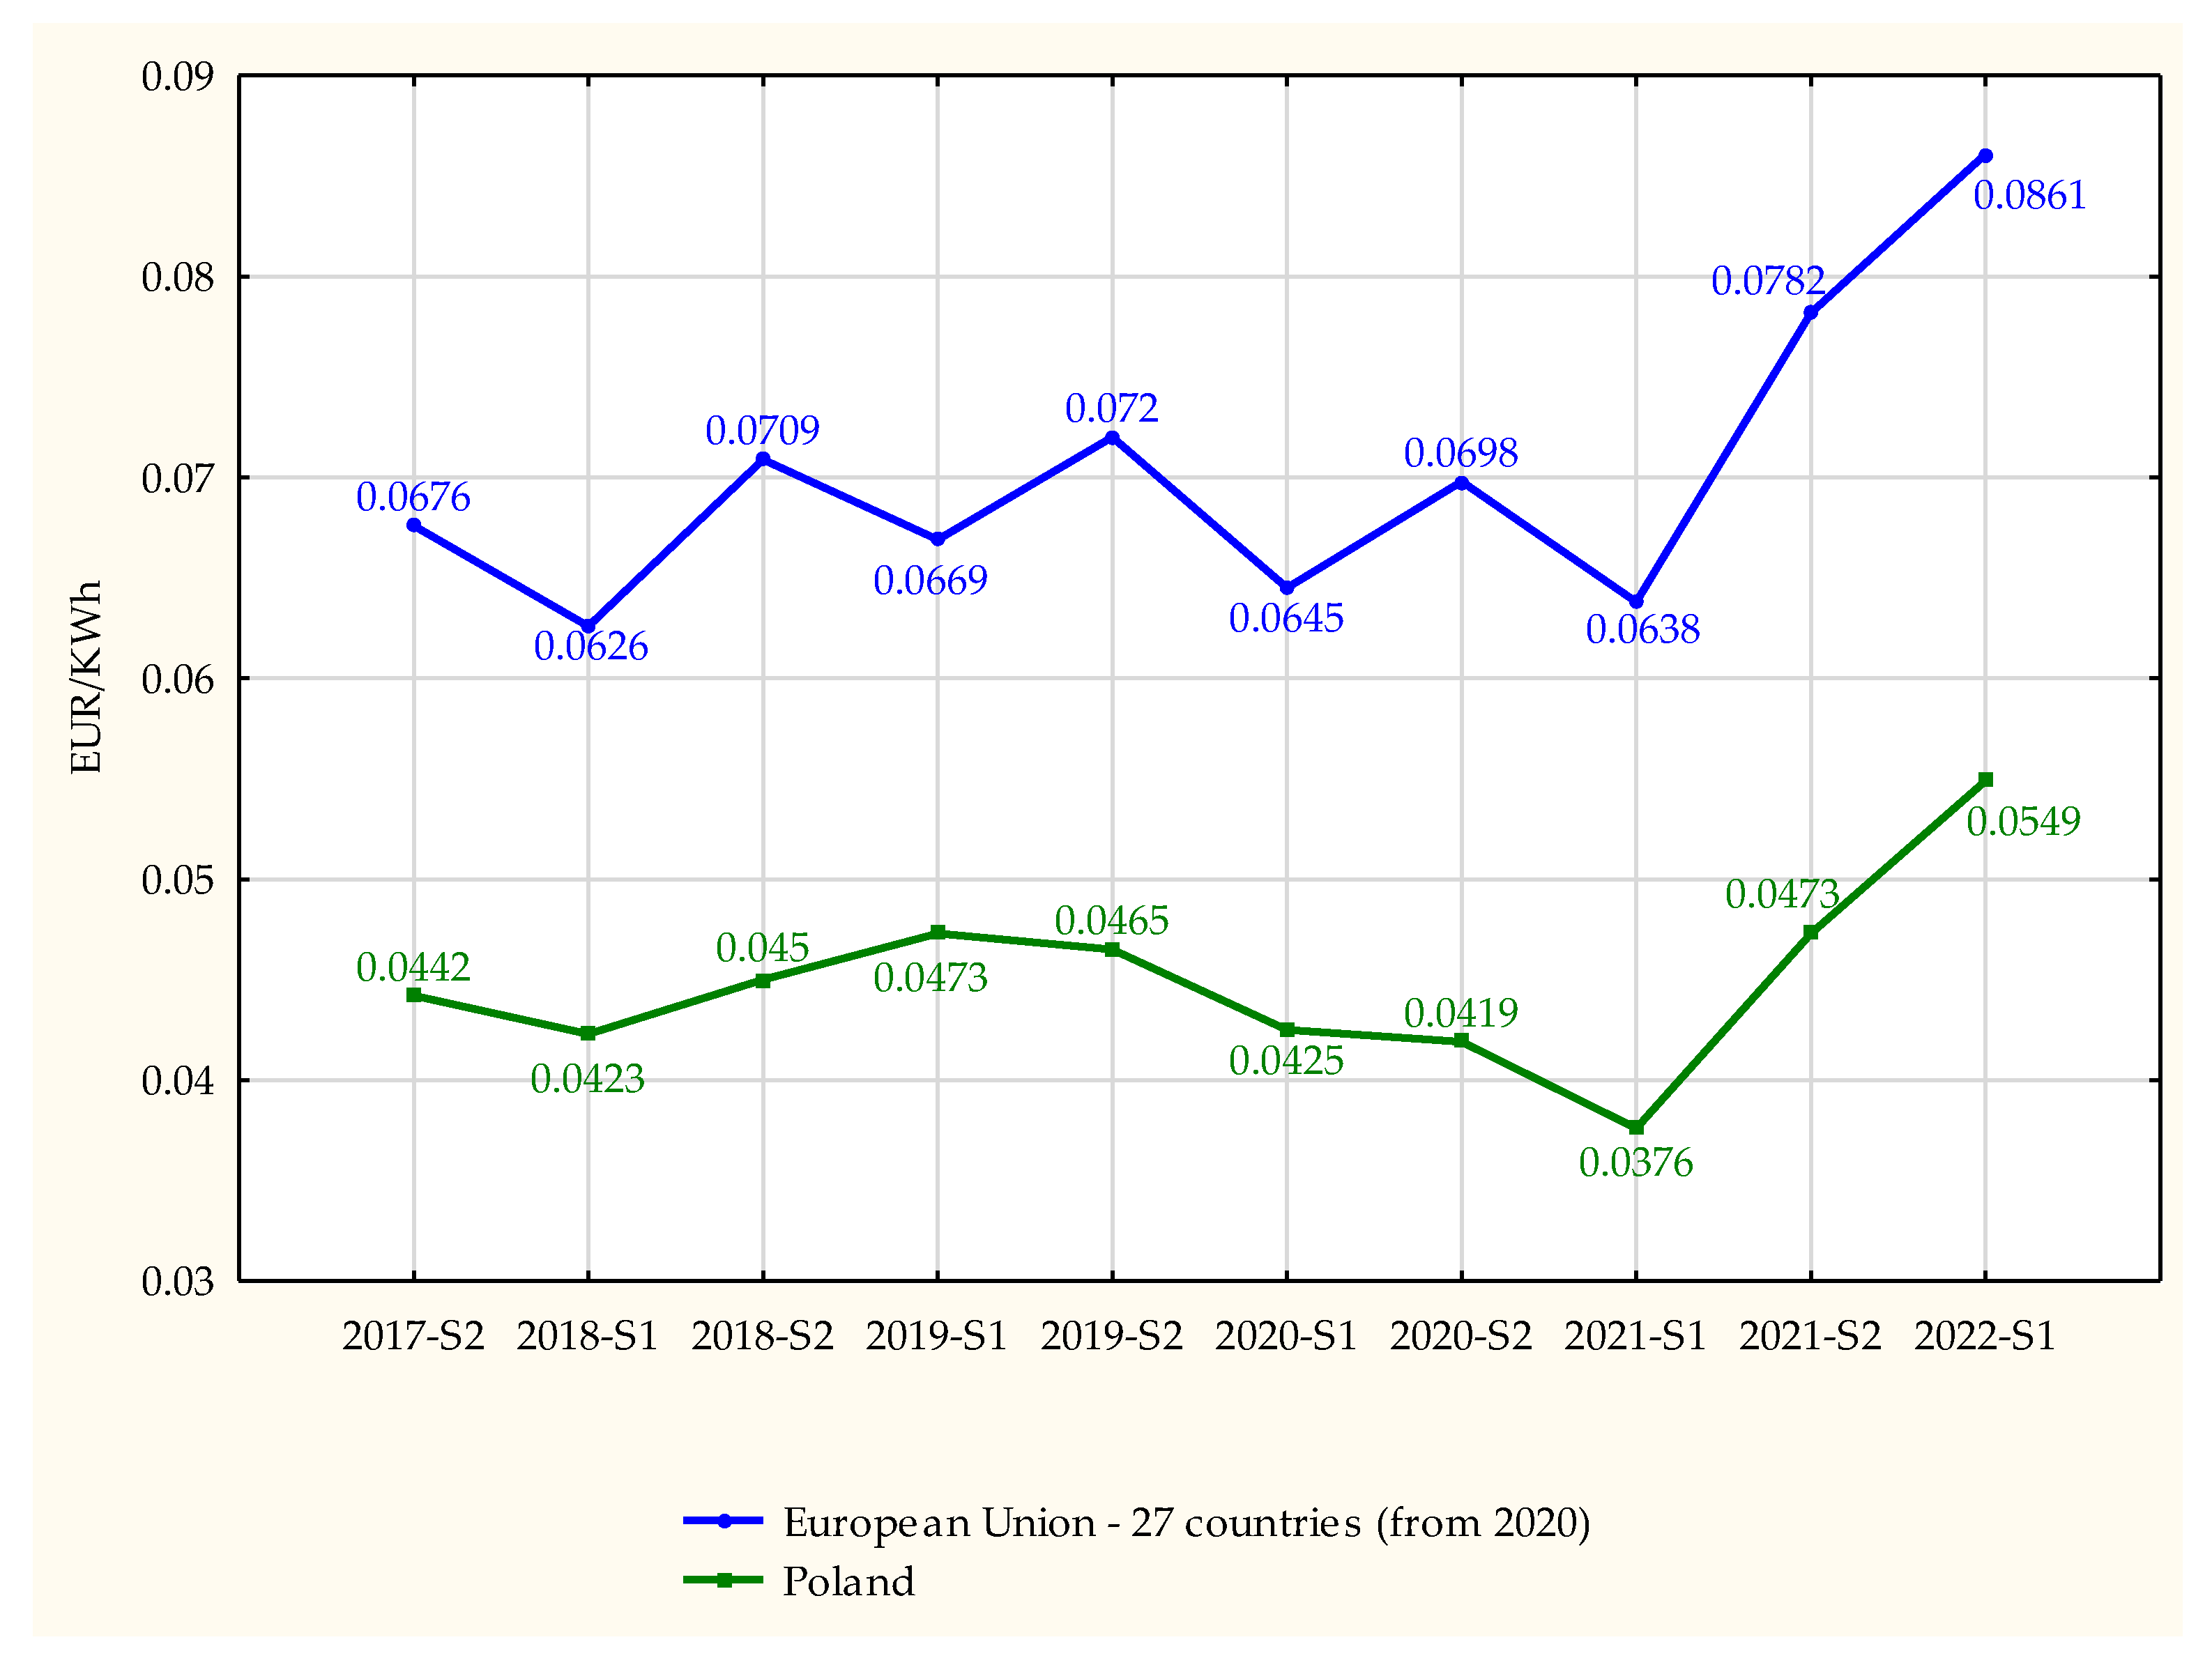
A good example here is Poland, which in the analysed period was purchasing natural gas from Russia at a lower price based on long-term contracts that satisfied over 50% of its demand. A substantial price increase occurred in the second quarter of 2021 and continues to this day (Figure 6) [28].
Comments:
- No data available before 2017-S2 and after 2022-S1;
- The analysed prices contain all taxes and fees;
- The prices from non-Eurozone countries are converted to EUR (Euros) based on the average annual exchange rate, meaning that exchange rate fluctuations can slightly affect the conversion results.
Eurostat information demonstrates that in the first quarter of 2022 the household gas price in the EU amounted to 0.0861 EUR/KWh on average. For comparison—in the same period of year prior the price was EUR 0.0638. This means an increase of over 34%. In the period between the first half of 2021 and the first half of 2022, gas prices increased in 23 out of 24 member states for which up-to-date information is available. However, the price increases were not the same in each country. The highest natural gas price increase (by more than 79%) was recorded in Sweden. Gas also became several times more expensive in Estonia, Lithuania, Bulgaria, and Belgium (by 154%, 110%, 108% and 101%, respectively). In the same period, household natural gas prices slightly decreased only in one member state, i.e., Hungary, which imposed price regulations. In Poland’s case, gas prices increased by 46% and the average household gas price is below the EU’s average price. In the first quarter of 2022 the natural gas price was only lower in Hungary, Croatia, Latvia, and Slovakia. The EU’s household natural gas prices in the analysed period are presented in Table 5 [28].
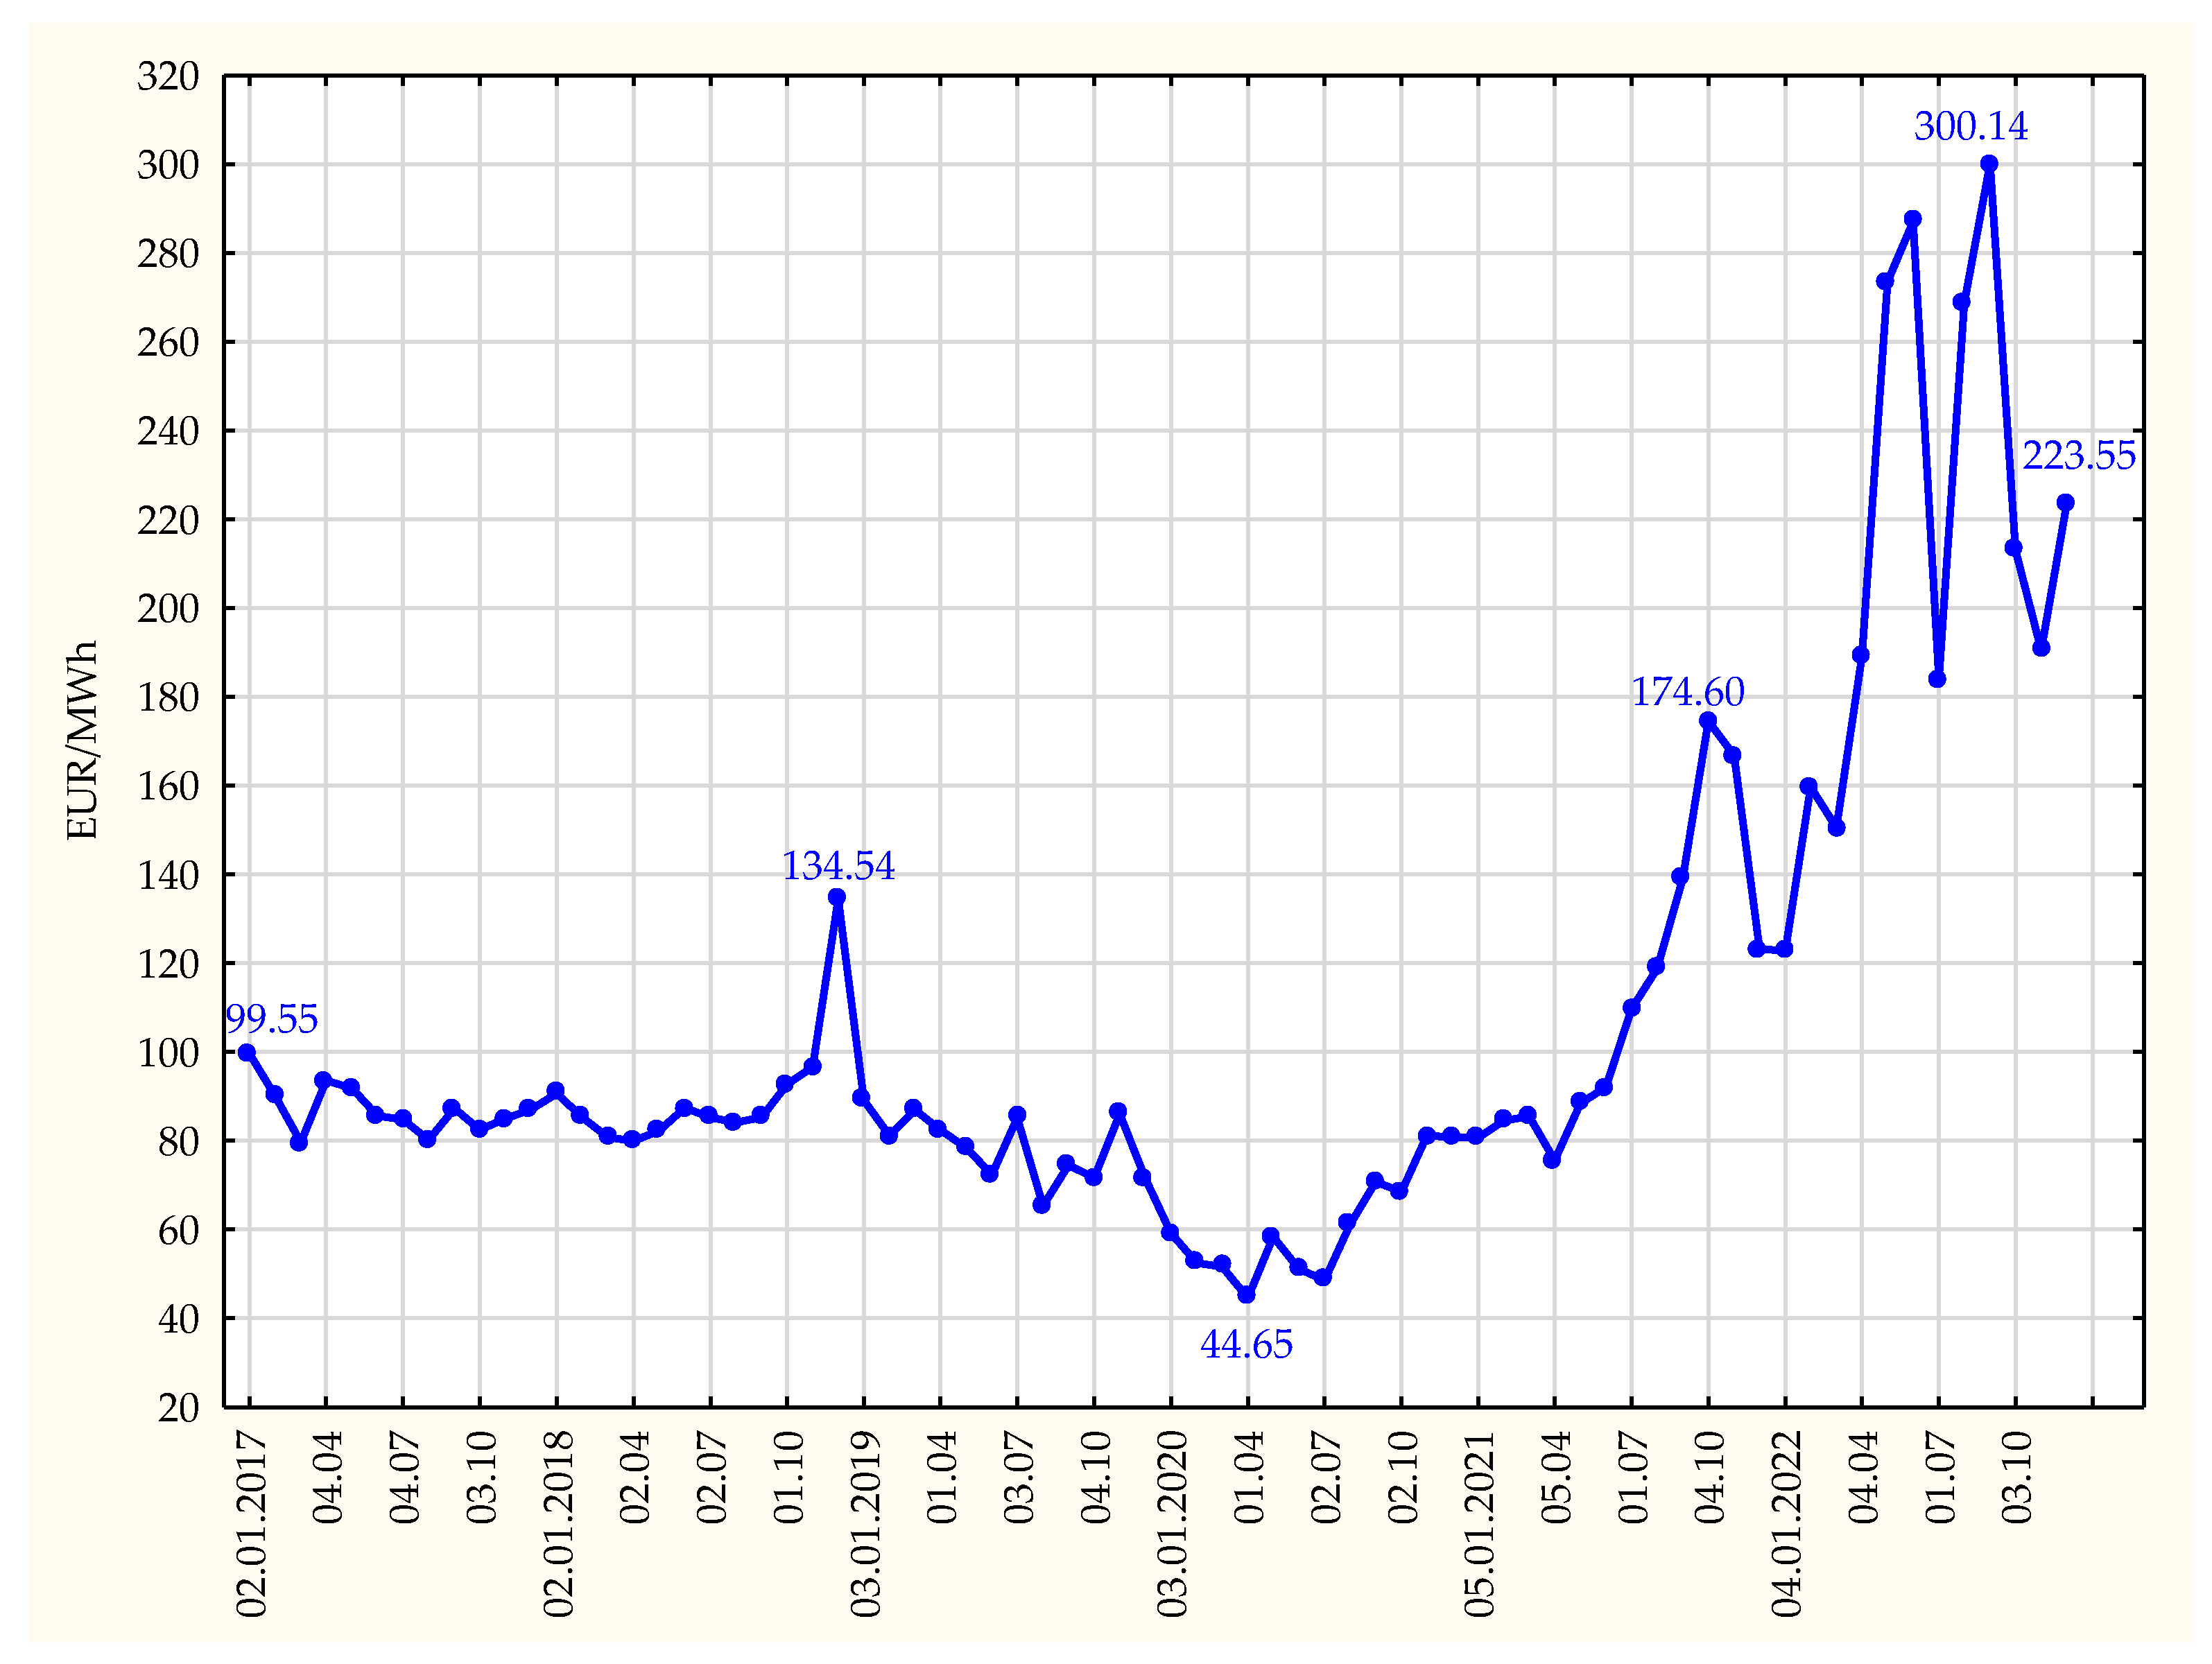
The EU’s main household natural gas price trends are set by resource exchanges on which contracts with the highest gas sales volumes are concluded. The aggregated data on European markets are presented in Figure 7. The presented gas price applies to spot transactions (implemented at the price as of the transaction date or the next working day), wherein these are averaged daily prices with consideration of the sales volume [78].
Exchange price quotations provide information on the main gas price trends in the EU; however, it is difficult to attempt to forecast the future resource prices based on it. The market gas price in Europe is mainly affected by the geopolitical situation, including the effects of Russia’s invasion of Ukraine in February 2022. The EU exchanges’ gas prices automatically increased due to the shortage of relatively cheaper Russian resource [81]. The prices will depend on the manner of functioning of international markets. From October 2022 BalticPipe enables the import of gas from Norway, while LNG terminals enable the import of the liquefied resource from various parts of the world (USA, Qatar). However, this gas is relatively expensive and its high price depends not only on fundamental market mechanisms, but also on the uncertainty regarding the market’s future form.
Russian gas was the cheapest source of gas for Poland and other European states. The lack of this component that started in 2021 forced EU countries to increase their resource purchases from other suppliers. This, in turn, resulted in a gas price increase in markets that previously imported Russian gas, including an increase in the Polish wholesale market.
4. Conclusions
In the time of an energy crisis, it was necessary to take up the topic that was not discussed in the proposed frame by the scientific doctrine following 2009. The paper fills a research gap in the disparity of prices of natural gas supplied to final individual recipients in the EU. This topic is not currently being explored in sufficient detail.
The paper has a cognitive nature and the deliberations contained in it can contribute to further scientific discussion on the topic and to further research encompassing literature studies and empirical research.
The conducted study allowed for a specification of household gas prices in Poland in the 2017–2022 period, with consideration of the situations on the Polish and EU markets. It included identification of the gas fuel price trends in PGNiG’s officially approved tariffs, which control most of the household gas fuel market in Poland (88.4–93.1%). It also featured an analysis of household natural gas prices in EU member states.
The first phase of the study included a subject literature analysis to enable systemic research reasoning. The literature review allowed for the conclusion that the current international and domestic doctrines do not feature papers, the objectives and subject of which would correspond to the topic of this article. Even though household natural gas prices constitute an important present-day issue in terms of the Polish gas fuel markets and households’ functioning, the domestic subject literature includes few studies that deal with this aspect. On the other hand, household natural gas prices are not a subject of studies in international literature. The identified research gap constituted the main premise for solving the research issue with main focus on studying natural gas prices for Polish households in two dimensions: domestic and EU-related. Filling this gap can be a prerequisite for further research in this subject.
When interpreting the results provided in this study it is necessary to remember that they were compiled using a model-based approach, which in principle does not consider all cause-and-effect relationships that occur in an economic environment and affect household natural gas prices in Poland and EU member states. When specifying the domestic context, the study mainly encompassed price increases and decreases caused by factors separated for research purposes.
In the analysed years, the tariff of natural gas prices for Polish households was affected by two factors: natural gas purchase prices in gas fuel sales markets managed by TGE, and purchase prices of gas from EU member states.
The results obtained from the conducted study allowed for the following conclusions:
- The household natural gas prices, established in the PGNiG’s officially approved tariffs, are substantially affected by two factors: resource purchase prices in foreign markets and purchase prices at the TGE, as result of which:
- -
- Slight increases in average annual purchase prices of natural gas imported from EU member states or other states and increases in the resource’s purchase prices at the TGE resulted in moderate increases in average annual household gas fuel prices in Poland in the 2017–2021 period;
- -
- Sudden increases in the resource’s purchase prices on global and domestic exchanges translated into an increase in the household gas fuel price in Poland starting from mid-2021.
- A similar effect occurred in other EU states; however, the increase in the household natural gas prices in the EU is not uniform across all countries as it depends on the volume of gas production and consumption in the given country and on the diversity of gas sources that determine the resource purchase price.
The main reason for price increases was the unforeseen substantial changes in the conditions of conducting business activity by PGNiG SA in terms of gas fuel trading, resulting from the increase in high-methane natural gas purchase price at the TGE. On the other hand, the increases in purchase price of natural gas imported from EU or EFTA member states by 2021 have moderately translated into increases in prices established in officially approved tariffs.
In a market economy, the retail prices of gas sold to final recipients mainly depend on the wholesale prices of resource sold on commodity exchanges. However, this simple dependency between the wholesale and retail prices, which allows distributors to specify the profit margin, is modified by administrative mechanisms. In Poland, the Energy Regulatory Office (URE) approves energy tariffs for final customers, including gas tariffs. This action partially abolishes free market rules and introduces regulated tariff prices, thereby allowing them to remain relatively low. Household gas prices in Poland are therefore regulated prices. The modification of gas fuel prices by using administrative mechanisms is especially evident in 2022. In the period from January to September 2022, the tariff gas prices (calculated without additional fees), were three to six times lower than prices calculated based on the market mechanism. This is a result of the introduction of the Act of 26 January 2022 on special solutions intended to protect gas fuel recipients in relation to the gas market situation [82]. According to this act, households were automatically covered by tariff protection that entitles them to purchase gas fuel at a price lower than the market price. The administrative mechanism causes a huge discrepancy in prices between the industry and households. The following years will probably feature a gradual withdrawal from regulated tariff prices for households and liberalisation of the gas market for individual recipients through abolition of the official approval of gas prices.
Author Contributions
Conceptualization, A.B., S.K. and U.R.; Formal analysis, A.B., S.K. and U.R.; Investigation, A.B. and U.R.; Methodology, S.K.; Project administration, S.K.; Resources, A.B. and U.R.; Writing—original draft, A.B., S.K. and U.R.; Writing—review and editing, A.B. All authors have read and agreed to the published version of the manuscript.
Funding
The research was funded by Opole University of Technology.
Data Availability Statement
Data available in public repositories at the addresses indicated in the body of the article.
Acknowledgments
The paper presents the personal opinions of the authors.
Conflicts of Interest
The authors declare no conflict of interest.
References
- Di Bella, G.; Flanagan, M.; Foda, K.; Maslova, S.; Pienkowski, A.; Stuermer, M.; Toscani, F. Natural Gas in Europe. The Potential Impact of Disruptions to Supply. IMF Work. Pap. 2022, 145, 1–28. [Google Scholar] [CrossRef]
- Baqaee, D.; Moll, B.; Landais, C.; Martin, P. The Economic Consequences of a Stop of Energy Imports from Russia. Cons. Anal. Econ. Focus 2022, 84, 1–14. Available online: https://www.cae-eco.fr/the-economic-consequences-of-a-stop-of-energy-imports-from-russia (accessed on 15 January 2023).
- Albrizio, S.; Bluedorn, J.C.; Koch Ch Pescatori, A.; Stuermer, M. Market Size and Supply Disruotions: Sharing the Pain of a Potential Russian Gas Shutoff to the European Union. IMF Work. Pap. 2022, 143, 1–39. [Google Scholar] [CrossRef]
- Nerlinger, M.; Utz, S. The Impact of the Russia-Ukraine Conflict on Energy Firms: A Capital Market Perspec-Tive. Financ. Res. Lett. 2022, 50, 103243. [Google Scholar] [CrossRef]
- EUROSTAT. An Official Website of the European Union. Available online: https://ec.europa.eu/eurostat/en/ (accessed on 10 November 2022).
- Gross Available Energy. Available online: https://ec.europa.eu/eurostat/statistics-explained/index.php?oldid=557337 (accessed on 9 September 2022).
- EUROSTAT. Database-Energy. Available online: https://ec.europa.eu/eurostat/web/energy/data/database (accessed on 10 November 2022).
- Rozporządzenie Parlamentu Europejskiego i Rady (WE) Nr 223/2009 z Dnia 11 Marca 2009 r. w Sprawie Statystyki Europejskiej, Dz. Urz. UE 2015/759 L 123/90. Available online: https://eur-lex.europa.eu/legal-content/PL/TXT/HTML/?uri=CELEX:32015R0759&from=LV (accessed on 10 November 2022).
- EUROSTAT. Energy Statistics—An Overview. Available online: https://ec.europa.eu/eurostat/statistics-explained/index.php?title=Energy_statistics_-_an_overview#Non-energy_consumptio (accessed on 10 November 2022).
- Li, G.; Bai, X.; Li, H.; Lu, Z.; Zhou, Y.; Wang, Y.; Cao, J.; Huang, Z. Nutrients removal and biomass production from anaerobic digested effluent by microalgae: A review. Int. J. Agric. Biol. Eng. 2019, 12, 8–13. Available online: https://ijabe.org/index.php/ijabe/article/view/3630/0 (accessed on 23 January 2022). [CrossRef]
- Anandarajah, G.; Gambhir, A. India’s CO2 emission pathways to 2050: What role can renewables play? Appl. Energy. 2014, 131, 79–86. [Google Scholar] [CrossRef]
- Li, G.; Hu, R.; Wang, N.; Yang, T.; Xu, F.; Li, J.; Wu, J.; Huang, Z.; Pan, M.; Lyu, T. Cultivation of microalgae in adjusted wastewater to enhance biofuel production and reduce environmental impact: Pyrolysis performances and life cycle assessment. J. Clean. Prod. 2022, 355, 131768. [Google Scholar] [CrossRef]
- Ji, F.; Liu, Y.; Hao, R.; Li, G.; Zhou, Y.; Dong, R. Biomass production and nutrients removal by a new microalgae strain Desmodesmus sp. in anaerobic digestion wastewater. Bioresour. Technol. 2014, 161, 200–207. [Google Scholar] [CrossRef]
- Queirós-Reis, L.; Gomes da Silva, P.; Gonçalves, J.; Brancale, A.; Bassetto, M.; Mesquita, J.R. SARS-CoV-2 Virus−Host Interaction: Currently Available Structures and Implications of Variant Emergence on Infectivity and Immune Response. Int. J. Mol. Sci. 2021, 22, 10836. [Google Scholar] [CrossRef]
- Huang, Z.; Zhang, J.; Pan, M.; Hao, Y.; Hu, R.; Xiao, W.; Li, G.; Lyu, T. Valorisation of microalgae residues after lipid extraction: Pyrolysis characteristics for biofuel production. Biochem. Eng. J. 2021, 179, 108330. [Google Scholar] [CrossRef]
- Tursi, A. A review on biomass: Importance, chemistry, classification, and conversion. Biofuel Res. J. 2019, 6, 962–979. [Google Scholar] [CrossRef]
- Portal Internetowy Rzeczpospolita, Gaz Jeszcze Przez Wiele Lat Będzie Odgrywał Istotną Rolę w Gospodarce. Available online: https://www.rp.pl/perspektywy-dla-polski/art8548341-gaz-jeszcze-przez-wiele-lat-bedzie-odgrywal-istotna-role-w-gospodarce (accessed on 13 January 2023).
- Popp, J.; Kovács, S.; Oláh, J.; Divéki, Z.; Balázs, E. Bioeconomy: Biomass and Biomass-Based Energy Supply and Demand. N. Biotechnol. 2021, 60, 76–84. [Google Scholar] [CrossRef]
- Li, G.; Lu, Z.; Zhang, J.; Li, H.; Zhou, Y.; Zayan, A.M.I.; Huang, Z. Life Cycle Assessment of Biofuel Production from Microalgae Cultivated in Anaerobic Digested Wastewater. Int. J. Agric. Biol. Eng. 2022, 13, 241–246. [Google Scholar] [CrossRef]
- Centrum Informacji o Rynku Energii, Gaz Ziemny i Odnawialne Źródła Energii Idealnym Połączeniem? Available online: https://www.cire.pl/artykuly/serwis-informacyjny-cire-24/79593-gaz-ziemny-i-odnawialne-zrodla-energii-idealnym-polaczeniem (accessed on 23 September 2022).
- EUROSTAT. Imports of Natural Gas. Available online: https://ec.europa.eu/eurostat/cache/infographs/energy_trade/entrade.html?geo=PL&year=2017&language=EN&trade=imp&siec=G3000&filter=all&fuel=gas&unit=TJ_GCV&defaultUnit=TJ_GCV&detail=1&chart=pie#0 (accessed on 10 November 2022).
- Taryfy PGNiG Obrót Detaliczny Sp. z o. o. w Zakresie Obrotu Paliwami Gazowymi. Available online: https://pgnig.pl/archiwum-taryf (accessed on 10 November 2022).
- Sprawozdanie Prezesa Urzędu Regulacji Energetyki Za 2021 R. Available online: https://www.ure.gov.pl/pl/urzad/informacje-ogolne/edukacja-i-komunikacja/publikacje/sprawozdania-z-dzialaln/2916,Sprawozdania-z-dzialalnosci-Prezesa-URE.html (accessed on 5 October 2022).
- Średnie Kwartalne Ceny Zakupu Gazu Ziemnego Sprowadzanego z Państw Członkowskich UE Lub z Państw Członkowskich Europejskiego Porozumienia o Wolnym Handlu (EFTA)—Stron Umowy o Europejskim Obszarze Gospodarczym. Available online: https://www.ure.gov.pl/pl/paliwa-gazowe/ceny-wskazniki/7859,Srednie-kwartalne-ceny-zakupu-gazu-ziemnego-sprowadzanego-z-panstw-czlonkowskich.html (accessed on 10 November 2022).
- Raporty Roczne Towarowej Giełdy Energii 2017–2021. Available online: https://tge.pl/Publikacje (accessed on 10 November 2022).
- Informacja Ze Strony Urzędu Regulacji Energetyki, Podsumowanie Działalności TGE w 2021 Roku. Available online: https://www.tge.pl/pub/TGE/komunikaty/2022/2022.01.05_podsumowanie dzialalnosci tge w 2021 roku.pdf (accessed on 10 November 2022).
- EUROSTAT: Imports of Natural Gas by Partner Country. Available online: https://ec.europa.eu/eurostat/databrowser/view/NRG_TI_GAS__custom_2405727/default/map?lang=en (accessed on 10 November 2022).
- EUROSTAT. Gas Prices for Household Consumers—Bi-Annual Data (from 2007 Onwards). Available online: https://ec.europa.eu/eurostat/databrowser/view/nrg_pc_202/default/table?lang=en (accessed on 10 November 2022).
- Narodowy Bank Polski. Kursy Walut. Available online: https://www.nbp.pl/home.aspx?f=/kursy/arch_a.html (accessed on 10 November 2022).
- Mills, A.; Wiser, R.; Millstein, D.; Carvallo, J.P.; Gorman, W.; Seel, J.; Jeong, S. The Impact of Wind, Solar, and Other Factors on the Decline in Wholesale Power Prices in the United States. Appl. Energy 2021, 283, 116266. [Google Scholar] [CrossRef]
- Scarcioffolo, A.R.; Etienne, X. Testing Directional Predictability between Energy Prices: A Quantile-Based Analysis. Resour. Policy 2021, 74, 102258. [Google Scholar] [CrossRef]
- Xia, T.; Ji, Q.; Geng, J.-B. Nonlinear dependence and information spillover between electricity and fuel source markets: New evidence from a multi-scale analysis. Phys. A Stat. Mech. Its Appl. 2019, 537, 122298. [Google Scholar] [CrossRef]
- Amirnekooei, K.; Ardehali, M.; Sadri, A. Optimal energy pricing for integrated natural gas and electric power network with considerations for techno-economic constraints. Energy 2017, 123, 693–709. [Google Scholar] [CrossRef]
- Filippini, M.; Kumar, N. Gas Demand in the Swiss Household Sector. Appl. Econ. Lett. 2021, 28, 359–364. [Google Scholar] [CrossRef]
- Radev, J.; Boiadjiev, M. Demand of Natural Gas by the Households. Available online: https://media.neliti.com/media/publications/550070-none-0f146cb9.pdf (accessed on 13 September 2022).
- Ruhnau, O.; Stiewe, C.; Muessel, J.; Hirth, L. Gas Demand in Times of Crisis. The Response of German Households and Industry to the 2021/22 Energy Crisis, ZBW—Leibniz Information Centre for Economics; Hamburg, 2022. Available online: https://www.econstor.eu/bitstream/10419/261082/3/Ruhnau%20et%20al.%202022.%20Gas%20demand%20in%20times%20of%20crisis.%20Econstor.pdf (accessed on 15 January 2023).
- Pellini, E. Estimating Income and Price Elasticities of Residential Electricity Demand with Autometrics. Energy Econ. 2021, 101, 10541. [Google Scholar] [CrossRef]
- Gao, J.; Peng, B.; Smyth, R. On Income and Price Elasticities for Energy Demand: A Panel Data Study. SSRN Electron. J. 2021, 96, 105168. [Google Scholar] [CrossRef]
- Erias, A.; Iglesias, E. The Daily Price and Income Elasticity of Natural Gas Demand in Europe. Energy Rep. 2021, 44, 14595–14605. [Google Scholar] [CrossRef]
- Labandeira, X.; Labeaga, J.M.; López-Otero, X. A meta-analysis on the price elasticity of energy demand. Energy Policy 2017, 102, 549–568. [Google Scholar] [CrossRef]
- Gomółka, K.; Kasprzak, P. Household Ability of Expenditures on Electricity and Energy Resources in the Countries That Joined the EU after 2004. Energies 2022, 15, 3052. [Google Scholar] [CrossRef]
- Trzaskuś, Ż.B.; Czopek, K. Analiza Zmian Taryfowych i Przychodu Ze Sprzedaży Gazu w Wybranych Spółkach Gazowniczych. Nafta-Gaz 2006, 3, 120–130. [Google Scholar]
- Kaliski, M.; Trzaskuś-Żak, B. Kształtowanie Cen Gazu Ziemnego w Polsce w 2007 Roku. Świat Nieruchom. 2007, 61, 19–25. Available online: https://www.swiatnieruchomosci.krakow.pl/components/com_jshopping/files/demo_products/61_03.pdf (accessed on 13 September 2022).
- Trzaskuś-Żak, B. Kształtowanie Się Cen Gazu w Grupach Taryfowych Od W-1 Do W-4 w Sześciu Spółkach Dystrybucyjnych Na Polskim Rynku Paliw Gazowych. Nafta-Gaz 2007, 3, 194–203. [Google Scholar]
- Trzaskuś-Żak, B.; Staśko, D. Ceny Gazu Dla Odbiorcy Końcowego. Profesjonalne Gazow. 2009, 43–44. Available online: http://www.aknet.biz.pl/pg/07_09_pl.pdf (accessed on 13 September 2022).
- Trzaskuś-Żak, B. Ocena Wpływu Wewnętrznej Struktury Taryf Na Końcową Cenę Gazu Ziemnego. Polityka Energ. 2009, 2, 619–632. Available online: http://yadda.icm.edu.pl/baztech/element/bwmeta1.element.baztech-article-BPB9-0003-0042 (accessed on 13 September 2022).
- Piekut, M.; Piekut, K. Źródła Energii w Gospodarstwach Domowych z Polski i Ukrainy Na Tle Innych Krajów Europejskich. In Selected Issues of Socio-Economic Development in Poland and Ukraine; Piekut, M., Smentyna, N., Eds.; Politechnika Warszawska: Płock, Poland, 2020; pp. 61–82. [Google Scholar]
- Cieślik, T.; Janusz, P.; Kogut, K.; Szutlej, A.; Zyśk, J. Wpływ Realizacji Założeń Ujętych w Programach Ochrony Powietrza Na Zużycie Gazu Ziemnego Przez Gospodarstwa Domowe. Rynek Energii 2018, 6, 42–46. Available online: https://www.cire.pl/pliki/2/2019/wwcn.pdf (accessed on 13 September 2022).
- Cieślik, T.; Górowska, K.; Metelska, K.; Szurej, A. Zużycie Gazu Ziemnego w Podziale Na Województwa. Nierówności Społeczne A Wzrost Gospod. 2018, 54, 190–205. Available online: http://cejsh.icm.edu.pl/cejsh/element/bwmeta1.element.desklight-91453d6c-86c4-40a4-8d9a-c2463e3421ab (accessed on 13 September 2022). [CrossRef]
- Tarnawski, M. Wpływ Kształtowania Się Cen Na Wybranych Rynkach Gazu Ziemnego Na Bezpieczeństwo Energetyczne. Bezpieczeństwo. Teor. I Prakt. 2016, 1, 31–45. Available online: http://cejsh.icm.edu.pl/cejsh/element/bwmeta1.element.desklight-bb1cd561-65f5-455c-970c-4cb98f0f2727 (accessed on 13 September 2022).
- Pikus, P.; Korda-Burza, A.; Szurlej, A. Transformacja Krajowego Rynku Gazu Ziemnego—Aspekty Strukturalne i Regulacyjne. Rynek Energii 2020, 4, 3–9. Available online: https://www.cire.pl/pliki/2/2020/tkrg.pdf (accessed on 13 September 2022).
- Pepłowska, M.; Gawlik, L. Gaz Ziemny w Zrównoważonym Rozwoju Krajowej Gospodarki. Zesz. Nauk. Inst. Gospod. Surowcami Miner. I Energią PAN 2017, 98, 39–50. Available online: http://yadda.icm.edu.pl/baztech/element/bwmeta1.element.baztech-e2d242d5-1f0e-40cf-bf5c-51d86e9adf30 (accessed on 13 September 2022).
- Kaliski, M.; Staśko, D.; Trzaskuś-Żak, B. Uregulowania Prawne i Organizacyjne Dotyczące Zasady TPA (Third Part Access) w Sektorze Gazowniczym Na Przykładzie Polski i Wielkiej Brytanii. Wiert. Naft. Gaz 2006, 23, 667–679. Available online: http://yadda.icm.edu.pl/baztech/element/bwmeta1.element.baztech-article-AGH5-0013-0050 (accessed on 13 September 2022).
- Niewiński, G.; Badyda, K.; Kopałka, J. Funkcjonowanie Polskiego Rynku Gazu Na Tle Europy. Nierówności Społeczne a Wzrost Gospod. 2017, 50, 209–231. Available online: http://cejsh.icm.edu.pl/cejsh/element/bwmeta1.element.desklight-65f0e0ef-15e8-400c-8a3b-be3919b7df6c (accessed on 13 September 2022). [CrossRef]
- Okulski, T.; Szurlej, A.; Janusz, P. Realizacja Polityki Energetycznej w Obszarze Gazu Ziemnego. Polityka Energ. 2015, 2, 5–17. Available online: http://yadda.icm.edu.pl/baztech/element/bwmeta1.element.baztech-6ebe6e36-5e77-4487-907e-835ae07a8886 (accessed on 13 September 2022).
- Ustawa z Dnia 10 Kwietnia 1997 r. Prawo Energetyczne, Dz. U. 2022, Poz. 1385. Available online: https://www.ure.gov.pl/pl/urzad/prawo/ustawy/17,Ustawa-z-dnia-10-kwietnia-1997-r-Prawo-energetyczne.html (accessed on 5 October 2022).
- Rozporządzenie Ministra Energii z Dnia 15 Marca 2018 r. w Sprawie Szczegółowych Zasad Kształtowania i Kalkulacji Taryf Oraz Rozliczeń w Obrocie Paliwami Gazowymi, Dz. U. z 2018 r. Poz. 640. Available online: https://isap.sejm.gov.pl/isap.nsf/DocDetails.xsp?id=WDU20180000640 (accessed on 5 October 2022).
- Dyrektywa Parlamentu Europejskiego i Rady 2009/73/WE z Dnia 13 Lipca 2009 r. Dotycząca Wspólnych Zasad Rynku Wewnętrznego Gazu Ziemnego i Uchylająca Dyrektywę 2003/55/WE Dz. U. L 211 z 14. 8.2009, 94. Available online: https://eur-lex.europa.eu/legal-content/PL/ALL/?uri=CELEX:32009L0073 (accessed on 5 October 2022).
- Hancher, L.; Marhold, A. Common EU Framework Regulating Import Pipelines for Gas? Exploring the Commission’s Proposal to Amend the 2009 Gas Directive. J. Energy Nat. Resour. Law 2019, 37, 289–303. [Google Scholar] [CrossRef]
- Koturbash, T.; Brokarev, I. Estimation of the Energy Content of Propanated Biomethane Using Ultrasonic Measurements. J. Nat. Gas. Sci. Eng. 2021, 86, 103735. [Google Scholar] [CrossRef]
- Goldthau, A.; Sitter, N. Power, Authority and Security: The EU’s Russian Gasdilemma. J. Eur. Integr. 2020, 42, 111–121. [Google Scholar] [CrossRef]
- Kanapinskas, V.; Urmonas, A. Changes of Legal Regulation on Natural Gas Market in the Context of the Third European Union Package. Jurisprudencija 2021, 18, 233–249. [Google Scholar]
- Vashchenko, Y. National Regulatory Authorities in the Energy Sector of Ukraine: Problems of the Legal Status in the Context of the European Integration and the Administrative Reform. Available online: https://www.academia.edu/77290109/National_regulatory_authorities_in_the_energy_sector_of_Ukraine_problems_of_the_legal_status_in_the_context_of_the_European_integration_and_the_administrative_reform (accessed on 7 October 2022).
- Informacja Ze Strony Internetowej PGNiG Pt. Rachunek Za Gaz—Od Czego Zależy i Co Się Na Niego Składa? Available online: https://pgnig.pl/rachunek-za-gaz (accessed on 15 October 2022).
- Decyzja Prezesa Urzędu Regulacji Energetyki Nr DRG.DRG-2.4212.8.2017.IRŚ z Dnia 17 Marca 2017 R. Available online: https://bip.ure.gov.pl/bip/taryfy-i-inne-decyzje-b/paliwa-gazowe/3506,Taryfy-opublikowane-w-2017-r.html (accessed on 15 October 2022).
- Decyzja Prezesa Urzędu Regulacji Energetyki Nr DRG.DRG-2.4212.1.2018.KGa z Dnia 14 Marca 2018 R. Available online: https://bip.ure.gov.pl/bip/taryfy-i-inne-decyzje-b/paliwa-gazowe/3638,Taryfy-opublikowane-w-2018-r.html (accessed on 15 October 2022).
- Decyzja Prezesa Urzędu Regulacji Energetyki Nr DRG.DRG-2.4212.30.2018.KGa z Dnia 25 Lipca 2018 R. Available online: https://bip.ure.gov.pl/bip/taryfy-i-inne-decyzje-b/paliwa-gazowe/3638,Taryfy-opublikowane-w-2018-r.html (accessed on 15 October 2022).
- Decyzja Prezesa Urzędu Regulacji Energetyki Nr DRE.WRE.4211.66.18.2018.2019.JCz z Dnia 25 Stycznia 2019 R. Available online: https://bip.ure.gov.pl/bip/taryfy-i-inne-decyzje-b/energia-elektryczna/3780,Taryfy-opublikowane-w-2019-r.html (accessed on 15 October 2022).
- Decyzja Prezesa Urzędu Regulacji Energetyki Nr DRG.DRG-2.4212.31.2020.Ask2 z Dnia 16 Czerwca 2020 RNo Title. Available online: https://bip.ure.gov.pl/bip/taryfy-i-inne-decyzje-b/paliwa-gazowe/3908,Taryfy-opublikowane-w-2020-r.html (accessed on 15 October 2022).
- Decyzja Prezesa Urzędu Regulacji Energetyki Nr DRG.DRG-2.4212.31.2020.Ask2 z Dnia 17 Grudnia 2020 r.No Title. Available online: https://bip.ure.gov.pl/bip/taryfy-i-inne-decyzje-b/paliwa-gazowe/3908,Taryfy-opublikowane-w-2020-r.html (accessed on 15 October 2022).
- Decyzja Prezesa Urzędu Regulacji Energetyki Nr DRG.DRG-2.4212.31.2021.AIK z Dnia 16 Lipca 2021 r.o Title. Available online: https://bip.ure.gov.pl/bip/taryfy-i-inne-decyzje-b/paliwa-gazowe/4007,Taryfy-opublikowane-w-2021-r.html (accessed on 15 October 2022).
- Decyzja Prezesa Urzędu Regulacji Energetyki Nr DRG.DRG-2.4212.43.2021.KGa z Dnia 16 Września 2021 R. Available online: https://bip.ure.gov.pl/bip/taryfy-i-inne-decyzje-b/paliwa-gazowe/4007,Taryfy-opublikowane-w-2021-r.html (accessed on 15 October 2022).
- Wzrost Cen Energii Od 2021 r.- Infografika. Available online: https://www.consilium.europa.eu/pl/infographics/energy-prices-2021/ (accessed on 15 October 2022).
- Informacje Ze Strony Internetowej TGE Dotyczące Rynku Dnia Następnego i Bieżącego Gazu. Available online: https://tge.pl/gaz-rdb (accessed on 15 October 2022).
- Regulamin Obrotu Rynku Towarów Giełdowych Towarowej Giełdy Energii S.A. Available online: https://tge.pl/pub/TGE/files/RTG/ogolne/23102019_Regulamin_RTG_MNA.pdf (accessed on 20 October 2022).
- Bp Statistical Review of World Energy 2022 | 71st Edition. Available online: https://www.bp.com/content/dam/bp/business-sites/en/global/corporate/pdfs/energy-economics/statistical-review/bp-stats-review-2022-full-report.pdf (accessed on 15 November 2022).
- REPowerEU: Przystępna Cenowo, Bezpieczna i Zrównoważona Energia Dla Europy. Available online: https://ec.europa.eu/info/strategy/priorities-2019-2024/european-green-deal/repowereu-affordable-secure-and-sustainable-energy-europe_pl#:~:text=REPowerEU to plan Komisji Europejskiej polegający na uniezależnieniu,rosyjskego gazu i ropy naftowej%2C aby we (accessed on 15 November 2022).
- Notowania Surowców. Available online: https://businessinsider.com.pl/gielda/surowce/profil?id=gaz_ziemny (accessed on 2 December 2022).
- Przelicznik Jednostek. Available online: https://www.jednostek-miary.info/przelicznik-jednostek.php?typ=energie (accessed on 2 October 2022).
- Google Finance. Available online: https://www.google.com/finance/ (accessed on 2 October 2022).
- Gawin, R. Prezes Urzędu Regulacji Energetyki o 25 Latach Funkcjonowania Rynku Energetycznego: “Hasłem Przewodnim Jest Klimat a Nie Energetyka”. Available online: https://gloswielkopolski.pl/rafal-gawin-prezes-ure-o-25-latach-funkcjonowania-rynku-energetycznego-haslem-przewodnim-jest-klimat-a-nie-energetyka/ar/c3-16299251 (accessed on 20 November 2022).
- Ustawa z Dnia 26 Stycznia 2022 r. o Szczególnych Rozwiązaniach Służących Ochronie Odbiorców Paliw Gazowych w Związku z Sytuacją Na Rynku Gazu, Dz. U. 2022, Poz. 202. Available online: https://isap.sejm.gov.pl/isap.nsf/DocDetails.xsp?id=WDU20220000202 (accessed on 2 December 2022).
Figure 1.
Gross available Energy, EU, in selected years 2017–2020 percentage [9]. Comments: No data available for 2021–2022.
Figure 1.
Gross available Energy, EU, in selected years 2017–2020 percentage [9]. Comments: No data available for 2021–2022.

Figure 2.
Relation between the average annual purchase prices of natural gas imported from EU member states and other states and the average annual gas fuel prices established in PGNiG’s officially approved tariffs, 2017–2022. Comments: No data available after II Q 2022.
Figure 2.
Relation between the average annual purchase prices of natural gas imported from EU member states and other states and the average annual gas fuel prices established in PGNiG’s officially approved tariffs, 2017–2022. Comments: No data available after II Q 2022.

Figure 3.
Relation between the average annual purchase prices of natural gas on the TGE markets (RDNiBg and RTTg) and the average annual gas fuel prices established in PGNiG’s officially approved tariffs, 2017–2022.
Figure 3.
Relation between the average annual purchase prices of natural gas on the TGE markets (RDNiBg and RTTg) and the average annual gas fuel prices established in PGNiG’s officially approved tariffs, 2017–2022.

Figure 5.
Total natural gas import and Russian natural gas import by EU states, 2020 (billion m3). Comments: 1 billion m3 = 109 m3.
Figure 5.
Total natural gas import and Russian natural gas import by EU states, 2020 (billion m3). Comments: 1 billion m3 = 109 m3.

Figure 6.
Prices of natural gas for households in the EU and in Poland, 2017–2022 (EUR/KWh).

Figure 7.
Gas price, EU exchange, 2017–2022 (EUR/MWh). Comments: The exchange price USD per 1 million BTU was converted to EUR per MWh, where 1 MWh (megawatt hour) = 3.412142 × 10⁶ BTU (British Thermal Unit) [79,80].

Table 1.
Gross available energy, EU, in selected years 2017–2020, Petajoule (PJ) [9].
Table 1.
Gross available energy, EU, in selected years 2017–2020, Petajoule (PJ) [9].
| Energy Fuel | 2017 | 2018 | 2019 | 2020 |
|---|---|---|---|---|
| Solid fossil fuels | 9159.52 | 8808.51 | 7197.36 | 5875.64 |
| Natural gas | 13,854.78 | 13,602.80 | 14,034.11 | 13,696.18 |
| Oil and petroleum products | 23,113.57 | 22,906.53 | 22,822.66 | 19,918.61 |
| Renewables and biofuels | 9005.41 | 9410.25 | 9713.89 | 10,046.86 |
| Nuclear Heat | 8160.03 | 8174.63 | 8213.70 | 7334.23 |
| All other fuels | 880.08 | 925.66 | 864.67 | 871.80 |
| Sum | 64,173.39 | 63,828.38 | 62,846.39 | 57,743.32 |
Comments: 1 Petajoule (PJ) = 2.777778 × 10⁵ MWh, No data available for 2021–2022.
Table 2.
The average annual price of gas for Polish households according to PGNiG’s officially approved tariffs, 2017–2022.
Table 2.
The average annual price of gas for Polish households according to PGNiG’s officially approved tariffs, 2017–2022.
| Year | Duration | The Prices of Gas Fuel for Households (PLN/KWh) | The Average Annual Prices of Gas Fuel for Households (PLN/KWh) | The Average Annual Prices of Gas Fuel for Households (EUR/KWh) |
|---|---|---|---|---|
| 2017 | January–March | 0.09240 | 0.09316 | 0.022 |
| April–December | 0.09392 | |||
| 2018 | January–March | 0.09392 | 0.09641 | 0.023 |
| April–July | 0.09486 | |||
| August–December | 0.10046 | |||
| 2019 | January–December | 0.10296 | 0.10296 | 0.024 |
| 2020 | January–May | 0.10002 | 0.09473 | 0.021 |
| June–December | 0.08944 | |||
| 2021 | January–April | 0.08543 | 0.09652 | 0.021 |
| May–July | 0.09024 | |||
| August–September | 0.10146 | |||
| October–December | 0.10895 | |||
| 2022 | January–December | 0.20017 | 0.20017 | 0.043 |
Comments: No data available after II Q 2022. Own elaboration based on analysis annual TGE Reports for 2017–2021 made available on TGE’s website [22].
Table 3.
The average annual purchase prices of natural gas imported from EU member states and other states.
Table 3.
The average annual purchase prices of natural gas imported from EU member states and other states.
| Year | The Average Purchase Prices of Natural Gas Imported from EU Member States and Other States by Quarter | The Average Annual Purchase Prices of Natural Gas Imported from EU Member States and Other States | ||||
|---|---|---|---|---|---|---|
| PLN/MWh | PLN/MWh | EUR/KWh | ||||
| Q1 | Q2 | Q3 | Q4 | |||
| 2017 | 83.00 | 68.74 | 68.47 | 73.89 | 73.525 | 0.017 |
| 2018 | 84.72 | 90.61 | 96.71 | 104.13 | 94.043 | 0.022 |
| 2019 | 96.11 | 66.18 | 58.54 | 65.08 | 71.478 | 0.017 |
| 2020 | 54.82 | 30.89 | 34.88 | 67.74 | 47.083 | 0.011 |
| 2021 | 85.72 | 102.4 | 211.24 | 371.49 | 186.537 | 0.042 |
| 2022 | 439.26 | 442.15 | 886.88 | - | 589.430 | 0.095 |
Comments: Own elaboration based on information posted on the official website of the URE concerning data on average purchase prices of natural gas from EU member states or EFTA member states (parties to the Agreement on the European Economic Area) [24].
Table 5.
The EU’s household natural gas prices, 2017–2021 (EUR/KWh).
| Country EU | Year | |||||
|---|---|---|---|---|---|---|
| 2017-S2 | 2018 | 2019 | 2020 | 2021 | 2022-S1 | |
| Greece | - | 0.0593 | 0.0571 | 0.0500 | 0.0732 | 0.0888 |
| Bulgaria | 0.0375 | 0.0408 | 0.0446 | 0.0372 | 0.0538 | 0.0764 |
| Estonia | 0.0413 | 0.0413 | 0.0452 | 0.0426 | 0.0593 | 0.1106 |
| Sweden | 0.1125 | 0.1188 | 0.1175 | 0.1027 | 0.1545 | 0.2216 |
| Luxembourg | 0.0398 | 0.0420 | 0.0431 | 0.0389 | 0.0539 | 0.0856 |
| Romania | 0.0308 | 0.0338 | 0.0340 | 0.0322 | 0.0396 | 0.0611 |
| Denmark | 0.0875 | 0.0893 | 0.0813 | 0.0749 | 0.1071 | 0.1600 |
| Netherlands | 0.0815 | 0.0838 | 0.0943 | 0.1003 | 0.1029 | 0.1293 |
| Spain | 0.0865 | 0.0770 | 0.0879 | 0.0804 | 0.0887 | 0.0897 |
| Belgium | 0.0552 | 0.0581 | 0.0564 | 0.0497 | 0.0572 | 0.0939 |
| Ireland | 0.0649 | 0.0697 | 0.0724 | 0.0685 | 0.0702 | 0.0847 |
| Italy | 0.0874 | 0.0833 | 0.0852 | 0.0813 | 0.0854 | 0.0986 |
| Germany | 0.0609 | 0.0608 | 0.0610 | 0.0609 | 0.0670 | 0.0806 |
| France | 0.0695 | 0.0714 | 0.0789 | 0.0736 | 0.0740 | 0.0850 |
| Slovenia | 0.0532 | 0.0562 | 0.0567 | 0.0568 | 0.0567 | 0.0691 |
| Latvia | 0.0393 | 0.0418 | 0.0399 | 0.0298 | 0.0365 | 0.0462 |
| Croatia | 0.0366 | 0.0364 | 0.0391 | 0.0383 | 0.0386 | 0.0412 |
| Poland | 0.0442 | 0.0437 | 0.0469 | 0.0422 | 0.0425 | 0.0549 |
| Lithuania | 0.0395 | 0.0402 | 0.0428 | 0.0328 | 0.0345 | 0.0587 |
| Austria | 0.0698 | 0.0685 | 0.0667 | 0.0652 | 0.0666 | 0.0767 |
| Czechia | 0.0566 | 0.0572 | 0.0587 | 0.0566 | 0.0558 | 0.1010 |
| Portugal | 0.0799 | 0.0772 | 0.0768 | 0.0784 | 0.0768 | 0.0837 |
| Slovakia | 0.0445 | 0.0443 | 0.0465 | 0.0469 | 0.0417 | 0.0488 |
| Hungary | 0.0365 | 0.0353 | 0.034 | 0.0314 | 0.0306 | 0.0291 |
Comments: No data available for Finlandia, Malta, Cyprus and for Greece 2017-S1. Own elaboration based on information posted on the official website EUROSTAT. Gas Prices for Household Consumers—Bi-Annual Data (from 2007 Onwards).
Disclaimer/Publisher’s Note: The statements, opinions and data contained in all publications are solely those of the individual author(s) and contributor(s) and not of MDPI and/or the editor(s). MDPI and/or the editor(s) disclaim responsibility for any injury to people or property resulting from any ideas, methods, instructions or products referred to in the content. |
© 2023 by the authors. Licensee MDPI, Basel, Switzerland. This article is an open access article distributed under the terms and conditions of the Creative Commons Attribution (CC BY) license (https://creativecommons.org/licenses/by/4.0/).
Share and Cite
MDPI and ACS Style
Bohdan, A.; Klosa, S.; Romaniuk, U. Fluctuations of Natural Gas Prices for Households in the 2017–2022 Period—Polish Case Study. Energies 2023, 16, 1824. https://doi.org/10.3390/en16041824
AMA Style
Bohdan A, Klosa S, Romaniuk U. Fluctuations of Natural Gas Prices for Households in the 2017–2022 Period—Polish Case Study. Energies. 2023; 16(4):1824. https://doi.org/10.3390/en16041824
Chicago/Turabian StyleBohdan, Anna, Sabina Klosa, and Urszula Romaniuk. 2023. "Fluctuations of Natural Gas Prices for Households in the 2017–2022 Period—Polish Case Study" Energies 16, no. 4: 1824. https://doi.org/10.3390/en16041824
Note that from the first issue of 2016, this journal uses article numbers instead of page numbers. See further details here.