
R&D Human Capital, Renewable Energy and CO2 Emissions: Evidence from 26 Countries
by
 , ,
, ,
Grzegorz Mentel
1,* ,
,
Waldemar Tarczyński
2,
Hossein Azadi
3,4,5,
Kalandar Abdurakmanov
6,
Elina Zakirova
7 and
Raufhon Salahodjaev
8,9,10 1
Department of Quantitative Methods, The Faculty of Management, Rzeszow University of Technology, 35-959 Rzeszow, Poland
2
Department of Sustainable Finance and Capital Markets, Institute of Economics and Finance, University of Szczecin, 71-101 Szczecin, Poland
3
Department of Economics and Rural Development, Gembloux Agro-Bio Tech, University of Liège, 5030 Gembloux, Belgium
4
Faculty of Environmental Sciences, Czech University of Life Sciences Prague, 165 00 Prague, Czech Republic
5
Faculty of Environmental Science and Engineering, Babeș-Bolyai University, 400000 Cluj-Napoca, Romania
6
Tashkent State University of Economics, Tashkent 100066, Uzbekistan
7
Institute of Additional Education, Ural State University of Economics, 620144 Yekaterinburg, Russia
8
Center for Research in Social Sciences, AKFA University, Tashkent 111221, Uzbekistan
9
Department of Research, ERGO Analytics, Tashkent 100022, Uzbekistan
10
Department of Mathematical Method in Economics, Tashkent State University of Economics, Tashkent 100022, Uzbekistan
*
Author to whom correspondence should be addressed.
Energies 2022, 15(23), 9205; https://doi.org/10.3390/en15239205
Submission received: 1 November 2022
/
Revised: 22 November 2022
/
Accepted: 27 November 2022
/
Published: 5 December 2022
(This article belongs to the Special Issue Energy Policy, Regulation and Sustainable Development)
Abstract
:This study examines the long-term relationship between carbon emissions and a number of researchers engaged in Research and Development (R&D), economic development, foreign capital inflows, renewable energy and population growth in 26 countries between 1995 and 2015. Pedroni’s panel cointegration test confirms the cointegrating relationship between the variables. Long-term elasticities are derived from FMOLS regression. Researchers in R&D and renewable energy are negatively and significantly related to carbon emissions. There is a positive and significant long-term relationship between GDPs per capita and CO2 and between the FDI and CO2. Dumitrescu and Hurlin’s panel causality test revealed unidirectional causality running from economic development to carbon emissions and feedback hypotheses between the FDI and CO2 and between renewable energy and CO2.
1. Introduction
During the last decades, research on the link between innovation and pollution has expanded significantly [1,2,3,4,5]. This is both due to the rapid increase of CO2 emissions by nearly 90% since 1970 and continuing enhancing environmental concerns and technological advancements, which can effectively mitigate the consequences of environmental pollution and climate change without destroying economic growth [6]. At the same time, policymakers aim to achieve economic growth without “without inflicting environmental harm” [7].
However, a separate strand of studies explores the effect of human capital on pollution. Led by the cognitive capitalism theory, some studies suggest that nations with greater cognitive capital tend to achieve more wealth led by innovation, effectively adopt modern technologies, develop strong institutions and demonstrate higher environmental awareness and pro-environmental behavior [8,9,10]. Lin et al. [11] stated that economies’ technology development and implementation are highly dependent on the so-called “innovative human capital”. This is basically research and development personnel, whose knowledge and skills serve as a unique resource of cutting-edge technologies and innovations, including those aimed at clean production, clean energy generation and environmental sustainability.
To the best of our knowledge, few research studies have considered innovative human capital as a pollution-reducing factor. Some scholars who explored the relationship employed education-based proxies of innovative human capital, such as tertiary education, which might have created certain issues, as tertiary education measures human capital stock rather than specifies innovative human capital.
Based on the study of Lin et al. [11], our paper employed Research and Development (R&D hereafter)-based measures of innovative human capital, which is the number of researchers involved in R&D.
Our study explores the relationship between innovative human capital and carbon emissions in 26 industrialized economies between 1995 and 2015. This paper’s structure is as follows. We first provide an overview of related literature. Based on the literature review, we construct a model and design a model estimation framework, which is described in detail in the Data and Methods section. Following that methodological description, we provide and discuss the econometric results. The final section concludes our findings.
2. Literature Review
Numerous researchers have explored the link between carbon emissions and innovation, considering innovation and technological as the significant factor to mitigate climate change issues [12] and enhance environmental wellbeing without harming economic growth. Existing research can measure innovation by expenditure in energy R&D, expenditure in R&D, renewable energy consumption, the number of patent families, number of researchers engaged in R&D, industry–university–research cooperation and even green project financing (e.g., green bonds) [13], etc. Authors have explored the effect of public expenditure in energy R&D and carbon emissions per GDP. Authors have investigated the relationship between public energy R&D and per capita carbon emissions using a sample of 13 developed economies, including Canada, Denmark, Finland, France, Germany, Italy, Japan, Norway, the Netherlands, Spain, Sweden, the UK and the USA between 1980 and 2004 and employing the Granger causality approach. They distinguished two channels by which public expenditure in energy R&D may affect carbon emissions, which are carbon emissions and carbon intensity. Their findings suggest that spending on energy R&D improves the energy efficiency, yet it did not significantly relate to the carbon factor or carbon intensity. On the other hand, carbon trends are related to the formation of energy R&D budgets.
However, later research provided evidence on the significant effects of innovation and technological advances on various environmental indicators, including carbon emissions. Lee and Min [14] observed the negative effect of firm innovation (green R&D) on carbon dioxide emissions using data on Japanese manufacturing firms during 2001–2010. Irandoust [3] studied the relationship between renewable energy consumption, technological innovation, economic growth and carbon dioxide emissions in Nordic countries. Technological innovation is measured by real R&D spending on the energy sector. Their findings suggest that technological innovation has an significant impact on renewable energy consumption. Álvarez-Herránz et al. [15] explained that, despite the time lags required for energy innovation to reach their maximum effect, it reduces the energy intensity and pollution. Zhang et al. [16] observed that environmental innovation can reduce carbon emissions using data from 30 provinces of China between 2000 and 2013. Similarly, Ganda [17] observed a negative relationship between innovations—in particular, renewable energy consumption and R&D expenditure—and carbon emissions in OECD countries. Khan et al. [18] studied the relationship between environmental innovation, renewable energy consumption, carbon emissions, trade and income in G7 between 1990 and 2017. Their findings revealed the negative impact of exports, environmental innovation and renewable energy consumption on carbon dioxide emissions in the long run. Similar findings were also obtained by Nguyen et al. [19], who attributed technology and spending on innovation as the main drivers of lowering carbon emissions in 13 countries of G20. Wahab et al. [20] suggested that the adoption of new technologies aimed at cleaner production can reduce carbon emissions in G7 economies between 1996 and 2017. At the same time, some studies revealed that the innovation–pollution relationship is sector-dependent. For example, Zhang et al. [21] (2020) attempted to identify whether carbon emissions policies are related to the implementation of low-carbon technology innovations. Their findings suggest that carbon emissions policies improve technology innovation in the power and aviation sectors only and are not related to each other in the steel, chemical, building material, petrochemical, nonferrous metals and paper industries. Erdoğan et al. [4] suggested that policies aimed at lowering carbon emissions should be designed and implemented in each sector separately, as the effects of technology innovation on carbon emissions vary. Using data on G20 between 1991 and 2017, the authors findings revealed that innovations in the industrial sector discourage carbon emissions and, on the other hand, enhance carbon emissions in the construction sector. The latest research considers the role of technological innovation, measured by patent applications in the remittances–renewable energy—CO2 relationship [22]. Their findings suggest to incorporate R&D with carbon policies to quickly attain low-carbon growth.
On the other hand, another strand of research considered human capital as a pollution-reducing factor [23,24]. Those studies explained that greater human capital measured either by intelligence or cognitive abilities implies greater commitment to environmentalism and pollution reduction. Considering cognitive capital and the number of researchers occupied in research and development as elements of national human capital, it indeed may decrease the pollution levels and encourage public and private commitment to cleaner and ecologically friendly technologies [25].
Hassan et al. [26] examined the effect of the index of per capita human capital and biocapacity on the ecological footprint, measured by the area of bio-productive lands, as they both may have an impact on human pro-environmental behavior. For this purpose, the authors employed cointegration and the Granger causality approach. Their findings suggested a neutral relationship between the variables. Yao et al. [27] used a sample of 20 OECD economies between 1870 and 2014 using parametric and nonparametric tests to explore the effect of human capital on carbon emissions. Their results implied a negative yet time-variant relationship between human capital and carbon dioxide emissions. However, human capital may be indirectly related to pollution reduction. While investigating the effect of fiscal decentralization on CO2 emissions, Khan et al. [28] observed the significant role of human capital. Their study also highlighted the one-way causal effect running from eco-innovation to CO2 emissions. In contrast, Wang and Wu [29] investigated if air pollution could be related to brain drain in China and India. The empirical results revealed that a higher concertation of pollutants in the air negatively impact the stock of technologically innovative human capital—a higher-educated population engaged in R&D in enterprises, research centers and universities. Eshchanov et al. [30] observed that cognitive abilities positively related to pro-environmental behavior and a favorable attitude toward renewable energy sources using household data of Uzbek households. Finally, Lin et al. [11] explored the relationship between innovative human capital, carbon dioxide emissions and economic growth in Chinese provinces during 2003–2017 by employing System GMM. Innovative human capital was measured by the number of patents of every one million R&D staff full-time equivalent. Their findings suggested that innovative human capital decreases carbon dioxide emissions, and its further development will enhance the environmental sustainability of China.
3. Data and Methods
The current study examines the long-term relationships between atmospheric pollution, research in R&D fields, economic development, foreign capital inflows, renewable energy and population growth. Our key independent variable is research in R&D, measured by the number of researchers engaged in R&D. Variables’ descriptions and summary statistics are represented in Table 1. Our sample is restricted to the countries with full data series covering Belgium, Canada, China, the Czech Republic, France, Germany, Hungary, Ireland, Italy, Japan, South Korea, Latvia, Lithuania, Mexico, the Netherlands, Poland, Portugal, Romania, the Russian Federation, Singapore, the Slovak Republic, Slovenia, Spain, Turkey, the United Kingdom and the United States.
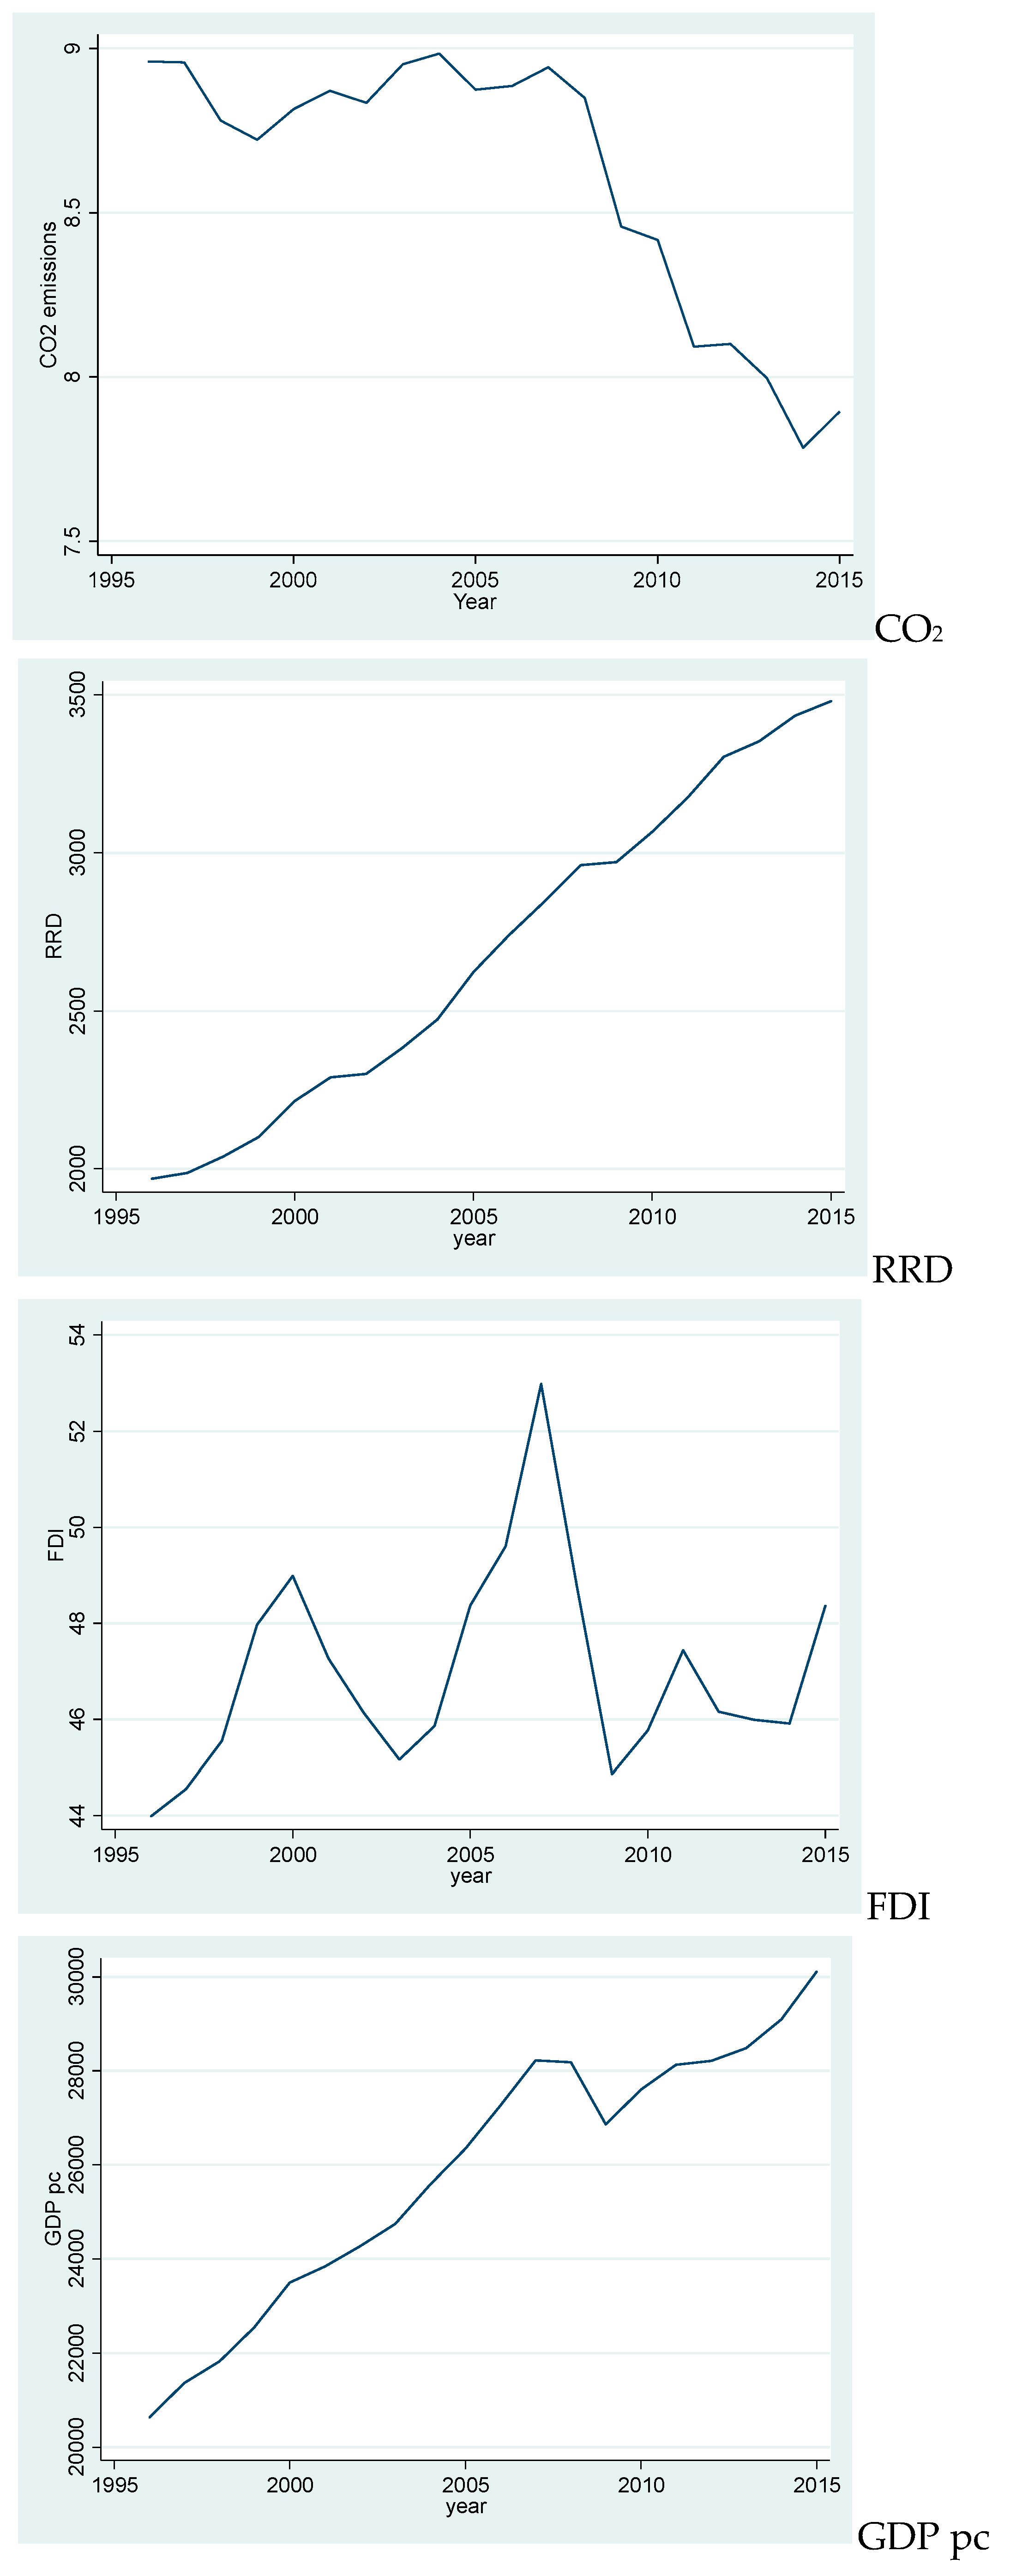
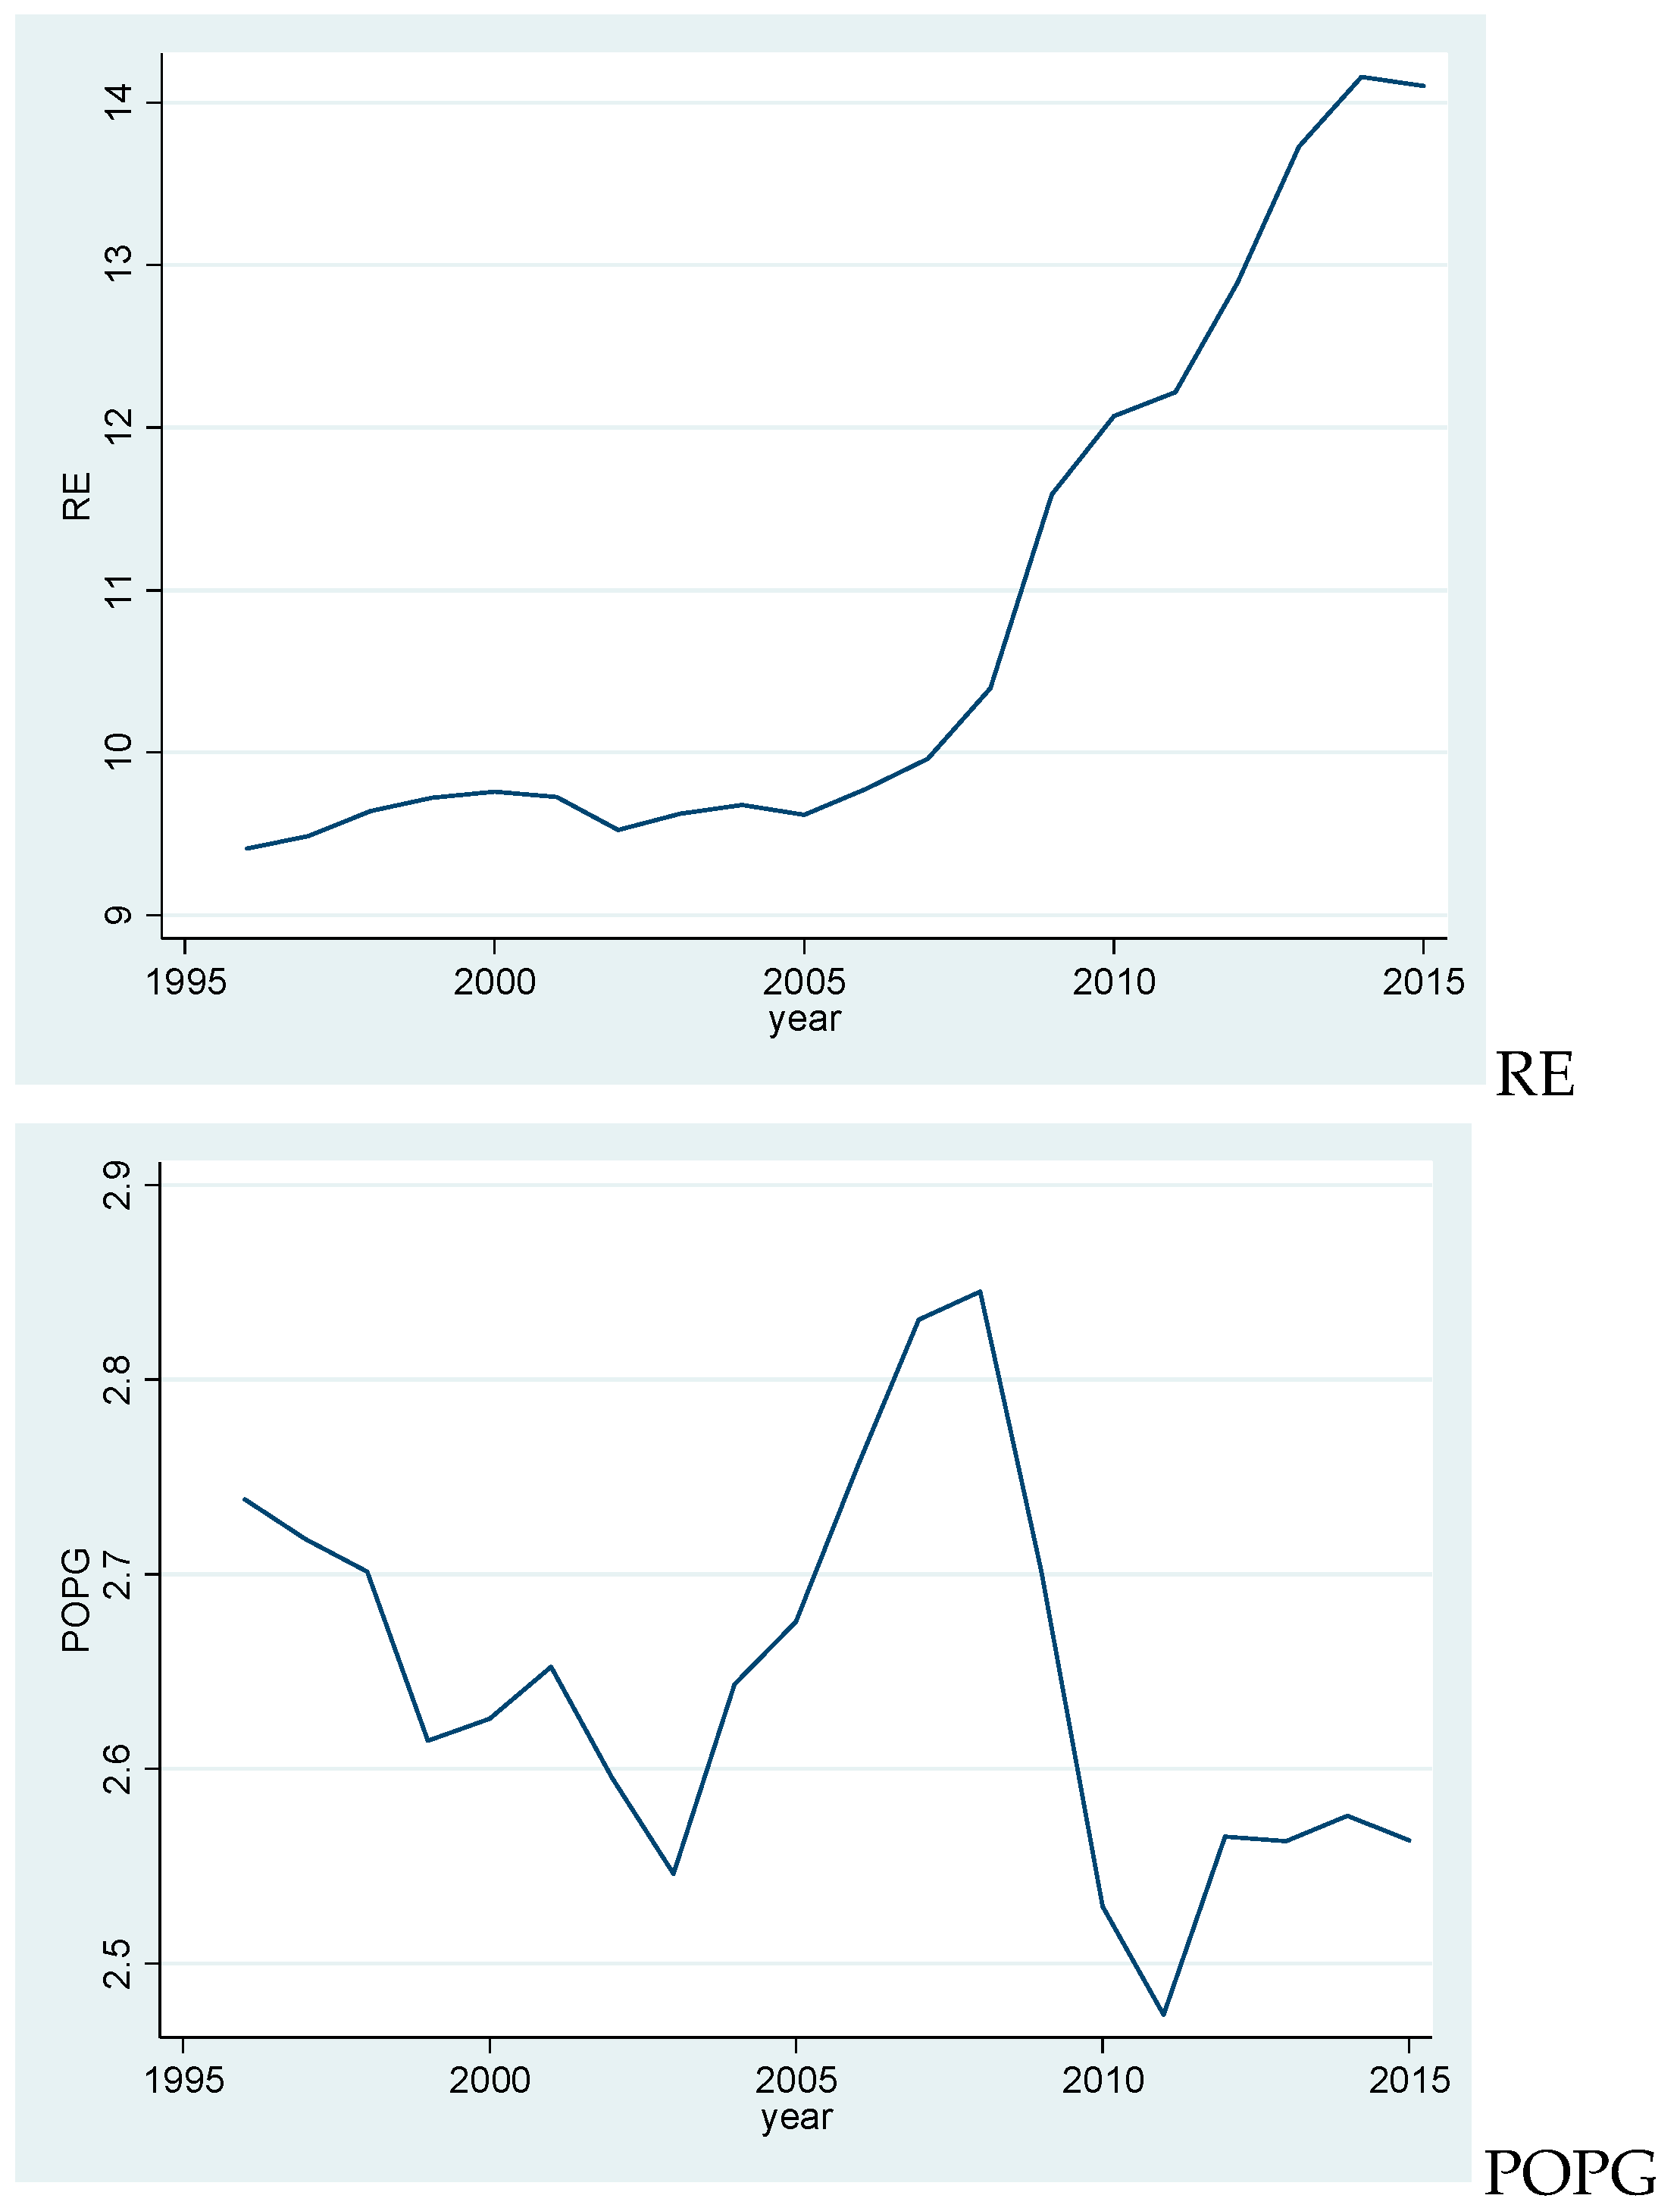
The dependent variable is carbon emissions measured as CO2 emissions in metric tons per capita. The average CO2 emission in our sample is 8.6 metric tons per capita (Table 1). Between 1995 and 2015, carbon dioxide emissions decreased rapidly. Economies significantly decreased their pollution levels between 2007 and 2015. Before 2005, the amount of CO2 emissions fluctuated, yet with an ascending tendency.
The figures below represent a time series of the selected variables as a pretest measure to identify trends and breaks as suggested by [31].
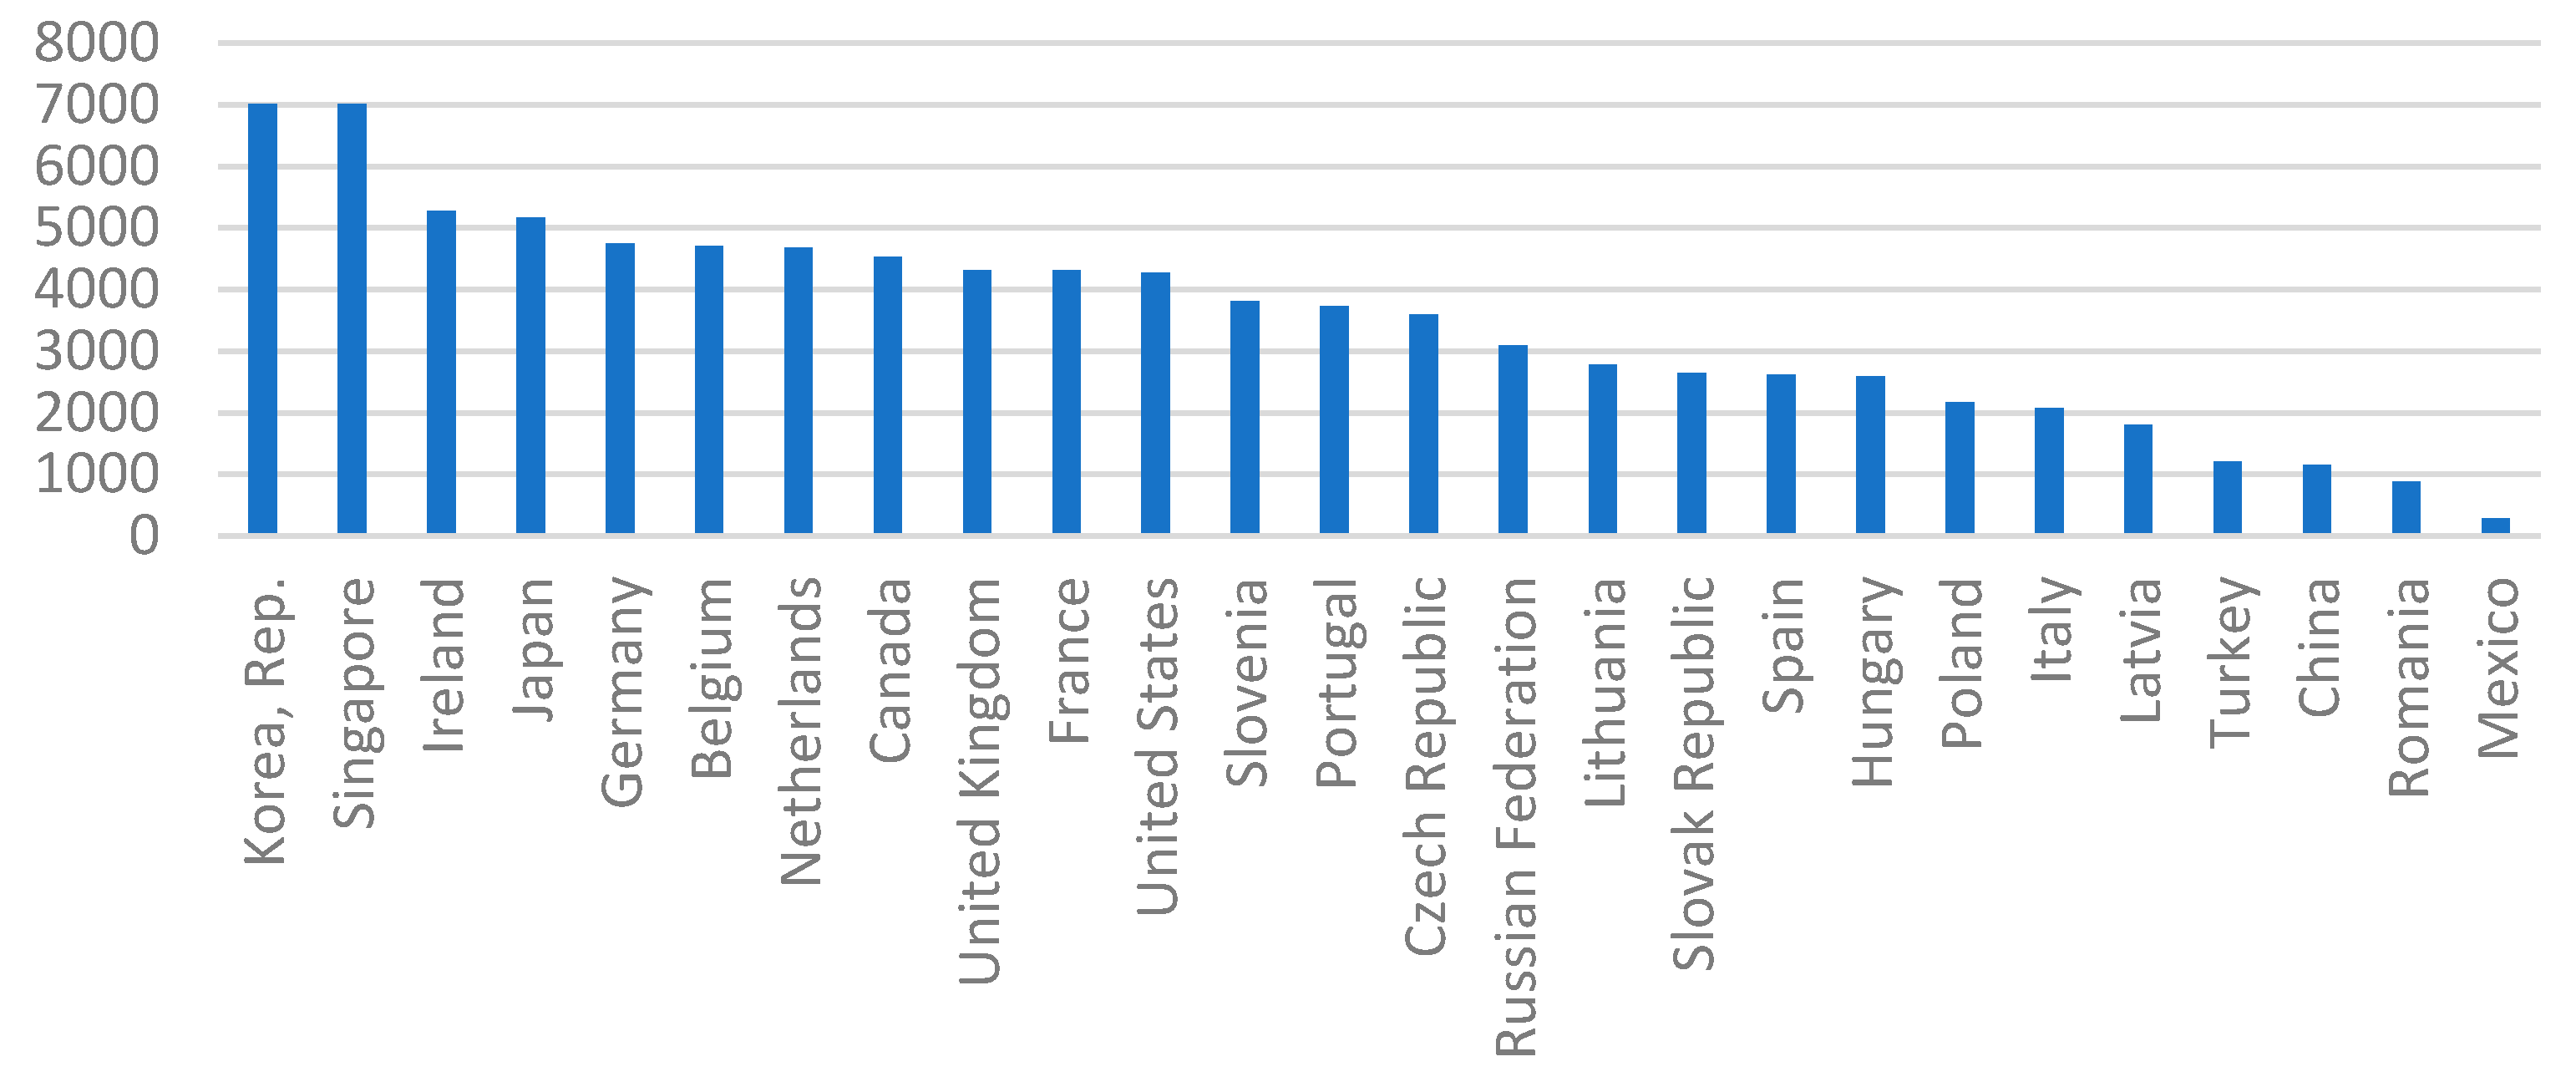
Independent variable—the number of researchers engaged in R&D per million population. The average number of researchers in R&D in our sample is 2.7 thousand people (Table 1). Between 1996 and 2015, the number of researchers engaged in R&D grew rapidly (Figure 1). In 2015, two outstanding economies were South Korea and Singapore, where the number of researchers exceeded 7 thousand per million people, followed by Ireland and Japan (>5 thousand) and Germany (4.7 thousand). The bottom 5 were Latvia, Turkey, China, Romania and Mexico, where the number of researchers in R&D was less than 2 thousand (Figure 2).
The control variables in the model include net inflows of the FDI as a GDP share, GDP per capita, share of renewable energy in the total final energy consumption and the annual rate of population growth. The FDI, GDP per capita and population growth experienced a significant fall down between 2007 and 2010, which may be a response to the global financial crisis. On the other hand, renewable energy consumption started a growing trend in 2005.
Our study describes CO2 emissions as follows:
where CO2 is the carbon dioxide emissions per capita, GDP pc is the GDP per capita, FDI—foreign direct investment as a share of the GDP, RE—renewable energy consumption as a % of the total final energy consumption and POPG is the population growth rate. i and t represent individual and temporal dimensions.
As one can note, some variables represent shares, while others are expressed in the number of people, dollars or tons. Such disparities may complicate further analyses and decrease the results quality due to data sharpness. We therefore transform Equation (1) by taking natural logs from each variable, so that each variable is now expressed in the same measurement unit.
The first step of our analyses assumes a stationarity check. For this purpose, we employ five panel unit root tests, which are the LLC test by [32], Breitung’s test by [33], the IPS test by [34] and Fisher-type tests by Maddala & Wu [35]. We check each variable in two different forms—level and first difference—to test the null hypothesis of stationarity. In case our level model is nonstationary, then there may exist a cointegrating relationship [36].
Once all variables are stationary after first differencing, we may proceed with the cointegration analysis. Here, we adopt the panel cointegration test introduced by Pedroni [36,37] for heterogeneous panels. It tests the model for the cointegrating vector by employing seven parametric and nonparametric statistics. The test’s output is grouped by group and panel estimates. The null hypothesis states no cointegration and may be rejected in the favor of the majority of the test statistics.
After confirming a cointegrating relationship between variables, we estimate the regression coefficients, which, in our case, are long-term elasticities, since natural logs are taken from each variable. We estimate our model with a Fully Modified Ordinary Least Squares (FMOLS) estimator that is usually applied if the model exhibits a cointegrating vector [32].
FMOLS coefficients provide us with the effect of selected variables on CO2 and their significance, yet it does not account for the causality direction. We employ Dumitrescu and Hurlin’s [33] panel causality test, which is based on Granger’s technique. The test is designed for heterogeneous panel data and assumes a noncausal relationship. Dumitrescu and Hurlin’s test described the regression equation as follows:
where and are observations of two stationary variables in a strongly balanced panel dataset for individual i in a period.
The test runs separate regressions to check different causal directions. The test output results in a table providing Wald statistics and underlying z statistics. The final decision is made based on z-bar statistics [38].
4. Results
We first demonstrate the results of panel unit root tests (Table 2). We test each variable in the level- and first-difference forms with the LLC, Breitung, IPS and Fisher tests on both the ADF and PP. The dependent variable—log of carbon emissions—is nonstationary at the level under all the test statistics but stationary after first differencing and strongly significant. Researchers in R&D (RRD) demonstrate stationarity at the level form under the LLC test, while other test statistics demonstrate the opposite. First, differencing eliminates the unit root at p < 0.01. The level forms of GDP pc and RE are nonstationary but become stationary after the first differencing. On the other hand, the level forms of the FDI and population growth (POPG) are stationary both at the level and first-difference forms. Our results suggest that most of the variables are nonstationary at the level but stationary after detrending, which enables the further investigation of panel cointegration.
Additionally, a panel unit root with a structural break is employed to check the stationarity of the variables, as structural breaks may mislead stationarity tests to accept the unit root while the opposite is true [39,40]. To be considered for a structural break, we employed Karavias and Tzavalis’ [41] test for panel data. This methodology allows to test the unit root in the presence of one or two structural breaks in the intercepts of the individual series or in both intercepts and linear trends. The null hypothesis states the unit root in all panels and no structural breaks, while, alternatively, one assumes the stationarity of some panels and structural break(s). We assume one known structural break during the global subprime mortgage crisis between 2008 and 2009. We tested all variables for the unit root in the presence of a structural break in 2008 in both intercepts and trends. Table 3 demonstrates that the unit root are mostly contained in linear trends of ln CO2, ln RRD, ln GDP pc and ln RE. Once the variables are detrended, the data is stationary.
Panel cointegration test results are depicted in Table 4. Out of seven test statistics, four confirm the hypothesis of a long-term relationship between variables at p < 0.01. In addition, Kao’s ADF and Westerlund’s variance ratio also demonstrate that the variables in our model are cointegrated. Our results suggest a long-term relationship between carbon emissions, researchers in R&D, GDP per capita, foreign capital investment, renewable energy share and population growth, which means that, in the long term, these variables can impact carbon dioxide emissions, yet the effect must be examined. For this purpose, we ran a fully modified OLS regression (Table 5). Since all variables are in logarithmic form, the coefficients represent long-term elasticities.
In our sample, the number of researchers in R&D is negatively related to carbon emissions, or, in other words, the more researchers are employed in R&D sector, the less are volumes of carbon dioxide emissions. As for other variables, the GDP per capita and FDI are positively related to CO2 emissions. Shares of renewable energy, however, decrease carbon emissions in selected economies. Population growth is not related to carbon dioxide emissions.
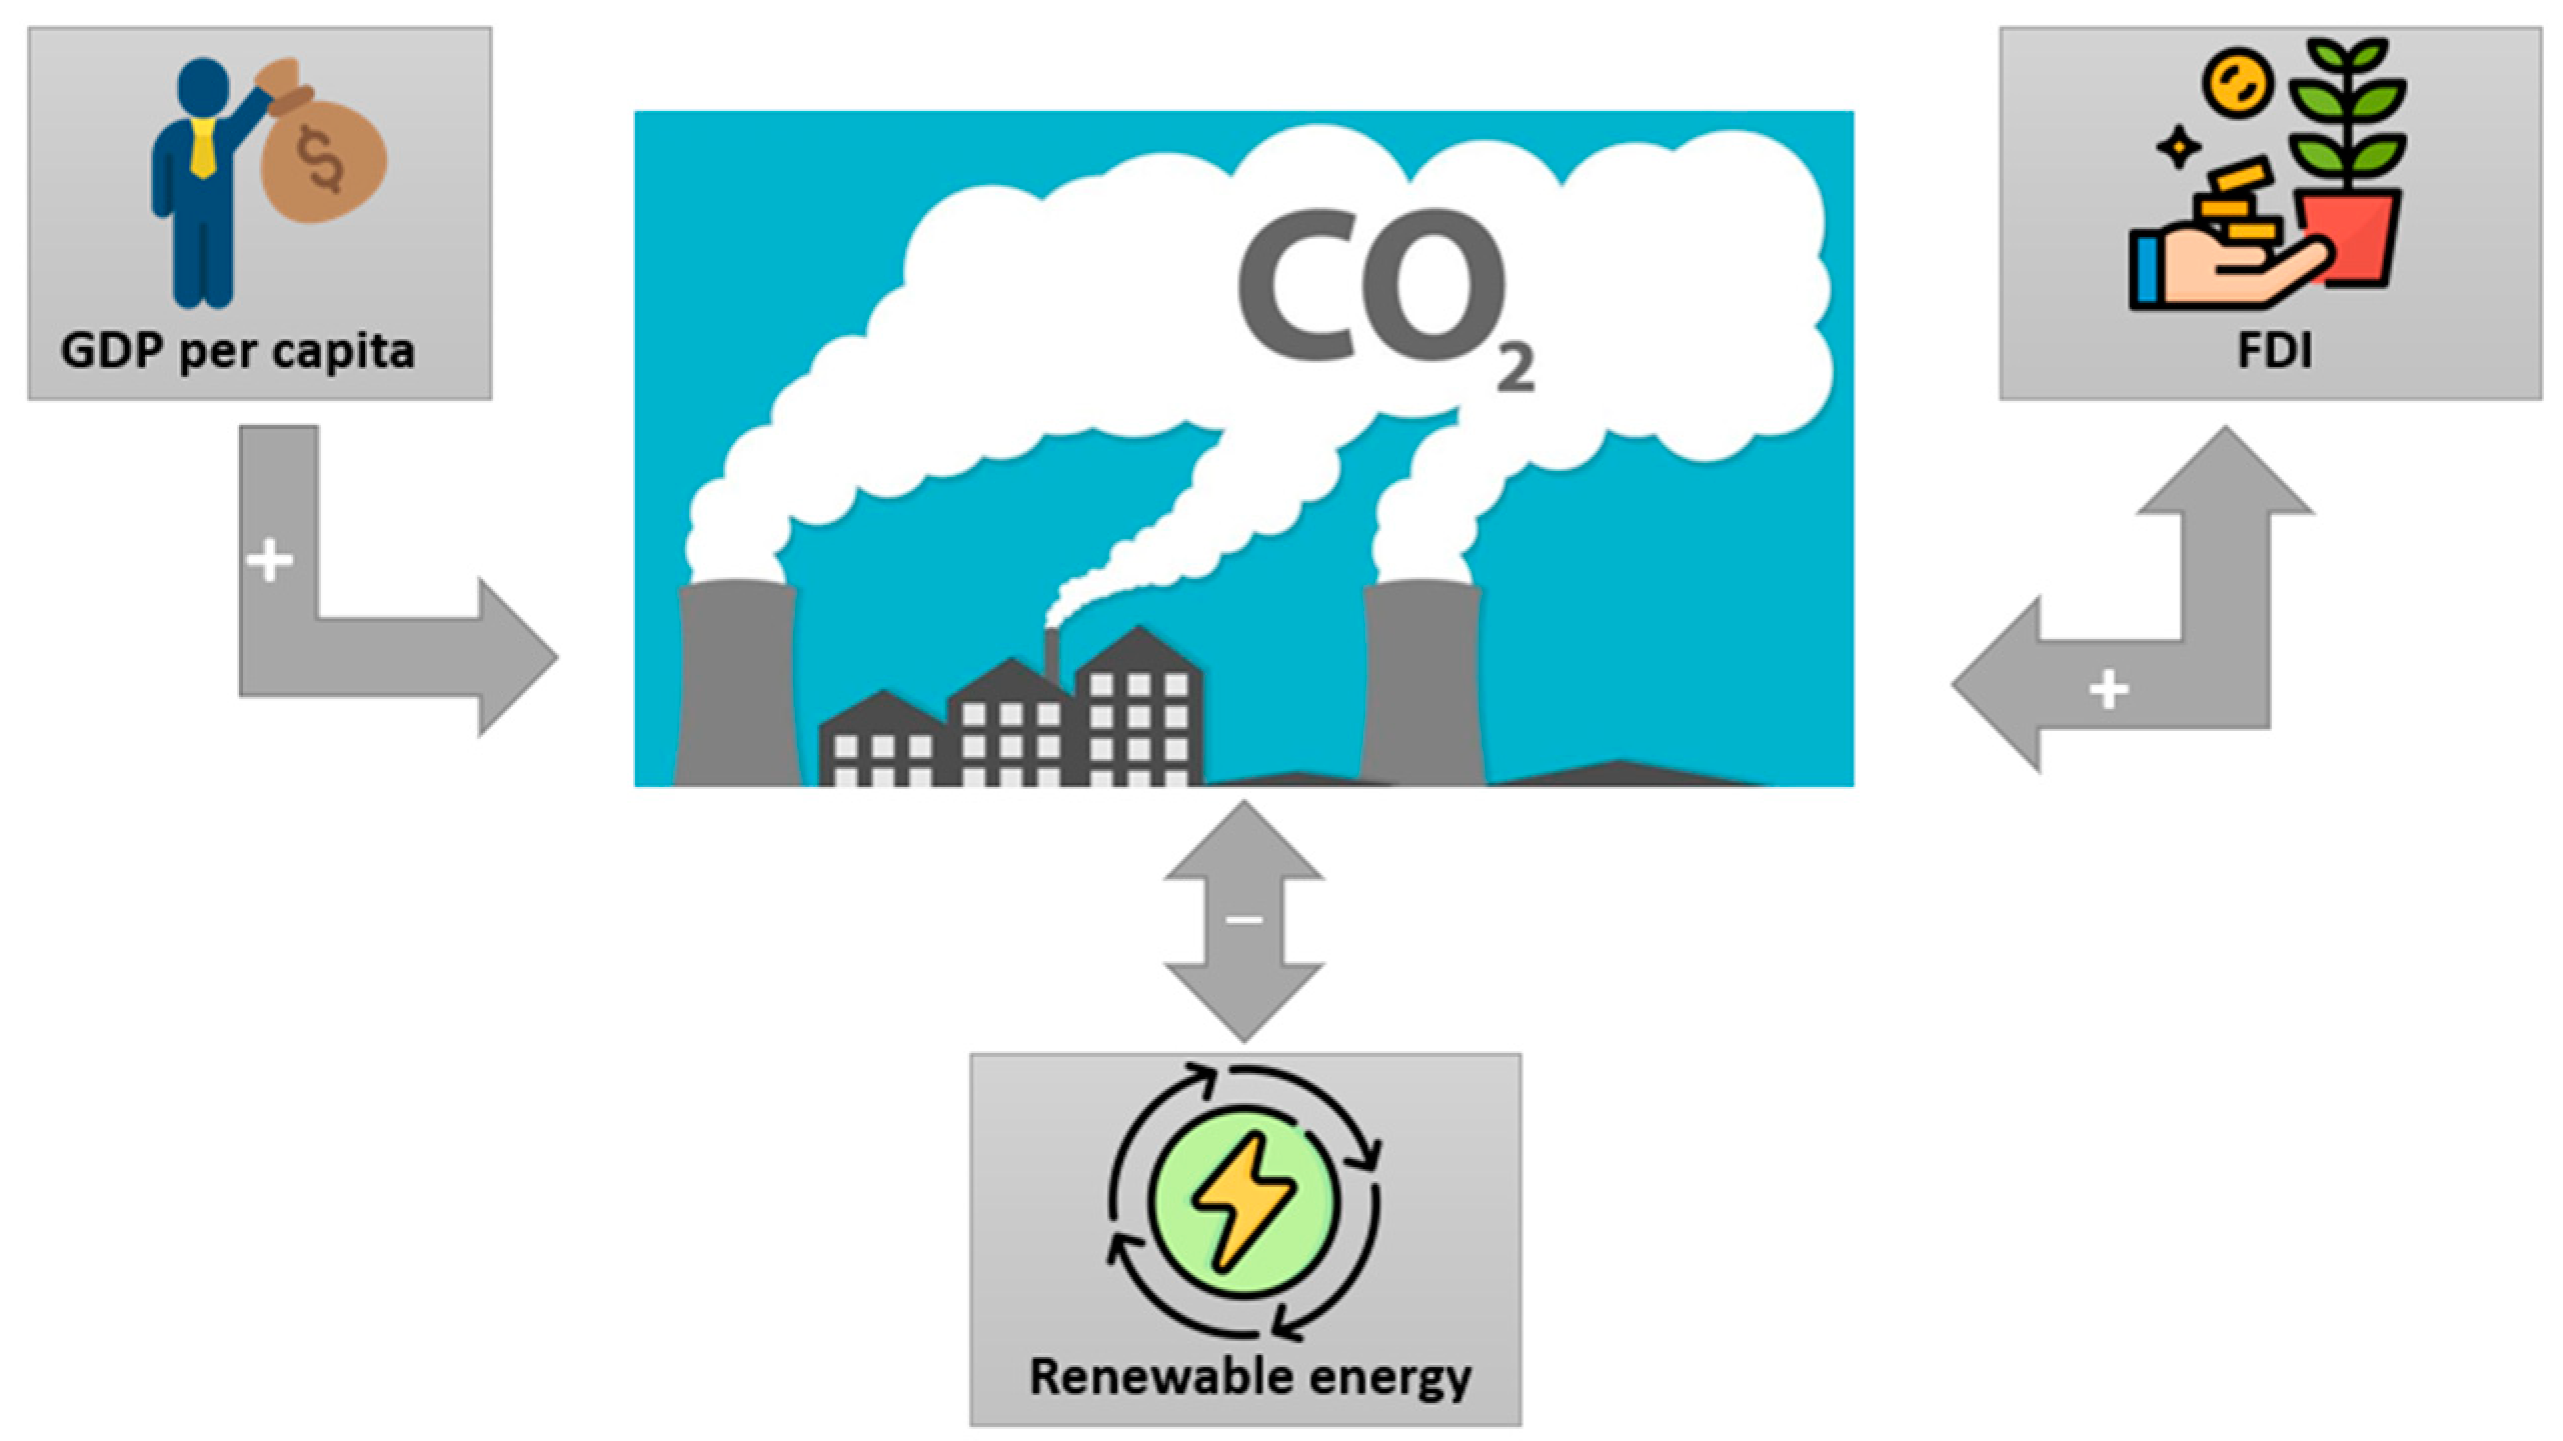
Finally, it is necessary to understand the nature of the relationship, whether it is causal or linked through other channels. For this purpose, we conduct a panel causality test, introduced by Dumitrescu and Hurlin [42]. We test each independent variable with CO2 for two hypotheses, which assume different causality directions. The first hypothesis tests the RRD–CO2 nexus, i.e., causal relationship between the number of researchers in R&D and carbon dioxide emissions. According to Table 6, RRD and CO2 are not causally related in our sample, although the variables are strongly and negatively related in the long term. Economic development, on the other hand, is causally related to carbon emissions. We observe a significant causal relationship running from the per capita GDP to carbon emissions at p < 0.01. A bidirectional causal relationship was also observed between the FDI and CO2 (Figure 3). It means that foreign capital inflows may be directed to carbon-intensive sectors and thus increase atmospheric pollution. Similarly, there is a two-way causality between renewable energy and carbon dioxide emissions, meaning that higher shares of renewable energy consumption cause lower shares of carbon emissions.
Our results provide interesting insights on the relationship between scientific advancements of countries and atmospheric pollution. First, we found that researchers in R&D are positively related to carbon emissions in the long term, yet the causal link is not supported. Our findings are partly explained by Obydenkova and Salahodjaev [10], who find that higher human capital, combined with democracy, encourage environmental commitments. Secondly, we observed that economic development is significantly and positively related to carbon emissions. There is also a causal link running from economic development to carbon emissions. Similar findings were observed by [43,44], which generally stated that economic development initially encourages pollution. Further, there is a feedback effect between the FDI and carbon emissions. The relationship between the FDI and CO2 is far from obvious, as it largely depends on the economy’s development stage and environmental commitment [45]. Although inflows of foreign capital may enhance the development of green technologies [46], it can also be directed to support the most profitable pollution-extensive sectors [47]. Finally, we found the bidirectional and negative effects of renewable energy. Increasing shares of renewables consumed and policies aimed at green economy transition would thus decrease environmental harm. Similar findings were observed by [48].
5. Conclusions
This study tested the long-term relationships between carbon dioxide emissions, researchers engaged in R&D, GDP per capita, renewable energy and population growth in 26 economies between 1995 and 2015. The econometric estimates were based on Pedroni’s cointegration test and Dumitrescu and Hurlin’s panel causality test. Our results suggest a negative long-term relationship between the number of researchers in R&D, renewable energy and CO2. A positive long-term relationship was observed between CO2, economic growth and the FDI. A panel causality test revealed unidirectional causality running from GDPs per capita to carbon emissions. Bidirectional causality was observed between carbon emissions and the FDI and between renewable energy and carbon emissions.
Our study confirmed that innovations measured by researchers in R&D are negatively related to atmospheric pollution in the long term. Indeed, innovations result in the development of efficient and ecological solutions, aimed at improving the quality of life and wellbeing. Such logic is supported by a number of researchers [2,49], whose results concluded the pollution-reducing effect of innovations. Growing environmental concerns encourage both adopting pro-environmental policies and promoting research and development investments [50]. Thus, policymakers should encourage research and development both through investment and human capital. Besides innovation, pollution can be reduced by adopting renewable energy sources. On the other hand, the FDI exacerbates pollution. It might be useful to create incentives for the adoption of pro-environmental technologies and developing environmentally sustainable sectors, so that the direction of foreign capital would shift in favor of green projects.
Author Contributions
Conceptualization, K.A., E.Z., R.S., W.T. and G.M.; methodology, R.S. and G.M.; software, R.S.; validation, K.A., E.Z., W.T. and H.A.; formal analysis, R.S., G.M. and E.Z.; investigation, R.S.; and writing—original draft preparation, K.A., E.Z., R.S., W.T. and H.A. All authors have read and agreed to the published version of the manuscript.
Funding
This research received no external funding.
Data Availability Statement
Data are available from World Bank.
Conflicts of Interest
The authors declare no conflict of interest.
References
- Calef, D.; Goble, R. The allure of technology: How France and California promoted electric and hybrid vehicles to reduce urban air pollution. Policy Sci. 2007, 40, 1–34. [Google Scholar] [CrossRef] [Green Version]
- Carrión-Flores, C.E.; Innes, R. Environmental innovation and environmental performance. J. Environ. Econ. Manag. 2010, 59, 27–42. [Google Scholar] [CrossRef]
- Irandoust, M. The renewable energy-growth nexus with carbon emissions and technological innovation: Evidence from the Nordic countries. Ecol. Indic. 2016, 69, 118–125. [Google Scholar] [CrossRef]
- Zeng, S.; Zhou, Y. Foreign Direct Investment’s Impact on China’s Economic Growth, Technological Innovation and Pollution. Int. J. Environ. Res. Public Health 2021, 18, 2839. [Google Scholar] [CrossRef]
- Erdoğan, S.; Yıldırım, S.; Yıldırım, D.; Gedikli, A. The effects of innovation on sectoral carbon emissions: Evidence from G20 countries. J. Environ. Manag. 2020, 267, 110637. [Google Scholar] [CrossRef]
- Irga, P.J.; Pettit, T.J.; Torpy, F.R. The phytoremediation of indoor air pollution: A review on the technology devel-opment from the potted plant through to functional green wall biofilters. Rev. Environ. Sci. Bio/Technol. 2018, 17, 395–415. [Google Scholar] [CrossRef]
- Özbay, R.D.; Athari, S.A.; Saliba, C.; Kirikkaleli, D. Towards Environmental Sustainability in China: Role of Glob-alization and Hydroelectricity Consumption. Sustainability 2022, 14, 4182. [Google Scholar] [CrossRef]
- Nentjes, A.; Wiersma, D. Innovation and pollution control. Int. J. Soc. Econ. 1988, 18, 18–29. [Google Scholar] [CrossRef]
- Salahodjaev, R. Is there a link between cognitive abilities and environmental awareness? Cross-national evidence. Environ. Res. 2018, 166, 86–90. [Google Scholar] [CrossRef]
- Obydenkova, A.; Salahodjaev, R. Intelligence, democracy, and international environmental commitment. Environ. Res. 2016, 147, 82–88. [Google Scholar] [CrossRef]
- Lin, X.; Zhao, Y.; Ahmad, M.; Ahmed, Z.; Rjoub, H.; Adebayo, T.S. Linking innovative human capital, economic growth, and CO2 emissions: An empirical study based on Chinese provincial panel data. Int. J. Environ. Res. Public Health 2021, 18, 8503. [Google Scholar] [CrossRef] [PubMed]
- Yan, L.; Wang, H.; Athari, S.A.; Atif, F. Driving green bond market through energy prices, gold prices and green energy stocks: Evidence from a non-linear approach. Econ. Res.-Ekon. Istraživanja 2022, 35, 6479–6499. [Google Scholar] [CrossRef]
- Garrone, P.; Grilli, L. Is there a relationship between public expenditures in energy R&D and carbon emissions per GDP? An empirical investigation. Energy Policy 2010, 38, 5600–5613. [Google Scholar] [CrossRef]
- Lee, K.-H.; Min, B. Green R&D for eco-innovation and its impact on carbon emissions and firm performance. J. Clean. Prod. 2015, 108, 534–542. [Google Scholar] [CrossRef] [Green Version]
- Álvarez-Herránz, A.; Balsalobre, D.; Cantos, J.M.; Shahbaz, M. Energy Innovations-GHG Emissions Nexus: Fresh Empirical Evidence from OECD Countries. Energy Policy 2017, 101, 90–100. [Google Scholar] [CrossRef]
- Zhang, Y.-J.; Peng, Y.-L.; Ma, C.-Q.; Shen, B. Can environmental innovation facilitate carbon emissions reduction? Evidence from China. Energy Policy 2017, 100, 18–28. [Google Scholar] [CrossRef]
- Ganda, F. The impact of innovation and technology investments on carbon emissions in selected organisation for economic Co-operation and development countries. J. Clean. Prod. 2019, 217, 469–483. [Google Scholar] [CrossRef]
- Khan, Z.; Ali, S.; Umar, M.; Kirikkaleli, D.; Jiao, Z. Consumption-based carbon emissions and International trade in G7 countries: The role of Environmental innovation and Renewable energy. Sci. Total Environ. 2020, 730, 138945. [Google Scholar] [CrossRef]
- Nguyen, T.T.; Pham, T.A.T.; Tram, H.T.X. Role of information and communication technologies and innovation in driving carbon emissions and economic growth in selected G-20 countries. J. Environ. Manag. 2020, 261, 110162. [Google Scholar] [CrossRef]
- Wahab, S.; Zhang, X.; Safi, A.; Wahab, Z.; Amin, M. Does energy productivity and technological innovation limit trade-adjusted carbon emissions? Econ. Res.-Ekon. Istraživanja 2021, 34, 1896–1912. [Google Scholar] [CrossRef]
- Zhang, Y.J.; Shi, W.; Jiang, L. Does China’s carbon emissions trading policy improve the technology innovation of relevant enterprises? Bus. Strategy Environ. 2020, 29, 872–885. [Google Scholar] [CrossRef]
- Saliba, C.B.; Hassanein, F.R.; Athari, S.A.; Dördüncü, H.; Agyekum, E.B.; Adadi, P. The Dynamic Impact of Re-newable Energy and Economic Growth on CO2 Emissions in China: Do Remittances and Technological Innovations Matter? Sustainability 2022, 14, 14629. [Google Scholar] [CrossRef]
- Obydenkova, A.; Nazarov, Z.; Salahodjaev, R. The process of deforestation in weak democracies and the role of Intelligence. Environ. Res. 2016, 148, 484–490. [Google Scholar] [CrossRef] [PubMed]
- Omanbayev, B.; Salahodjaev, R.; Lynn, R. Are greenhouse gas emissions and cognitive skills related? Cross-country evidence. Environ. Res. 2018, 160, 322–330. [Google Scholar] [CrossRef]
- Larkin, A.; Hystad, P. Towards Personal Exposures: How Technology Is Changing Air Pollution and Health Research. Curr. Environ. Health Rep. 2017, 4, 463–471. [Google Scholar] [CrossRef] [PubMed]
- Hassan, S.T.; Baloch, M.A.; Mahmood, N.; Zhang, J. Linking economic growth and ecological footprint through human capital and biocapacity. Sustain. Cities Soc. 2019, 47, 101516. [Google Scholar] [CrossRef]
- Yao, Y.; Ivanovski, K.; Inekwe, J.; Smyth, R. Human capital and CO2 emissions in the long run. Energy Econ. 2020, 91, 104907. [Google Scholar] [CrossRef]
- Khan, Z.; Ali, S.; Dong, K.; Li, R.Y.M. How does fiscal decentralization affect CO2 emissions? The roles of institutions and human capital. Energy Econ. 2020, 94, 105060. [Google Scholar] [CrossRef]
- Wang, F.; Wu, M. Does air pollution affect the accumulation of technological innovative human capital? Empirical evidence from China and India. J. Clean. Prod. 2020, 285, 124818. [Google Scholar] [CrossRef]
- Eshchanov, B.; Abdurazzakova, D.; Yuldashev, O.; Salahodjaev, R.; Ahrorov, F.; Komilov, A.; Eshchanov, R. Is there a link between cognitive abilities and renewable energy adoption: Evidence from Uzbekistan using micro data? Renew. Sustain. Energy Rev. 2021, 141, 110819. [Google Scholar] [CrossRef]
- Kirikkaleli, D.; Athari, S.A. Time-frequency co-movements between bank credit supply and economic growth in an emerging market: Does the bank ownership structure matter? N. Am. J. Econ. Finance 2020, 54, 101239. [Google Scholar] [CrossRef]
- Levin, A.; Lin, C.-F.; Chu, C.-S.J. Unit root tests in panel data: Asymptotic and finite-sample properties. J. Econ. 2002, 108, 1–24. [Google Scholar] [CrossRef]
- Breitung, J. Nonparametric tests for unit roots and cointegration. J. Econ. 2002, 108, 343–363. [Google Scholar] [CrossRef]
- Im, K.S.; Pesaran, M.; Shin, Y. Testing for unit roots in heterogeneous panels. J. Econ. 2003, 115, 53–74. [Google Scholar] [CrossRef]
- Maddala, G.S.; Wu, S. A Comparative Study of Unit Root Tests with Panel Data and a New Simple Test. Oxf. Bull. Econ. Stat. 1999, 61, 631–652. [Google Scholar] [CrossRef]
- Pedroni, P. Fully modified OLS for heterogeneous cointegrated panels. In Nonstationary Panels, Panel Cointegration, and Dynamic Panels; Emerald Group Publishing Limited: Bradford, UK, 2001. [Google Scholar] [CrossRef]
- Pedroni, P. Critical Values for Cointegration Tests in Heterogeneous Panels with Multiple Regressors. Oxf. Bull. Econ. Stat. 1999, 61, 653–670. [Google Scholar] [CrossRef]
- Ahmed, N.; Sheikh, A.A.; Hamid, Z.; Senkus, P.; Borda, R.C.; Wysokińska-Senkus, A.; Glabiszewski, W. Exploring the Causal Relationship among Green Taxes, Energy Intensity, and Energy Consumption in Nordic Countries: Dumitrescu and Hurlin Causality Approach. Energies 2022, 15, 5199. [Google Scholar] [CrossRef]
- Irani, F.; Athari, S.A.; Hadood, A.A.A. The impacts of country risk, global economic policy uncertainty, and macroeconomic factors on the Turkish tourism industry. Int. J. Hosp. Tour. Adm. 2022, 23, 1242–1265. [Google Scholar] [CrossRef]
- Kondoz, M.; Kirikkaleli, D.; Athari, S.A. Time-frequency dependencies of financial and economic risks in South American countries. Q. Rev. Econ. Finance 2020, 79, 170–181. [Google Scholar] [CrossRef]
- Karavias, Y.; Tzavalis, E. Testing for unit roots in short panels allowing for a structural break. Comput. Stat. Data Anal. 2014, 76, 391–407. [Google Scholar] [CrossRef]
- Dumitrescu, E.-I.; Hurlin, C. Testing for Granger non-causality in heterogeneous panels. Econ. Model. 2012, 29, 1450–1460. [Google Scholar] [CrossRef] [Green Version]
- Ozturk, I.; Acaravci, A. The long-run and causal analysis of energy, growth, openness and financial development on carbon emissions in Turkey. Energy Econ. 2013, 36, 262–267. [Google Scholar] [CrossRef]
- Dogan, E.; Seker, F. The influence of real output, renewable and non-renewable energy, trade and financial devel-opment on carbon emissions in the top renewable energy countries. Renew. Sustain. Energy Rev. 2016, 60, 1074–1085. [Google Scholar] [CrossRef]
- Salahodjaev, R.; Isaeva, A. Post-Soviet states and CO2 emissions: The role of foreign direct investment. Post-Communist Econ. 2021, 34, 944–965. [Google Scholar] [CrossRef]
- Hao, Y.; Liu, Y.-M. Has the development of FDI and foreign trade contributed to China’s CO2 emissions? An empirical study with provincial panel data. Nat. Hazards 2014, 76, 1079–1091. [Google Scholar] [CrossRef]
- Blanco, L.; Gonzalez, F.; Ruiz, I. The Impact of FDI on CO2 Emissions in Latin America. Oxf. Dev. Stud. 2013, 41, 104–121. [Google Scholar] [CrossRef] [Green Version]
- Baloch, M.A.; Mahmood, N.; Zhang, J.W. Effect of natural resources, renewable energy and economic development on CO2 emissions in BRICS countries. Sci. Total Environ. 2019, 678, 632–638. [Google Scholar] [CrossRef]
- Kumar, S.; Managi, S. Energy price-induced and exogenous technological change: Assessing the economic and en-vironmental outcomes. Resour. Energy Econ. 2009, 31, 334–353. [Google Scholar] [CrossRef]
- Gu, G.; Wang, Z. Research on global carbon abatement driven by R&D investment in the context of INDCs. Energy 2018, 148, 662–675. [Google Scholar] [CrossRef]
Figure 1.
Pretest analysis: time series of the variables between 1995 and 2015.


Figure 2.
Researchers engaged in R&D in 2015 (per million population).

Figure 3.
Graphical results of the study.


Table 1.
Summary statistics.
| Variable | Indicator | Source | Mean | Std. Dev. | Min | Max |
|---|---|---|---|---|---|---|
| CO2 | CO2 emissions (metric tons per capita) | World Development Indicators (WDI) | 8.61 | 3.99 | 2.54 | 21.29 |
| RRD | Researchers in R&D (per million people) | World Development Indicators (WDI) | 2685.72 | 1447.22 | 213.58 | 7013.49 |
| FDI | Foreign direct investment, net inflows (% of GDP) | World Development Indicators (WDI) | 5.48 | 9.13 | −15.84 | 86.59 |
| GDP pc | GDP per capita (constant 2010 US$) | World Development Indicators (WDI) | 25,840.96 | 15,655.76 | 1332.41 | 65,432.75 |
| RE | Renewable energy consumption (% of total final energy consumption) | World Development Indicators (WDI) | 10.85 | 8.78 | 0.33 | 40.37 |
| POPG | Population growth (annual %) | World Development Indicators (WDI) | 0.39 | 0.87 | −2.26 | 5.32 |
Table 2.
Panel unit root test results.
| Form | Variable | Test | ||||
|---|---|---|---|---|---|---|
| LLC | Breitung | IPS | ADF Fisher | PP Fisher | ||
| Level | ln CO2 | 1.2358 | 2.5056 | 4.0181 | 45.9329 | 34.7407 |
| (0.8917) | (0.9939) | (1.0000) | (0.7101) | (0.9685) | ||
| First-difference | Δln CO2 | −8.1625 *** | −10.146 *** | −10.2910 *** | 229.0940 *** | 487.9605 *** |
| (0.0000) | (0.0000) | (0.0000) | (0.0000) | (0.0000) | ||
| Level | ln RRD | −3.0719 *** | 7.7004 | 3.0491 | 59.9960 | 49.9982 |
| (0.0011) | (1.0000) | (0.9989) | (0.2085) | (0.5530) | ||
| First-difference | Δln RRD | −8.6075 *** | −8.9015 *** | −9.8892 *** | 208.9463 *** | 351.0317 *** |
| (0.0000) | (0.0000) | (0.0000) | (0.0000) | (0.0000) | ||
| Level | ln GDP pc | −2.5543 | 8.9488 | −0.6820 | 44.0777 | 76.2989 |
| (0.0053) | (1.0000) | (0.2476) | (0.7746) | (0.0157) | ||
| First-difference | Δln GDP pc | −7.8853 *** | −8.0403 *** | −6.7039 *** | 175.9595 *** | 204.6046 *** |
| (0.0000) | (0.0000) | (0.0000) | (0.0000) | (0.0000) | ||
| Level | ln FDI | −6.1026 *** | −7.1488 *** | −5.9123 *** | 133.3009 *** | 158.4418 *** |
| (0.0000) | (0.0000) | (0.0000) | (0.0001) | (0.0000) | ||
| First-difference | Δln FDI | −13.237 *** | −14.465 *** | −11.8957 *** | 337.4060 *** | 617.9227 *** |
| (0.0000) | (0.0000) | (0.0000) | (0.0000) | (0.0000) | ||
| Level | ln RE | 0.2612 | 7.6633 | 5.4611 | 20.7966 | 31.0526 |
| (0.6030) | (1.0000) | (1.0000) | (1.0000) | (0.9907) | ||
| First-difference | Δln RE | −7.2622 *** | −9.5504 *** | −10.2925 *** | 226.8364 *** | 452.8732 *** |
| (0.0000) | (0.0000) | (0.0000) | (0.0000) | (0.0000) | ||
| Level | ln POPG | −8.1323 *** | 0.4863 | −1.5792 ** | 161.9481 *** | 106.7020 *** |
| (0.0000) | (0.6866) | (0.0571) | (0.0000) | (0.0000) | ||
| First-difference | Δln POPG | −7.7530 *** | −8.4494 *** | −6.7115 *** | 262.6809 *** | 343.1562 *** |
| (0.0000) | (0.0000) | (0.0000) | (0.0000) | (0.0000) | ||
Note: *** and ** indicate significance at the 1% and 5% levels, respectively. The figures in parentheses are p-values.
Table 3.
Karavias and Tzavalis’ panel unit root test with structural breaks.
| Variables | Intercept | Linear Trend |
|---|---|---|
| ln CO2 | −3.9318 *** | −0.8835 |
| Δln CO2 | −17.7569 *** | −9.6421 *** |
| ln RRD | −7.7910 *** | −0.2121 |
| Δln RRD | −18.4935 *** | −9.1178 *** |
| ln GDP pc | −10.2388 *** | 2.1072 |
| Δln GDP pc | −12.1393 *** | −5.0840 *** |
| ln FDI | −10.4964 *** | −6.0351 *** |
| Δln FDI | −5.0840 *** | −10.4964 *** |
| ln RE | −2.9500 *** | 0.2949 |
| Δln RE | −20.1432 *** | −12.5214 *** |
| ln POPG | −18.1378 *** | −7.8630 *** |
| Δln POPG | −25.8440 *** | −14.6723 *** |
Note: *** indicates significance at the 1% levels, respectively.
Table 4.
Pedroni’s panel cointegration.
| Test Statistic | Score |
|---|---|
| V-stat | −2.73 ** |
| Panel rho-stat | 1.221 |
| Panel PP-stat | −8.909 *** |
| Panel ADF-stat | −0.9854 |
| Group rho stat | 2.954 *** |
| Group PP stat | −10.67 *** |
| Group ADF stat | 0.8447 |
| Kao’s ADF | −12.9579 *** |
| Variance ratio | 2.6777 *** |
Note: *** and ** indicate significance at the 1% and 5% levels, respectively.
Table 5.
Long-term elasticities.
| FMOLS | |
|---|---|
| Δ ln RRD | −0.08 *** |
| (−5.64) | |
| Δ ln GDP pc | 0.54 *** |
| (35.75) | |
| Δ ln FDI | 0.05 *** |
| (4.19) | |
| Δ ln RE | −0.24 *** |
| (−32.59) | |
| Δ ln POPG | −0.02 |
| 0.09 |
Note: *** indicates significance at the 1% levels, respectively. Figures in parentheses are t-statistics.
Table 6.
Dumitrescu and Hurlin’s noncausality test.
| Null Hypothesis: CO2 Causalities | W-Stat | Zbar-Stat (p-Value) | Optimal Number of Lags (AIC) |
|---|---|---|---|
| RRD does not cause CO2 | 1.0557 | 0.2010 (0.8407) | 1 |
| CO2 does not cause RRD | 0.9161 | −0.3025 (0.7623) | 1 |
| GDP pc does not cause CO2 | 2.4879 | 5.3649 *** (0.0000) | 1 |
| CO2 does not cause GDP pc | 1.0299 | 0.1077 (0.9143) | 1 |
| FDI does not cause CO2 | 1.7056 | 2.5442 ** (0.0110) | 1 |
| CO2 does not cause FDI | 6.7268 | 4.9158 *** (0.0000) | 4 |
| RE does not cause CO2 | 7.8991 | 7.0291 *** (0.0000) | 4 |
| CO2 does not cause RE | 4.2206 | 5.6614 *** (0.0000) | 2 |
| POPG does not cause CO2 | 1.1809 | 0.6522 (0.5143) | 1 |
| CO2 does not cause POPG | 10.2530 | 11.2727 *** (0.0000) | 4 |
Note *** and ** indicate significance at the 1% and 5% levels, respectively. Figures in parentheses are p-values.
Publisher’s Note: MDPI stays neutral with regard to jurisdictional claims in published maps and institutional affiliations. |
© 2022 by the authors. Licensee MDPI, Basel, Switzerland. This article is an open access article distributed under the terms and conditions of the Creative Commons Attribution (CC BY) license (https://creativecommons.org/licenses/by/4.0/).
Share and Cite
MDPI and ACS Style
Mentel, G.; Tarczyński, W.; Azadi, H.; Abdurakmanov, K.; Zakirova, E.; Salahodjaev, R. R&D Human Capital, Renewable Energy and CO2 Emissions: Evidence from 26 Countries. Energies 2022, 15, 9205. https://doi.org/10.3390/en15239205
AMA Style
Mentel G, Tarczyński W, Azadi H, Abdurakmanov K, Zakirova E, Salahodjaev R. R&D Human Capital, Renewable Energy and CO2 Emissions: Evidence from 26 Countries. Energies. 2022; 15(23):9205. https://doi.org/10.3390/en15239205
Chicago/Turabian StyleMentel, Grzegorz, Waldemar Tarczyński, Hossein Azadi, Kalandar Abdurakmanov, Elina Zakirova, and Raufhon Salahodjaev. 2022. "R&D Human Capital, Renewable Energy and CO2 Emissions: Evidence from 26 Countries" Energies 15, no. 23: 9205. https://doi.org/10.3390/en15239205
Note that from the first issue of 2016, this journal uses article numbers instead of page numbers. See further details here.