Article

TADA: A Transferable Domain-Adversarial Training for Smart Grid Intrusion Detection Based on Ensemble Divergence Metrics and Spatiotemporal Features

1
Department of Electrical and Computer Engineering (ECE), Concordia University, Montréal, QC H3G 1M8, Canada
2
Concordia Institute for Information Systems Engineering (CIISE), Concordia University, Montréal, QC H3G 1M8, Canada
3
Ericsson GAIA Montréal, AI hub Canada, Montréal, QC H4S 0B6, Canada
4
Department of Computer Science and Software Engineering (CSSE), Concordia University, Montréal, QC H3G 1M8, Canada
*
Author to whom correspondence should be addressed.
Energies 2022, 15(23), 8778; https://doi.org/10.3390/en15238778
Submission received: 6 October 2022 / Revised: 10 November 2022 / Accepted: 18 November 2022 / Published: 22 November 2022
(This article belongs to the Special Issue Volume II: Situation Awareness for Smart Distribution Systems)

Abstract

:
For attack detection in the smart grid, transfer learning is a promising solution to tackle data distribution divergence and maintain performance when facing system and attack variations. However, there are still two challenges when introducing transfer learning into intrusion detection: when to apply transfer learning and how to extract effective features during transfer learning. To address these two challenges, this paper proposes a transferability analysis and domain-adversarial training (TADA) framework. The framework first leverages various data distribution divergence metrics to predict the accuracy drop of a trained model and decides whether one should trigger transfer learning to retain performance. Then, a domain-adversarial training model with CNN and LSTM is developed to extract the spatiotemporal domain-invariant features to reduce distribution divergence and improve detection performance. The TADA framework is evaluated in extensive experiments where false data injection (FDI) attacks are injected at different times and locations. Experiments results show that the framework has high accuracy in accuracy drop prediction, with an RMSE lower than 1.79%. Compared to the state-of-the-art models, TADA demonstrates the highest detection accuracy, achieving an average accuracy of 95.58%. Moreover, the robustness of the framework is validated under different attack data percentages, with an average F1-score of 92.02%.

1. Introduction

As one of the national cyberphysical systems (CPS) infrastructures, the smart grid provides efficient, secure, and sustainable electricity in an increasingly power-demanding society. The application of sensing, communications, and distributed computing empowers the smart grid in monitoring and controlling; however, it renders the smart grid exposed to various cyberattacks and increases its vulnerability [1]. As reported in recent studies, cyberattacks on critical infrastructures could have severe social, economic, and physical impacts [2,3]. To address the importance of cybersecurity situation awareness in power systems, various machine learning (ML) detection mechanisms have been exploited extensively and demonstrated high accuracy and efficient computation in attack detection [4,5,6], such as k-nearest neighbors (kNN) and support vector machine (SVM).
Many ML-based attack detection models assume that the training and testing data are in the same space and have the same or similar independent distributions [7]. However, this assumption is unlikely to hold in most real-world CPS scenarios because of system dynamics and attack changes. For instance, in power systems, the system load demand is continuously changing, and the system topology may also be altered by normal operations. Meanwhile, the same-scheme attacks may happen at different times and target different buses, and new-scheme attacks are emerging as well. These variations will alter the data distribution and cause a well-trained ML detection model to perform poorly on a new dataset. Moreover, labeled attack data are extremely rare compared to labeled normal data in real-world power systems. Models trained on insufficient data are fragile, and a small change of the attack data distribution may cause a significant drop of detection accuracy.
Transfer learning (TL) is hence proposed to help solve these problems. This technique enables models to transfer the knowledge learned from a labeled domain to another unseen domain with distribution divergence [8]. Over the last few years, TL has shown remarkable achievements in image identification and semantic parsing tasks [9]. Recently, TL has also been introduced into highly dynamic CPS scenarios to enhance cybersecurity situation awareness [10]. However, these works have not considered a problem that might be referred to as transferability: when will a model suffer a severe performance drop and should TL be applied?
Meanwhile, there is another question to consider during TL: how to extract the internal spatial and temporal features of CPS data effectively to improve detection performance? This is because the spatiotemporal features have been proven to help discriminate attacks from normal data [11]. For instance, on the spatial side, the smart grid can be regarded as an image. To launch false data injection (FDI) attacks on a particular bus, measurements of several specific buses need to be manipulated simultaneously according to the physical topology [12]. Thus, exploiting these spatial correlations of measurement data is crucial for intrusion detection systems (IDS). Moreover, the temporal feature can be extracted from the measurement flow over a continuous period to enhance the detection of well-constructed attacks, such as FDI [13].
To tackle these two challenges, this work proposes a transferability analysis and domain-adversarial training (TADA) framework to mitigate the impact of distribution divergence and improve detection performance. The proposed framework has two steps. The first step is to leverage selected data divergence metrics and regression models to predict a detection accuracy drop and identify the tasks calling for TL. Then, the framework applies parallel long short-term memory (LSTM) networks and convolutional neural networks (CNN) to extract spatiotemporal features, and employ domain-adversarial training to reduce distribution divergence between two domains and enhance attack detection performance.
To evaluate the proposed framework, this work first obtains the 7-year load demand of ISO New England [14], then uses the load demand to generate multivariate time series data on the IEEE 30-bus system. The stealthy FDI attacks [12] are injected at different times and on different buses to generate attack data. With the synthesized datasets, the proposed framework is evaluated and compared to state-of-the-art ML models. The experiment results demonstrate that the TADA framework has high accuracy in accuracy drop prediction based on distribution divergence and can significantly improve attack detection performance by extracting spatiotemporal domain-invariant features against divergence from both temporal and spatial dimensions. The main contributions of this work are summarized as follows:
1.
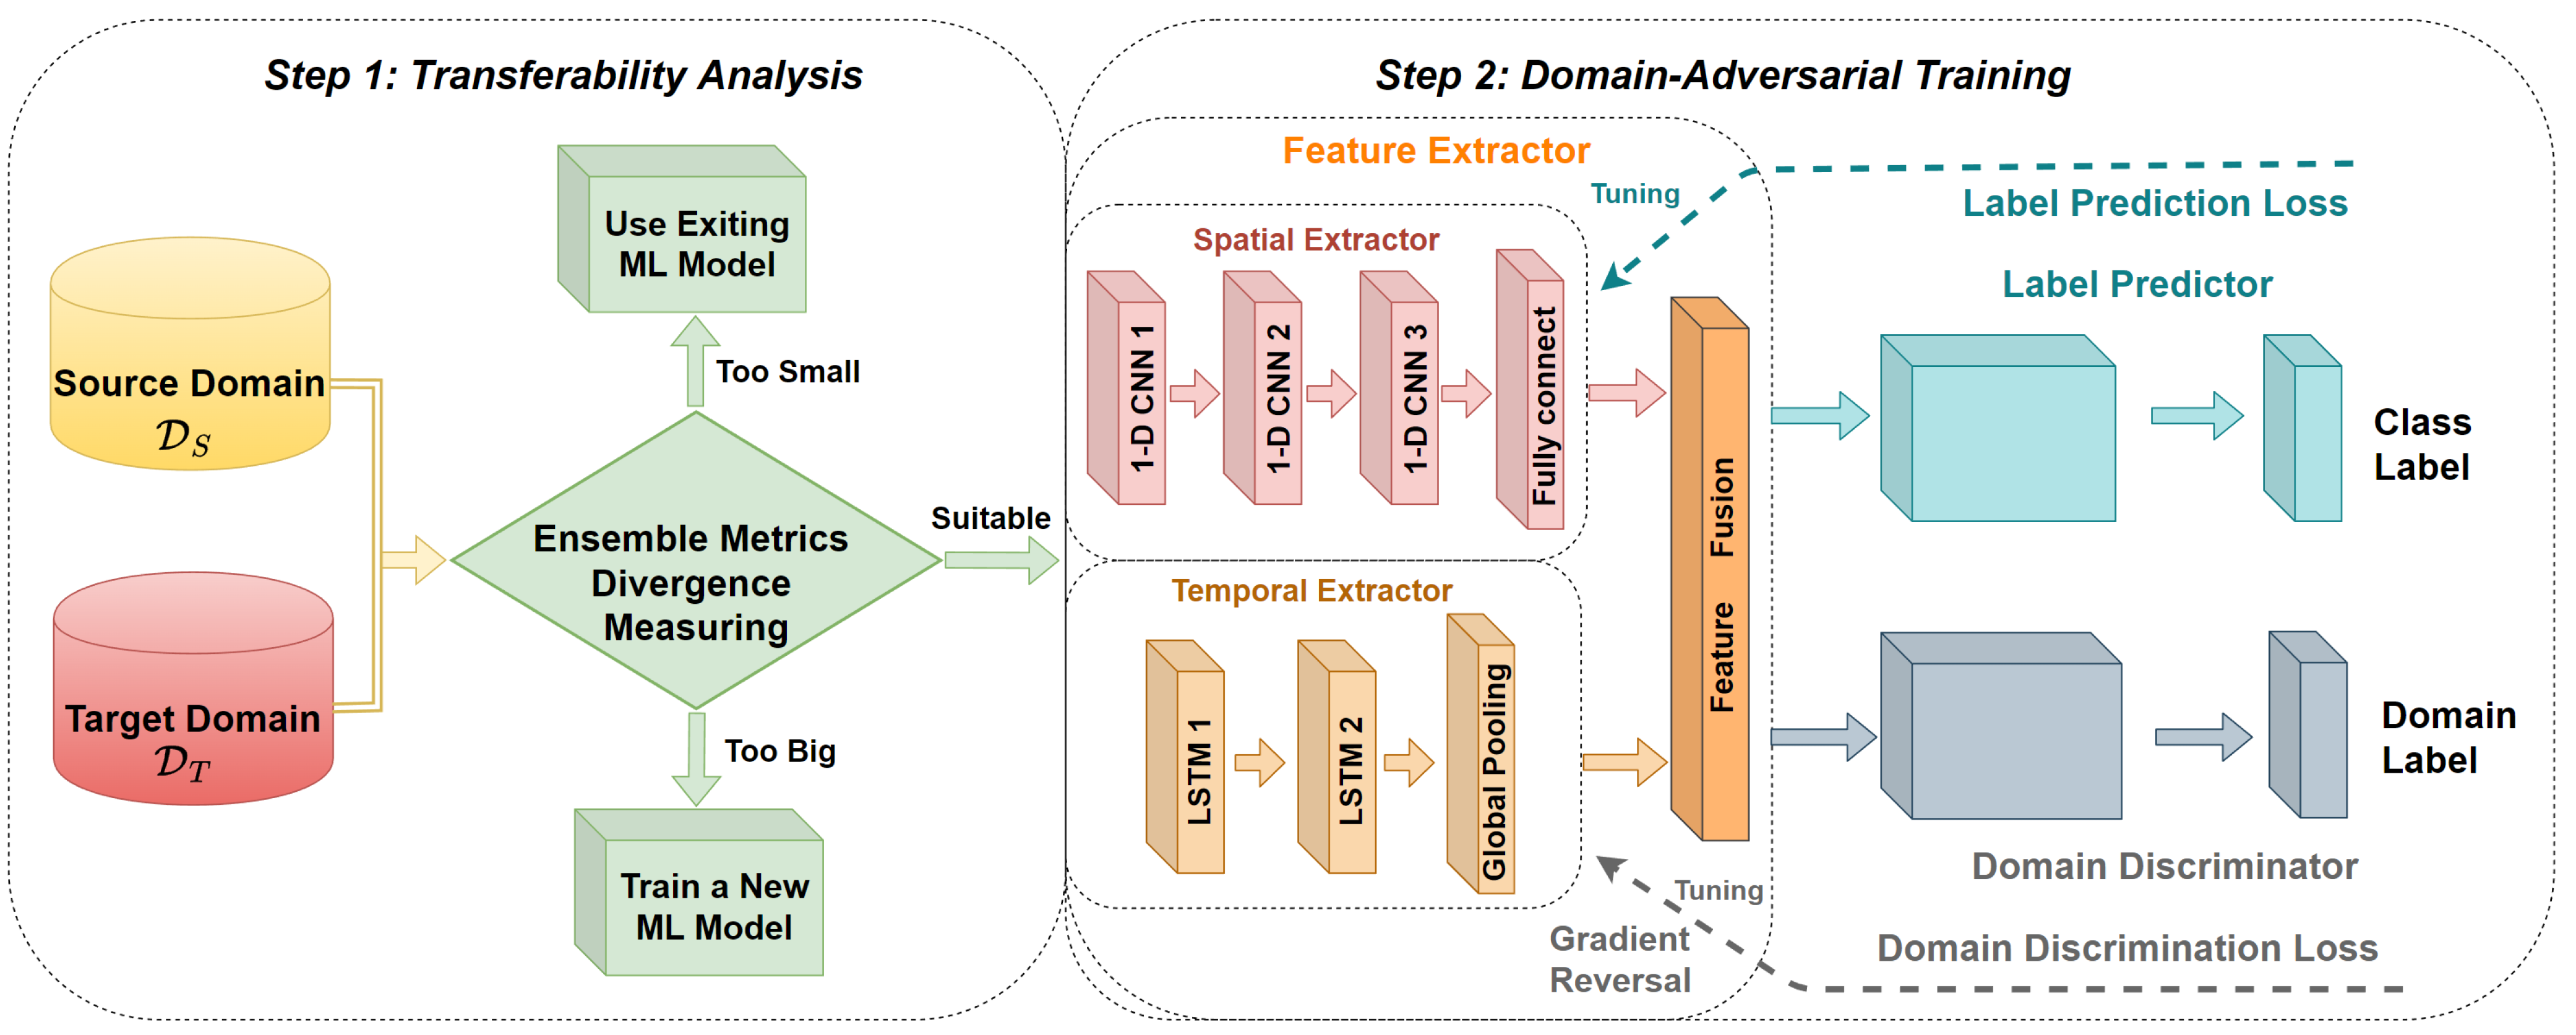
This work proposes a two-stage transfer learning framework, including a transferability analysis and spatiotemporal domain-adversarial training, which leverages a CNN and LSTM along with domain-adversarial training to extract spatiotemporal domain-invariant features and enhance attack detection performance.
2.
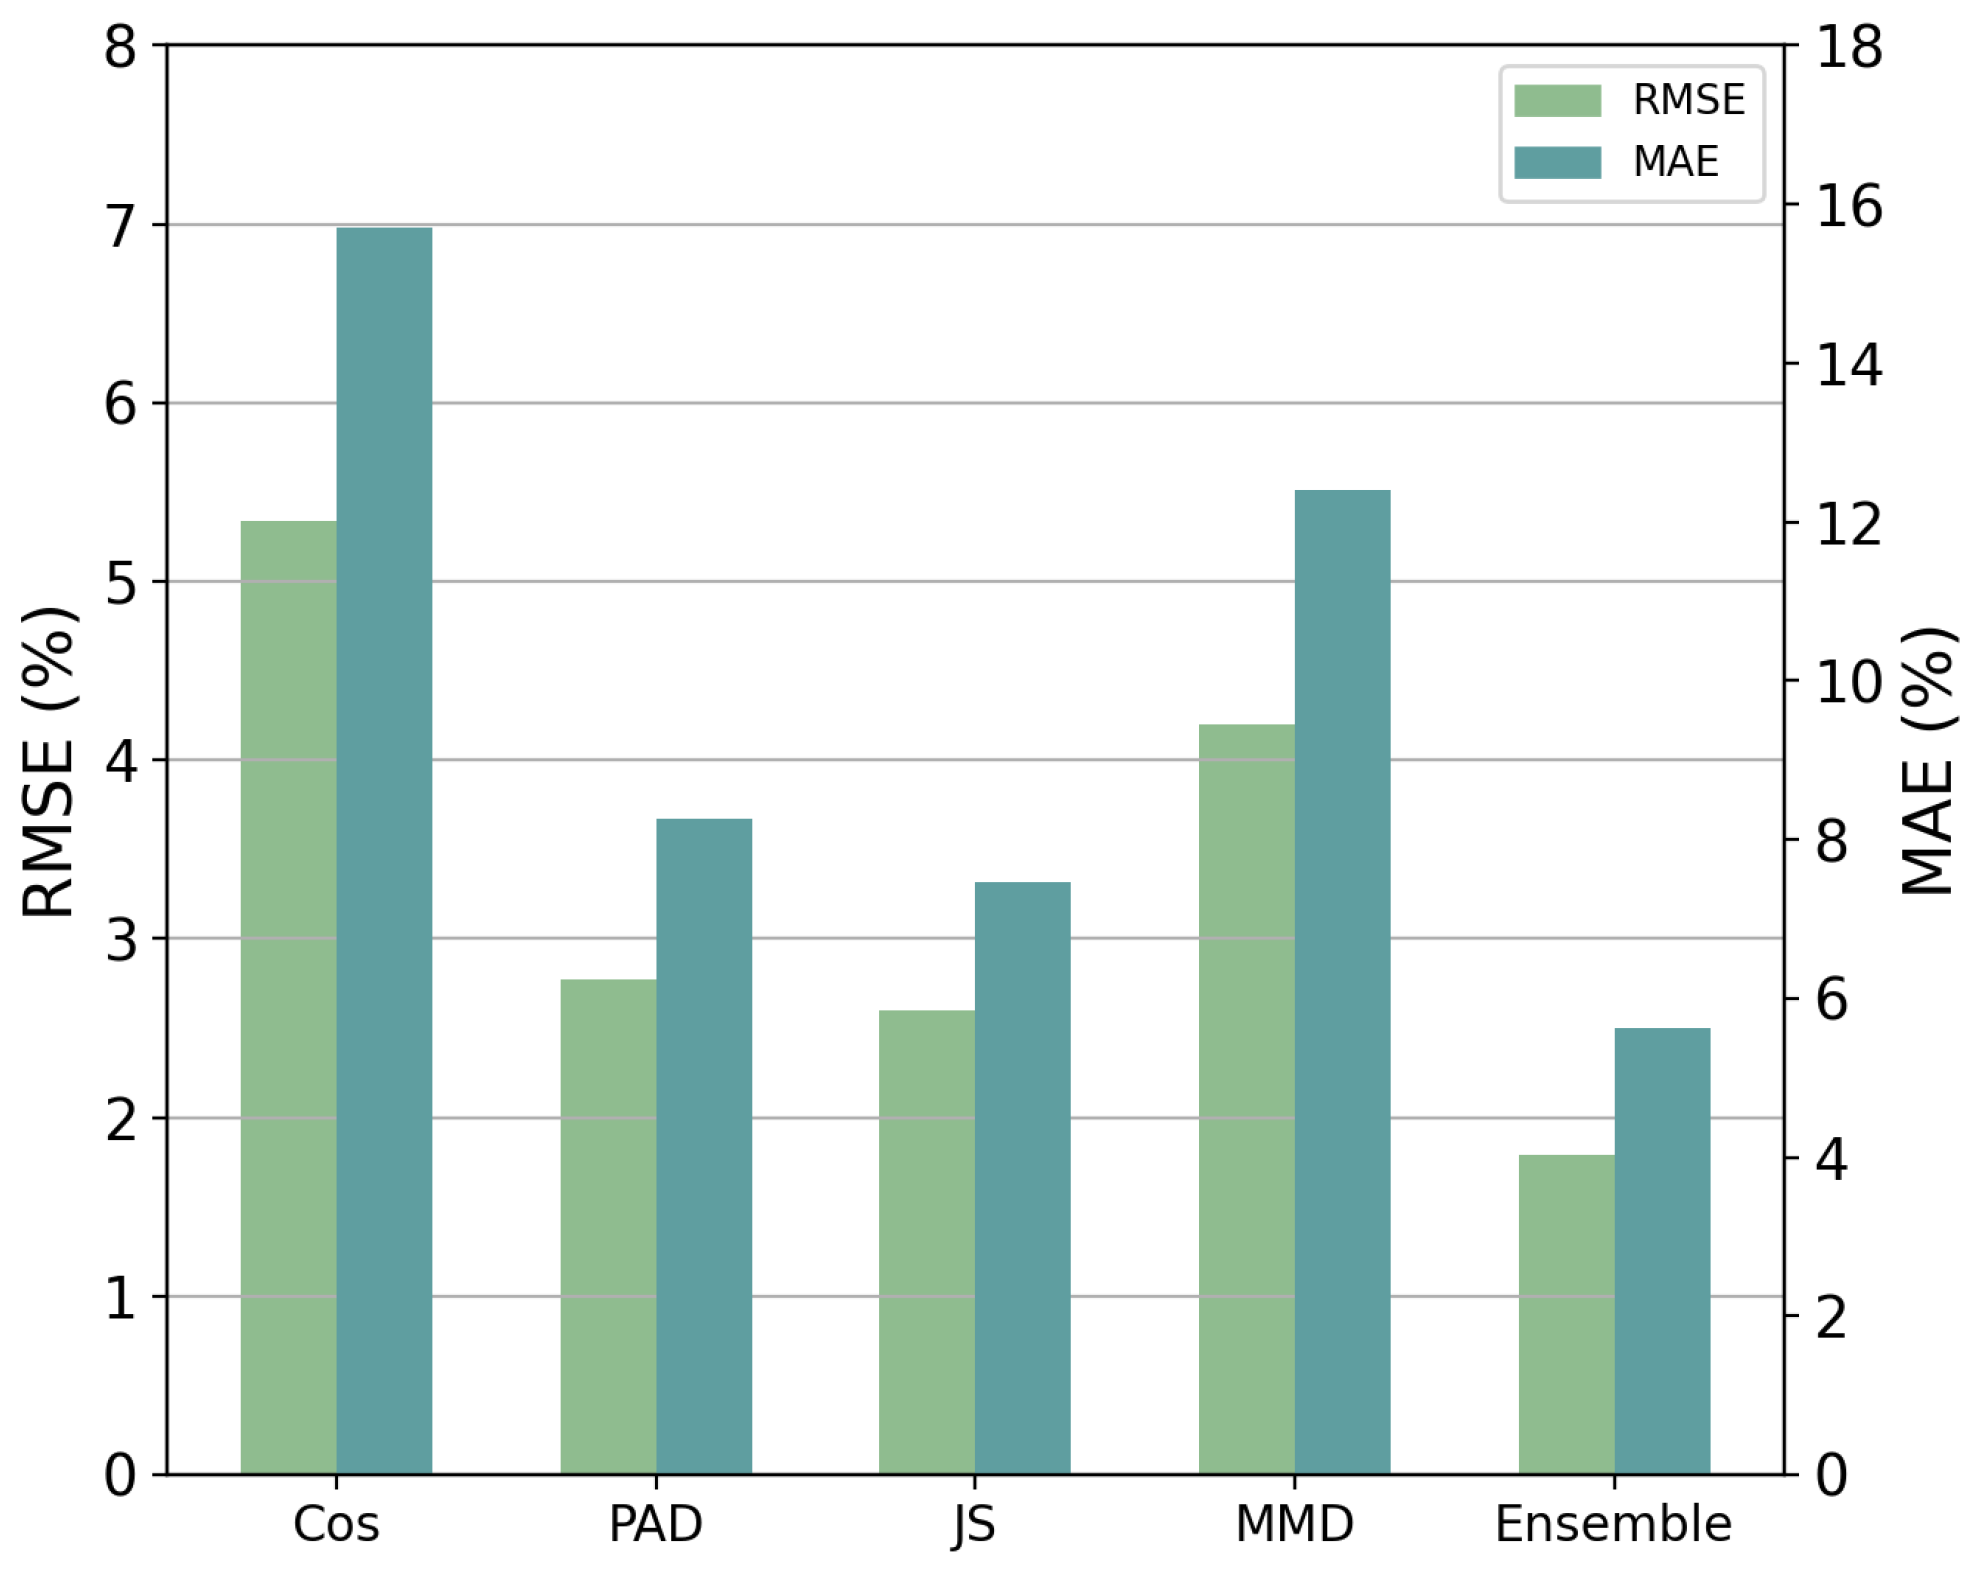
This work proposes an ensemble method that combines different types of metrics to capture multiple data distribution information, predict accuracy drop, and justify the need for TL in cybersecurity situation awareness.
The rest of this paper is structured as follows. Section 2 reviews the related work about transferability analysis, spatiotemporal features extraction in IDS, and domain-adversarial training in IDS. Section 3 illustrates the proposed framework. Section 4 introduces the setup of the experiment. Section 5 discusses the experimental results and analysis. Section 6 draws conclusions and presents future work.

2. Related Work

2.1. Transferability Analysis

The goal of transferability analysis is to analyze whether a trained model will degrade significantly and thus require TL. Meila and Fort et al. [15,16] showed that the performance degradation of a trained mode was related to data distribution divergence between two domains. Thus, the data distribution divergence measurement plays a crucial role in predicting performance drop and triggering TL. Given its importance, researchers have invested much effort in leveraging metrics to evaluate distribution divergence. Elsahar et al. [17] used probability-related metrics and the H-divergence to predict the accuracy drop of natural language processing (NLP) models. Deng et al. [18] leveraged the Fréchet distance to predict the model accuracy for computer vision (CV) tasks. However, these works did not consider using the accuracy drop to decide whether TL should be applied to maintain acceptable accuracy.
Therefore, our previous paper [19] selected three commonly used metrics and evaluated each of them for predicting the accuracy drop and determining when to apply TL. However, that paper used each metric in isolation and did not consider combining different metrics to extract complementary distribution information. Different types of metrics can look at the datasets from different angles [20]. Ruder et al. [21] proved the importance of combining different metrics for measuring divergence, since each metric may only cover limited aspects of the data distribution information. Instead of using individual metrics in isolation, this paper systematically analyzes the divergence metrics published in the literature, compares the distribution information obtained from different metrics, and proposes an ensemble method that combines all metrics to further improve prediction performance. Specifically, this work uses different types of metrics as the features to train a neural network regression model, then applies the regression model to predict the accuracy drop and identify the need for TL. Moreover, this paper also considers the spatial and temporal features of CPS data and extends the previous paper by customizing the feature extractor with CNN and LSTM to extract spatial and temporal features. Furthermore, different from the previous paper that used balanced datasets, this work also considers a wide range of attack data percentages to validate the robustness of the proposed framework.

2.2. Spatiotemporal Domain-Adversarial Training for IDS

In recent years, various ML approaches, such as pretraining [22], incremental learning [23], and lifelong learning [24], have been proposed to preserve and extend the knowledge learned from previous tasks to new tasks. Durairaj et al. [22] introduced pretraining into a deep belief network (DBN) to enhance the FDI and denial of service detection performance. Nakagawa et al. [23] proposed an online and unsupervised scheme based on incremental learning to detect attacks in smart home IoT networks. However, these schemes do not consider reducing the data distribution divergence that leads to a performance drop. Thus, these approaches cannot solve the data distribution divergence problem considered in this paper. Instead, in our work, we want to use TL techniques to decrease the data distribution divergence and enhance detection performance.
Domain-adversarial training is a subcategory of TL techniques that reduces domain divergence and improves model generalization by extracting domain-invariant features [25]. Ganin et al. [26] introduced adversarial training into TL and established a domain-adversarial neural network (DANN) to improve the generalization of the trained models. Zhang et al. [7,8] further extended the DANN with customized classifiers and proposed a semisupervised domain-adversarial training model to detect attacks in power systems. Wei et al. [27] propose a DANN-based IDS to detect in-vehicle network variant attacks. However, these domain-adversarial training works did not consider extracting effective spatial and temporal features of the CPS data to enhance the attack detection performance. Instead, this work introduces a CNN and LSTM into domain-adversarial training to learn spatial and temporal features to further improve intrusion detection performance. Specifically, a CNN is responsible for extracting spatial features of power system data, and LSTM is used to learn the temporal features of time series data.
Some studies also used deep learning to extract effective spatial and temporal features to enhance attack detection performance [28,29]. He et al. [30] proposed a conditional deep belief network (CDBN) to detect FDI with historical measurements. They used a CDBN to learn high-dimensional temporal features from sensor measurements and detect FDI attacks. The approach proposed by Wang et al. [31] first used CNN to extract low-level spatial features from the CPS data, then leveraged LSTM to extract high-level temporal features. Considering that adversarial examples may cause misclassification by a deep neural network (DNN), Hyun et al. [32,33,34] proposed robust adversarial examples schemes using classification scores and AdvGuard. However, their uses of deep learning only focused on informative feature extraction. They did not consider that the distribution of extracted features may have changed significantly and may degrade the detector’s performance since IDS operates in dynamic CPS environments. This work combines deep learning and domain-adversarial training to extract deep domain-invariant features. In this way, the distribution divergence decreases, and thus a trained model can maintain high performance under dynamic operating environments.
Inspired by the current works in transferability analysis and spatiotemporal domain-adversarial training in IDS, this work proposes a transferability analysis and domain-adversarial training (TADA) framework to detect attacks in the smart grid. The TADA framework first leverages transferability analysis to identify the tasks that require TL, then uses domain-adversarial training to extract the spatiotemporal domain-invariant features to improve the attack detection performance against distribution divergence.

3. Transferability Analysis and Domain-Adversarial Training

3.1. Problem Formulation

To elaborate on how the TADA framework addresses the aforementioned challenges, this work first defines several notations of TL. In TL, a domain D consists of a feature space X and a marginal probability distribution P(X). A task consists of a label space Y and an objective predictive function f ( · ) from X to Y [10]. The objective function f ( · ) also refers to conditional probability P ( Y | X ) from a probabilistic view, which is learned from the training data [8]. This paper focuses on unsupervised TL, where the source domain is labeled, i.e., D S = { ( x S 1 , y S 1 ) , . . . , ( x S n S , y S n S ) } , and the target domain is unlabeled, i.e., D T = { ( x T 1 ) , . . . , ( x T n T ) } , where x R T × C , T is the length of the time series, and C is the dimension of feature space. Unsupervised TL is a common situation in real power systems intrusion detection, as the IDS deployed in the smart grid needs to detect intrusions in real time, and the newly generated dataset is usually unlabeled.
This work assumes that source and target domains contain both normal and attack data, but the data distributions of the two domains are different. One case of data distribution divergence is considered in this paper, covariate divergence, where two domains have the same conditional distribution, i.e., P D S ( Y | X ) = P D T ( Y | X ) , but their feature distributions are different, i.e., P D S ( X ) P D T ( X ) . Covariate divergence is a common case in the smart grid because of system and attack variations. For instance, power system topology and load demand changes may lead to system variations, and the same attack can occur at different times and on different buses. Specifically, this work considers a spatiotemporal TL problem, where attackers target the power systems during different periods when load demand has changed and inject intrusions on different buses in the power grid.
To tackle the aforementioned problems, this work aims to build a deep TL model that has the ability to learn spatiotemporal domain-invariant features to mitigate the impact of data distribution divergence. The challenges are when to apply TL and how to extract effective informative spatiotemporal features for CPS data during TL, which are tackled by the proposed transferability analysis and domain-adversarial training (TADA) framework in Figure 1. The framework has two steps: (1) this work first selects one metric from each divergence measurement category, then trains a neural network regression model using all metrics to approximate the relationship between divergence and accuracy drop. Afterward, the regression model is applied to predict the accuracy drop on the unlabeled target domains and identify the need for TL; (2) the TL is trained once the predicted accuracy drop falls in the predefined range. Specifically, a domain-adversarial training model with a CNN and LSTM is applied to extract spatiotemporal domain-invariant features, reduce distribution divergence, and improve detection performance against attacks at different times and locations.

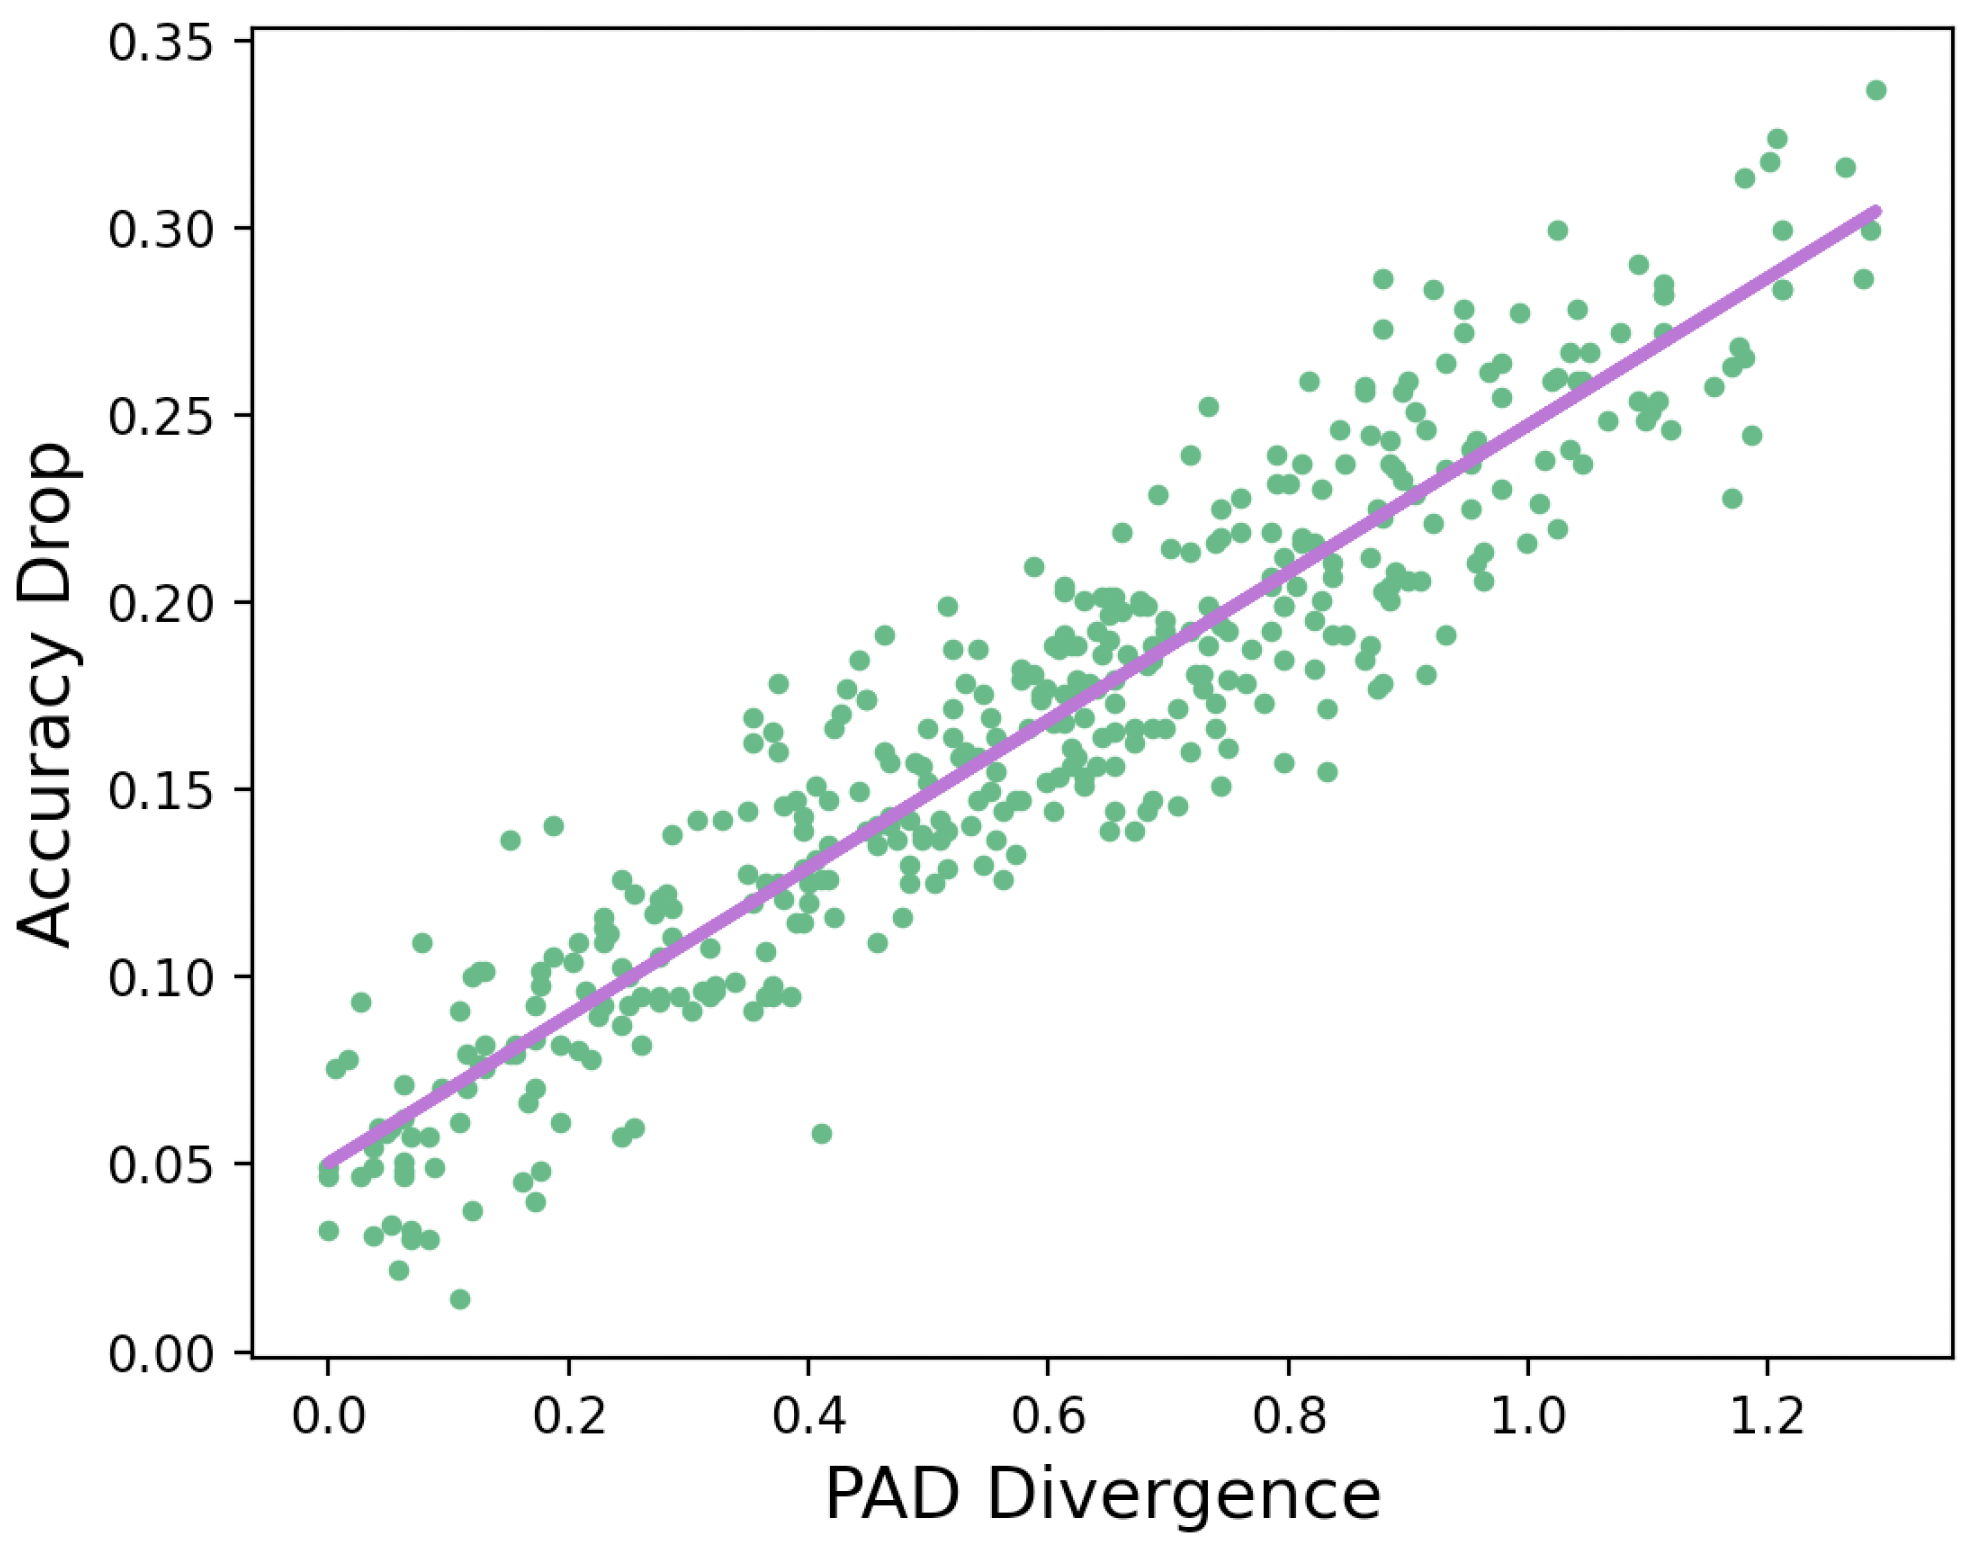
3.2. Ensemble Metrics Transferability Analysis

3.2.1. Distribution Divergence Metrics

This work systematically analyzed different divergence measurement metrics and classified them into four categories by comparing the information each metric provides [20,21]. Considering different categories of metrics can capture various and complementary distribution information, this work chose one metric from each category that was shown to have good divergence measurement and performance prediction ability:
Geometry-based Metrics: Geometry-based metrics, such as Euclidean distance and Manhattan distance [20], use the statistical descriptions of data distribution, such as mean and standard deviation, to capture the geometry-related information. This work chose the cosine similarity since it has demonstrated effectiveness in measuring similarity between two domains [35]. The cosine distance (Cos) is defined as 1 c o s i n e s i m i l a r i t y :
D C o s = 1 c o s ( m , n ) = 1 m · n m · n ,
where m ans n are two statistical vectors used to describe two distributions.
Domain-Discrimination-based Metrics: Domain-discrimination-based metrics look at datasets from the perspective of classifiers and train classifiers to extract the high-dimensional feature space information of the two distributions in a representation layer. The classifier is trained to discriminate the data domains between the source and target, and the divergence is characterized by the classification error. Among the available metrics, the proxy A -distance (PAD) [17] performs best in measuring divergence and predicting the performance drop in tasks such as part-of-speech tagging [20], and thus was picked in this paper:
P A D = 2 ( 1 2 ϵ G d ) ,
where ϵ G d denotes the classifier’s error on the target domain.
Mutual-Information-Based Metrics: Mutual-information-based metrics look at datasets from an information theory perspective and capture the probability information between two distributions by measuring the amount of information required to convert one distribution to the other, such as the Kullback–Leibler (KL) divergence [20] and cross-entropy [21]. This work chose the Jensen–Shannon (JS) divergence as it is a symmetric variance of the KL divergence and has been proved to be a reliable indicator for measuring domain similarity in tasks such as sentiment analysis [36].
D J S ( P | | Q ) = 1 2 D K L ( P | | M ) + 1 2 D K L ( Q | | M ) ,
where D K L ( P | | Q ) = p ( x ) l o g p ( x ) q ( x ) d x , M = 1 2 ( P + Q ) . p ( x ) and q ( x ) are probability density functions of two distributions.
Higher-Order-Moment-Based Metrics: Higher-order-moment-based metrics, such as correlation alignment (CORAL) [20] and central moment discrepancy (CMD) [37], capture the moment information between two distributions. Maximum mean discrepancy (MMD) was chosen in this work since it has been extensively adopted to measure the domain discrepancy in domain adaptation works [38]:
D M M D ( X | | Y ) = 1 n 1 i = 1 n 1 φ ( x i ) 1 n 2 j = 1 n 2 φ ( y j ) H ,
where φ ( x ) is a mapping which projects samples to the reproducing kernel Hilbert space (RKHS) [38].

3.2.2. Regression Models

Using the aforementioned metrics, this work measured the distribution divergence with labeled historical data in the source domain, then trained a neural network regression model with ensemble metrics:
Δ A c c = f e n s e m b l e ( d C o s , d P A D , d J S , d M M D ) ,
where f e n s e m b l e is a fully connected neural network with all selected metrics as the input.
This paper also trained a linear regression model for each single metric, and compared the ensemble metrics method to the single metric method for predicting the accuracy drop. The single metric method was defined as:
Δ A c c = w 1 d + w 0 ,
where Δ A c c denotes the accuracy drop, d is the measured divergence, and w 0 and w 1 denote the model parameters.
The regression models were leveraged to predict the accuracy drop based on the measured divergence for the unlabeled target domains. As shown in Step 1 of Figure 1, if the predicted drop is too small, the trained model can retain a good detection performance on the new target domain, so there is no need to apply TL since the improvement is trivial. Meanwhile, if the predicted drop is too large, the model will suffer severe performance degradation, and TL may not be able to improve the model to acceptable performance. It is recommended to train a new model since the divergence is beyond what TL can handle. If the predicted drop is neither too small that TL is unnecessary nor too large that is beyond transferable, TL will be leveraged to improve the detection accuracy. This paper mainly focuses on the last scenario, where the TL is necessarily triggered, and proposes an effective domain-adversarial training approach by considering spatiotemporal features in the smart grid.

3.3. Spatiotemporal Domain-Adversarial Training

The domain-adversarial training of the proposed framework aimed to extract the domain-invariant representations to reduce the divergence between source and target domains. In this way, the model trained on the labeled source domain could also generalize well to the unlabeled target domain. Our model built on a DANN [26], which consists of three networks, namely, a feature extractor, a label predictor, and a domain discriminator, as shown in Step 2 of Figure 1. Moreover, a gradient reversal layer (GRL) was added between the feature extractor and the domain discriminator to make the domain discriminator perform poorly. By training three networks simultaneously, the feature extractor tried to minimize the label predictor loss and maximize the domain discriminator loss, thereby extracting domain-invariant and label-discriminative features. The total loss function was constructed as:
L ( θ f , θ y , θ d ) = i = 1 m L y i ( θ f , θ y ) λ j = 1 n L d j ( θ f , θ d ) ,
where L y is the label predictor loss, L d is the domain discriminator loss, λ is the adaptation factor used to tune the trade-off between two network losses [26], and the minus sign indicates the adversarial training.
This work further customized the design of the feature extractor to extract the deep spatiotemporal features from CPS data. Motivated by the success of deep learning on CV and NLP tasks, the feature extractor in this work consisted of a CNN and LSTM to extract domain-invariant spatial and temporal features, as depicted in Figure 1. The CNNs were used to extract the cross-measurement correlation of CPS data since they can extract effective spatial features [28]. The LSTM networks, which are capable of learning long-term dependencies [13], worked on mining the context information of the sequential measurement flow. A parallel combination of three layers of CNNs and two layers of LSTM networks was adopted in this work because extensive experiments conducted by Zhang et al. [39] proved that this combination could extract effective spatiotemporal features. A feature fusion layer was leveraged to merge the extracted spatial and temporal features as spatiotemporal features, and feed them to the label predictor and domain discriminator.
Typically, the raw measurements from different smart meters at time index t are a one-dimensional (1-D) vector:
v t = [ m t 1 , m t 2 , . . . , m t C ] ,
where m t i is the reading of the ith measurement. For an observation period [ t , t + N ] , there is a measurement flow with N + 1 vectors, and each vector contains C measurements. To extract temporal features with LSTM, this work adopted a sliding window to divide measurement flow into individual segments. Each segment had a fixed length of time series vectors and was defined as:
s j = [ v t , v t + 1 , . . . , v t + T 1 ] T ,
where T is the fixed sliding window size, and s j denotes the jth segment fed into the feature extractor. Each segment was fed into the CNNs and LSTM networks in parallel.
The CNNs were responsible for learning spatial features. Following [29], this work employed three layers of 1-D CNNs to extract the spatial features of each vector in the segment s j :
r k = C o n v 1 D ( v k ) ,
where r k is the extracted spatial features corresponding to the measurement vector v k . To be comparable to the temporal features in terms of size, the extracted spatial features in the same segment were fed into a global average pooling (GAP) layer. The GAP can reduce the computational burden and avoid overfitting, thus enhancing the generality of spatial features. The final spatial features could be expressed as:
f s p a t i a l = G G A P ( r t , r t + 1 , . . . , r t + T 1 ) ,
where G G A P is the pooling layer. f s p a t i a l denotes a single vector representing the spatial features.
The LSTM networks were leveraged to extract the temporal features of multivariate time series measurements. Specifically, the LSTM networks had two LSTM layers, and each LSTM layer had T units since each segment contained T measurement vectors. Since this work was interested in segment-level intrusion detection, the output of the last unit in the second layer was selected to generate temporal features:
h t + T 1 2 = L S T M ( s j ) ,
where h t + T 1 2 is the output of the last unit in the second layer.
Then, a fully connected layer was added to improve temporal feature representation [39]:
f t e m p o r a l = G F C ( h t + T 1 2 ) ,
where G F C is the fully connected layer. f t e m p o r a l denotes a single vector representing the temporal features.
Finally, the spatial and temporal features extracted in parallel were merged as spatiotemporal features in the feature fusion layer:
f s p a t i o t e m p o r a l = [ f s p a t i a l , f t e m p o r a l ] .
Then, the spatiotemporal features were fed into the label predictor and domain discriminator for the domain-adversarial training. By training three networks simultaneously, the feature extractor could learn the domain-invariant and label-discriminative spatiotemporal features, thus improving the attack detection performance.

4. Experiments Setup

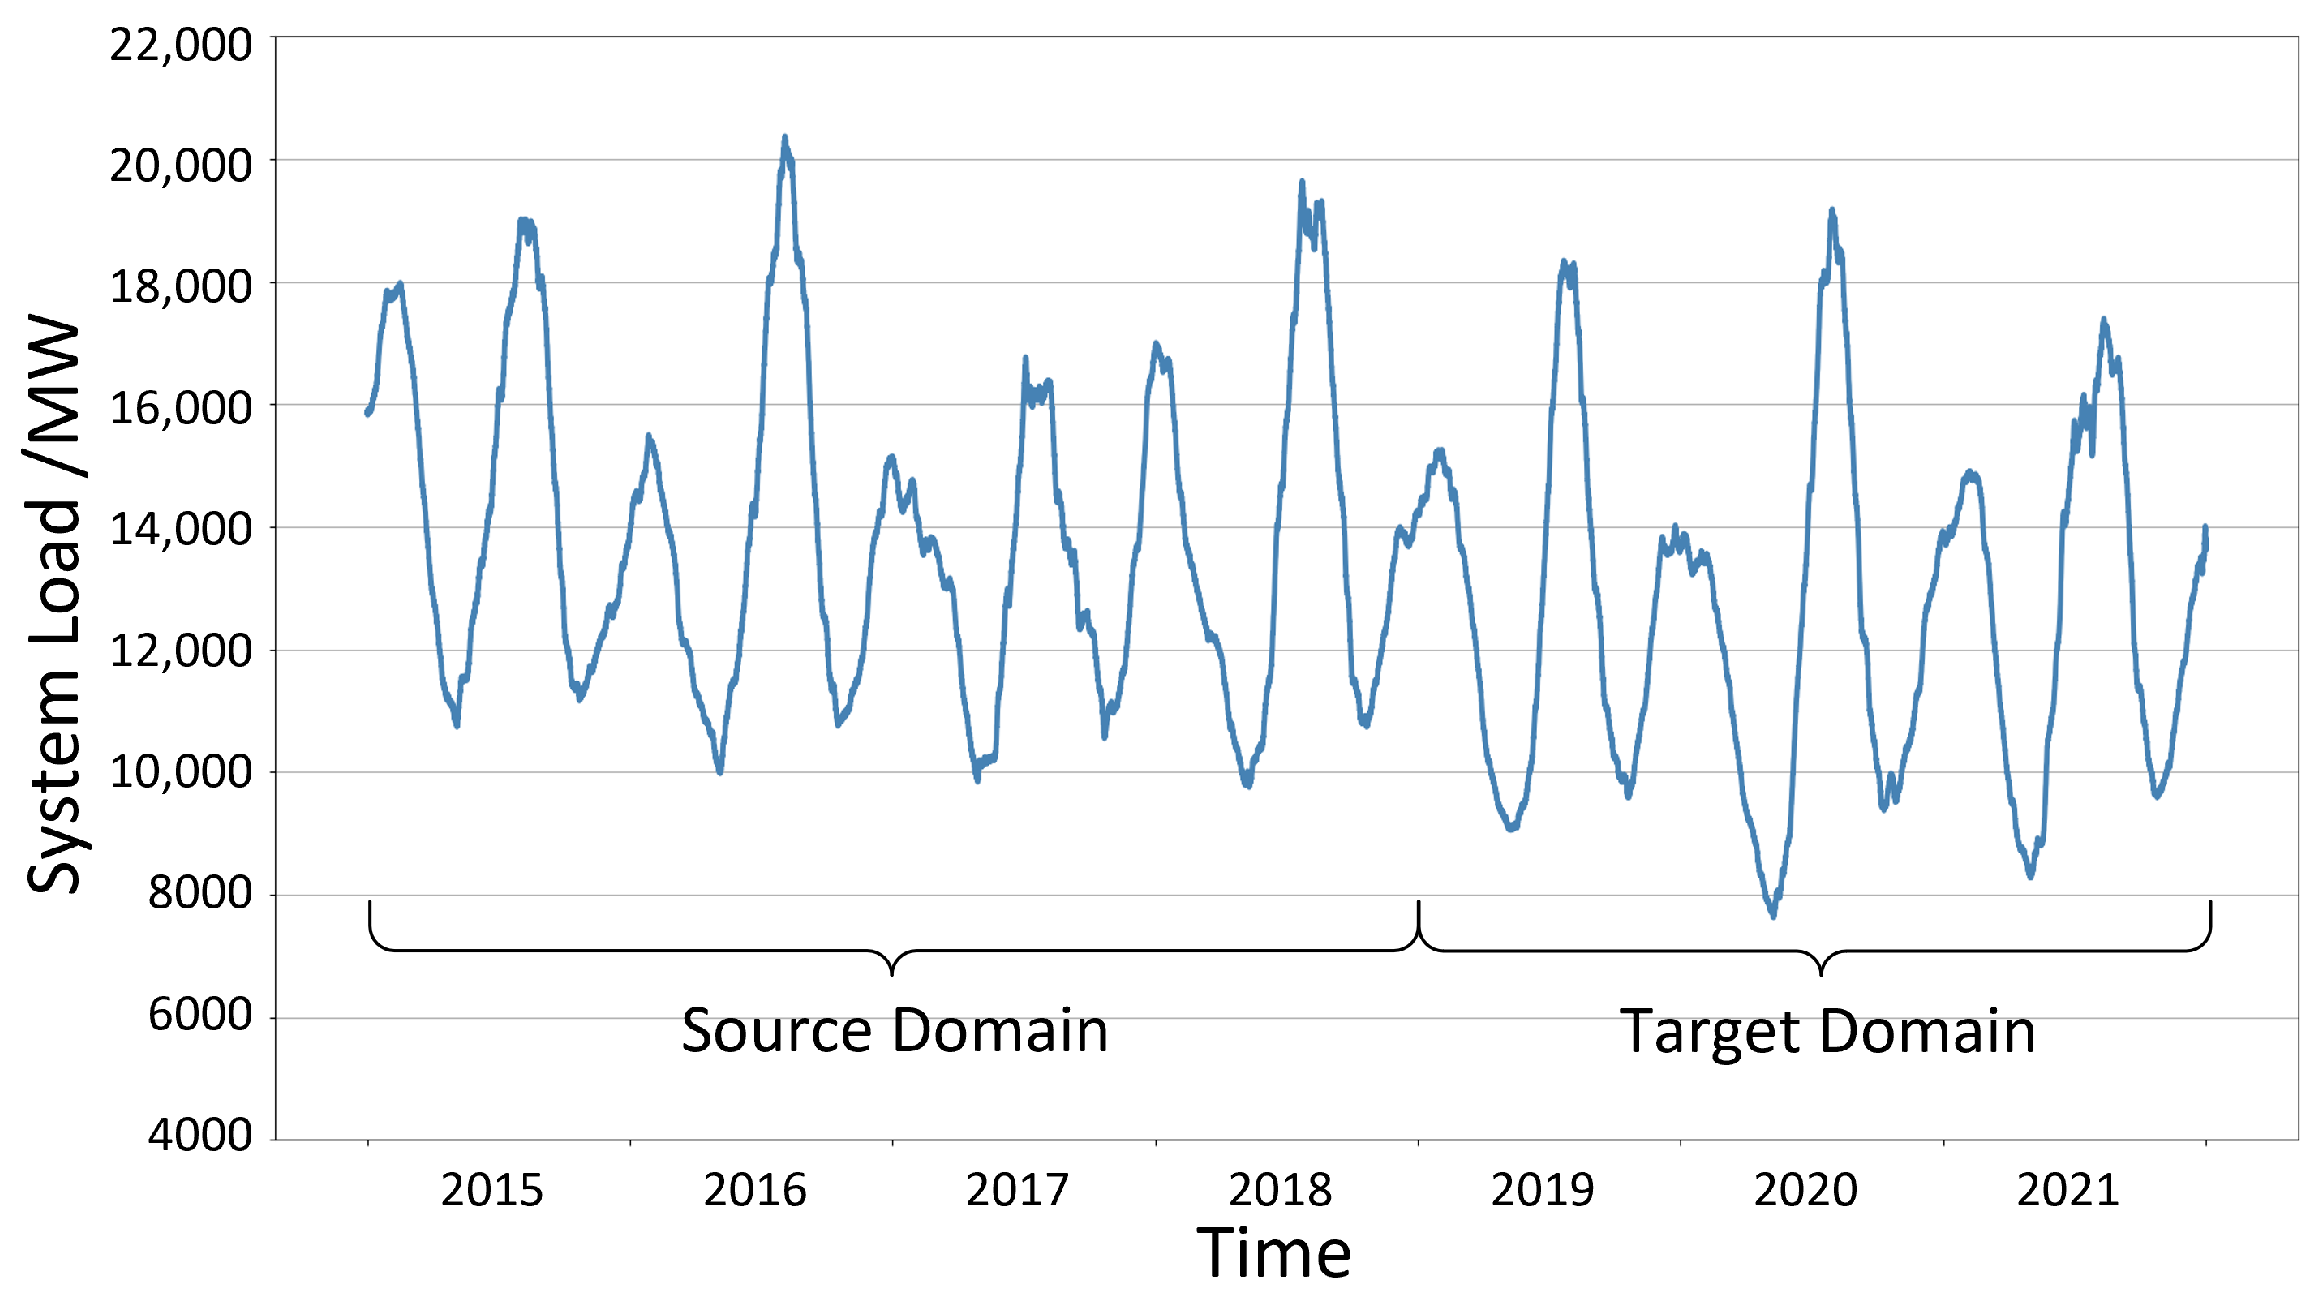
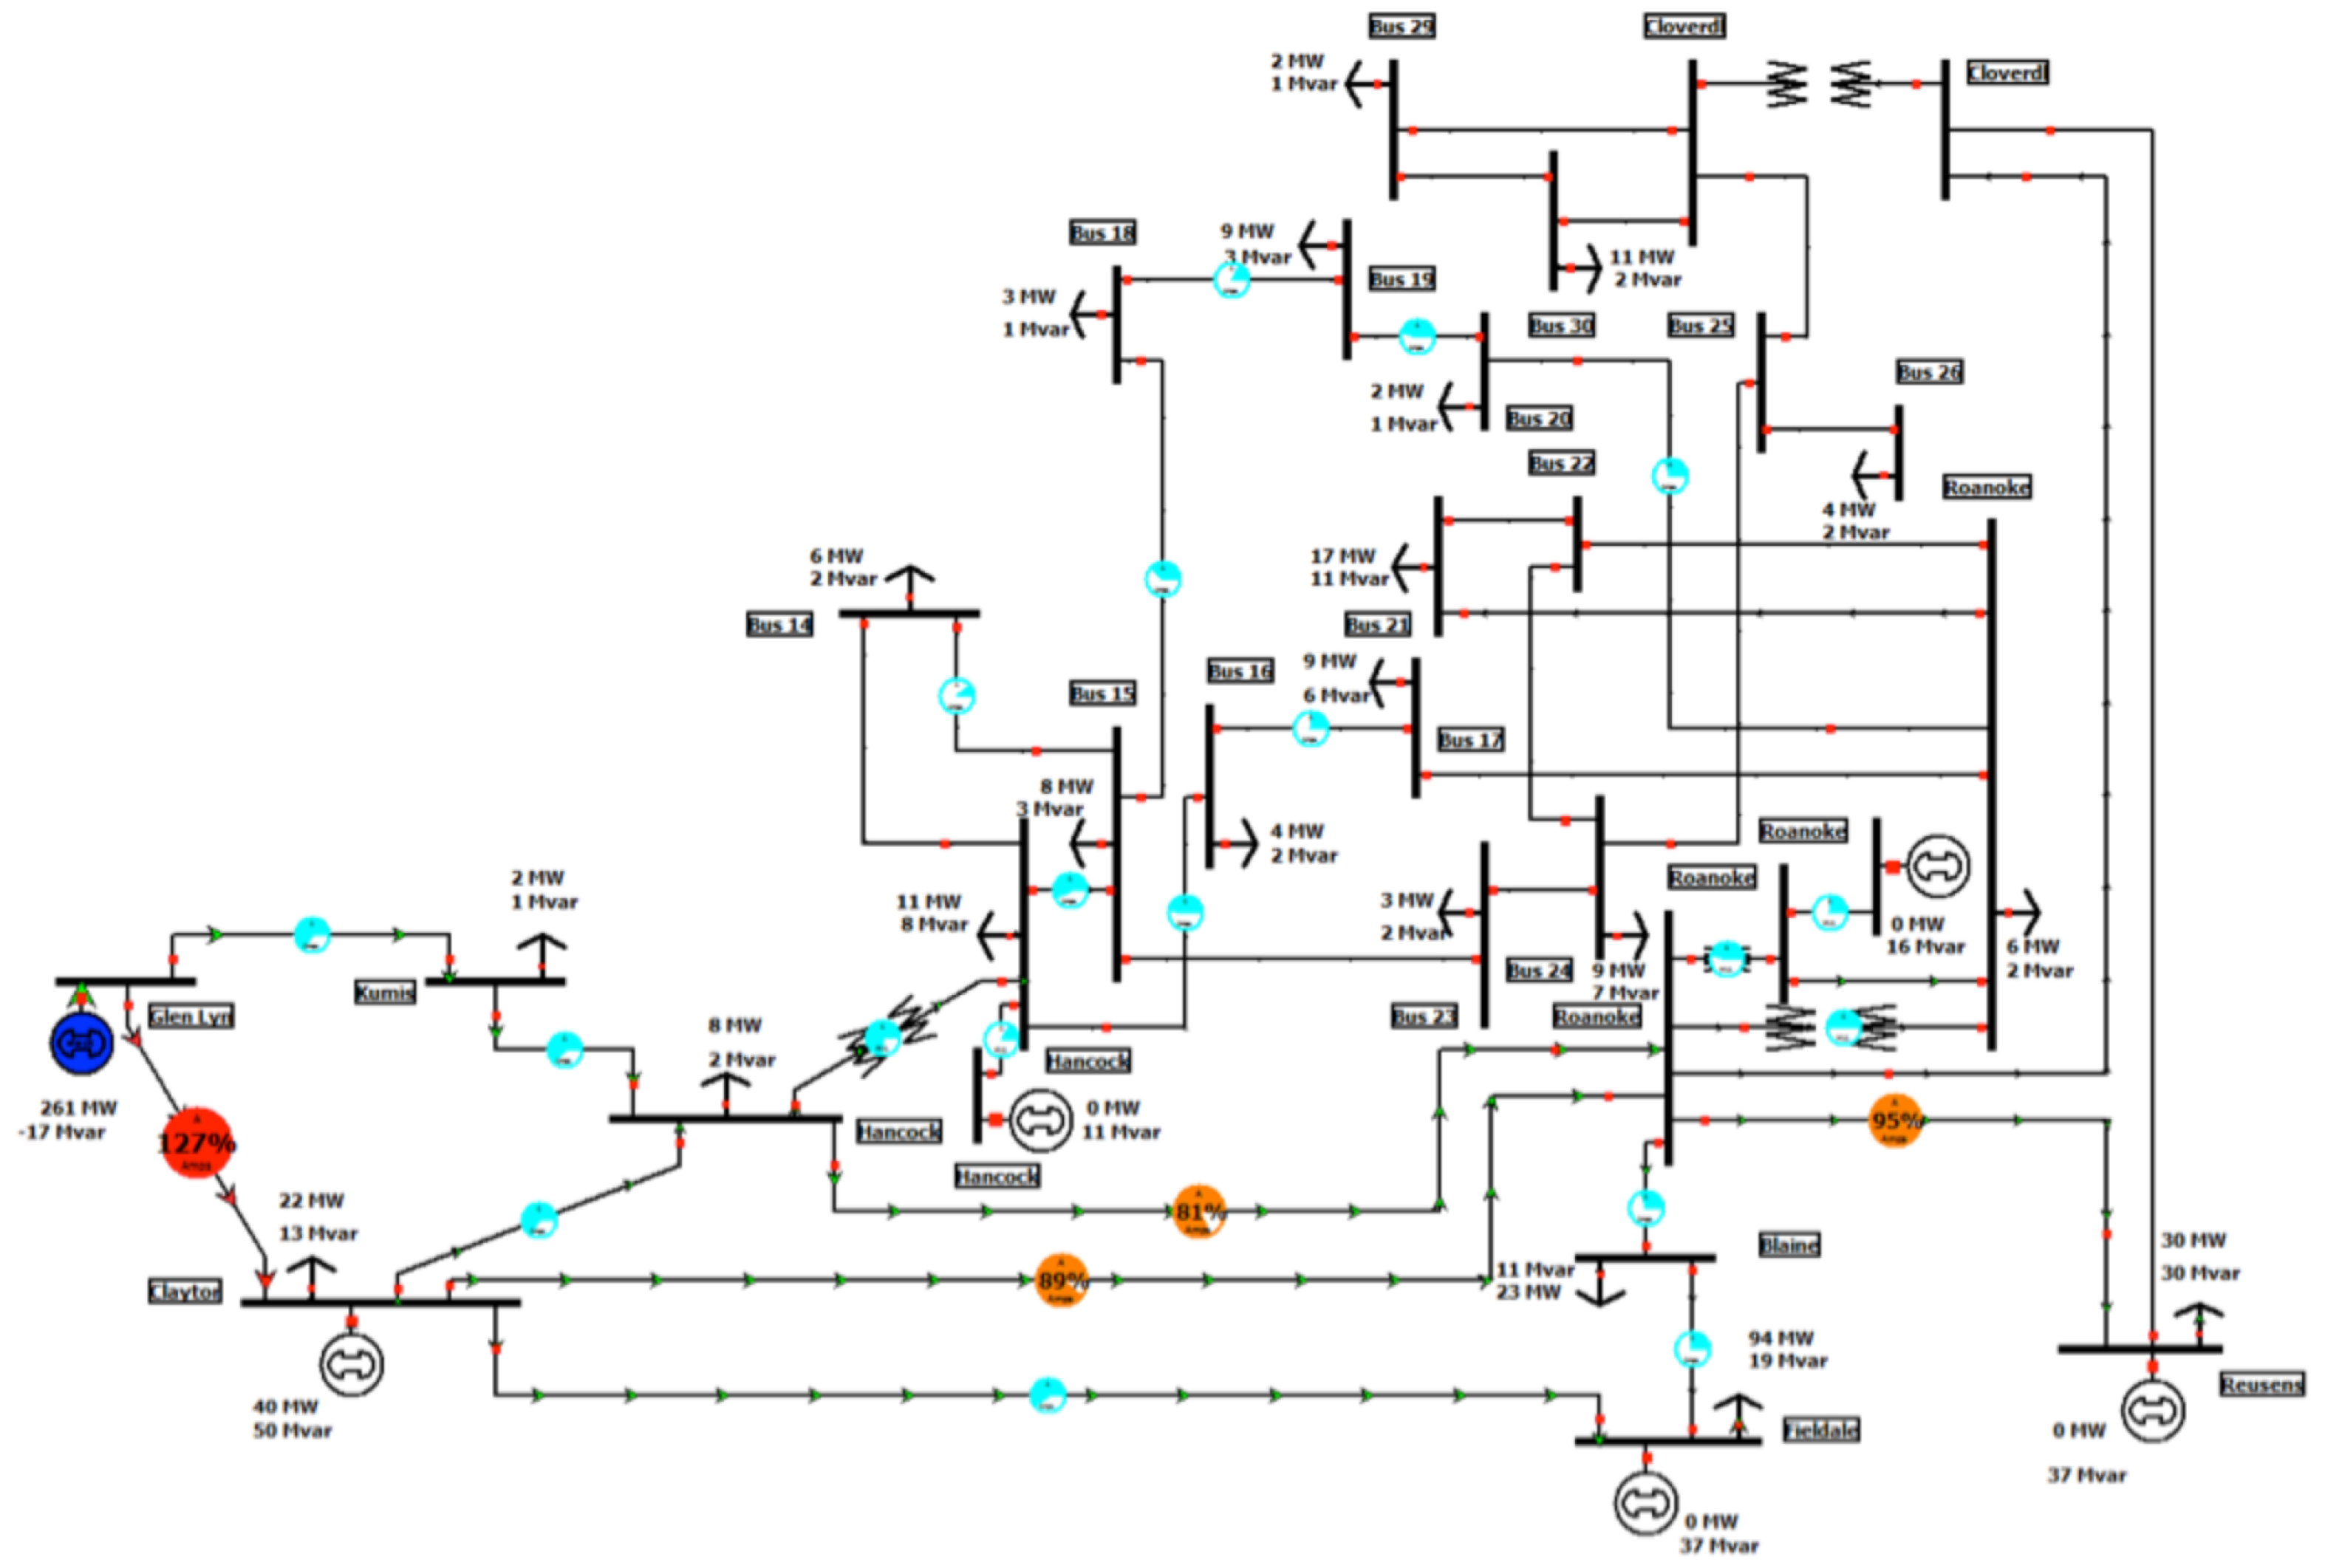
4.1. Data Generation

To evaluate the proposed framework on realistic CPS scenarios, seven-year practical load demand data of ISO New England from 2015 to 2021 were used for the normal data simulation, as shown in Figure 2. The load demand was normalized to the load value of the standard IEEE 30-bus system [40], as shown in Figure 3. Then, MATPOWER was implemented to generate 142 measurements over a 1-min interval, i.e., C = 142 , by performing the DC optimal power flow (DC-OPF) analysis. Gaussian noises were also added to the measurements with a mean of zero and a standard deviation of 0.02. Then, this work selected 60 min as the sliding window, i.e., T = 60 , to transform normal data into time series data.
The FDI [12], which can stealthily compromise measurements in a coordinated fashion, was chosen as the attack model to generate the attack data. This work constructed the attack vectors according to the system topology matrix H by a = Hc , and injected them into normal data z to synthesize the attack data by z a = z + a . The false state c had a mean of zero and a standard deviation of 0.1. In this way, the FDI attacks could evade the bad data detection (BDD) and compromise the state estimation results, which could result in severe impacts such as insufficient generation, power outages, and monetary loss [1,4]. Moreover, this paper considered that the attack data percentage was not always consistent in real-world power systems. Based on the fact that the attack data are generally rare compared to the normal data in the smart grid [41], this paper set the attack data percentage range of [5%, 40%]. Meanwhile, considering many ML algorithms are tested and developed on balanced datasets, this work also set up relatively balanced datasets with an attack data percentage range of [45%, 55%]. Combining these two, this work had datasets with an attack data percentage range of [5%, 55%]. The attack data percentages were chosen in every 5% among [5%, 55%] to validate the robustness of the proposed framework, that is, 5%, 10%, 15%, 20%, 25%, 30%, 35%, 40%, 45%, 50%, and 55%.

4.2. Spatiotemporal TL Setup

This work assumed the power system could be attacked at different times and locations. In terms of attack times, considering the load demand of different seasons distinct, this work set up four cases from each year’s data, winter, spring, summer, and fall, to capture the temporal divergence, as shown in Table 1. Source domains were generated from the labeled historical normal and attack data from 2015 to 2018. Target domains contained unlabeled normal data and attack data from 2019 to 2021.
Regarding attack locations, it was assumed that the attackers could only target one bus each time considering the limited access ability of attackers in real-world scenarios. Following [3], this work found 15 attackable buses in the IEEE 30-bus system. Different attackable buses were targeted by FDI attacks for the attack location variations.
In the transferability analysis, following our previous paper [19], this work randomly chose two domains from the labeled historical data between 2015 and 2018 as a pair of training domain and validation domain. Then, this work measured the distribution divergence between two domains, and calculated the model’s accuracy drop from the training domain to the validation domain. Regression models with a single metric and ensemble metrics were trained to learn the relationship between the measured divergence and accuracy drop. Then, the trained regression models were leveraged to predict the accuracy degradation on the unlabeled target domain between 2019 and 2021. If the predicted accuracy degradation exceeded the predefined threshold, the second step of the proposed framework was applied to maintain the performance.

4.3. Comparison Models

The performance of the TADA framework was validated via comparing to three non-TL models and two state-of-art TL models. The three non-TL models were a multi-layer perceptron (MLP) and a linear SVM, chosen for their high performance and low computational complexity in intrusion detection [5,6], and a fully convolutional network (FCN) [29] for its ability to learn deep spatial features. For the state-of-art TL models, this work chose a DANN and the convolutional deep domain adaptation model for time series data (CoDATS) [42] for their capacity for domain adaptation.
This work adopted the accuracy and F1-score for the evaluation and comparison, which can be calculated as follows:
Accuracy = TP + TN TP + TN + FP + FN ,
where TP, TN, FP, and FN represent true positives, true negatives, false positives, and false negatives, respectively. Since this work used imbalanced domains, examining the accuracy alone could sometimes be misleading. Hence, this work also introduced the F1-score, which is the harmonic mean of precision and recall:
F 1 - score = 2 × Precision × Recall Precision + Recall ,
where Precision = TP TP + FP , Recall = TP TP + FN .

4.4. Model Implementation

For the transferability analysis, this work deactivated the domain discriminator and used a serial connection between the feature extractor and the label predictor as the detection classifier to calculate the detection accuracy drop. The three layers of CNNs are set with kernel sizes of {8, 5, 3} and kernel numbers of {128, 256, 128}. Following [28], this work used grid research and found that combining an LSTM time step size of 60 (in minutes) and a hidden state size of 100 achieved robust detection performance. This work referred to [26] and gradually changed the adaptation factor λ in Equation (7) from zero to one to tune the trade-off between the label predictor loss and the domain discriminator loss. In this way, the domain discriminator loss was suppressed at the early training stage. Furthermore, an annealing learning rate that decreased from 0.01 to 0.001 was applied in this work.
This work used MATLAB R2020b and MATPOWER v7.1 to generate datasets. All models were implemented in Python v3.6, TensorFlow v2.4.0, Keras v2.4.3, and Scikit-learn v0.24.2. The hardware environment for training and testing was an AMD Ryzen 9 3900X 12-Core Processor 3.80 GHz with 32GB RAM, and an NVIDIA GeForce RTX 2070 Super GPU.

5. Results and Discussion

5.1. Evaluation of Transferability Analysis

The root-mean-square error (RMSE) and maximum absolute error (MaxAE) of each regression model in predicting the accuracy drop are shown in Figure 4. The first four are the performance of the single-metric method, and the last one is that of the ensemble method with all metrics.
To show the accuracy drop prediction ability of the transferability analysis, this work first compared the selected metrics with the baseline. The baseline divided the divergence of the historical data between 2015 and 2018 into small intervals, and calculated the mean accuracy drop in each small divergence interval as the expected accuracy drop. For the target dataset, if the measured divergence was located in a specific interval, the baseline took the expected accuracy drop of that interval as the predicted accuracy drop of the target domain. The RMSE and MaxAE of the baseline were 6.32% and 17.28%, respectively. All selected metrics outperformed the baseline in both RMSE and MaxAE. Among the four selected metrics with a linear regression, PAD and JS had the highest prediction performance, reducing RMSE and MaxAE significantly to under 2.88% and 8.27%, respectively. MMD performed slightly worse than PAD and JS, but still improved the baseline by 3.03% in RMSE and 7.31% in MaxAE. Cos performed worst among the selected metrics but still achieved smaller RMSE and MaxAE than the baseline.
Moreover, compared to using a single metric to predict the accuracy drop, the ensemble method provided better performance. The ensemble method achieved an RMSE as low as 1.79% and a MaxAE of 5.62%. This was because the ensemble method took advantage of different metrics that could capture complementary distribution information to further improve prediction performance [21]. Overall, the ensemble method decreased the RMSE to below 1.80%, indicating that the predicted accuracy drop with the ensemble metrics was close to the ground truth. This also implied that it was feasible to predict the models’ performance drop by distribution divergence.
The low RMSE and MaxAE of the selected metrics can be explained by the strong relationship between the divergence and accuracy drop. For example, the relationship of the accuracy drop and PAD divergence is presented in Figure 5. A strong relationship between the PAD divergence and accuracy drop can be observed: the Pearson correlation coefficient ρ is 0.87. According to [43], ρ > 0.8 indicates a strong correlation between two variables.

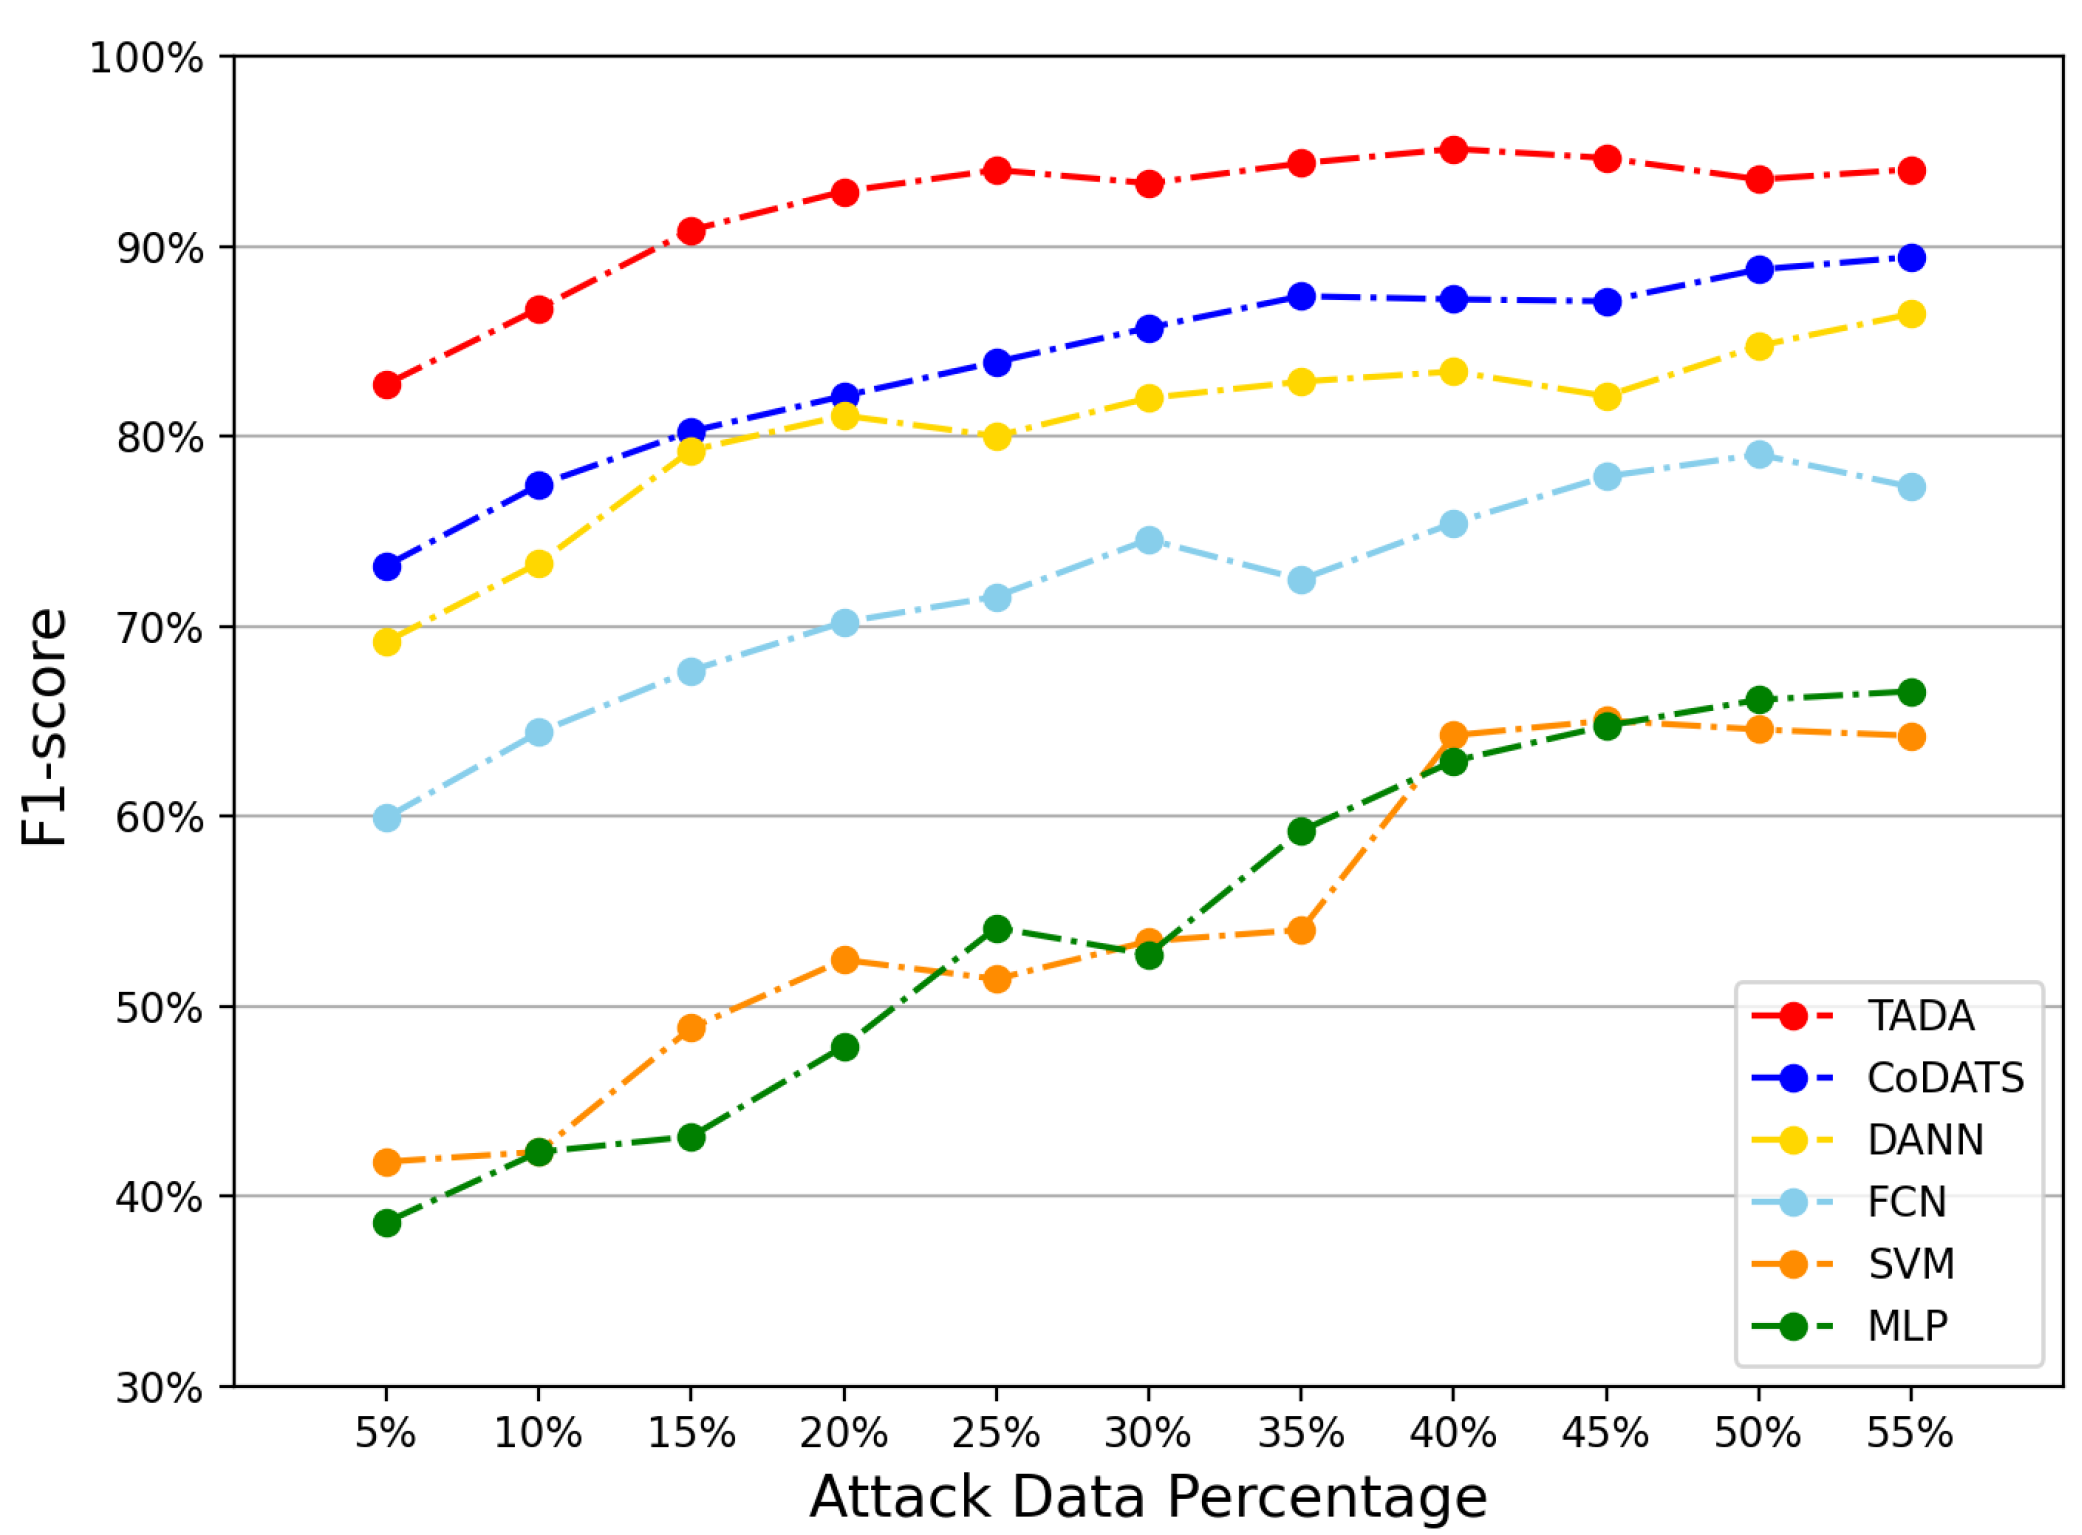
5.2. FDI Detection Performance

Table 2 illustrates the accuracy of the TADA framework and five compared models in detecting FDI attacks in different seasons. The accuracy shown in Table 2 is the average of every 1080 experiments, where attacks were injected on individual buses of different locations. This work used the ensemble method to predict the accuracy drop of each case. Since FDI attacks may severely impact the power systems, this work set an accuracy drop of 10% as the threshold for activating TL. The target seasons where the actual accuracy drop was smaller than 10% are underlined. In these seasons, the accuracy drop was not significant enough to call for TL, because this small accuracy drop might be the normal accuracy variation. In this case, TL was unnecessary, because frequently applying TL can be costly but the performance boost would be trivial. Table 2 shows that the predicted accuracy drop of all the underlined seasons was less than 10%, indicating the ensemble method successfully identified all TL-unnecessary cases. Overall, the predicted accuracy drop was close to the actual accuracy drop. It can also be found that except for winter in Case 4, the source and target domain pairs demonstrated less accuracy drop if they were from the following pairs: the same-season pairs, winter and summer pairs, spring and fall pairs. This was because the load demand of the source and target domains from the aforementioned pairs was similar, as shown in Table 1. A similar load demand indicates less data distribution divergence and accuracy drop.
Among all methods, the SVM and MLP had the lowest detection accuracy, with an average accuracy of 72.55% and 74.10%, respectively. This was because they could neither learn deep spatiotemporal features nor use domain adaptation to mitigate the impact of distribution divergence. The FCN performed slightly better than the SVM and MLP with an average accuracy of 78.06%, because the FCN can leverage its CNN to extract spatial features within the smart grid measurements. However, the FCN was also a non-TL model, so it suffered performance degradation when facing significant distribution divergence. Moreover, compared to three non-TL models (SVM, MLP, and FCN), the TL models (DANN, CoDATS, and TADA) achieved a higher detection accuracy. This suggested that the three TL models could extract domain-invariant features to improve the classification accuracy, while the non-TL models failed to mitigate the impact of distribution divergence.
Among the three TL models, although the DANN could learn domain-invariant features, it had the lowest detection accuracy since it could not extract temporal or spatial features. The TADA framework outperformed the CoDATS by an average improvement of 4.56%. This was because the CoDATS could only learn temporal features, but the TADA framework could learn both temporal and spatial features in parallel to further improve FDI detection performance. Overall, the TADA framework demonstrated the highest accuracy in all cases. The best-case and the worst-case improvements reached +30.32% compared to the MLP during fall in Case 3, and +1.57% compared to the CoDATS during fall in Case 4. The results suggested that the TADA framework could not only take advantage of domain-adversarial training to extract domain-invariant features, but also leverage the LSTM and CNNs to learn spatiotemporal features, to achieve superior FDI detection performance against distribution divergence.
Considering this work used imbalanced datasets, the F1-score of the TADA framework and other compared models under different attack data percentages are shown in Figure 6. The results show that the detection performance of all methods was generally increasing as the percentage of attack data increased and datasets became more balanced. When the attack data percentage was less than 25%, the TADA framework demonstrated a significant improvement compared to the other models. The F1-score of the TADA framework did not further improve when the attack data percentage was higher than 25%, but it still outperformed the other models. Overall, the TADA framework showed the highest F1-score when the attack data percentage varied, which indicated that the TADA framework could achieve robust detection performance against variations in attack data percentage.

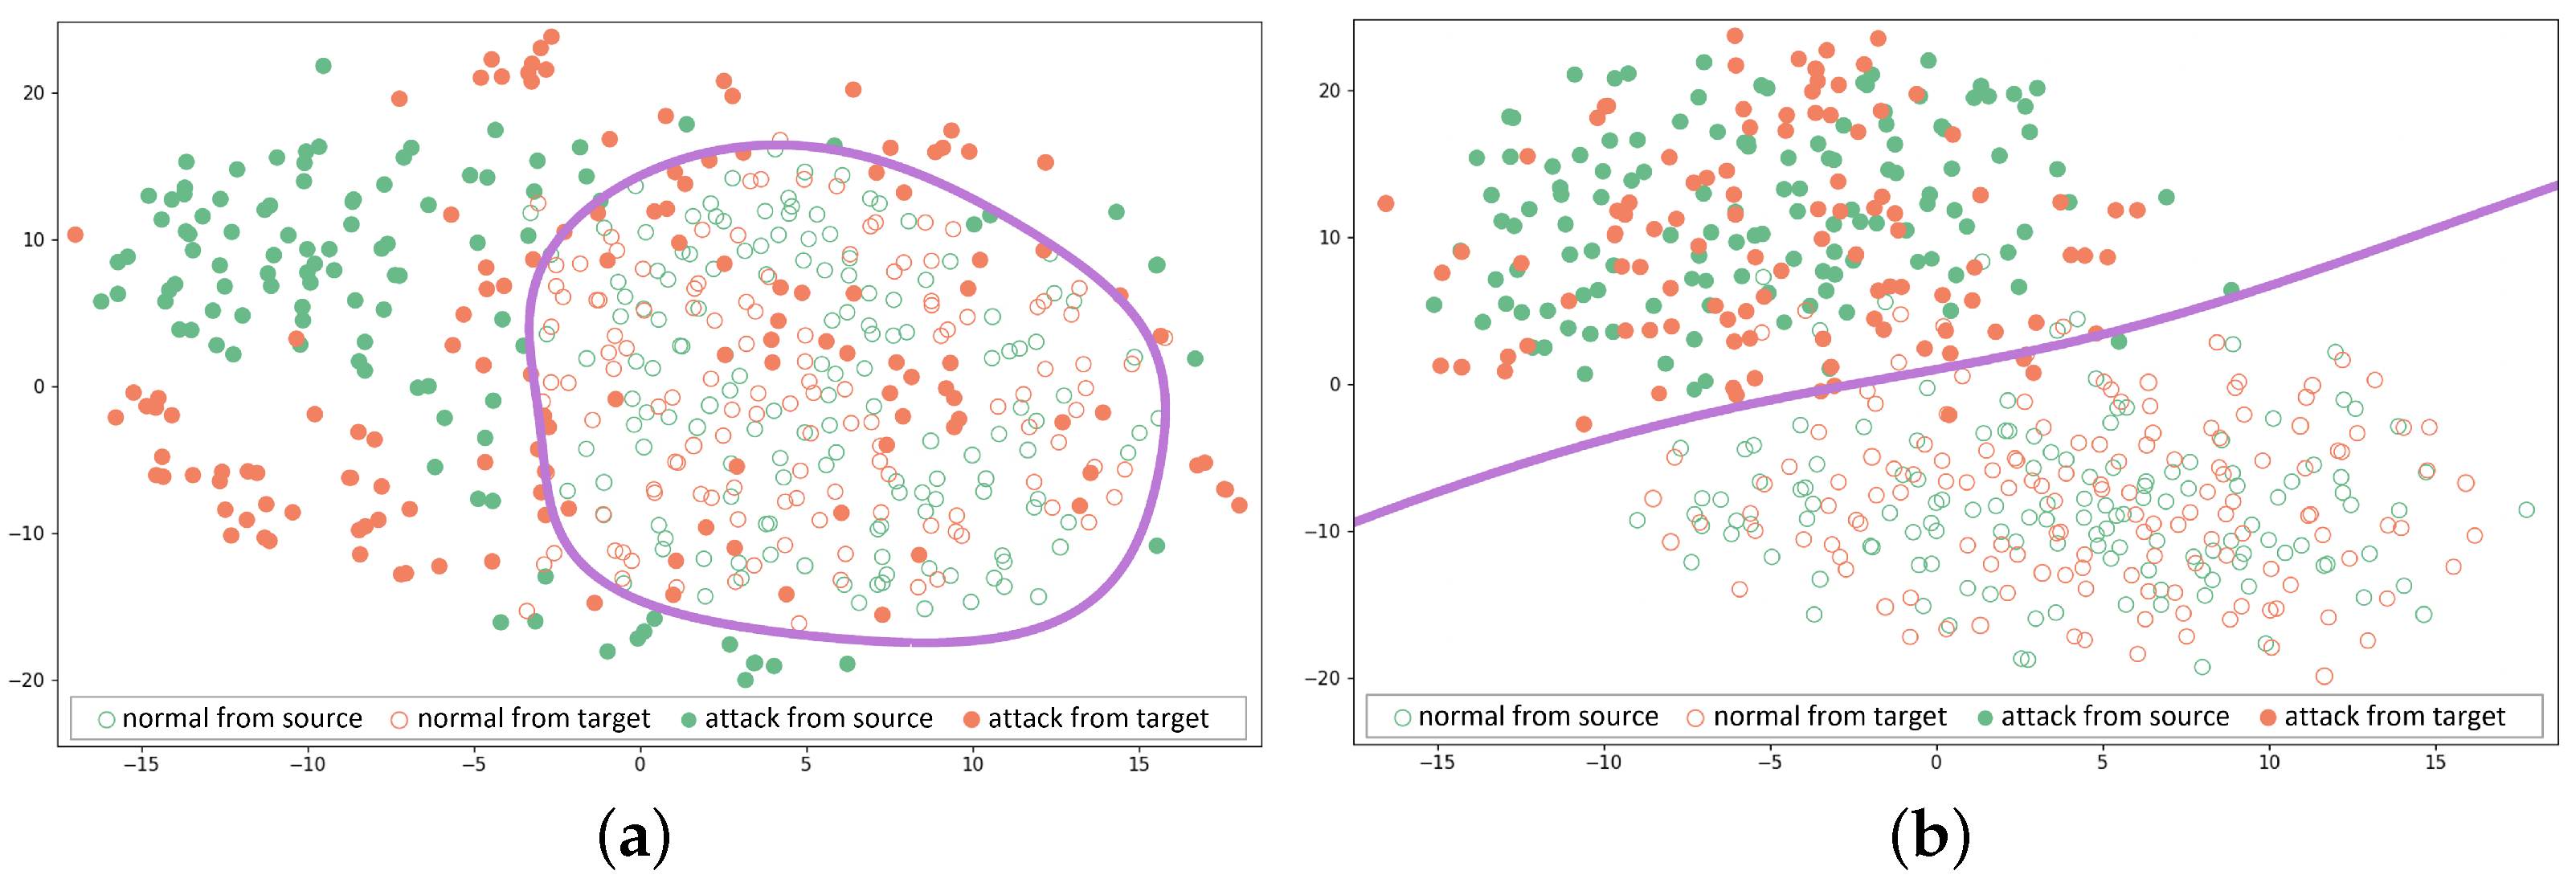
5.3. Visualization of Data Distribution

To vividly visualize the results of the domain-invariant feature extraction, Figure 7 employs t-SNE and presents normal and attack data distribution without and with domain-adversarial training. Specifically, for Figure 7a where the domain-adversarial training was not performed, this work deactivated the domain discriminator and used t-SNE to visualize the output of the feature fusion layer in Figure 1. For Figure 7b where the domain-adversarial training was performed, this work trained all three networks and visualized the output of the feature fusion layer. This work also plotted the decision boundary on the attack detection problem, which was given by the label predictor in Figure 1. Specifically, a sample was classified as attack data if the output of the label predictor was greater than 0.5. Otherwise, it was classified as normal data.
Figure 7a shows that without domain-adversarial training, the distributions of source and target data were different, especially for the attack data that were injected at different times and locations. Moreover, the decision boundary could distinguish between normal and attack data from the source domain but could not perfectly classify normal and attack data from the target domain. This was because the classifier was trained based on the labeled source domain, but the target domain had a different data distribution. After applying the domain-adversarial training, however, the distribution divergence between the two domains decreased. The source and target domains shared a similar distribution in the feature fusion layer, as shown in Figure 7b. Specifically, the attack data were clustered on the upper left, while the normal data were clustered on the lower right. Therefore, the label predictor trained on features extracted from the source domain could also generalize well to the target domain, thus achieving a high and robust detection performance. The results demonstrated that the TADA framework could effectively reduce distribution divergence and thus improve the detection performance.

6. Conclusions

This work studied the problems of when to apply TL and how to extract effective features during TL for attack detection in power systems. A two-step attack detection framework based on transferability analysis and unsupervised domain-adversarial training was proposed. The framework first used the distribution divergence to determine when TL should be applied, and then leveraged the spatiotemporal domain-adversarial training to enhance detection performance against attacks at different times and locations. The transferability analysis results demonstrated that the framework was capable of predicting the accuracy drop with an RMSE lower than 1.79% and determining whether to apply TL. The attack detection results showed that the TADA framework could extract effective spatiotemporal domain-invariant features to improve attack detection performance and achieved an average accuracy of 95.58%. The results also demonstrated that the TADA framework could achieve robust detection performance against variations of attack data percentages, with an average F1-score of 92.02%. In the future, we will further investigate more practical attack scenarios in the smart grid and extend the work to other CPS scenarios.

Author Contributions

Conceptualization, P.L. and J.Y.; methodology, P.L. and J.Y.; software, P.L. and Y.Z.; validation, P.L., J.Y. and J.M.S.; formal analysis, P.L., J.Y. and J.M.S.; investigation, P.L.; data curation, P.L. and Y.Z.; writing—original draft preparation, P.L. and Y.Z.; writing—review and editing, P.L., J.Y., J.M.S. and Y.Z.; supervision, J.Y. and J.M.S.; project administration: J.Y. and J.M.S.; funding acquisition, J.Y. All authors have read and agreed to the published version of the manuscript.

Funding

This research was funded in part by the Ericsson GAIA Montréal AI hub Canada and Mitacs Accelerate grant IT-15923, in part by the Natural Sciences and Engineering Research Council of Canada (NSERC) under grants RGPIN-2018-06724, and in part by the Fonds de Recherche du Québec–Nature et Technologies (FRQNT) under grant 2019-NC-254971.

Institutional Review Board Statement

Not applicable.

Informed Consent Statement

Not applicable.

Data Availability Statement

The data presented in this study are available on request from the corresponding author. The data are not publicly available due to privacy.

Conflicts of Interest

The authors declare no conflict of interest.

Abbreviations

The following abbreviations are used in this manuscript:
TADATransferability analysis and domain-adversarial training
CPSCyberphysical systems
IDSIntrusion detection system
FDIFalse data injection
BDDBad data detection
MLMachine learning
TLTransfer learning
DANN Domain-adversarial neural network
GRLGradient reversal layer
DANDeep adaptation network
DNNDeep neural network
CDBNConditional deep belief network
CNNConvolutional neural network
LSTMLong short-term memory
GAPGlobal average pooling
NLPNatural language processing
CVComputer vision
FCNFully convolutional network
CoDATSConvolutional deep domain adaptation model for time series data
MLPMultilayer perceptron
kNNk-nearest neighbors
SVMSupport vector machine
PADProxy A -distance
KLKullback–Leibler
JSJensen–Shannon
CMDCentral moment discrepancy
CORALCorrelation alignment
MMDMaximum mean discrepancy
RKHSReproducing kernel Hilbert space
DC-OPFDC optimal power flow

References

  1. Ge, L.; Li, Y.; Li, Y.; Yan, J.; Sun, Y. Smart Distribution Network Situation Awareness for High-Quality Operation and Maintenance: A Brief Review. Energies 2022, 15, 828. [Google Scholar] [CrossRef]
  2. Li, Y.; Yan, J. Cybersecurity of Smart Inverters in the Smart Grid: A Survey. IEEE Trans. Power Electron. 2022, 38, 2364–2383. [Google Scholar] [CrossRef]
  3. Rahman, M.; Li, Y.; Yan, J. Multi-Objective Evolutionary Optimization for Worst-Case Analysis of False Data Injection Attacks in the Smart Grid. In Proceedings of the 2020 IEEE Congress on Evolutionary Computation (CEC), Glasgow, UK, 19–24 July 2020; pp. 1–8. [Google Scholar]
  4. Cheng, G.; Lin, Y.; Zhao, J.; Yan, J. A Highly Discriminative Detector Against False Data Injection Attacks in AC State Estimation. IEEE Trans. Smart Grid 2022, 13, 2318–2330. [Google Scholar] [CrossRef]
  5. Shaukat, K.; Luo, S.; Varadharajan, V.; Hameed, I.A.; Chen, S.; Liu, D.; Li, J. Performance Comparison and Current Challenges of Using Machine Learning Techniques in Cybersecurity. Energies 2020, 13, 2509. [Google Scholar] [CrossRef]
  6. Kumar, A.; Saxena, N.; Jung, S.; Choi, B.J. Improving Detection of False Data Injection Attacks Using Machine Learning with Feature Selection and Oversampling. Energies 2022, 15, 212. [Google Scholar] [CrossRef]
  7. Zhang, Y.; Yan, J. Domain-Adversarial Transfer Learning for Robust Intrusion Detection in the Smart Grid. In Proceedings of the 2019 IEEE International Conference on Communications, Control, and Computing Technologies for Smart Grids (SmartGridComm), Beijing, China, 21–23 October 2019; pp. 1–6. [Google Scholar]
  8. Zhang, Y.; Yan, J. Semi-Supervised Domain-Adversarial Training for Intrusion Detection against False Data Injection in the Smart Grid. In Proceedings of the 2020 International Joint Conference on Neural Networks (IJCNN), Glasgow, UK, 19–24 July 2020; pp. 1–7. [Google Scholar] [CrossRef]
  9. Houidi, S.; Fourer, D.; Auger, F.; Sethom, H.B.A.; Miègeville, L. Comparative Evaluation of Non-Intrusive Load Monitoring Methods Using Relevant Features and Transfer Learning. Energies 2021, 14, 2726. [Google Scholar] [CrossRef]
  10. Zhang, Y. Domain Adversarial Transfer Learning for Robust Cyber-Physical Attack Detection in the Smart Grid. Ph.D. Thesis, Concordia University, Montréal, QC, Canada, 2020. [Google Scholar]
  11. Cui, M.; Wang, J.; Chen, B. Flexible Machine Learning-Based Cyberattack Detection Using Spatiotemporal Patterns for Distribution Systems. IEEE Trans. Smart Grid 2020, 11, 1805–1808. [Google Scholar] [CrossRef]
  12. Liu, Y.; Ning, P.; Reiter, M.K. False Data Injection Attacks Against State Estimation in Electric Power Grids. ACM Trans. Inf. Syst. Secur. 2011, 14, 1–33. [Google Scholar] [CrossRef]
  13. Deng, Q.; Sun, J. False Data Injection Attack Detection in a Power Grid Using RNN. In Proceedings of the IECON 2018-44th Annual Conference of the IEEE Industrial Electronics Society, Washington, DC, USA, 21–23 October 2018; pp. 5983–5988. [Google Scholar] [CrossRef]
  14. England, I.N. ISO New England—Energy, Load, and Demand Reports. [EB/OL]. Available online: https://www.iso-ne.com/isoexpress/web/reports/load-and-demand/-/tree/dmnd-five-minute-sys (accessed on 1 January 2022).
  15. Miller, J.P.; Taori, R.; Raghunathan, A.; Sagawa, S.; Koh, P.W.; Shankar, V.; Liang, P.; Carmon, Y.; Schmidt, L. Accuracy on the Line: On the Strong Correlation Between Out-of-Distribution and In-Distribution Generalization. In Proceedings of the 38th International Conference on Machine Learning, Virtual, 18–24 July 2021; Volume 139, pp. 7721–7735. [Google Scholar]
  16. Fort, S.; Ren, J.; Lakshminarayanan, B. Exploring the Limits of Out-of-Distribution Detection. In Proceedings of the Advances in Neural Information Processing Systems, Virtual, 6–14 December 2021; Ranzato, M., Beygelzimer, A., Dauphin, Y., Liang, P., Vaughan, J.W., Eds.; Curran Associates, Inc.: Red Hook, NY, USA, 2021; Volume 34, pp. 7068–7081. [Google Scholar]
  17. Elsahar, H.; Gallé, M. To annotate or not? predicting performance drop under domain shift. In Proceedings of the 2019 Conference on Empirical Methods in Natural Language Processing and the 9th International Joint Conference on Natural Language Processing (EMNLP-IJCNLP), Hong Kong, China, 3–7 November 2019; pp. 2163–2173. [Google Scholar]
  18. Deng, W.; Zheng, L. Are labels always necessary for classifier accuracy evaluation? In Proceedings of the IEEE/CVF Conference on Computer Vision and Pattern Recognition, Nashville, TN, USA, 20–25 June 2021; pp. 15069–15078. [Google Scholar]
  19. Liao, P.; Yan, J.; Sellier, J.M.; Zhang, Y. Divergence-Based Transferability Analysis for Self-Adaptive Smart Grid Intrusion Detection With Transfer Learning. IEEE Access 2022, 10, 68807–68818. [Google Scholar] [CrossRef]
  20. Ramesh Kashyap, A.; Hazarika, D.; Kan, M.Y.; Zimmermann, R. Domain Divergences: A Survey and Empirical Analysis. In Proceedings of the 2021 Conference of the North American Chapter of the Association for Computational Linguistics: Human Language Technologies, Online, 6–11 June 2021; Association for Computational Linguistics: Stroudsburg, PA, USA, 2021; pp. 1830–1849. [Google Scholar] [CrossRef]
  21. Ruder, S.; Plank, B. Learning to select data for transfer learning with Bayesian Optimization. In Proceedings of the 2017 Conference on Empirical Methods in Natural Language Processing, Copenhagen, Denmark, 7–8 September 2017; Association for Computational Linguistics: Stroudsburg, PA, USA, 2017; pp. 372–382. [Google Scholar] [CrossRef] [Green Version]
  22. Durairaj, D.; Venkatasamy, T.K.; Mehbodniya, A.; Umar, S.; Alam, T. Intrusion detection and mitigation of attacks in microgrid using enhanced deep belief network. In Energy Sources, Part A: Recovery, Utilization, and Environmental Effects; Taylor & Francis: Abingdon, UK, 2022; pp. 1–23. [Google Scholar]
  23. Nakagawa, F.H.Y.; Barbon Junior, S.; Zarpelão, B.B. Attack Detection in Smart Home IoT Networks using CluStream and Page-Hinkley Test. In Proceedings of the 2021 IEEE Latin-American Conference on Communications (LATINCOM), Santo Domingo, Dominican Republic, 17–19 November 2021; pp. 1–6. [Google Scholar] [CrossRef]
  24. Liang, J.; Ma, M. Co-maintained database based on blockchain for idss: A lifetime learning framework. IEEE Trans. Netw. Serv. Manag. 2021, 18, 1629–1645. [Google Scholar] [CrossRef]
  25. Pan, S.; Yang, Q. A Survey on Transfer Learning. IEEE Trans. Knowl. Data Eng. 2010, 22, 1345–1359. [Google Scholar] [CrossRef]
  26. Ganin, Y.; Ustinova, E.; Ajakan, H.; Germain, P.; Larochelle, H.; Laviolette, F.; Marchand, M.; Lempitsky, V. Domain-adversarial Training of Neural Networks. J. Mach. Learn. Res. 2016, 17, 1–35. [Google Scholar]
  27. Wei, J.; Chen, Y.; Lai, Y.; Wang, Y.; Zhang, Z. Domain adversarial neural network-based intrusion detection system for in-vehicle network variant attacks. IEEE Commun. Lett. 2022, 26, 2547–2551. [Google Scholar] [CrossRef]
  28. Hong, W.C.; Huang, D.R.; Chen, C.L.; Lee, J.S. Towards accurate and efficient classification of power system contingencies and cyber-attacks using recurrent neural networks. IEEE Access 2020, 8, 123297–123309. [Google Scholar] [CrossRef]
  29. Wang, Z.; Yan, W.; Oates, T. Time series classification from scratch with deep neural networks: A strong baseline. In Proceedings of the 2017 International joint conference on neural networks (IJCNN), Anchorage, AL, USA, 14–19 May 2017; pp. 1578–1585. [Google Scholar]
  30. He, Y.; Mendis, G.J.; Wei, J. Real-Time Detection of False Data Injection Attacks in Smart Grid: A Deep Learning-Based Intelligent Mechanism. IEEE Trans. Smart Grid 2017, 8, 2505–2516. [Google Scholar] [CrossRef]
  31. Wang, W.; Sheng, Y.; Wang, J.; Zeng, X.; Ye, X.; Huang, Y.; Zhu, M. HAST-IDS: Learning Hierarchical Spatial-Temporal Features Using Deep Neural Networks to Improve Intrusion Detection. IEEE Access 2018, 6, 1792–1806. [Google Scholar] [CrossRef]
  32. Kwon, H.; Kim, Y.; Yoon, H.; Choi, D. Classification score approach for detecting adversarial example in deep neural network. Multimed. Tools Appl. 2021, 80, 10339–10360. [Google Scholar] [CrossRef]
  33. Kwon, H.; Lee, J. AdvGuard: Fortifying Deep Neural Networks against Optimized Adversarial Example Attack. IEEE Access 2020, 1. [Google Scholar] [CrossRef]
  34. Kwon, H.; Lee, J. Diversity Adversarial Training against Adversarial Attack on Deep Neural Networks. Symmetry 2021, 13, 428. [Google Scholar] [CrossRef]
  35. Plank, B.; van Noord, G. Effective Measures of Domain Similarity for Parsing. In Proceedings of the 49th Annual Meeting of the Association for Computational Linguistics: Human Language Technologies, Portland, OR, USA, 19–24 June 2011; Association for Computational Linguistics: Stroudsburg, PA, USA, 2011; pp. 1566–1576. [Google Scholar]
  36. Remus, R. Domain Adaptation Using Domain Similarity- and Domain Complexity-Based Instance Selection for Cross-Domain Sentiment Analysis. In Proceedings of the 2012 IEEE 12th International Conference on Data Mining Workshops, Brussels, Belgium, 10 December 2012; pp. 717–723. [Google Scholar] [CrossRef]
  37. Zellinger, W.; Grubinger, T.; Lughofer, E.; Natschläger, T.; Saminger-Platz, S. Central Moment Discrepancy (CMD) for Domain-Invariant Representation Learning. In Proceedings of the 5th International Conference on Learning Representations (ICLR 2017), Toulon, France, 24–26 April 2017. [Google Scholar]
  38. Long, M.; Cao, Y.; Wang, J.; Jordan, M. Learning transferable features with deep adaptation networks. In Proceedings of the International Conference on Machine Learning, Lille, France, 7–9 July 2015; pp. 97–105. [Google Scholar]
  39. Zhang, D.; Yao, L.; Zhang, X.; Wang, S.; Chen, W.; Boots, R. EEG-based intention recognition from spatio-temporal representations via cascade and parallel convolutional recurrent neural networks. arXiv 2017, arXiv:1708.06578. [Google Scholar]
  40. Illinois Center for a Smarter Electric Grid (ICSEG). IEEE 30-Bus System. [EB/OL]. Available online: https://icseg.iti.illinois.edu/ieee-30-bus-system/ (accessed on 2 October 2013).
  41. Wei, L.; Gao, D.; Luo, C. False data injection attacks detection with deep belief networks in smart grid. In Proceedings of the 2018 Chinese Automation Congress (CAC), Xi’an, China, 30 November–2 December 2018; pp. 2621–2625. [Google Scholar]
  42. Wilson, G.; Doppa, J.R.; Cook, D.J. Multi-source deep domain adaptation with weak supervision for time-series sensor data. In Proceedings of the 26th ACM SIGKDD International Conference on Knowledge Discovery & Data Mining, Virtual, 6–10 July 2020; pp. 1768–1778. [Google Scholar]
  43. Akoglu, H. User’s guide to correlation coefficients. Turk. J. Emerg. Med. 2018, 18, 91–93. [Google Scholar] [CrossRef] [PubMed]
Figure 1. The proposed transferability analysis and domain-adversarial training (TADA) framework.
Energies 15 08778 g001
Figure 2. ISO New England seven-year load demand [14].
Energies 15 08778 g002
Figure 3. IEEE 30-bus system [40].
Energies 15 08778 g003
Figure 4. RMSE and MAE of accuracy drop prediction.
Energies 15 08778 g004
Figure 5. Scatter plot showing a strong relationship between PAD divergence and accuracy drop. Each dot represents a domain pair. The linear regression result is plotted in purple.
Energies 15 08778 g005
Figure 6. Comparison of F1-score of the TADA framework and other ML classifiers under different attack data percentages.
Energies 15 08778 g006
Figure 7. Distribution of normal and attack data in the feature fusion layer when (a) domain-adversarial training was not applied and (b) domain-adversarial training was applied. The circles represent normal data, while the dots represent the attack data. The green dots and circles correspond to data from the source domain, and the orange dots and circles correspond to the data from the target domain. The decision boundary is plotted in purple.
Energies 15 08778 g007
Table 1. Cases setup of temporal variation.
CasesSeasonsMonthsSource Domain from
Year 2015 to 2018
Target Domain from
Year 2019 to 2021
Mean of
Load (MW)
Standard Deviation
of Load (MW)
Mean of
Load (MW)
Standard Deviation
of Load (MW)
1WinterMid-December to
mid-March
14,482.95750.0913,851.43500.32
2SpringMid-March to
mid-June
12,744.30560.5411,838.29627.72
3SummerMid-June to
mid-September
15,390.25953.5114,890.62961.39
4FallMid-September to
mid-December
13,107.20533.2312,501.28613.43
Table 2. Comparison of the TADA framework and five ML classifiers in detecting FDI attacks in different seasons.
CasesSource
Seasons
Target
Seasons
Predicted
Drop
Actual
Drop
TADACoDATSDANNFCNSVMMLPBest-Case
Margin
Worst-Case
Margin
1WinterWinter8.978.8997.3193.8691.1786.6879.5681.03+17.74+3.44
Spring26.0125.2094.8787.6985.6972.4467.6566.93+27.94+7.18
Summer11.4711.2395.7493.3189.1379.8274.1375.57+21.61+2.43
Fall20.9720.6594.8490.9385.5171.4166.0269.27+28.82+3.91
2SpringWinter18.5518.7496.6889.1488.1677.3071.7470.42+26.25+7.54
Spring12.8113.0296.0593.0089.7481.5075.6678.91+20.39+3.04
Summer19.6219.1495.4290.4988.0370.2367.7271.04+27.70+4.93
Fall6.266.3697.8993.2190.2386.2278.8582.69+19.04+4.68
3SummerWinter17.2817.6295.0890.5586.0378.5572.1573.56+22.93+4.53
Spring28.2127.1992.9089.4784.3970.8364.8666.98+28.04+3.43
Summer7.197.2996.8789.7990.1285.0779.2581.89+17.61+6.75
Fall23.1723.8094.9986.5782.8071.5068.1964.67+30.32+8.42
4FallWinter11.7611.4996.5290.7891.0684.1278.5378.10+18.42+5.46
Spring14.4814.7594.9893.3090.0478.4274.3576.44+20.63+1.68
Summer24.7723.9293.0889.6881.1972.9967.3267.40+25.75+3.39
Fall9.209.0996.0894.5192.5681.9174.7680.70+21.32+1.57
The target seasons are underlined where the actual accuracy drop is smaller than a predefined threshold (10%) and thus the domain-adversarial training is unnecessary.
Publisher’s Note: MDPI stays neutral with regard to jurisdictional claims in published maps and institutional affiliations.

