
Inventory Routing for Ammonia Supply in German Ports

1
Institute of Mathematics, Technische Universität Berlin, Straße des 17. Juni 135, 10623 Berlin, Germany
2
School of Business and Governance, Tallinn University of Technology, Ehitajate Tee 5, 12616 Tallinn, Estonia
3
Wismar Business School, Wismar University of Applied Sciences, Philipp-Müller-Str. 14, 23966 Wismar, Germany
4
Berlin Institute of Co-Operative Studies, Humboldt-Universität, Luisenstraße 53, 10117 Berlin, Germany
*
Author to whom correspondence should be addressed.
Energies 2022, 15(17), 6485; https://doi.org/10.3390/en15176485
Submission received: 11 July 2022
/
Revised: 22 August 2022
/
Accepted: 31 August 2022
/
Published: 5 September 2022
(This article belongs to the Special Issue Emerging Topics in Energy Infrastructure Planning Based on Energy Sharing and Energy Transition)
Abstract
:Following the International Maritime Organization (IMO), in order to safeguard the realization of the Paris Agreement on climate protection, greenhouse gas (GHG) emissions have to be reduced by 50% by the year 2050. This objective shall be reached by decarbonization of maritime traffic, which is why ship operators currently increasingly search for alternative fuels. Moreover, since the start of the Ukrainian war in February 2022, this issue of alternative fuels has gained central importance in political agendas. A promising candidate for clean shipping that meets the IMO goals is ammonia since it is a carbon-free fuel. Ammonia (NH3) shows good advantages in handling and storage, and it ensures long sea voyages without any significant loss in cargo space for a reasonable price. Hence, ammonia has the potential to improve the environmental footprint of global shipping enormously. Induced by the introduction of stricter regulations in the so-called emission control areas (ECAs) in Northern Europe in 2015 as well as the renewed global sulfur cap, which entered into force in 2020, ship operators had to decide between different compliance methods, among which the most popular solutions are related to the use of expensive low-sulfur fuel oils, newbuilds and retrofits for the usage of liquefied natural gas (LNG) or the installation of scrubber technology. A change to ammonia as a marine alternative fuel represents an additional novel future option, but the successful implementation depends on the availability of NH3 in the ports, i.e., on the installation of the maritime NH3 infrastructure. Currently, the single German NH3 terminal with maritime access is located in Brunsbüttel, the western entrance to Kiel Canal. The distribution of NH3 from the existing NH3 hub to other German ports can be analyzed by the mathematical model of an inventory routing problem (IRP) that is usually solved by combinatorial optimization methods. This paper investigates the interrelated research questions, how the distribution of marine NH3 fuel can be modeled as an IRP, which distribution mode is the most economic one for the German ports and which modal mix for the NH3 supply leads to the greenest distribution. The results of this paper are empirically validated by data that were collected in several EU projects on sustainable supply chain management and green logistics. The paper includes a special section that is dedicated to the discussion of the economic turbulences related to the Ukrainian war together with their implications on maritime shipping.
1. Introduction
The agenda of the International Maritime Organization (IMO) toward greener shipping is primarily driven by the implementation of the Paris Agreement on climate protection, which specifies a 50% reduction in greenhouse gases (GHGs) by the year 2050. First steps have already been taken with the introduction of stricter regulations, launched in 2015, concerning the established emission control areas (sulfur emission control areas (SECAs) and nitrogen emission control areas (NECAs)) around the globe, next to the implementation of the global sulfur cap in 2020 [1,2]. Thereby, the experience of more than seven years of renewed SECA regulations in the Baltic Sea Region (BSR) shows rather neglectable externalities on the maritime industry; i.e., the SECA regulations in the BSR did not meet the grave negative economic assumptions of skeptical stakeholders proclaimed before the initialization in 2015 [2,3]. Induced by the implemented stricter SECA and subsequent NECA regulations, an increasing interest in alternative marine fuels was noticeable, and a special focus was placed on liquefied natural gas (LNG). Hence, numerous LNG-powered vessels have been constructed in recent years. Thus, the growing LNG demand pushed ports to invest in the establishment of needed LNG supply facilities [1]. Furthermore, since the start of the Ukrainian war in February 2022, the issue of LNG supply for Europe together with complementary discussions about alternative fuels gained even stronger importance on the political agenda.
German ports have been slightly late concerning the installation of well-needed LNG infrastructure. For instance, a new LNG terminal will be established at the Port of Brunsbüttel situated at the western entrance to the Kiel Canal, whereas other, but smaller, terminals are in preparation in the North Sea port of Wilhelmshaven as well as in the Baltic port of Rostock. However, the LNG facility in Brunsbüttel will be the main entrance point and the new German hub for LNG into the German market with a terminal capacity of up to 5 billion cubic meters. The establishment of these terminals will solve only partly the LNG supply issue with regard to the maritime demand in the ports since LNG distribution to the other German ports has to be realized as well. Therefore, Prause and Prause [4] investigated the LNG distribution in form of a classical inventory routing problem (IRP) together with an analysis of the estimated LNG consumption and the different LNG distribution modes by considering the most important German ports in the Baltic Sea and the North Sea.
Recent developments in the maritime industry indicate a shifting focus from LNG as marine fuel to other alternative fuels—mainly hydrogen, biofuels and also ammonia (NH3) [1]. Particularly, against the background of the currently enabled sustainable production of green ammonia, growing attention is dedicated to the usage of NH3 as marine fuel [5]. Hence, the interest in ammonia is manifold, on one hand as a carbon-free fuel that can be utilized in combustion engines, and on the other hand as a medium for storing and transporting hydrogen [6]. However, despite the great interest and the fact that ammonia is already widely used in agricultural business, the use of ammonia as a marine fuel requires initially a sufficient NH3 infrastructure together with an establishment of legal regulations as well as a solution to some technical challenges.
Tightly related to the introduction of ammonia as a marine fuel is the issue of distribution among the different ports. Currently, ammonia terminals at the seashore are still rare, and both the construction of such facilities and the subsequent storage of NH3 are quite expensive. A critical view of the countries of the BSR reveals that only a handful of such port-situated NH3 terminals exist, so the development of the NH3 infrastructure represents a crucial issue for the widespread use of NH3 as a sustainable marine fuel [5]. Coincidentally, the most important German ammonia terminal is also located at the seashore at the port of Brunsbüttel; i.e., the port of Brunsbüttel carries the role of the central German LNG port as well as the central German ammonia port. Consequently, the characteristics of a marine LNG distribution can be directly compared with the potential NH3 distribution to other German ports.
Against this background, this study does not discuss the pros and cons of ammonia as marine fuel compared to traditional or green marine fuels. This paper investigates different scenarios for the NH3 distribution from the central German NH3 terminal at Brunsbüttel port to other German ports together with different modes of operation and compares and discusses the results for NH3 with the distribution of LNG.
The underlying mathematical models for marine fuel distribution in German ports are formulated as inventory routing problems (IRPs); i.e., the models for fuel supply—i.e., LNG as well as NH3—from the central terminal in Brunsbüttel to the German ports are assumed to be realized by vessels, trucks and a mixture of both transport modes. The models consider the costs of each distribution channel as well as the related CO2 emissions. In a similar way, as already demonstrated within the LNG case by Prause and Prause (2021), it can be stated that also in the ammonia case within the present paper, the main part of the overall distribution costs consists of the storage cost for NH3. The mathematical models are constructed and solved by mixed integer programming (MIP), which is well known in business logistics [7].
Accordingly, this paper investigates different scenarios for the NH3 distribution from Brunsbüttel port to other German ports together with different modes of operation by comparing transport costs of vessels and trucks as well as the cost of NH3 storage at the ports. The different scenarios will be further analyzed and discussed by determining the CO2 emissions that occur in each scenario as well as estimating the ecological dimensions of the different distribution channels. Within a supplementary step, the results of the present study concerning the NH3 distribution will be benchmarked against the research results from [4], who studied LNG inventory routing in German ports. Thus, the study will answer the research questions of (1) how the NH3 distribution among the German ports can be modeled as an IRP, (2) which distribution mode is the most efficient one and (3) which modal mix of marine NH3 supply for German ports is the greenest—especially through the benchmark with the comparable marine LNG distribution.
The research results generated by the present study are validated by empirical data that were collected in several EU projects that thematically focused on sustainable supply chain management and green logistics. Methodologically, the data were generated by desktop research conducted mainly in the EU projects “Connect2SmallPorts”, “EnviSuM” and “GoLNG” within the last three years. The underlying economic values concerning fuel prices, exchange rates and costs are taken from the end of 2021 [8], i.e., before the start of the Ukrainian war. Hence, a special section is dedicated to the discussion of the economic impact of the Ukrainian crisis on the research topic.
2. Theoretical Background
2.1. Ammonia as a Marine Fuel
Ammonia is a compound of nitrogen and hydrogen (NH3). It is globally one of the most important inorganic chemicals since currently about 80% of the international production is used as fertilizers in the agricultural business. The industrial production of ammonia usually takes place according to the Haber–Bosch process, which is linked to a high energy consumption—that is most often still covered by the usage of fossil fuels—for transforming nitrogen and hydrogen into NH3. Thus, traditional NH3 production cannot be considered environmentally friendly. Hence, modern processes concentrate on the generation of green ammonia in which renewable energy sources are used within the production process. Among other things, this is the reason why ammonia has been examined more closely during the last decade by the energy supply industry as fuel for combustion engines or fuel cells in the context of decarbonization. However, ammonia also has its disadvantages, namely its high toxicity for humans and maritime organisms, such that the use of NH3 requires high safety standards leading to extensive construction and handling procedures. The physical and chemical properties of ammonia characterize it as a colorless, harmful gas with a pungent odor—the characteristic smell can be compared with the smell of urine. At a standard temperature of 20 °C and atmospheric pressure of 1 bar, NH3 as gas is lighter than air. The boiling point of NH3 is at around −3 °C under atmospheric pressure, which makes it easier to handle than LNG which has its boiling point at about −161 °C. Ammonia has no embrittlement issues, wherefore metallic tubing, valves and tanks do not need to be periodically replaced. Recent research has shown that converting LNG storage tanks and the corresponding technology to ammonia storage technology is possible without any extensive adjustments since the materials used for full containment and single-containment LNG tanks are generally compatible with refrigerated ammonia tanks [5].
However, under certain conditions, liquefied ammonia is known to cause stress corrosion cracking (SCC) in steel. Extensive research and investigations have been conducted on ammonia SCC, leading to preventative measures such as the adoption of low-temperature carbon steel for refrigerated ammonia tanks. Concerning the structural design of LNG tanks, liquid level and density are the necessary parameters used to calculate the static and dynamic pressures that act on the wall and foundation. The structural integrity of the tank must be revalidated using the increased hydrostatic load. Based on the ratio of LNG density versus liquid ammonia density, the maximum liquid level allowed for ammonia storage is expected to be approximately two-thirds of the original design; hence the nominal tank capacity when used for ammonia will be approximately two-thirds of the original design [9].
A profound analysis of ammonia as a potential marine fuel also requires the comparison of the corresponding physical and environmental aspects with traditional alternatives, which goes beyond this article and can be found in the scientific papers of [10,11]. The important parameters for our study comprise more the physical characteristics such as the density, the lower heating value (LHV), the energy per volume and the normalized volume. These parameters are considered for NH3 and the traditionally well-known marine fuels marine gas oil (MGO) and LNG. The parameter of the normalized volume compares the energy per volume to the basis of the specific energy per volume of MGO (cf. Table 1).
Considering the LHV, LNG is on a similar level to MGO, whereas ammonia only shows roughly half of the energy potential compared with MGO. Nevertheless, the energy values of each fuel are not informative if they are not considered in relation to density and energy per volume. By normalizing these figures, it turns out that ammonia in comparison to MGO has only one-third of the energy density, whereas compared to LNG, the energy density is only half as high. Thus, a NH3-propelled vessel would suffer massive cargo capacity losses due to larger NH3 fuel tanks and thus generate significant opportunity costs. Already in the case of LNG, the issue of lost cargo space was followed by an intensive discussion in the shipping industry, especially in the context of LNG retrofitting in the case of freight vessels. However, LNG also shows disadvantages in terms of GHG emissions, particularly by emitting methane as unburned residues—the so-called methane slip.
2.2. Inventory Routing Problems
The IRP has a central importance in logistics, in which it leads to multifarious applications as well as the development of new algorithms ([12,13,14]). The classical approach to solving an IRP is based on combinatorial optimization methods, but also other formulations in form of a Markov decision process or a two-phase decomposition are used to solve the problem ([15,16]). A look into the scientific literature reveals that in recent studies an increasing number of problems in green logistics and multimodal supply chain management have been tackled by using IRP models (cf. [17,18,19,20,21]). The underlying idea of all IRP approaches is to consider a fixed length of time-steps in which a given set of deliveries shall be fulfilled, i.e., fixing a sequence of time-steps by using only one distributing vehicle for each route with the goal of obtaining the best routes for supply, so that the costs for operation, transport and storage become minimal. The approach of considering several time-steps generates sets of solutions for the distribution that use different routes in each time-step. Consequently, some of the retailers do not need to be supplied every time-step, which results in lower total costs for the whole distribution model.
IRPs are usually formulated with a given storing capacity together with the inventory volume that needs to be routed; i.e., the storage volume has to be minimized. In our case, no capacity is fixed for the storing facilities in the ports; i.e., by solving the MIP equations, the size of the storages with respect to the considered price for NH3 storing at each port is already optimized. By doing so, we obtain an optimal solution for the costs together with the best size of the storages. The calculated results will be compared with the model in which trucks distribute the ammonia—representing an MIP formulation of a vehicle routing problem (VRP) that also leads to the minimal total costs of supply.
Scholars investigated VRPs and IRPs in a large variety of cases and scenarios including green logistics—for instance, with electric vehicles (e.g., [22,23,24,25]). Related studies such as that of [26] considered scenarios with predefined time-windows for supply, whereas [27] investigated a VRP from several starting depots to the corresponding customers. VRPs are usually hard to solve in the case of many time-steps or a large number of customers, so often heuristics or simulated annealing approaches are used to solve the problems ([28,29]).
Ref. [4] studied the potential LNG distribution as marine fuel from the central hub in Brunsbüttel to other relevant German ports by analyzing and discussing three different models for LNG supply. Thereby, all considered distribution models were formulated as routing problems with a single vehicle or with multiple equivalent vehicles, resulting either in an IRP, a VRP or a distribution model that is a composition of an IRP and a VRP. The three different LNG distribution models for the German ports comprised the distribution via a vessel (model A), the distribution by trucks (model B) and a combined multimodal distribution by vessel and truck (model C).
The first model A considered the distribution only by a single vessel and was modeled as an IRP assuming only internal deliveries, i.e., assuming the supplying and receiving facilities belong to the same company. Here, the instance was split into three traveling salesman problems (TSPs), each having its start and end in Brunsbüttel. In the first step, the problems were solved in order to determine the necessary length of the time horizon that needs to be considered in the IRP. Since the same procedure will be carried out in the present study for the examined NH3 distribution, the underlying mathematical models for the IRP and VRP together with a definition of the corresponding variables can be found in the Appendix B.
The fact that the supplying trucks are able to reach every port within one day facilitated the optimization tasks so that all calculations could be solved on daily basis as long as the ports are equipped with LNG storages to buffer the daily demand. The same applies for the NH3 case; i.e., after having calculated and delivered the demand in all ports in form of the integer value of full-truck-loads (FTLs), the resting demand can be solved as a VRP in the shape of less-than-a-truckload (LTL). Consequently, we solve the VRP and obtain a solution determining the number of needed trucks together with their routes in order to satisfy the demand, so that the total costs of this distribution model become minimal.
3. Methodology
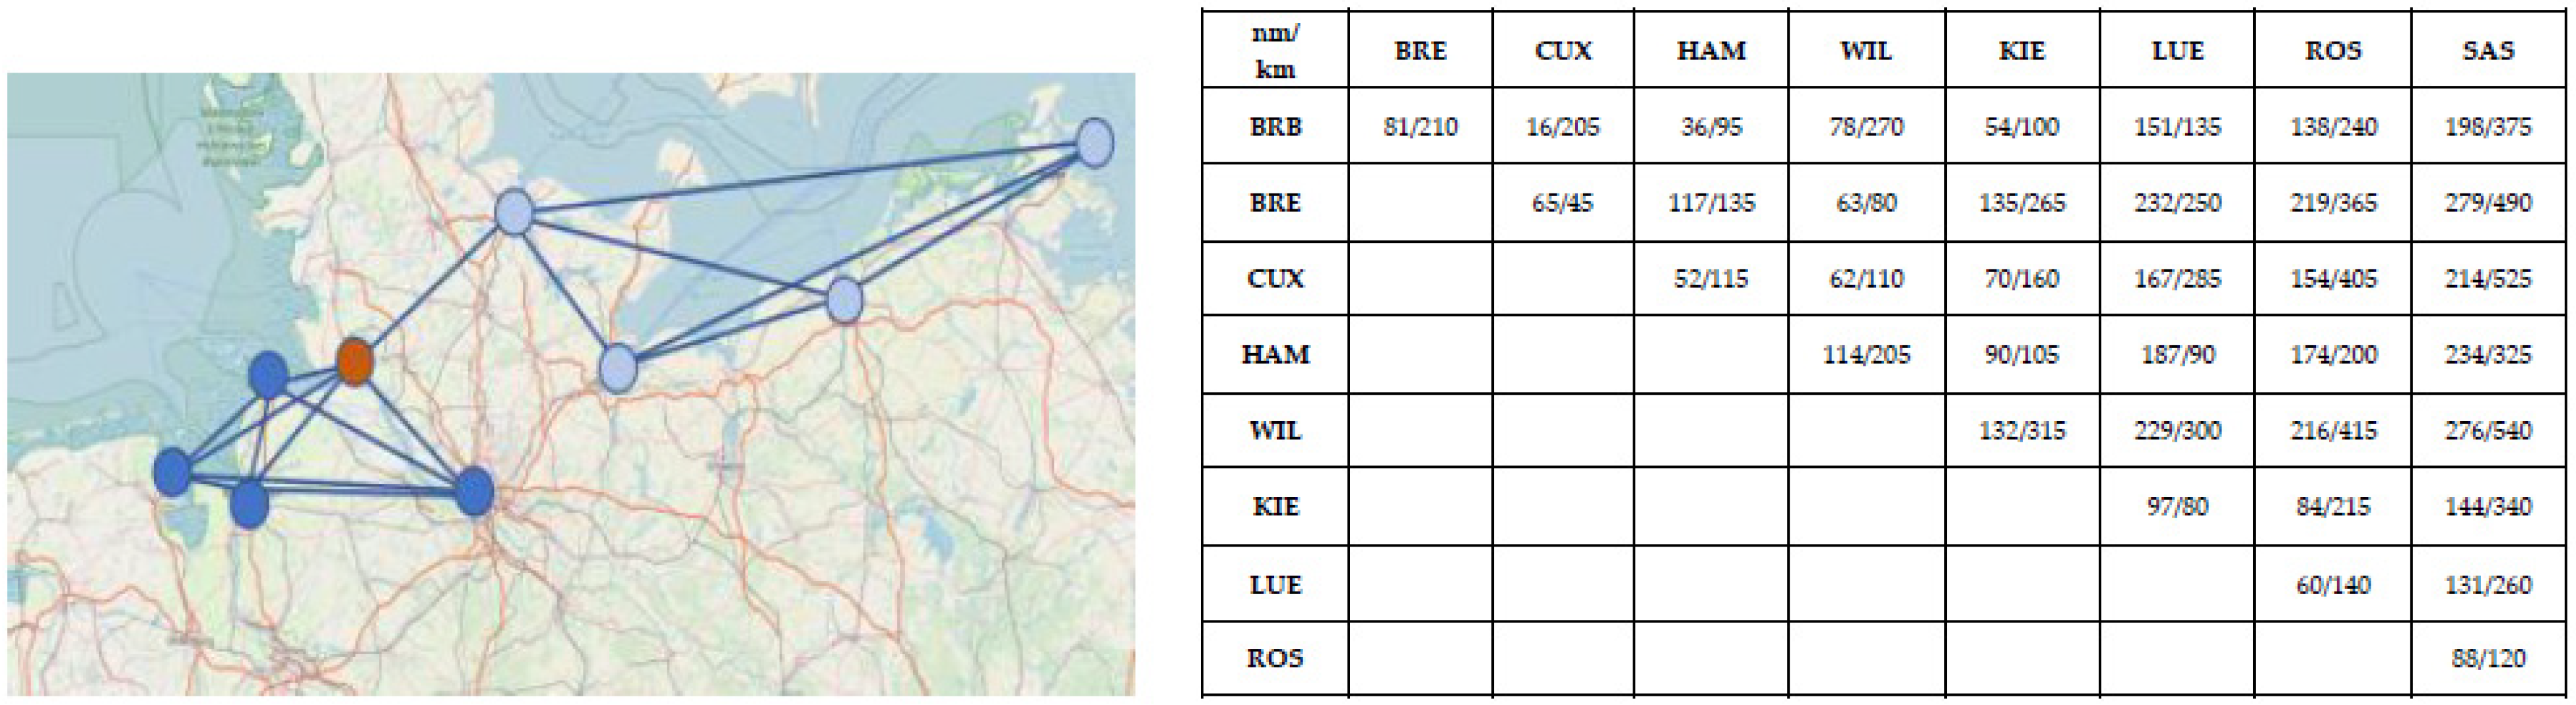
The present study follows the graph-theoretical model of [4], which is based on the geographical data of the German main ports (represented by the vertices of the graph in Figure 1, with the main NH3 terminal located in the port of Brunsbüttel colored red). The four German Baltic ports are located in the east and colored light blue, whereas the four other North Sea ports are colored dark blue and are located in the west. Like in the investigated LNG case of [4], in the present ammonia case, the ports are labeled by three-letter abbreviations that are for the main NH3 hub in Brunsbüttel (BRB); for the four largest German North Sea ports Bremen/Bremerhaven (BRE), Cuxhaven (CUX), Hamburg (HAM) and Wilhelmshaven (WIL); and for the four most important German Baltic Sea ports Kiel (KIE), Lübeck (LUE), Rostock (ROS) and Sassnitz (SAS). These nine ports generate a graph G = (V, E) with the vertex set V representing the set of the ports and the set of all possible edges E representing the connections between the ports.
The distribution graph G requires special attention due to the particular role of the Kiel Canal (NOK) connecting the four western North Sea ports and the four eastern Baltic Sea ports. This is the rationale for adding an additional node for Kiel (KI2) to the vertex set V of the graph together with an additional edge (KI2, KIE) labeled with zero costs and zero demand per time-step. With this second vertex KI2, it is possible to start a tour at Brunsbüttel (BRB) through the Baltic ports and apply the IRP model [4]. The node KI2 has the same distances and edge costs to all other Baltic ports as Kiel (KIE).
Thus, the underlying graph consists of two complete graphs that are only connected by a single edge, starting and ending in Brunsbüttel, where the NH3 hub for central distribution is located. The distances between the ports are determined by a combined sea/road distance matrix expressing in the first position the maritime NH3 transport distance between the ports by vessel and in the second position the road distances for a tentative truck transport between the German ports [4]. The underlying geographical and corresponding distances are shown in Figure 1.
Based on the distances, we will calculate and discuss three different inventory routing models for the NH3 distribution between the German main ports. By doing so, we concentrate on NH3 distribution by ship and by truck, and we also consider multimodal supply to the ports realized by vessels and trucks. The corresponding environmental impact of the NH3 distribution is calculated based on the distances via sea or road and the average CO2 emissions for each edge depending on the transport modes and taking into account the distance and cargo load [30]. All estimated costs in the models are full costs taken from internationally recognized studies of business logistics, and they are based on economic values including fuel prices, exchange rates and costs taken from the end of 2021, i.e., before the start of the Ukrainian war [8]. In February 2022, the turbulences around the Ukrainian war heavily jumbled the international markets, especially the energy prices, but since the long-term effects are not clearly predictable, our choice of taking the economic environment for our research seems to be reasonable. The application scenarios and values from before the Ukrainian war also is justified since we use the same mathematical model and corresponding distribution technologies as in the LNG case from [4]; i.e., we are able to discuss the present study of the NH3 distribution in comparison to the results of the former LNG study.
In order to fully understand the research design, it has to be mentioned that [4] used an LNG demand estimation for the German ports forecasting the daily average LNG demand for each port. In this study, we assume that the estimated LNG demands are fully substituted by ammonia as marine fuel to be able to compare the economic and environmental consequences in the related IRP solutions of both fuels. The NH3 demand of the German main ports has been estimated on the basis of the corresponding LNG demand, which has to be translated into tons by using the physical and chemical characteristics of LNG and NH3. These estimations lead to the assumptions in applying the results of [4] that are shown in Table 2.
A delicate issue in the LNG distribution study is related to the costs of LNG storage at the ports [4]. The investigations revealed that the storage per day and per ton of LNG ranged around EUR 450, so from an economic point of view, a daily LNG supply to the ports is more cost-efficient than the utilization of storages. Consequently, under simple financial consideration, the LNG supply via vessels would not be an option, because a daily LNG supply with ships is not feasible; i.e., a fully maritime distribution is linked with high storage costs. Thus, the authors included an enlarged view of environmental aspects and considered different fuel supply models.
As in the LNG case (cf. [4]), we take for our NH3 analysis the same underlying dataset with the same ports, distances and energy demand profiles of the ports. Based on this assumption, three different IRP models with different distribution modes for the NH3 distribution between the German main ports are investigated. The first NH3 distribution type is realized by a vessel (model A), the second NH3 distribution type is realized by trucks (model B) and finally a mixed-mode distribution type by vessel and truck is considered (model C). All three distribution models are evaluated in terms of transported volume, time and costs. As already mentioned, due to the similar physical characteristics of both marine fuels, it is possible to use the same storage and transport technologies for LNG as well as for NH3. Hence, we assume the same techno-economic data for the storage, the distribution vessels and the supply trucks that transport the different fuels between the main hub in Brunsbüttel and the other eight considered German ports.
Ref. [4] took into consideration for the marine LNG distribution two types of vessels with transport capacities, namely one vessel of 5000 m3 and another of 7500 m3. A cost analysis revealed that the daily operating costs for the two vessel types are EUR 4970 for the 5000 m3 vessel and EUR 5587 for the 7500 m3 vessel. In addition to the daily operating costs, it is necessary to take into account also the voyage costs that include not only the fuel costs for propelling the ships but also canal dues for passing the Kiel Canal (NOK), which is compulsory when commuting between Baltic Sea and the North Sea. Since the analysis of the vessel costs is partly expressed in USD and our research takes place in Europe, we use for our calculations the currency EUR by applying an exchange rate of USD 1 = EUR 0.90.
Thus, we obtain the following costs for each edge for using a 5000 m3 and a 7500 m3 vessel. Table 3 expresses the voyage costs for each vessel type, where the upper figure represents the voyage costs along an edge of the graph for the smaller vessel and the lower amount in each cell of the table shows the voyage costs for the larger vessel. Hence, a detailed calculation of the voyage costs yields the values that are shown in Table 3, in which all amounts are expressed in EUR.
For land-based transport, the model assumes trucks with a capacity of 30 tons of fuel, where each truck is composed of a semitrailer and trailer with a 15-ton capacity each. Furthermore, we assume a 24/7 service of the distribution trucks and a normal German working time of an employee, which amounts to 1690 h per year. The variable costs per kilometer for the distribution vehicle will also be called transportation costs.
4. Findings
By using the underlying dataset of the three different IRP models for the NH3 distribution between the main terminal in Brunsbüttel and the other German main ports, it is possible to calculate and assess the three distribution modes for the NH3 distribution by vessel (model A), by trucks (model B) and finally by mixed-mode distribution (model C). All three distribution modes are evaluated in terms of costs, time and related CO2 emissions. Within a final step in the present study, the elaborated results concerning the potential NH3 distribution will be benchmarked against the findings of the study by [4], who studied the LNG distribution.
The great advantage of our approach is that the underlying geography as well as the transport and storing technologies of LNG and ammonia are comparable, so the pure distribution indicators can be compared. As already mentioned, we assume the same daily storage costs for NH3 as for LNG, which amount to EUR 190.50 per m3 [4]. Considering the different physical properties of LNG and NH3, this yields daily storage costs per ton of EUR 453.60 for LNG and EUR 312.30 for NH3.
Logistics performance and costs are usually considered on the basis of distance and tons of transport volume. Since the energy and density equivalents of LNG and NH3 differ, we use the fact that one ton of LNG equals 2.688 tons of NH3, so that we are able to transform the demand tons of LNG into tons of NH3 and vice versa. A closer look at the round trip covering all German ports adds up to 683 nm, which is composed of two sub-tours—the first one through the North Sea ports with a length of 294 nm and the second sub-tour through the Baltic ports with 389 nm. Hence, a vessel plying with a speed of 12 knots will need 57 h for this distance, plus passing the passage through the NOK two times, which takes in total 20 h. Thus, we obtain a total time for the round trip of 77 h, which equals 3 days and 5 h. In addition to that, we have to include the time for loading and unloading the vessel.
4.1. The Results of the NH3 Distribution with Model A
Model A is dedicated to the use of a vessel for distributing the NH3 fuel between all German ports. For a full round trip of 683 nm by calling all Baltic ports and all North Sea ports and using the Kiel Canal (NOK) for switching between the Baltic Sea and the North Sea, a vessel plying with an average speed of about 12 knots needs a total time of 4 days–including loading and unloading, traveling and 10 h for passing the NOK one time. Hence, the supply route of the supply vessel consists of two loops that are linked by the NOK, whereby the NH3 hub in Brunsbüttel port is passed for reloading. Furthermore, the supply vessel can be sized so that the transport NH3 capacity can be chosen as the maximum of the North Sea port demand and the Baltic port demand.
Since the considered time horizon for one round trip is four days, we can conclude from Table 2 that the demand of the North Sea ports is 4826 tons of NH3, whereas we need to supply the Baltic ports with 3679 tons of NH3. Hence, the vessel needs to have a capacity of at least 4826 tons as its size is determined by the maximum demand of both sub-tours since the vessel can be reloaded each time it passes Brunsbüttel, i.e., whenever it traverses the NOK. Since 4826 tons of NH3 have a volume of 7910.62 m3, we need a vessel of at least 8000 m3 volume so that we assume a carrying weight capacity for the vessel of 6500 dwt.
Such a vessel that is able to serve all German ports in a 4-day voyage, generating daily operating costs of about USD 6300 or approximately EUR 5660, as well as the related transport costs with an hourly fuel consumption of half a ton of LSMGO, which overall leads to travel costs of EUR 255 per hour [4]. Additionally, we need the cost of storing one ton of NH3.
Within this model, the ports must be able to store their 4-day demand of marine NH3 fuel in tanks. By assuming the previously mentioned storage costs of EUR 312.30 per ton for NH3, we can calculate that the total NH3 storage capacity for 4 days in the German ports of 8505 tons of NH3 yields overall annual storage costs of EUR 969,437,798. Hence, the daily and hourly results have to be transformed into annual values. Finally, by summing up the results of the NH3 IRP for model A, we receive annual costs for the vessel distribution of:
| Transportation Costs: | EUR 2,617,615 |
| OPEX: | EUR 2,060,240 |
| Total distribution costs: | EUR 4,677,855 |
| Storage costs (4 days): | EUR 969,437,798 |
| Total annual costs of model A: | EUR 974,115,653 |
The obvious result of the analysis of the vessel distribution model A lies in the fact that more than 99% of the total costs are related to storage costs that are driven by the 4-day period of storing the ammonia in the ports. The storing costs depend on technological progress, so it is expectable that the cost levels will decrease in the future.
4.2. The Results of NH3 Distribution with Model B
Model B represents a fully land-based NH3 distribution on daily basis by trucks—mathematically expressed as a VRP. On first glance, the trucks have the same characteristics as in the LNG case [4], consisting of a tractor with a semitrailer and trailer, which together allow transporting a capacity of up 43 tons with an average speed of 60 km/h between Brunsbüttel and the different ports. However, due to the physical properties of NH3 compared to LNG, the transport capacity of the trucks has to be limited to 30 tons of NH3, since NH3 and LNG have comparable densities, so comparable tank sizes for transportation can be assumed.
By following [4], the operating costs—comprising capital costs, driver salaries toll and administrative costs—sum up to EUR 840 OPEX per day and truck with transport costs of EUR 0.82 per km. The calculations reveal that the NH3 distribution requires daily 66 FTLs directly serving the German ports and an additional truck fleet of 19 vehicles realizing the NH3 supply to the ports as LTL. The LTL volumes are consolidated to FTL loads and then distributed by round trip to more than one port, as shown in Table 4.
As shown in Table 4, first, the number of needed FTLs is determined by dividing the daily demand of the ports by 30 tons, so that we obtain the number of needed FTL deliveries directly to the ports. Since we aim to deliver only FTLs to the ports, the remaining volume of NH3 is consolidated into fractions of FTLs, which are then delivered by combined routes where the routing is gained according to the solution of an MIP. Deeply rooted in the fact that the remaining NH3 volume—i.e., the sum of the parts that exceed the FTLs—sums up to 4.88 FTLs, we can assume that five to eight additional trucks are needed to supply the eight different ports completely in combined routes.
In addition, the maximum number of daily round trips between Brunsbüttel and the considered ports is required in order to determine the number of trucks necessary for the direct delivery. Therefore, we divide the number of FTLs by the number of maximum possible daily tours to the ports and obtain on the basis of the desired combination of deliveries the number of 19 trucks.
Within a subsequent step, the determination of the costs for the combined deliveries is calculated by an MIP, which formulates mathematically the idea to find the routes for delivering the remaining 4.88 FTLs. The corresponding consolidated round trips covering the necessary LTL supply yield five round trips starting from the NH3 hub at Brunsbüttel (BRB). The resulting schedule for the consolidated supply consists of the following routes that can be realized by five trucks:
- BRB -> WIL -> BRE -> HAM -> BRB;
- BRB -> LUE -> ROS -> BRB;
- BRB -> HAM -> SAS -> ROS -> BRB;
- BRB -> CUX -> HAM -> BRB;
- BRB -> KI -> BRB.
Summing up the 19 trucks for the FTL distribution and the 5 needed trucks for the remaining NH3 supply (i.e., consolidated LTLs to 4.88 FTLs) yields overall 24 trucks that are necessary to safeguard a land-based NH3 supply. The corresponding financial analysis of this solution leads to the following daily costs for model B:
| Daily direct transport costs: | EUR 16,842.80 |
| Daily direct OPEX: | EUR 15,960.00 |
| Daily combined transport costs: | EUR 6241.80 |
| Daily distribution costs for model B: | EUR 39,044.60 |
Building upon this, the annual costs for the distribution of NH3 to all German ports via trucks are highlighted in Table 5.
These total annual distribution costs of model B until now do not contain the storage costs for buffering NH3 in the ports; i.e., we have to take into account the necessary storage costs in the ports, which sum up to EUR 242,359,450. Since the distribution of the daily demand and the arrival time of supplying trucks may differ, it could be meaningful to consider an additional storage of a 1-day demand as a safety buffer at each port. However, in the present study, we omitted these additional costs and neglected this situation. Thus, by summing up all cost items, we receive the annual cost statement for the VRP presented in Table 6.
Again, as already mentioned in the context of model A, the storage costs represent the most dominating cost category in model B as well—summing up to 94% of the total costs. Nevertheless, by comparing the cost levels of model A and model B, it is obvious that the total costs of model A are about four times higher than the total costs of model B, which is linked to the dominating role of the storage costs that are much higher in case of model A. More precisely, regarding the storage costs in model B in comparison to model A, it can be stated that the storage of the marine NH3 fuel is to a large extent distributed to the trucks, and thus, the share that is stored in the port is much lesser in the case in of model B.
4.3. The Results of NH3 Distribution with Model C
Finally, model C represents a combined model, in which the NH3 supply is organized by trucks and by vessel. The analysis of the supply volumes, costs and time results in a combined distribution model with a sea-bound NH3 supply for the North Sea ports and a supply of the Baltic ports by trucks. This approach follows model C in the study of [4] and has a time horizon of one day. By considering the daily NH3 demand in the German ports, it turns out that the North Sea ports have a daily NH3 fuel demand of around 2000 m3, whereas the Baltic ports only require about 1500 m3 of ammonia daily. Thus, the use of a vessel is more convenient for NH3 supply in the North Sea, and a closer look at the distances between the North Sea ports reveals that it is possible to distribute the NH3 between the North Sea ports in a daily round trip. The Baltic Sea ports will be further served by daily truck deliveries as already discussed in model B. It shall be noted that eight trucks are necessary to satisfy the demand of the Baltic Sea ports. As in model B, we calculate the direct deliveries to the Baltic Sea ports, and for the calculation of the combined routes distributing the LTL volumes of ammonia, we rerun the VRP, which yields three NH3 supply routes:
- BRB -> ROS -> SAS -> BRB;
- BRB -> KI -> BRB;
- BRB -> LUE -> ROS -> BRB.
The combined NH3 supply requires three additional trucks that distribute the ammonia along the routes to the Baltic ports—always starting and ending a route in the NH3 hub of Brunsbüttel (BRB).
The pure North Sea round trip allows the downsizing of the NH3 supply vessel to a transport capacity of 2000 m3 or expressed as cargo weight to 2000 dwt. Thus, by using the logarithmic function for determining the OPEX values of the considered vessels in the work of [4], we obtain operation costs of EUR 4609 and additionally assume an hourly fuel consumption of 0.42 tons of MGO, corresponding to the consumption of the small vessel considered in model C of [4]. The vessel uses the same routes in the North Sea as in model A. Furthermore, we have the same storage costs as in model B since this is again a model on a daily basis. The results of the financial analysis of model C are shown in the Table 7.
As already highlighted, it is again noticeable that the storage costs represent the most important cost category with more than 96% of the total costs. It is also obvious that the storage costs of model C are only about half as high as those of model A.
4.4. Consolidated Results for the Marine Fuel Distribution
Within this sub-section, we will investigate the different marine fuel distribution models from the viewpoint of green logistics. The scientific literature points out three pillars of green logistics that correspond to economic, ecologic and social issues [31]. The social dimension of the models will be neglected in our study since the working conditions in all models are comparable and no model comes along with specific social disadvantages. Hence, we reduce the investigation to the three dimensions of costs, emissions and time in order to assess the different distribution models by covering two of the main criteria of sustainable logistics. By doing so, within a first step, we consider the situation of the three NH3 distribution models and then compare these findings to the results of the examined LNG case from [4].
To consolidate and compare the results of the three NH3 distribution models, it is necessary to evaluate models A, B and C by their CO2 emissions, since the carbon footprint represents a good indicator of the greenness of the corresponding supply model. The base for the CO2 assessment is the type of transport mode, the load factor, the distance and the transport performance expressed in ton-km, which is abbreviated in the following as tkm. Thereby, we evaluate the models by the annual CO2 emissions. A conducted literature review revealed a large variety of estimations for the CO2 emissions of different transport modes. Ref. [4] used the average values of the study from [30], who estimated the CO2 emissions of a truck to be 62 g CO2/tkm and of a vessel to be 20 g CO2/tkm. These average values are in the same range as the emission values of the STREAM study of [32]. In the following discussion, we make use of the average values from the Cefic study in order to guarantee the comparison of the results from the LNG and the present NH3 study.
The vessel-based NH3 supply model A, which is realized by 4-day round trips, delivers an annual logistics performance of 126,893,311 tkm; i.e., by taking into account the CO2 emissions of the vessel of 20 g CO2/tkm, the calculation yields an annual emission value of 2537.8 tons of CO2. The CO2 emissions for the truck-based NH3 distribution in model B are composed of the 66 daily FTLs that yield a daily logistics performance of 308,100 tkm or equivalently an annual transport performance of 112,456,500 tkm. Additionally, we have to consider the LTL round trips of the five trucks that are heading for more than one port. These round trips require a daily logistics performance of 2,983,455 tkm or 10,889,611 tkm per year. By summing up, it can be stated that the FTL and LTL deliveries are responsible for a total annual logistics performance of 123,346,111 tkm per year, which equals annual emissions of 7647.5 tons of CO2.
Finally, model C has to be analyzed by keeping in mind that the combined NH3 supply consists of a vessel-based distribution in the case of the North Sea ports and a truck-based NH3 supply for the Baltic Sea ports. The North Sea delivery by vessel realizes an annual logistics performance of 52,222,001.75 tkm, whereas the truck-related NH3 distribution yields an annual logistics performance of 36,577,989.75 tkm, which in turn leads to a total annual transport performance of 88,799,992 tkm. The CO2 emissions are calculated by evaluating again the vessel transport performance with 20 g CO2/tkm and the truck distribution with 62 g CO2/tkm. These calculations yield annual CO2 emissions for the truck-based distribution in the case of the Baltic Sea ports of 2267.8 tons, whereas for the vessel-based distribution in the case of the North Sea ports, 1004.4 tons will be achieved. Overall, model C has a total transport performance of 88,799,992 tkm and annual CO2 emissions of 3312.3 tons.
The results of our analysis are summarized in Table 8, which shows in one glance for all our investigated NH3 distribution models (A, B and C) the distribution costs—comprising the costs for transport and the operational expenses—together with the total costs—including the storage costs in the ports—as well as CO2 emissions and the corresponding time.
Concerning the LNG distribution to German ports, in the following, we will briefly recall the main findings of [4]. In a similar way, the research study also investigated different models for the distribution of LNG between the main German ports, whereby the underlying IRP structure is comparable to the NH3 situation of the present study, which becomes also apparent on the basis of the definitions of the relevant models:
- Model A: LNG distribution by vessel;
- Model B: LNG distribution by trucks;
- Model C: Combined distribution ways.
Model A considered, as in the NH3 case, storages in the ports, and the maximal capacity of the LNG storages equaled the demand of 4 days. The supply by trucks in model B was based as well on daily round trips from the LNG hub in Brunsbüttel (BRB) to the ports. Lastly, the combined distribution model used daily truck deliveries for the Baltic Sea ports and 1-day round trips by a vessel in the case of the North Sea ports. The final assessment in form of the evaluation vectors for the three models can be found in Table 9.
At first glance, Table 8 and Table 9 show no difference concerning the time dimension, because all corresponding distribution models of NH3 and LNG have the same periods for supply. Furthermore, the figures for the distribution of NH3 and LNG in model A differ by about 10%, where the NH3 distribution costs are about half a million euros higher than those for the LNG case. More significant differences are visible in model B where the NH3 distribution costs are more than twice as high that those for LNG. Finally, model C reveals a difference of about EUR 3 million.
Striking are the remarkable differences between the total costs, which are caused by the storage costs in the ports. Despite the fact that the supply periods of both marine fuels are identical, the differing physical properties of ammonia and LNG are the drivers of the differences in the storage costs. Significant differences between the NH3 case and the LNG case are also obvious in the area of CO2 emissions. Here, the ammonia distribution models generate about twice as many GHG emissions or even more than in the LNG case, which is related to the different physical properties of the two fuel types.
5. Discussion
As already mentioned, a first comparison between the values of the NH3 and the LNG supply models revealed partly significant differences between the considered costs and emissions. The major difference in model C stems from the different volumes that have to be transported between the German ports due to the different physical properties of both marine fuels. Another obvious difference appears in the case of the storage costs in the ports that lead to maximum values in both cases in model A, because the fuel supply is executed in 4-day periods, since a single round trip with a vessel through all German ports requires four days. Thus, the fact that the total transport costs of model A for NH3 are about 1.5 times higher than for LNG has its reason in the necessary 4-day round trip by a vessel, in which the transported and stored NH3 volumes are significantly higher than those of LNG due to lower energy density of NH3 causing higher storage costs. Furthermore, considering model A, the maximal storage capacity of the ports equals the demand of 4 days, which implies that the model tries to minimize the storage costs first; i.e., it is cheaper to deliver the demand of the next 4 days but not more. Therefore, we conclude that the transportation costs have to be cheaper than the storage costs, even for those ports with small demand and long distances to other ports, as it appears for the port of Sassnitz (SAS). Consequently, an approach to improve the existing optimal routing solution would be to prolong the periods of fuel deliveries to these ports by exceeding the implied 4 days. Thereby, the time values for the different models also express flexibility and deliver security, since the demands in the ports are only estimated, so random changes in the predicted demands can be balanced within the given timeframes.
An advanced sensitivity analysis for the calculation of the maximum reasonable price for the storage per ton of LNG or NH3 leads to a binary search in the interval [0, 453.6]. Such a search of the storage costs yields maximal prices in the range between EUR 5.20 and EUR 6.20 per ton of LNG or NH3 for appropriate vessels. According to such a price range, it makes sense to reduce the number of deliveries to the port of Sassnitz (SAS) and thus to deliver fuel only every second time-step—i.e., every second round trip. Another modification in the touring plan occurs if the storage costs fall into a price range between EUR 1.30 and EUR 2, i.e., when the port of Sassnitz (SAS) is supplied only every fourth time-step and all other Baltic Sea ports are supplied every second time-step. Nevertheless, it has to be stressed that this case might only occur insofar as the storage price decreases more than 98% compared with the current actual values used in the model.
The investigation of the ecological dimension of the distribution models reveals that the supply by vessel—represented by model A—is in both fuel cases the most ecological option since it yields the lowest CO2 emissions, followed by models C and B. These results are not surprising, considering the ecological properties of the underlying transport modes of the models due to the different carbon footprints of seaborne and land-based transportation. In addition to that, both fuel cases yield a ratio of CO2 emissions between model B (highest emissions) and model A (lowest emissions) of around three, which highlights comparable environmental relationships within the distribution models. Finally, the circumstance that the CO2 emissions related to ammonia are more than twice as high as those in the case of LNG can be traced back again to the physical differences of the marine fuels. On the other hand, the central weak points of model A are related to the high total costs and the low flexibility of the distribution solution, since each port is only served in a 4-day interval, which makes it difficult to react to random demand changes.
By focusing on the NH3 distribution costs, it becomes obvious that model A—followed by model C—represents the most economical option, whereas model B faces the highest distribution costs, which is even true in both fuel cases. A different picture appears by considering the total costs of NH3 distribution where now model C is the most economically favorable, followed by model B, whereas in the case of model A the costs are more than three times as high as those of models C and B. The LNG case shows comparable results. A comparison of the distribution costs of the different models for both fuels reveals a higher cost spread for ammonia compared to LNG, so a management decision between the different models is linked to smaller regrets than in the NH3 situation.
In accordance with the scientific literature, the three main pillars of green logistics consist of the economic, ecologic and social dimensions, and the social dimension can be neglected within the present study due to existing comparable working conditions in all considered models. Hence, the two main dimensions of sustainable logistics are covered through the comparison of costs and emissions for each model, and they are complemented by the time dimension. However, there are economic dimensions that might be considered, namely the distribution costs and the total costs that differ by the storage costs at the ports. By focusing on the distribution costs, it can be derived that the most economical solution for the distribution of both marine fuels is model A, i.e., the complete distribution by vessel, because this model enjoys the lowest distribution costs together with the lowest CO2 emissions. In all models, the NH3 distribution costs are higher than the costs for the corresponding LNG distribution. As already mentioned, the reason for this fact lies in the different physical properties of the fuels leading to different volumes and weights. This economic disadvantage for ammonia becomes even more significant when considering the total costs, which additionally include the storage costs. Accordingly, compared to LNG, the large volume factor of NH3 more than doubles the storage costs in the ports. Consequently, an analysis of the economic dimension of the marine fuel distribution reveals a clear competitive advantage for LNG, compared to NH3. The main disadvantage of model A lies in the low flexibility due to 4-day round trips that make model A vulnerable to random effects of fuel demand.
By taking into account the total costs as an economic dimension, then in both cases model C, i.e., the combined fuel supply with a vessel to the North Sea ports and a truck-based supply to the Baltic Sea ports, has the lowest total costs and reasonable CO2 emissions that come along with high flexibility based on daily fuel deliveries. Concerning the storage costs, [4] pointed out the special practical importance of truck-to-ship LNG bunkering, since LNG terminals are still not widespread and thus are often missing, even in large ports. Such a truck-to-ship bunkering and distribution option requires a large truck fleet and reveals high LNG supply costs. Nevertheless, a truck-to-ship LNG bunkering solution leads to reasonable distribution costs per distributed ton of LNG in the ports, but the truck-to-ship solution is rather an option for a certain transition period as long as the LNG demand is low. This bunkering solution is also applicable to ammonia; however, in the long term, NH3 terminals and storing facilities are the safer and better solution for handling larger volumes of NH3.
By summing up the findings of the present discussion, it can be derived that the most reasonable method for marine NH3 fuel supply, considering only the distribution costs and the CO2 emissions, is represented by model A, i.e., the ammonia distribution with a vessel, and this result is more obvious than that in the LNG case. The central weak point of model A can be traced back to the total costs that are driven by the NH3 storage costs in the ports, which are exorbitantly higher than those in case of the other models investigated in the present study due to the 4-day fuel buffering in the port. In turn, this is also comparable with the findings of the LNG case examined by [4], which—at the same time—is also the rationale for why many port operators and/or port authorities hesitate to invest in an LNG terminal. Thus, by considering the current technological state of the art, as well as the total costs and related CO2 emissions, it turns out that model C is the most reasonable decision at the moment. This is because model C has total costs that are less than half as high as those in the case of model A. Furthermore, it can be assumed that the technological development together with economy of scale effects in storage technology will have a positive impact on the cost structure of NH3 as well as that of LNG in the inventory routing problem, so that ecologically better solutions will be able to compete also economically with cheaper distribution forms.
Finally, it has to be mentioned as well that the CO2 emissions for the NH3 supply in all three models are much higher than those in the corresponding LNG cases. However, in this context, it has to be kept in mind that the use of green ammonia does not generate any CO2 emissions in production as well as in combustion, compared to the usage and burning of LNG in engines. A closer look at the annual CO2 emissions of the German ports when using marine LNG fuel yields a value of about 380 thousand tons of CO2 since the annual demand sums up to 125 thousand tons of LNG [4]. Hence, the maritime use of green ammonia would save all CO2 emissions that stem from burning the fossil fuel LNG, which has to be brought into the discussion of the evaluation of the IRP as well. Honestly, it has to be admitted that currently most of the available ammonia is still produced as brown ammonia, i.e., with the input of fossil fuels, whereas future ammonia production will be blue, i.e., based on the use of renewable energy ([5,6]).
A critical discussion about the results and their implications has to highlight as well the problem area of prices and availability for implied resources in the present study models. For our calculations, we used daily prices in order to achieve a realistic picture of the underlying business situation. However, these figures can only reflect the situation as a snapshot of the timeline that changes rapidly. Future changes in fuel prices together with other economic indicators such as increasing exchange and interest rates might lead to other outcomes. Nevertheless, the presented equation models of this study can be easily adapted to a new economic reality. Furthermore, financial long-term aspects related to investment appraisal, using more sophisticated methods from capital budgeting and real-option analysis, can be integrated into the presented models without any problems. Another issue touches on the availability of ammonia for maritime use, which includes two main aspects, namely the sufficient global production volume of NH3 for all technical purposes as well as the accessibility of ammonia for shipping companies. Both issues lie beyond the scope of this paper, but the developments around the Ukrainian crisis highlight impressively that these topics are crucial for the perspective of using NH3 in the shipping sector. Hence, future research activities might be triggered by the present study and, thus, may result in further developments of the models under investigation.
6. Current Political and Economic Turbulences
Since February 2022, the political and economic environment has been heavily in motion, with a significant impact also on the logistics sector. In the wake of the Ukrainian crisis, a dramatic increase in fuel prices as well as in commodities appeared with unpredictable economic consequences. The oil price increased from about USD 80 at the beginning of January 2022 to about USD 110 at the end of June 2022. This increase in the oil price was followed by sharp growth in all energy prices, including marine and truck fuels, and pushed inflation in nearly all economic sectors. Consequently, the price per ton of LSGO, LNG, diesel and even ammonia increased dramatically up to four times the price before the Ukrainian crisis [8].
Hence the question appears to which extent the results of our research are still relevant under the current economic frame conditions because the analysis is based on price levels before February 2022. This question also includes other economic base values such as exchange rates between USD and EUR as well as cost factors such as salaries and hardware costs. To answer the last question, it can be stated that inflation did not impact until now salaries and hardware costs to a great extent, especially because the assumption of our study was that the necessary assets of the transport infrastructure were already in the stock of the participating companies.
Thus, in future considerations, both transport models, namely the LNG transport as well as the NH3 transport, will use comparable assets so upcoming changes will impact both transport activities in a balanced way. The exchange rate between USD and EUR is mainly used in the parts related to maritime shipping and storage of the necessary fuel volumes in the ports. In addition, here comparable equipment is used so that changes in exchange rates do not treat either option with favor.
The biggest influence of price changes is dedicated to the fuel costs. Here, the fuel costs for transporting LNG or NH3 by ship or truck have a significant influence, but the effects are under control in the sense that in both transport options the fuel costs in the current calculations represent a certain percentage of the transport costs and this percentage has to be adapted to the new fuel prices in order to calculate the new transport costs. Here, the differences in the transport costs between different options become only larger in the case of increasing fuel costs and thus do not change the general result of our study. The base prices for LNG and NH3 play only a secondary role in the inventory routing analysis.
Finally, it has to be mentioned that the daily prices currently represent snapshots of economic indicators of a chaotic environment that can change heavily from day to day, so research on daily based indicators leads to volatile results that are not appropriate for long- or medium-term investigations. Hence, the authors decided to use pre-chaotic parameters to execute their research and to discuss the influence of topical issues on their research results.
7. Conclusions
The research within the present study investigated the possible usage of ammonia as a marine fuel in German ports under the viewpoint of an IRP. Within a first step, the potential NH3 demands of the German ports on the Baltic Sea and the North Sea were estimated. Then, based on an IRP approach, three different models that are able to satisfy the demand in the ports were proposed, and the corresponding results were supplementarily discussed. The three models represent three different modes of distribution: using vessels, trucks and a combination of vessels and trucks. Finally, the three models, named A, B and C, were transformed into mathematical equations based on an IRP and a VRP formulation.
The solution of the mathematical equations leads to a description representing the three models by a four-dimensional performance vector that consists of the distribution costs, the total costs, the CO2 emissions and the inter-arrival times between deliveries. The missing social dimension that is theoretically part of green and sustainable logistics considerations was neglected in the present study due to rather equal social conditions in all three models. All three ammonia supply models revealed a high share of storage costs in the total costs, whereby the assessment overall led to different solutions under ecological and economic viewpoints. Overall, the results of the present study are comparable with the findings of the study from [4] that examined the distribution of LNG as marine fuel among the major German ports. Nevertheless, the present study revealed significant differences between NH3 and LNG distribution as well, whereas among other things some economic advantages for LNG supply had been carved out. The political and economic turbulences after February 2022 that are linked to increasing fuel and commodity prices, including LNG and ammonia prices, change the numerical values of our calculations but do not change the general results of the research.
By summarizing the results, it can be stated that the main cost driver is currently represented by the storage of NH3 in each port and that the most economical way to master the costs is to reduce the amount of NH3 stored in each port. Hence, the vessel-based model A represents the most favorable NH3 supply model for the German ports considering only the distribution costs and the CO2 emissions. The picture changes if the distribution costs are replaced by the total costs in which also the storage costs are included. In this case, combined NH3 distribution model C, in which a vessel and trucks are used, becomes the most favorable option. This result is in line with the finding of the LNG study from [4]. Accordingly, the mixed vessel–truck distribution represents currently the most favorable supply mode of ammonia and LNG for the German ports when considering all relevant dimensions of sustainable logistics. This outcome will only change in favor of the eco-friendlier vessel-based supply model if the storage costs drop dramatically, which is likely to change in the future in case of technological progress together with economy of scale effects in storage technology.
Author Contributions
Conceptualization, G.P.; Data curation, F.P.; Formal analysis, R.P.; Funding acquisition, G.P.; Methodology, G.P., F.P. and R.P.; Software, F.P.; Supervision, G.P.; Writing—original draft, F.P., G.P. and R.P.; Writing—review & editing, F.P., G.P. and R.P. All authors have read and agreed to the published version of the manuscript.
Funding
Wismar University Research Funds.
Acknowledgments
This work has been supported by the European Regional Development Fund (ERDF) (INTERREG V B: Baltic Sea Region Programme & INTERREG V A: South Baltic Programme) within the projects EnviSuM, GoLNG and Connect2SmallPorts.
Conflicts of Interest
The authors declare no conflict of interest.
Appendix A
This Appendix presents the formulation of the MIP for the description of the underlying IRP for models A, B and C. All numerical calculations of the authors have been executed with the SCIP Optimization Suite 6.0 [33].
We start with the definition of the IPR equations for model A concerning the NH3 distribution of the German main ports by vessel. The necessary sets, parameters and variables in the equations for model A are described. The starting point of the definitions will be the distance graph G = (V, E) with V as the set of the ports and E as the set of edges. As already mentioned in the methodology section above, we consider two complete graphs, one for the North Sea and one for the Baltic Sea. These two complete graphs are considered as sub-graphs of the overall graph G, where the link between them is realized by the two edges (BRB, KIE) and (BRB, KI2). For the mathematical formulation of the new model, we have to introduce a larger number of sets, parameters and variables that are presented in the following lists:
Sets
- is the set of the ports located on the North Sea;
- is the set of the ports located on the Baltic Sea;
- ;
- ;
- is the set of edges between the ports;
- is the set of discrete time-steps;
- ;
- ;
- .
Parameters
- is the time horizon, i.e., the last time-step of the model;
- is the shipping cost of the edge given by the cost matrix;
- is the NH3 demand of port for 4 days given above;
- is the capacity of the vessel;
- are the daily storage costs for one ton of NH3;
- are the daily operation costs of the vessel.
Variables
- is a continuous variable determining how much NH3 is distributed to port i at time t;
- is a binary decision variable determining if edge ij is used at time t, in which additionally ;
- is a binary decision variable determining if port i receives a delivery at time t or not;
- is the inventory in port i at time t;
- is a continuous variable determining the maximum capacity of NH3 storage at port i;
- are the operation costs of the considered time period;
- are the storage costs of the considered time period;
- are the voyage costs of the considered time period.
With these definitions, we are able to formulate our MIP for the calculation of the underlying IPR for model A. Again, the main objective of our calculations is the minimization of the overall costs of the NH3 distribution to the German ports. The total costs comprise the operation costs and the transport costs for the NH3 deliveries. In addition, we consider as well the storage costs within the scope of the total costs, since in case of inter-arrival times of more than one day, the NH3 demand in the port has to be bridged by the NH3 storage in the port. Hence, via equations in the IPR model, it has to be safeguarded that the NH3 storage in the ports will never be empty, which in consequence is the rationale for the incorporation of additional equations. Building upon this background, we are able to formulate the mathematical model for the IRP for model A:
| (A1) | ||||
| (A2) | ||||
| (A3) | ||||
| (A4) | ||||
| (A5) | ||||
| (A6) | ||||
| (A7) | ||||
| (A8) | ||||
| (A9) | ||||
| (A10) | ||||
| (A11) | ||||
| (A12) | ||||
| (A13) | ||||
| (A14) | ||||
| (A15) | ||||
| (A16) | ||||
| (A17) | ||||
| (A18) |
Appendix B
After the formulation of the IRP equations for model A in Appendix A, we will now concentrate on the formulation of model B, representing the VRP for the land-bound NH3 supply between the ammonia hub in Brunsbüttel (BRB) and the German main ports. Similar to model A, first, we have to define for the truck-based model the sets, parameters and variables in order to formulate the equations:
Sets
- is the set of possible vehicles;
- the set of ports;
- ;
- is the set of edges, given by the street distance matrix from above.
Parameters
- is the maximum number of available trucks;
- are the costs of traveling edge given by the costs from the beginning of this model;
- is the demand of port ;
- are the daily operation costs of one truck.
Variables
- is the amount of NH3 truck r delivers to port i;
- is a binary decision variable determining if vehicle r is using edge ij or not. If , then , since we allow a truck to take the same route back to the depot;
- determines if vehicle r takes part in the supply of port i or not;
- determines if truck r is used or not;
- are the operating costs of the trucks;
- are the transport costs.
Equipped with these definitions, we are able to formulate the mathematical equations of model B, whereby again, the aim is to minimize the total costs of the supply via trucks. The MIP program for the corresponding VRP is shown in the following:
| (A19) | ||||
| (A20) | ||||
| (A21) | ||||
| (A22) | ||||
| 1 | (A23) | |||
| (A24) | ||||
| (A25) | ||||
| (A26) | ||||
| (A27) | ||||
| (A28) | ||||
| (A29) | ||||
| (A30) | ||||
| (A31) | ||||
| (A32) | ||||
| (A33) | ||||
| (A34) | ||||
| (A35) |
The objective function (A19) of this model aims at minimizing the total costs, consisting of transport (A27) and operating costs (A28). The constraints (A20) and (A21) ensure that whenever a vehicle delivers NH3 to a customer, it has to arrive at the port and leave this port, as well as that all vehicles start and end their tours at the Port of Brunsbüttel (BRB). Furthermore, constraints (A22) and (A23) guarantee that the demand at each port is satisfied and each truck cannot load more than one FTL. Thereby, we consider the leftover demand after the direct deliveries as the demand of each port that is in the interval [0,1], since there cannot be a demand greater than one truckload after the supply of the FTL(s). Constraint (A24) ensures that the tour of each vehicle does not contain a sub-tour according to [34]. Finally, constraints (A25) and (A26) define the number of vehicles that are used and which port is supplied by which truck.
References
- Philipp, R.; Prause, G.; Meyer, C. Blue growth potential in south Baltic Sea region. Transp. Telecommun. J. 2020, 21, 69–83. [Google Scholar] [CrossRef]
- Prause, G.; Olaniyi, E.O. A compliance cost analysis of the SECA regulation in the Baltic Sea. Entrep. Sustain. Issues 2019, 6, 1907–1921. [Google Scholar] [CrossRef]
- Atari, S.; Bakkar, Y.; Olaniyi, E.O.; Prause, G. Real options analysis of abatement investments for sulphur emission control areas compliance. J. Entrep. Sustain. Issues 2019, 6, 1062–1086. [Google Scholar] [CrossRef]
- Prause, F.; Prause, G. Inventory routing analysis for maritime LNG supply of German ports. Transp. Telecommun. J. 2021, 22, 67–86. [Google Scholar] [CrossRef]
- Gerlitz, L.; Mildenstrey, E.; Prause, G. Ammonia as Clean Shipping Fuel for the Baltic Sea Region. Transp. Telecommun. J. 2022, 23, 102–112. [Google Scholar] [CrossRef]
- AEA. Ammonia Energy Association. 2022. Available online: https://www.Ammoniaenergy.org (accessed on 1 July 2022).
- Pochet, Y.; Wolsey, L. Springer series in operations research and financial engineering. In Production Planning by Mixed Integer Programming; Springer: New York, NY, USA, 2006. [Google Scholar] [CrossRef]
- ECG. Bunker Prices. The Association of European Vehicle Logistics. 2022. Available online: http://ecgassociation.eu/Publications-Reports/General/Fuel-Prices/Bunker-Prices (accessed on 1 July 2022).
- B & V. Hybrid LNG & Ammonia Infrastructure: Key to a Green Economy; Black & Veatch: Kansas City, MO, USA, 2020. [Google Scholar]
- Ni, P.; Wang, X.; Li, H. A review on regulations, current status, effects and reduction strategies of emissions for marine diesel engines. Fuel 2020, 279, 118477. [Google Scholar] [CrossRef]
- Zhu, Y.; Zhou, W.; Xia, C.; Hou, Q. Application and Development of Selective Catalytic Reduction Technology for Marine Low-Speed Diesel Engine: Trade-Off among High Sulfur Fuel, High Thermal Efficiency, and Low Pollution Emission. Atmosphere 2022, 13, 731. [Google Scholar] [CrossRef]
- Archetti, C.; Bertazzi, L. Recent challenges in Routing and Inventory Routing: E-commerce and last-mile delivery. Networks 2021, 77, 255–268. [Google Scholar] [CrossRef]
- Bertazzi, L.; Grazia Speranza, M. Inventory routing problems: An introduction. EURO J. Transp. Logist. 2012, 1, 307–326. [Google Scholar] [CrossRef] [Green Version]
- Archetti, C.; Bertazzi, L.; Laporte, G.; Speranza, M.G. A Branch-and-Cut Algorithm for a Vendor-Managed Inventory-Routing Problem. Transp. Sci. 2007, 41, 382–391. [Google Scholar] [CrossRef]
- Campbell, A.M.; Savelsbergh, M.W.P. A Decomposition Approach for the Inventory-Routing Problem. Transp. Sci. 2004, 38, 488–502. [Google Scholar] [CrossRef]
- Kleywegt, A.J.; Nori, V.S.; Savelsbergh, M.W.P. The Stochastic Inventory Routing Problem with Direct Deliveries. Transp. Sci. 2002, 36, 94–118. [Google Scholar] [CrossRef]
- Cheng, C.; Qi, M.; Wang, X.; Zhang, Y. Multi-period inventory routing problem under carbon emission regulations. Int. J. Prod. Econ. 2016, 182, 263–275. [Google Scholar] [CrossRef]
- Soysal, M. Closed-loop Inventory Routing Problem for returnable transport items. Transp. Res. Part D Transp. Environ. 2016, 48, 31–45. [Google Scholar] [CrossRef]
- Van Anholt, R.G.; Coelho, L.C.; Laporte, G.; Vis, I.F.A. An Inventory-Routing Problem with Pickups and Deliveries Arising in the Replenishment of Automated Teller Machines. Transp. Sci. 2016, 50, 1077–1091. [Google Scholar] [CrossRef]
- De, A.; Kumar, S.K.; Gunasekaran, A.; Tiwari, M.K. Sustainable maritime inventory routing problem with time window constraints. Eng. Appl. Artif. Intell. 2017, 61, 77–95. [Google Scholar] [CrossRef]
- Morales, F.; Franco, C.; Mendez-Giraldo, G. Dynamic inventory routing problem: Policies considering network disruptions. Int. J. Ind. Eng. Comput. 2018, 9, 523–534. [Google Scholar] [CrossRef]
- Braekers, K.; Ramaekers, K.; Van Nieuwenhuyse, I. The vehicle routing problem: State of the art classification and review. Comput. Ind. Eng. 2016, 99, 300–313. [Google Scholar] [CrossRef]
- Laporte, G. The vehicle routing problem: An overview of exact and approximate algorithms. Eur. J. Oper. Res. 1992, 59, 345–358. [Google Scholar] [CrossRef]
- Bektaş, T.; Demir, E.; Laporte, G. Green vehicle routing. In Green Transportation Logistics; Springer: Cham, Switzerland, 2016; Volume 226, pp. 243–265. [Google Scholar] [CrossRef]
- Hiermann, G.; Puchinger, J.; Ropke, S.; Hartl, R.F. The Electric Fleet Size and Mix Vehicle Routing Problem with Time Windows and Recharging Stations. Eur. J. Oper. Res. 2016, 252, 995–1018. [Google Scholar] [CrossRef]
- Desrochers, M.; Desrosiers, J.; Solomon, M. A New Optimization Algorithm for the Vehicle Routing Problem with Time Windows. Oper. Res. 1992, 40, 342–354. [Google Scholar] [CrossRef]
- Lalla-Ruiz, E.; Expósito-Izquierdo, C.; Taheripour, S.; Voß, S. An improved formulation for the multi-depot open vehicle routing problem. OR Spectr. 2016, 38, 175–187. [Google Scholar] [CrossRef]
- Gendreau, M.; Hertz, A.; Laporte, G. A Tabu Search Heuristic for the Vehicle Routing Problem. Manag. Sci. 1994, 40, 1276–1290. [Google Scholar] [CrossRef]
- Osman, I.H. Metastrategy simulated annealing and tabu search algorithms for the vehicle routing problem. Ann. Oper. Res. 1993, 41, 421–451. [Google Scholar] [CrossRef]
- Cefic. Guidelines for Measuring and Managing CO2 Emission from Freight Transport Operations; ECTA: Belgium, Brussels, 2011. [Google Scholar]
- Prause, G. A Green Corridor Balanced Scorecard. Transp. Telecommun. 2014, 15, 299–307. [Google Scholar] [CrossRef]
- Otten, M.; ‘t Hoen, M.; den Boer, E. STREAM Freight Transport 2016. 2017. Available online: https://www.cedelft.eu/publicatie/stream_freight_transport_2016/1855 (accessed on 10 July 2022).
- Gleixner, A.; Bastubbe, M.; Eifler, L.; Gally, T.; Gamrath, G.; Gottwald, R.L.; Hendel, G.; Hojny, C.; Koch, T.; Lübbecke, M.E.; et al. The SCIP Optimization Suite 6.0. Optimization Online. 2018. Available online: http://www.optimization-online.org/DB_HTML/2018/07/6692.html (accessed on 1 July 2022).
- Dantzig, G.; Fulkerson, R.; Johnson, S. Solution of a Large-Scale Traveling-Salesman Problem. J. Oper. Res. Soc. Am. 1954, 2, 393–410. [Google Scholar] [CrossRef] [Green Version]
Figure 1.
The transport and distance graph of German main ports.


Table 1.
Physical characteristics of different marine fuels with ammonia.
| Fuel | Density (t/m3) | LHV (GJ/t) | GJ/m3 | Normalized Volume |
|---|---|---|---|---|
| MGO | 0.835 | 42.7 | 35.7 | 1.00 |
| LNG | 0.420 | 50.0 | 21.0 | 1.70 |
| NH3 | 0.610 | 18.6 | 11.4 | 3.14 |
Table 2.
LNG and NH3 demand estimation for German ports (authors’ calculation).
| Port | Estimated Daily LNG Demand in Tons | Equivalent Daily NH3 Demand in Tons | Equivalent Daily NH3 Demand in m3 |
|---|---|---|---|
| BRB | 7.40 | 19.89 | 32.61 |
| BRE | 175.07 | 470.62 | 771.51 |
| CUX | 22.19 | 59.65 | 97.79 |
| HAM | 203.84 | 547.96 | 898.29 |
| WIL | 47.67 | 128.15 | 210.07 |
| KIE | 177.18 | 476.29 | 780.80 |
| LUE | 75.30 | 202.42 | 331.84 |
| ROS | 75.68 | 203.44 | 333.51 |
| SAS | 14.00 | 37.63 | 61.70 |
| Sum | 342.16 | 2126.05 | 3518.11 |
Table 3.
Voyage costs between the German ports (authors’ calculation).
| 5000 m3 7500 m3 Vessel | BRB | BRE | CUX | HAM | WIL | KIE | LUE | ROS | SAS |
|---|---|---|---|---|---|---|---|---|---|
| BRB | 1276 1519 | 252 300 | 567 675 | 1229 1463 | 7619 7979 | ||||
| BRE | 1024 1219 | 1843 2194 | 992 1181 | ||||||
| CUX | 819 975 | 977 1163 | |||||||
| HAM | 1796 2138 | ||||||||
| KIE | 1528 1819 | 1323 1575 | 2268 2700 | ||||||
| LUE | 945 1125 | 2063 2456 | |||||||
| ROS | 1386 1650 |
Table 4.
Transport volumes of NH3 and needed trucks of model B.
| BRE | CUX | HAM | WIL | KIE | LUE | ROS | SAS | SUM | |
|---|---|---|---|---|---|---|---|---|---|
| Demand per day in tons | 470.62 | 59.65 | 547.96 | 128.15 | 476.29 | 202.42 | 203.44 | 37.63 | 2126.16 |
| FTL | 15.69 | 1.99 | 18.27 | 4.27 | 15.88 | 6.75 | 6.78 | 1.25 | 70.88 |
| Rounded FTL | 15 | 1 | 18 | 4 | 15 | 6 | 6 | 1 | 66 |
| Remaining FTL | 0.69 | 0.99 | 0.27 | 0.27 | 0.88 | 0.75 | 0.78 | 0.25 | 4.88 |
| Max number of single FTL tours to port | 3 | 3 | 7 | 2 | 6 | 5 | 3 | 1 | |
| Needed trucks | 5 | 1 | 3 | 2 | 3 | 2 | 2 | 1 | 19 |
Table 5.
Total annual NH3 distribution costs of model B.
| Transportation Cost—Direct Delivery | EUR 6,147,622 |
| Transportation cost—combined routes | EUR 745,257 |
| Total transportation cost | EUR 6,892,879 |
| OPEX direct delivery | EUR 5,825,400 |
| OPEX combined routes | EUR 1,533,000 |
| Total OPEX | EUR 7,358,400 |
| Total annual distribution cost of model B | EUR 14,251,279 |
Table 6.
Total annual costs of model B.
| Transportation Cost—Direct Delivery | EUR 6,147,622 |
| Transportation cost—combined routes | EUR 745,257 |
| Total transportation cost | EUR 6,892,879 |
| OPEX direct | EUR 5,825,400 |
| OPEX combined | EUR 1,533,000 |
| Total OPEX | EUR 7,358,400 |
| Storage costs | EUR 242,359,450 |
| Total annual cost of model B | EUR 256,610,729 |
Table 7.
Total annual costs of model C.
| Vessel | FTLs | Combined Truck Routes | |
|---|---|---|---|
| Operational costs | EUR 1,682,285 | EUR 2,452,800 | EUR 919,800 |
| Total OPEX | EUR 5,054,885 | ||
| Transport costs | EUR 1,690,315 | EUR 2,469,225 | EUR 433,985 |
| Total distribution costs | EUR 4,593,525 | ||
| Storage costs | EUR 137,514,069 | EUR 104,845,381 | |
| Total storage costs | EUR 242,359,450 | ||
| Total costs of model C | EUR 252,007,860 | ||
Table 8.
Final assessment of the three NH3 distribution models.
| Model | Distribution Costs | Total Costs | CO2 Emissions | Time |
|---|---|---|---|---|
| A | EUR 4.7 million | EUR 974 million | 2537.9 tons | 4 days |
| B | EUR 14.3 million | EUR 257 million | 7647.5 tons | 1 day |
| C | EUR 9.6 million | EUR 252 million | 3312.3 tons | 1 day |
Table 9.
Final assessment of the three LNG distribution models.
| Model | Distribution Costs | Total Costs | CO2 Emissions | Time |
|---|---|---|---|---|
| A | EUR 4.2 million | EUR 660 million | 940 tons | 4 days |
| B | EUR 6.6 million | EUR 270 million | 2840 tons | 1 day |
| C | EUR 6.3 million | EUR 270 million | 1540 tons | 1 day |
Publisher’s Note: MDPI stays neutral with regard to jurisdictional claims in published maps and institutional affiliations. |
© 2022 by the authors. Licensee MDPI, Basel, Switzerland. This article is an open access article distributed under the terms and conditions of the Creative Commons Attribution (CC BY) license (https://creativecommons.org/licenses/by/4.0/).
Share and Cite
MDPI and ACS Style
Prause, F.; Prause, G.; Philipp, R. Inventory Routing for Ammonia Supply in German Ports. Energies 2022, 15, 6485. https://doi.org/10.3390/en15176485
AMA Style
Prause F, Prause G, Philipp R. Inventory Routing for Ammonia Supply in German Ports. Energies. 2022; 15(17):6485. https://doi.org/10.3390/en15176485
Chicago/Turabian StylePrause, Felix, Gunnar Prause, and Robert Philipp. 2022. "Inventory Routing for Ammonia Supply in German Ports" Energies 15, no. 17: 6485. https://doi.org/10.3390/en15176485
Note that from the first issue of 2016, this journal uses article numbers instead of page numbers. See further details here.