Article

Geological Controlling Factors of Low Resistivity Shale and Their Implications on Reservoir Quality: A Case Study in the Southern Sichuan Basin, China

PetroChina Research Institute of Petroleum Exploration Development, Beijing 100083, China
*
Author to whom correspondence should be addressed.
Energies 2022, 15(16), 5801; https://doi.org/10.3390/en15165801
Submission received: 18 March 2022 / Revised: 25 June 2022 / Accepted: 31 July 2022 / Published: 10 August 2022

Abstract

:
At the Changning block and at the Luzhou block, the genetic mechanism of low-resistivity shale and its impact on reservoir quality are currently a hot topic on a world-wide scale. Shale with resistivity lower than 20 Ω·m is widely developed at the Wufeng-Longmaxi Formation in the Southern Sichuan Basin, bringing a considerable challenge for reservoir prediction using the electromagnetic method. This paper discusses the genetic mechanisms and reservoir qualities of three low-resistivity shale reservoir types in the Southern Sichuan Basin (the Changning block and Luzhou block). Three primary elements controlling low-resistivity shale distribution in the Southern Sichuan Basin have been deduced: widely distributed gravity flow deposits, poor structural preservation conditions and shale graphitization caused by Emeishan basalt. Specifically, (1) the shale reservoir with a resistivity <12 Ω·m was uniformly distributed with gravity flow deposits in the Southern Sichuan Basin. High clay mineral contents (especially illite) in gravity flow deposits increased cation exchange capacity and irreducible water saturation at shale reservoir, decreasing electrical resistivity. (2) The resistivity of the shale reservoir close to a complex fault-fracture zone was generally lower than 20 Ω·m, indicating that poor structural preservation conditions played an important role in the wide distribution of low-resistivity shale. The resistivity of the shale reservoir near NE-trending faults at the Changning block was significantly lower than that in other areas. (3) Emeishan basalt caused extensive shale graphitization at the west of the Changning block, which was limited at the Luzhou block. The shale resistivity at the Luzhou block was not affected by graphitization. Among three types of low-resistivity shale, type III was characterized by high quartz content, high TOC, high porosity, high gas content and low graphitization. Although the resistivity of type III is generally lower that 20 Ω·m, it is still a favorable exploration target in the Southern Sichuan Basin.

1. Introduction

Low resistivity pay (LRP) refers to low-resistivity (<20 Ω·m) sandstone reservoirs in the Gulf of Mexico and is commonly developed at highly-mineralized environment [1,2,3]. The concept of LRP has been introduced for all kinds of unconventional reservoirs (including carbonate rocks, shale, etc.), and the oil and gas potential of such reservoirs has attracted considerable attention. Scholars generally believe that low-resistivity shale reservoirs often have poor gas bearing properties, but considerable shale gas resources have been discovered in such reservoirs with increasing exploration practices, with high-yield gas flow, e.g., low-resistivity shale developed in the Northern Neuquén Basin and in the Middle-Upper Yangtze plate [1,2,3,4,5]. Currently, the relationship between electrical properties and shale reservoir quality has not been clarified, which greatly restricts low-resistivity shale gas exploration and development.
Although the impacts of TOC, mineral composition and water saturation on the electrical characteristics of shale reservoirs have been explored by many scholars, primary geological controlling factors of electrical properties vary greatly among different basins in the world. Five controlling factors have been employed to explain the low resistivity in shale reservoirs. Firstly, the graphitization of organic matter and residual hydrocarbon can arrange carbon atoms in over-mature shale in an orderly way, which increases the flow capacity of free electrons significantly [4,5]. Secondly, high organic matter abundance greatly increases the specific surface of pores, thus increasing cation exchange capacity. Connected organic pore networks can increase isotropy and orthogonal conductivity components with complex resistivity and short conductive paths, which can also decrease resistivity in organic-rich shale [6,7]. Thirdly, some minerals can exert significant impacts on resistivity, e.g., pyrites have low resistivity and high polarization [1,3], clay minerals can improve cation exchange capacity [4,5,6], and quartz can enhance compressive strength and pore volume [7,8,9,10,11,12], etc. [6,7,8,9,10,11,12] Fourthly, multi-scale fault systems and increased salinity in formation water [8,9,11,12,13,14,15] can reduce resistivity in shale reservoirs. These factors can work together to develop low resistivity in shale reservoirs, which are governed by the sedimentary environment, diagenesis and tectonic activities. Hence, it is essential to deeply investigate the genetic mechanisms of low resistivity in shale reservoirs integrating sedimentary, diagenetic evolution and tectonic activity.
Multiple organic-rich black shale sequences were deposited at the southern margin of the Sichuan Basin (Southern Sichuan Basin), where Lower Palaeozoic shale was characterized by stable distribution, large thickness and high quality with huge resource potential [16,17,18]. Large-scale production has been developed in Longmaxi shale (at depth of 2000–3500 m) at the Weiyuan block, Changning block, Zhaotong block, Jiaoshiba block in Fuling, etc., with proved reserves of 10,610 × 108 m3 and a cumulative yield of 260 × 108 m3 [17]. High-yield wells at depths of 3500–4500 m were also drilled at the Luzhou block in the southern Sichuan Basin with shale gas resources of up to 16.31 × 10¹² m3, representing a shale gas exploration breakthrough in deep basins [17]. Test production and gas-bearing properties are different among low-resistivity shale gas wells at the Changning block and Luzhou block. There are two doubts about the widely developed low-resistivity shale in the Wufeng-Longmaxi Formation of the Southern Sichuan Basin. Firstly, the controlling factors of low-resistivity shale are still controversial. Although most scholars believe that such low resistivity was primarily generated by graphitization [2,5,6,19], Ro values of low-resistivity shale reservoirs (<5 Ω·m) at the Luzhou block were only 2.9–3.3%. Hence, graphitization associated with thermal maturity was not the primary controller of low-resistivity shale formation. Secondly, the internal relationship between resistivity and reservoir quality is not clear. Some low-resistivity wells have high test production, e.g., the average resistivity of Wufeng-Longmaxi shale at Yi 203 well is 19.6 Ω·m, but test production is up to 19.4 m3/t. These problems greatly limit the Paleozoic shale gas exploration in the Southern Sichuan Basin.
Geological controlling factors of three low-resistivity shale types have been clarified and favorable targets of low-resistivity shales at Wufeng- Longmaxi Formation in the Southern Sichuan Basin have been identified based on XRD, FE-SEM, electrical resistivity, TOC, Ro, Raman spectrum, well logs and seismic profiles.

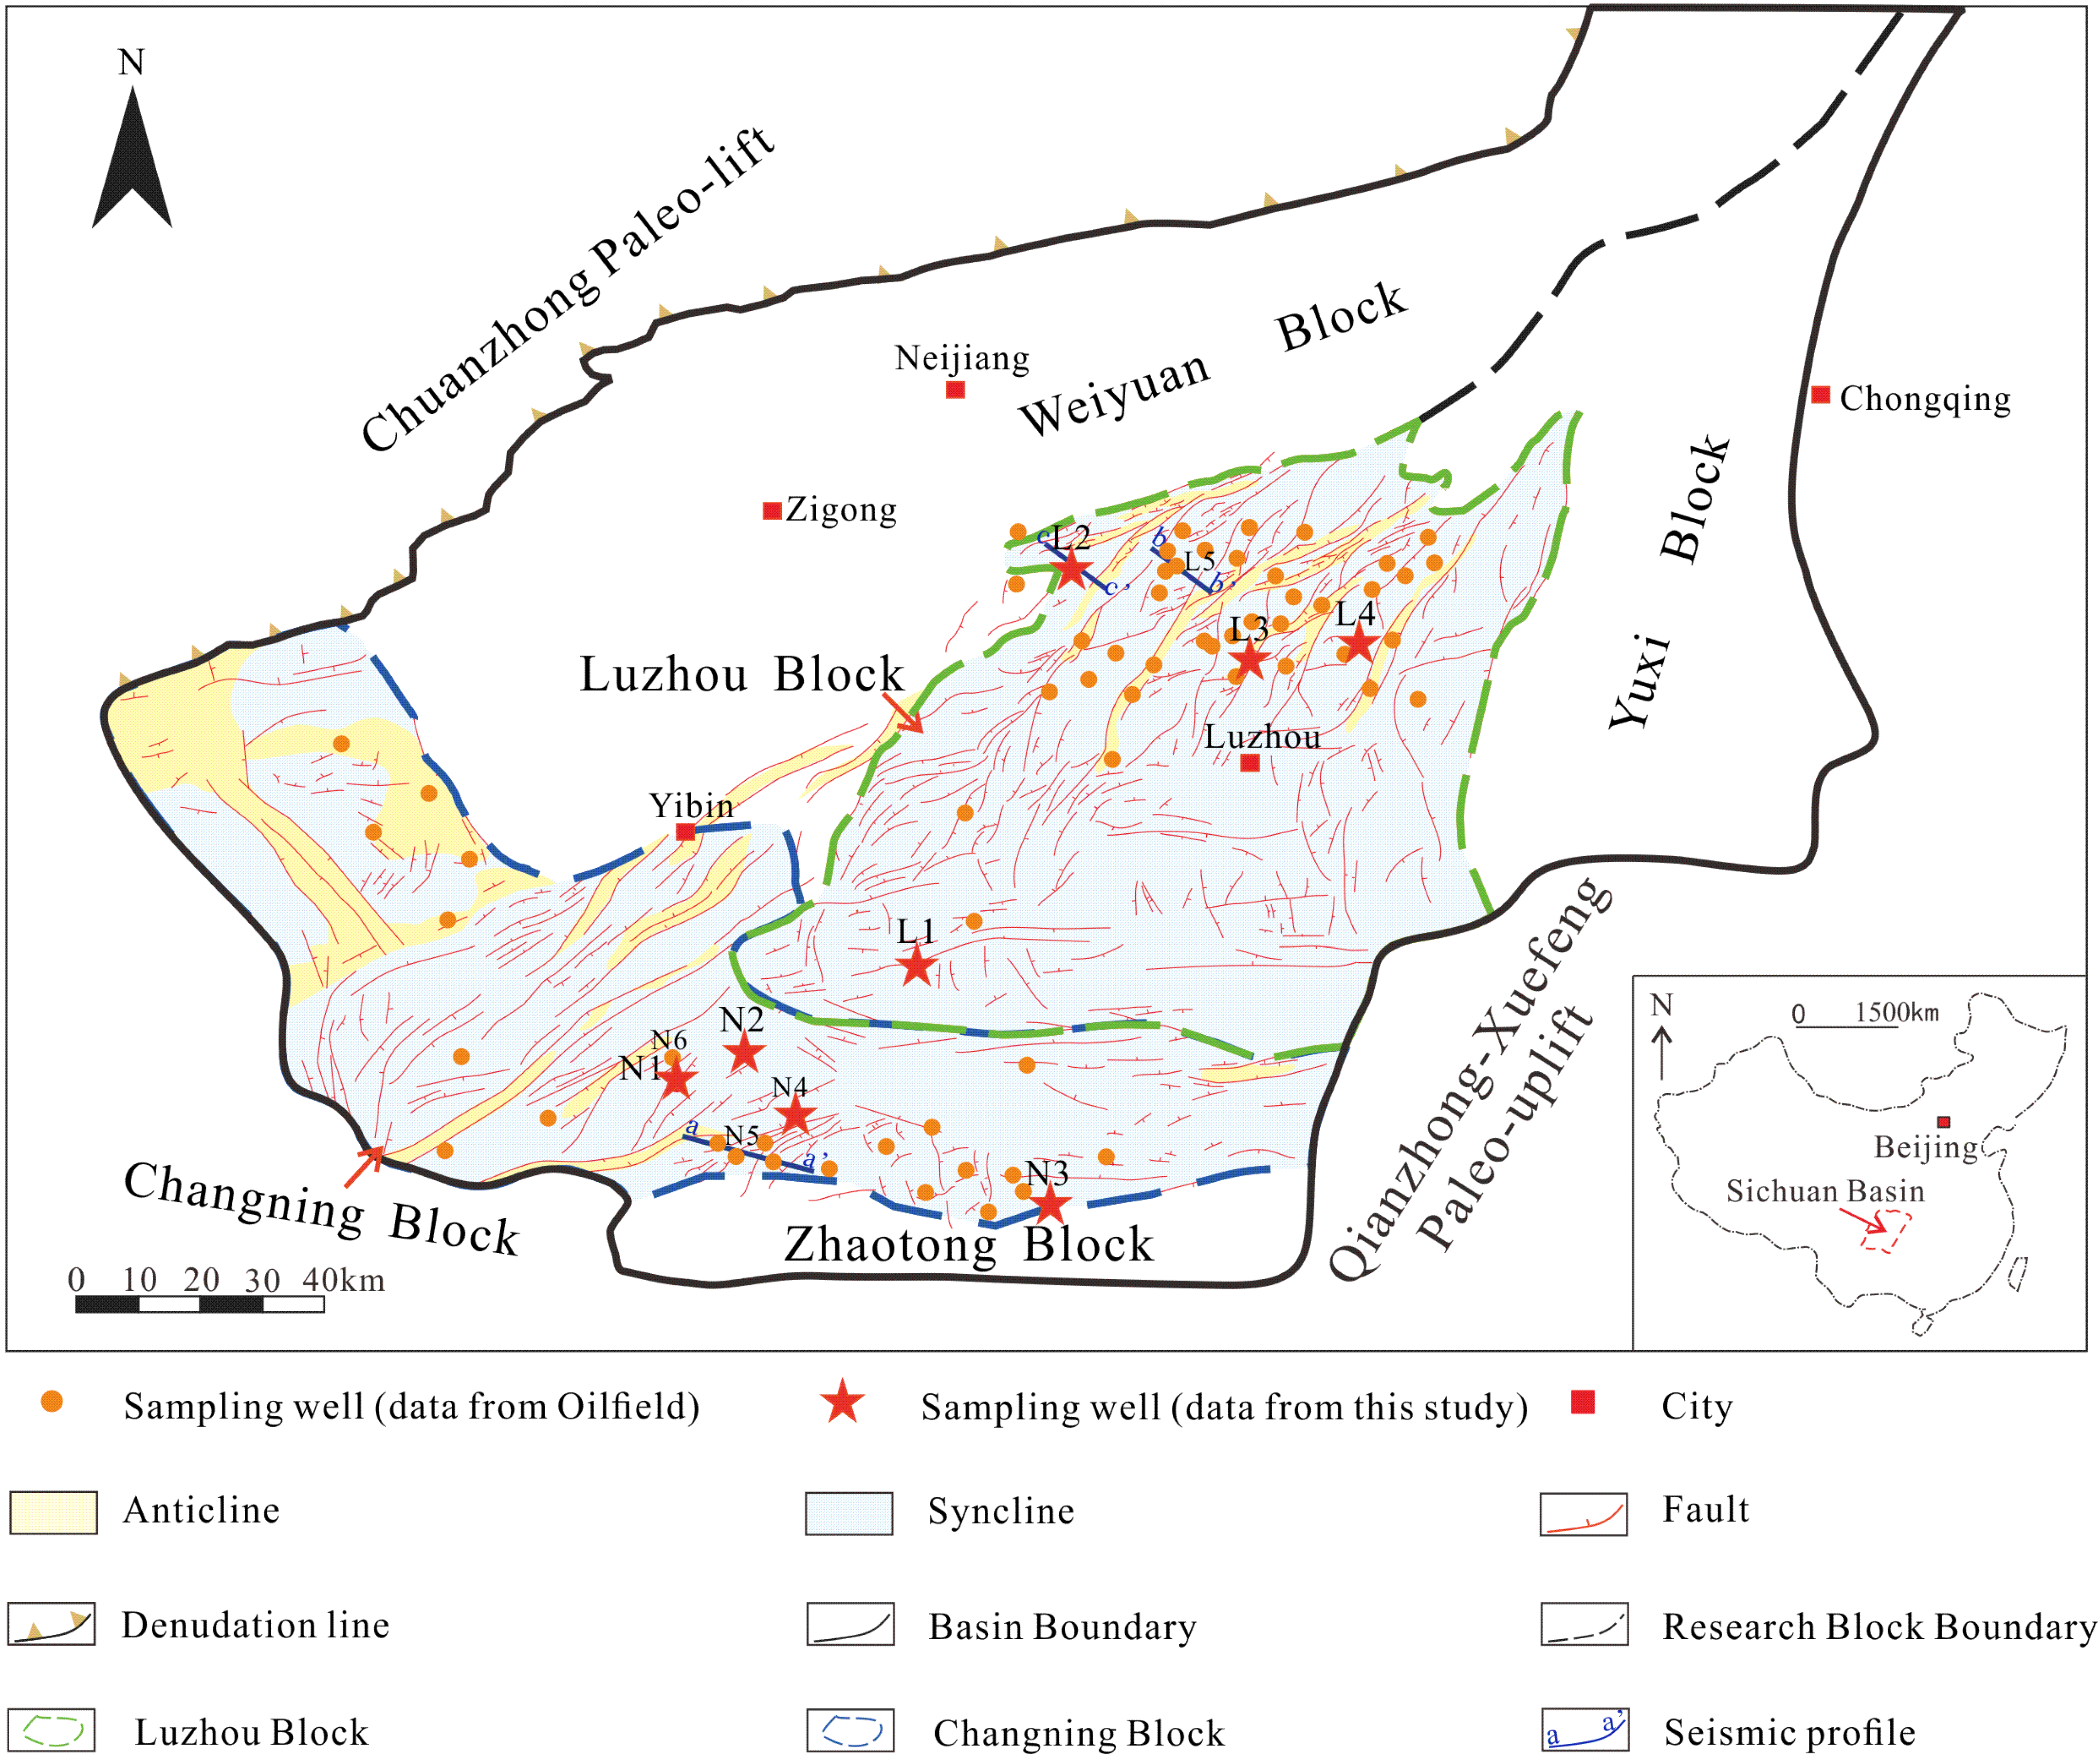
2. Geological Setting

The Wufeng-Longmaxi sequences in Sichuan Basin, West China, and its periphery were developed during the collision between the Cathaysia block and the Yangtze block [20]. The Yangtze plate was a foreland basin after the Middle Ordovician, where the Sichuan Basin and its periphery were part of the uplift backward unit of the Yangtze foreland basin. Strengthened compression from the southeast continuously uplifted the Sichuan Basin and its periphery in the Early Silurian, increasing the paleo-uplift at the Central Sichuan Basin, decreasing the water depth and intensifying sedimentary differentiation. The Upper Yangtze was sandwiched between the paleo-uplift and the Xuefeng paleo-uplift during this period, forming a semi-occluded euxinic basin. The Southern Sichuan Basin was located at the junction of the Tethys-Himalayan tectonic domain and Pacific tectonic domain [21], with an area of 2.2 × 10⁴ km2 (Figure 1). The Sichuan Basin was a shelf during the late Ordovician to early Silurian, where the shallow water shelf, semi-deep shelf and deep shelf were developed successively from the archicontinent edge to sedimentary center with four sedimentary microfacies e.g., deep-water slope, gravity flow deposits, deep-water sag and deep-water plain [22,23]. These sedimentary microfacies were widely developed at the Changning block and Luzhou block.
The Wufeng Formation in the Southern Sichuan Basin can be divided into black shale at the bottom and the Guanyinqiao Formation dominated by limestone at the top, and the Longmaxi Formation can be divided into Long-1 Member (L1) and Long-2 Member (L2) [24]. Long-1 Member can be divided into the first sub member (L11) and the second sub member (L12), while the L11 can be further divided into four layers: L111 layer, L112 layer, L113 layer and L114 layer [25]. The Wufeng Formation is defined as graptolite belt WF1-4, while the L111 layer, L112 layer, L113 layer, L114 layer, L12 sub-members and L2 member are graptolite belt LM1, LM2-3, LM4, LM5, LM6-8 and LM9, respectively [26].
The Changning block is located at the intersection of the triangular structural belt at the Southern Sichuan Basin and low-gentle fault-fold belt at southwestern Sichuan Basin [23,24,25,26].Three stages of faults were developed at the Changning block: small-scale near EW-trending faults were developed in the Middle-Late Yanshanian (180–150 Ma), large-scale NE–SW faults were formed in the Late Yanshanian to Early Himalayan (23 Ma), and NS–NNW faults were developed in the Middle Himalayan (5 Ma) [23,24,26]. The fault distribution pattern has a great influence on the quality of shale reservoir at the Changning block.
The Changning block was generally dominated by a deep shelf environment in the Late Ordovician to Early Silurian, where subaqueous slopes were distributed in the north, gravity flow deposits were distributed in the west, and subaqueous sub-sags were developed in the middle [27].
The Luzhou block is located in the middle of the southern Sichuan Basin. It is structurally at the low-steep structural belt in the south of the Central Sichuan Paleo-uplift. A series of narrow anticlines and wide-gentle synclines were developed in echelons from north to south [28]. Scholars reported that fractures and faults at the Luzhou block were primarily developed at anticline cores and wings [28]. Similar to the Changning block, the Luzhou block was a deep shelf environment in the Late Ordovician to Early Silurian. subaqueous slopes were distributed in the northwest and the northeast, gravity flow deposits were developed in the southeast, subaqueous sub-sags were developed in the middle, and subaqueous plains were developed in other areas [23].

3. Samples and Methods

A total of 518 Wufeng-Longmaxi shale samples were collected from eight wells, with an average resistivity <20 Ω·m. Four wells are located at the Luzhou block and another four wells are located at the Changning block (Figure 1 and Figure 2). These eight wells come from different structural units and are evenly distributed in the Changning block and Luzhou block (Figure 1). Meanwhile, some experiment data, including resistivity data, vitrinite reflectance data, well logs and seismic data, were collected from the Petrochina Southwest Oil and Gasfield Company. The uncertainty involved in the datasets of this study was calculated by the Bootstrap method with Oracle Crystal Ball (software), which is an original test data sampling approach with replacement to obtain the uncertainty information of distribution parameters [29] (Table S4). Therefore, the representativeness and uncertainty of datasets in this study could be guaranteed. Detailed information of the collected data is given in the following.

3.1. Mineral Composition and Morphological Analysis

The mineral composition and distribution of 518 sliced shale samples (<0.03 mm) were observed on optical microscope (Leica DM2700p, Berlin, Germany). After that, pore types were quantitatively determined based on image analysis with software Image J.
X-ray diffraction (XRD) was performed on 518 shale powders, and clay mineral measurement was carried out on 348 samples. XRD measurement was conducted with a Panalytical X- Pert PRO MPD X-X-ray diffractometer at working voltage of 50 keV and current of 800 μA. Diffractograms were recorded from 5° to 90° at a rate of 2θ. Sample preparation and spectral identification followed the Chinese oil and gas industry standard (SY/T) 5163-2014 [2]. After that, brittle mineral content (quartz content + feldspar content + pyrite content + carbonate content) was determined.
A field emission scanning electron microscope (FEI Quanta 650 FEG) and energy dispersion spectrometer (EDS) can be used to analyze mineral components, organic matter occurrence and pore morphology. Firstly, 20 samples were mechanically polished and then were polished with Ar-ion on Gatan 600 DuoMill instrument at 4 KV and a low angle (7.5°) for 2 h. Details about milling and SEM observation can be found in previous studies [29].

3.2. Petrophysical Parameters

In total, 518 samples from 8 wells were tested for porosity, gas content and water saturation. Helium porosity measurement was performed following the Gas Research Institute (GRI) method based on gas expansion [30]. Selected shale samples were crushed and sieved to 20–50 mesh. Powdered samples (Vb) were dried in an oven for 72 h at 110 °C to remove moisture before the measurements. Initial pressure (P1) was firstly measured. Helium at the reference cell (Vb) was isothermally expanded to the sample cell (Va) until equilibrium,;after that, equilibrium pressure (P2) was recorded to calculate pore volume (Vp). Vp could be calculated by following formula [31]:
Vp = Vbulk − Va − Vb × P2/(P2 − P1),
Then, the helium porosity was calculated with the sample volume and particle volume.
Cores were immediately put into closed desorption tanks from drilling sites to acquire in-situ gas contents [32]. Then, closed desorption tanks were heated at 95 °C for 2 h until no gas flew out, and gas contents were measured by releasing gas into an inverted measuring cylinder filled with water [33]. The in-situ gas contents were calculated under STP conditions based on the ideal gas law [34].
All these samples were measured for water saturation. In accordance with experimental steps as in Wu’s work [35,36], dry shale samples were put in an environment with constant humidity. Vapour diffusion absorption occurred to samples when the humidity in shale was lower than that in the environment. Then, water saturation was calculated based on the quality variation of shale samples [35,36].
Samples were put into a muffle roaster and heated to 105 °C for 24 h. Then, they were wrapped tightly with fresh-keeping film and were sealed in the double-layer sealed bag. The sample mass in the sealed bag was measured as m1. In total, 100 mL distilled water was put into an intermediate container with a volume of 1 L.
Fixed samples were bundled with thin wires under the cover of the intermediate container. After that, the intermediate container was put into the muffle roaster at 105 °C for t1 h (where t1 is 1, 2, 4, 6, 8, 10, 12, 14, 16, 18, 20 and 22, respectively). Then, samples were placed indoors for 3 h to be cooled to room temperature. After that, the sample weight (m2) was calculated to obtain water saturations at constant temperature (105 °C) [35,36].
In terms of representative samples from well L4 and well L2 (Table S2), with a water saturation of 50%, variations in weight and water saturation before and after the experiment were 28.3 mg and 4.9%, respectively, indicating that considerable movable water existed in shale. This part of water might be absorbed on pore surface and fractures, where water vapor was absorbed as a single layer controlled by diffusion. When the water saturation was 40%, the variation in core weight before and after the experiment was 13.2 mg, which was lower than that at a water saturation of 50%, indicating more movable water in samples with a water saturation of 50%.
At this time, multilayer adsorption occurred, increasing capillary condensation significantly. Sample mass and water saturation before and after experiment the were slightly changed when the water saturation was 30%, 20% and 0%. This was a good indicator that water in rocks occurred as bound water that could not occupy a large shale pore space when the water saturation of shale core was less than 30% [35,36]. This showed that diffusion was gradually weak but capillary condensation played an increasingly important role in adsorption with decreasing water saturation. In addition, the strong water adsorption capacity was related to high clay mineral and organic matter content [35,36]. Variations in the pore structure before and after water saturation measurement meant that these samples could not be used in other subsequent experiments (Table S2).

3.3. Electrical Resistivity

Resistivity data of 518 shale samples from 8 wells were measured with pole–pole method based on the Petroleum and Natural Gas Industry Standard “SY/T 5385-2007 laboratory measurement and calculation method of resistivity parameters”. Firstly, plungers were drilled with a diameter of 25 mm and length of over 20 mm and then were dried in an incubator at 62 °C for 24 h. Finally, resistivity was tested on an HDTS—II rock resistivity tester [37]. Resistivity data of 2400 shale samples from 78 wells (54 wells at the Luzhou block and 24 wells at the Changning block) were collected from the PetroChina Southwest Oil and Gasfield Company (Beijing, China).

3.4. Geochemistry Analysis

Total organic carbon (TOC) measurement was performed on all powdered samples with grain sizes of 200–400 mesh using a LECO CS-200 carbon/sulphur analyzer. Powders were processed using hydrochloric acid to remove carbonate before the measurement. Equivalent vitrinite reflectances were measured on 518 samples in this paper.
Because Wufeng-Longmaxi marine shale is at a high to over high maturity stage with no vitrinite, equivalent vitrinite reflectance (Ro) was converted from bitument reflectance (BRr) with the equation [38]
Ro = (BRr + 0.2443)/1.0495
At least 50 BRrs were observed for each sample on a 3Y Microphotometer under reflected light [39]. Equivalent Ro data of 38 samples from 5 wells at the Changning Block were collected from the PetroChina Southwest Oil and Gasfield Company.

3.5. Raman Spectrum

Raman spectroscopic analysis was carried out on six samples from six wells in the Southern Sichuan Basin. The sample processing was carried out under a sterile environment. Firstly, shale samples were made into thin sections and then were observed with a fluorescence microscope to ensure no residual hydrocarbon in thin sections. Next, solid asphalt particles with diameters >20 μm were circled used a marking pen without fluorescence under the fluorescence microscope. The laser Raman spectrum measurements on the centre of the solid asphalt particles were performed on inVia Laser Raman Spectrometer (Renishaw Company, Wotton-under-Edge, UK) with a semiconductor laser wavelength of 514.5 nm and laser power of 30 mW. This was completed in the Key Laboratory of Magmatism and Mineralization of the Ministry of Natural Resources. Finally, backgrounds of spectral curves were subtracted, and height ratios of the D peak and G peak were calculated using Origin software.
The main peak in the first-order band of graphite is about 1580 cm−1, which is called the G peak (graphite peak, also known as G-band). The G peak is positively correlated with graphite crystallinity [40]. The D-band often appears in the first-order band, where the intensity of two defect peaks at the D-band is negatively correlated with graphite crystallinity [40]. The Raman peak of graphite mainly appears at about 2700 cm−1 (S1-band) in the second-order band. The high graphite crystallinity results in poor symmetry of the S1 band. Therefore, many scholars characterize shale graphitization based on peak intensity ratios of the G-band and D-band [40,41,42,43,44].

3.6. Well Logs and Seismic Data

Three-dimensional seismic data at the Luzhou block and the Changning block were processed to acquire prestack inversion seismic data with a high signal-to-noise ratio and high resolution. The seismic exploration area at the Luzhou block and the Changning block was 1229 square kilometers and 150 square kilometers, respectively (Table S3). Three pre-stack time migration seismic profiles were carefully interpreted to observe the relationship between low-resistivity shale and fault systems. Locations of seismic profiles are marked in Figure 1. Two seismic horizons, i.e., the top of the Longmaxi Formation and the bottom of the Wufeng Formation, and fault systems have been interpreted. Conventional logs, including gamma ray, deep and shallow resistivity, bulk density, true formation resistivity and acoustic logs, were collected from 10 wells. The above log curves were used to identify stratigraphic units. Similarly, these log curves were also used to identify the distribution and depth of low-resistivity shale. A high-resolution borehole micro-resistivity imaging log from Schlumberger was also employed to provide millimeter-scale sedimentary structure information. The digital matrix of 192 original micro-conductivity curves was converted into color images, including speed correction, button harmonization and image calibration as well as pad concatenation and orientation [45,46,47].

4. Results

Cluster analysis identified three types of low-resistivity shale reservoirs based on mineral composition, TOC, petrophysical parameters and electrical resistivity. The characteristics of low-resistivity shale types are shown in Figure 3 and Figure 4 with specific data in Table S1. Meanwhile, the standard deviation of the above data is listed in Table S1 and Figure 4. Besides, the Pearson correlation analysis method was used to find the relevant parameters of shale resistivity for 14 variables, as shown in Table S1 (Figure S1).

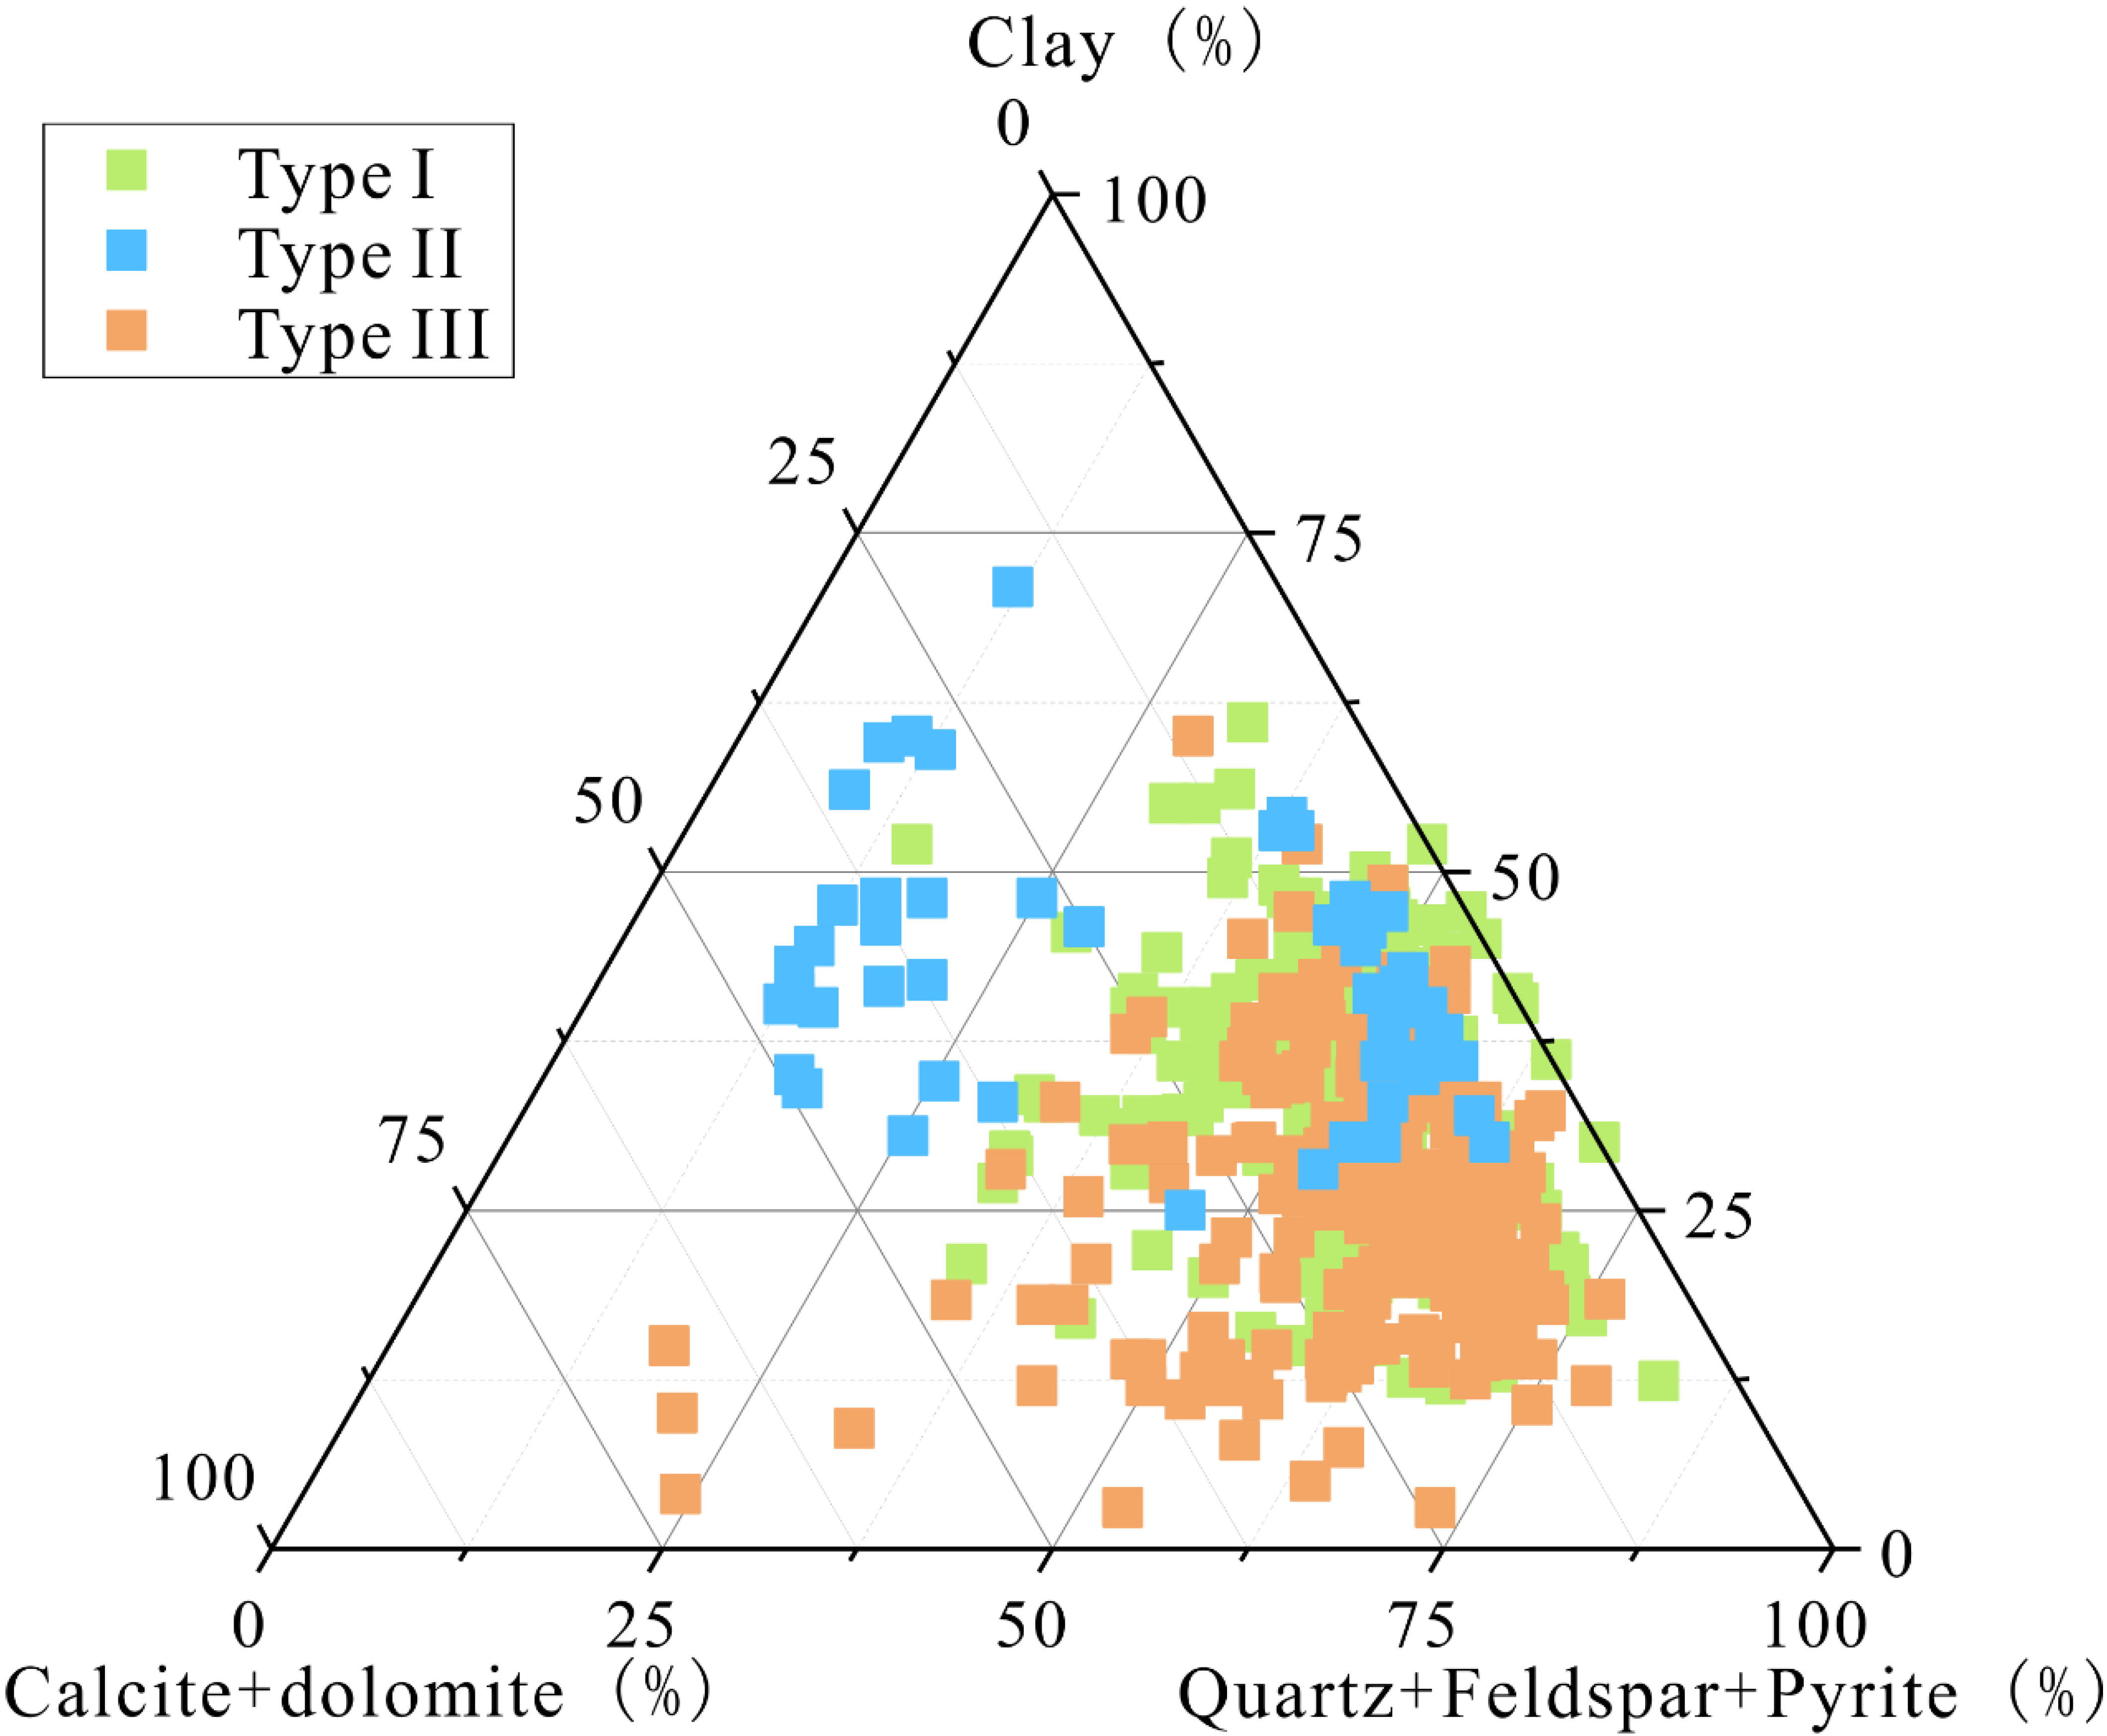
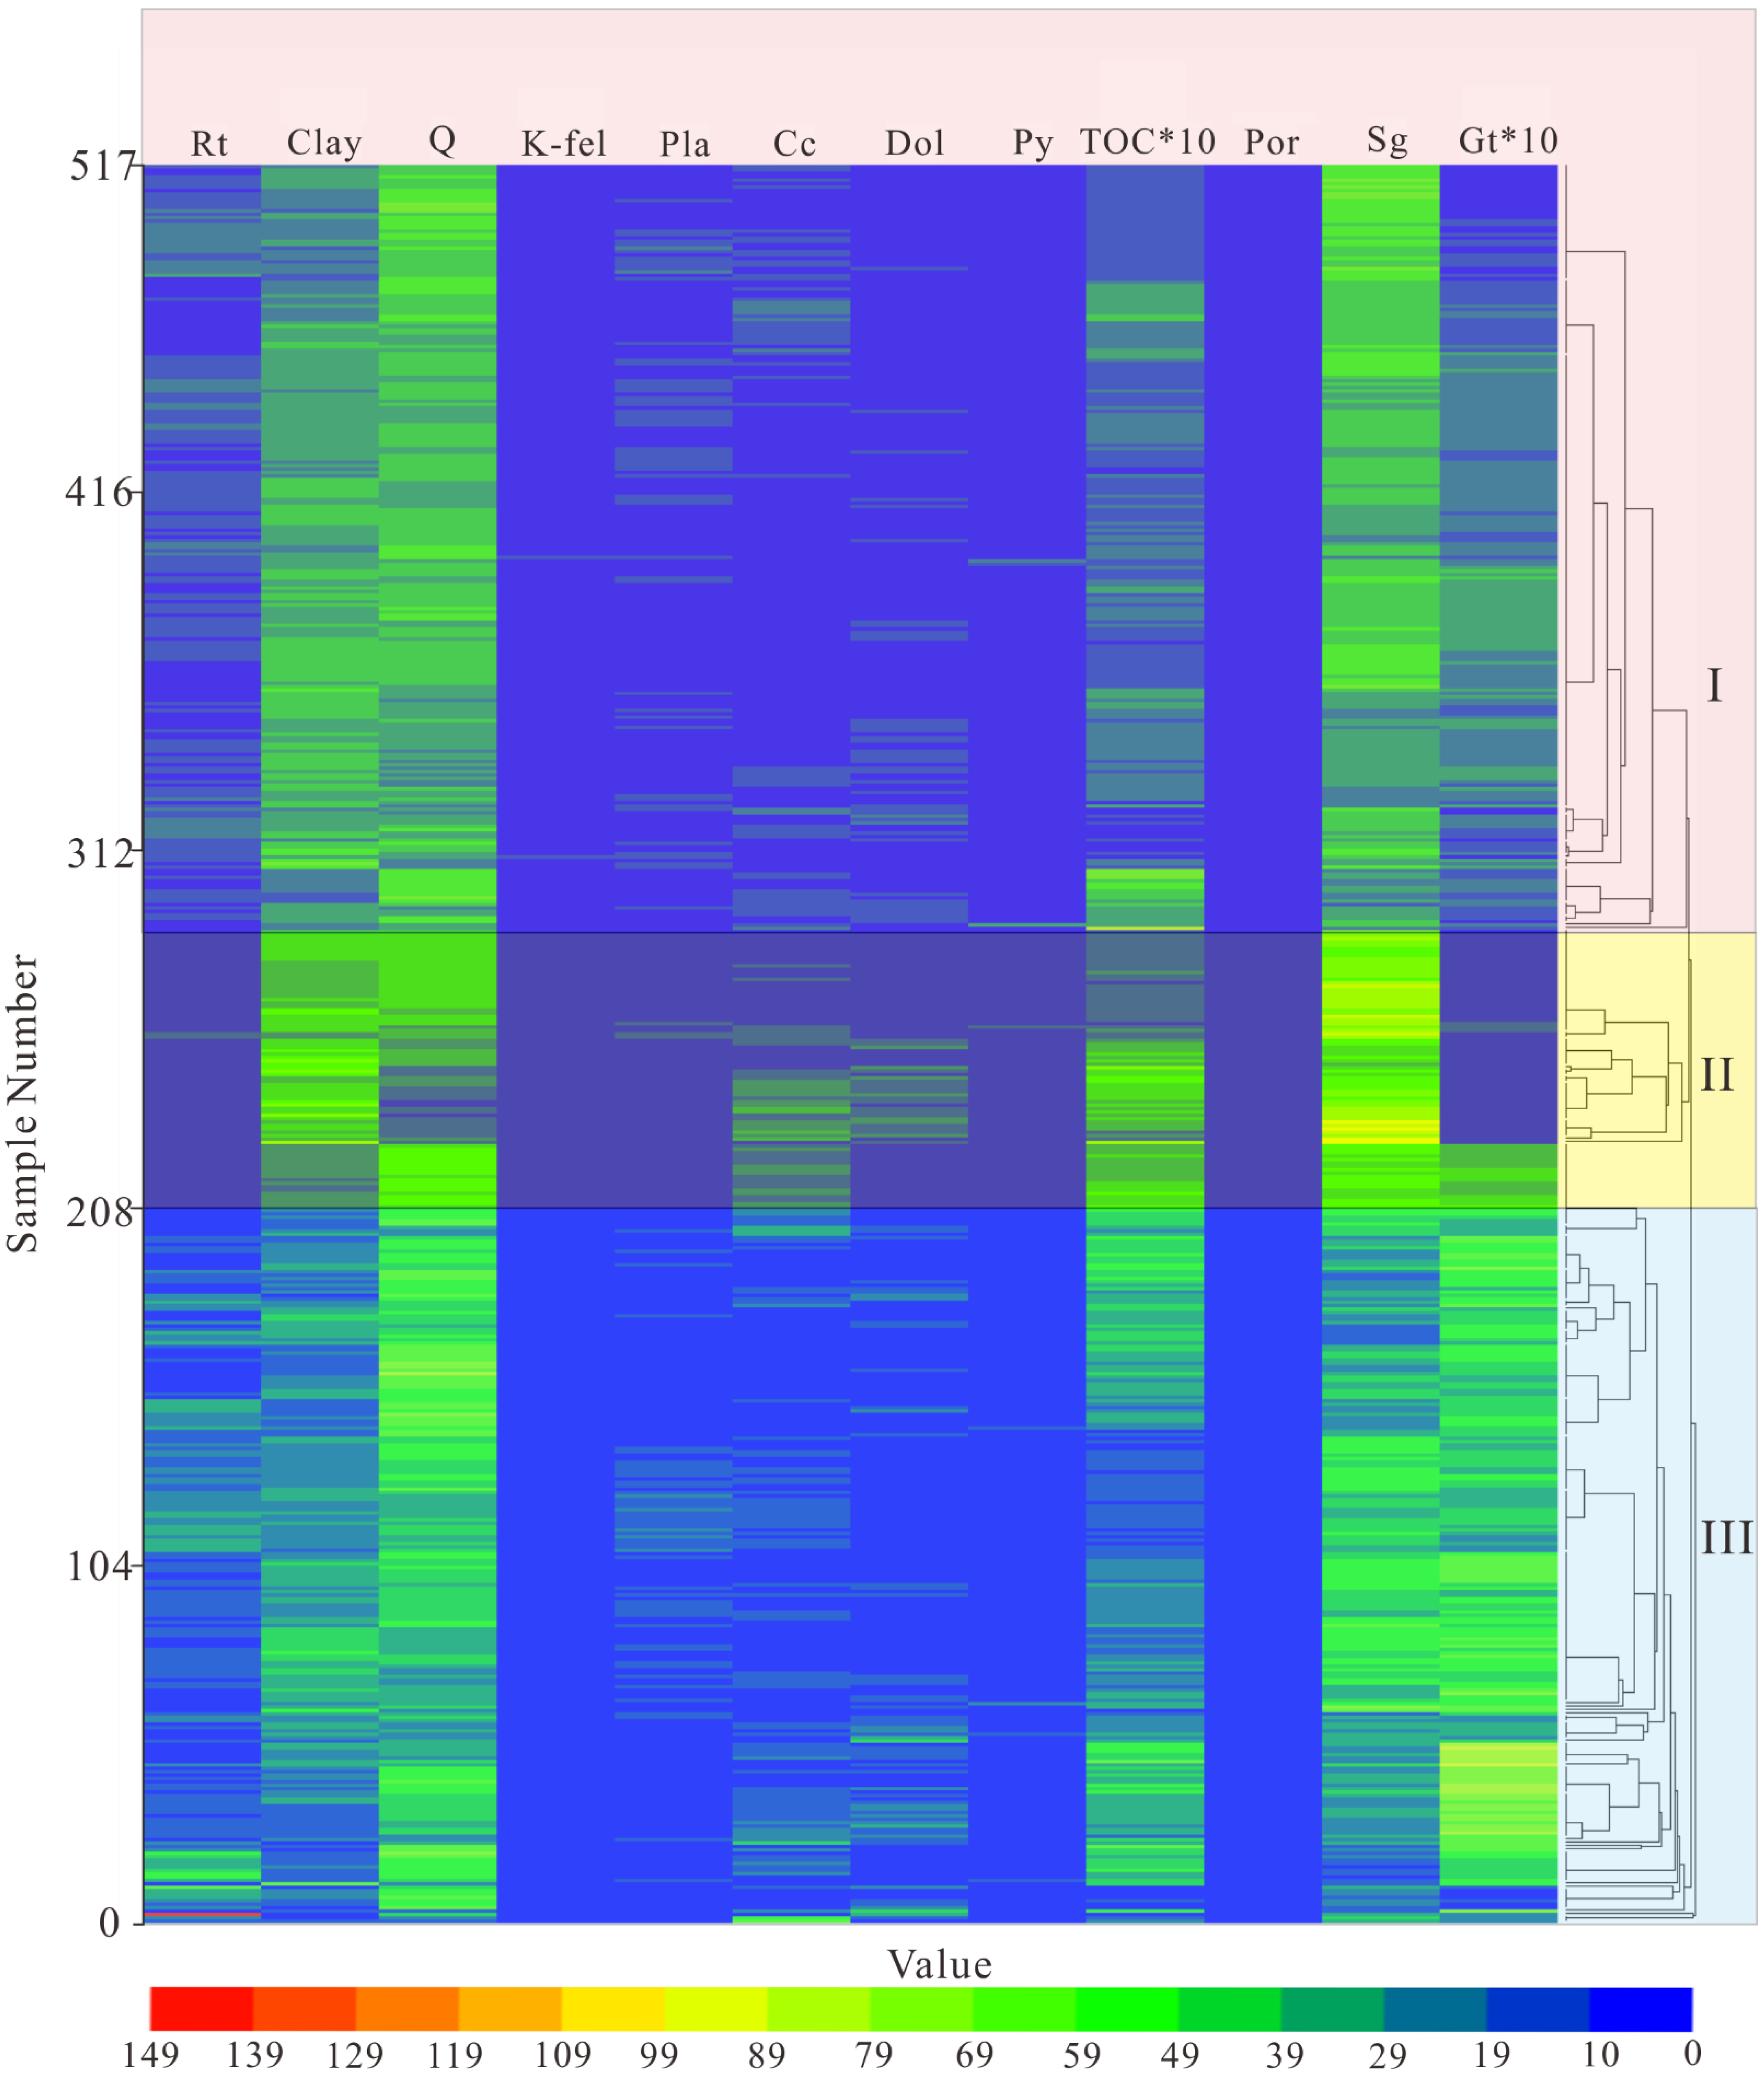
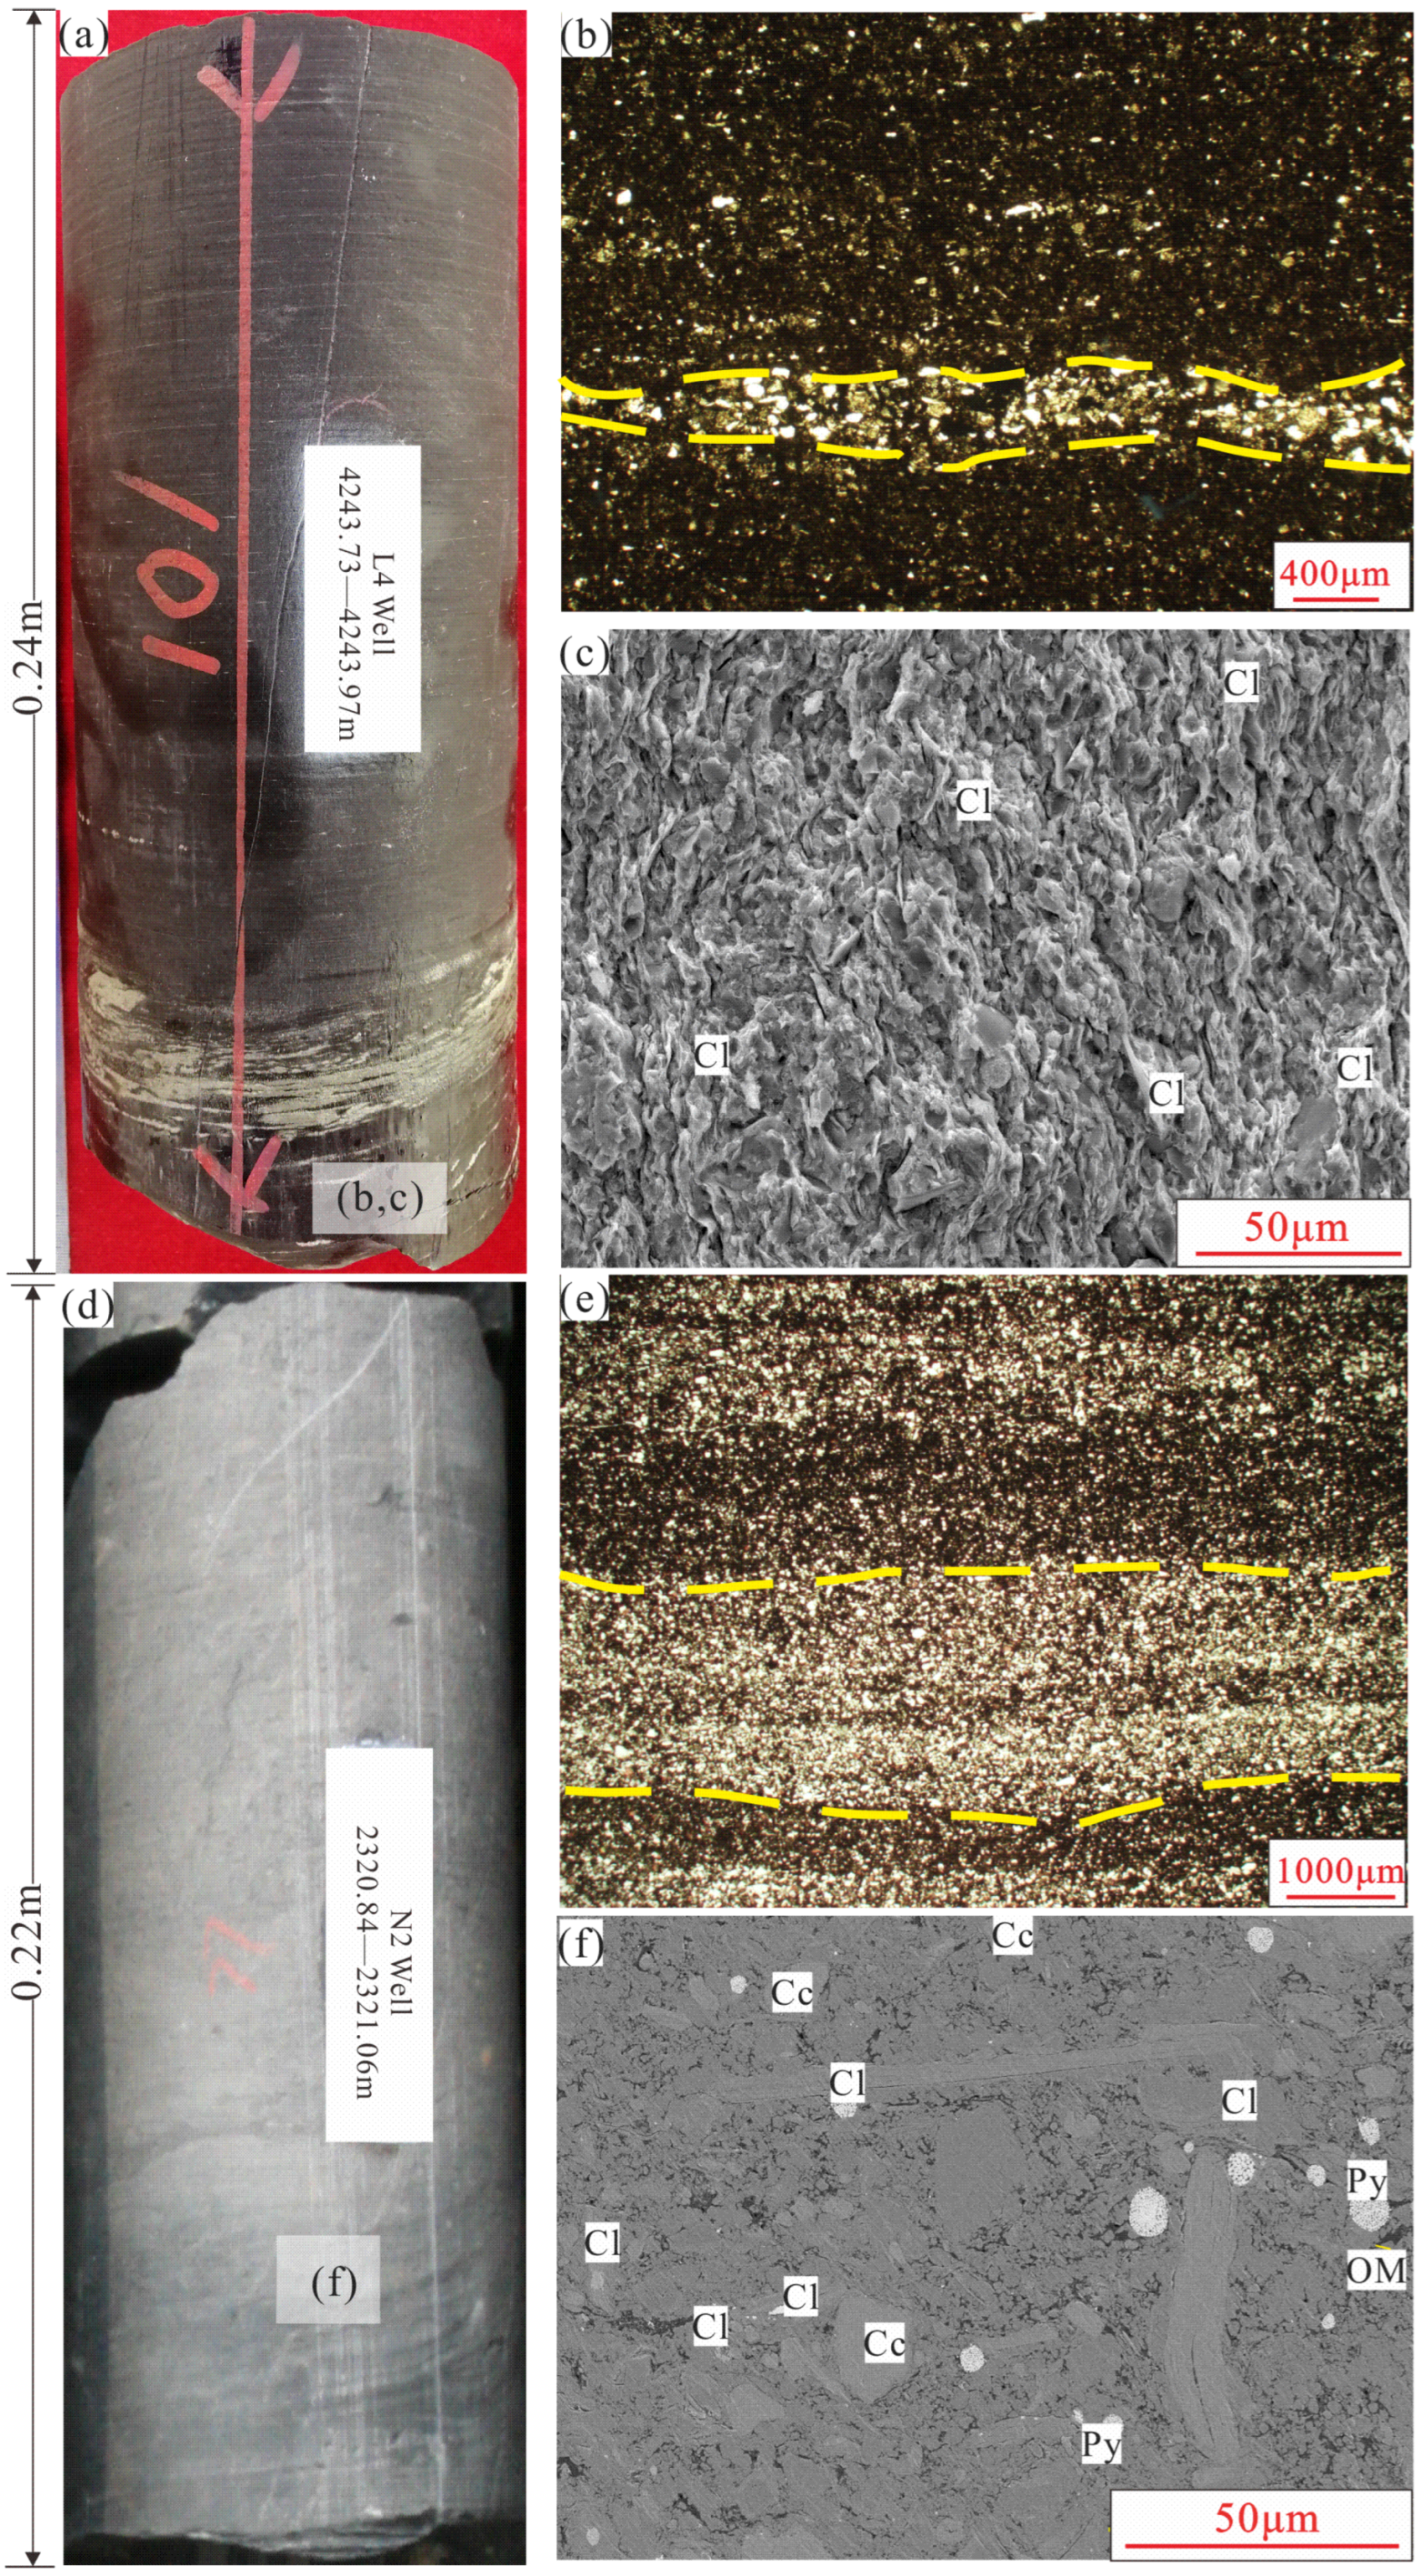
4.1. Lithology and Mineralogy

All low-resistivity shale samples are argillaceous shale [6], with an average clay mineral content of 30.9%. Three low-resistivity shale types are different in mineral compositions. Type I is dominated by a high quartz content (13.5–80.2%) and clay mineral content (12.2–61%), with minor carbonate mineral and pyrite content (Figure 3). In contrast to type I, type II is characterized by high carbonate mineral content, e.g., dolomite (2–26%) and calcite (2–35%). Furthermore, type II has a higher clay mineral content compared with the other two types (25–71%), mainly illite, chlorite and kaolinite. The quartz content of type II is between 7.5% and 47.8%, with an average value of 29.86%. Type III is lower in clay mineral content (3–60%) and is higher in quartz content (12–70.8%). The carbonate mineral (mainly dolomite and calcite) content is between 2.3% and 72%.

4.2. Organic Geochemistry

Measured TOC values vary slightly in the three types of low-resistivity shale reservoirs, ranging from 0.1% to 8.3%. The TOC value is low in type I (0.1–8.3%, average: 2.4%) and high in type II (0.34–6.93%, average: 2.2%). It is between 0.1% and 6.85% in type III, with an average value of 2.47%.
The measured vitrinite reflectance (Ro) values are in a range of 2.3% to 5.5%, indicating that the Wufeng-Longmaxi low-resistivity shale is currently in the over maturity stage [48]. Macerals are mainly composed of solid bitumen and graptolites, while the average solid bitumen content at the Changning block is higher than that at the Luzhou block [48]. Moreover, Ro values at the Changing block have an average of 3.55%—significantly higher than those at the Luzhou block, with values of 3.24%. The three types of low-resistivity shale are different in terms of their Ro values. Type II shale has the highest values, with an average Ro of 3.79%, followed by type I shale with an average value of 3.47%. The value is only 3.30% in type III shale.

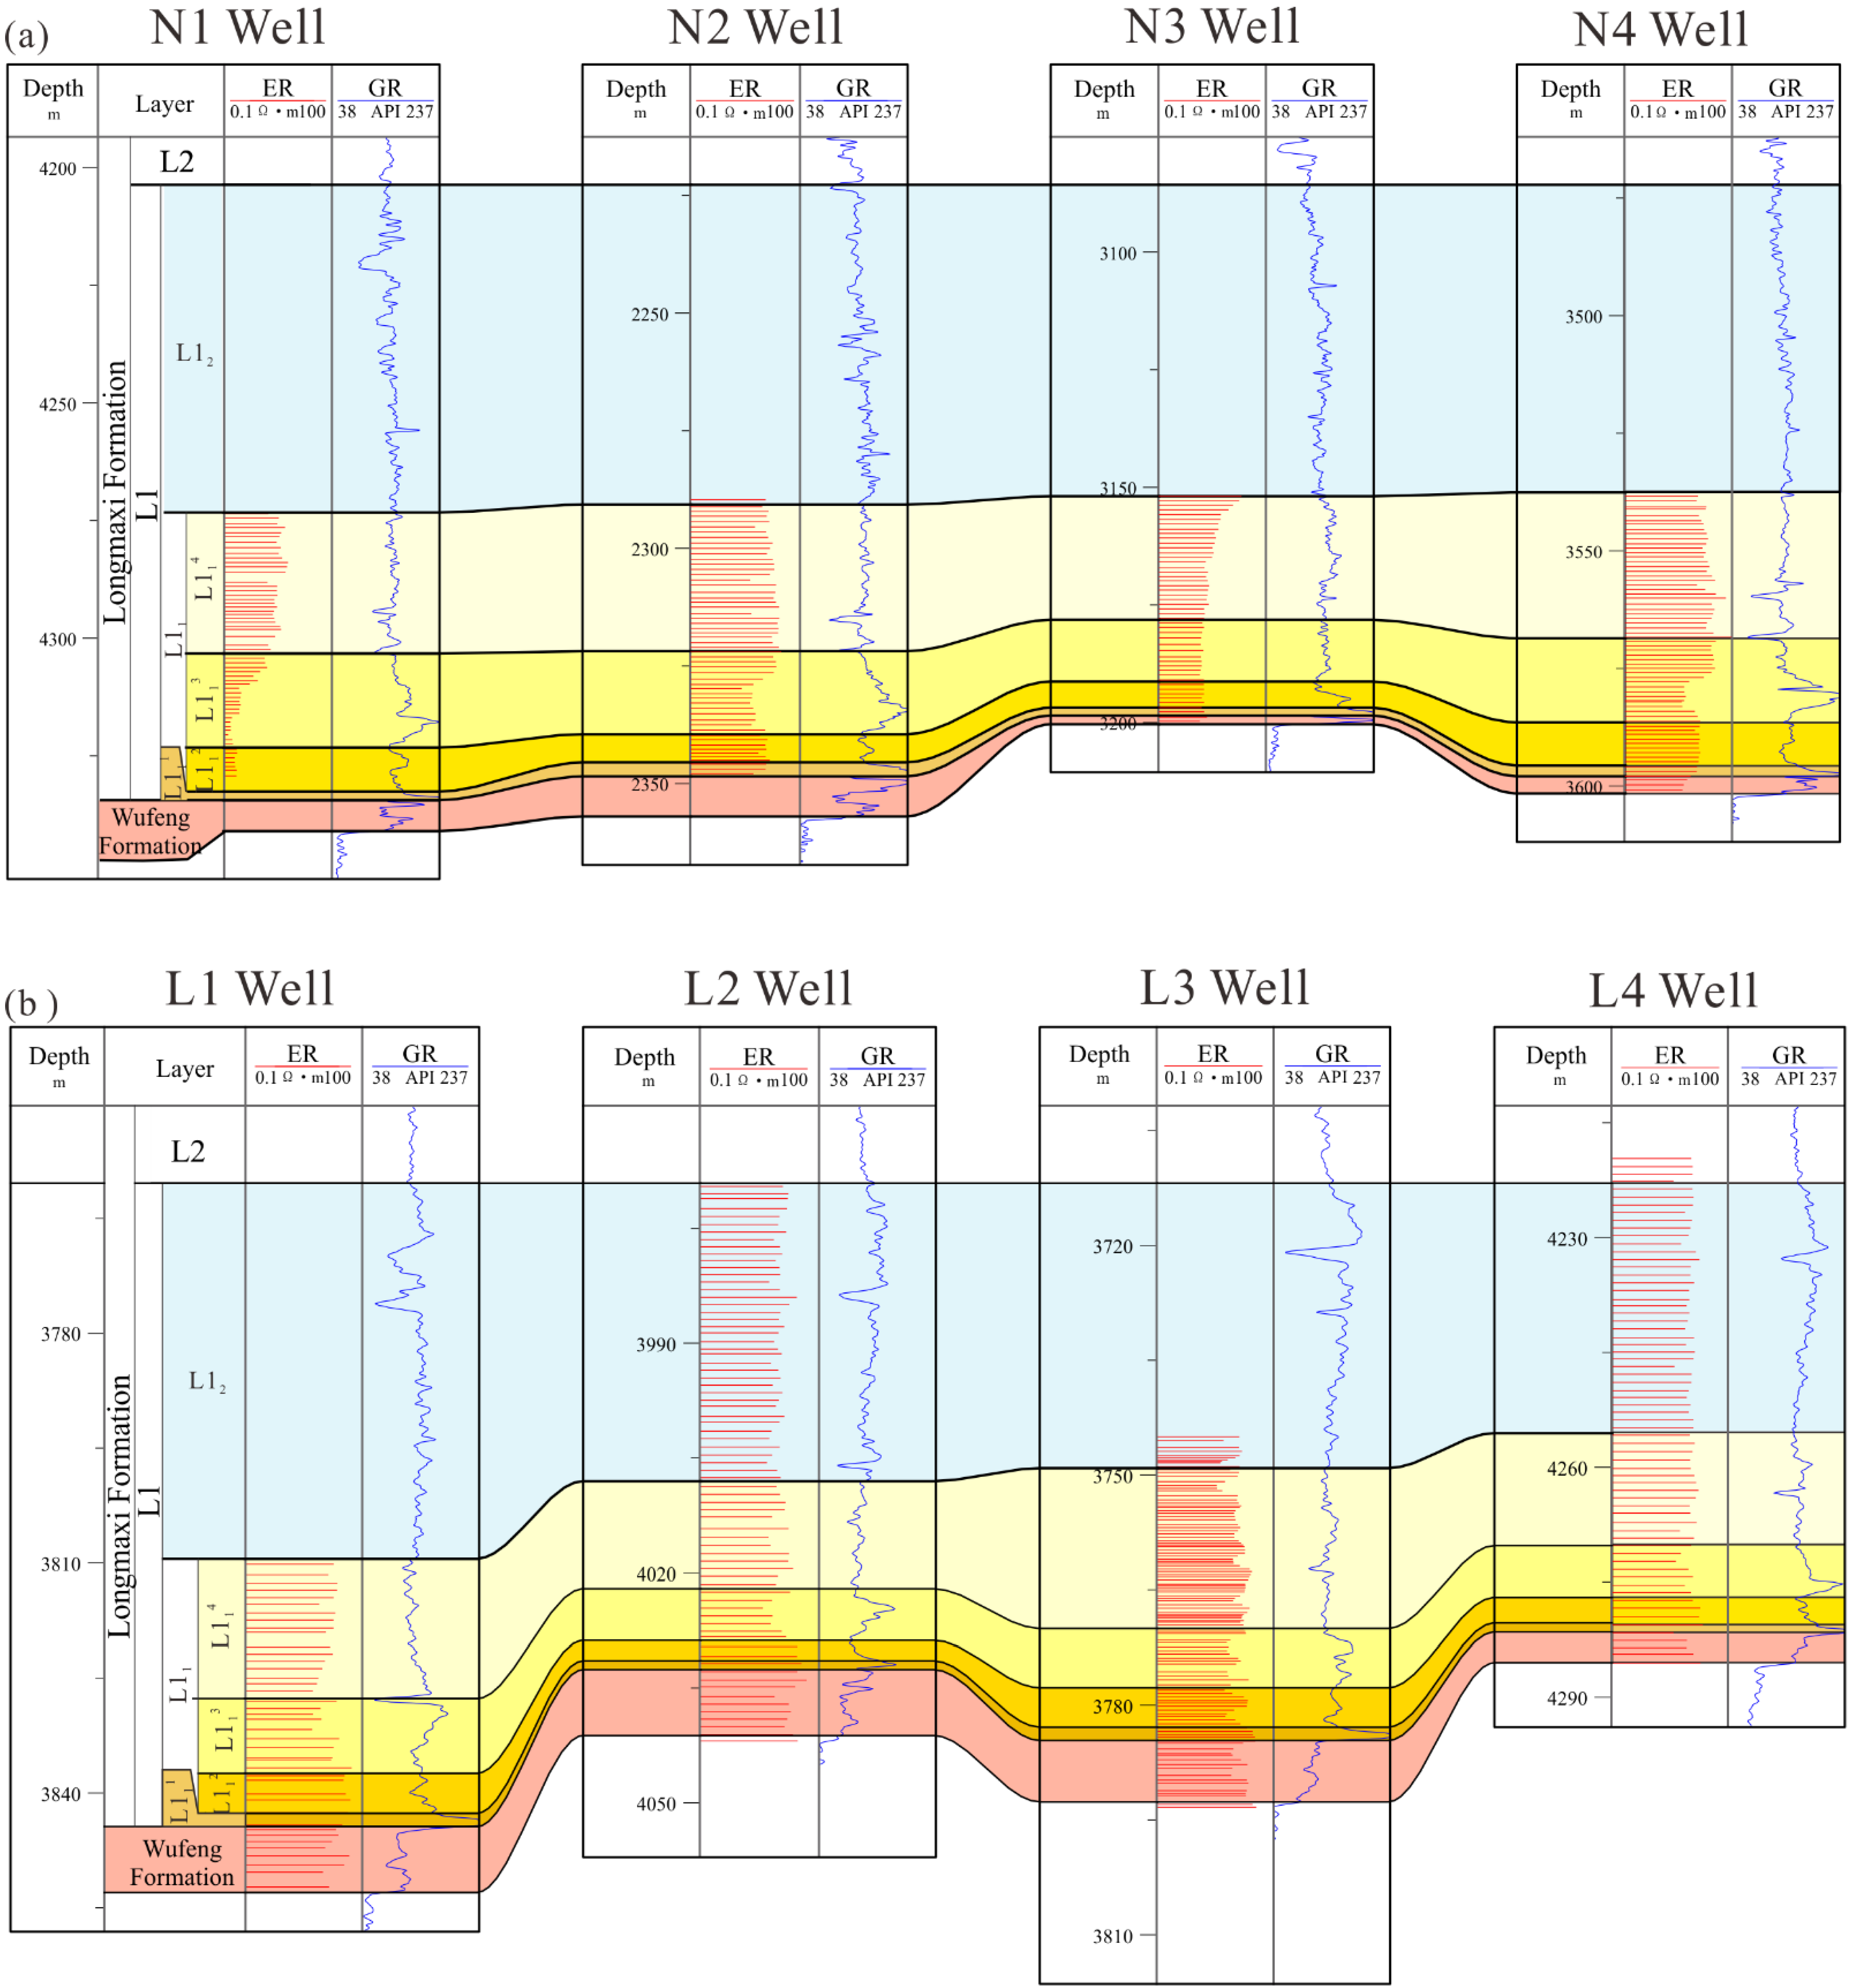
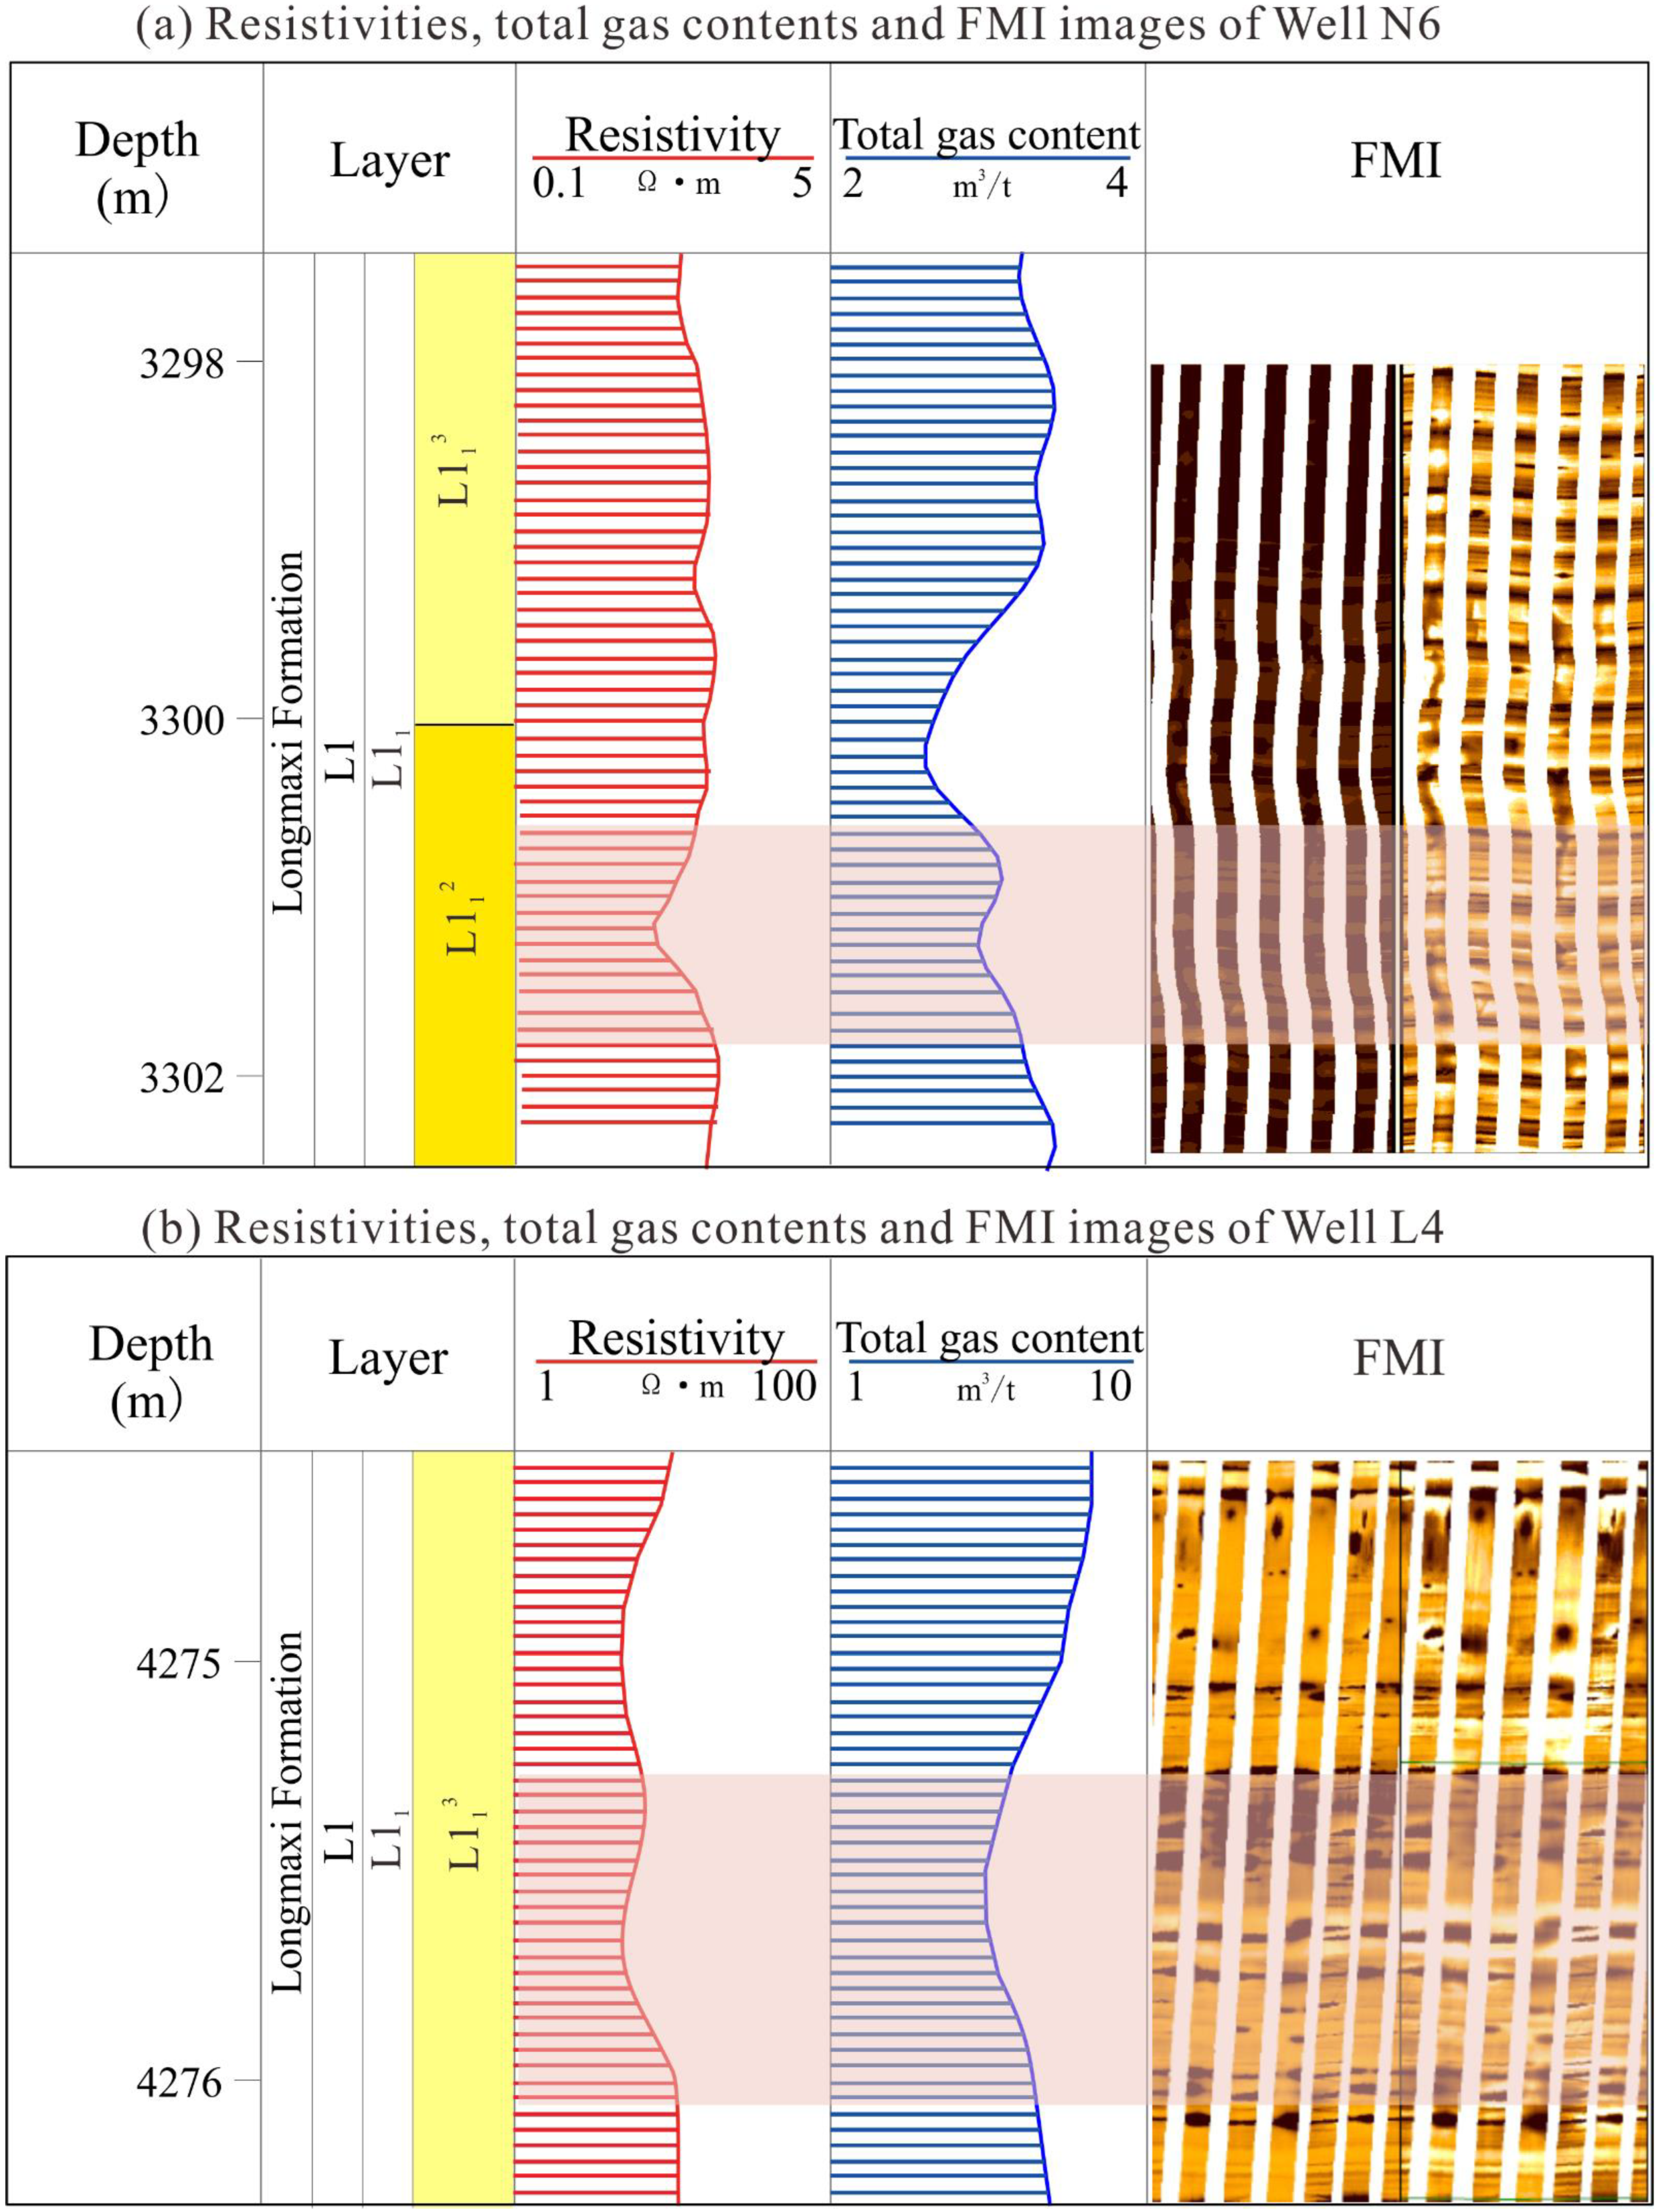
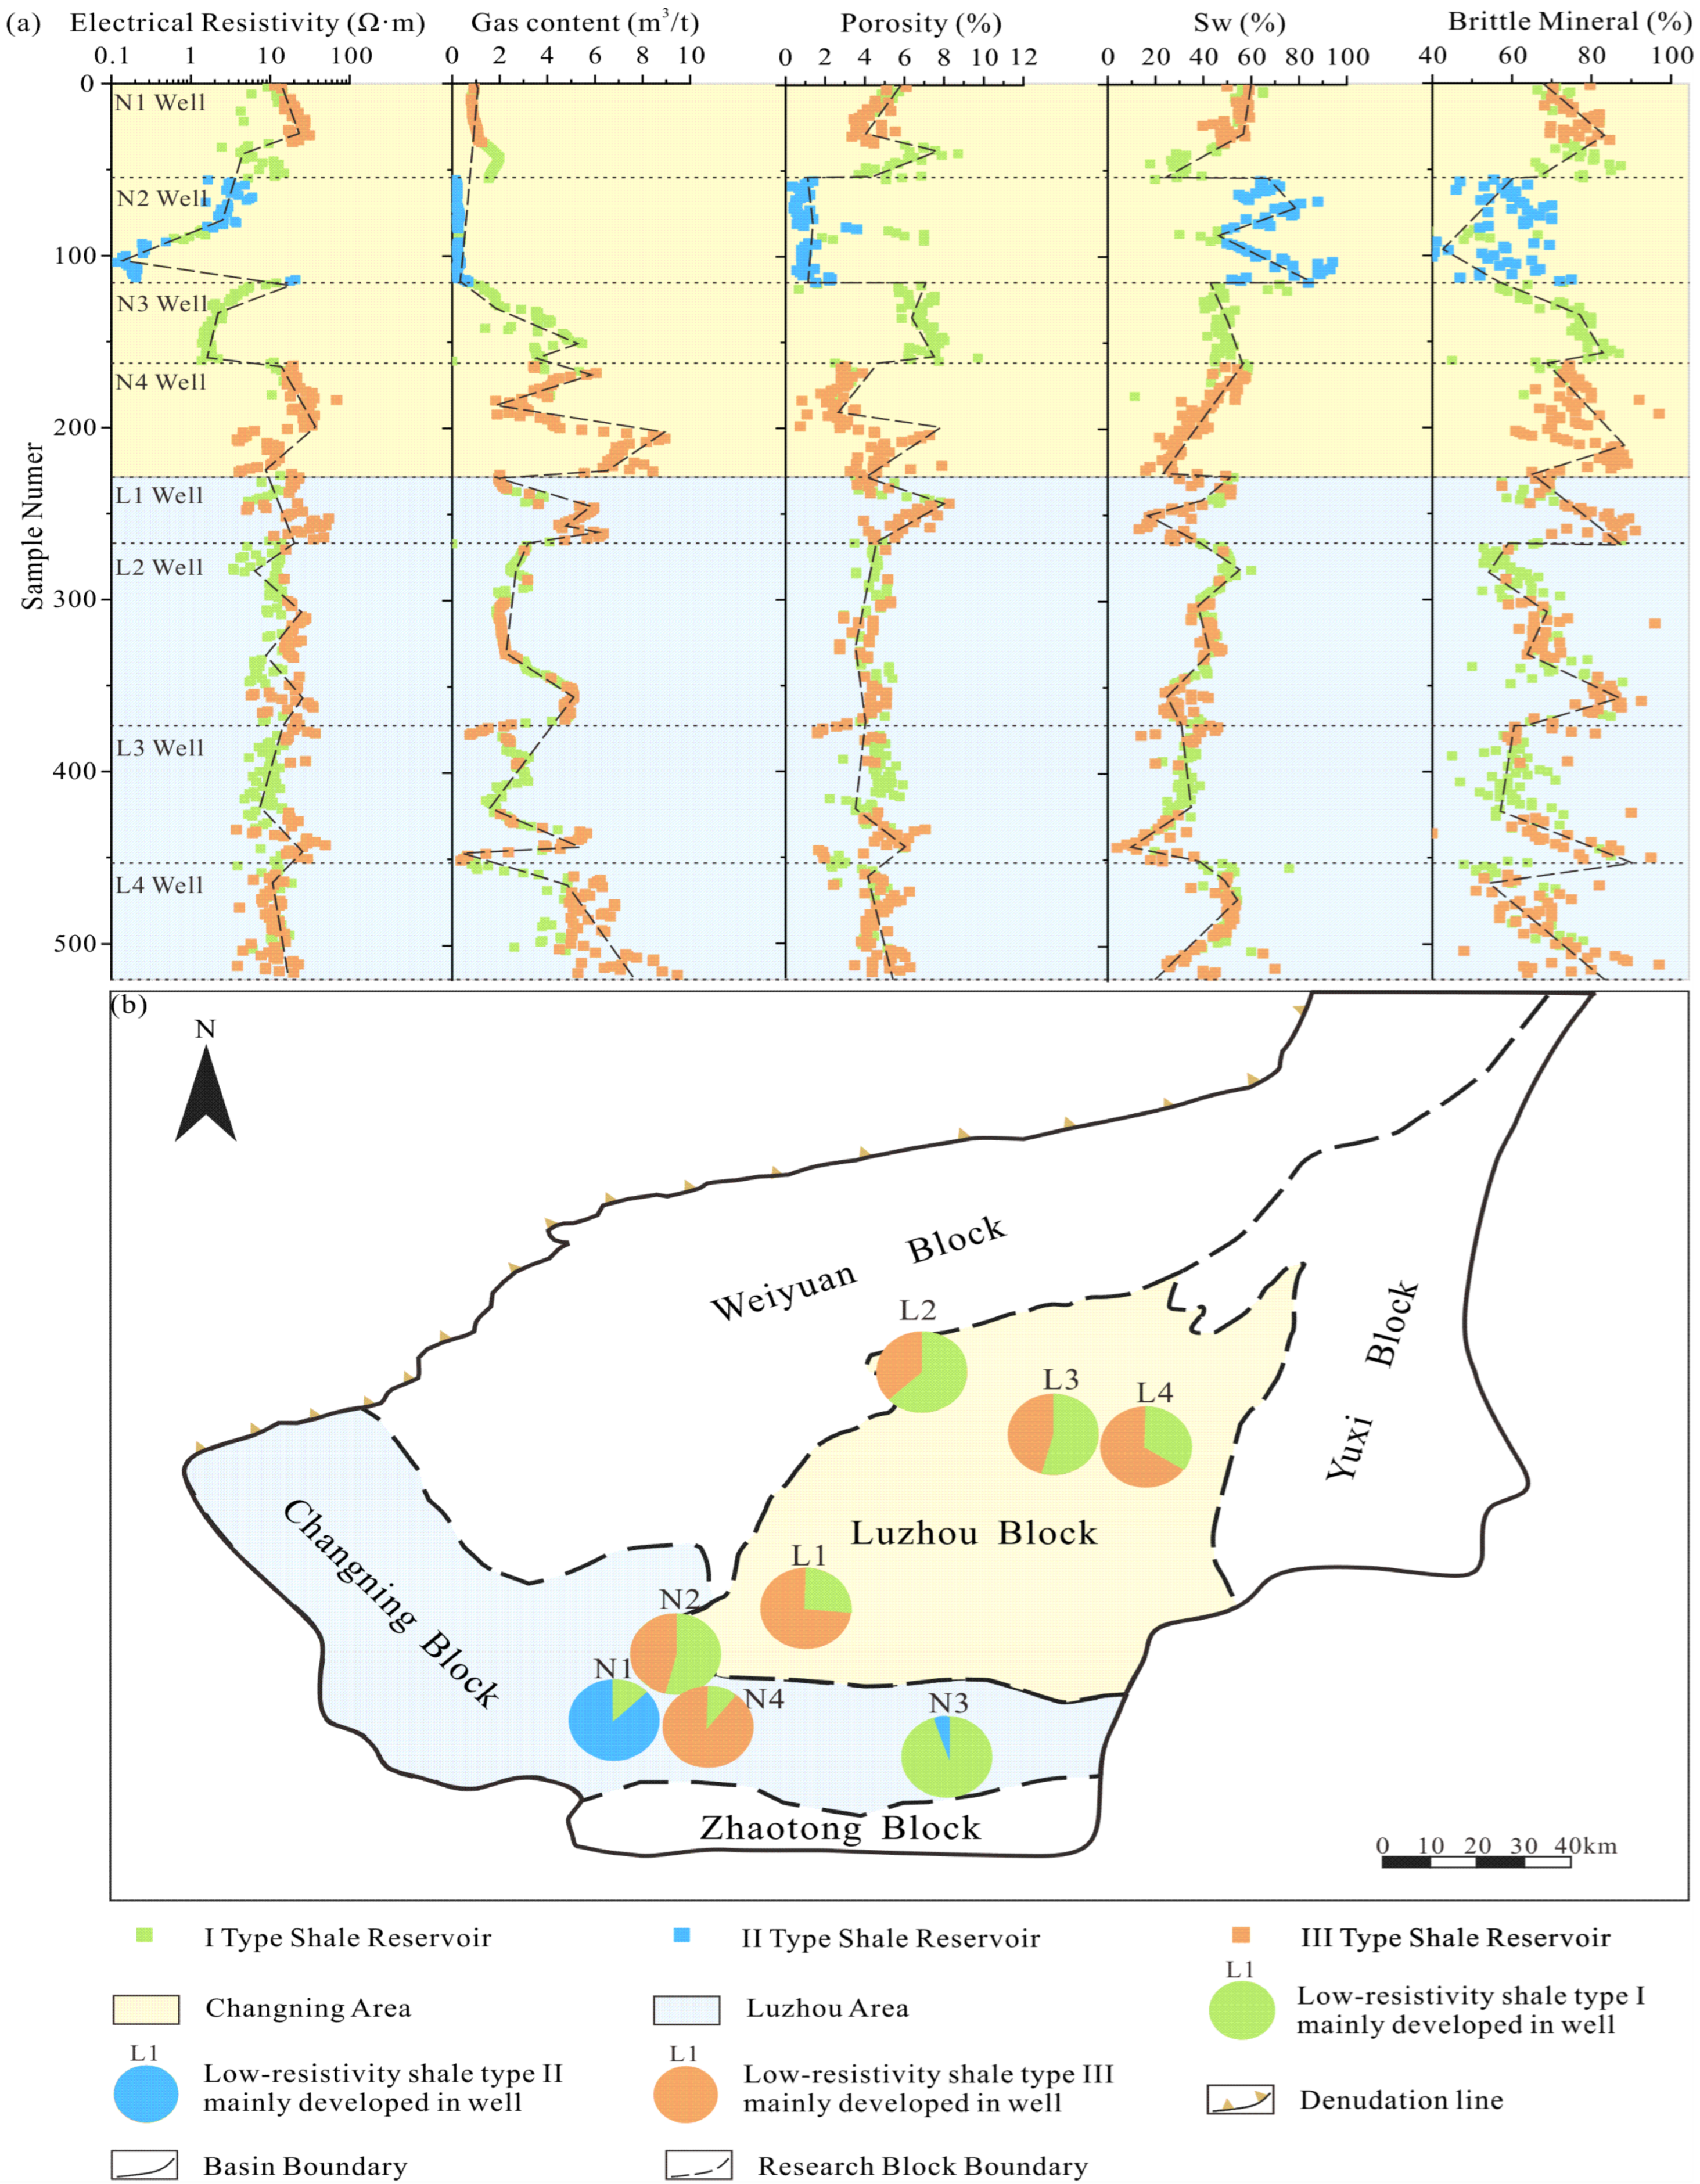
4.3. Distribution Characteristics of Low Resistivity Shale

The Wufeng-Longmaxi shale with a resistivity <20 Ω·m in the Southern Sichuan Basin was mainly distributed at the Changning block, Luzhou block and western Chongqing block [13,49]. The resistivity of Wufeng-Longmaxi shale at the Changning block varies widely from 0.12 Ω·m to 149.7 Ω·m. Low-resistivity shale is mainly distributed in the west of the Changning block, i.e., in the Shuanglong-Luochang area, with an average resistivity of 18.8 Ω·m. Low-resistivity shale can also be found in the southeast of the Changning block, especially the south of the Xuyong syncline, with an average resistivity of 3.4 Ω·m. Vertically, the resistivity is low in the L113 layer with a value of 7.8 Ω·m. The resistivity of Wufeng-Longmaxi shale at the Luzhou block is generally lower than that at the Changning block, where the resistivity is generally between 3.45 Ω·m and 54.4 Ω·m, with an average resistivity of 14.4 Ω·m. Shale with a resistivity <10 Ω·m is mainly distributed in the southeast of the Luzhou block, mainly at the Yunjin syncline, where a large number of natural fractures are widely developed. Similar to the Changning block, the resistivity of the L113 layer at the Luzhou block is also lower than that of other layers, with an average resistivity of 12.3 Ω·m. In terms of the three shale types, the resistivity varies in the order type II < type I < type III, with corresponding average values of 2.5 Ω·m, 8.1 Ω·m and 19.2 Ω·m, respectively (Figure 5).

4.4. Petrophysical Characteristics

4.4.1. Porosity

The measured porosities of low-resistivity shale samples vary greatly between 0.4% and 9.7%, which is lower than shale with resistivity >20 Ω·m. The value is an average of 4.1% at the Changning block and if 4.5% at the Luzhou block. The porosity of the three low-resistivity shale types varies greatly in the order type III > type II > type I, with corresponding values of 0.8–8.3% (average: 4.4%), 0.7–9.7% (average: 4.1%) and 0.4–3.6%, respectively.

4.4.2. Gas-Bearing Properties

The total gas content (desorbed gas + residual gas + lost gas) of studied Wufeng- Longmaxi shale samples primarily ranges from 0.1 m3/t to 9.5 m3/t, with an average value of 3.1 m3/t. It decreases upwards at both Changning block and Luzhou block. The average gas contents at the Changning block and Luzhou block are 2.5 m3/t and 3.6 m3/t, respectively. Furthermore, type II shale has the lowest total gas content, ranging from 0.1 m3/t to 0.7 m3/t (average: 0.2 m3/t). Type III shale has a higher total gas content compared with type I shale, with average values of 4.2 m3/t and 2.6 m3/t, respectively.

4.5. Graphitization Characteristics

Raman Spectrum Analysis

The six shale samples that have a similar mineral composition, TOC, porosity, and water saturation but different electrical resistivity were selected to identify the relationship between the thermal maturity and electrical properties of low-resistivity shale. Graphitization occurs to low-resistivity shale samples at the Changning block, e.g., Dh/Gh values of the three samples are between 0.53–0.78, with an average of 0.65. Obvious graphite peaks (G ‘peak) with Dh/Gh values >0.6 can be observed at sample 4277.11 m and sample 2327.24 m, indicating graphitized organic matter. The Dh/Gh of sample 3544.14 m is 0.53 with no obvious graphite peak. The graphitization of low-resistivity shale at the Luzhou block is much lower than that at the Changning block, where the Dh/Gh values of three samples are between 0.53–0.59, with an average of 0.57. The resistivity of these three samples is less than 20 Ω·m, indicating low graphitization of low-resistivity shale at the Luzhou block (Figure 6).

5. Discussion

The types and reservoir quality of low-resistivity shale in the Southern Sichuan Basin were determined based on resistivity distribution, thermal maturity, mineral composition and physical properties. After that, the sedimentary environment, diagenesis and tectonic activity at the Luzhou block and at the Changning block were integrated to investigate differences in the genetic mechanisms of low-resistivity shale reservoirs.

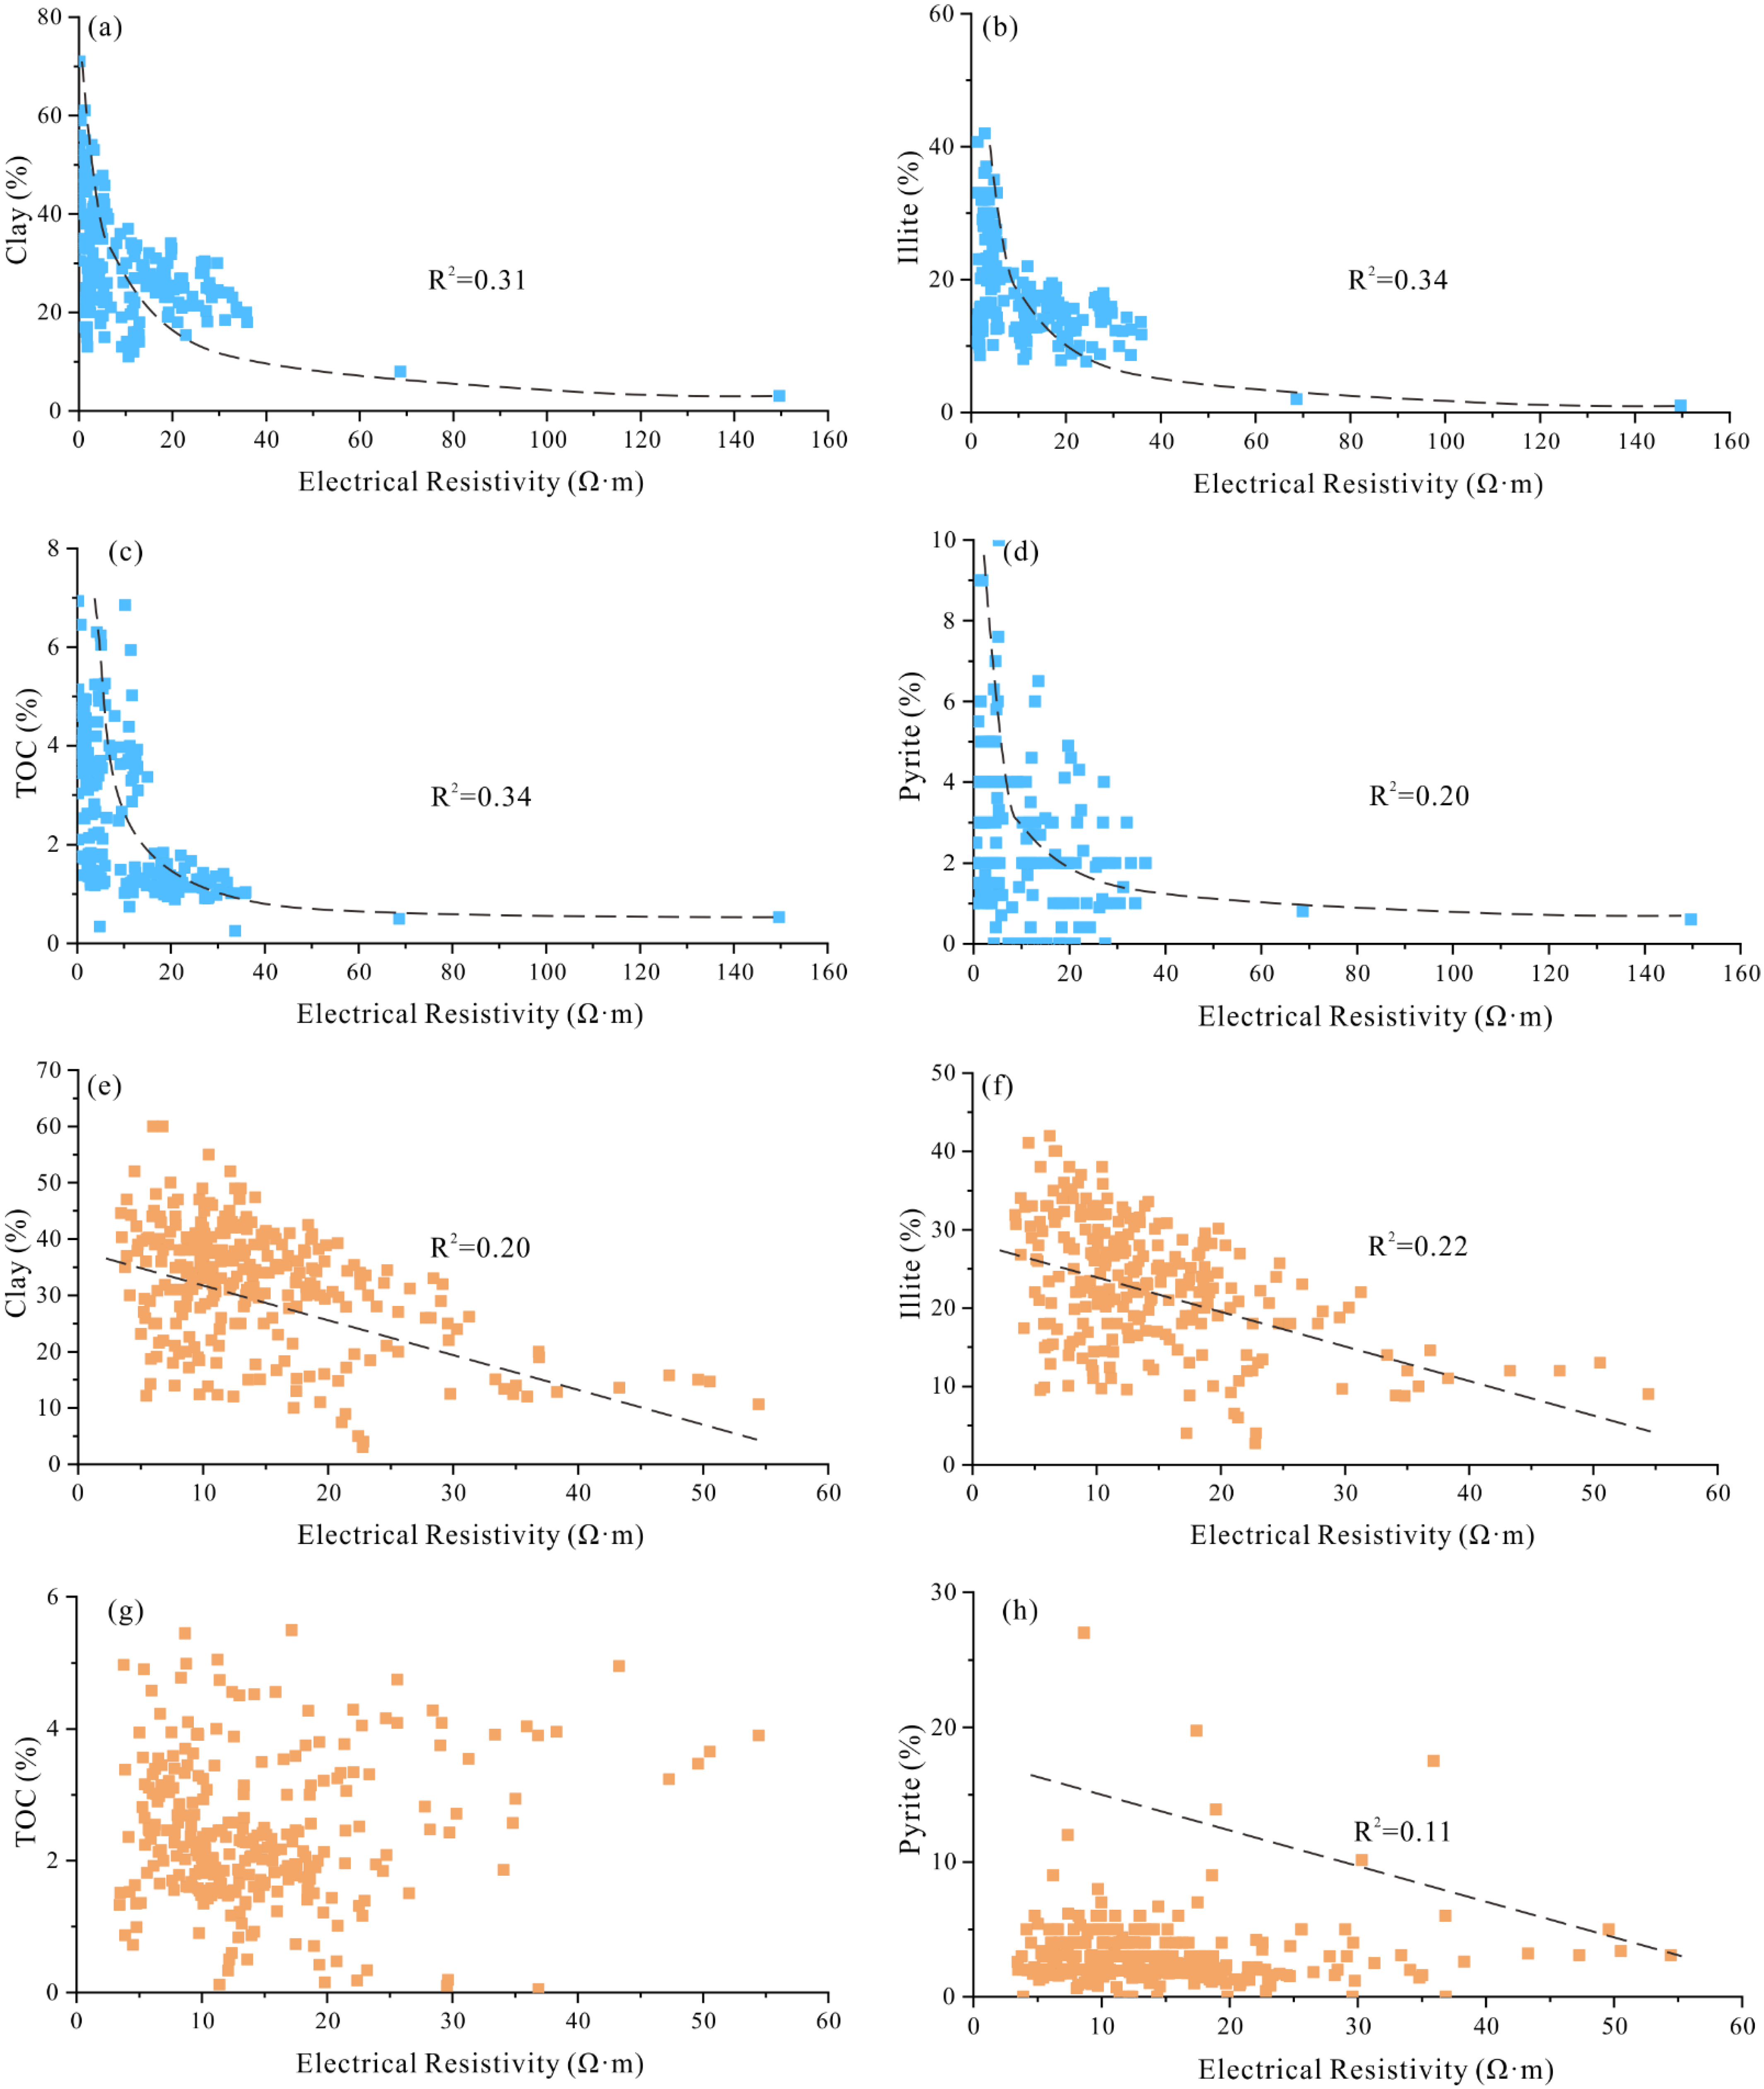
5.1. Key Geological Factors Controlling Low-Resistivity Origin

Analysis of low-resistivity shale reservoirs at the Changning block and Luzhou block suggested that the prevalence of low-resistivity shale in the Southern Sichuan Basin can be explained by the following three factors: high clay mineral content in shale, poor preservation conditions and graphitized shale associated with Emeishan basalt overflow.

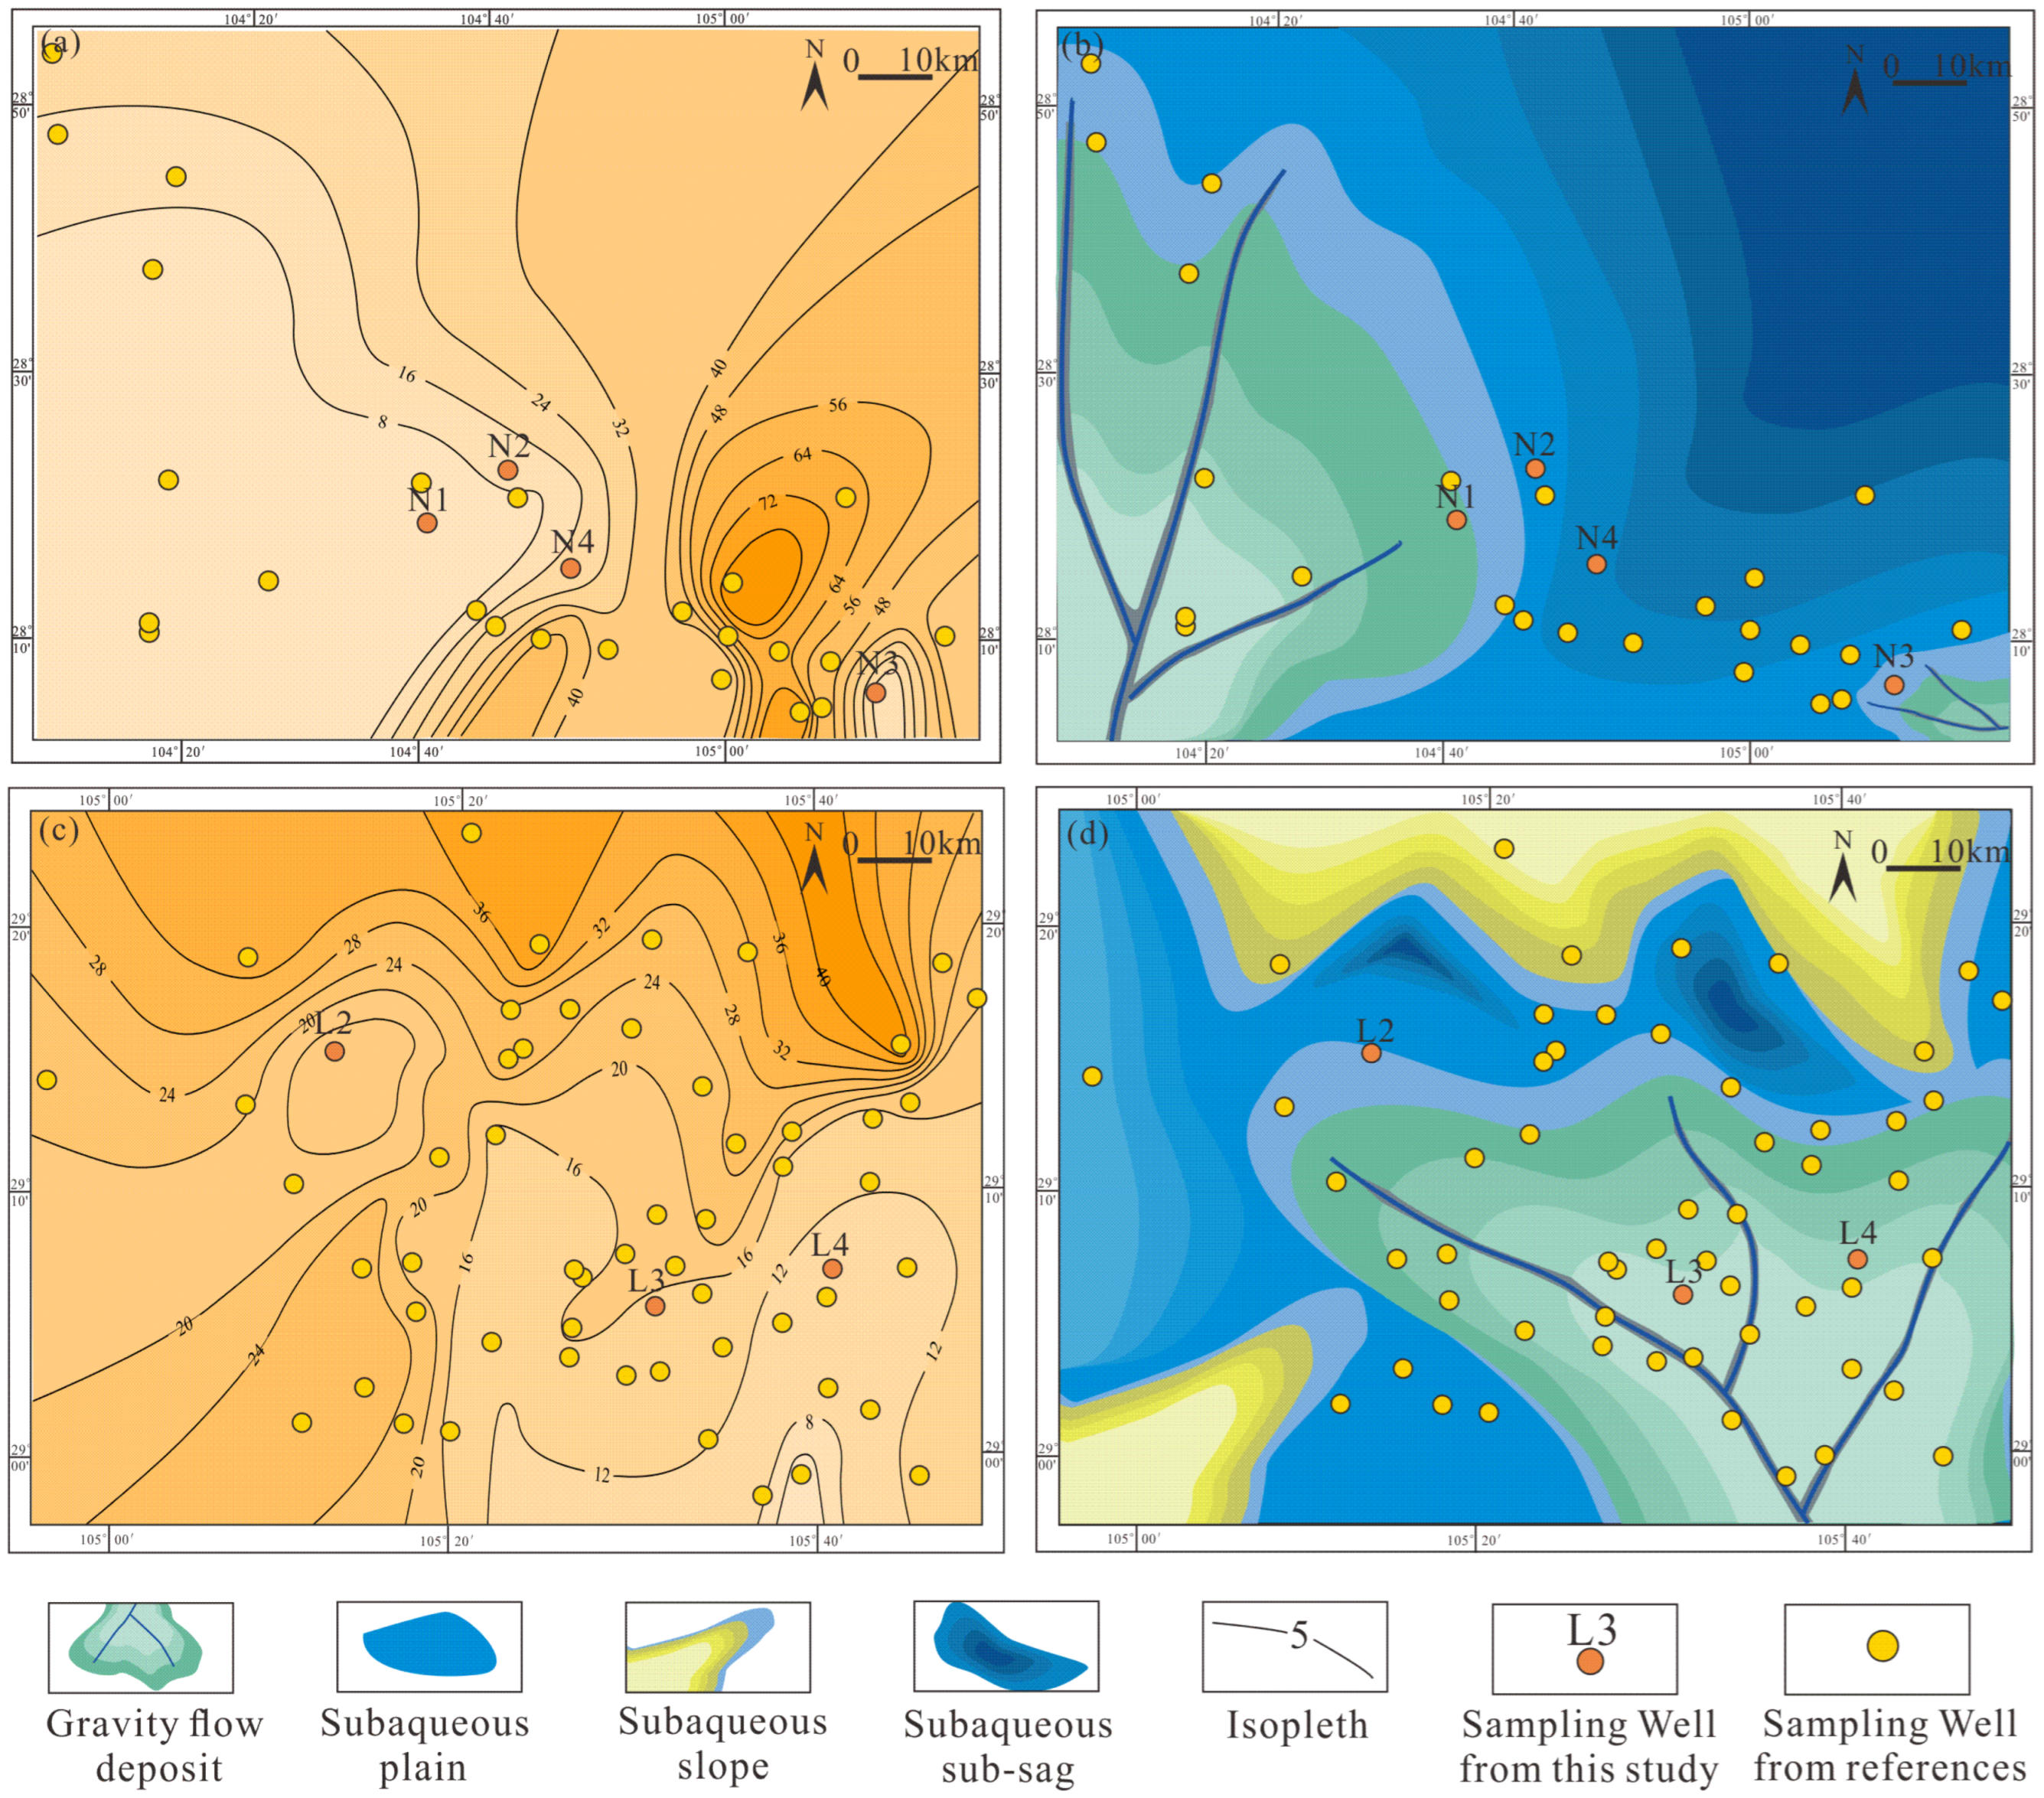
5.1.1. Gravity Flow Deposits

Gravity flow deposits are typically characterized by poor sorting and large variations in pore structure, which can result in low resistivity in sandstone reservoirs [50]. Gravity flow deposits were mainly developed in graptolite belt LM3–LM5 (L113 layer), at the Luzhou block and Changning block [51]. Gravity flow deposits at the Luzhou block are mainly distributed in the southeast, where shale with a resistivity <12 Ω·m and high clay mineral content of 35% was commonly derived from deep-water gravity flow deposits [23]. Gravity flow deposits at the Changning block are mainly distributed in the west and the south. Similarly, shale with a resistivity <8 Ω·m and clay mineral content >31.5% at the Changning block primarily originated from deep-water gravity flow deposits. This evidence indicates that gravity flow deposition controls the distribution of low-resistivity shale [52]. Core and thin-section observations suggest that gravity flow deposits in the southern Sichuan Basin are mainly composed of argillaceous shale and siltstone (Figure 7), with high clay mineral content and silty calcite content as well as low organic carbon content, where graded bedding, wavy bedding, vein bedding and lenticular bedding are generally developed [53]. A low-density turbidity current can be observed in low-resistivity shale at the Changning block and Luzhou block. For example, lenticular debris aggregates are mixed with dark organic matter at the L4 well, which are mainly clay minerals and siltstone with no orientation (Figure 7a). Considerable xenomorphic clastic clays can also be observed under a scanning electron microscope, which are mainly terrigenous inputs transported by the turbidity current (Figure 7b,c). Typical eroded cross bedding can be observed at the N2 well, where coarse silt mixed with terrigenous clay scours and erodes underlying argillaceous deposits in thin sections (Figure 7d,f). In addition, considerable fibrous illite can also be observed from SEM image, suggesting that the declining sea level during the Late Longmaxi period increased terrigenous material supply (Figure 7e,f) [54].
A negative correlation can be observed between clay mineral content (especially illite content) and resistivity in shale deposited at deep-water gravity flow at the Changning block and Luzhou block (Figure 8). This is because the high clay mineral content reduced the compressive strength of shale reservoirs, where primary intergranular pores were greatly decreased under mechanical compaction (Figure 7). In addition, abundant intergranular pores in clay minerals can reduce resistivity through increasing irreducible water saturation. Meanwhile, illite has large specific surface with a cation exchange capacity up to 10–40 cmol/k, much higher than that of chlorite and kaolinite, which can reduce resistivity significantly [6,55].
In addition, Woodruff et al. found that the cation exchange capacity of organic matter was reactivated during diagenesis by measuring complex shale resistivity [6,52]. This may be one of the explanations for the obvious negative correlation between the organic matter abundance and resistivity in shale at the Changning block. However, the correlation between organic matter abundance and resistivity is poor in shale with relatively low organic matter abundance (average: 2.4%), as in the Luzhou block. This can be explained by the fact that clastic material inputs at the Luzhou block diluted organic matter that exerted a limited impact on resistivity.
Pyrite is an important mineral to enhance the conductivity and polarization of the rock skeleton in low-resistivity shale [54]. However, shale from oxidizing deep-water gravity flow has low pyrite content, which is dispersed in pores and has little influence on resistivity (Figure 8). Therefore, pyrite content is not obviously correlated with resistivity at the Luzhou block and Changning block (Figure 8).

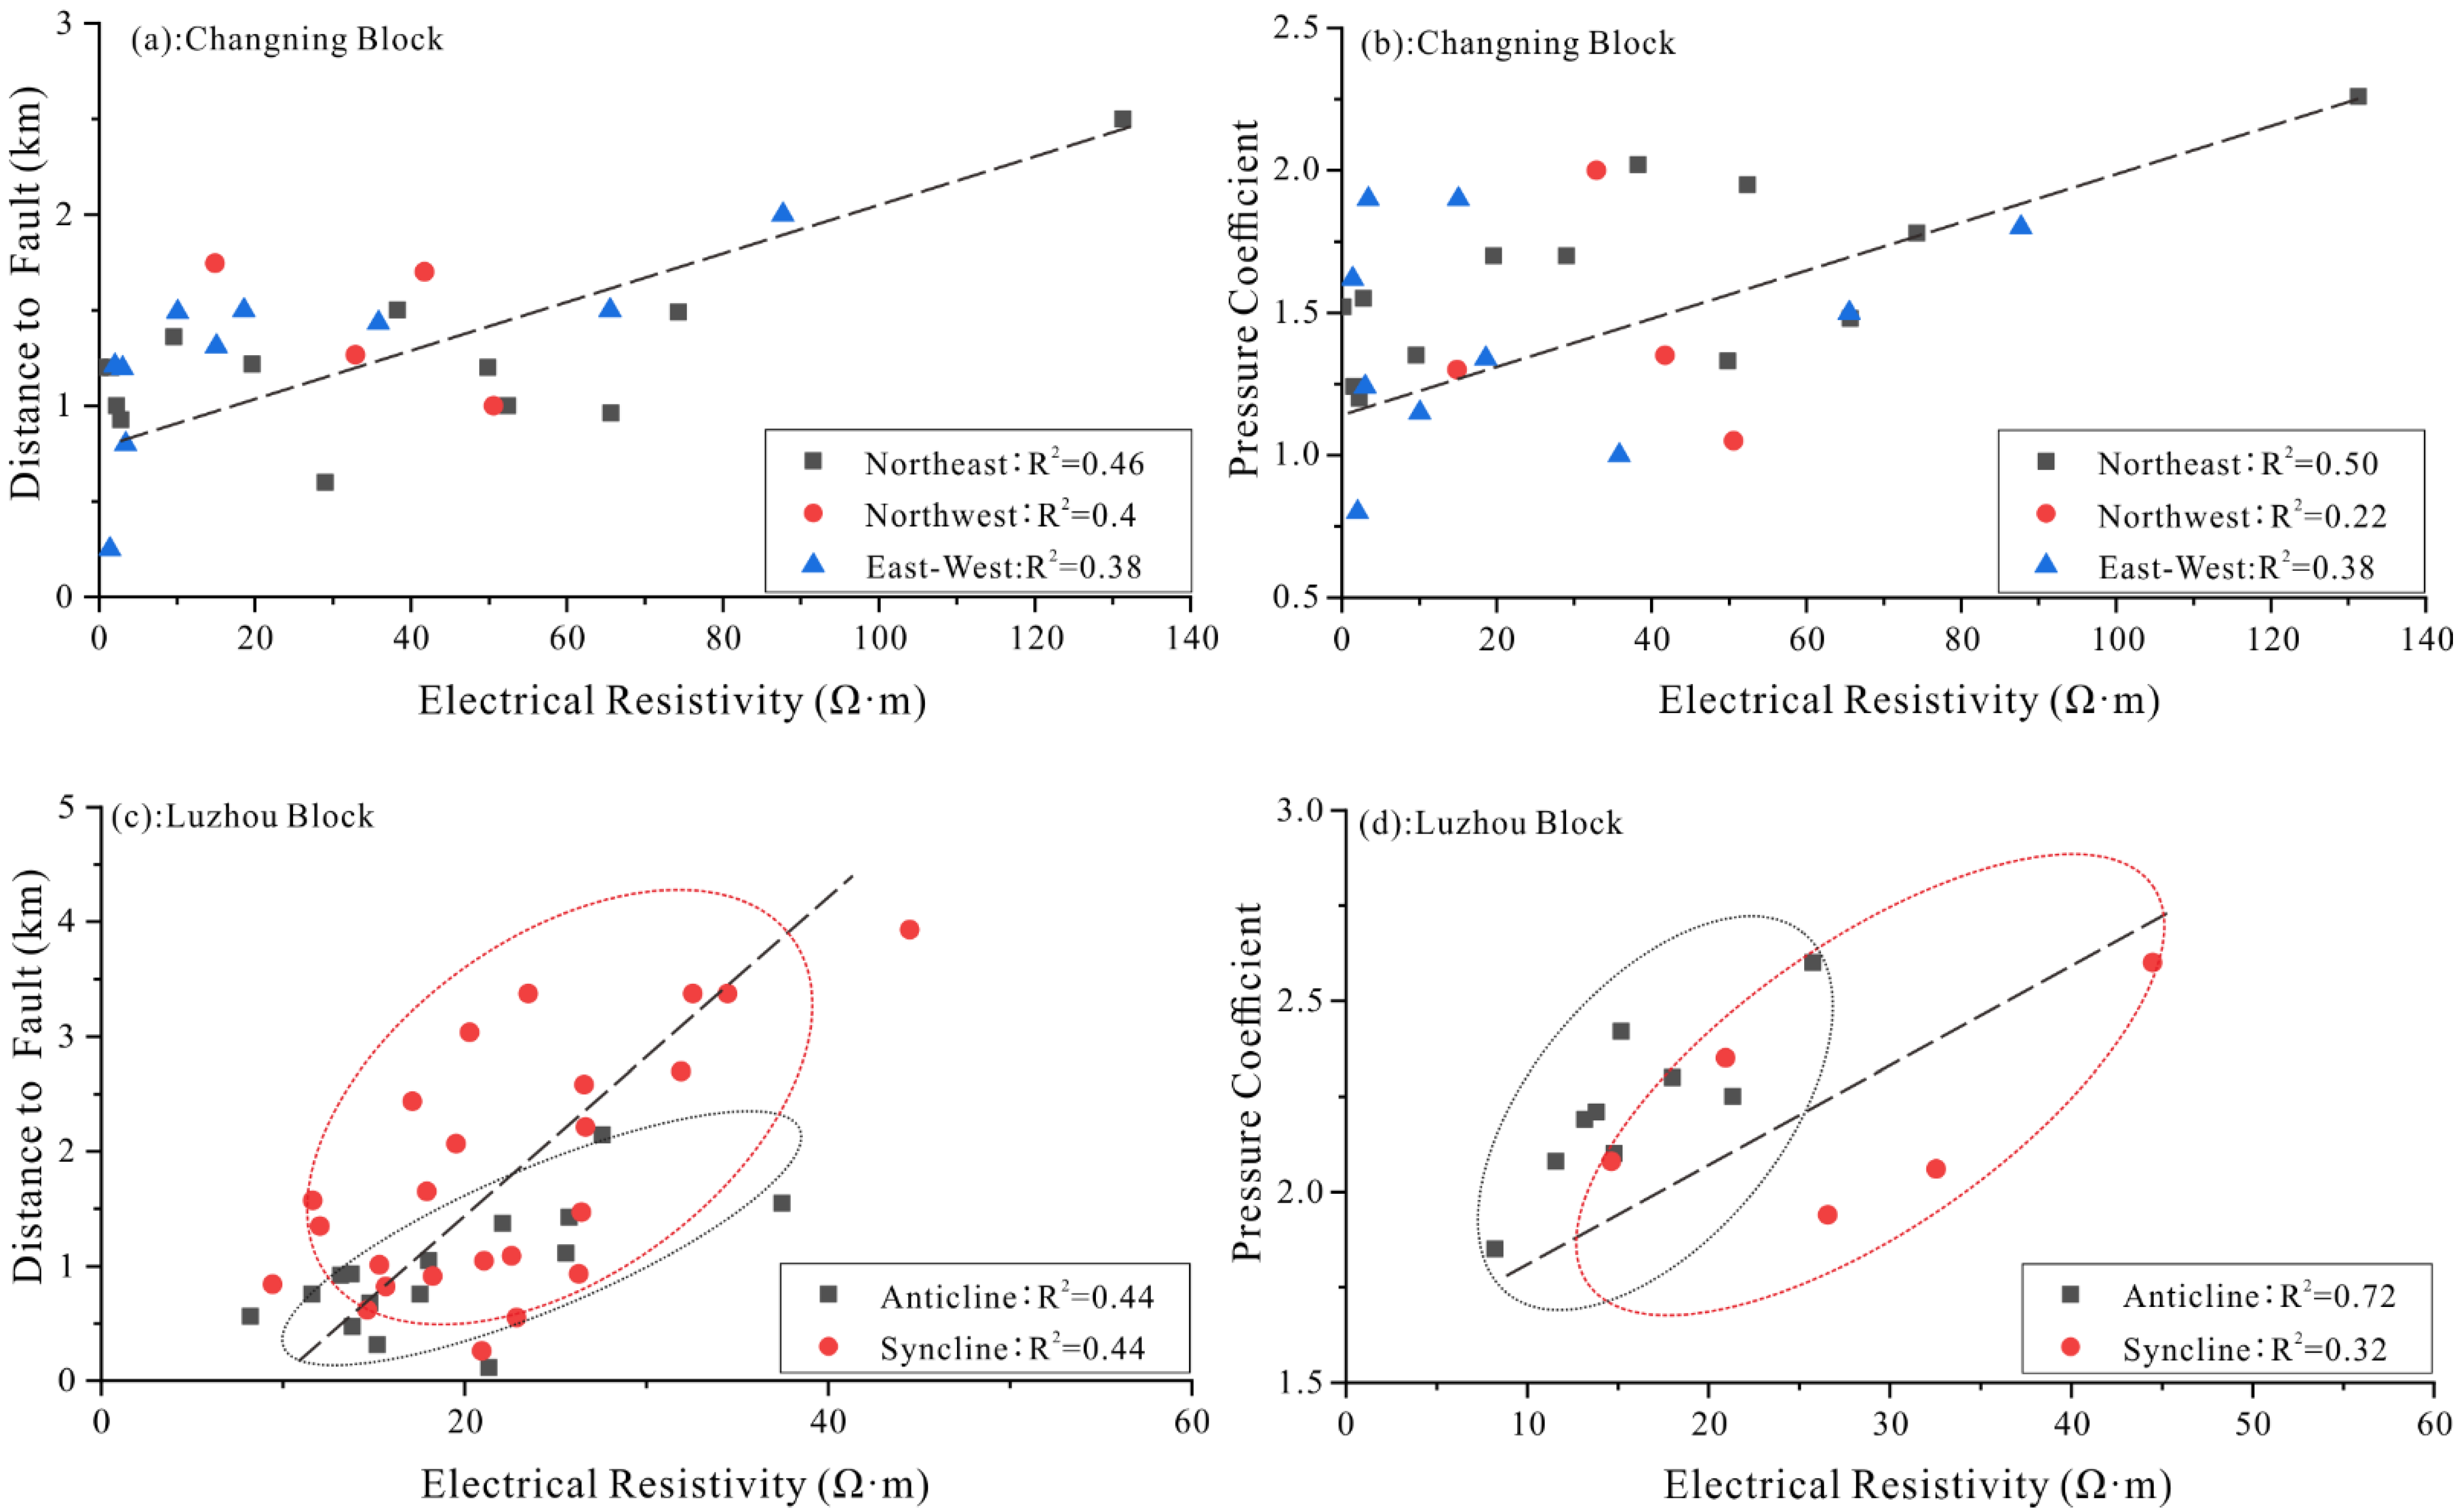
5.1.2. Poor Preservation Conditions

Many scholars use resistivity variation to study the electrical structure of the lithosphere in large-scale fault zones and ductile shear zones [55,56,57,58]. Complex fault systems with poor preservation conditions can lose shale gas and decrease the resistivity of shale reservoirs [58]. The distances between drilling wells and near NE-trending faults are well correlated with resistivity compared with the other two phases of faults at the Changning block (Figure 9a,b), and the same is true for pressure coefficients. Wyble (1958) reported the variation of the formation resistivity coefficient with pore pressure in sandstone, suggesting that the resistivity coefficient followed an increasing trend with pressure from 0 to 3500 psi [59,60]. In addition, well-developed NE-trending faults can worsen preservation conditions, decrease pressure coefficients and thereby reduce shale resistivity. The seismic profile shows that the N5 well is 0.8 km from the NE-trending faults and is 1.0 km from the NE-trending faults. These faults resulted in an average resistivity of 18.8 Ω·m and test yield of 11.12 m3/t at the L111 layer at the N5 well. All these show that the NE-trending faults exerted a negative impact on preservation conditions, resulting in low resistivity and gas content [61]. This is because large-scale uplift and denudation generally occurred in the Changning area during the early Himalayan period (25 Ma), and faults deeply cut the regional caprock–gypsum salt and shale in the Lower and Middle Triassic. Structural deformation reactivated pre-existing faults and developed a series of shallow faults, which greatly weakened structural preservation conditions and reduced shale resistivity [55,56,57,58,59,60,61]. The NE-trending fault has the largest scale among three phases of faults, which exerted significant impact on shale resistivity [61].
The average resistivity of the Wufeng-L114 layer of shale gas drilling wells located at the wing of tight anticline in the Luzhou Block mainly ranged from 8 to 27 Ω·m (average 19.1 Ω·m), while the average resistivity of Wufeng- L114 layer of shale gas drilling wells located at the wide and gentle syncline is mainly distributed from 10 to 44 Ω·m (average 23.4 Ω·m), indicating that the shale developed in the tight anticline has lower resistivity (Figure 9c,d). In addition, the drilling wells distributed in the tight anticline with low resistivity shale are closer to the fault (Figure 9c). It can be seen from the seismic profile (Figure 10) that the syncline in the Luzhou Block is wide and gentle with a small number of small intralayer and interlayer faults, while the anticline is relatively steep and narrow with many strata-dissecting faults at the wings. Therefore, the development of many strata-dissecting faults at the wing or top of the anticline may cause poor structural preservation conditions, leading to low-resistivity shale having developed widely.
Generally, micro-fractures are high-quality channels for water migration, which controls electrical conductance in rocks and can reduce electrical resistivity significantly [62,63,64].
Meter to centimeter-scale natural fractures can also slightly reduce resistivity in the Southern Sichuan Basin. High-angle and unfilled fractures are developed at 3298.6–3301.6 m at the N6 well at the Changning block, decreasing resistivity by 0.4–0.6 Ω·m (Figure 11a). Similarly, high-angle fractures are observed at 4275–4276.3 m at the L2 well at the Luzhou block, where the resistivity is decreased by 0.2–6 Ω·m (Figure 11b).

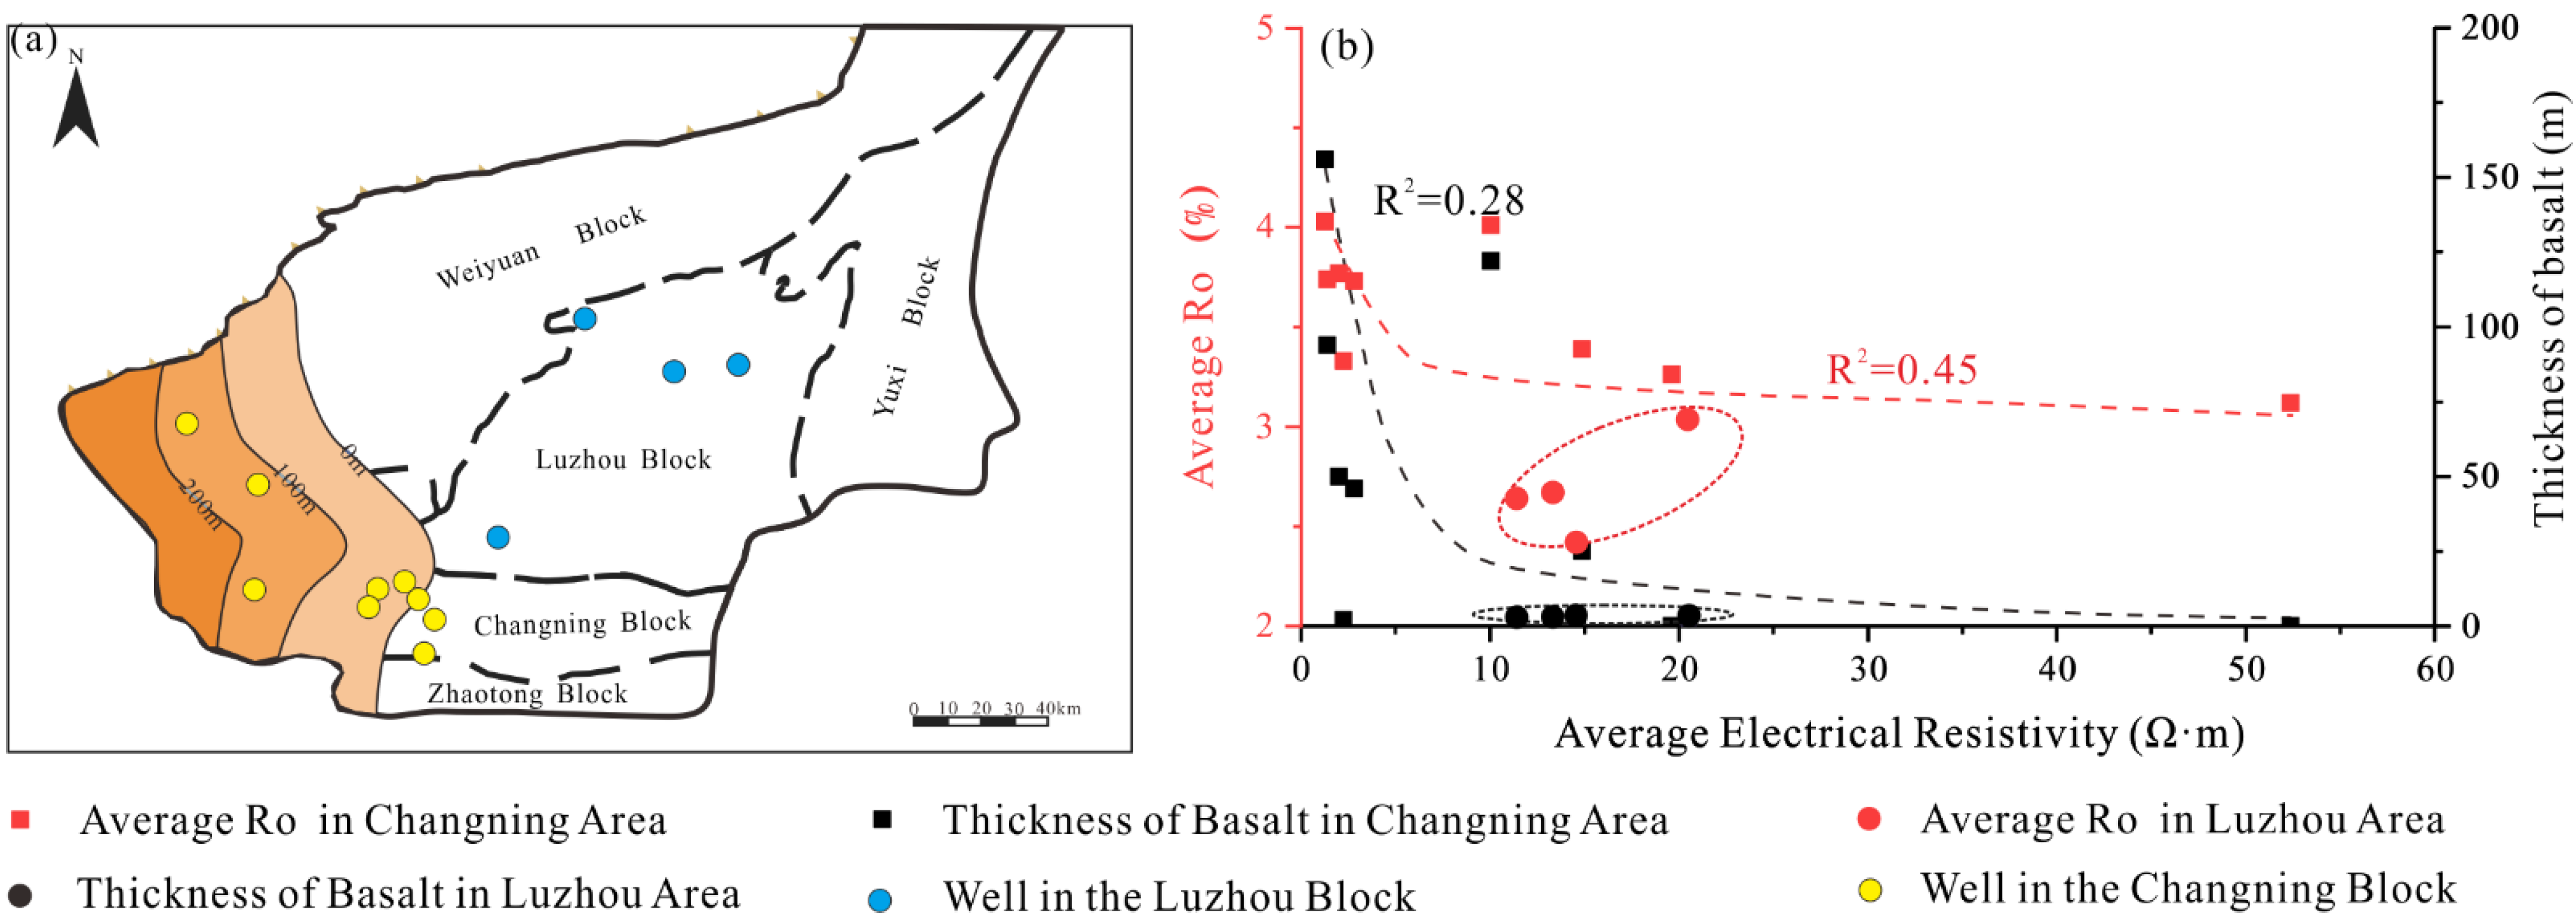
5.1.3. Thermal Maximum Associated with Emeishan Basalt

Kouketsu found that carbonaceous materials could be transformed from amorphous carbon to kish at temperatures >280 °C, where the continuously enhanced ductility and crystallinity of carbon layers can reduce resistivity [58]. Raman spectra showed that graphitization occurs in low-resistivity shale samples from the Changning block, and it is weak in shale samples from the Luzhou block (Figure 6). Many scholars believe that graphitization in Wufeng-Longmaxi shale in the southern Sichuan Basin was related to roasting caused by Emeishan volcanic rocks in the Late Permian [42]. Strong volcanic eruptions during this period brought extremely thick “Emeishan basalt” in Yunnan province, Guizhou province and Sichuan province, which altered the thermal maturity of shale within 400 km [65]. The west of the Changning block has the smallest basalt thickness in the Sichuan Basin, where the thickness of the thermal lithosphere is less than 130 km and the thickness of the basalt overflow is 0–350 m [41] (Figure 12a). The negative correlation between Ro values and resistivity is obvious at the Changning block but is weak at the Luzhou block (Figure 12b). In addition, drilled basalt thickness has a good positive correlation with Ro at the Changning block, while Ro values are low at the Luzhou block with no basalt (Figure 12). Raman spectra also show that Ro values decrease with decreasing basalt thickness and increasing distance from the overflow centre at the Changning block (Figure 12). However, Ro values of shale at the Luzhou block, far from basalt, have no obvious correlation with graphite content (Figure 12). Some scholars found that Emeishan basalt in the southern Sichuan Basin was primarily derived from the Yanshanian mantle plume with paleoheat flow up to 100 mW/m2. This could increase vitrinite reflectance by 0.4–0.7%, resulting in high-mature to over mature shale [65]. Furthermore, nano-scale pore networks in high-mature organic matter can increase isotopic and orthogonal conductivity components of complex resistivity, resulting in low-resistivity in shale [6,53]. The above evidence shows that graphitization and micro-pore generation worked together to decrease the resistivity of shale reservoirs at the Changning block. However, the lack of obvious graphitization at the Luzhou block suggests that low resistivity has little to do with Emeishan basalt.
In summary, the low shale resistivity in the west and the south of the Changning block was mainly caused by gravity flow deposits, poor preservation conditions and graphitization associated with Emeishan basalt overflow, While low-resistivity shale at the Luzhou block, far away from basalt overflow, was generated by gravity flow deposits and the fault–fracture system.

5.2. Influence of Low Resistivity on Reservoir Quality

Three types of low resistivity have developed in the Southern Sichuan Basin. Type II shale mainly developed in the west of Changning block and is lower in porosity compared with another two types. A higher clay content resulted in strong compaction in Type II shale, with few primary intergranular pores remaining. Secondly, the organic pore volume could reach the maximum at a Ro of 2.5% and will collapse gradually to disappear at a Ro of 3.5% [41]. This suggests that organic pores contribute little to porosity at the type II reservoir with an average Ro value of 3.79%. In addition, contact thermal metamorphism can develop metamorphic minerals in shale, e.g., chlorite and epidote, which can be further recrystallized under increasing temperature to block primary pores [65]. Type II shale also shows less gas content compared with the other two types, which may be related to Emeishan basalt. The gas generation peak of shale heated by basalt overflow was 100 Ma prior to unheated shale at the Changning block; as a result, shale gas was lost considerably under multiple tectonic activities during the long geological period [66,67]. Furthermore, some scholars believe that Emeishan basalt enabled organic matter in type II shale at the Changning block to release considerable nitrogen, increasing nitrogen volume and reducing methane volume in total gas [68]. Type III shale is rich in quartz, where microcrystalline quartz could fill primary pores at the early diagenetic stage and increase the compressive strength of the shale reservoir. Therefore, porosity in type III shale reservoirs is the highest among these three types. In addition, good preservation conditions contribute to the high gas content in type III shale reservoirs. Hence, type III shale is a characteristic of high-quality reservoirs, which is a favorable exploration target in the Southern Sichuan Basin (Figure 13).

6. Conclusions

(1) Primary geological elements for low-resistivity shale development at the Changning block were gravity flow deposits, poor preservation conditions and shale graphitization, while low-resistivity shale at the Luzhou block was mainly due to gravity flow deposits and poor preservation conditions. A. high clay mineral content (>30%) was derived from the rapid deposition of terrigenous debris due to the turbidity current. Clay minerals (especially illite) increase cation exchange capacity and develop a large number of intergranular pores occupied by irreducible water saturation, reducing the resistivities of shale reservoirs significantly. Poor preservation conditions were commonly associated with widely developed faults and natural fractures, which is one of main reasons for the reduction of resistivity. The largest-scale NE-trending faults at the Changning block mainly control the distribution of low-resistivity shale. A large number of through-strata faults and natural fractures were widely developed at the top and wings of tight anticlines at the Luzhou block, decreasing shale resistivity by 5 Ω·m. Emeishan basalt increased the thermal maturity (average Ro of 3.6%) and graphitization of shales, which reduced the resistivity of shale reservoirs to <5 Ω·m at the Changning block. Shales at the Luzhou block, 80 km from basalt, are limitedly graphitized.
(2) Three types of low-resistivity shale reservoirs have developed in the Southern Sichuan Basin. Type I shale has high quartz and clay mineral contents, with fair porosity and gas content. Type II low-resistivity shale is characterized by low TOC, low gas content and low porosity compared with the other two types due to organic matter graphitization, which is mainly developed in the west of the Changning block. Type III low-resistivity shale has relatively high quartz content, high TOC, high porosity and high gas content with no obvious graphitization. It is distributed at the Luzhou block and the middle to the east of the Changning block, which is a favorable exploration target in the Southern Sichuan Basin.
However, the current research results lack the use of validation metrics and only involved a preliminary discussion on the control factors of low resistivity shale. In the next step, we will verify the current control factors of low resistivity shale by using reasonable mathematical methods and more data, more accurate models of uncertainty quantification and sensitivity analyses. The log evaluation method of gas saturation at low- resistivity shale reservoir will be studied, and a calculation model for low-resistivity shale will be established in future.

Supplementary Materials

The following supporting information can be downloaded at: https://www.mdpi.com/article/10.3390/en15165801/s1, Table S1: Reservoir characteristics of three types of low-resistivity shale samples in the Southern Sichuan Basin.

Author Contributions

Conceptualization, X.M. and H.W.; methodology, T.Z.; software, T.Z.; validation, T.Z. and Q.Z.; formal analysis, Q.Z.; investigation, X.M.; resources, X.M.; data curation, F.C.; writing—original draft preparation, T.Z.; writing—review and editing, Z.S.; visualization, Z.S.; supervision, Z.S.; project administration, S.S.; funding acquisition, X.M. All authors have read and agreed to the published version of the manuscript.

Funding

This research received no external funding.

Institutional Review Board Statement

Not applicable.

Informed Consent Statement

Informed consent was obtained from all subjects involved in the study.

Data Availability Statement

The data relevant to this study can be accessed by contacting the corresponding author.

Conflicts of Interest

The authors declare no conflict of interest.

References

  1. Ashqar, A.; Uchida, M.; Salahuddin, A.A.; Olayiwola, S.O.; Awolayo, A.N.; Calgary, U.O. Evaluating a Complex Low-Resistivity Pay Carbonate Reservoir Onshore Abu Dhabi: From Model to Implementation. In International Petroleum Exhibition & Conference; University of Calgary: Abu Dhabi, United Arab Emirates, 2016. [Google Scholar]
  2. Wang, X.; Zhang, B.; He, Z.; He, L.; Yang, K.; Huang, T.; Luo, F.; Tang, J.; Gan, L. Electrical properties of Longmaxi organic-rich shale and its potential applications to shale gas exploration and exploitation. J. Nat. Gas. Sci. Eng. 2016, 36, 573–585. [Google Scholar] [CrossRef]
  3. Jianmeng, S.; Zhu, X.; Hong, L.; Hongpan, Z.; Jinjiang, Z.; Aarnes, I.; Aarnes, I. Mechanism analysis and logging evaluation of low resistivity in lower Paleozoic shale gas reservoirs of Yangtze region. J. China Univ. Pet. 2018, 42, 47–56. [Google Scholar]
  4. Senger, K.; Birchall, T.; Betlem, P.; Ogata, K.; Ohm, S.; Olaussen, S.; Paulsen, R.S. Resistivity of reservoir sandstones and organic rich shales on the Barents Shelf: Implications for interpreting CSEM data. Geosci. Front. 2021, 12, 101063. [Google Scholar] [CrossRef]
  5. Spacapan, J.B.; Odorico, A.; Palma, O.; Galland, O.; Senger, K.; Ruiz, R.; Manceda, R.; Leanza, H.A. Low resistivity zones at contacts of igneous intrusions emplaced in organic-rich formations and their implications on fluid flow and petroleum systems: A case study in the northern Neuquén Basin, Argentina. Basin. Res. 2019, 32, 3–24. [Google Scholar] [CrossRef]
  6. Zhang, B.; Wen, H.; Qing, H.; Yang, K.; Luo, Y.; Yang, H.; Wang, P.; He, L.; Xiao, W. The influence of depositional and diagenetic processes on rock electrical properties: A case study of the Longmaxi shale in the Sichuan Basin. J. Petrol. Sci. Eng. 2022, 211, 110119. [Google Scholar] [CrossRef]
  7. Revil, A.; Cathles, L.M.; Losh, S.; Nunn, J.A. Electrical conductivity in shaly sands with geophysical applications. J. Geophys. Res. Solid. Earth. 1998, 103, 23925–23936. [Google Scholar] [CrossRef]
  8. Bai, Z.; Tan, M.; Li, G.; Shi, Y. Analysis of low-resistivity oil pay and fluid typing method of Chang 81 Member, Yanchang Formation in Huanxian area, Ordos Basin, China. J. Petrol. Sci. Eng. 2019, 175, 1099–1111. [Google Scholar] [CrossRef]
  9. Chunmei, L.; Furong, W.; Dianguang, Z.; Cai, P.; Hongxi, G.; Jie, L. Logging-based assessment of low-resistivity oil zones: A case study from Sudan. Energy Geosci. 2021. [Google Scholar] [CrossRef]
  10. Wu, Y.; Lin, C.; Yan, W.; Liu, Q.; Zhao, P.; Ren, L. Pore-scale simulations of electrical and elastic properties of shale samples based on multicomponent and multiscale digital rocks. Mar. Petrol. Geol. 2020, 117, 104369. [Google Scholar] [CrossRef]
  11. Zhong, Z.; Rezaee, R.; Josh, M.; Esteban, L.; Sarmadivaleh, M. The salinity dependence of electrical conductivity and Archie’s cementation exponent in shale formations. J. Petrol. Sci. Eng. 2022, 208, 109324. [Google Scholar] [CrossRef]
  12. Yan, W.; Sun, J.; Zhang, J.; Yuan, W.; Zhang, L.; Cui, L.; Dong, H. Studies of electrical properties of low-resistivity sandstones based on digital rock technology. J. Geophys. Eng. 2018, 15, 153–163. [Google Scholar] [CrossRef] [Green Version]
  13. Wang, Y.; Jia, H.; Kou, Y.; Hao, Z. Causes of low resistivity of Longmaxi Formation shale reservoirs in Changning area. Pet. Geol. Recovery Effic. 2022, 29, 53–61. [Google Scholar]
  14. Tian, X.; He, X.; Song, D.; Li, Z.; Khan, M.; Liu, H.; Qiu, L. AFM characterization of surface mechanical and electrical properties of some common rocks. Int. J. Min. Sci. Technol. 2021, 32, 435–445. [Google Scholar] [CrossRef]
  15. Cherubini, A.; Garcia, B.; Cerepi, A.; Revil, A. Influence of CO2 on the Electrical Conductivity and Streaming Potential of Carbonate Rocks. J. Geophys. Res. Solid Earth 2019, 124, 10056–10073. [Google Scholar] [CrossRef] [Green Version]
  16. Ma, X.; Xie, J.; Yong, R.; Zhu, Y. Geological characteristics and high production control factors of shale gas reservoirs in Silurian Longmaxi Formation, southern Sichuan Basin, SW China. Petrol. Explor. Dev. 2020, 47, 901–915. [Google Scholar] [CrossRef]
  17. Ma, X.; Wang, H.; Zhou, S.; Shi, Z.; Zhang, L. Deep shale gas in China: Geological characteristics and development strategies. Energy Rep. 2021, 7, 1903–1914. [Google Scholar] [CrossRef]
  18. Shu, Y.; Lu, Y.; Chen, L.; Wang, C.; Zhang, B. Factors influencing shale gas accumulation in the lower Silurian Longmaxi formation between the north and South Jiaoshiba area, Southeast Sichuan Basin, China. Mar. Petrol. Geol. 2020, 111, 905–917. [Google Scholar] [CrossRef]
  19. Zhai, G.; Wei, B.; Xiang, K.; Hui, F.; Liang, Z. Study on the complex resistivity characteristics of organic-rich shale in the Longmaxi Formation in the Weiyuan area, China. Geophys. Prospect. Pet. 2021, 60, 844–855. [Google Scholar]
  20. Shi, Z.; Dong, D.; Wang, H.; Sun, S.; Wu, J. Reservoir characteristics and genetic mechanisms of gas-bearing shales with different laminae and laminae combinations: A case study of Member 1 of the Lower Silurian Longmaxi shale in Sichuan Basin, SW China. Petrol. Explor. Dev. 2020, 47, 888–900. [Google Scholar] [CrossRef]
  21. Jiang, L. Research on the Preservation Conditions of Lower Paleozoic Shale Gas in Southern Sichuan under Strong Transformation. Ph.D. Thesis, Chengdu University of Technology, Chengdu, China, 2019. [Google Scholar]
  22. Shi, Z.; Qiu, Z. Main Bedding Types of Marine Fine-Grained Sediments and their Significance for Oil and Gas Exploration and Development. Acta Sedimentol. Sin. 2021, 39, 181–196. [Google Scholar]
  23. Shi, Z.; Zhou, T.; Guo, W.; Liang, P.; Cheng, F. Quantitative Paleogeographic Mapping and Sedimentary Microfacies Division in a Deep-water Marine Shale Shelf: Case study of Wufeng-Longmaxi shale, southern Sichuan Basin, China. Acta Sedimentol. Sin. 2022. [Google Scholar] [CrossRef]
  24. Shi, Z.; Wu, J.; Dong, D.; Sun, S.; Guo, C.; Li, G. Pore types and pore size distribution of the typical Wufeng-Longmaxi shale wells in the Sichuan Basin. Earth Sci. Front. 2021, 28, 249–260. [Google Scholar]
  25. Wang, H.; Shi, Z.; Zhao, Q.; Liu, D.; Sun, S.; Guo, W.; Liang, F.; Lin, C.; Wang, X. Stratigraphic framework of the Wufeng-Longmaxi shale in and around the Sichuan Basin, China: Implications for targeting shale gas. Energy Geosci. 2020, 1, 124–133. [Google Scholar] [CrossRef]
  26. Dong, D.; Shi, Z.; Sun, S.; Guo, C.; Zhang, C.; Guo, W.; Guan, Q.; Zhang, M.; Jiang, S.; Zhang, L.; et al. Factors controlling microfractures in black shale: A case study of Ordovician Wufeng Formation–Silurian Longmaxi Formation in Shuanghe Profile, Changning area, Sichuan Basin, SW China. Petrol. Explor. Dev. 2018, 45, 763–774. [Google Scholar] [CrossRef]
  27. Wang, H.; Shi, Z.; Sun, S.; Zhang, L. Characterization and genesis of deep shale reservoirs in the first Member of the Silurian Longmaxi Formation in southern Sichuan Basin and its periphery. Oil Gas Geol. 2021, 42, 66–75. [Google Scholar]
  28. Dong, M.; Guo, W.; Zhang, L.; Wu, Z.; Ma, L.; Dong, H.; Feng, X.; Yang, Y. Characteristics of paleotectonic stress field and fractures of Wufeng-Longmaxi Formation in Luzhou area, southern Sichuan Basin. Lithologic Reservoirs. Lithol. Reserv. 2022, 34, 43–51. [Google Scholar]
  29. Zhou, T.; Wu, C.; Guan, X.; Wang, J.; Zhu, W.; Yuan, B. Effect of Diagenetic Evolution and Hydrocarbon Charging on the Reservoir-Forming Process of the Jurassic Tight Sandstone in the Southern Junggar Basin, NW China. Energies 2021, 14, 7832. [Google Scholar] [CrossRef]
  30. Xu, H.; Zhou, W.; Hu, Q.; Yi, T.; Ke, J.; Zhao, A.; Lei, Z.; Yu, Y. Quartz types, silica sources and their implications for porosity evolution and rock mechanics in the Paleozoic Longmaxi Formation shale, Sichuan Basin. Mar. Petrol. Geol. 2021, 128, 105036. [Google Scholar] [CrossRef]
  31. Anovitz, L.M.; Cole, D.R. Characterization and Analysis of Porosity and Pore Structures. Rev. Miner. Geochem. 2015, 80, 61–164. [Google Scholar] [CrossRef] [Green Version]
  32. Tang, X.; Jiang, S.; Jiang, Z.; Li, Z.; He, Z.; Long, S.; Zhu, D. Heterogeneity of Paleozoic Wufeng-Longmaxi formation shale and its effects on the shale gas accumulation in the Upper Yangtze Region, China. Fuel 2019, 239, 387–402. [Google Scholar] [CrossRef]
  33. Zhang, L.; Xiao, D.; Lu, S.; Jiang, S.; Chen, L.; Guo, T.; Wu, L. Pore development of the Lower Longmaxi shale in the southeastern Sichuan Basin and its adjacent areas: Insights from lithofacies identification and organic matter. Mar. Petrol. Geol. 2020, 122, 104662. [Google Scholar] [CrossRef]
  34. Tang, X.; Jiang, Z.; Jiang, S.; Cheng, L.; Zhang, Y. Characteristics and origin of in-situ gas desorption of the Cambrian Shuijingtuo Formation shale gas reservoir in the Sichuan Basin, China. Fuel 2017, 187, 285–295. [Google Scholar] [CrossRef]
  35. Wu, K.; Xiong, W.; Hu, Z.; Gao, S. Experimental Study on Influence of Different Degrees of Water Saturation on Seepage Capacity of Shale. Res. Explor. Lab. 2018, 37, 32–35. [Google Scholar]
  36. Zhu, L.; Ma, Y.; Cai, J.; Zhang, C.; Wu, S.; Zhou, X. Key factors of marine shale conductivity in southern China—Part II: The influence of pore system and the development direction of shale gas saturation models. J. Petrol. Sci. Eng. 2022, 209, 109516. [Google Scholar] [CrossRef]
  37. Gao, H.; Ding, A.; Cai, X.; He, G. Genetic analysis of abnormal resistivity of Middle-Upper Yangtze marine shales. Fault Block Oil Gas Field 2016, 23, 578–582. [Google Scholar]
  38. Tian, H.; Li, T.; Zhang, T.; Xiao, X. Characterization of methane adsorption on overmature Lower Silurian–Upper Ordovician shales in Sichuan Basin, southwest China: Experimental results and geological implications. Int. J. Coal Geol. 2016, 156, 36–49. [Google Scholar] [CrossRef]
  39. Schoenherr, J.; Littke, R.; Urai, J.L.; Kukla, P.A.; Rawahi, Z. Polyphase thermal evolution in the Infra-Cambrian Ara Group (South Oman Salt Basin) as deduced by maturity of solid reservoir bitumen. Org. Geochem. 2007, 38, 1293–1318. [Google Scholar] [CrossRef]
  40. Ohtomo, Y.; Kakegawa, T.; Ishida, A.; Nagase, T.; Rosing, M.T. Evidence for biogenic graphite in early Archaean Isua metasedimentary rocks. Nat. Geosci. 2014, 7, 25–28. [Google Scholar] [CrossRef]
  41. Wang, Y.; Li, X.; Chen, B.; Wu, W.; Dong, D.; Zhang, J.; Han, J.; Ma, J.; Dai, B.; Wang, H.; et al. Lower limit of thermal maturity for the carbonization of organic matter in marine shale and its exploration risk. Petrol. Explor. Dev. 2018, 45, 385–395. [Google Scholar] [CrossRef]
  42. Wang, Y.; Wei, G.; Shen, J.; Qiu, Z.; LI, X.; Zhang, Q.; Zhang, L.; Wang, C.; Liu, W. Analysis on carbonization distribution and main controlling factors of organic matter in marine shale in Sichuan Basin and its periphery. Nat. Gas Geosci. 2022, 33, 1672–1926. [Google Scholar]
  43. Kouketsu, Y.; Mizukami, T.; Mori, H.; Endo, S.; Aoya, M.; Hara, H.; Nakamura, D.; Wallis, S. A new approach to develop the Raman carbonaceous material geothermometer for low-grade metamorphism using peak width. Isl. Arc 2014, 23, 33–50. [Google Scholar] [CrossRef]
  44. Wang, Q.; Hou, Y.; Wu, W.; Yu, Z.; Ren, S.; Liu, Q.; Liu, Z. A study on the structure of Yilan oil shale kerogen based on its alkali-oxygen oxidation yields of benzene carboxylic acids, 13 C NMR and XPS. Fuel Process. Technol. 2017, 166, 30–40. [Google Scholar] [CrossRef]
  45. Zhang, S.; Yan, J.; Cai, J.; Zhu, X.; Hu, Q.; Wang, M.; Geng, B.; Zhong, G. Fracture characteristics and logging identification of lacustrine shale in the Jiyang Depression, Bohai Bay Basin, Eastern China. Mar. Petrol. Geol. 2021, 132, 105192. [Google Scholar] [CrossRef]
  46. Wang, S.; Wang, G.; Huang, L.; Song, L.; Zhang, Y.; Li, D.; Huang, Y. Logging evaluation of lamina structure and reservoir quality in shale oil reservoir of Fengcheng Formation in Mahu Sag, China. Mar. Petrol. Geol. 2021, 133, 105299. [Google Scholar] [CrossRef]
  47. Khoshbakht, F.; Azizzadeh, M.; Memarian, H.; Nourozi, G.H.; Moallemi, S.A. Comparison of electrical image log with core in a fractured carbonate reservoir. J. Petrol. Sci. Eng. 2012, 86–87, 289–296. [Google Scholar] [CrossRef]
  48. Chen, J.; Gai, H.; Xiao, Q. Effects of composition and temperature on water sorption in overmature Wufeng-Longmaxi shales. Int. J. Coal Geol. 2021, 234, 103673. [Google Scholar] [CrossRef]
  49. Wang, X. Low-Resistivity Origin and Evaluation of Gas-Bearing Properties of Marine Shale in Southern Sichuan Basin. Master’s Thesis, China University of Petroleum, Beijing, China, 2020. [Google Scholar]
  50. Di, F.; Wang, G. Genetic analysis and identification technology application of Sha3 low resistivity reservoir in Wa 38 block. Pet. Instrum. 2010, 24, 54–61. [Google Scholar]
  51. Hai, M. Study on Reservoirs Characteristics and Controlling Factors of Wufeng- Longmaxi Black Shale in Southern Sichuan Basin. Ph.D. Thesis, Shandong University of Science and Technology, Qingdao, China, 2018. [Google Scholar]
  52. Revil, A.; Leroy, P. Constitutive equations for ionic transport in porous shales. J. Geophys. Res. Solid Earth 2004, 109, B03208. [Google Scholar] [CrossRef]
  53. Woodruff, W.F.; Lewan, M.D.; Revil, A.; Torres-Verdín, C. Complex electrical conductivity changes associated with hydrous pyrolysis maturation of the Woodford Shale. Geophysics 2017, 82, D83–D104. [Google Scholar] [CrossRef]
  54. Zhdanov, M. Generalized effective-medium theory of induced polarization. Geophysics 2008, 73, F197–F211. [Google Scholar] [CrossRef]
  55. Becken, M.; Ritter, O.; Bedrosian, P.A.; Weckmann, U. Correlation between deep fluids, tremor and creep along the central San Andreas fault. Nature 2011, 480, 87–90. [Google Scholar] [CrossRef] [PubMed]
  56. Hoffmann-Rothe, A.; Ritter, O.; Janssen, C. Correlation of electrical conductivity and structural damage at a major strike-slip fault in northern Chile. J. Geophys. Res. Solid Earth 2004, 109, B10. [Google Scholar] [CrossRef]
  57. Ritter, O.; Hoffmann-Rothe, A.; Bedrosian, P.A.; Weckmann, U.; Haak, V.; Bruhn, D.; Burlini, L. Electrical conductivity images of active and fossil fault zones. Geol. Soc. Spec. Publ. 2005, 245, 165–186. [Google Scholar] [CrossRef]
  58. Zeng, L.; Lyu, W.; Li, J.; Zhu, L.; Weng, J.; Yue, F.; Zu, K. Natural fractures and their influence on shale gas enrichment in Sichuan Basin, China. J. Nat. Gas. Sci. Eng. 2016, 30, 1–9. [Google Scholar] [CrossRef]
  59. Kolah-kaj, P.; Kord, S.; Soleymanzadeh, A. The effect of pressure on electrical rock typing, formation resistivity factor, and cementation factor. J. Petrol. Sci. Eng. 2021, 204, 108757. [Google Scholar] [CrossRef]
  60. Wyble, D.O. Effect of applied pressure on the conductivity, porosity and permeability of sandstones. J. Pet. Technol. 1958, 10, 57–59. [Google Scholar] [CrossRef]
  61. Zhou, Z. Enrichment Laws of Shale-Gas in the Wufeng-Longmaxi Formation, Changning Area, Southern Sichuan Basin. Master’s Thesis, Chengdu University of Technology, Chengdu, China, 2020. [Google Scholar]
  62. Reynolds, O.M. An Introduction to Applied and Environmental Geophysics; Wiley-Blackwell: Hoboken, NJ, USA, 2011. [Google Scholar]
  63. Ammar, A.I. Development of numerical model for simulating resistivity and hydroelectric properties of fractured rock aquifers. J. Appl. Geophys. 2021, 189, 104319. [Google Scholar] [CrossRef]
  64. Aghli, G.; Moussavi-Harami, R.; Tokhmechi, B. Integration of sonic and resistivity conventional logs for identification of fracture parameters in the carbonate reservoirs (A case study, Carbonate Asmari Formation, Zagros Basin, SW Iran). J. Petrol. Sci. Eng. 2020, 186, 106728. [Google Scholar] [CrossRef]
  65. Li, Y.; Li, M.; Zhang, J.; Pang, Q.; Zou, C.; Shu, H.; Wang, G. Influence of the Emeishan basalt eruption on shale gas enrichment: A case study of shale from Wufeng-Longmaxi formations in northern Yunnan and Guizhou provinces. Fuel 2020, 282, 118835. [Google Scholar] [CrossRef]
  66. Aarnes, I.; Svensen, H.; Polteau, S.; Planke, S. Contact metamorphic devolatilization of shales in the Karoo Basin, South Africa, and the effects of multiple sill intrusions. Chem. Geol. 2011, 281, 181–194. [Google Scholar] [CrossRef]
  67. Agirrezabala, L.M.; Permanyer, A.; Suárez-Ruiz, I.; Dorronsoro, C. Contact metamorphism of organic-rich mudstones and carbon release around a magmatic sill in the Basque-Cantabrian Basin, western Pyrenees. Org. Geochem. 2014, 69, 26–35. [Google Scholar] [CrossRef]
  68. Xu, Z.; Liang, X.; Lu, H.; Zhang, J.; Shu, H.; Xu, Y.; Wu, J.; Wang, G.; Lu, W.; Tang, X.; et al. Structural deformation characteristics and shale gas preservation conditions in the Zhaotong National Shale Gas Demonstration Area along the southern margin of the Sichuan Basin. Nat. Gas Ind. 2019, 39, 22–31. [Google Scholar] [CrossRef]
Figure 1. Map showing tectonic sub-units of the Southern Sichuan Basin. The green and blue rectangular dotted lines represent the Changning block and Luzhou block, respectively (modified after [22,23]).
Energies 15 05801 g001
Figure 2. Sedimentation sections of eight sampled wells at the Changning block (a) and Luzhou block (b).ER: Electrical resistivity; GR: Gamma ray.
Energies 15 05801 g002
Figure 3. Ternary diagram exhibiting mineral compositions of three low-resistivity shale types in Wufeng-Longmaxi Formation.
Energies 15 05801 g003
Figure 4. The heat map showing petrophysical parameters and mineral components of three low-resistivity shale types in Wufeng-Longmaxi Formation. Rt: electrical resistivity (Ω·m), Q: quartz (%). K-fel: potassium feldspar (%), Pla: plagioclase (%). Cc: Calcite (%), Dol: Dolomite (%), Py: Pyrite (%), TOC: total organic content (%), Por: porosity (%), Sg: gas saturation (%), Gt: total gas content (m3/t). Standard deviations of Rt, Q, K-fel, Pla, Cc, Dol, Py, TOC, Por, Sg, and Gt are 11.18 Ω·m, 11.96%, 1.84%, 4.12%, 7.21%, 6.20%, 2.57%, 1.32%, 1.76%, 85.36%, and 62.07 m3/t, respectively. The resistivity values of 518 shale samples were mainly distributed from 0.1 to 20 Ω·m, and there was only one shale sample whose resistivity was greater than 100 Ω·m.
Energies 15 05801 g004
Figure 5. Distribution of average resistivity and sedimentary microfacies of Wufeng-L114 layer at the Changning block and Luzhou block. (a) Resistivity at the Changning block, (b) sedimentary microfacies at the Changning block, (c) resistivity at the Luzhou block, (d) sedimentary microfacies at the Luzhou block.
Energies 15 05801 g005
Figure 6. Raman spectrum of representative shale samples from the Changing block and the Luzhou block. (a) Sample 4277.11 m, N2 Well, Dh/Gh: 0.78, Ro: 3.71%, electrical resistivity: 1.64 Ω·m. (b) Sample 2327.24 m, N1 Well, Dh/Gh: 0.63, Ro: 3.45%, electrical resistivity: 9.56 Ω·m. (c) Sample 3544.14 m, N4 Well, Dh/Gh: 0.53, Ro: 3.20%, electrical resistivity: 16.08 Ω·m. (d) Sample 3821.89 m, L1 Well, Dh/Gh: 0.53, Ro: 2.94%, electrical resistivity: 17.47 Ω·m. (e) Sample 3766.95 m, L2 Well, Dh/Gh: 0.58, Ro: 2.64%, electrical resistivity: 16.04 Ω·m. (f) Sample 4261.09 m, L3 Well, Dh/Gh: 0.59, Ro: 2.42%, electrical resistivity: 17.51 Ω·m.
Energies 15 05801 g006
Figure 7. Core photographs, thin section photos and SEM images of gravity flow deposits in the Southern Sichuan Basin. (a) Massive shale with wavy siltstone laminae developed in core, 4243.9 m, L4 well, (b) lenticular debris aggregates mixed with dark organic matter, thin section photo, 4243.9 m, L4 well, (c) xenomorphic clastic clays filled in the primary pore, SEM image, 4243.9 m, L4 well, (d) typical eroded cross bedding observed from core, 2320.9 m, N2 well, (e) coarse silt mixed with terrigenous clay scours and erodes underlying argillaceous deposits in thin sections, 2320.9 m, N2 well, (f) disordered flake-like illite in primary pores.
Energies 15 05801 g007
Figure 8. Relations between sedimentary element and electrical resistivity, (a) clay content versus electrical resistivity at the Changning block, (b) illite content versus electrical resistivity at the Changning block, (c) TOC versus electrical resistivity at the Changning block, (d) pyrite content versus electrical resistivity at the Changning block, (e) clay mineral content versus electrical resistivity at the Luzhou block, (f) illite content versus electrical resistivity at the Luzhou block, (g) TOC versus electrical resistivity at the Luzhou block, (h) pyrite content versus electrical resistivity at the Luzhou block.
Energies 15 05801 g008
Figure 9. Plots of structural factors controlling electrical resistivities of shales in the Southern Sichuan Basin, (a) correlation between distance to fault and electrical resistivity at the Changning block, (b) relationship between pressure coefficient and electrical resistivity at the Changning block, (c) correlation between distance to fault and electrical resistivity at the Luzhou block, (d) relationship between pressure coefficient and electrical resistivity at the Luzhou block.
Energies 15 05801 g009
Figure 10. Seismic profiles showing that (a) low-resistivity shales are widely developed at the N5 Well because the L5 well is close to NE-trending faults at the Changning block, (b,c) faults and natural fractures are widely developed at the top of tight anticlines, decreasing the resistivity of the shale reservoir. a–c means the starts of the seismic profiles and a’–c’ means the ends of the seismic profiles. And locations of 3 seismic profiles have been marked in the Figure 1.
Energies 15 05801 g010
Figure 11. FMI images indicating natural fractures resulted small decrease in electrical resistivities, (a) relationship among resistivities, total gas contents and FMI images of well N6, (b) relationship among resistivities, total gas contents and FMI images of well L4.
Energies 15 05801 g011
Figure 12. Relationship between resistivity and Ro/basalt thickness in the southern Sichuan Basin. (a) Basalt thickness and well locations in Sichuan Basin (blue spots are wells at the Luzhou block and yellow spots are wells at the Changning block. (b) Relationship between resistivity and Ro/basalt thickness at the Luzhou block and Changning block.
Energies 15 05801 g012
Figure 13. Relationship among reservoir parameters of three low-resistivity shale types (a) and the distribution of three types of low-resistivity shale at the Changning block and Luzhou block (b).
Energies 15 05801 g013
Publisher’s Note: MDPI stays neutral with regard to jurisdictional claims in published maps and institutional affiliations.

