
Models of Electricity Price Forecasting: Bibliometric Research


1
Department of Process Management, Faculty of Business Management, Wroclaw University of Economics and Business, ul. Komandorska 118/120, 53-345 Wroclaw, Poland
2
Department of Advanced Research in Management, Faculty of Business Management, Wroclaw University of Economics and Business, ul. Komandorska 118/120, 53-345 Wroclaw, Poland
*
Authors to whom correspondence should be addressed.
Energies 2022, 15(15), 5642; https://doi.org/10.3390/en15155642
Submission received: 19 July 2022
/
Revised: 29 July 2022
/
Accepted: 1 August 2022
/
Published: 3 August 2022
(This article belongs to the Special Issue Global Challenges in Energy Markets: Economics, Technology, and Policy)
Abstract
:Electricity Price Forecasting (EPF) influences the sale conditions in the energy sector. Proper models of electricity price prognosis can be decisive for choice between energy sources as a start point of transformation toward renewable energy sources. This article aims to present and compare various EPF models scientific publications. Adopted in this study procedure, the EPF publications models are compared into two main categories: the most popular and the most accurate. The adopted method is a bibliometric study as a variation of Systematic Literature Review (SLR) with specified automated queries supported by the VOSviewer bibliometric maps exploration. The subject of this research is the exploration of EPF models in two databases, Web of Science and Scopus, and their content comparison. As a result, the SLR research queries were classified into two groups, the most cited and most accurate models. Queries characteristics were explained, along with the graphical presentation of the results. Future promising research avenues can be dedicated to the most accurate EPF model formulation proved by statistical testing of its significance and accuracy.
1. Introduction
The energy sector is the core of each country’s economy and influences all other economic sectors [1,2]. This sector impacts economic growth [3,4] and development [5,6]. In the energy sector, there is an ongoing transition from fossil fuels to renewable or nuclear energy [7,8]. The transformation processes have been challenging the “traditionally monopolistic and government-controlled power sectors” [9]. This change also influences energy prices [10,11] and Electricity Price Forecasting (EPF) procedures [9,12] and models [13,14]. On the other hand, the mathematical models that predict what electricity prices will be in the future are important not only for the electricity produces [15,16] but also for their clients [17,18]. Electrical energy producers are involved in domestic economies because energy sources affect the prices of energy goods and services [19,20].
The EPF in the energy sector influences energy companies’ stocks [8] and their business management [21,22] and strategic decisions [19,23], because electricity is also traded under market rules [15,21]. The energy sector companies generate, transfer, distribute, and retail electricity [19]. The conditions under which they operate can be described as a dynamic equilibrium between supply and demand [24] due to the changes caused by the weather and business activity [25]. On the other hand, electricity is a very special commodity, because it is “economically non-storable, and power system stability requires a constant balance between production and consumption” [9]. Electricity price is hard to forecast because of the unanticipated price dynamics [26,27] and specific characteristics of the market [28,29]. The development of the methods represented in citation dynamics, or the number of newly published papers, indicates the importance of the subject and is the reason for this research.
In the literature related to the EPF, the forecasting models are based on the specific statistical methods chosen for the energy sector [30]. The choice of the EPF model and its results can support the decision-making process in day-ahead trading, the transition towards new preferred business technologies [22], renewable energy sources [31,32], electromobility [33,34], and regional investment directions [35]. Although the forecasting methods are numerous, they have encouraged researchers to intensify their studies to develop more accurate forecasting techniques [36]. Finally, there is a research gap related to the comprehensive comparison of the EPF models’ bibliometric relations, their development, and their accuracy [37]. There is also a growing importance of transforming the economy [38,39] and economic growth model into one “that includes the environmental as well as the social dimension and establishing a relationship between the environment and development” [40]. Such a change is possible only if the EPF models are classified or their risks are recognized and assessed [41]. The accuracy of the EPF influences the volume of the generated electricity [42,43] and reduces the operational risk in business [44,45]. Therefore, the subject of EPF is important because the choice of the model has fundamental input on energy companies’ strategic decision-making [3,46].
The aim of this article is to present and compare various EPF models in two categories: the most popular (often cited), and the most accurate procedures. The models presented in this scientific paper literature review of EPF models cover identified research gaps in the indicated categories. This research is an attempt to determine which EPF approaches are the most popular and accurate procedures [9]. The adopted method in this research is a bibliometric study as a variation of Systematic Literature Review (SLR) [47,48] based on the databases’ research queries [49,50] and developed in bibliometric maps with the use of the VOSviewer program (version 1.6.18) [51]. The method used in this research is to perform bibliometric analysis to produce a network visualization of keyword maps for the queries [52,53].
This paper is based on the structure of the obtained data from two original queries, and the database’s scope and results. The queries used in this research allowed this study to explore Scopus and Web of Science databases. This study provides data analysis by utilizing mapping tools and providing analysis of the research gap [22]. Then, the scientific contribution of this paper is to demonstrate the bibliometric data analysis related to the identified EPF two groups’ procedures. Therefore, this paper presents and compares various EPF model-related publications into two groups: the most popular and the most accurate [54,55].
The paper is organized in a classical arrangement and has an IMRaD structure. After already being presented in this section introduction, the method section is explained in detail. The detailed method explanation in this article is accompanied further by the obtained calculations and presentation of results. Based on the proposed methods, the results of the Systematic Literature Review (SLR) are analyzed, presented, and discussed. Then, conclusions are presented, along with the theoretical and managerial implications, in the last part of this article. The possible research avenues are also addressed.
2. Method
The subjects of the research were scientific publications collected in bibliographic databases WoS and Scopus. These scientific databases are multidisciplinary [56]. A bibliographic database is an organized digital collection of references to published scientific literature, including journal articles, conference proceedings, patents, books, etc. Scientific databases generally contain very rich subject descriptions in the form of keywords, subject classification terms, or abstracts [56]. Information related to a bibliographic record is called bibliographic metadata, and this can be explored with visualization tools. The method adopted in this paper is a bibliometric study variation of SLR [57] to explore EPF models related to publications based on the queries in scientific databases. The SLR has its own procedure, which is not presented in detail in this paper [58]. There is also a classical review method dedicated to the selected papers’ overall presentation. The papers were distinguished in the SLR and VOSviewer (version 1.6.18) analyses [59]. In the variation of the SLR method, the two original queries were formulated by authors based on the keywords to create a comprehensive and similar query syntax for each explored database. The use of similar keywords may have influenced the results of the study when two databases are compared. The keyword “business management” in the Web of Science query was added automatically by search filters. Next, keyword “business management” in the Web of Science was emphasized directly in the syntax of Query 2. Scopus query has a similar keyword “limit-to (SUBJAREA, “BUSI”)” and it was created from the refined results sidebar after the query was executed to achieve similarity of queries. The inspiration for the two queries was the publication of R. Weron [9], which is based on a similar bibliometric approach [60]. Therefore, in this paper, the main method is supported by the bibliometric analysis performed in VOSviewer for the Web of Science (WoS) and Scopus databases. The choice of these two databases has its limitations, most notably the fact that some of the newer journals are not indexed in these systems. There is no fixed classification in research in terms of the EPF technique details or in terms of the planning time horizon duration in the researched EPF models. The adopted approach in performed SLR is an explorative one. For the Scopus search, original Query 1 was constructed as follows:
(TITLE-ABS-KEY (((forecasting) AND (electricity AND spot OR electricity AND day-ahead OR electricity AND price)) OR ((price AND forecasting OR price AND prediction OR forecasting AND price OR predicting AND price OR forecasting AND spikes) AND (electricity AND spot AND price OR electricity AND price OR electricity AND market OR day-ahead AND market OR power AND market OR sales OR energy AND sectors)))) AND (limit-to (srctype, “j”) OR limit-to (srctype, “p”)) AND (limit-to (doctype, “ar”) OR limit-to (doctype, “cp”)) AND (limit-to (subjarea, “COMP”) OR limit-to (subjarea, “ECON”) OR limit-to (SUBJAREA, “BUSI”) OR limit-to (subjarea, “SOCI”)) AND (limit-to (pubyear, 2021) OR limit-to (pubyear, 2020) OR limit-to (pubyear, 2019) OR limit-to (pubyear, 2018) OR limit-to (pubyear, 2017) OR limit-to (pubyear, 2016) OR limit-to (pubyear, 2015) OR limit-to (pubyear, 2014)) AND (limit-to (Language, “English”))
The original standard Query 2 for the Web of Science exploration was formulated as:
TS = (((“forecasting”) AND (“electricity spot” OR “electricity day-ahead” OR “electricity prices” OR “sales”)) OR ((“price forecasting” OR “price prediction” OR “forecasting” “price” OR “predicting price” OR “forecasting spikes”) AND (“electricity spot price” OR “electricity price” OR “electricity market” OR “day-ahead market” OR “power market” OR “energy sectors”)) AND (“business management”))
There are differences in the formulated queries. The queries have a syntax that corresponds with the database on which they are used. Moreover, queries differ in the explicit year, publication type, and category filters in the query. The WoS search panel allows filtering by refining results, which do not differ from examined queries. The Query 2 limitations are chosen from the left panel of the WoS and are equivalent to the Query 1 filters. To determine which models are accurate, the word “accurate” was added to the end of the query for the studied databases. This modification was the basis for the new queries dedicated to the exploration of the most accurate EPF models in the Scopus and WoS databases. Double underlined “AND” in Queries 1 and 2 indicates the position where the keyword was added (before filtering to year, publication, and category). For Query 1, according to the syntax, the following was added after double underlined the “AND” element of syntax: (accurate and precise), so this part of Query 1 has the form: AND (accurate OR precise). In the case of WoS exploration with Query 2, the “accurate” or “precise” search phrases were set after “forecasting” but before the underlined “AND” because only there yielded satisfactory results. After the modifications, Query 1 output yielded 198 document results and Query 2 hit 85 document results, respectively. The most cited scientific publications were visible in both databases when the filter “most cited” was applied to the results of Queries 1 and 2, respectively. The results of this procedure are gathered in Supplementary Materials File S1. Due to the ongoing research in the discipline, the newest publications were not distinguished from each database with the use of original Queries 1 and 2, respectively. The newest publications can be selected with the use of the publication date filter in Scopus and WoS on the basis proposed in this study for the two queries. However, heat maps or overlay visualizations as bibliometric maps in VOSviewer were also generated to illustrate the direction and development of scientific publications about the most cited and accurate EPF models.
To extend the SLR method, the VOSviewer program was used. The results obtained from Queries 1 and 2 from the studied time intervals were downloaded each time a set of files, for the Scopus database in .csv format, and WoS, a .txt file, and during export, all fields on the publication were marked. For Scopus, the following fields were selected for export: citation information, bibliographic information, abstract, keywords, funding details, and other information. On the other hand, in the WoS database, the following fields were marked for export: author, title, source, abstract, keyword, addresses, cited references, use of funding, and others. Further analyses were carried out on the most recent data. The exported data were used for analyses in VOSviewer, and the results are shown in bibliometric maps. The choice of the number of keywords co-occurrences determines the result obtained in its graphical presentation and bibliometric map clarity, as suggested by L. Waltman and N. Van Eyck [59]. Therefore, a minimum number of 5 keywords co-occurrences was set for each bibliometric map, if not indicated by another number of co-occurrences for a specific map. Additionally, there is a comparison between bibliometric analysis results performed at different time points. This procedure aims to present the dynamics of the scientific interest in the EPF, also visible in bibliometric maps revealing the subject trends. The VOSviewer allows researchers to define the research gaps covered by published papers and indicate the directions of scientific development. The exploration of the scientific databases leads to the comparison of two categories of the queries results. First were highly cited papers (hoping that they are ‘the influential ones’) and therefore cover the most popular models listed in Supplementary Materials File S1. Second, the most accurate procedures are listed in Supplementary Materials File S2 and presented in the article text. The newest EPF models are rarely cited, but they are opening new and promising research avenues.
3. Results
This section is divided into two subsections that reflect the two method approaches. The first subsection contains a bibliometric analysis of the popularity of EPF-related publications and those that are claimed to be the most accurate or precise [9]. This approach is gaining popularity in bibliometric analysis with the use of queries and VOSviewer software [61]. The second subsection consists of an overview of the selected scientific publications identified as the most cited and accurate EPF models in the first subsection [62].
3.1. Bibliometric Analysis Results
Queries 1 and 2 were used for studying each database at different time points. The number of the obtained results of each query is presented in Table 1. The observed changes indicate the huge dynamics in the topic of EPF and its popularity. There are existing research gaps covered by researchers in multiple papers within seven months.
Although the WoS has fewer records representing the indexed scientific publications than Scopus (Table 1), the syntaxes of formulated Queries 1 and 2 differ. The results do differ quantitatively, as the collections of publications indexed by WoS and Scopus are not the same, but they do not differ qualitatively. However, the Scopus search engine is more user-friendly and allows for more refined queries. The results presented in the Supplementary Materials File S1 section prove that among the ten most cited papers indexed in WoS, some go beyond the energy or EPF models. There are some of the most cited papers related to the fashion, food, and movie industries. Due to this observation, these papers were excluded from further research with the VOSviewer program. However, from Scopus analysis, the most popular model (Table S1 in Supplementary Materials File S1) for EPF is “A moving-average filter-based hybrid ARIMA-ANN model for forecasting time series” [63]. On the other hand, in the same Query 1 results, there is the highest growth (111%) of citations related to the paper titled “Energy markets volatility modeling using GARCH“ [64]. In the WoS, the most popular is the paper “An empirical comparison of alternative schemes for combining electricity spot price forecasts” [65], as proved by Query 2 (Table S2 in Supplementary Materials File S1).
The number of publications aggregated by year in the WoS and Scopus databases is displayed in Figure 1. A primary database, Queries 1 and 2, was used to generate tabular results, and the graph was created using a Python tool. Figure 1 presents the results of Queries 1 and 2 in the period 2014–2021. The year 2022 is not presented in Figure 1. The WoS contains a lower number of scientific publications than Scopus, but on this basis, it is not clear if it contains the same documents. Contrary to other publications, there is no certainty that the WoS is a sub-collection of Scopus (differences in results collected in Supplementary Materials File S1). Figure 1 shows numbers for scientific books, book chapters, journal articles, and conference papers.
Figure 2 and Figure 3 show a bibliometric map of co-occurrences of keywords related to EPF forecasting models in the energy sector. A file was selected in the VOSviewer program, which was prepared from the queries performed on the Scopus and WoS databases. A 5 minimum number of keywords co-occurrences was set for each bibliometric map (Figures 2–4 and 6 except for Figures 5 and Figure 7). In the final dialogue box in the VOSviewer program, the keywords selected that are related to forecasting models and keywords duplicates were removed.
Although the EPF subject was explored by Query 1 in Scopus and Query 2 in Wos, the keyword “electricity price forecasting” is not present in Figure 2 and Figure 3. The keywords which were selected and used by the VOSviewer program are gathered in Table 2. Keywords are separated by semicolons. In Table 2 there are clusters identified by colors, as in Figure 2. Despite the original writing form (for example ARIMA or GARCH models), the keywords in Table 2 are written in small letters as in the VOSviewer program. The order of clusters presented in Table 2 is caused by the number of keywords identified by the VOSviewer.
The identified clusters are related to the different areas of the scientific interest of the analyzed scientific publications’ authors. First is the red cluster, related to the mathematical aspects of EPF models. The second cluster is marked in green and is related to deep learning, and this is additionally represented in Table 2. In Figure 2, there is also a third cluster with seven keywords, and this cluster is related to the classical statistical models. The fourth cluster (yellow color) consists of keywords combined with analyses of data used for EPF model formulation. The final identified by the VOSviewer cluster revolves around machine learning with two similar keywords.
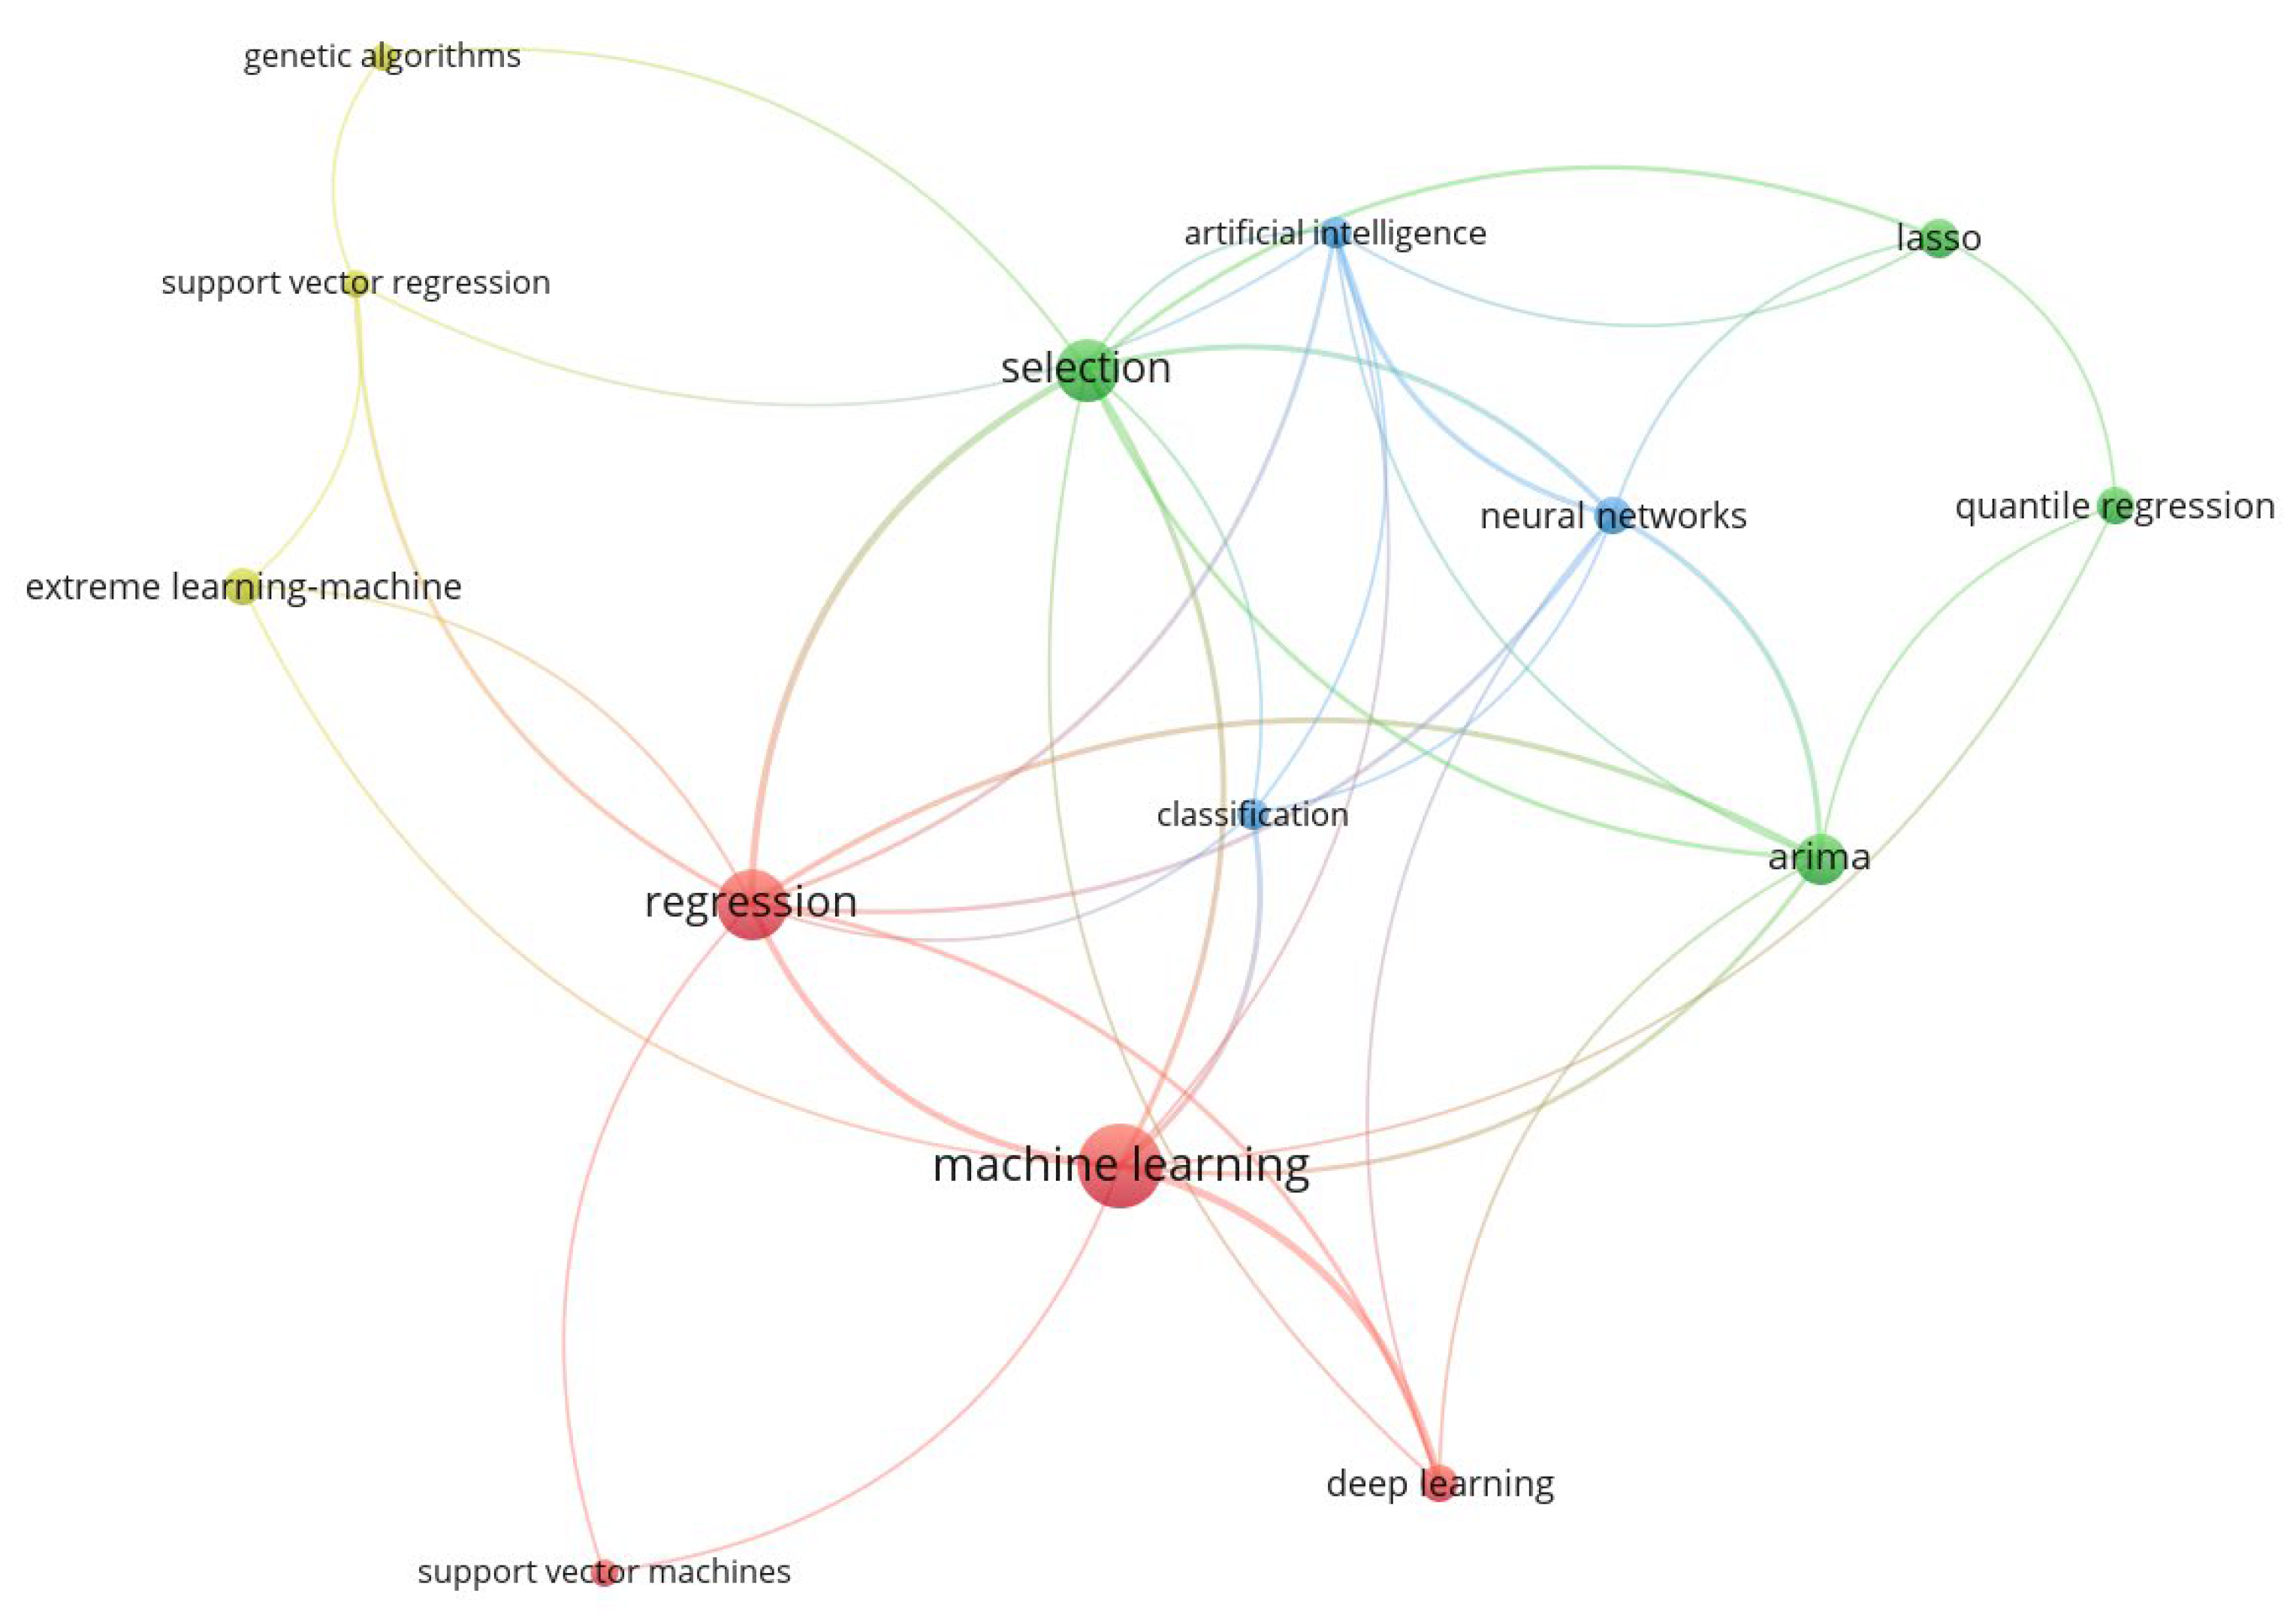
Figure 3 presents the graphical results of Query 2 used for the WoS exploration. In Figure 3, the minimum 5 co-occurrences of keywords are represented as nodes in the network. The edges of the network represent the explored co-occurrences between keywords in data obtained from WoS [66]. The keywords used in the WoS Query 2 were collected in Table 3 and are separated by semicolons. The keywords are written in small letters in Table 3, despite their original writing due to the VOSviewer procedures.
In Table 3 there are 4 clusters automatically identified and ordered by the VOSviewer program. The first cluster is marked in color red in Figure 3 and consists of co-occurring keywords related to machine learning models of EPF. The second cluster keywords revolve around procedures and models related to the EPF. Another group of scientific publications gathered in the third blue cluster crate paper dedicated to artificial intelligence. The last cluster, colored in yellow in Figure 3, consists of a mix of EPF procedures.
Figure 2 (results from Query 1) and Figure 3 (results from Query 2) bibliometric maps represent the number proportions presented in Table 1 and Figure 1. There is a significantly lower number of the bibliometric map nodes in Figure 3, which represent keywords identified by VOSviewer algorithms. There are, however, the common points of both bibliometric maps visible in yellow keywords (Figure 2 and Figure 3) related to EPF models: LSTM, deep learning, and regression models.
After the identification of the most popular EPF method in scientific works and their areas in two researched databases, the used original queries were modified to find the most accurate EPF models. Although the EPF models and procedures were explored by Query 1 in Scopus and Query 2 in Wos, the keyword “electricity price forecasting” is not present in Figure 4 and Figure 5. There are co-occurring keywords, along with the EPF’s most accurate models.
Figure 4 presents the graphical results of data gathered with Query 1 in the Scopus database exploration. In Figure 4, the minimum 5 co-occurrences of keywords are represented as nodes in the network. The edges of the network represent the explored co-occurrences between keywords in data obtained from WoS. Their connection represents the common areas represented by the repetition of some keywords in clusters distinguished automatically by the VOSviewer program. The keywords extracted from Scopus by modified Query 1 were collected in Table 4. The keywords are written again in small letters, despite their original writing.
In Table 4 there are 5 clusters identified and ordered automatically by the VOSviewer [67]. The first cluster is marked in color red in Figure 4 and consists of co-occurring keywords related to neural networks and their modifications related to models of EPF [16,68]. Second cluster keywords revolve around procedures and models related to the EPF such as clustering and decision tree models. Another group of scientific publications gathered in the third blue cluster is dedicated to deep learning. The fourth cluster, colored in yellow in Figure 4, consists of hybrid EPF model procedures. The last cluster in Table 4 consists of the keywords “machine learning” and “extreme learning machines”, which are used to calculate the most accurate EPF models.
Figure 5 presents the bibliometric map of keyword co-occurrences with a minimum number of thresholds equaling 1. During the creation of a bibliometric map, the same methodology as in the Figures described earlier was applied. The uniqueness of this map comes from the vast number of clusters and their combinations. Two clusters (green, yellow, and red) were observed to be interconnected. The remaining clusters are connected by a minimum of 2 keywords between them or are so far apart that the keywords do not strictly form clusters, as there is one keyword in the cluster defined by the VOSviewer software. Therefore, only the interconnected three nodes are further described in Table 5.
In Table 5 there are presented only interconnected clusters from Figure 5. The rest of the clusters are nodes with no connections. The designed minimum cluster size was established for 2 keywords. Only red and green clusters aggregate more than 2 keywords (Table 5). The most accurate EPF models identified in the WoS database are gathered in the red cluster and are connected with the following keywords: machine learning; xgboost; sarima; ga-bp algorithm. The second cluster, colored green, consists of hybrid EPF models. The third yellow cluster is similar to the results gathered in Table 4, and cluster 2 is related to the decision trees and classification procedures.
Keywords identified in bibliometric procedures with the use of original and modified Queries 1 and 2 are collected in Table 6. Common keywords are present in different numbered and colored clusters when the results of original queries are compared. The hybrid models are a narrow group of methods and are a subset of machine learning. These keywords are distributed without any pattern between Table 2 and Table 3. In modified query results, the whole colored and numbered clusters are exchanged between Table 4 and Table 5. For example, the yellow 4th cluster from Table 4 and part of the 2nd green cluster in Table 5.
There are more differences between Table 4 and Table 5. Therefore, there is a small number of common keywords in Table 6. Another reason for the observed differences between Table 4 and Table 5 is the different thresholds of a minimum number of co-occurring keywords, 5 and 1 keyword respectively. This indicates that the Scopus database contains more details than WoS in areas related to the EPF models [68,69]. That was proved by the disconnected points in the bibliometric map in Figure 5 instead of the network in Figure 4 (Scopus’ results).
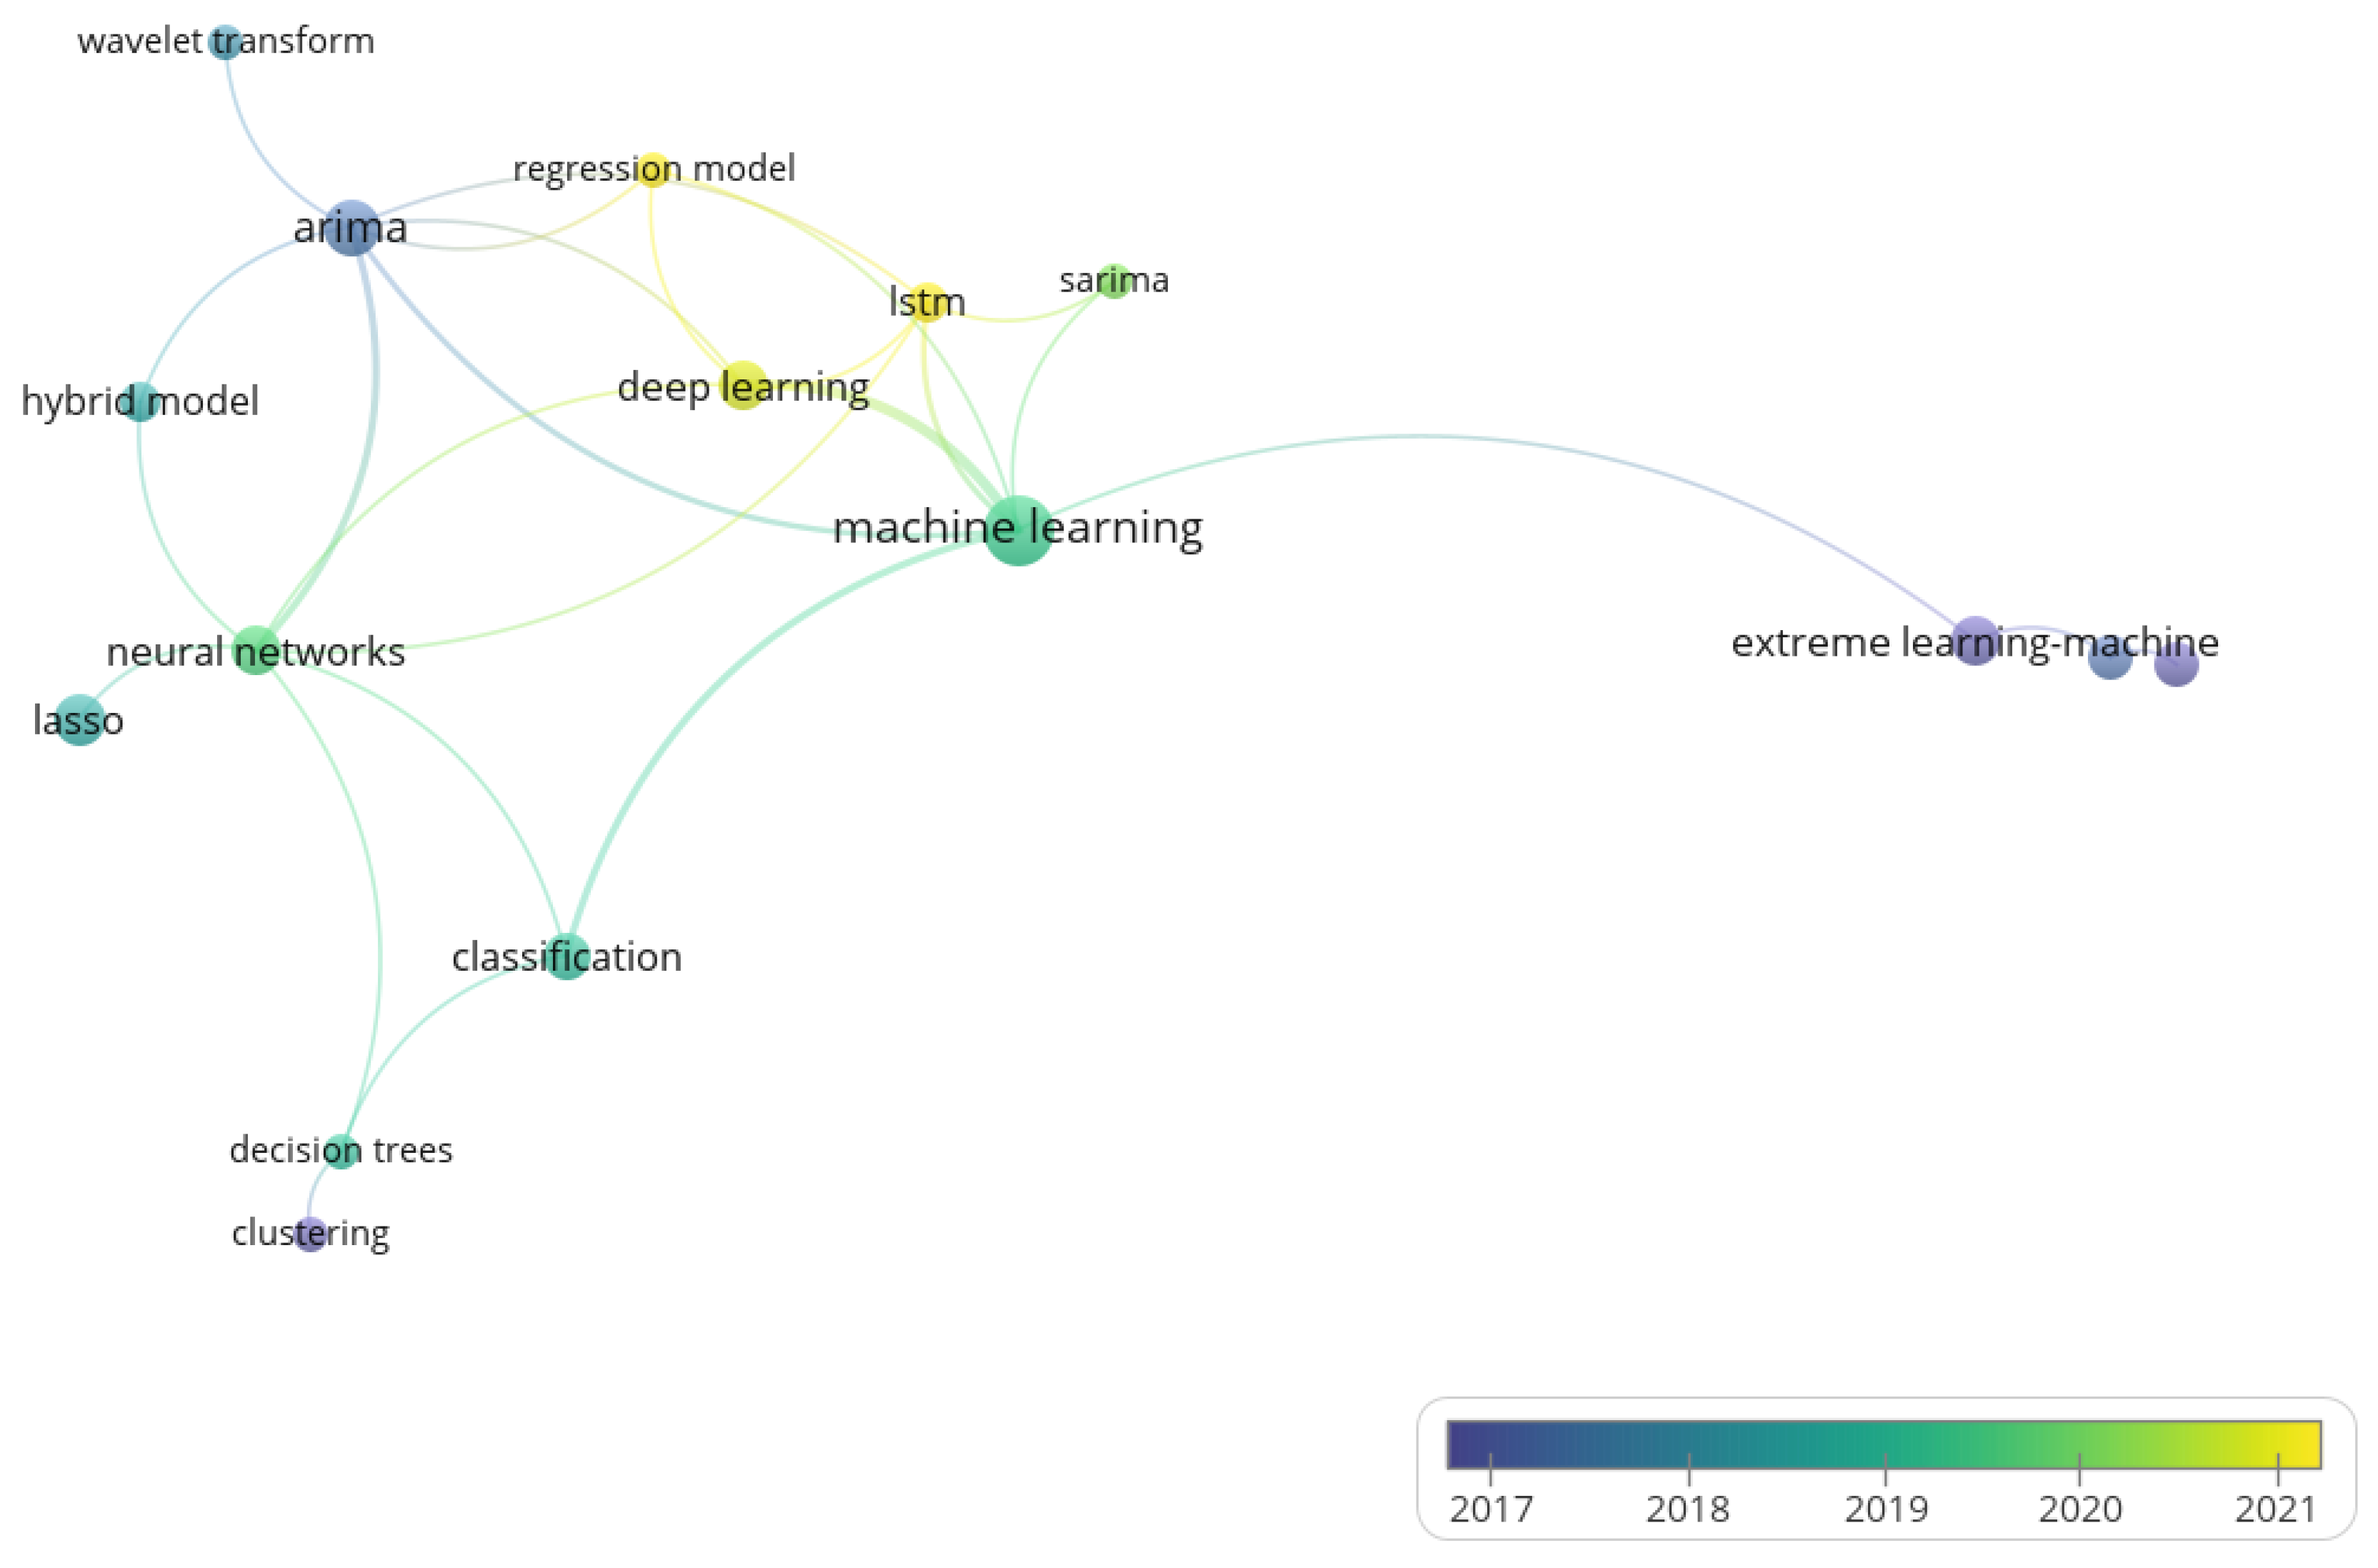
The trend of EPF models is presented in Figure 6 and Figure 7. The overlay visualization map indicates which methods have been developed over time and which are still in use. The years are represented by various color ranges. In blue, green, and yellow, the topics studied over the studied years of 2014–2021 are depicted. Darker colors are used to mark the older publications, while light colors represent the newest publications.
In Figure 6, there is a clear shift from fundamental or classical statistical EPF methods (purple and dark blue) to decision trees and their derivatives (green and light green) to keywords associated with the most recent (yellow) EPF models: LSTM, deep learning [70], and convolutional neural networks. Additionally, there are strong relations between neural networks and machine learning, which are presented as a wider edge between these two nodes in Figure 6, also visible in dynamic analysis in the VOSviewer software. Trend analysis does not provide information about groups or categories of methods to calculate EPF models as shown in Figure 2, Figure 3, Figure 4 and Figure 5. However, it is possible to name 3 main groups in Figure 6 and Figure 7, due to the years and colors: blue (2016–2017), green (2018–2019), and yellow (2020–2021).
In Figure 7, there is movement in the interest of authors from ARIMA to LSTM. This change is visible in Figure 7: differences between the oldest blue and the newest yellow keyword in the presented time. There is a distinguished group of keywords on the far-right side of Figure 7, and those are extreme machine learning, support vector regression, and genetic algorithms. Those keywords represent the oldest directions of scientific publications dedicated to EPF models. There are also combined methods of EPF in the upper-left corner of Figure 7. Classification and clustering methods are represented on the lower-left side of the same bibliometric map.
The trend of EPF models presented in Figure 6 and Figure 7 indicates that there are classical and new methods of EPF model formulation. An interesting observation is that hybrid models for EPF are intermediaries in both databases. The trend in publications goes towards machine learning in both explored databases. Both figures present different numbers of nodes (keywords) and edges (relations, co-occurrences) as results of standard Queries 1 and 2 for Scopus and WoS, respectively. The common elements for both Figures are the newest EPF models: ARIMA, LSTM, deep learning models (Scopus), and regression models (WoS). There are also visible differences between Figure 6 and Figure 7. Scopus analysis shows in Figure 6 that the dominant node of the bibliometric map is made by EPF models based on neural networks. As a result of the WoS analysis, the machine learning as EPF model is visible as the network’s largest node (Figure 7).
3.2. Overview of the Most Cited and Most Accurate Publications of EPF Models
The result of the use of Query 1 in the Scopus database is the most cited scientific article, which describes a hybrid model between linear and nonlinear time series forecasting models proposed by Babu and Reddy [21]. This paper explores the linear autoregressive Integrated Moving Average (ARIMA) [71] and nonlinear Artificial Neural Network (ANN) models to develop a new hybrid ARIMA–ANN model for the prediction of time series data [72]. ARIMA models assume that current data is a linear function of previous data points and past errors before fitting a linear equation to the data. Moreover, ARIMA requires that the data be made stationary. In the related works [72,73] in the hybrid methods, the input data were collected as the sum of linear and nonlinear components. The given data, however, is not divided into linear and nonlinear components; instead, a linear ARIMA model is fitted directly to the data, and the resulting error sequence is applied to the nonlinear component. Therefore, the linear aspect of the ARIMA model is used in both these hybrid models [63].
The most cited paper from Query 2 in WoS is “An empirical comparison of alternative schemes for combining electricity spot price forecasts” [65]. The main findings of this article indicate the added value of combining the projections of separate methods to derive more accurate forecasts. Nevertheless, the performance is not uniform across the markets and periods investigated. Specifically, equally weighted pooling of forecasts emerges as a simple yet effective strategy when compared to alternative systems that rely on estimated combination weights, but only when no predictor regularly outperforms its competition. Constrained least squares regression (CLS) [12] provides a balance between robustness against such well-performing individual approaches and relatively accurate forecasts, which are, on average, more accurate than those derived from the individual predictors. Some well-known forecast averaging strategies, such as ordinary least squares regression (OLS) and Bayesian Model Averaging (BMA), are inappropriate for forecasting day-ahead electricity prices.
The most cited publication from modified Query 1 was “The price prediction for the energy market based on a new method” [74]. The described article is a common part of Query 1 (no. 6 article in Supplementary Materials File S1 Table S1). In the article under review, a feature selection based on mutual information is implemented for day-ahead prediction of energy prices, which is essential for establishing the redundancy and relevance of selected features [74]. Based on a neural network, a combination of wavelet transforms and a hybrid EPF method is presented.
From modified Query 2, the article titled “A novel ensemble deep learning model with dynamic error correction and multi-objective ensemble pruning for time series forecasting” was distinguished [75] and the accurate method was elaborated. Due to high variances and low biases, standalone deep learning methods are not sufficient. In the novel forecasting model, ensemble methods are being used. The main difference between standard learning models is using fewer methods for both statistical and deep learning models. The result of that combination is better robustness in dynamic environments and improving generalization effectiveness. This article with the most cited article in WoS contributed a new framework for time series forecasting [75].
The proposed EPF models require more computation time, memory, and resources during the construction and combination stages of the basic predictors, according to the available literature. To further enhance the computational efficiency and scalability of the model, it is necessary to investigate more efficient construction and ensemble methods for basic predictors [75]. Another study concludes that the proposed hybrid method is over a hundred times more efficient than the bootstrap neural network (BNN) method [76].
4. Discussion and Conclusions
EPF models are important both for energy consumers [77] and producers [34,78]. Therefore, EPF models are an important scientific subject of many publications indexed both in Scopus and WoS. The topic of EPF has saturated the research community in recent years, although the number of citations is still increasing [9,62]. Both theoretical and empirical research provides a vast number and variety of EPF models [79], which results in different organizational performances among energy producers and their strategic decisions [11,80,81]. The bibliometric analyses of the EPF is a rare subject in the literature due to the complexity and number of scientific publications, and this paper covers this research gap.
In this paper, two databases, Scopus and WoS, were explored with the SLR method using Queries 1 and 2. The queries were modified to explore the designed two groups of scientific publications in each database. In this method, the most popular (cited), accurate publications dedicated to the EPF procedures and models were identified. The queries used in the SLR were then extended by the VOSviewer program results. The obtained results of database analyses proved that there was a difference in the query selectivity, although the syntax of the Queries was the same.
There are two groups of EPF models scientific publications. The first group consists of the most popular and most cited papers identified by the original queries. The second group is the most precise or accurate EPF models recognized by modified queries. The second group results were compared between studied databases (Figure 4 and Figure 5) and confirmed by the trend analysis in the presented bibliometric maps (Figure 6 and Figure 7). The wide scope of the WoS database is visible in the obtained results of the SLR query and bibliometric maps representing its assets. The WoS explored with Query 2 unfortunately found that EPF models-related papers cover the movie industry, food industry, and fashion, so those publications have to be excluded from the analysis. On the other hand, publications indexed in WoS are less cited than in Scopus. One of the possible reasons for this difference is the impact of the Mendeley reference manager usage among authors, which is associated with the Scopus database and allows authors to find references related to the EPF models. On the other hand, the WoS is combined with the EndNote reference manager.
Contrary to the other bibliometric analysis publications [9,82], this study does not prove that WoS is a subset of Scopus [9], therefore it is not possible to limit literature review analysis to WoS only [83]. The comparison of citation data in both multidisciplinary databases performed by L. Waltman proved the similarities between both database collections [84]. Additionally presented in this article are numerical and graphical results related to the EPF models that prove there are differences between explored databases, which stand following the results of bibliometric analyses performed by M. Aria and C. Cuccurullo [56,85].
In this paper, Wos and Scopus databases were explored, and those have some significant limitations. These databases require a standard academic subscription, which can be a source of limitations for those who would like to replicate this study. Next to accessibility is the structure of the data available to be exported from databases [86]. WoS is preferable to Scopus in terms of data quality. In Scopus, cited reference items are not standardized, therefore they need to be matched. In WoS, plain text format is preferable to BibTeX in terms of the completeness of the information used in further analyses [85].
There is a limitation of the used methods of SLR related directly to the formulation queries. In the queries, the limitations were primarily caused by explored years 2014–2021. Regarding the queries, a large number of synonyms, and a variety of spellings for certain EPF models or procedures, was the limitation in the queries’ syntax and the results presented by the VOSviewer software. Another limitation of the study is that only the frequency and popularity of particular keywords in scientific publications are presented without the positive or negative meaning. The repeated keywords denoted the primary limitation of bibliometric maps. It is caused mainly by a lack of consensus among researchers, and for instance, there is a keyword defining neural networks that has multiple permutations, including neural networks, neural networks, artificial neural networks, ann, and many other variations. Additionally, the VOSviewer program recognizes or reverts the capital letters of abbreviations to small letters. In this paper, this specific limitation required revising each keyword and removing the keyword duplicates.
The scientific contribution of this paper is the presentation of the existing research in published scientific papers and the proposition of the classification of the EPF models related to scientific publications. Another scientific contribution is the visualization of bibliometric maps of the researched EPF. This research article aimed to present and compare various EPF model publications in two categories: most popular (cited) and accurate procedures. Another scientific contribution is a detailed description of procedures that assure the reproducibility of the paper by the other authors. The novelty of this is based on the usage of combined methods of bibliometric method variation of SLR and bibliometric maps analysis. The visualizations present the relationships between EPF model formulation and performed classification research among scientific publications. Bibliometric maps prove the trends in science and inform other authors about the general progress or research gaps in the explored field of science [87]. The presented complex literature research revealed that linear models of EPF do not accurately capture the asymmetric relationship between energy consumption and energy pricing. There are numerous instances in which predictive methods are specified. The limitation may not be exceptional in this field. In a future study, it is proposed to combine similar keywords.
Researched EPF models, forecasting energy, and energy carriers can be used for considering future financial plans and energy infrastructure development. On the other hand, short-term energy forecasting aims to increase energy schedule efficiency and is another possible future research avenue.
Supplementary Materials
The detailed results from original Queries 1 and 2 for Scopus and WoS databases are presented in File S1, Available online: https://uewrc-my.sharepoint.com/:b:/g/personal/adam_sulich_ue_wroc_pl/ESJek-TqE2xFsxHDuvxfk2kBIQuXdxoDH-aQ1L34VIWCCA?e=VaN483. The detailed results from modified Queries 1 and 2 for Scopus and WoS databases are presented in File S2, Available online: https://uewrc-my.sharepoint.com/:b:/g/personal/adam_sulich_ue_wroc_pl/EevxM_ehN59JhD00dQb1OnwB0yBNJzMlXo47gUli6LOGNA?e=sfl5hr.
Author Contributions
Conceptualization, A.S. and T.Z.; methodology, A.S. and T.Z.; software, A.S. and T.Z.; validation, A.S. and T.Z.; formal analysis, A.S. and T.Z.; investigation, A.S. and T.Z.; resources, A.S. and T.Z.; data curation, A.S. and T.Z.; writing—original draft preparation, A.S. and T.Z.; writing—review and editing, A.S. and T.Z.; visualization, A.S. and T.Z.; supervision, A.S. and T.Z.; project administration, A.S. and T.Z.; funding acquisition, A.S. and T.Z. All authors have read and agreed to the published version of the manuscript.
Funding
(A.S.) The project is financed by the National Science Centre in Poland under the program “Business Ecosystem of the Environmental Goods and Services Sector in Poland”, implemented in 2020–2022; project number 2019/33/N/HS4/02957; total funding amount PLN 120,900.00. (A.S. and T.Z.) The project is financed by the Ministry of Science and Higher Education in Poland under the program “Regional Initiative of Excellence” 2019–2022; project number 015/RID/2018/19; total funding amount PLN 10,721,040.00. (T.Z) This project is financed by the Faculty of Management, Wroclaw University of Business and Economics Internal Research Grant number WGB 20/2021 total funding amount PLN 15,000.00.
Institutional Review Board Statement
Not applicable.
Informed Consent Statement
Not applicable.
Data Availability Statement
Not applicable.
Acknowledgments
The authors would like to thank Kinga Zmigrodzka-Ryszczyk and Agnieszka Dramińska (Wroclaw University of Economics and Business) for the Orbis database exploration, bibliometric workshops, and secondary data acquisition.
Conflicts of Interest
The authors declare no conflict of interest.
References
- Mazzucato, M. Financing the Green New Deal. Nat. Sustain. 2022, 5, 93–94. [Google Scholar] [CrossRef]
- Kozar, Ł. Energy Sector and the Challenges of Sustainable Development Analysis of Spatial Differentiation of the Situation in the EU Based on Selected Indicators [Sektor energetyczny, a wyzwania zrównoważonego rozwoju-analiza przestrzennego zróżnicowania sytuacji]. Zesz. Nauk. Szk. Głównej Gospod. Wiej. w Warszawie Probl. Rol. Światowego 2018, 18, 173–186. [Google Scholar] [CrossRef] [Green Version]
- Medvedeva, Y.Y.; Luchaninov, R.S.; Poluyanova, N.V.; Semenova, S.V.; Alekseeva, E.A. The Stakeholders’ Role in the Corporate Strategy Creation for the Sustainable Development of Russian Industrial Enterprises. Economies 2022, 10, 116. [Google Scholar] [CrossRef]
- Dereń, A.; Górski, A.; Parkitna, A.; Skonieczny, J. Dimensions of business ecosystem efficiency. In Proceedings of the Proceedings of 38th International Conference on Information Systems Architecture and Technology, ISAT 2017, Szklarska Poręba, Poland, 17–19 September 2017; Pt. 3. pp. 128–140. [Google Scholar]
- Schmidt, C.; Mayer, B.; Junginger, F.; Rebholz, M.; Grupp, A.; Brida, D.; Huber, R.; Leitenstorfer, A.; Pashkin, A. Ultrafast low-energy dynamics of graphite studied by nonlinear multi-THz spectroscopy. In EPJ Web of Conferences; EDP Sciences: Les Ulis, France, 2013; Volume 41. [Google Scholar]
- Kulhanek, L.; Sulich, A.; Zema, T. European integration and real convergence in V4 Group: Transformation towards green economy. In Proceedings of the 6th International Conference on European Integration 2022, Ostrava, Czechy, 18–20 May 2022; Stanickova, M., Melecky, L., Eds.; VSB–Technical University of Ostrava: Ostrava, Czech Republic, 2022; pp. 363–371. [Google Scholar]
- Almutairi, K.; Thoma, G.; Durand-Morat, A. Ex-Ante Analysis of Economic, Social and Environmental Impacts of Large-Scale Renewable and Nuclear Energy Targets for Global Electricity Generation by 2030. Sustainability 2018, 10, 2884. [Google Scholar] [CrossRef] [Green Version]
- Tănasie, A.V.; Năstase, L.L.; Vochița, L.L.; Manda, A.M.; Boțoteanu, G.I.; Sitnikov, C.S. Green Economy—Green Jobs in the Context of Sustainable Development. Sustainability 2022, 14, 4796. [Google Scholar] [CrossRef]
- Weron, R. Electricity price forecasting: A review of the state-of-the-art with a look into the future. Int. J. Forecast. 2014, 30, 1030–1081. [Google Scholar] [CrossRef] [Green Version]
- Uniejewski, B.; Marcjasz, G.; Weron, R. On the importance of the long-term seasonal component in day-ahead electricity price forecasting: Part II—Probabilistic forecasting. Energy Econ. 2019, 79, 171–182. [Google Scholar] [CrossRef] [Green Version]
- Kozar, Ł.; Oleksiak, P. Organisations Facing the Challenges of Sustainable Development-Selected Aspects [Organizacje Wobec Wyzwań Zrównoważonego Rozwoju–Wybrane Aspekty]; Wydawnictwo Uniwersytetu Łódzkiego: Łódź, Poland, 2022; ISBN 9788382208191. [Google Scholar]
- Gunter, S.I.; Aksu, C. N-step combinations of forecasts. J. Forecast. 1989, 8, 253–267. [Google Scholar] [CrossRef]
- Benalcazar, P.; Kaszyński, P.; Kamiński, J. Assessing the effects of uncertain energy and carbon prices on the operational patterns and economic results of chp systems. Energies 2021, 14, 8216. [Google Scholar] [CrossRef]
- Komorowska, A.; Benalcazar, P.; Kaszyński, P.; Kamiński, J. Economic consequences of a capacity market implementation: The case of Poland. Energy Policy 2020, 144, 111683. [Google Scholar] [CrossRef]
- Castelli, M.; Groznik, A.; Popovič, A. Forecasting electricity prices: A machine learning approach. Algorithms 2020, 13, 119. [Google Scholar] [CrossRef]
- Pourdaryaei, A.; Mohammadi, M.; Karimi, M.; Mokhlis, H.; Illias, H.A.; Kaboli, S.H.A.; Ahmad, S. Recent development in electricity price forecasting based on computational intelligence techniques in deregulated power market. Energies 2021, 14, 6104. [Google Scholar] [CrossRef]
- Benalcazar, P.; Suski, A.; Kaminski, J. The effects of capital and energy subsidies on the optimal design of microgrid systems. Energies 2020, 13, 995. [Google Scholar] [CrossRef] [Green Version]
- Stós, K.; Kamiński, J.; Malec, M. Analysis of selected environmental regulations influencing the long-term operation of cogeneration companies. Polityka Energetyczna-Energy Policy J. 2019, 22, 81–96. [Google Scholar] [CrossRef]
- Sulich, A.; Sołoducho-Pelc, L. Renewable Energy Producers’ Strategies in the Visegrád Group Countries. Energies 2021, 14, 3048. [Google Scholar] [CrossRef]
- Księżopolski, K.; Maśloch, G. Time Delay Approach to Renewable Energy in the Visegrad Group. Energies 2021, 14, 1928. [Google Scholar] [CrossRef]
- Kamińska, A.M.; Parkitna, A.; Górski, A. Factors determining the development of small enterprises. Proceedings of 38th International Conference on Information Systems Architecture and Technology, ISAT 2017, Szklarska Poręba, Poland, 17–19 September 2017; Pt. 3. pp. 197–209. [Google Scholar]
- Gostkowski, M.; Rokicki, T.; Ochnio, L.; Koszela, G.; Wojtczuk, K.; Ratajczak, M.; Szczepaniuk, H.; Bórawski, P.; Bełdycka-Bórawska, A. Clustering Analysis of Energy Consumption in the Countries of the Visegrad Group. Energies 2021, 14, 5612. [Google Scholar] [CrossRef]
- Sulich, A.; Rutkowska, M. Factor analysis of the green management in the context of Poland regions sustainable development. In Proceedings of the Experimental and Quantitative Methods in Contemporary Economics: Computational Methods in Experimental Economics (CMEE) 2018: Conference, Łódź, Poland, 29–30 November 2018; pp. 143–156. [Google Scholar]
- Goldstein, H. Multilevel Statistical Models; Oxford University Press: London, UK, 2003. [Google Scholar]
- Łuszczyk, M.; Sulich, A.; Siuta-Tokarska, B.; Zema, T.; Thier, A. The development of electromobility in the european union: Evidence from Poland and cross-country comparisons. Energies 2021, 14, 8247. [Google Scholar] [CrossRef]
- Ropuszynska-Surma, E.; Weglarz, M. Profiling end user of renewable energy sources among residential consumers in Poland. Sustainability 2018, 10, 4452. [Google Scholar] [CrossRef] [Green Version]
- Florczak-Strama, M.; Parkitna, A. Project appraisal in the transport sector. In Information Systems Architecture and Technology: Proceedings of 36th International Conference on Information Systems Architecture and Technology, ISAT 2015, Karpacz, Poland, 20–22 September 2015; Springer: Berlin/Heidelberg, Germany, 2015; Pt. 4; pp. 63–73. [Google Scholar]
- Mazzucato, M. A computational model of economies of scale and market share instability. Struct. Chang. Econ. Dyn. 1998, 9, 55–83. [Google Scholar] [CrossRef] [Green Version]
- Kozar, Ł.; Paduszyńska, M. Change Dynamics of Electricity Prices for Households in the European Union between 2011 and 2020. Finans. i Prawo Finans. 2021, 4, 97–115. [Google Scholar] [CrossRef]
- Di Palma, M.A.; Filzmoser, P.; Gallo, M.; Hron, K. A robust Parafac model for compositional data. J. Appl. Stat. 2017, 45, 1347–1369. [Google Scholar] [CrossRef]
- Simionescu, M.; Wojciechowski, A.; Tomczyk, A.; Rabe, M. Revised Environmental Kuznets Curve for V4 Countries and Baltic States. Energies 2021, 14, 3302. [Google Scholar] [CrossRef]
- Kochanek, E. The Energy Transition in the Visegrad Group Countries. Energies 2021, 14, 2212. [Google Scholar] [CrossRef]
- Górka, K.; Łuszczyk, M.; Thier, A. The Impact of a Circular Economy on Sustainable Development. Barom. Reg. 2018, 4, 7–14. [Google Scholar]
- Grzesiak, S.; Sulich, A. Car Engines Comparative Analysis: Sustainable Approach. Energies 2022, 15, 5170. [Google Scholar] [CrossRef]
- Robinson, D.K.R.; Mazzucato, M. The evolution of mission-oriented policies: Exploring changing market creating policies in the US and European space sector. Res. Policy 2019, 48, 936–948. [Google Scholar] [CrossRef]
- Jędrzejewski, A.; Marcjasz, G.; Weron, R. Importance of the Long-Term Seasonal Component in Day-Ahead Electricity Price Forecasting Revisited: Parameter-Rich Models Estimated via the LASSO. Energies 2021, 14, 3249. [Google Scholar] [CrossRef]
- Boyack, K.; Glänzel, W.; Gläser, J.; Havemann, F.; Scharnhorst, A.; Thijs, B.; van Eck, N.J.; Velden, T.; Waltmann, L. Topic identification challenge. Scientometrics 2017, 111, 1223–1224. [Google Scholar] [CrossRef]
- Bilgaev, A.; Sadykova, E.; Mikheeva, A.; Bardakhanova, T.; Ayusheeva, S.; Li, F.; Dong, S. Green Economy Development Progress in the Republic of Buryatia (Russia). Int. J. Environ. Res. Public Health 2022, 19, 7928. [Google Scholar] [CrossRef]
- Andriuškevičius, K.; Štreimikienė, D. Sustainability Framework for Assessment of Mergers and Acquisitions in Energy Sector. Energies 2022, 15, 4557. [Google Scholar] [CrossRef]
- Lago, J.; Marcjasz, G.; De Schutter, B.; Weron, R. Forecasting day-ahead electricity prices: A review of state-of-the-art algorithms, best practices and an open-access benchmark. Appl. Energy 2021, 293, 116983. [Google Scholar] [CrossRef]
- Cuerda, C.; Zornoza, A.; Gallud, J.A.; Tesoriero, R.; Ayuso, D.R. Deep learning assisted cognitive diagnosis for the D-Riska application. Soft Comput. 2022, 26, 665–676. [Google Scholar] [CrossRef]
- Komorowska, A. Can decarbonisation and capacity market go together? The case study of Poland. Energies 2021, 14, 5151. [Google Scholar] [CrossRef]
- Komorowska, A. Cross-border exchange of electricity between Poland and the neighboring countries. Polityka Energetyczna-Energy Policy J. 2019, 22, 37–52. [Google Scholar] [CrossRef]
- Sobiech-Grabka, K.; Stankowska, A.; Jerzak, K. Determinants of Electric Cars Purchase Intention in Poland: Personal Attitudes v. Economic Arguments. Energies 2022, 15, 3078. [Google Scholar] [CrossRef]
- Acaroğlu, H.; García Márquez, F.P. Comprehensive review on electricity market price and load forecasting based on wind energy. Energies 2021, 14, 7473. [Google Scholar] [CrossRef]
- Sołoducho-Pelc, L.; Sulich, A. Between Sustainable and Temporary Competitive Advantages in the Unstable Business Environment. Sustainability 2020, 12, 8832. [Google Scholar] [CrossRef]
- Kunisch, S.; Menz, M.; Bartunek, J.M.; Cardinal, L.B.; Denyer, D. Feature topic at organizational research methods: How to conduct rigorous and impactful literature reviews? Organ. Res. Methods 2018, 21, 519–523. [Google Scholar] [CrossRef] [Green Version]
- Denyer, D.; Tranfield, D. Producing a systematic review. W The Sage Handbook of Organizational Research Methods; Sage Publications Ltd.: Thousand Oaks, CA, USA, 2009; pp. 671–689. ISBN 978-1-4129-3118-2. [Google Scholar]
- MacFarlane, A.; Russell-Rose, T.; Shokraneh, F. Search strategy formulation for systematic reviews: Issues, challenges and opportunities. Intell. Syst. Appl. 2022, 15, 200091. [Google Scholar] [CrossRef]
- Charbonnier, F.; Morstyn, T.; McCulloch, M.D. Coordination of resources at the edge of the electricity grid: Systematic review and taxonomy. Appl. Energy 2022, 318, 119188. [Google Scholar] [CrossRef]
- Zhu, Z.; Yao, X.; Qin, Y.; Lu, Z.; Ma, Q.; Zhao, X.; Liu, L. Visualization and mapping of literature on the scientific analysis of wall paintings: A bibliometric analysis from 2011 to 2021. Herit. Sci. 2022, 10, 1–13. [Google Scholar] [CrossRef]
- Visser, M.; van Eck, N.J.; Waltman, L. Large-scale comparison of bibliographic data sources: Scopus, web of science, dimensions, crossref, and microsoft academic. Quant. Sci. Stud. 2021, 2, 20–41. [Google Scholar] [CrossRef]
- van Eck, N.J.; Waltman, L.; Dekker, R.; van den Berg, J. A comparison of two techniques for bibliometric mapping: Multidimensional scaling and VOS. J. Am. Soc. Inf. Sci. Technol. 2010, 61, 2405–2416. [Google Scholar] [CrossRef] [Green Version]
- Waltman, L.; van Eck, N.J. A taxonomy of bibliometric performance indicators based on the property of consistency. In Proceedings of the 12th International Conference on Scientometrics and Informetrics, ISSI 2009, Rio de Janeiro, Brazil, 14–17 July 2009; pp. 1002–1003. [Google Scholar]
- van Eck, N.J.; Waltman, L.; Noyons, E.C.M.; Buter, R.K. Automatic term identification for bibliometric mapping. Scientometrics 2010, 82, 581–596. [Google Scholar] [CrossRef] [Green Version]
- Aria, M.; Cuccurullo, C.; Biblioshiny. Bibliometrix for no Coders. Available online: https://bibliometrix.org/biblioshiny/assets/player/KeynoteDHTMLPlayer.html#0 (accessed on 18 June 2022).
- Rousseau, D.M.; Manning, J.; Denyer, D. Evidence in Management and Organizational Science: Assembling the Field’s Full Weight of Scientific Knowledge Through Syntheses. Acad. Manag. Ann. 2008, 2, 475–515. [Google Scholar] [CrossRef]
- Fischl, M.; Scherrer-Rathje, M.; Friedli, T. Digging deeper into supply risk: A systematic literature review on price risks. Supply Chain Manag. Int. J. 2014, 19, 480–503. [Google Scholar] [CrossRef]
- Van Eck, N.J.; Waltman, L. Accuracy of citation data in Web of Science and Scopus. In Proceedings of the ISSI 2017—16th International Conference on Scientometrics and Informetrics, Conference Proceedings, Wuhan, China, 16–20 October 2017; pp. 1087–1092. [Google Scholar]
- van Eck, N.J.; Waltman, L. Software survey: VOSviewer, a computer program for bibliometric mapping. Scientometrics 2010, 84, 523–538. [Google Scholar] [CrossRef] [Green Version]
- Bu, Y.; Waltman, L.; Huang, Y. A multidimensional framework for characterizing the citation impact of scientific publications. Quant. Sci. Stud. 2021, 2, 155–183. [Google Scholar] [CrossRef]
- Lamers, W.S.; Boyack, K.; Larivière, V.; Sugimoto, C.R.; van Eck, N.J.; Waltman, L.; Murray, D. Investigating disagreement in the scientific literature. Elife 2021, 10, e72737. [Google Scholar] [CrossRef]
- Babu, C.N.; Reddy, B.E. A moving-average filter based hybrid ARIMA-ANN model for forecasting time series data. Appl. Soft Comput. J. 2014, 23, 27–38. [Google Scholar] [CrossRef]
- Efimova, O.; Serletis, A. Energy markets volatility modelling using GARCH. Energy Econ. 2014, 43, 264–273. [Google Scholar] [CrossRef]
- Nowotarski, J.; Raviv, E.; Trück, S.; Weron, R. An empirical comparison of alternative schemes for combining electricity spot price forecasts. Energy Econ. 2014, 46, 395–412. [Google Scholar] [CrossRef]
- Eklund, M.; Alamaniotis, M.; Hernandez, H.; Jevremovic, T. Method of characteristics-A review with applications to science and nuclear engineering computation. Prog. Nucl. Energy 2015, 85, 548–567. [Google Scholar] [CrossRef]
- Waltman, L.; van Eck, N.J. A new methodology for constructing a publication-level classification system of science. J. Am. Soc. Inf. Sci. Technol. 2012, 63, 2378–2392. [Google Scholar] [CrossRef] [Green Version]
- Waltman, L.; Kaymak, U.; van Den Berg, J. Maximum likelihood parameter estimation in probabilistic fuzzy classifiers. In Proceedings of the IEEE International Conference on Fuzzy Systems, Reno, NV, USA, 25 May 2005; pp. 1098–1103. [Google Scholar]
- Tsironis, G.; Daglis, T.; Tsagarakis, K.P. Social media and EU companies’ engagement in circular economy: A LinkedIn approach. Sustain. Prod. Consum. 2022, 32, 802–816. [Google Scholar] [CrossRef]
- Xie, X.; Li, M.; Zhang, D. A multiscale electricity price forecasting model based on tensor fusion and deep learning. Energies 2021, 14, 7333. [Google Scholar] [CrossRef]
- Box, G.E.P.; Jenkins, G.M.; Reinsel, G.C.; Ljung, G.M. Time Series Analysis: Forecasting and Control, 5th ed.; Wiley: Hoboken, NJ, USA, 2015; pp. 199–201. ISBN 978-1-118-67502-1. [Google Scholar]
- Khashei, M.; Bijari, M. A novel hybridization of artificial neural networks and ARIMA models for time series forecasting. Appl. Soft Comput. 2011, 11, 2664–2675. [Google Scholar] [CrossRef]
- Zhang, P.G. Time series forecasting using a hybrid ARIMA and neural network model. Neurocomputing 2003, 50, 159–175. [Google Scholar] [CrossRef]
- Ebrahimian, H.; Barmayoon, S.; Mohammadi, M.; Ghadimi, N. The price prediction for the energy market based on a new method. Econ. Res.-Ekon. Istraživanja 2018, 31, 313–337. [Google Scholar] [CrossRef] [Green Version]
- Zhang, S.; Chen, Y.; Zhang, W.; Feng, R. A novel ensemble deep learning model with dynamic error correction and multi-objective ensemble pruning for time series forecasting. Inf. Sci. 2021, 544, 427–445. [Google Scholar] [CrossRef]
- Wan, C.; Xu, Z.; Wang, Y.; Dong, Z.Y.; Wong, K.P. A Hybrid Approach for Probabilistic Forecasting of Electricity Price. IEEE Trans. Smart Grid 2014, 5, 463–470. [Google Scholar] [CrossRef]
- Gomółka, K.; Kasprzak, P. Household Ability of Expenditures on Electricity and Energy Resources in the Countries That Joined the EU after 2004. Energies 2022, 15, 3052. [Google Scholar] [CrossRef]
- Niemczyk, J.; Sus, A.; Bielińska-Dusza, E.; Trzaska, R.; Organa, M. Strategies of European Energy Producers. Directions of Evolution. Energies 2022, 15, 609. [Google Scholar] [CrossRef]
- Alamaniotis, M.; Gatsis, N.; Tsoukalas, L.H. Virtual Budget: Integration of electricity load and price anticipation for load morphing in price-directed energy utilization. Electr. Power Syst. Res. 2018, 158, 284–296. [Google Scholar] [CrossRef]
- Niemczyk, J.; Sus, A.; Borowski, K.; Jasiński, B.; Jasińska, K. The Dominant Motives of Mergers and Acquisitions in the Energy Sector in Western Europe from the Perspective of Green Economy. Energies 2022, 15, 1065. [Google Scholar] [CrossRef]
- Stor, M.; Haromszeki, Ł. Competency management and the financial results of the foreign subsidiaries of Polish MNCs: The empirical research findings. Hum. Syst. Manag. 2022, 41, 393–405. [Google Scholar] [CrossRef]
- Silveira Gontijo, T.; Azevedo Costa, M.; Barbosa De Santis, R. Electricity price forecasting on electricity spot market: A case study based on the Brazilian Difference Settlement Price. In E3S Web of Conferences; EDP Sciences: Les Ulis, France, 2021; Volume 239. [Google Scholar]
- Weron, R.; Ziel, F. Electricity price forecasting. In Routledge Handbook of Energy Economics; Soytaş, U., Sarı, R., Eds.; Taylor and Francis: London, UK, 2019; pp. 506–521. [Google Scholar]
- Boyack, K.W.; van Eck, N.J.; Colavizza, G.; Waltman, L. Characterizing in-text citations in scientific articles: A large-scale analysis. J. Informetr. 2018, 12, 59–73. [Google Scholar] [CrossRef] [Green Version]
- Aria, M.; Cuccurullo, C. bibliometrix: An R-tool for comprehensive science mapping analysis. J. Informetr. 2017, 11, 959–975. [Google Scholar] [CrossRef]
- Cuccurullo, C.; Aria, M.; Sarto, F. Foundations and trends in performance management. A twenty-five years bibliometric analysis in business and public administration domains. Scientometrics 2016, 108, 595–611. [Google Scholar] [CrossRef]
- Šubelj, L.; van Eck, N.J.; Waltman, L. Clustering scientific publications based on citation relations: A systematic comparison of different methods. PLoS ONE 2016, 11, e0154404. [Google Scholar] [CrossRef] [Green Version]
Figure 1.
The number of publications in WoS and Scopus each year. Source: Authors’ elaboration.

Figure 2.
Bibliometric map of keywords co-occurrences results from Scopus based on original Query 1. Source: Authors’ elaboration performed in the VOSviewer (version 1.6.18).
Figure 2.
Bibliometric map of keywords co-occurrences results from Scopus based on original Query 1. Source: Authors’ elaboration performed in the VOSviewer (version 1.6.18).

Figure 3.
Bibliometric map of keywords co-occurrences results from WoS based on original Query 2. Source: Authors’ elaboration performed in the VOSviewer (version 1.6.18).
Figure 3.
Bibliometric map of keywords co-occurrences results from WoS based on original Query 2. Source: Authors’ elaboration performed in the VOSviewer (version 1.6.18).

Figure 4.
Bibliometric map of keywords co-occurrences (minimum 5) results from Scopus based on modified Query 1. Source: Authors’ elaboration performed in the VOSviewer (version 1.6.18).
Figure 4.
Bibliometric map of keywords co-occurrences (minimum 5) results from Scopus based on modified Query 1. Source: Authors’ elaboration performed in the VOSviewer (version 1.6.18).

Figure 5.
Bibliometric map of keywords co-occurrences (minimum 1) results from WoS based on modified Query 2. Source: Authors’ elaboration performed in the VOSviewer (version 1.6.18).
Figure 5.
Bibliometric map of keywords co-occurrences (minimum 1) results from WoS based on modified Query 2. Source: Authors’ elaboration performed in the VOSviewer (version 1.6.18).

Figure 6.
Bibliometric map of keywords in the overlay visualization context, co-occurrences (minimum 5) results from Scopus based on Query 1. Source: Authors’ elaboration performed in the VOSviewer (version 1.6.18).
Figure 6.
Bibliometric map of keywords in the overlay visualization context, co-occurrences (minimum 5) results from Scopus based on Query 1. Source: Authors’ elaboration performed in the VOSviewer (version 1.6.18).

Figure 7.
Bibliometric map of keywords in the overlay visualization context, co-occurrences (minimum 2) results from WoS based on Query 2. Source: Authors’ elaboration performed in the VOSviewer (version 1.6.18).
Figure 7.
Bibliometric map of keywords in the overlay visualization context, co-occurrences (minimum 2) results from WoS based on Query 2. Source: Authors’ elaboration performed in the VOSviewer (version 1.6.18).


Table 1.
Queries dynamics results in indicated time points.
| Query | 10 December 2021 | 10 May 2022 | 10 July 2022 |
|---|---|---|---|
| 1 (Scopus) | 766 | 798 | 851 |
| 2 (WoS) | 377 | 435 | 443 |
Source: Authors elaboration.
Table 2.
Clusters of keywords co-occurrences visible in Figure 2 for Scopus.
Table 2.
Clusters of keywords co-occurrences visible in Figure 2 for Scopus.
| Cluster | Color | Keywords |
|---|---|---|
| 1 | Red | Bayesian networks; clustering; fuzzy neural networks; wavelet transforms; genetic algorithms; Monte Carlo methods; neural networks |
| 2 | Green | convolutional neural networks; deep learning; long short-term memory; multilayer neural networks; recurrent neural networks; reinforcement learning |
| 3 | Blue | feedforward neural networks; linear regression; arima; support vector machine; hybrid model; garch |
| 4 | Yellow | adaptive boosting; decision trees; ensemble learning; gradient boosting |
| 5 | Purple | extreme learning machine; machine learning |
Source: Authors elaboration.
Table 3.
Clusters of keywords co-occurrences as visible in Figure 3 for WoS.
Table 3.
Clusters of keywords co-occurrences as visible in Figure 3 for WoS.
| Cluster | Color | Keywords |
|---|---|---|
| 1 | Red | machine learning; regression; deep learning; support vector machines |
| 2 | Green | selection; lasso; quantile regression; arima |
| 3 | Blue | artificial intelligence; neural networks; classification |
| 4 | Yellow | genetic algorithms; support vector regression; extreme learning-machine |
Source: Authors’ elaboration.
Table 4.
Clusters of keywords co-occurrences as presented in Figure 4.
Table 4.
Clusters of keywords co-occurrences as presented in Figure 4.
| Cluster | Color | Keywords |
|---|---|---|
| 1 | Red | neural networks; fuzzy neural networks; wavelet transforms; multilayer neural networks; genetic algorithms |
| 2 | Green | decision trees; support vector machines; clustering; adaptive boosting |
| 3 | Blue | long short-term memory; deep learning |
| 4 | Yellow | arima; hybrid model |
| 5 | Purple | machine learning; extreme learning machines |
Source: Authors’ elaboration.
Table 5.
Selected clusters of keywords co-occurrences presented in Figure 5.
Table 5.
Selected clusters of keywords co-occurrences presented in Figure 5.
| Cluster | Color | Keywords |
|---|---|---|
| 1 | Red | machine learning; xgboost; sarima; ga-bp algorithm |
| 2 | Green | arima; hybrid model; neural networks; lasso |
| 3 | Yellow | classification; decision trees |
Source: Authors elaboration.
Table 6.
Common results of the performed analyses of publications related to the EPF models.
| Most Cited Scientific Publications | Most Accurate Scientific Publications |
|---|---|
| extreme machine learning; machine learning; arima; neural networks | arima; hybrid model; decision trees |
Source: Authors elaboration.
Publisher’s Note: MDPI stays neutral with regard to jurisdictional claims in published maps and institutional affiliations. |
© 2022 by the authors. Licensee MDPI, Basel, Switzerland. This article is an open access article distributed under the terms and conditions of the Creative Commons Attribution (CC BY) license (https://creativecommons.org/licenses/by/4.0/).
Share and Cite
MDPI and ACS Style
Zema, T.; Sulich, A. Models of Electricity Price Forecasting: Bibliometric Research. Energies 2022, 15, 5642. https://doi.org/10.3390/en15155642
AMA Style
Zema T, Sulich A. Models of Electricity Price Forecasting: Bibliometric Research. Energies. 2022; 15(15):5642. https://doi.org/10.3390/en15155642
Chicago/Turabian StyleZema, Tomasz, and Adam Sulich. 2022. "Models of Electricity Price Forecasting: Bibliometric Research" Energies 15, no. 15: 5642. https://doi.org/10.3390/en15155642
Note that from the first issue of 2016, this journal uses article numbers instead of page numbers. See further details here.