1. Introduction
Road transport is an important contributor of greenhouse gases [
1] that are responsible for global warming. Global CO
2 abatement goals have urged the electrification of vehicles that aims to carbon-free tailpipe emissions [
2]. Life-cycle assessment studies on electric vehicles show potential benefits compared to conventional vehicles, especially if the technology change is combined with a low-carbon electricity mix [
3,
4,
5]. The transition to purely electric vehicles (PEVs) is on-going; however, due to some barriers (e.g., short driving range, high cost) for their wide diffusion [
6], also hybrid (the combination of an internal combustion engine and an electric motor) solutions are followed. Already since the late 1990s, the first hybrid electric vehicles (HEVs) were introduced in the market, while in the late 2000s, the first plug-in hybrid vehicles (PHEVs) were commercialized.
HEVs are equipped with an internal combustion engine and a rechargeable electric energy storage system (REESS) (i.e., battery) that captures energy during braking, stores it, and powers the vehicle. PHEVs (also referred as off-vehicle charge hybrid electric vehicles, OVC-HEVs, in the European regulation 2017/1151) can also externally charge the REESS, giving a higher electric range and minimizing the use of the ICE. The market share of commercial and passenger PHEVs has increased over the last few years [
7]. Due to their extended electric operation, PHEVs have been expected to reduce tailpipe greenhouse gas emissions compared to conventional vehicles and also improve urban air quality.
However, different studies have identified a significant gap between official type approval and real-world CO
2 emissions of PHEVs which can be attributed to usage and charging behavior [
8,
9]. A recent study [
10] showed that even if PHEVs emit lower CO
2 compared to conventional vehicles, the in-use CO
2 emissions are 1.5 to 2 times more than the official declared values. The impact of the user-selectable mode on the CO
2 variability of three PHEVs was also investigated in one study [
11] and it was found that, when the discharged REESS was charged by the ICE, the CO
2 emissions were 50 to 100% higher than a trip with the REESS simply discharged. In another study [
12], the cabin air-heating system and lower ambient temperatures were found to increase CO
2 emissions of two PHEVs. The higher real-world CO
2 emissions compared to official type approval values were attributed to the more frequent than expected ignitions of the ICE. This difference may also create implications for air pollutants.
PHEVs are frequently combined with a gasoline direct injection (GDI) engine. GDIs are known for improving fuel efficiency but may emit a higher solid particle number (SPN) compared to a port fuel injection (PFI) engine [
13]. The high SPN emissions of GDIs have been handled in the European regulation by introducing a SPN limit down to a 23 nm particle size (SPN
23) in Euro 6 [
14]. The regulation limit, also applicable to on-road testing, drove to the optimization of GDIs operation [
15] and to the implementation of gasoline particulate filters (GPFs) which can efficiently reduce SPN emissions [
16,
17] with a trapping efficiency even >90% [
18]. GDIs still emit high SPN concentrations during cold start, and the speed, load, or fuel/air ratio increase [
19] but also during GPF regeneration [
20]. Moreover, when the GPF is cold, its efficiency may be reduced [
21]. Considering that PHEVs cold ICE ignition may occur under high power demand accelerations and with cold GPF, it is very likely that SPN emissions will be high.
SPN emissions of HEVs during engine ignitions and re-ignitions have been investigated by different studies. The on-road SPN emissions of two China-6 vehicles, a GDI-HEV and a PFI-HEV, both without gasoline particulate filter, were >10
12 #/km [
22]. The SPN spikes corresponded to engine start events. The contribution of high instantaneous SPN emissions was assessed in a study [
23] and it was found that, for three GDI-HEVs and one PFI-HEV, 20% of SPN was emitted in 2% of driving time. Another study compared the SPN emission rate (#/s) of a 2012 light-duty gasoline HEV during re-ignition events and found that they were 2.5 to 4.4 higher compared to stabilized ICE conditions [
24]. In another study [
25], the SPN emissions of a 2019 HEV with GDI during ICE re-ignitions accounted for ~70% of total trip SPN. A combination of injection pressure, end of injection, and spark timing modifications reduced ICE re-ignition SPN emissions by ~88%.
Few researchers have studied the SPN emissions of PHEVs. A study that measured real-driving SPN emissions of a Euro 6b PHEV equipped with a GDI engine [
26] found that SPN emissions were higher in the hybrid mode compared to ICE-dominant trips in the highway, whilst fuel consumption was lower. Researchers [
27] measured the particle sizes during the first cold engine ignition in laboratory cycles and observed that accumulation particles were mainly emitted. Cold-start SPN emissions were attributed to the fuel combustion and not to the oil. The high SPN emissions during ICE ignitions, especially at trips with fully or partially charged REESS, were confirmed by others as well [
28], and the authors claimed that optimization of GPFs will be needed to achieve stricter regulation limits. A comparison between a GDI and a PHEV with GDI, both equipped with a GPF, showed that similar soot management can be also applied to PHEVs, but calibration should be performed at high states of charge (SOCs) of the REESS to avoid high GPF inlet temperature [
29].
In this study, we investigate SPN emissions of three Euro 6 PHEVs with a GDI engine equipped with a GPF. The gaseous emissions have been published in a companion paper [
11]. SPN
23 emission factors are presented for laboratory tests performed according to the worldwide harmonized light vehicles test procedure (WLTP) and on-road tests with variable REESS states of charge (SOCs). The variability of SPN emissions at different SOCs are determined and the effect of cold ICE ignitions at trips with charged or partially charged REESS is compared to ICE-dominant trips. Furthermore, the ambient temperature effect on SPN
23 is studied. Finally, the sub-23 nm particles emissions as well as their contribution to SPN are presented.
2. Materials and Methods
The following subsections describe the plug-in hybrid vehicles that were tested, the laboratory and on-road driving cycles and protocols, and the instrumentation used for SPN measurements.
2.1. Vehicles
Table 1 summarizes the main characteristics of the tested vehicles. Vehicles are denoted with Vx, where x is their number. The number was selected according to the chronological order in which the vehicles were tested. All of them were PHEVs equipped with a GDI engine. Their class was M1 (passenger cars) and the model year was 2020. The after-treatment devices were a three-way catalyst (TWC) and a GPF. V1 and V3 were type-approved as Euro 6d, while V2 was type-approved as Euro 6d-TEMP. Thus, for all of them, a SPN
23 limit of 6 × 10
11 #/km was applicable at type-approval laboratory tests and the not-to-exceed (NTE) limit of 9 × 10
11 #/km on the road (i.e., with a conformity factor of 1.5). Moreover, all vehicles had to fulfil the in-service conformity tests (ISC), meaning that they should comply with emission limits up to 100,000 km or 5 years, whichever comes first. V1 and V2 had low mileage (~3000 km), while V3 had ~14,000 km. V1 and V3 had identical characteristics of thermal engine and electric motor, but were commercialized by different manufacturers and had different mileage. Moreover, their test mass was slightly different. V2 had lower test mass, engine displacement (1499 vs. 1598 cm
3), power (100 vs. 133 kW), electric range (52 vs. 61 km), and declared SPN
23 (1.29 × 10
11 vs. 1.86 × 10
11 #/km) compared to V1 and V3. The engine displacement, power, electric range, and declared SPN
23 under charge-sustaining conditions are reported in
Table 1. All vehicles were maintained according to the requirements of the manufacturer. Commercial gasoline fuel E10 was used for testing.
2.2. Driving Cycles and Routes
In Europe, light duty vehicles are tested according to Regulation 2017/1151. For internal combustion engine-equipped vehicles, the worldwide harmonized light vehicles test cycle (WLTC) applies. This driving cycle is performed at 23 °C, it consists of low, medium, high, and extra high speed phases, while its total duration is 1800 s. More information can be found elsewhere [
30].
PHEVs, in addition to testing with depleted REESS (charge-sustaining conditions), have to also be tested with charged REESS (charge-depleting conditions). Their testing consists of a series WLTC, and four different options for the order of tests are prescribed in 2017/1151. Herein, we applied option three. Accordingly, a preconditioning WLTC was conducted under charge-sustaining conditions. Then, the vehicle was soaked at 23 °C for ~20 h and the REESS was fully charged. Subsequently, a series of charge-depleting (CD) WLTC cycles were performed until the break-off criterion was fulfilled. The break-off criterion is reached when the relative change in the REESS at consequent cycles is less than 4%. The WLTC in which this criterion is reached is called the confirmation cycle, while the previous one is called the transition cycle. The maximum soaking time between CD cycles was 30 min, while the REESS was not charged. After the completion of the CD cycles, the vehicle was soaked for ~20 h and then a charge-sustaining (CS) WLTC was performed. The REESS current and voltage were continuously measured during the tests. According to the regulation, the weighted emissions of a PHEV are calculated by considering the CD cycles until the transition WLTC and the CS WLTC. SPN23 emissions of these cycles are weighted using the utility factors described in 2017/1151. Fractional utility factors apply for each phase and depend on the travelled distance. According to this method, the first driven cycle has a larger weight on the total emissions calculation compared to the subsequent ones (~50% in our case). In addition to WLTC testing at 23 °C, all vehicles were tested both with CD and CS tests at −10 °C. Moreover, V2 and V3 were also tested only with CS at 40 °C.
For on-road testing, there is no provision in the European real driving emissions (RDE) regulation, consolidated in 2017/1151, for the state of charge (SOC) of PHEVs. Thus, a PHEV should comply with the RDE regulation requirements under all different SOC levels. Herein, we conducted RDE-compliant tests with different SOC (100%, 50%, 25%, discharged). For some SOCs, more than one test was performed. The trip duration was ~103 min and was composed of an urban (~35.5 km), a rural (~29.1 km), and a highway (~26.5 km) section according to the regulation requirements. Note that the limits apply both to the urban and to the total trip SPN23 emissions. The vehicles were tested in different months; thus, the ambient temperature varied. The average trip temperatures were 8 to 18 °C for V1, 25 to 32 °C for V2, and 19 to 28 °C for V3. All tests were carried out with the default driving mode, except from two tests of V1 which were performed in the electric user-selectable mode (indicated in the “Results and Discussion” section).
Table 2 presents all laboratory and on-road tests performed for each vehicle.
2.3. Instrumentation
Laboratory tests were conducted at the vehicle emissions laboratory (VELA 8) of the Joint Research Centre in Italy. VELA 8 is a climatic test cell equipped with a 4WD chassis dynamometer. SPN
23 was measured from a dilution tunnel with constant volume sampling (CVS). The particle counter was the APC 489 from AVL (Graz, Austria) [
31]. It consisted of a hot dilution stage at 150 °C, an evaporation tube at 350 °C, a cold dilution stage, and a particle counter with a cut-off size at 23 nm. Additionally, a particle counter with cut-off size down to 10 nm was used for measuring SPN
10. The dilution factor combined with the particle losses through the APC 489, were expressed through the particle number concentration reduction factor (PCRF). Due to the high SPN emissions of PHEVs during their cold start, we used PCRF = 1000 in order to avoid saturation of the particle number counter and minimize volatile artifacts in the system [
32].
On-road testing was performed with two different portable emissions measurement systems (PEMS), namely an AVL MOVE system (for V1 and V3) and a HORIBA (Kyoto, Japan) OBS ONE system (for V2). MOVE utilizes a particle detector based on diffusion charging technology, while the OBS particle detector is based on condensation particle counting. The cut-off size of PN-PEMS systems was 23 nm. In parallel with these two PEMS, a portable Fourier transform infrared (FTIR) spectrometer was also installed on the vehicles. More information can be found in the companion paper of this work [
11].
Note that all instrumentation used in this study was maintained and calibrated according to the regulation requirements. The estimated measurement uncertainty is around 14% for the laboratory system and 31% for the portable system. A detailed discussion on the uncertainty of regulatory SPN measurements in the laboratory and on-road can be found in [
33].
3. Results and Discussion
In this section, we present the SPN23 emissions of V1 to V3 under regulated laboratory (3.1) and on-road (3.2) tests, we determine the emission rate and concentration SPN23 spikes during on-road cold engine ignition of the ICE (3.3), we investigate the effect of low- (−10 °C) and high-temperature (40 °C) tests in the laboratory (3.4), and finally we present the SPN10 emissions measured in laboratory tests for V1 and V2 (3.5).
3.1. Regulated Laboratory Tests
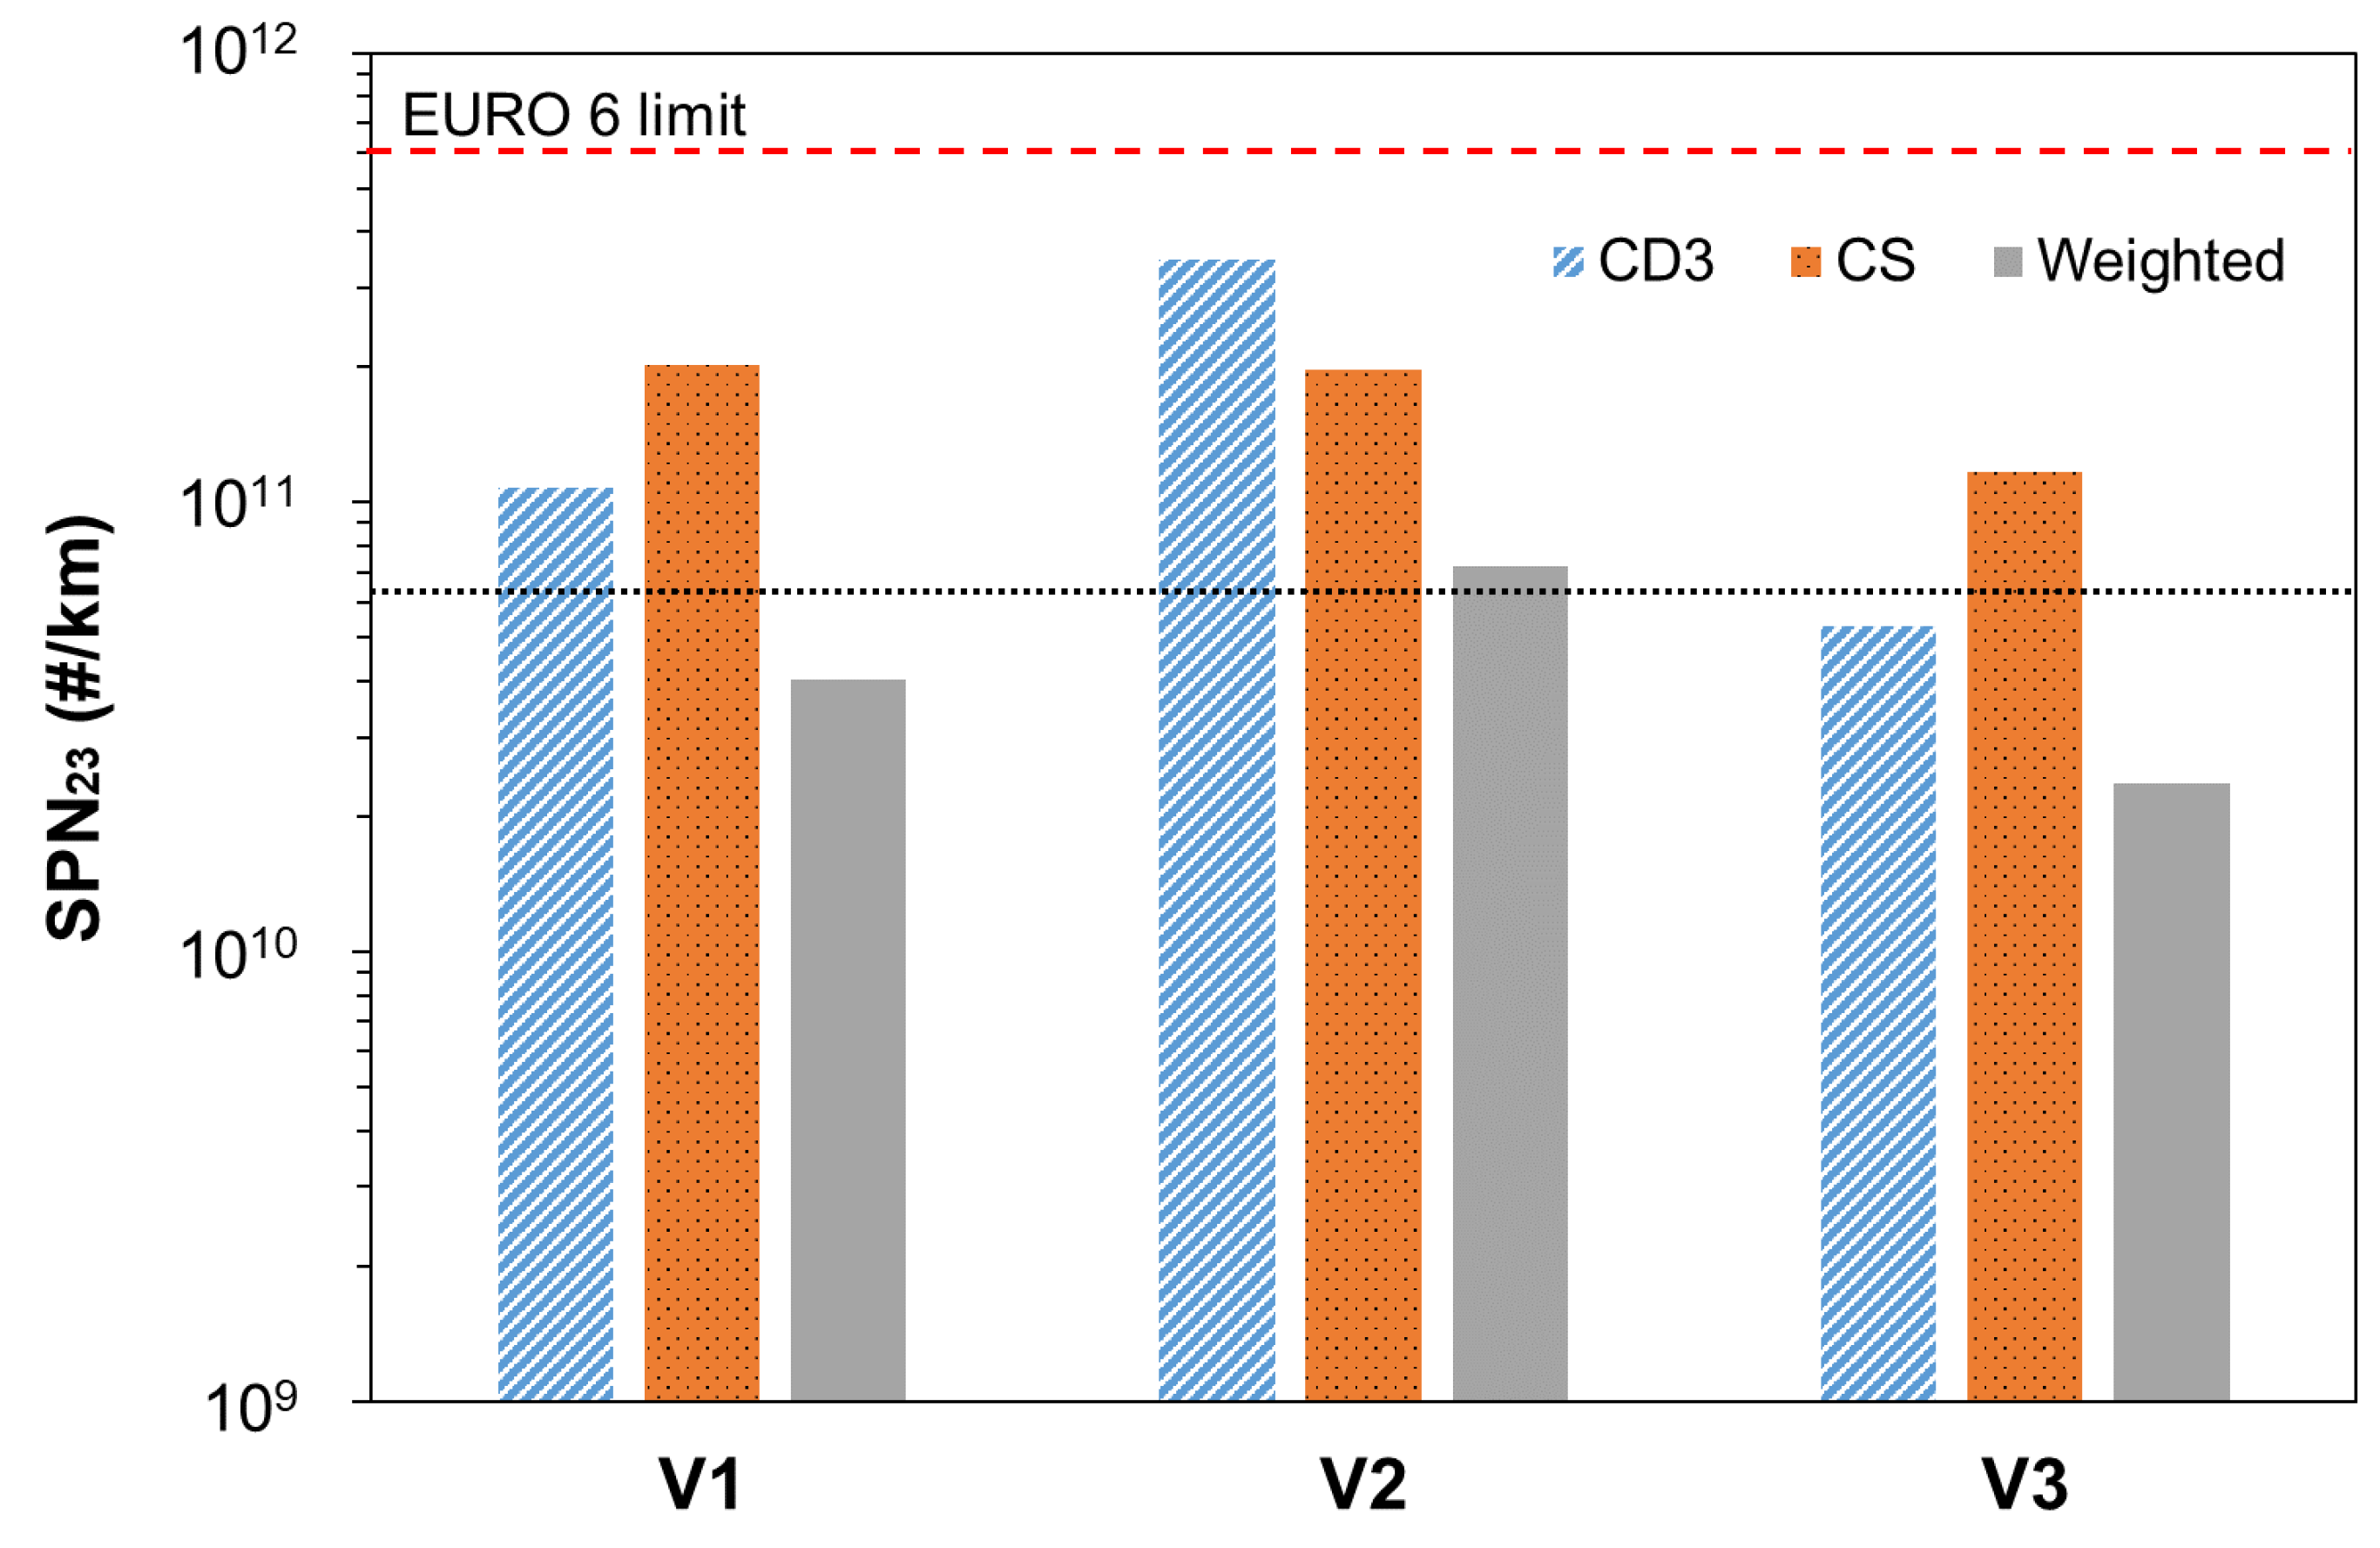
Figure 1 presents the SPN
23 emissions of the three plug-in vehicles (V1 to V3) measured in the laboratory when tested with the type-approval WLTC. Only testing cycles for which the ICE ignited are shown. All vehicles were powered exclusively with the electric motor for the first two charge-depleting cycles (CD1 and CD2) and during the third CD (CD3) the ICE ignited for the first time. SPN
23 emissions during CD3 are presented with blue and white diagonal lines and the charge-sustaining (CS) emissions are presented with an orange bar with grid. Additionally, the weighted WLTP SPN
23 emissions, calculated according to 2017/1151, are plotted with a grey bar. The red dashed line shows the Euro 6 SPN
23 limit (6 × 10
11 #/km) and the black dotted line shows the average SPN
23 emissions of all GDI vehicles, equipped solely with an internal combustion engine (6.3 × 10
10 #/km), tested during the 2020–2021 market surveillance activities of the Joint Research Centre (JRC), and specifically of six Euro 6d-TEMP and two Euro 6d, all equipped with GPF [
34].
All vehicles complied with the Euro 6 limit. Note that when testing a PHEV, the limit has to be respected at all cycles (both CD and CS). V1 emitted ~1 × 10¹¹ #/km during CD3 and approximately two times more (~2 × 10¹¹ #/km) during the CS WLTC. Also for V3, the CS emissions were almost double compared to the CD3 emissions (1.2 × 10¹¹ #/km vs 5.3 × 10¹⁰ #/km, respectively). On the contrary, V2 emitted higher SPN23 during CD3 (3.5 × 10¹¹ #/km) compared to CS (2.0 × 10¹¹ #/km) even if the ICE operated for ~880 s during CD3.
SPN
23 emissions during CS cycles were higher than the average of the eight GDI vehicles presented in
Figure 1. This result shows that PHEVs, when operating solely with the ICE, perform equally or even worse than conventional vehicles with regards to particulate emissions, possibly due to their larger weight related to the additional REESS weight. A previous study found that payload may increase SPN emissions [
35]. CD3 emissions of V1 and V2 were higher than the average of conventional GDIs, while for V3 lower. The weighted emissions were ≤7.2 × 10
10 #/km for all vehicles and lower (V1 and V3) or equal (V2) to conventional Euro 6d/6d-TEMP GDIs.
To better understand the SPN
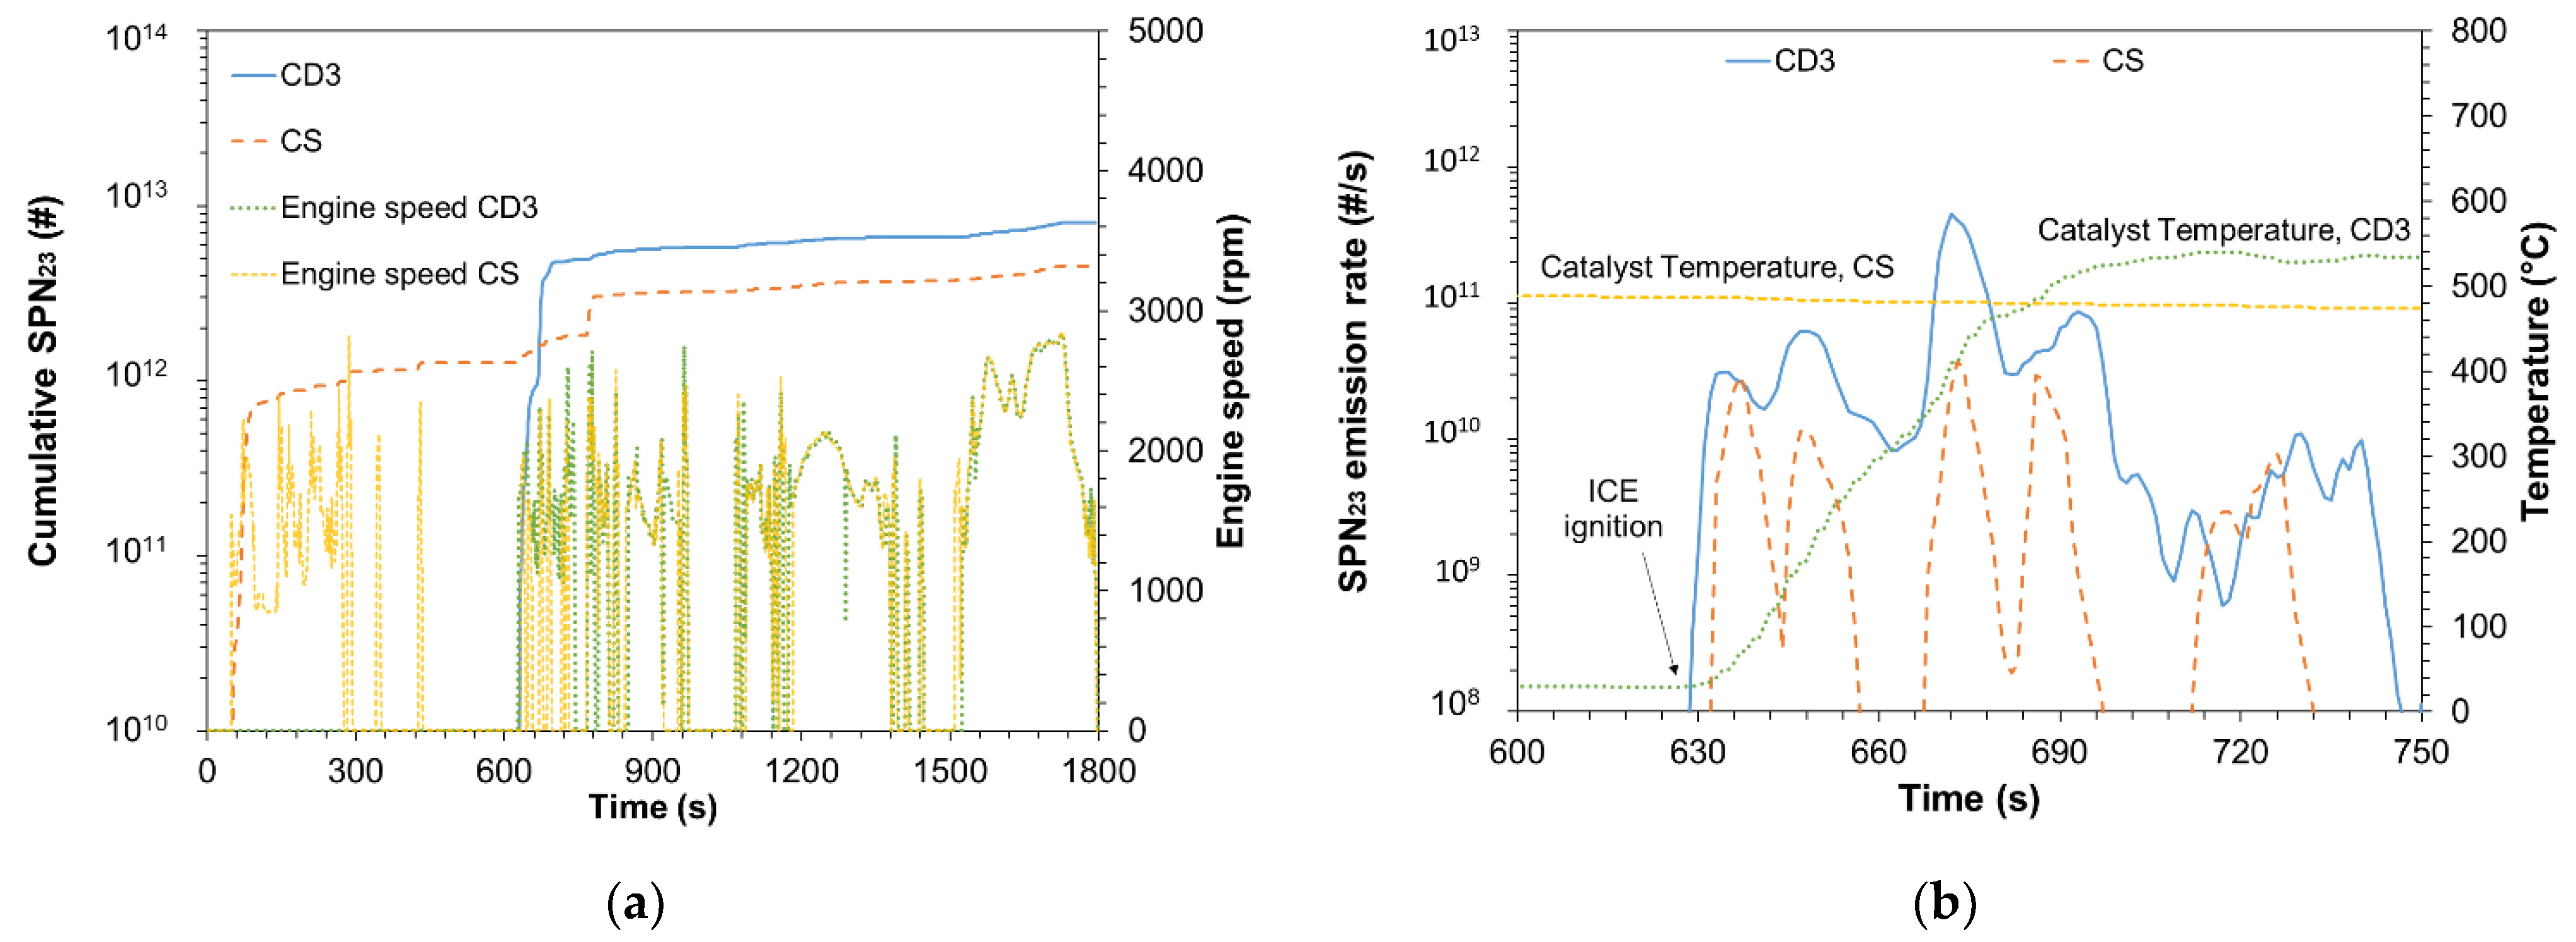
23 emissions of V2 during CD3 and CS, we plotted the cumulative SPN
23 emissions over time in
Figure 2a. We also plotted the ICE speed (rpm) during the two tests. During the CS, the ICE switched on a few seconds after the initiation of the cycle and powered the vehicle until ~300 s. Then, it remained off almost always until 635 s when it re-ignited. During the first 40 s after the ICE ignition, cumulative SPN
23 steeply increased up to ~7 × 10
11 # which corresponded to ~16% of the particles emitted during the entire cycle (4.5 × 10
12 #). After 40 s, the cumulative SPN
23 slope changed and it continuously increased during the test cycle.
During CD3, ICE switched on after ~630 s and powered the vehicle (as already reported above) for total ~880 s. Cumulative SPN23 steeply increased during the first 70 s after the cold start and ~4.8 × 10¹² # was emitted which corresponded to ~60% of the total cycle SPN23. Note that in the entire CS, the total SPN23 emitted was 4.5 × 10¹² #. In order to put this result in the right context, considering the limit of 6 × 10¹¹ #/km, the SPN23 during a WLTC could not overcome ~1.4 × 10¹³ #. Thus, V2 emitted ~32% of the maximum cumulative SPN23 (#) permitted during a WLTC in 70 s, covering a distance of 650 m. Whilst SPN23 emissions were below the regulation limits, their spatial distribution was non-uniform in this case.
Figure 2b plots the SPN
23 emission rate of V2 during CD3 and CS. We focus on the time frame in which the ICE ignited for the first time in CD3 and re-ignited in CS. We also plot the catalyst temperature which was obtained by the on-board diagnostics system. There was no information on the exact position of the temperature sensor (i.e., before or after the GPF); therefore, its signal was used as a qualitative indication of the exhaust after-treatment system (ATS) condition (cold or hot). As already mentioned, the ICE ignited after ~635 s. In CD3, the after-treatment and the ICE were cold, while in CS they were hot. The SPN
23 emission rate spikes in CD3 were even 10 times higher compared to CS. Considering that the test cycle was identical, the emission rate spike difference may be attributed to higher SPN
23 concentrations and not to significant exhaust flow differences (note that emission rate depends on the concentration and the exhaust flow).
3.2. Regulated On-Road Tests
On-road tests were performed according to the European RDE regulation, consolidated in 2017/1151. The vehicles were tested with different REESS SOCs, i.e., fully charged (CD100), 50% charged REESS (CD50), 25% charged REESS (CD25), and discharged REESS (CS). Soaking was performed in the laboratory at around 20 °C, while in one case for V1, soaking was performed outside at around 3 °C.
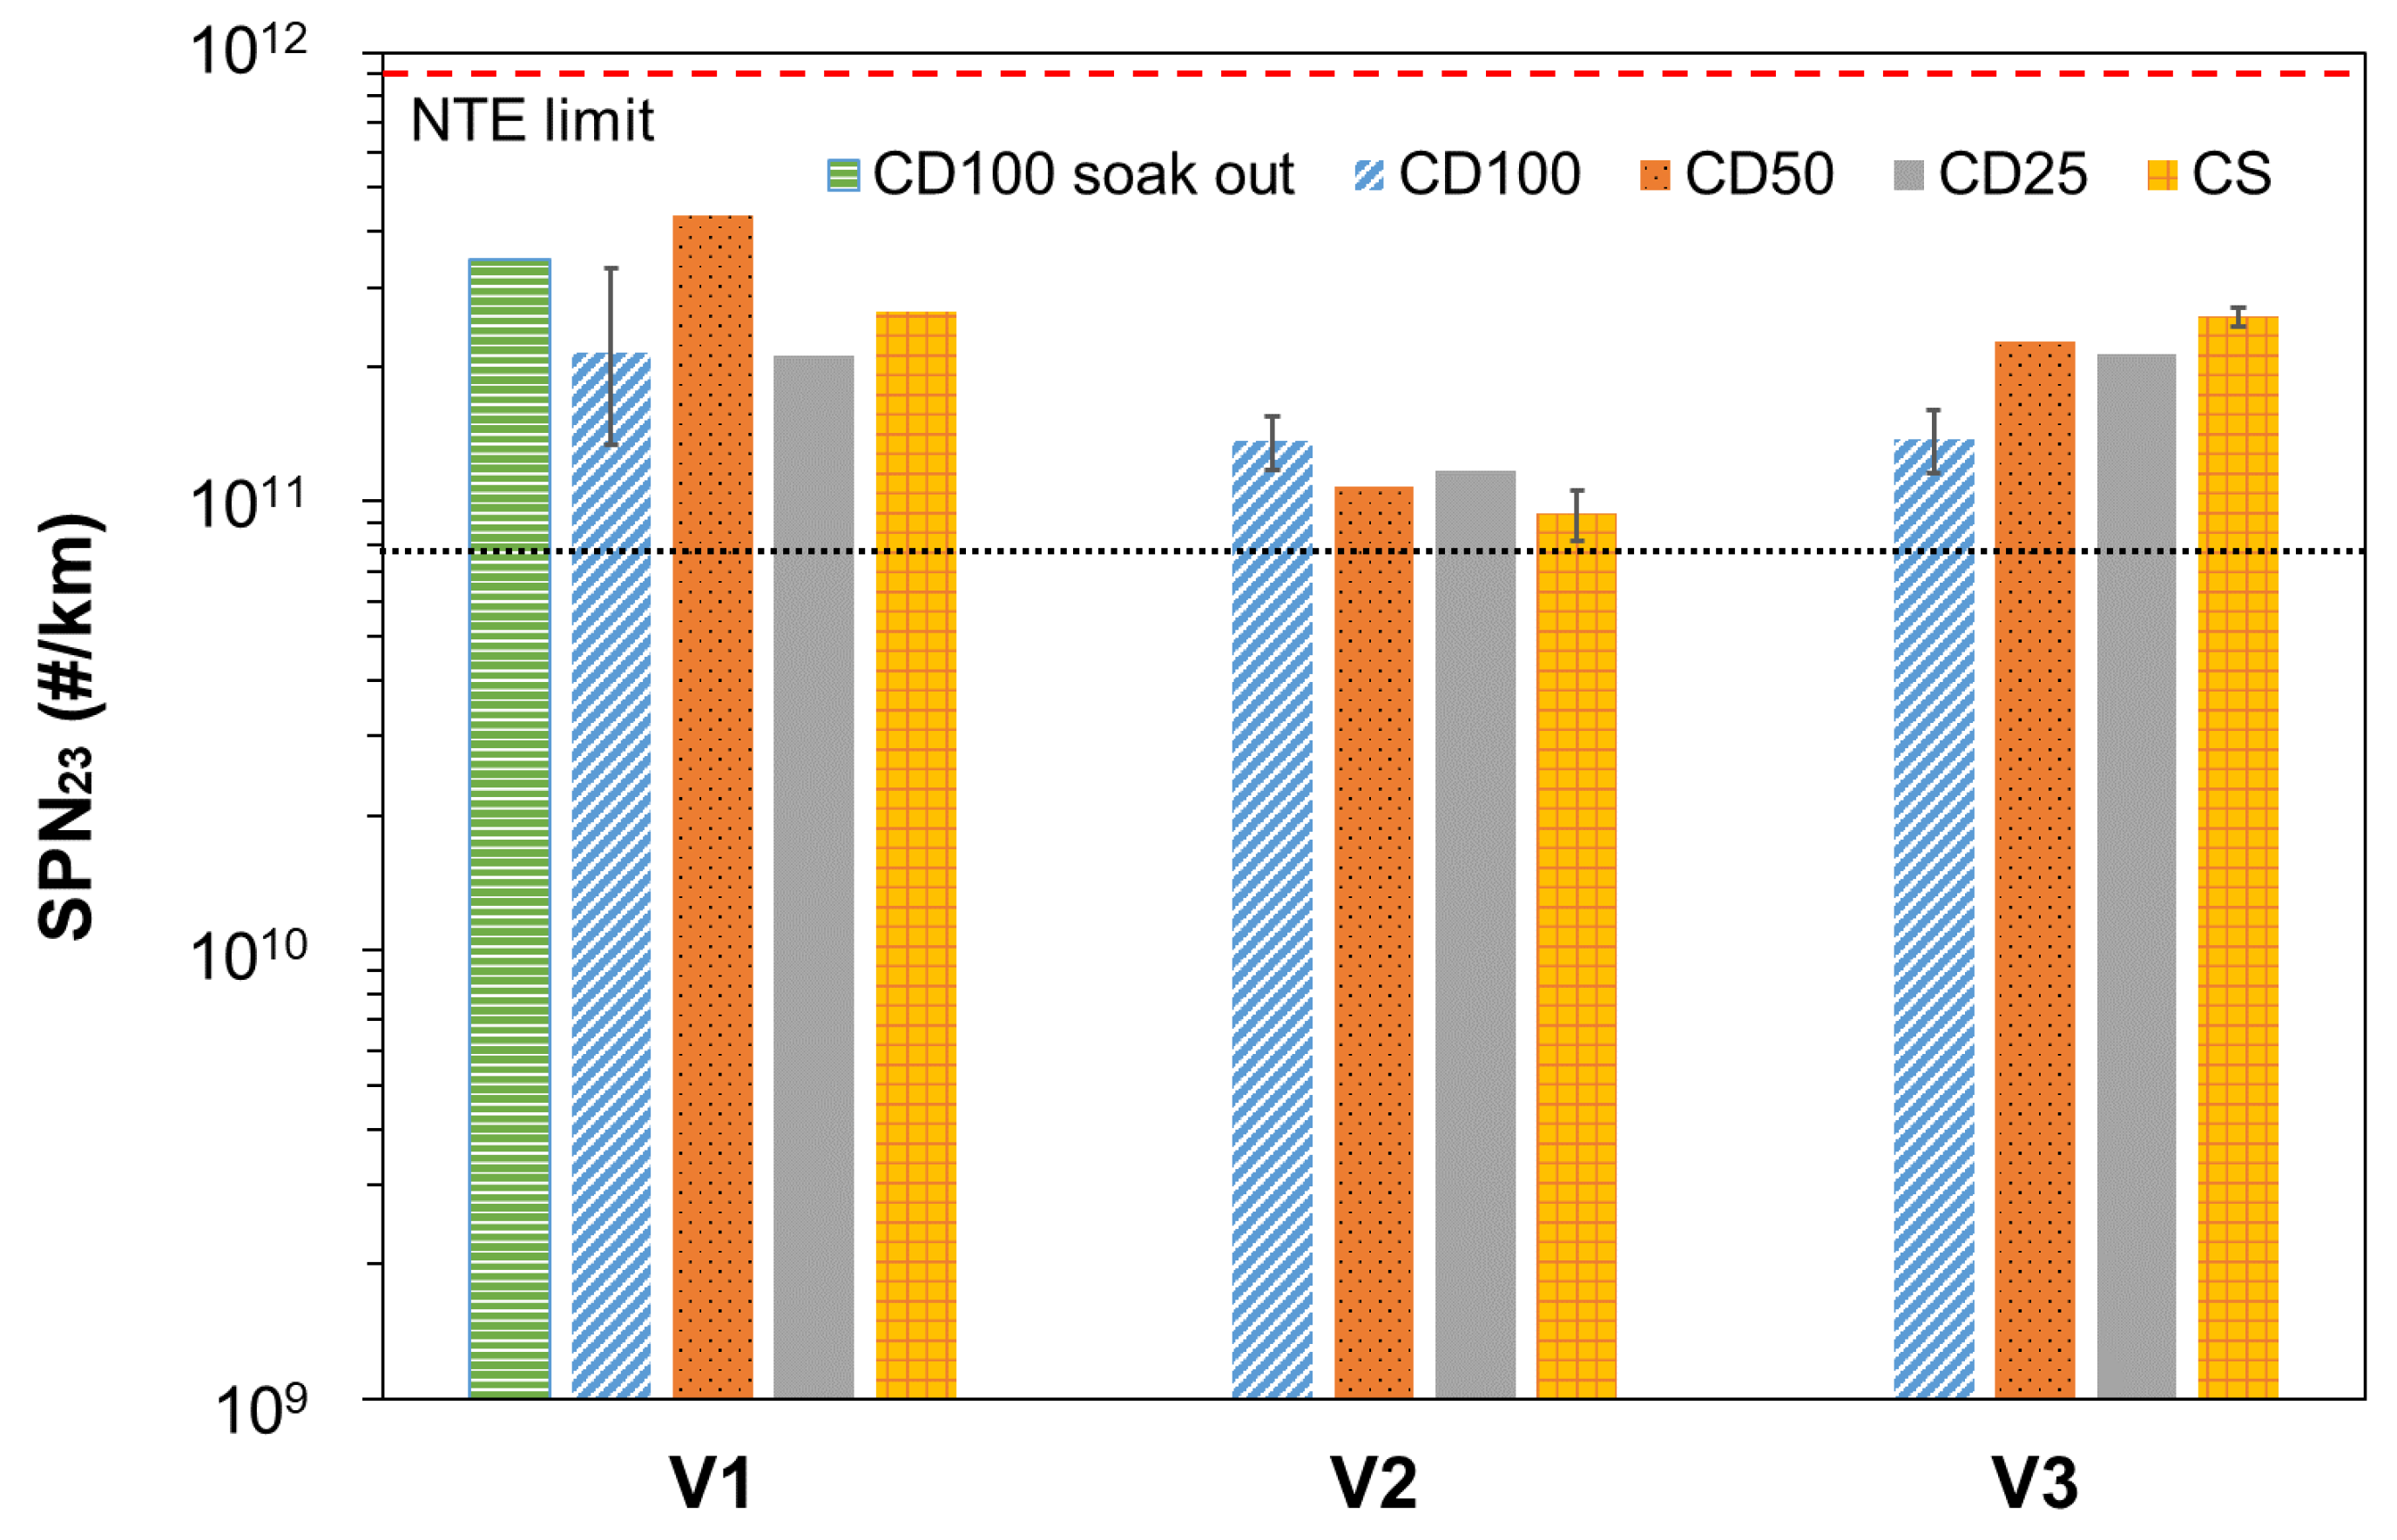
Figure 3 plots the SPN
23 (#/km) emissions during the entire trip that consisted of an urban, a rural, and a highway part (total distance around 91 km). The black dotted line indicates the average on-road SPN
23 emissions of all Euro 6d/6d-TEMP GDI vehicles (7.8 × 10
10 #/km) tested in the period 2020–2021 in the framework of JRC market surveillance activities [
34]. The red dashed line depicts the on-road NTE limit of 9 × 10
11 (#/km). Error bars show the maximum and minimum measured values for tests where more than one repetition was performed. All tests were performed with the default user-selectable mode, except for two tests of V1 (CD100 soak out and CD50) which were conducted with the user-selectable electric mode.
All vehicles under all conditions complied with the NTE limit, but in all cases SPN
23 emissions of the tested vehicles were higher than the average values observed for conventional vehicles. V1 emitted the highest SPN
23 (1.3 × 10
11–4.3 × 10
11 #/km), while V2 emitted the lowest (8.1 × 10
10–1.1 × 10
11 #/km). For V1, the test with the highest emissions was CD50, while for V3 the test with the highest emissions was CS. Interestingly, for V2, the test with the highest emissions was for fully charged REESS (CD100). Soaking out at an average ambient temperature of 3 °C resulted an increase in SPN
23 emissions. In summary, the particle emissions did not benefit from charged REESS, but in some cases the emissions were higher in this trip of ~91 km even with fully charged REESS. This finding is in agreement with previous studies [
26,
28] which found that the high-load cold-start emissions of PHEVs may dominate the total SPN
23 emissions.
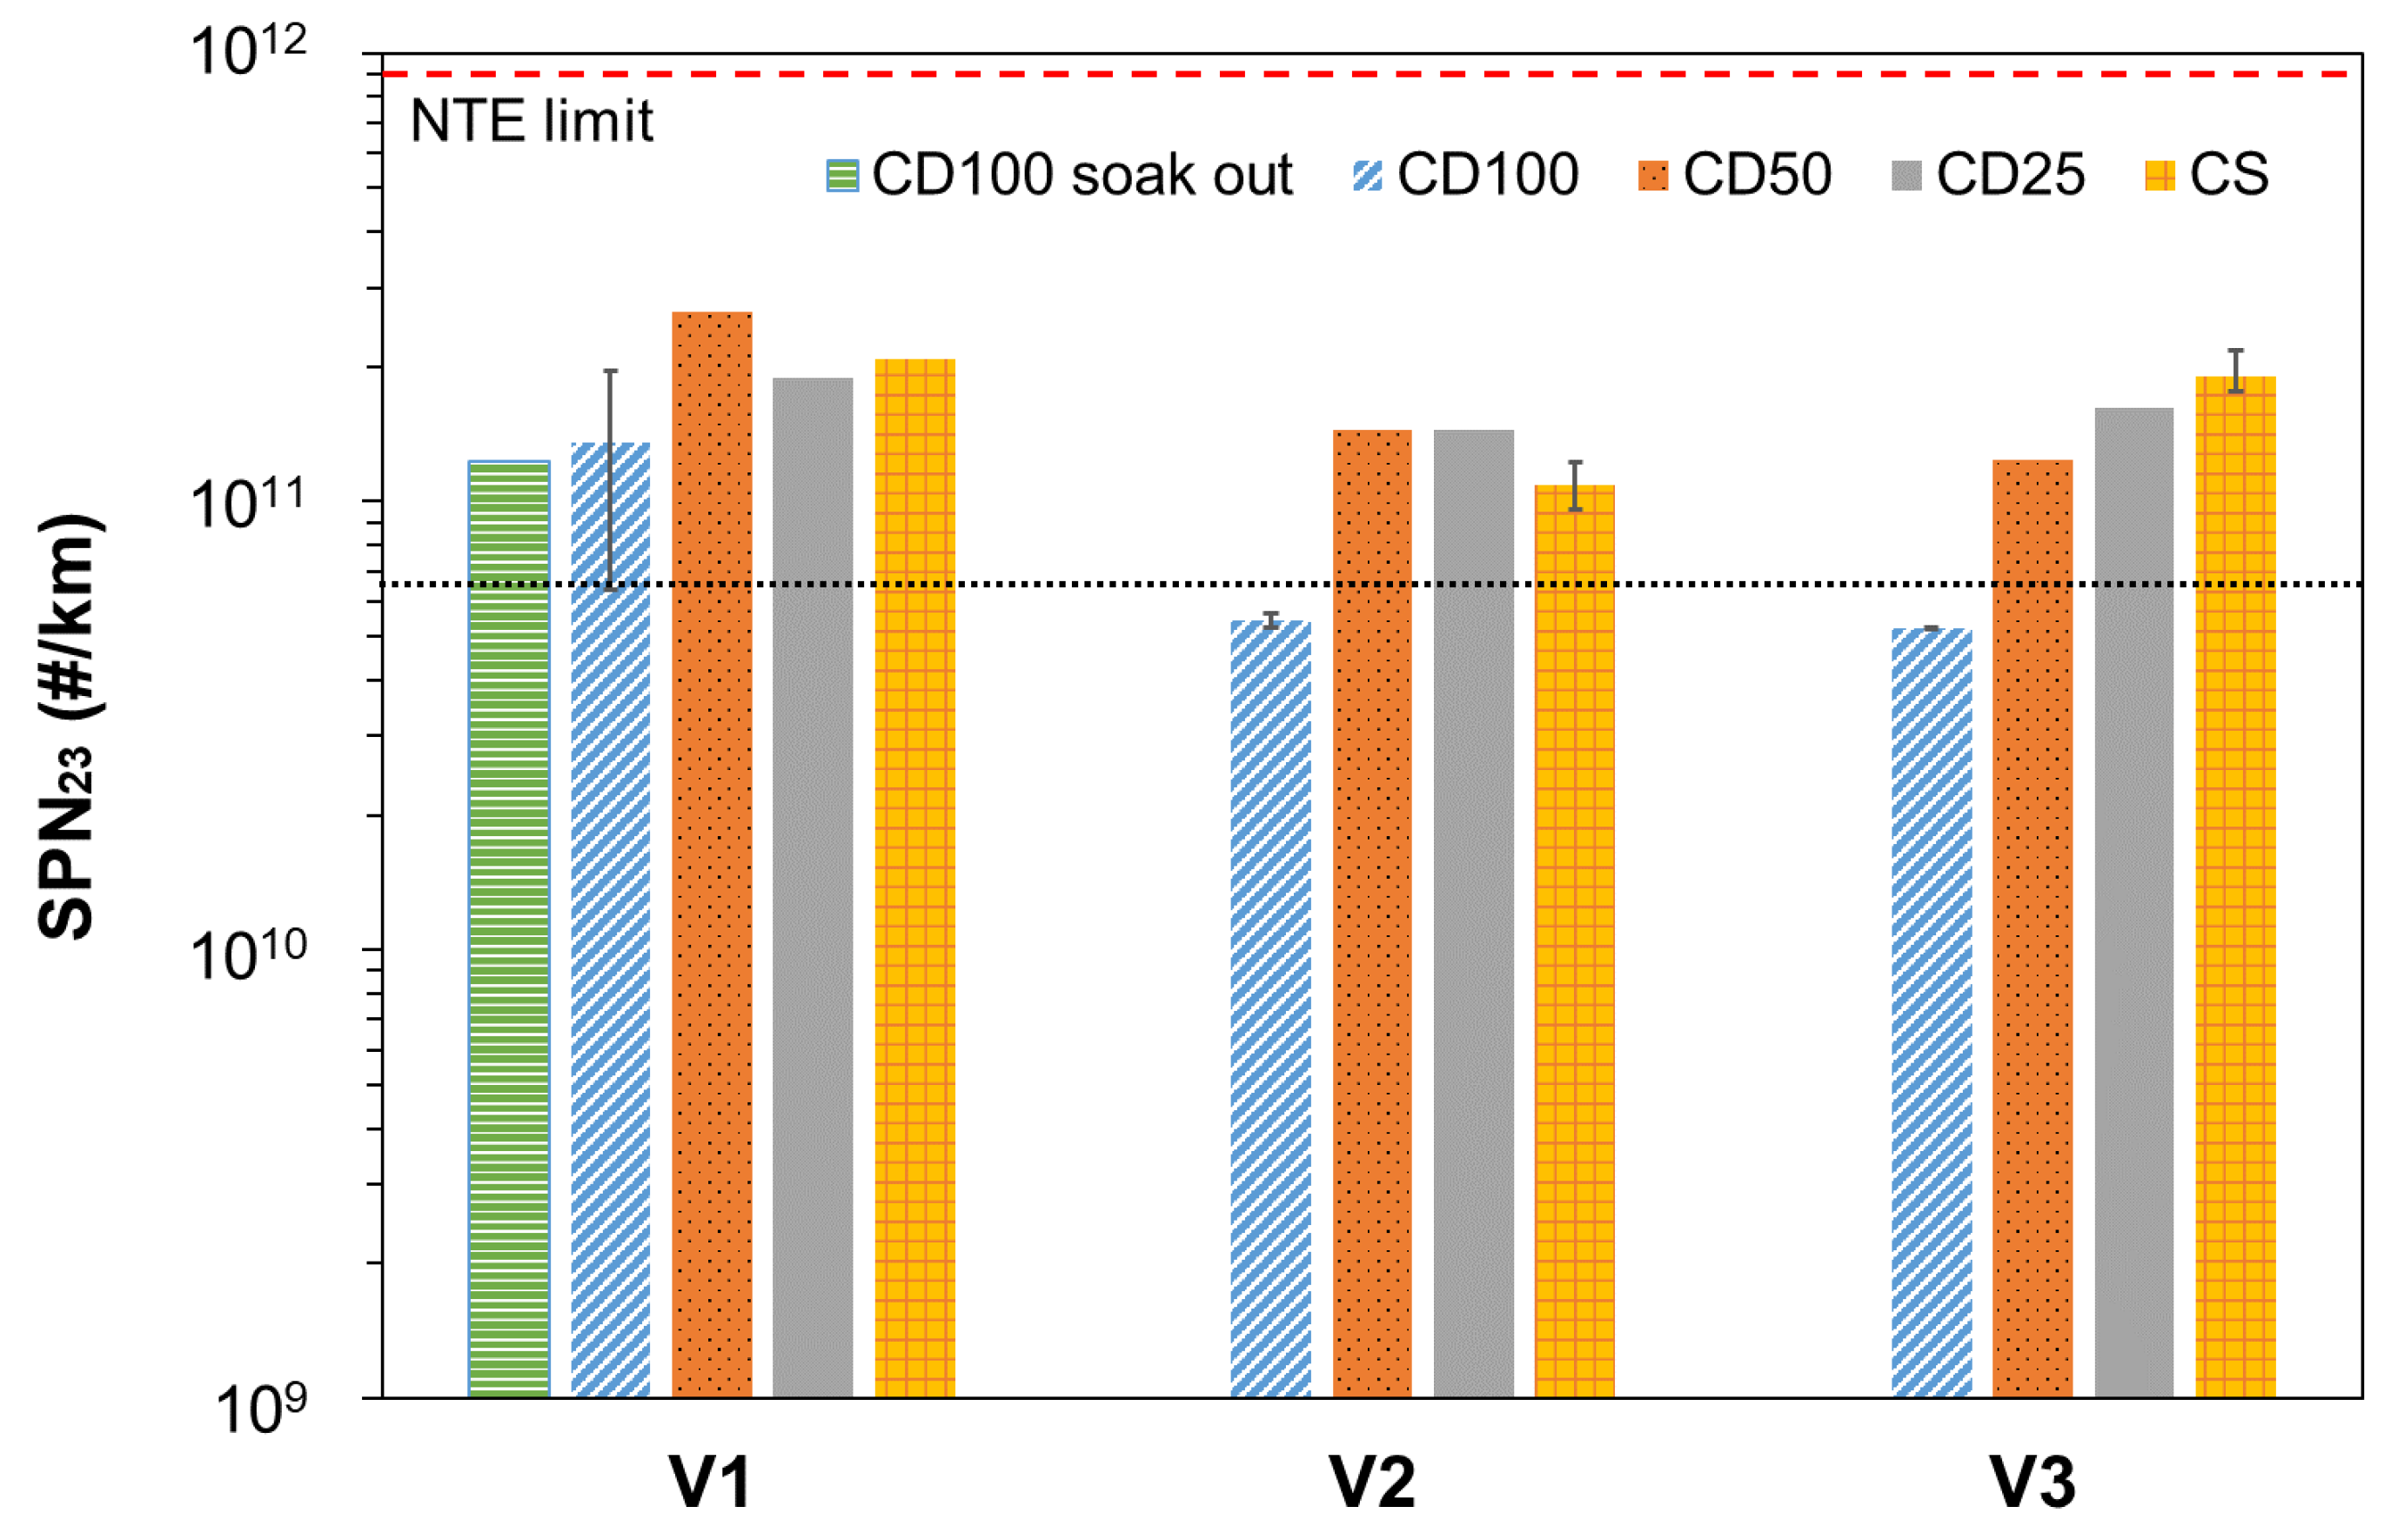
Figure 4 plots the SPN
23 emissions during the urban part of the trip (distance of approximately 35.5 km). Note that, according to RDE, the NTE limit also applies to the urban section (red dashed line). Similar to
Figure 1 and
Figure 3, the average values of conventional vehicles are plotted with a black dotted line (6.5 × 10
10 #/km). Also in this case all vehicles complied with the limits while only V2 and V3 with fully charged REESS emitted less than the conventional vehicles. For V3, as the REESS SOC decreased, the vehicle emitted more particles. In contrast, for V1 and V2, SPN
23 emissions varied and no relation with REESS SOC was found, except from CD100 where the emissions were lower than CD50, CD25, and CS. This is related to the fact that the electric range of the tested vehicles was higher than the distance travelled in the urban environment and the ICE was on only for short distances. It should be highlighted that even for short urban trips, shorter than the electric range of the vehicles, the ICE ignited producing a significant amount of particles.
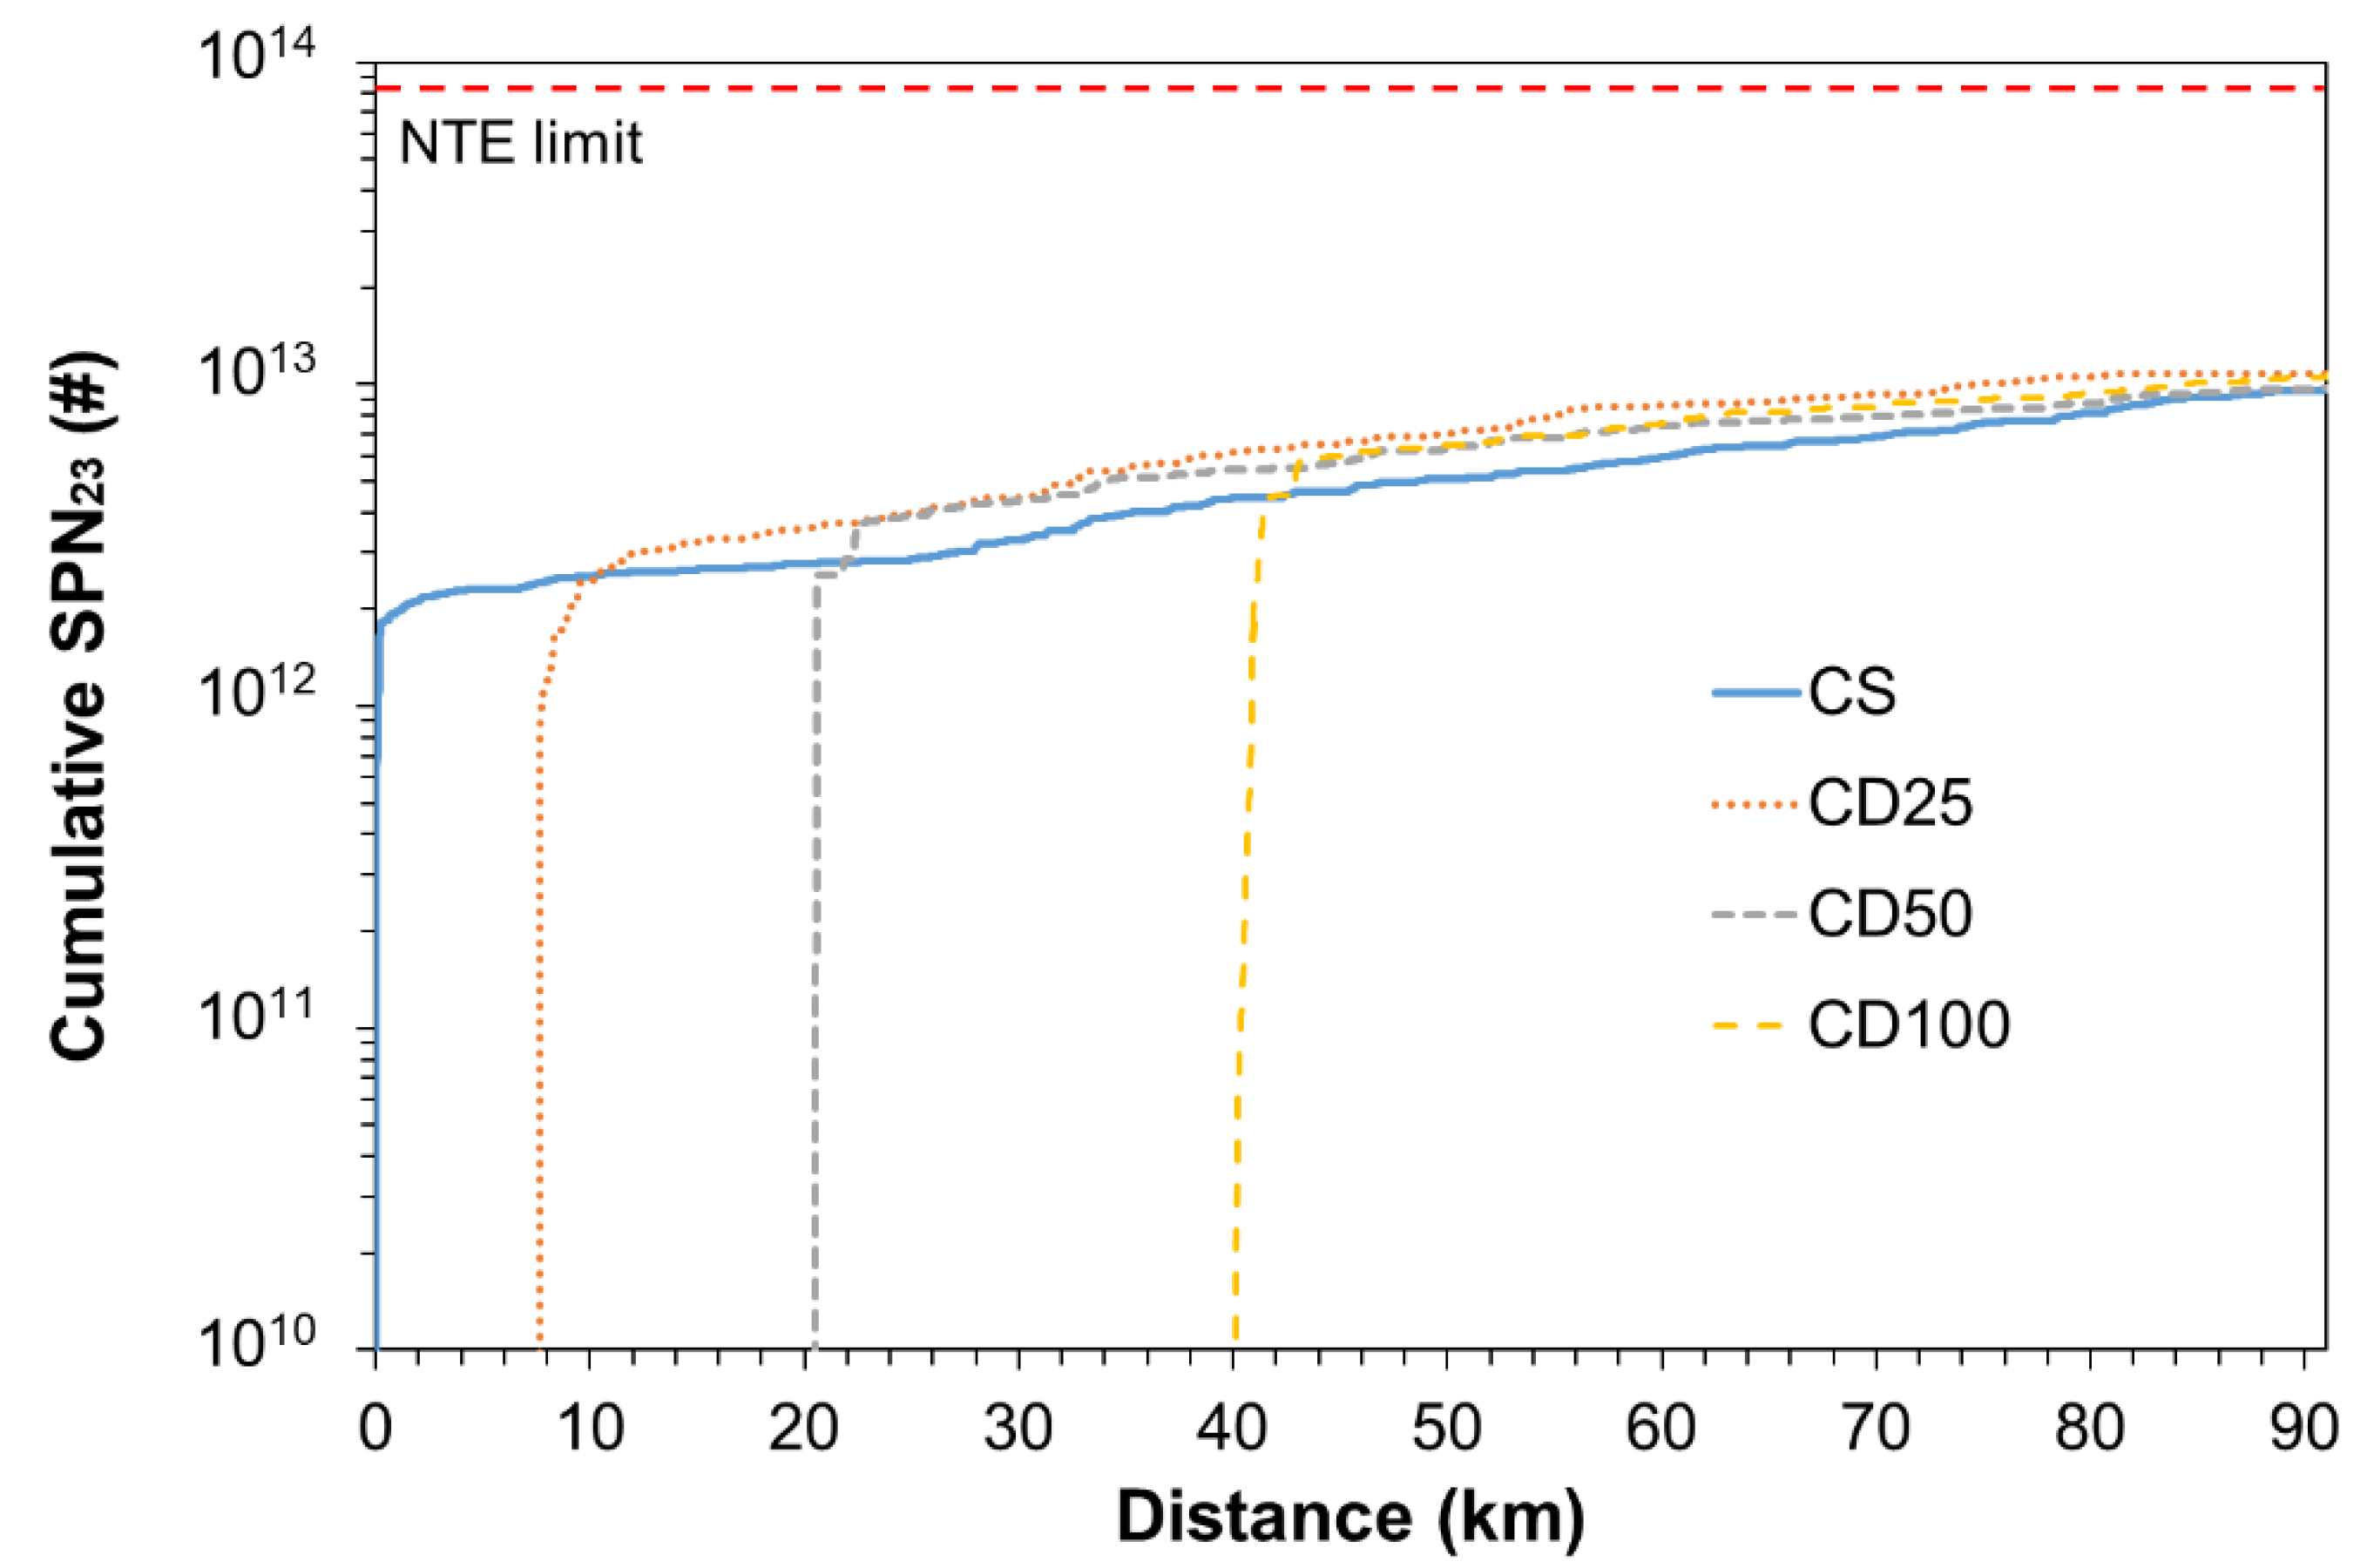
Next, we focus on the SPN
23 emissions of V2 presented in
Figure 3. As already discussed, with fully charged REESS, the vehicle emitted the highest SPN
23.
Figure 5 plots the cumulative SPN
23 emissions against distance. The red dashed line depicts the not-to-exceed cumulative SPN
23, according to the distance travelled by the vehicles. The tests CD100 and CS had two or more repetitions. In order to examine the best case scenario for the impact of cold-start emissions, we plotted the CD100 test with the lowest emissions and the CS with the highest emissions in
Figure 5. When the REESS was discharged, the ICE ignited at the beginning of the trip. The ICE ignition during the CD cycles occurred after ~8, ~21, and ~40 km for CD25, CD50, and CD100, respectively. In maximum 3 km after the ICE ignition, the same amount of cumulative SPN
23 was emitted as in the CS trip until this distance. During the first 1 km in CS, V2 emitted 19% of the total trip emissions, while in CD100 it emitted 22%. In all cases, except for CD25, during the first kilometer after the ICE cold start more than 2 × 10
12 # were emitted. The strong effect of the high-load cold start resulted in high particle concentration emissions. In the charge-depleting cycles, the maximum spike concentrations during cold start were 1.3 × 10
7 (#/cm
3), 1.5 × 10
7 (#/cm
3), and 1.7 × 10
7 (#/cm
3) for CD100, CD50, and CD25, respectively, while during the CS trip they were 5 × 10
6 (#/cm
3).
Another important aspect of on-road tests of PHEVs is the variability of SPN
23 emissions due to different REESS testing conditions. We calculated the coefficient of variation (i.e., the ratio of the standard deviation to the mean) of SPN
23 emissions considering the average emissions of each testing condition; CD100 (not soak out), CD50, CD25, CS. In overall, urban emissions exhibited highest variance especially for V2 (38%) and V3 (45%). For V1, also total SPN
23 emissions varied significantly and namely 37%. In a previous study, the variability of SPN
23 emissions emitted by a GDI engine under a simulated RDE trip (well-controlled conditions) was found to be 22% [
36]. The difference with our findings is small considering in our case the variability of traffic and ambient temperature conditions as well as the different conditions during the ICE ignition.
Table 3 summarizes the coefficient of variation of SPN
23 emissions under on-road tests performed in this study.
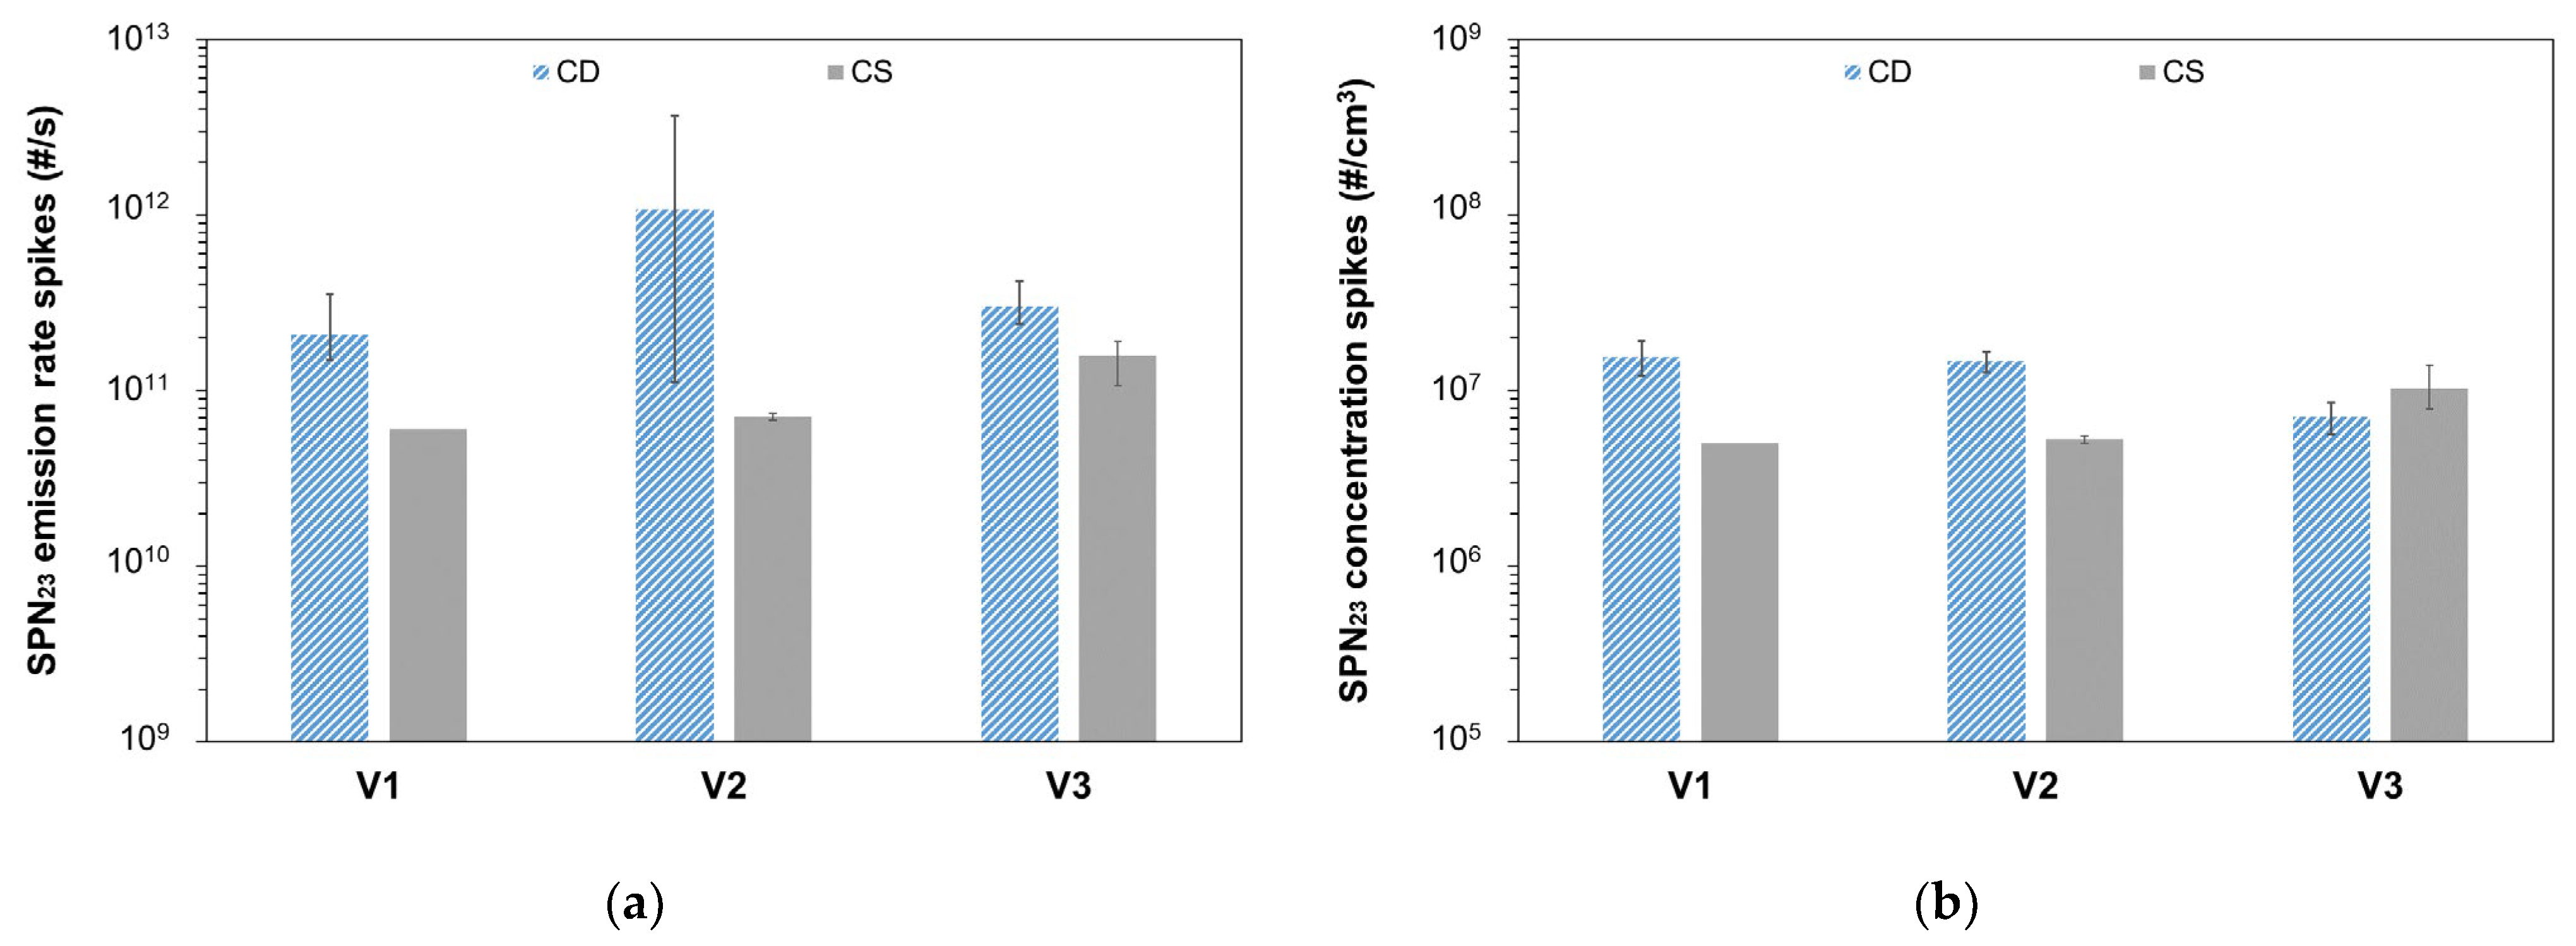
3.3. Emissions at Cold Engine Ignitions
The highest SPN
23 emission rate spike (#/s) during ICE cold start (considering the first ~30 s after the first ICE ignition) at each test was determined and then averaged over all charge-depleting and charge-sustaining on-road tests.
Figure 6a presents the average values for the tested vehicles and the error bars show the maximum and minimum value. Note that in ~65% of CD trips, the ICE ignited in the urban environment. SPN
23 emission rate spikes in CD were, on average, ~3.5, ~15, and ~2 times higher than in CS for V1, V2, and V3, respectively. In order to exclude the exhaust flow rate effect, we plot the average of the highest SPN
23 concentration (#/cm
3) spikes in
Figure 6b. For V1 and V2, the concentration spikes are approximately three times higher during CD trips compared to CS. Instead, for V3, the spikes during CS were approximately 1.5 times higher compared to CD and the cold-start effect during high load was smaller. Thus, for V1, higher SPN
23 emission rates were due to higher SPN
23 concentrations; for V2, it was a combination of exhaust flow and concentration; and for V3, it was due to higher exhaust flow rates. Note that the cold-start concentrations of PHEVs reached approximately 2 × 10
7 #/cm
3 and these high concentration levels should be taken into consideration when designing SPN
23 measurement instruments in order to ensure high accuracy and avoid the saturation of SPN detectors.
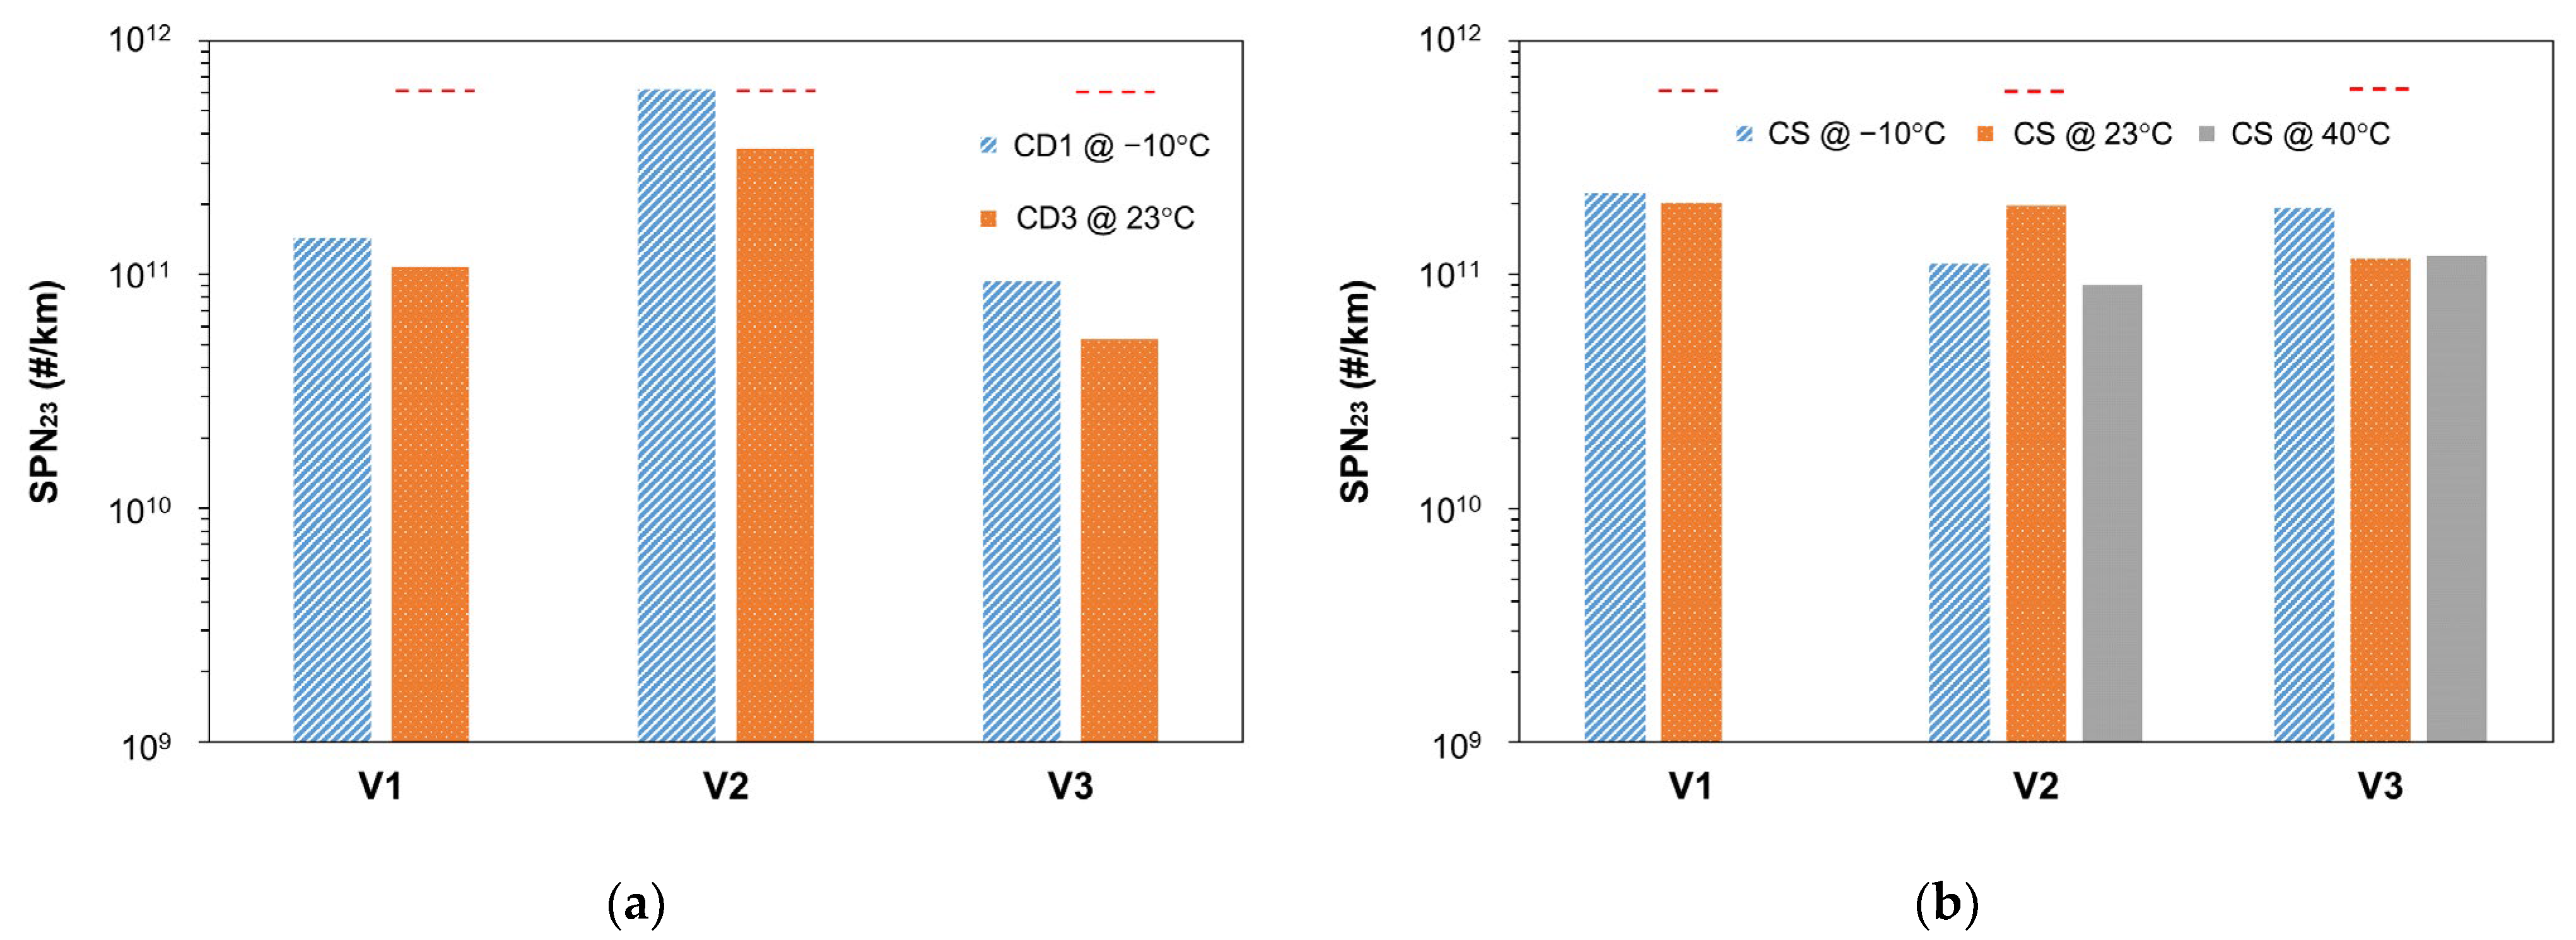
3.4. Temperature Effect
The WLTC CD and CS regulatory cycles were also performed at −10 °C. For V2 and V3, a high-temperature (40 °C) test was also done in CS. Note that these two temperatures were outside the boundaries of on-road testing and no SPN limit was applicable.
Figure 7a plots the SPN
23 (#/km) emissions during the CD cycle in which the ICE ignited for the first time and
Figure 7b plots emissions during the CS cycles. In both figures, the emissions at 23 °C were also plotted (presented in
Figure 1). The dashed red lines indicate the Euro 6 regulation limit at cycles in which it is applicable.
For all tested vehicles, at −10 °C and with fully charged REESS, the ICE ignited during the first CD cycle (CD1) and specifically at the beginning of the test. SPN23 emissions were higher compared to CD3 at 23 °C and specifically from ~30% for V1 to ~80% for V2. For V2, SPN23 at −10 °C was slightly higher than the limit (6.2 × 10¹¹ #/km). Although the limit does not apply at this extreme temperature, we should also consider that these SPN23 emissions corresponded to a fully charged PHEV.
For CS cycles, the temperature effect was not so clear. Indeed, for V2, the highest SPN
23 emissions were measured at 23 °C, while for V1 and V3 they were measured at −10 °C. At 40 °C, the SPN
23 emissions were lower (V2) or equal (V3) to 23 °C. In all cases, the SPN
23 emissions were below the emission limit which applies at 23 °C. This result is in agreement with a previous study that observed high GPF effectiveness at a temperature range from −30 °C to 50 °C [
21].
3.5. Sub-23 nm Particle Emissions
In addition to SPN
23, SPN
10 was also measured for V1 and V2 during laboratory tests at −10 °C and 23 °C.
Table 4 presents the SPN
23, SPN
10, and the sub-23 nm particles contribution calculated by (SPN
10 − SPN
23)/SPN
23. The sub-23 nm contribution was lower than 20% in all cases. GDI engines may emit particles from 10 to 40 nm, especially under high-load transients, but the introduction of GPFs can effectively reduce these small-size particles [
37]. In this study, the low sub-23 nm contribution may be attributed either to the efficiency of the GPFs and/or to the larger size of particles generated during the cold-start emissions which dominate the SPN of the entire test.
4. Conclusions
In this study, the SPN emissions of three PHEVs (V1 to V3) (electric range of 52–61 km), equipped with GDI engines, were studied in the laboratory and on-road. The laboratory test cycle was the regulated WLTC at different temperatures (−10 °C, 23 °C, and 40 °C), and also unregulated SPN10 was measured in some cases. On-road tests were performed according to the current RDE regulation (a total distance of ~90 km and an urban distance of ~35 km). The main focus was the effect of different REESS SOCs on the SPN23 emissions.
All vehicles complied with regulation limits, both in the laboratory and on-road, but their emissions compared to conventional vehicles equipped with GDI engines were either comparable or even higher in many cases. The rationale was that after the ignition of the ICE, any benefit, in terms of SPN emissions, from the electric motor operation was vanished in short periods (less than 70 s in one case) and driven distances (less than 1 km in one case). Even the weighted laboratory emissions calculated with utility factors applied for the weight of each testing cycle (larger weight to cycles with fully charged REESS) were higher than the average SPN23 of conventional vehicles for one of the tested vehicles of this study (V2). For on-road tests (a driven distance of ~90 km), the PHEVs emitted more SPN23 than the average of conventional GDIs, but exhibited better performance in terms of SPN23 for two out of three vehicles at urban environments when the REESS was fully charged. The variability of on-road SPN23 emissions was also studied for different REESS SOCs. For the total trip the variability ranged from 16% to 37% and in the urban section from 27% to 45%.
The effect of cold-engine starts on SPN23 emissions was investigated. In the laboratory, the SPN23 emission rate spikes (in #/s) during an ICE ignition at high load were approximately ten times higher at cold-start compared to hot-start under identical driving conditions. For on-road tests, the highest SPN23 emission rate spike after the first ICE ignition (considering the first 30 s) was determined and averaged for charge-depleting and charge-sustaining trips. It was shown that when the first ignition occurs during the trip, the cold-start SPN23 emission rate spikes can be 2 to 15 times higher than the spikes in charge-sustaining REESS where the engine ignites at the beginning of the trip. This difference was due to higher SPN23 concentrations (in #/cm3) but also exhaust flow rates. For V1, the average cold-start emission rate spike differences between CD and CS trips were similar to cold-start SPN23 concentration spike differences and approximately three times higher in CD compared to CS. For V2, both the exhaust flow rate (approximately five times higher in CD cold start) and SPN23 concentrations (approximately three times higher in CD cold start) contributed to the 15-times-higher cold-start emission rate differences. For V3, the higher exhaust flow rate was mainly responsible for the SPN23 emission rate differences, as SPN23 concentration spikes were higher during cold start at CS on-road tests. The impact of the cold-start emissions was also supported by the contribution of 22% to total emissions in a trip with fully charged REESS. Cumulative cold-start emissions of V2 in the first km after the ICE ignition were >2 × 10¹² #. Considering that approximately 65% of the cold starts occurred in the urban environment, special attention should be given to these high emission rates due to the highly non-uniform spatial distribution of PHEV SPN emissions. These results highlight the need for improvements in the combustion process during frequent cold starts or the implementation of high filtration efficiency filters at hybrid vehicles.
Low temperatures had a significant impact on the REESS operation. Specifically, even with fully charged REESS at −10 °C, the ICE ignited and emissions were 30% to 80% more than during the first charge-depleting cycle at 23 °C when the ICE ignited. In charge-sustaining cycles, the temperature did not have a strong effect. Finally, the sub-23 nm particles emitted by V1 and V2 were measured during laboratory tests (23 °C and −10 °C) and their contribution to SPN was low (<20% in all cases).


 ,
, 


