
Experimental Comparison of Hub- and Roller-Type Chassis Dynamometers for Vehicle Exhaust Emissions
by
Barouch Giechaskiel
1,*, 
Fabrizio Forloni
1,
Marcos Otura
1,
Christian Engström
2 and
Per Öberg
2 1
European Commission, Joint Research Centre (JRC), 21027 Ispra, Italy
2
Rototest Europe, SE-144 40 Rönninge, Sweden
*
Author to whom correspondence should be addressed.
Energies 2022, 15(7), 2402; https://doi.org/10.3390/en15072402
Submission received: 21 February 2022
/
Revised: 17 March 2022
/
Accepted: 20 March 2022
/
Published: 24 March 2022
(This article belongs to the Special Issue Advanced Engine and Vehicle Control Energy Management and Combustion Technologies)
Abstract
:The emissions of vehicles are measured in laboratories with roller-type chassis dynamometers, which simulate road driving resistances. Hub-coupled dynamometers, which are not included in the regulations for emission measurements, are commonly used for research and development purposes, for example, to assess powertrain capabilities, simulate on-road trips, and calibrate the control of individual wheels. As they do not need particular infrastructure and offer a wider range of applications, they could be a more economical alternative, especially if they could also be used for emission measurements for the type approval of vehicles. Nevertheless, the two types have not been directly compared in the literature, and, thus, their equivalency, especially regarding emission measurements, is not known. In this study, the emissions of a diesel and a gasoline plug-in vehicle were compared using the same analytical equipment and by switching only the roller and hub dynamometers. The diesel vehicle was further tested on a second roller-type dynamometer with the same driver and a second driver. The results of the two dynamometer types were very close, even though the repeatability of the measurements was very narrow. The main message of this work is that hub-type dynamometers can be used interchangeably with roller-type dynamometers. The points that need to be addressed, such as the determination of dynamic wheel radius and tire slip level, are also discussed.
1. Introduction
A dynamometer (or dyno) measures the torque and rotational speed (rev/s) of an engine so that its instantaneous power may be calculated. An engine dynamometer measures power and torque directly from the engine’s crankshaft (or flywheel). It is a regulated methodology for heavy-duty engine applications; nevertheless, a lot of research for light-duty engine calibration is also carried out in engine test cells. To test the whole powertrain of a vehicle, “chassis” (i.e., vehicle) dynamometers are used, which measure the power delivered to the surface of the roller by the drive wheels. The roller(s) act as the interface (road surface) between the vehicle and dynamometer(s). An optical encoder mounted on the roller monitors the speed of the dynamometer for control and supervision. Load cells between the base frame and the motor or the brake absorber measure the load, which is converted to tractive force on the surface of the rollers [1].
The light-duty regulation requires the measurement of vehicle emissions using chassis dynamometers with rollers and appropriate analytical systems (e.g., dilution tunnel and gas analyzers) [2]. Based on this methodology and the appropriate selection of test cycles, the emissions of a wide range of vehicles fulfilling various emission standards have been assessed [3,4,5,6,7,8]. Other types of chassis dynamometers are available that attach directly to a vehicle’s hubs for direct torque measurement from the axle. The application of chassis dynamometers is very wide, including, among others, mileage accumulation facilities; anechoic chambers; noise, vibration, and harshness (NVH) or electromagnetic compatibility (EMC) chambers; wind tunnels; and climatic chambers. Typically, in the regulations and in research, chassis dynamometers only refer to the roller type. Here, in order to avoid confusion, the terms roller-type and hub-type dynamometers are used, while the standalone term “chassis dynamometer” is avoided.
Hub-type dynamometers can be used for the same applications that the roller-type dynamometers are used (e.g., mileage accumulation, climatic tests, and NVH). Other applications include engine mapping and vibration testing, as well as applications with steering of the wheel [9]. Hub-type dynamometers utilize an above-ground installation; thus, the test cell only requires a flat floor and no basement. Consequently, hub-type dynamometers have lower infrastructural demands than the roller-type one, and they have the potential to provide a lower total cost. With a hub coupling, no slippage can occur. This enables tests requiring high torque conditions to be conducted, such as full load on low gears. Furthermore, as the road surface is simulated, it allows mixed friction road conditions, such as ice and snow, to be simulated, as well as tire grip changing vehicle dynamics, such as longitudinal and lateral load transfers. Hub-type dynamometers are also used for emission measurements [10], but they are not included in the current vehicle emission regulations for the type approval of vehicles.
Comparisons between roller-type dynamometers are very common, and many inter-laboratory studies have been published [11,12,13,14]. However, comparisons of roller- and hub-type dynamometers are scarce. The authors are aware of only one presentation where the two types of dynamometers, installed in different laboratories, were compared measuring the emissions of the same vehicle [15]. It is well known that many parameters can influence the emissions of a vehicle: road loads [16], cooling fans [17], vehicle pre-conditioning [18], and emission analyzers [19]. There were some differences, but it was not possible to identify whether they were due to the vehicle’s emission variability, the analytical systems in the two laboratories, or the dynamometers. To the best of the authors’ knowledge, there is no study where the two dynamometer types have been compared using the same analytical equipment.
The objective of this paper is to compare the emissions of two vehicles using the two dynamometer types in the same facility and in different facilities with the same driver or different drivers. Using the same facilities (i.e., cooling fan, analyzers, and automation system) and driver, the impact of the dynamometer can be isolated, while with the use of different facilities, the other influencing parameters are included, and the results can be put into perspective.
2. Materials and Methods
2.1. Main Facilities
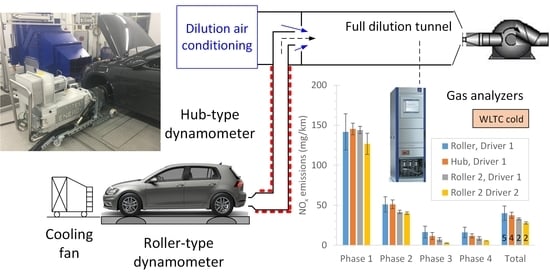
The core experiments were conducted at the vehicle emissions laboratories (VELA 8) of the Joint Research Centre (JRC) of the European Commission (Figure 1). The samples were taken from a dilution tunnel where the whole exhaust gas was diluted (i) in real time and (ii) at the end of the test from bags that were filled during the test. Regulated gaseous emissions were analyzed by sampling diluted exhaust from a set of Tedlar bags using an integrated setup that included non-dispersive infrared (for CO and CO2), a chemiluminescence detector (for NOx), and a heated (191 °C) flame ionization detector (for total hydrocarbons) (AVL AMA i60). The solid particle number (SPN) emissions were measured from the full dilution tunnel with a particle counter (AVL APC 489).
The uncertainty of the gas analyzers was around 2%, with another 2% from the gas cylinders that were used for calibration [19]. The flow of the dilution tunnel also had around 2% uncertainty. According to the error propagation rule, the expected uncertainty was around 3.5%. This was valid for concentration levels higher than the detection limit of the analyzers (e.g., CO2). When the concentrations were at the detection limit of the analyzers (typically 1–2 ppm), the uncertainty was much higher in relative terms (see, e.g., the discussion in [19]). The uncertainty of the particle number counter was around 15% [20].
2.2. Dynamometers
The roller-type dynamometer system was set in four-wheel driving (4WD) mode, i.e., simulated inertia and road load on both axles of the test vehicle. A cooling fan in front of the vehicle cooled the vehicle engine following the speed trace. Note that the cooling fan was not simulating the air drag force but that it was there to provide representative cooling at the engine and the aftertreatment devices. The vehicle remained in the laboratory during the whole testing period (i.e., no other cars were tested in between) in order to improve the repeatability.
The setup was identical when the hub-type dynamometer system was used in order to minimize any factors that could influence the results (see, e.g., the discussion in [21]). Four hub-type dynamometers were brought inside the climatic chamber, and they were connected to the wheel hubs with adapter plates after removing the wheels. During the hub-type dynamometer tests, the covers of the roller-type dynamometers were kept closed. The (in-house) automation system controlling the laboratory systems (cooling fan, driver’s aid, dynamometer, dilution tunnel, analyzers) had to be slightly modified to achieve this change, but, nevertheless, all functionalities were kept identical. For example, the hub-type dynamometer system had to implement the AK protocol of the roller-type dynamometers, and they were controlled by the automation system. To provide a swift and easy commissioning and decommissioning (2 days) of the hub-type dynamometer system, it was connected with a reduced mains supply at 4 × 125 A, 400 VAC (voltage in alternating current) for the four motors. The characteristics of the two dynamometers are summarized in Table 1. While the hub-type dynamometer could also simulate the longitudinal load transfer during acceleration and braking, it was decided to disable this degree of simulation during the comparison, as this characteristic is not physically available on roller-type dynamometers.
Neglecting any road gradients, the force F (N) required to drive the vehicle is [22,23]
where TM is the test mass (kg); mr (kg) is the rotational mass; a is the acceleration (m/s2); and f0 (N), f1 (N/km/h), and f2 (N/(km/h)2) are the road load parameters determined by the coastdown procedure [24]. The coastdown procedure consists of reaching a high speed and then coasting (decelerating) to a low speed with the powertrain (clutch) disengaged and transmission in neutral in order to calculate the road load parameters from Equation (1). The roller-type dynamometer applies the appropriate torque MR (Nm) based on the following equation:
where R (m) is the roller diameter, while the torque that needs to be applied by the hub-type dynamometer on the wheel MH (Nm) is calculated as follows:
where rd is the wheel (tire) dynamic radius (m). As hub-type dynamometers do not use a roller surface to define the vehicle speed, the equivalent vehicle speed can be calculated by the following equation [25,26]:
where v is the (actual) vehicle speed (km/h), n is the individually measured wheel rotational speed (rev/s), and s is the tire longitudinal slip (-). In order to have conditions as similar as possible to those of the roller dynamometer, the dynamic radius and the force-slip relationship should be determined on the roller dynamometer. The dynamic radius was determined with a constant speed test on the roller dynamometer, and the tire slippage (as a function of force) was determined by applying positive and negative torque (using the accelerator and brake pedal) while the dynamometer kept the speed constant. As the objective of this study was to compare the two dynamometer types and minimize any impact of the vehicle, the actual rotational mass of the test vehicle’s wheel was determined and compensated for.
F = f0 + f1 · v + f2 · v2 + (TM + mr) · a,
F = MR/R,
F = MH/rd,
v = rd (2 · π · n)/(1 − s),
2.3. Vehicles
The manual transmission vehicle had a 2019 Euro 6d-temp 1.6 L diesel-fueled engine with 85 kW max power. The aftertreatment consisted of a diesel oxidation catalyst (DOC), a diesel particulate filter (DPF), and a selective catalytic reduction (SCR) for NOx. The vehicle was one axle powered (front wheel driven). The test mass (TM) was 1445 kg, and the road load parameters were f0 = 90.7 N, f1 = 0.655 N/(km/h), and f2 = 0.03105 N/(km/h)2. The rotational mass mr was calculated to be 41.4 kg. Thus, for the force calculation during coastdown, a total mass of 1486.4 kg was used (for both dynamometer types), while for the testing, the dynamometers’ inertia was set as 1445 kg, as both dynamometers were used in 4WD operation. This option was selected because it is closer to road application. The actual rotational mass of the wheels was determined to be 38.4 kg, which was applied to the hub-type dynamometer for the actual testing (for the reason stated above). On the roller dynamometer, the wheels are physically present, and this rotational mass is actually present.
Before the diesel vehicle, an automatic transmission 2016 Euro 6b plug-in hybrid vehicle was tested, with a 1.5 L gasoline direct injection engine and 100 kW max power. The test mass (TM) was 1937 kg, and the road load parameters were f0 = 171.4 N, f1 = 0.109 N/(km/h), and f2 = 0.0386 N/(km/h)2. The rotational mass mr was set to 41.4 kg. Both dynamometers were used in 4WD operation. The vehicle was tested with its high-voltage battery empty (i.e., charge-sustaining mode).
2.4. Test Cycles
The worldwide harmonized light vehicles test cycle (WLTC) and reference fuel with 7% biofuel (B7) were used for all tests. The test cell temperature was 23 °C in all tests. A protocol as similar as possible was followed for both dynamometers in order to minimize any effect of temperatures and preconditioning on CO2 and the pollutants [21,27]. The protocol included cold-start (i.e., oil temperature at room temperature) and hot-start WLTCs (oil temperature > 85 °C). As a final test, a steady-speed ramp test was conducted (50-90-120-90-50 km/h) in order to identify any possible differences or non-linearity issues at the levels of emissions. The 12 V vehicle battery was charged during the soaking period before the cold-start WLTCs. The same person drove all cycles with both dynamometers. The driver also practiced before the roller testing and the hub testing in order to minimize any driving errors. Typically, four repetitions were conducted for each cycle.
2.5. Additional Roller-Type Dynamometer
To put into perspective any differences between the two dynamometers, the diesel vehicle was tested on a second roller-type dynamometer (VELA 2) with the same driver and a second driver (Table 1). Due to time restrictions, only two repetitions were conducted for the cold-start WLTC and one for the hot-start WLTC. VELA 2 had a Maha (AIP) roller dynamometer and Horiba MEXA 7400 gas analyzers (measuring with the same principle of operation as the AMA i60 of VELA 8).
The plug-in gasoline vehicle was not tested on the second roller-type dynamometer. As shown, due to the variability in the state of charge (SOC) of the high-voltage battery, the emissions had too high a variability to make any meaningful comparisons.
2.6. Calculations
The pollutant emissions were given by the automation systems of VELA 8 and VELA 2 (in g/km) considering the covered roller surface distance. For the hub-type dynamometer, the distance was given by the integration of the modeled road speed of the vehicle (as no wheels were present and, hence, no surface). For CO2, battery charge balance (RCB) and speed–distance corrections were applied. The RCB corrections were very small (for the diesel vehicle), because all cold-start tests started with a fully charged 12V battery. Furthermore, indexes such as the inertial work rating (IWR) (%) and the root mean square speed error (RMSSE) (km/h) were calculated to obtain an estimate of the driving behavior. Details for the calculations can be found in SAE J2951 (drive quality evaluation for chassis dynamometer testing) [28].
3. Results
The results of the tests are presented in the following sections, focusing on CO2 and NOx for the diesel vehicle because the other pollutant emissions were very low. Only the WLTCs are presented because there were enough repetitions and they were tested in all laboratories. The steady-state tests can be found in Appendix A.
The plug-in hybrid had very high variability due to small differences in the state of charge (SOC) of the high-voltage battery. This resulted in high variability in the emissions, and it made all results statistically equivalent. With such a high variability, it was not possible to quantify the impact of the two dynamometer types on the emissions. For this reason, the results are not presented in as much detail as those of the diesel vehicle. The results can be found in Appendix B.
3.1. Drive Indexes
Table 2 summarizes the distances covered with the hub- and roller-type dynamometers for the cold-start and hot-start WLTCs. The results regarding the second roller-type dynamometer with the same driver and a second driver are also included. The distances should match the reference distance, but small deviations occurred due to small deviations from the speed pattern. For both roller- and hub-type dynamometers, the covered distance was slightly less than the reference distance, which had to do with driving style. On the second roller-type dynamometer, the covered distance was closer to the reference distance for both drivers. Nevertheless, the differences were within a few meters, and the actual covered distance was taken into account in the final emission results. It should be emphasized that, for the hub-type dynamometer, any error in the determination of wheel radius (and tire slip) will impact the engine operation point only. As the distance is derived from vehicle speed integration, which, in turn, is controlled by the driver (following a speed trace); an error in radius (or slip level) has no impact on the driven distance.
The speed trace tolerances, which were not shown to the driver, are ±2 km/h within ±1 s of the given point in time. Speed tolerances can be exceeded up to 1 s on any one occasion, with a maximum of ten such deviations per test cycle. Table 3 summarizes the speed tolerance violations for the roller- and hub-type dynamometers. Driver 2 (D2) on Roller 2 had no violation, even though there was no practice with the specific vehicle. This was due to the many years of driving experience with this specific roller-type dynamometer. Driver 1 had higher violations on Roller 2 because their experience with that roller dynamometer was limited (the driver aid, as well as how the speed trace was depicted on the screen, was different compared to the driver aid of Roller 1). The violations between hub- and roller-type dynamometers were similar.
The other driving indexes are the RMSSE, with a 1.3 km/h limit, and the IWR, with a 4% limit (see Section 2.6). Table 4 summarizes the IWR indexes for the roller- and hub-type dynamometers. The values were below the limit (which is applicable for the whole cycle only), with a trend of lower values for the hub-type dynamometer. This shows that driving on the hub-type dynamometer was at least similar to driving on the roller-type, without creating any particular difficulties for the driver.
3.2. Real-Time Concentrations
Figure 2a presents all speed signals (in 10 Hz) recorded for both dynamometer types. The signals are almost indistinguishable. This was expected based on the integrated distances and the indexes.
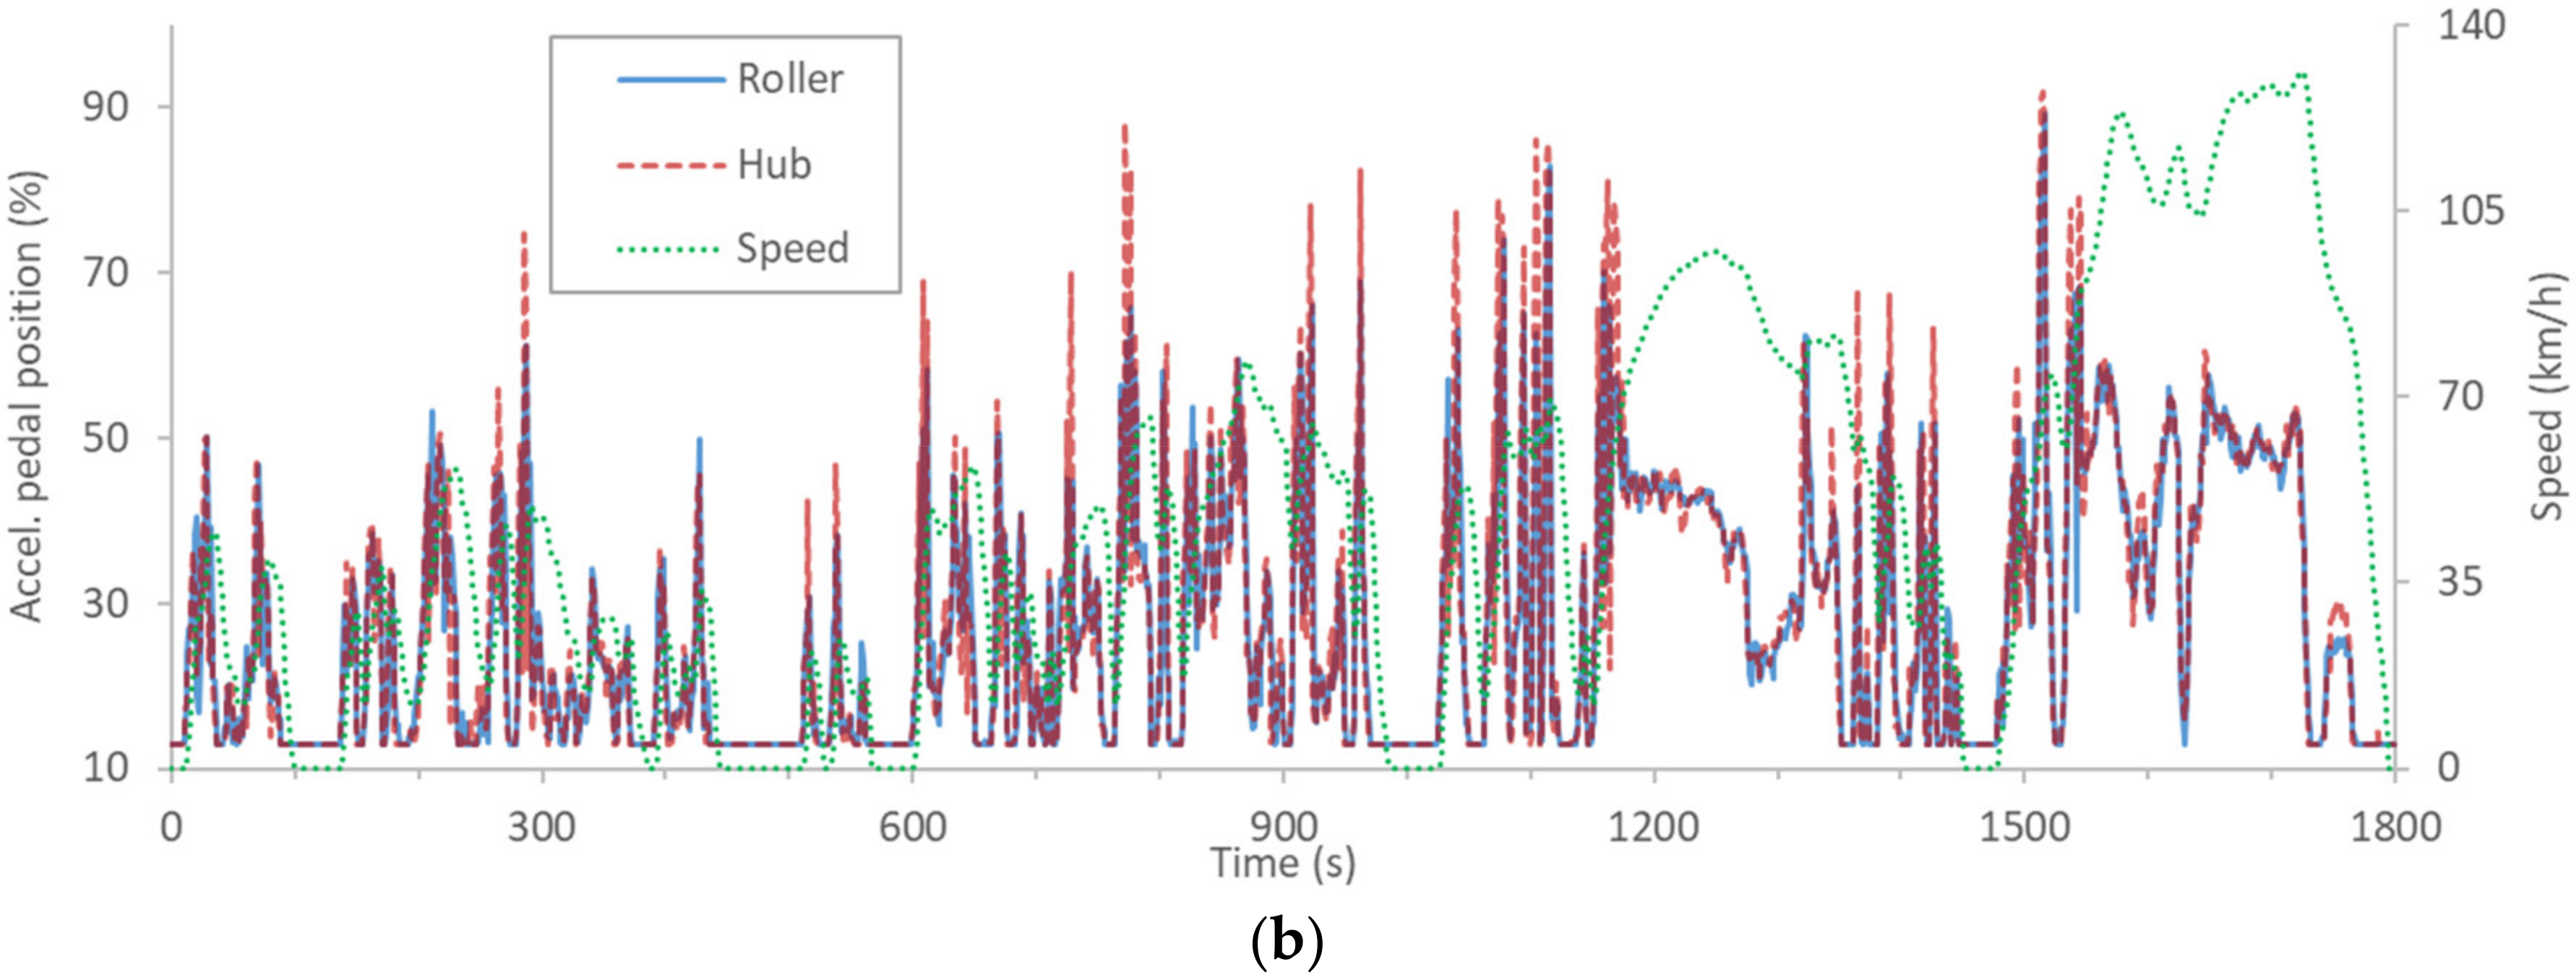
Figure 2b presents the accelerator pedal position for the cold-start WLTC with the two dynamometer types. There were some small differences during accelerations where the driver in the hub-type dynamometer case applied a higher accelerator pedal position for short durations. This can be attributed to the low experience of the driver with this specific dynamometer type.
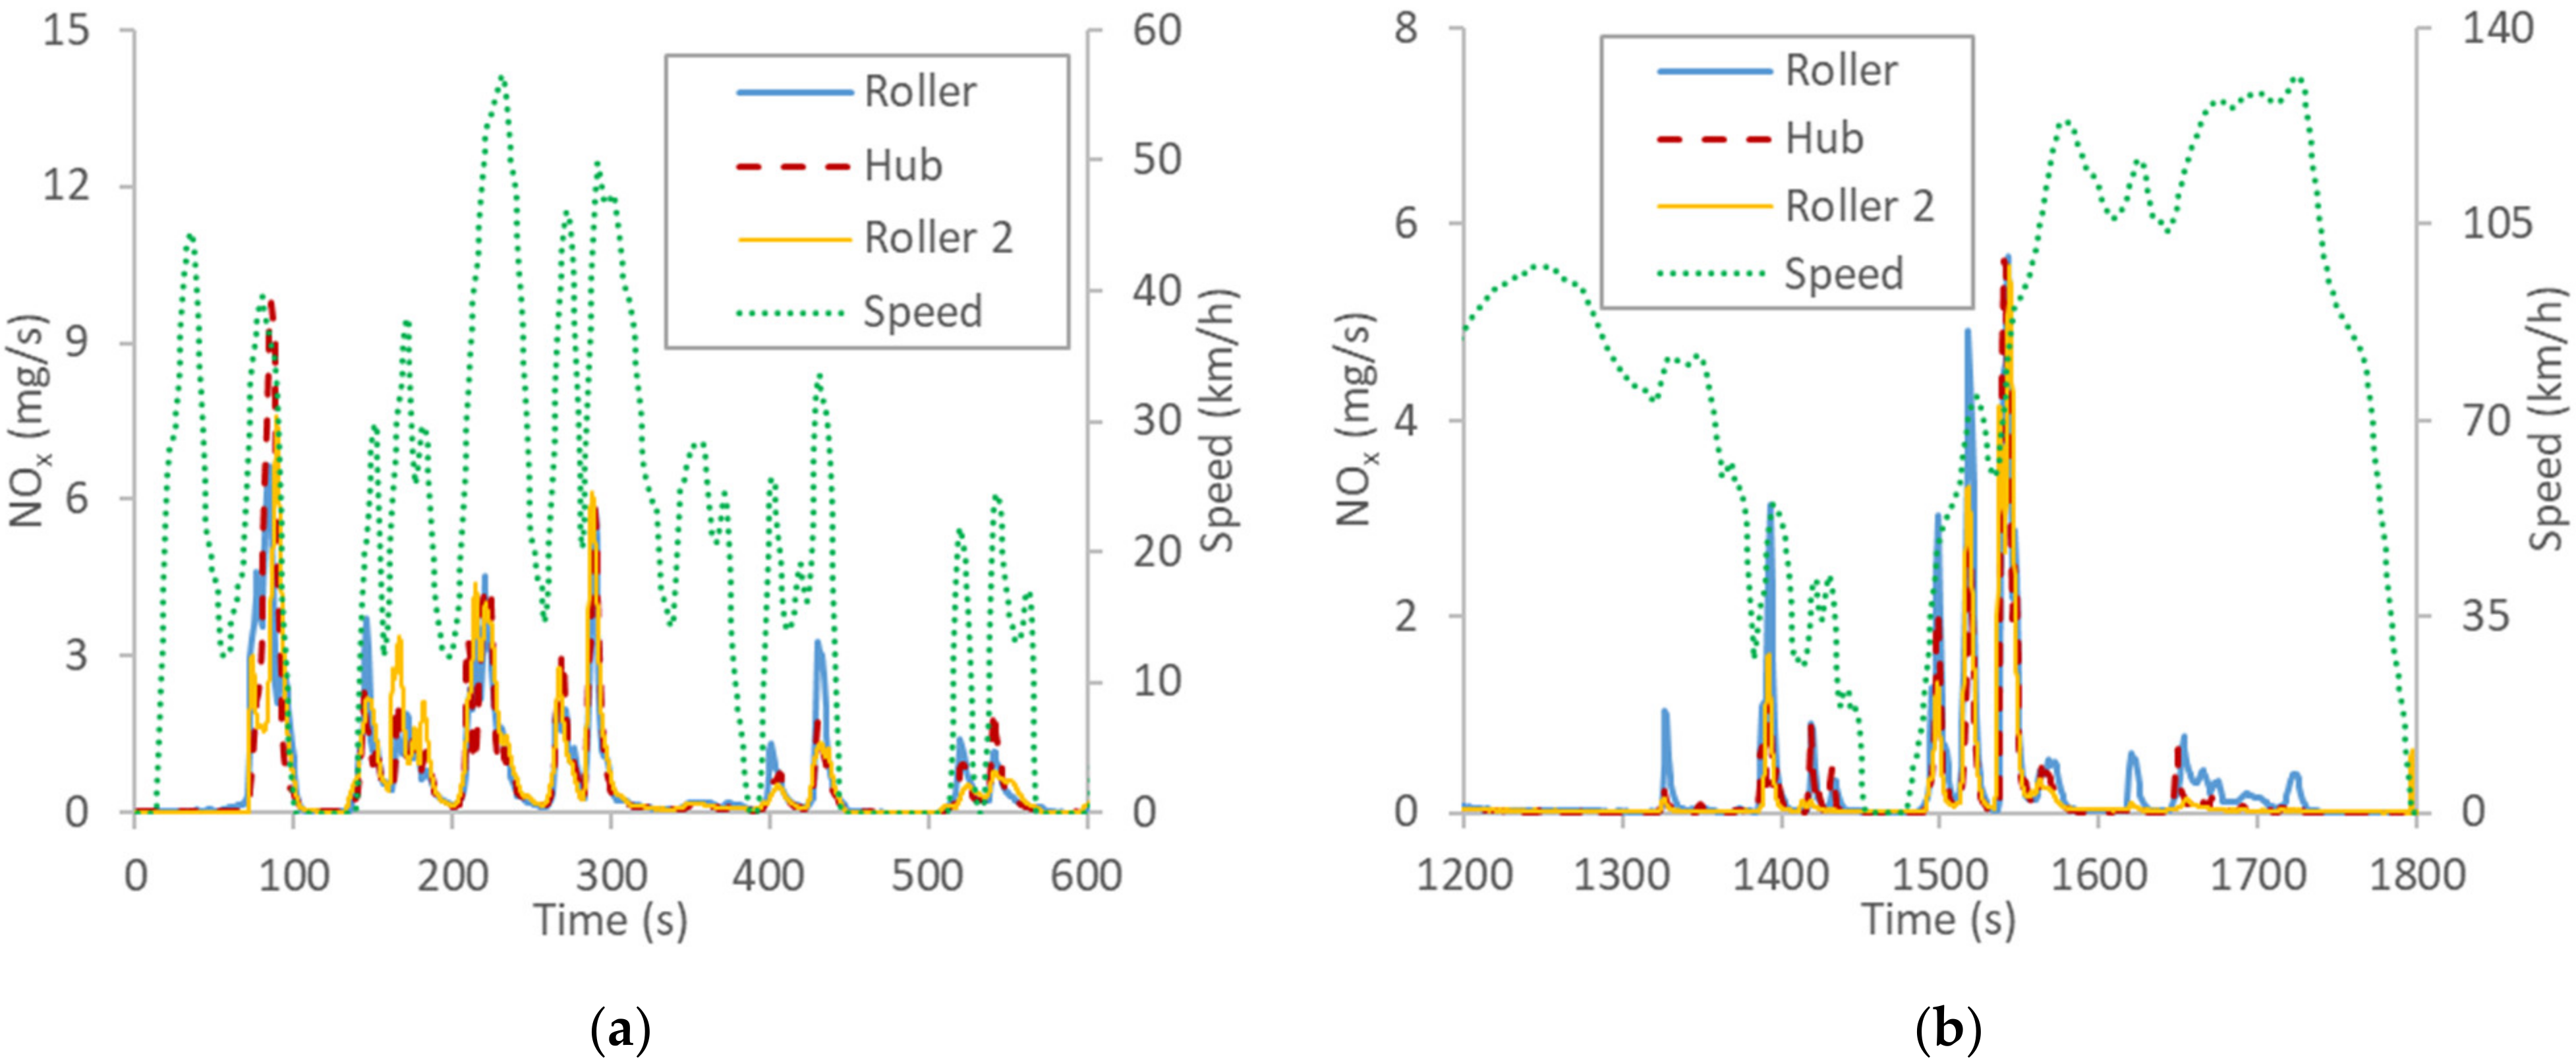
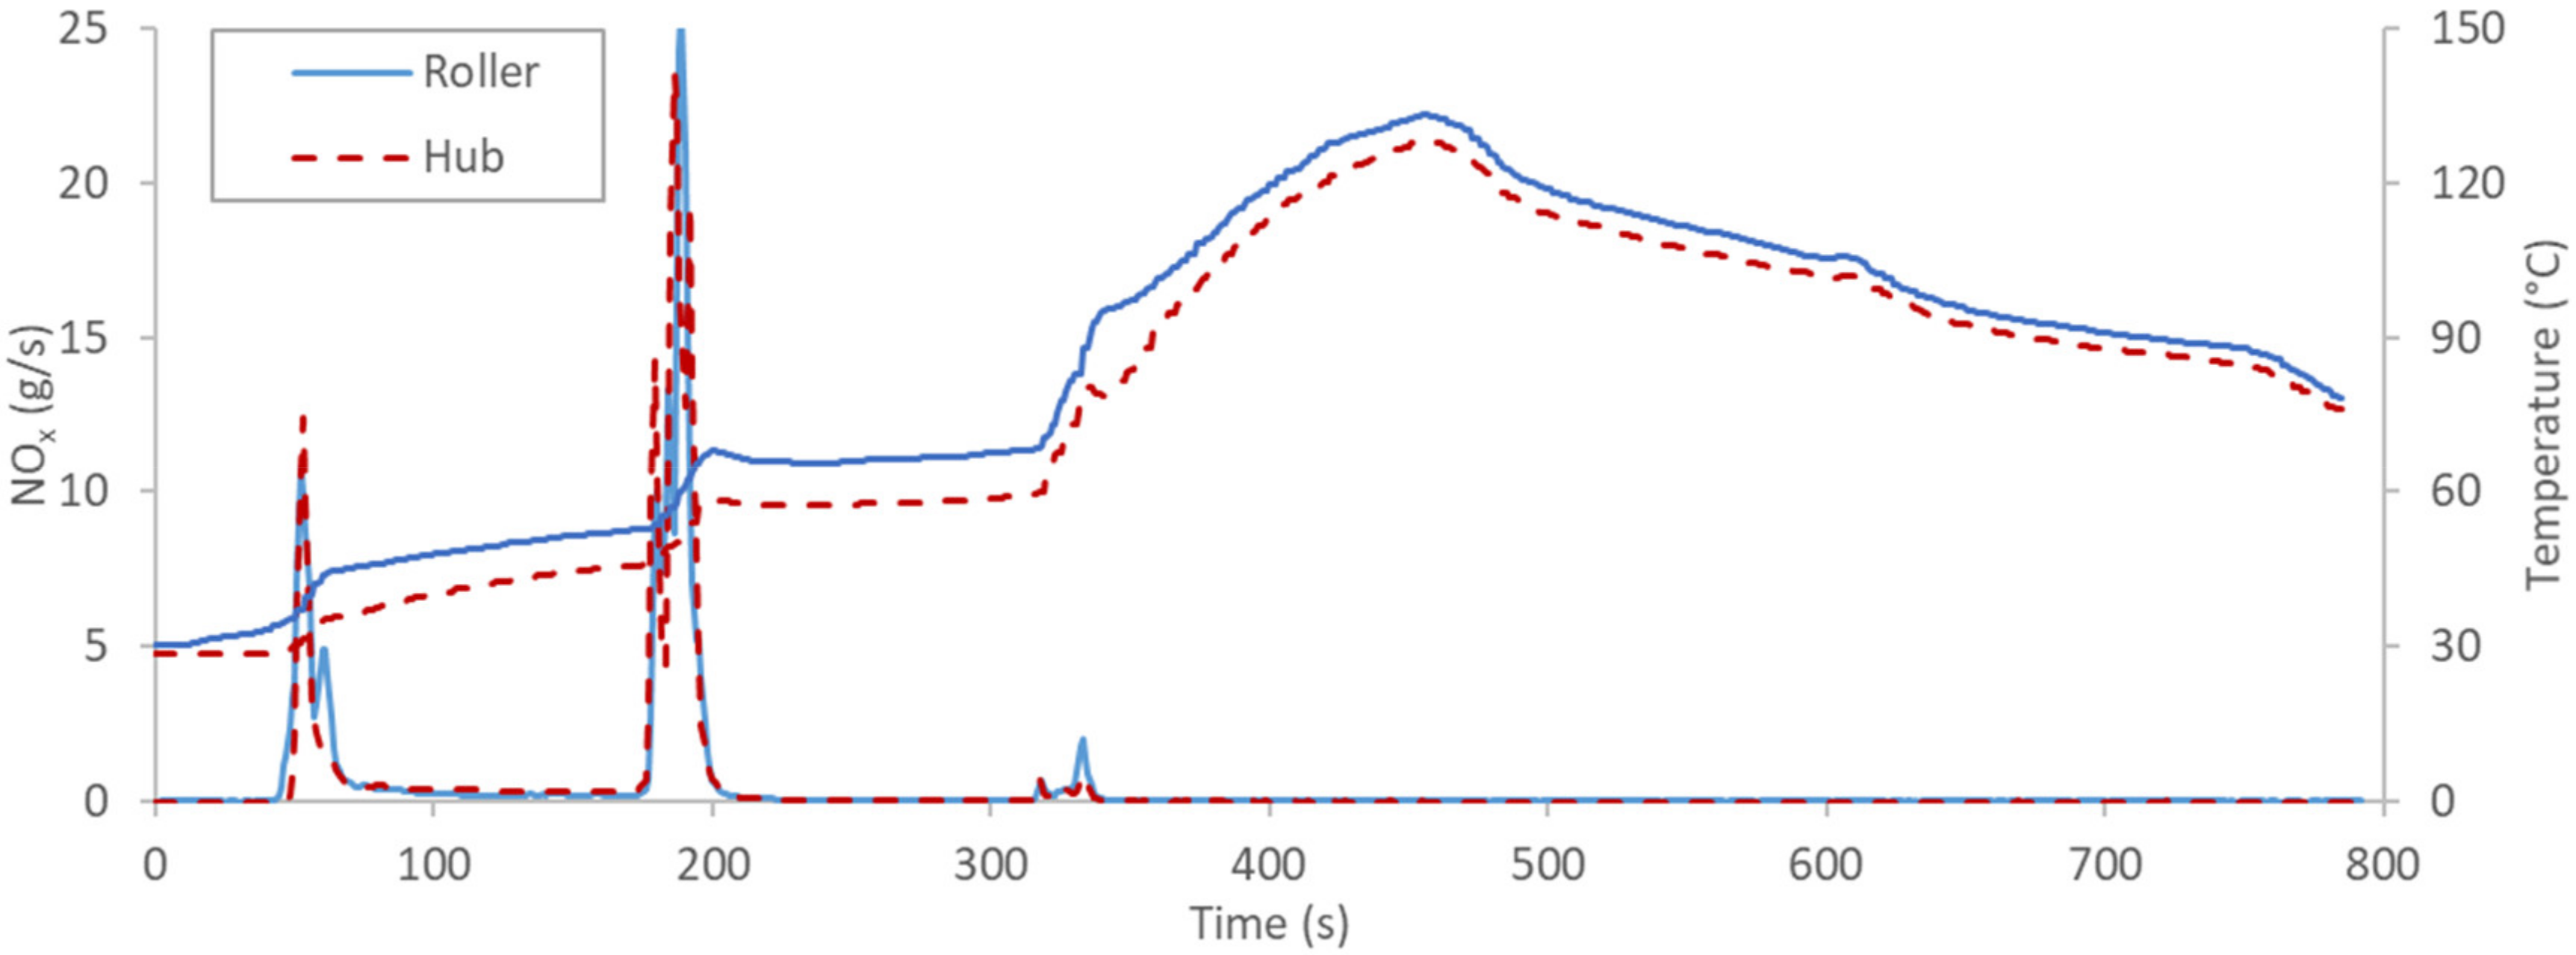
Figure 3 presents the real-time NOx emissions for the cold-start WLTC. The emissions were higher at the beginning of the cycle (Figure 3a); then, they were almost zero in the middle of the cycle (not shown in the figure); and then there were some spikes in the last high-speed part of the cycle (Figure 3b, note the different y-axis scale). The real-time patterns of the two dynamometers were very similar, with small deviations in some acceleration parts. The emissions on the second roller dynamometer with the same driver (Roller 2) are also plotted, and they were also very similar. The small differences in the peaks can be considered typical variability in exhaust emissions (i.e., both engine-out and exhaust aftertreatment control).
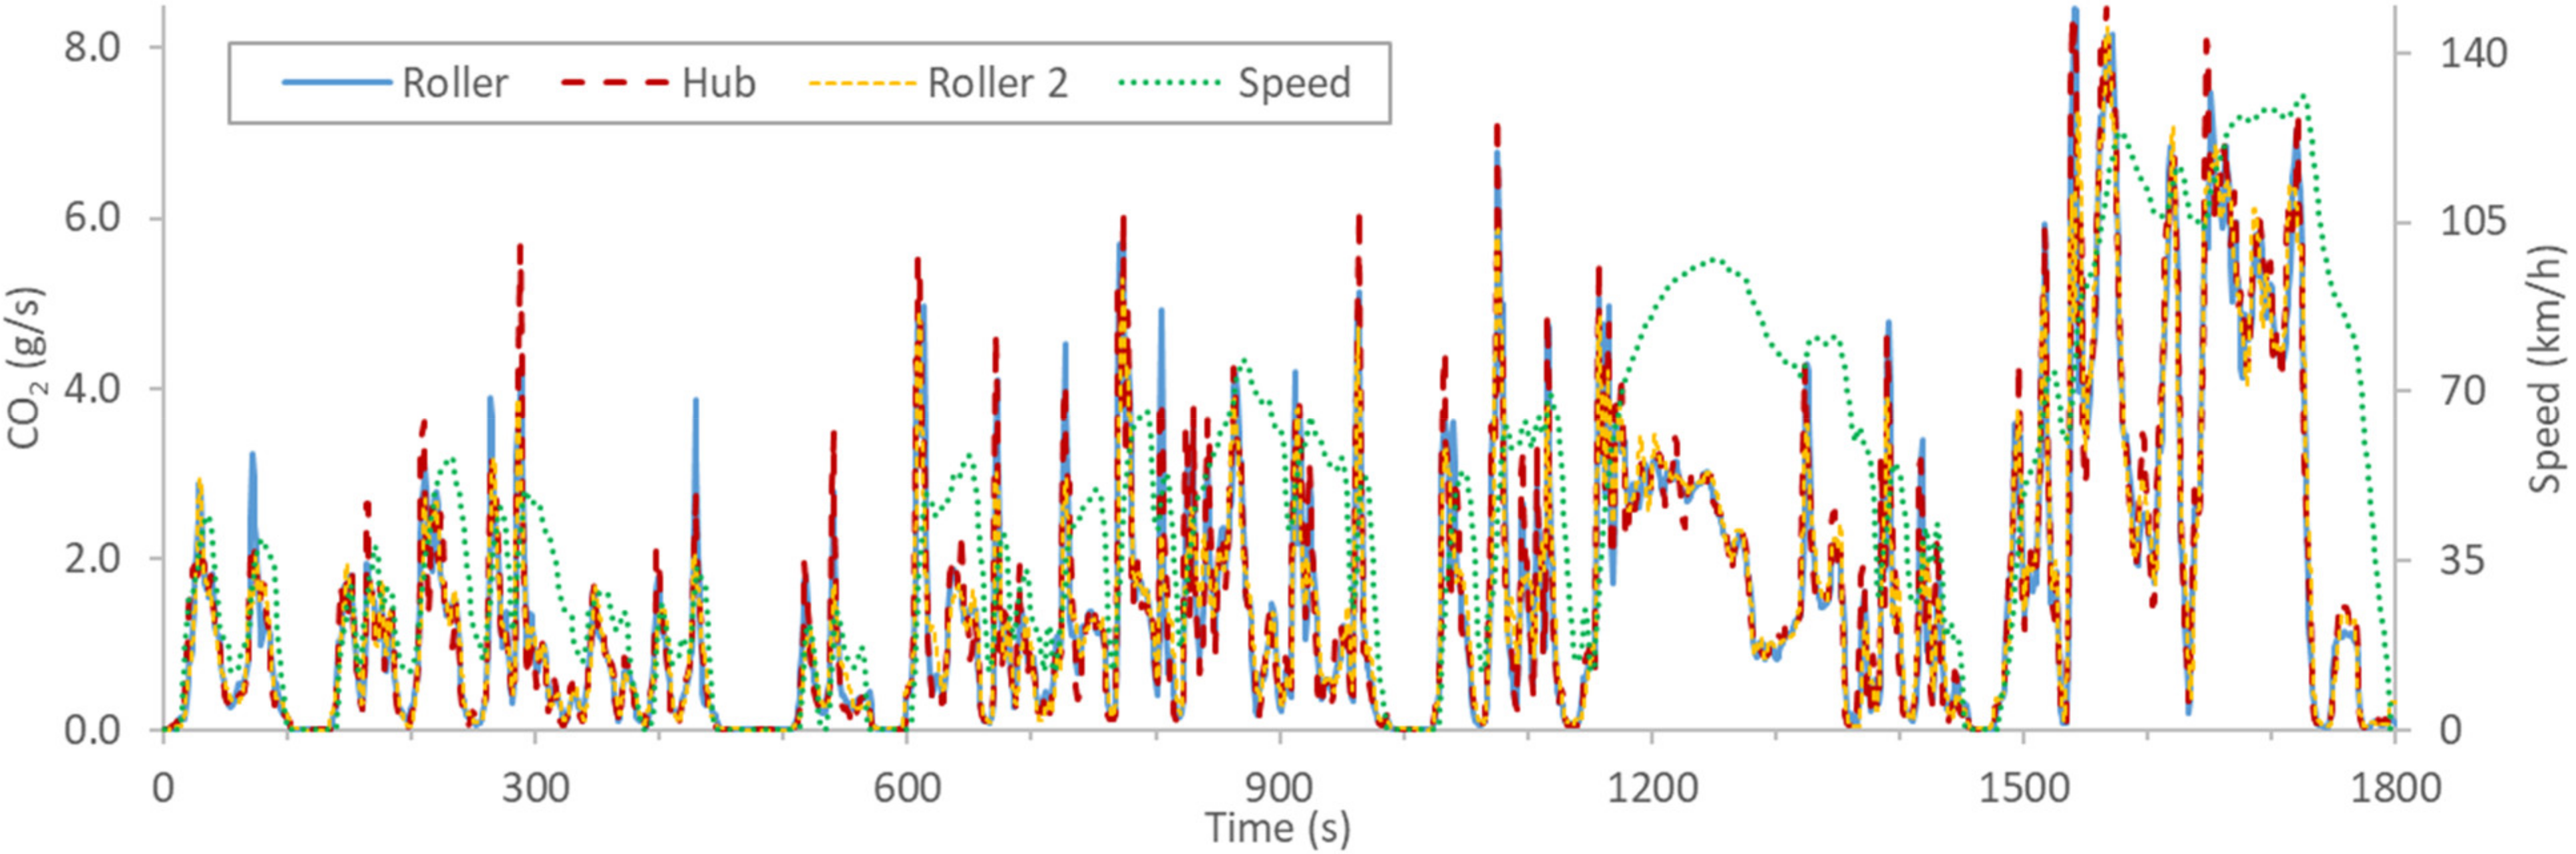
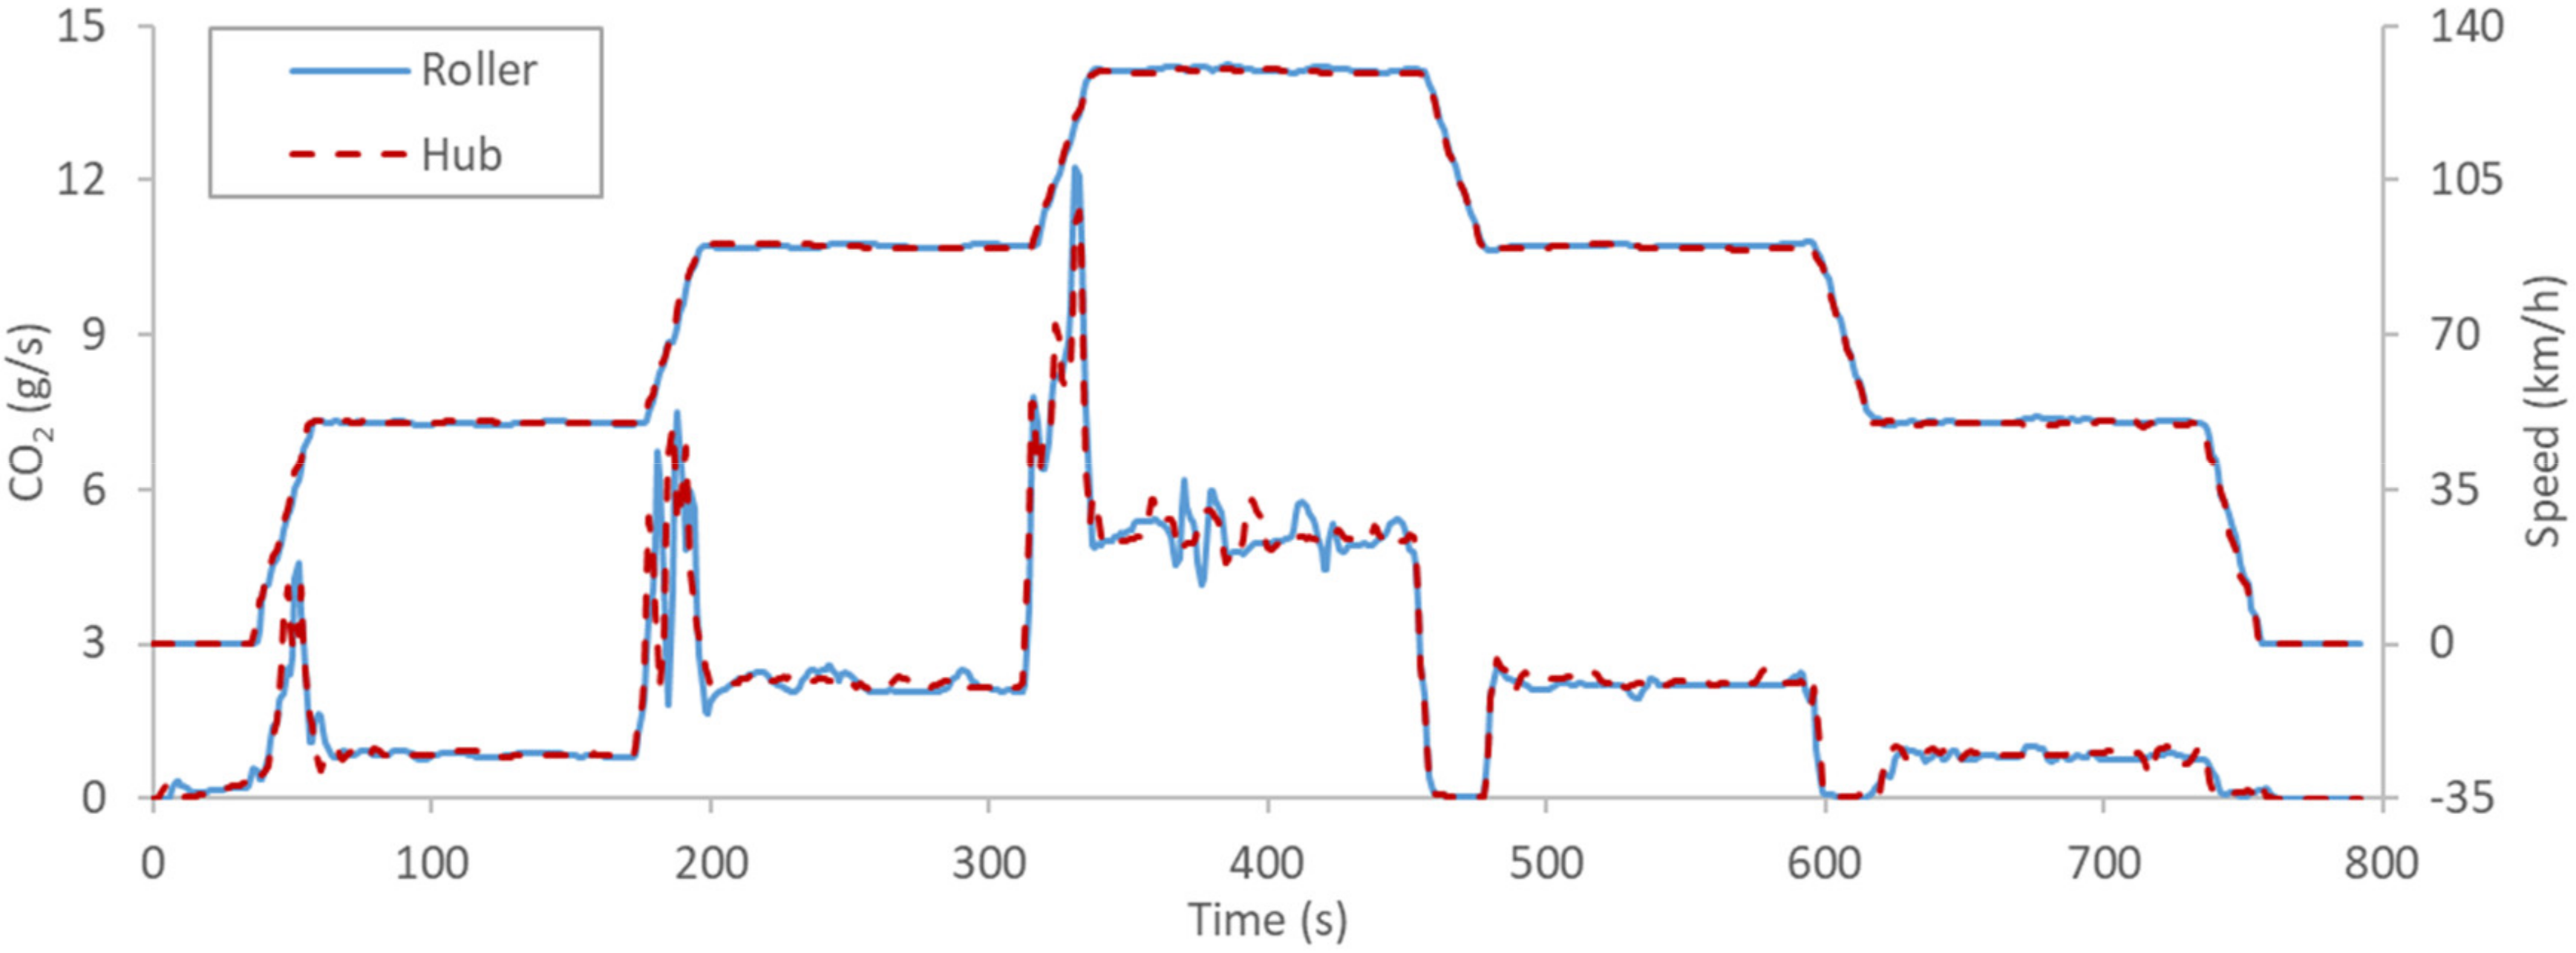
Figure 4 presents the real-time CO2 emissions. The two CO2 traces were very similar to each other, without any particular differences. The only minor differences could be seen at times 1600 s and 1750 s, which could be explained by the different accelerator pedal positions during the braking (Figure 2). Compared with the CO2 trace of the second roller dynamometer with the same driver (Roller 2), these differences could be considered negligible and within experimental uncertainty.
3.3. Integrated Emissions
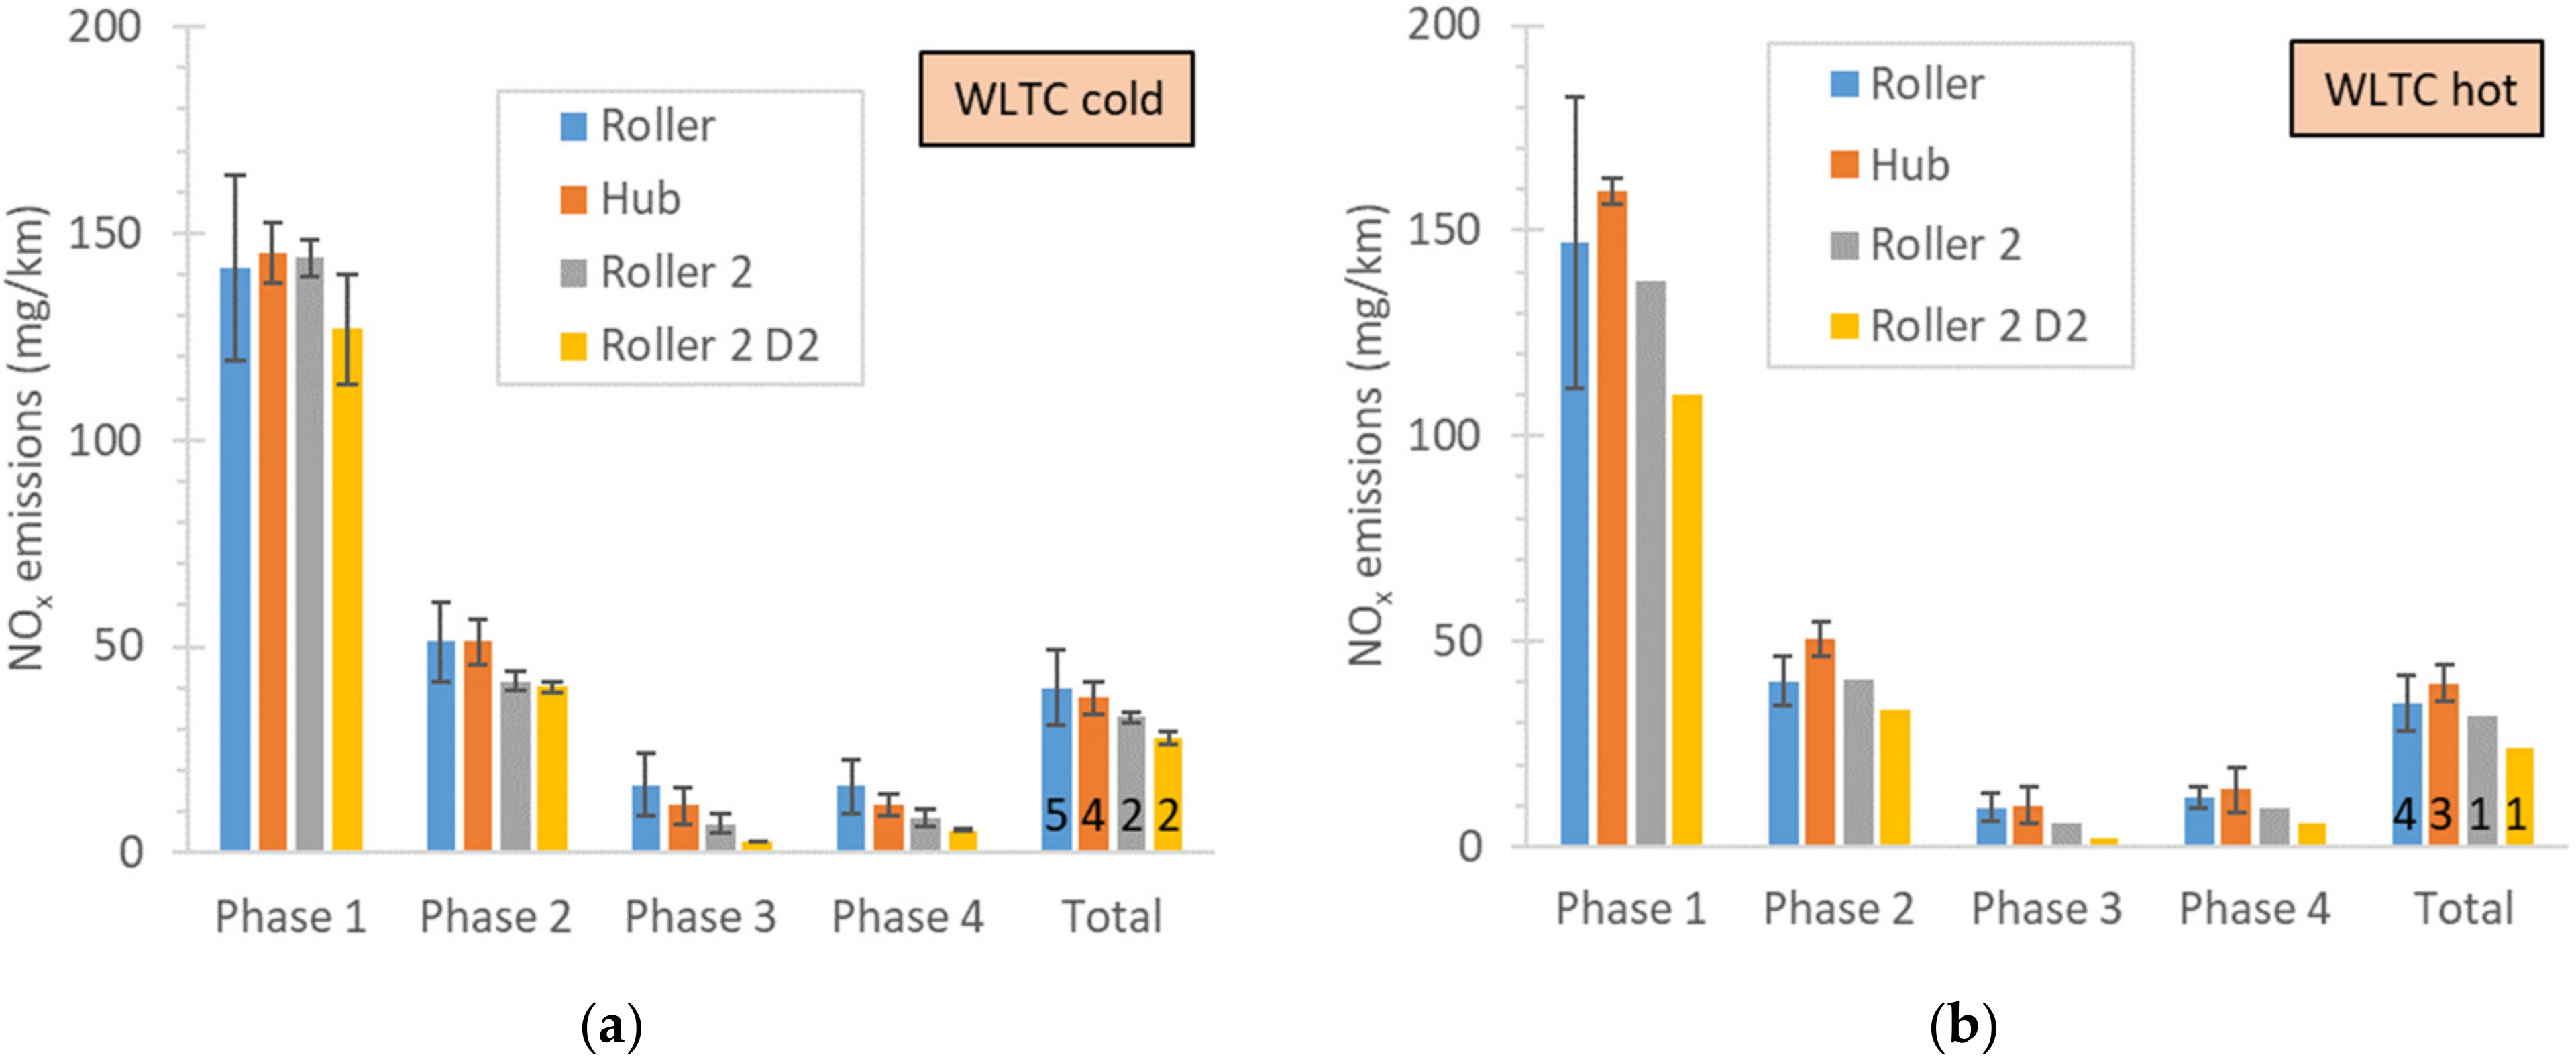
The NOx results of the integrated emissions per phase or the complete WLTC are plotted in Figure 5 for the cold-start cycle (Figure 5a) and the hot-start cycle (Figure 5b). The emissions are given for the roller-type and hub-type dynamometers tested in one laboratory, as well as the emissions of a second roller-type dynamometer with the same driver and a second driver. The results were similar, with differences of 10 mg/km at emission levels < 50 mg/km (15 mg/km in Phase 1) and 20 mg/km at the 150 mg/km level (Phase 1) (except for Roller 2, D2).
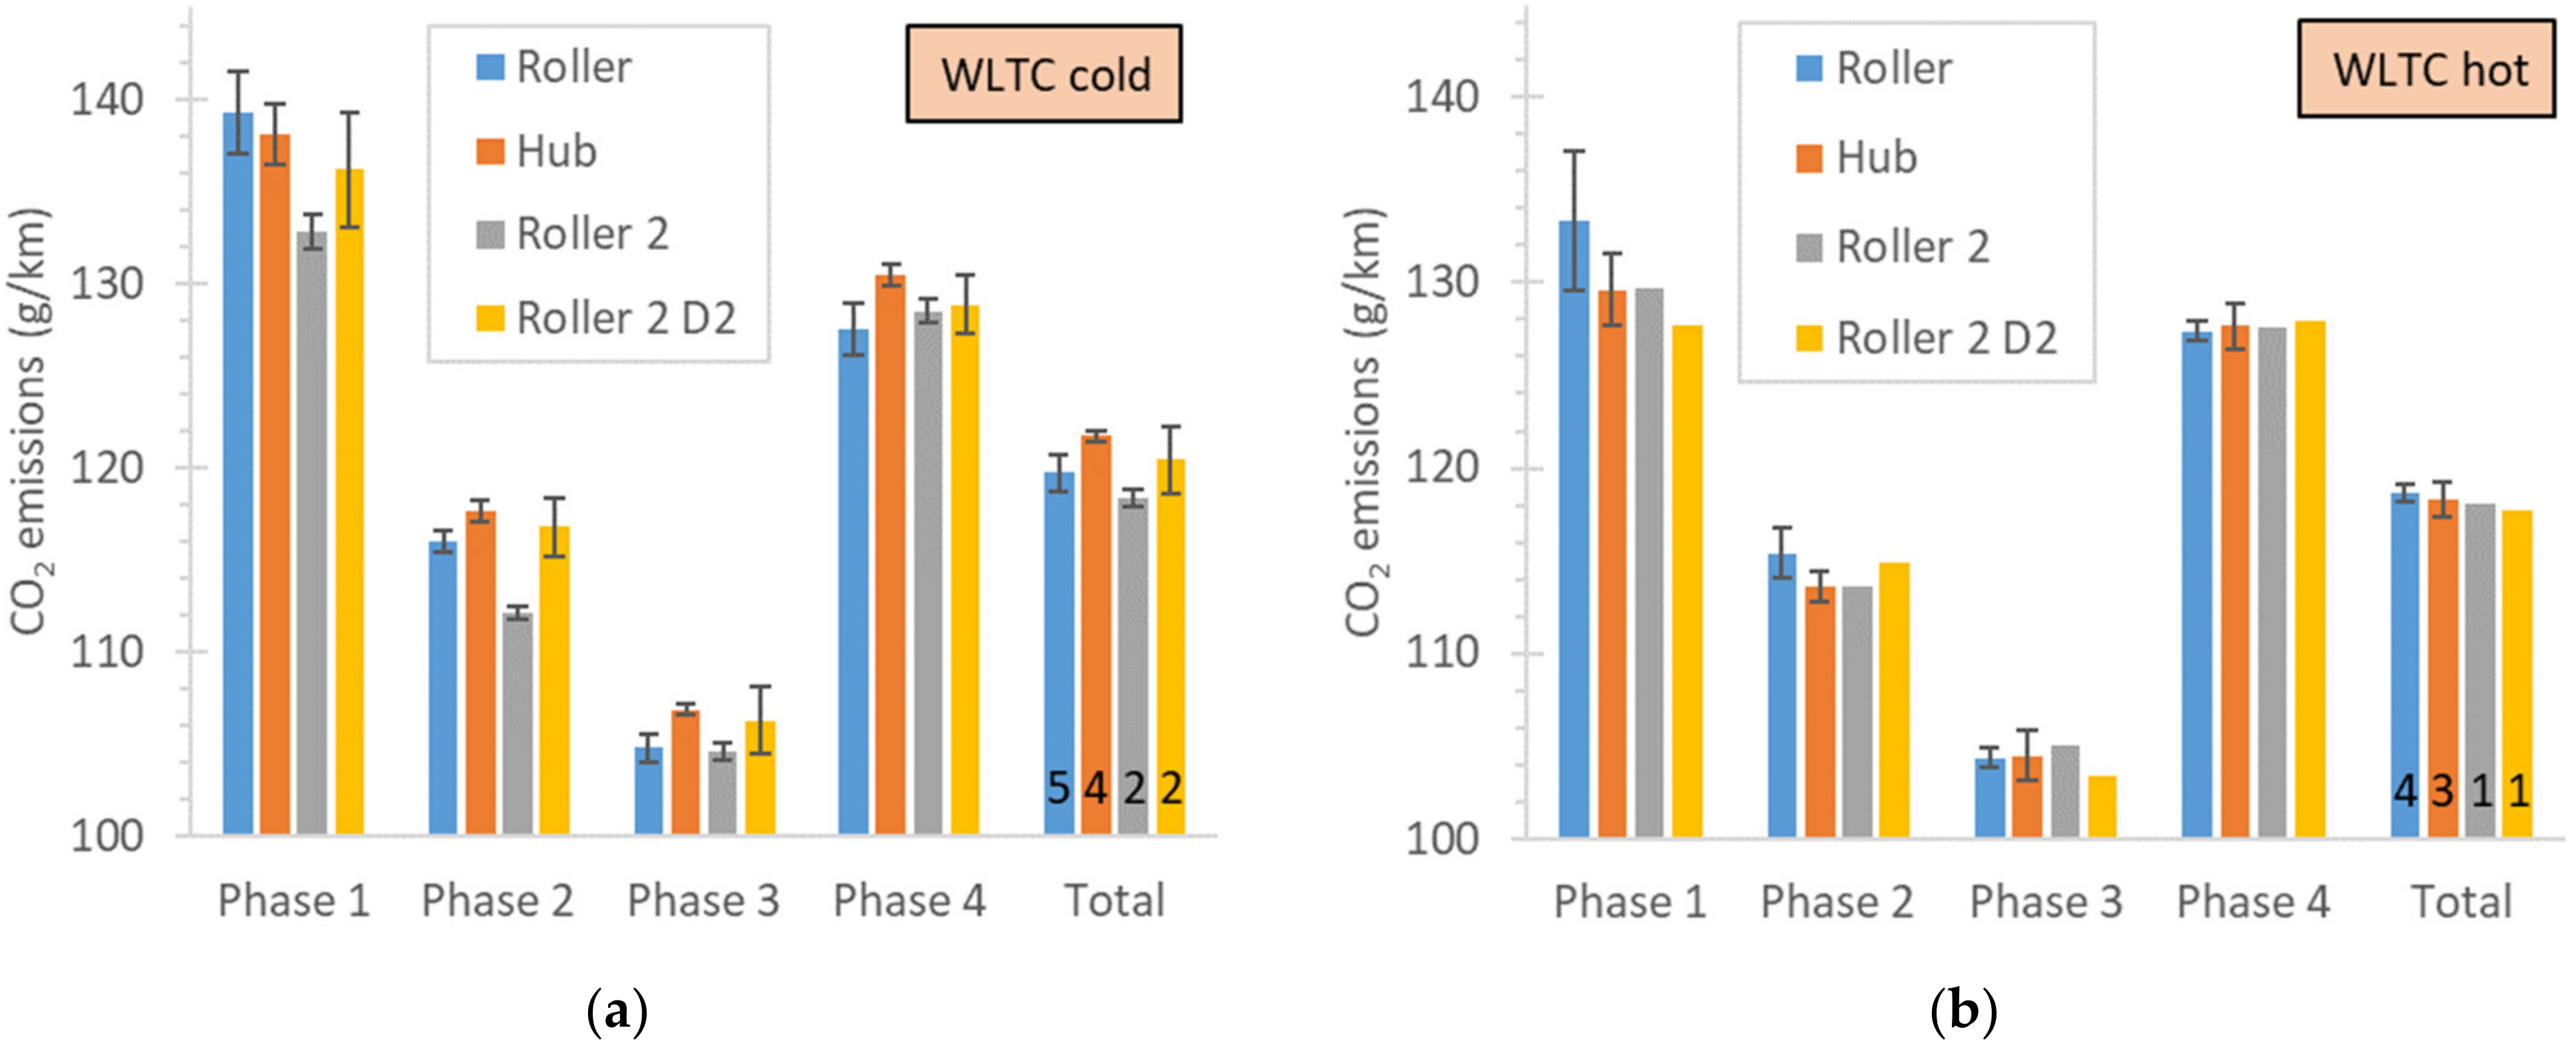
The CO2 results of the integrated emissions per phase or the complete WLTC are plotted in Figure 6 for the cold-start cycle (Figure 6a) and the hot-start cycle (Figure 6b). The differences were very small (2–3 g/km for the cold-start WLTC and even lower for the hot-start WLTC), and in most cases, the error bars overlapped. One exception is Roller 2 in Phases 1 and 2 of the cold-start WLTC (6 g/km lower from the highest value). The hub-type dynamometer’s CO2 in Phases 3 and 4 was 2–3 g/km higher than that of Roller 1, but the error bars did not overlap. Half of this difference came from the time points discussed in Figure 4. Removing these points, the difference would be well within the error bars.
4. Discussion
This is one of the first studies to compare a hub-type dynamometer with roller-type dynamometers and the first one to use the same facilities in order to minimize any additional influencing parameters. The only publicly available study that was identified presented CO2 differences in the order of up to 10 g/km between the two types of dynamometers for the complete cycles, but with overlapping error bars in most cases [15]. As the tests were conducted in different facilities with different analytical equipment and different drivers, it was not possible to identify the contribution of the dynamometers to the differences. The aim of this study was to try to isolate the impact of the dynamometer on the results by conducting the tests in the same facility with the same driver and following an identical protocol (i.e., order of tests).
The first vehicle that was tested was a plug-in hybrid. The original plan was to test it at different state-of-charge (SOC) levels of the high-voltage battery. However, even from the beginning, with the minimum SOC, the variability in the emissions was very high because the internal combustion engine (ICE) was switched on at different times. This has also been observed by other researchers [29]. Even though the results of the roller- and hub-type dynamometers were statistically equivalent, the high scatter could have masked any impact of the dynamometer on the emissions. For this reason, a second, more stable vehicle was selected. Furthermore, in order to put the results into perspective, the results of the two dynamometers in one facility and with one driver were also compared with the results of a second roller-type dynamometer with the same driver or a second driver. The results showed that the differences between the test runs on the same dynamometer system were on the same level as the differences between the different dynamometer systems, regardless of dynamometer type. The overall differences were <3 g/km for the complete cycles for CO2 and <10 mg/km for NOx, with no particular trend in the results. These differences are well within the differences reported from inter-laboratory comparison exercises (see [11,12] and references within) and repeatability studies in the same laboratory [30]. Even though the variability in our tests was small, it demonstrated the importance of the experience of the driver with a specific dynamometer. This has also been discussed in other studies [31]. It would be of interest to have a robot-driving the vehicle in future studies in order to minimize any human driver impact [32].
The results of this study support the notion that hub-type dynamometers are equivalent to roller-type dynamometers. However, the following points should be kept in mind:
The tests were dedicated to compare the two types of dynamometers; thus, the parameters that were set on the hub-type dynamometer were based on tests on a specific roller-type dynamometer. These tests consisted of the determination of the dynamic radius and the tire slip. The uncertainty in the determination of these parameters will be the topic of a separate publication. In summary, the expected impacts are as follows:
- Wheel dynamic radius: Overestimation of, e.g., 1% of the radius will result in 1% lower engine speed but also 1% higher torque. That is, the power demand from the engine is the same although at another operating point.
- Slip: Overestimation of, e.g., 10% of the slip will increase the tire slip losses by 10%. Approximating a 10% overestimation of slip on the diesel vehicle in this study would have an impact of about a 0.07% increase in CO2 for the WLTC.
- Rotational mass: Overestimation of, e.g., 10% will result in a 0.3% higher acceleration load. Approximating a 10% overestimation of rotational mass on the diesel vehicle in this study would have an impact of about a 0.1% increase in CO2 for the WLTC.
Finally, it also needs to be examined how these parameters can be determined for use with a hub-type dynamometer without tests on a roller-type dynamometer, for instance, during road tests.
5. Conclusions
The emissions of a Euro 6d-Temp diesel and a Euro 6b plug-in gasoline direct injection vehicle were determined using a roller-type and a hub-type dynamometer installed in the same facilities. The results of the two dynamometers were equivalent for the plug-in hybrid vehicle, but the scatter of the results was too large to draw any definitive conclusion about the impact of the dynamometer types on the results. For this reason, the testing focused on the diesel vehicle. The diesel vehicle was also tested on a second roller-type dynamometer with the same driver and a second driver. For the diesel vehicle, the differences in the two types of dynamometers in the same facility were <2 g/km for CO2 and <5 mg/km for NOx, within their experimental uncertainty. These differences were lower than the differences that could be found between the different roller-type dynamometers and the different drivers (<3 g/km for CO2 and <10 mg/km for NOx). This study supports the notion that the two dynamometer types can give similar results. Further studies are required to investigate how alternative methods for the determination of input parameters for use with a hub-type dynamometer may impact emissions.
Author Contributions
Conceptualization, B.G. and C.E.; methodology, B.G. and C.E.; formal analysis, B.G., F.F., C.E. and P.Ö.; writing—original draft preparation, B.G., C.E. and P.Ö.; writing—review and editing, F.F. and M.O. All authors have read and agreed to the published version of the manuscript.
Funding
This research received no external funding.
Institutional Review Board Statement
Not applicable.
Informed Consent Statement
Not applicable.
Data Availability Statement
Data are available upon request from the corresponding author.
Acknowledgments
The authors would like to acknowledge M. Centureli, C. Bonato, and P. Le Lijour for their experimental support, and M. Carriero and P. Canevari for the organization of the installation of the hub-type dynamometer in the laboratory facilities.
Conflicts of Interest
B.G., F.F. and M.O. declare no conflicts of interest. P.Ö. and C.E. are employed by Rototest, which manufactures, among other things, hub-type dynamometers. However, they were blinded to the data, which were made available after the end of the tests.
Disclaimer
The opinions expressed in this manuscript are those of the authors and should in no way be considered to represent an official opinion of the European Commission. The mention of trade names or commercial products does not constitute endorsement or recommendation by the European Commission or the authors.
Appendix A
The speed ramp tests with the diesel vehicle are presented in Figure A1 for CO2 and Figure A2 for NOx. The results are comparable without any indication of bias between the two types of dynamometers (differences < 1.5%), and they are in agreement with the WLTC tests. The small difference in the tailpipe temperature (<8 °C) between the two tests was due to the 30 min delay to the start of the steady-state test compared to the roller test, and it let the tubing cool down more. Nevertheless, this small temperature difference did not affect the NOx emissions because the small temperature difference at the aftertreatment SCR for the two tests was also small (no data available). After 200 s, the exhaust gas temperature reached the appropriate temperature for the proper functioning of the SCR, and the NOx emissions were practically zero. The NOx emissions were relatively higher during the ramp up due to the lower temperature of the SCR. During the ramp down, the emissions were zero because the SCR had reached the appropriate temperature for the NOx reduction.
Figure A1.
CO2 real-time emissions during the speed ramp tests.

Figure A2.
NOx real-time emissions during the speed ramp tests.

Appendix B
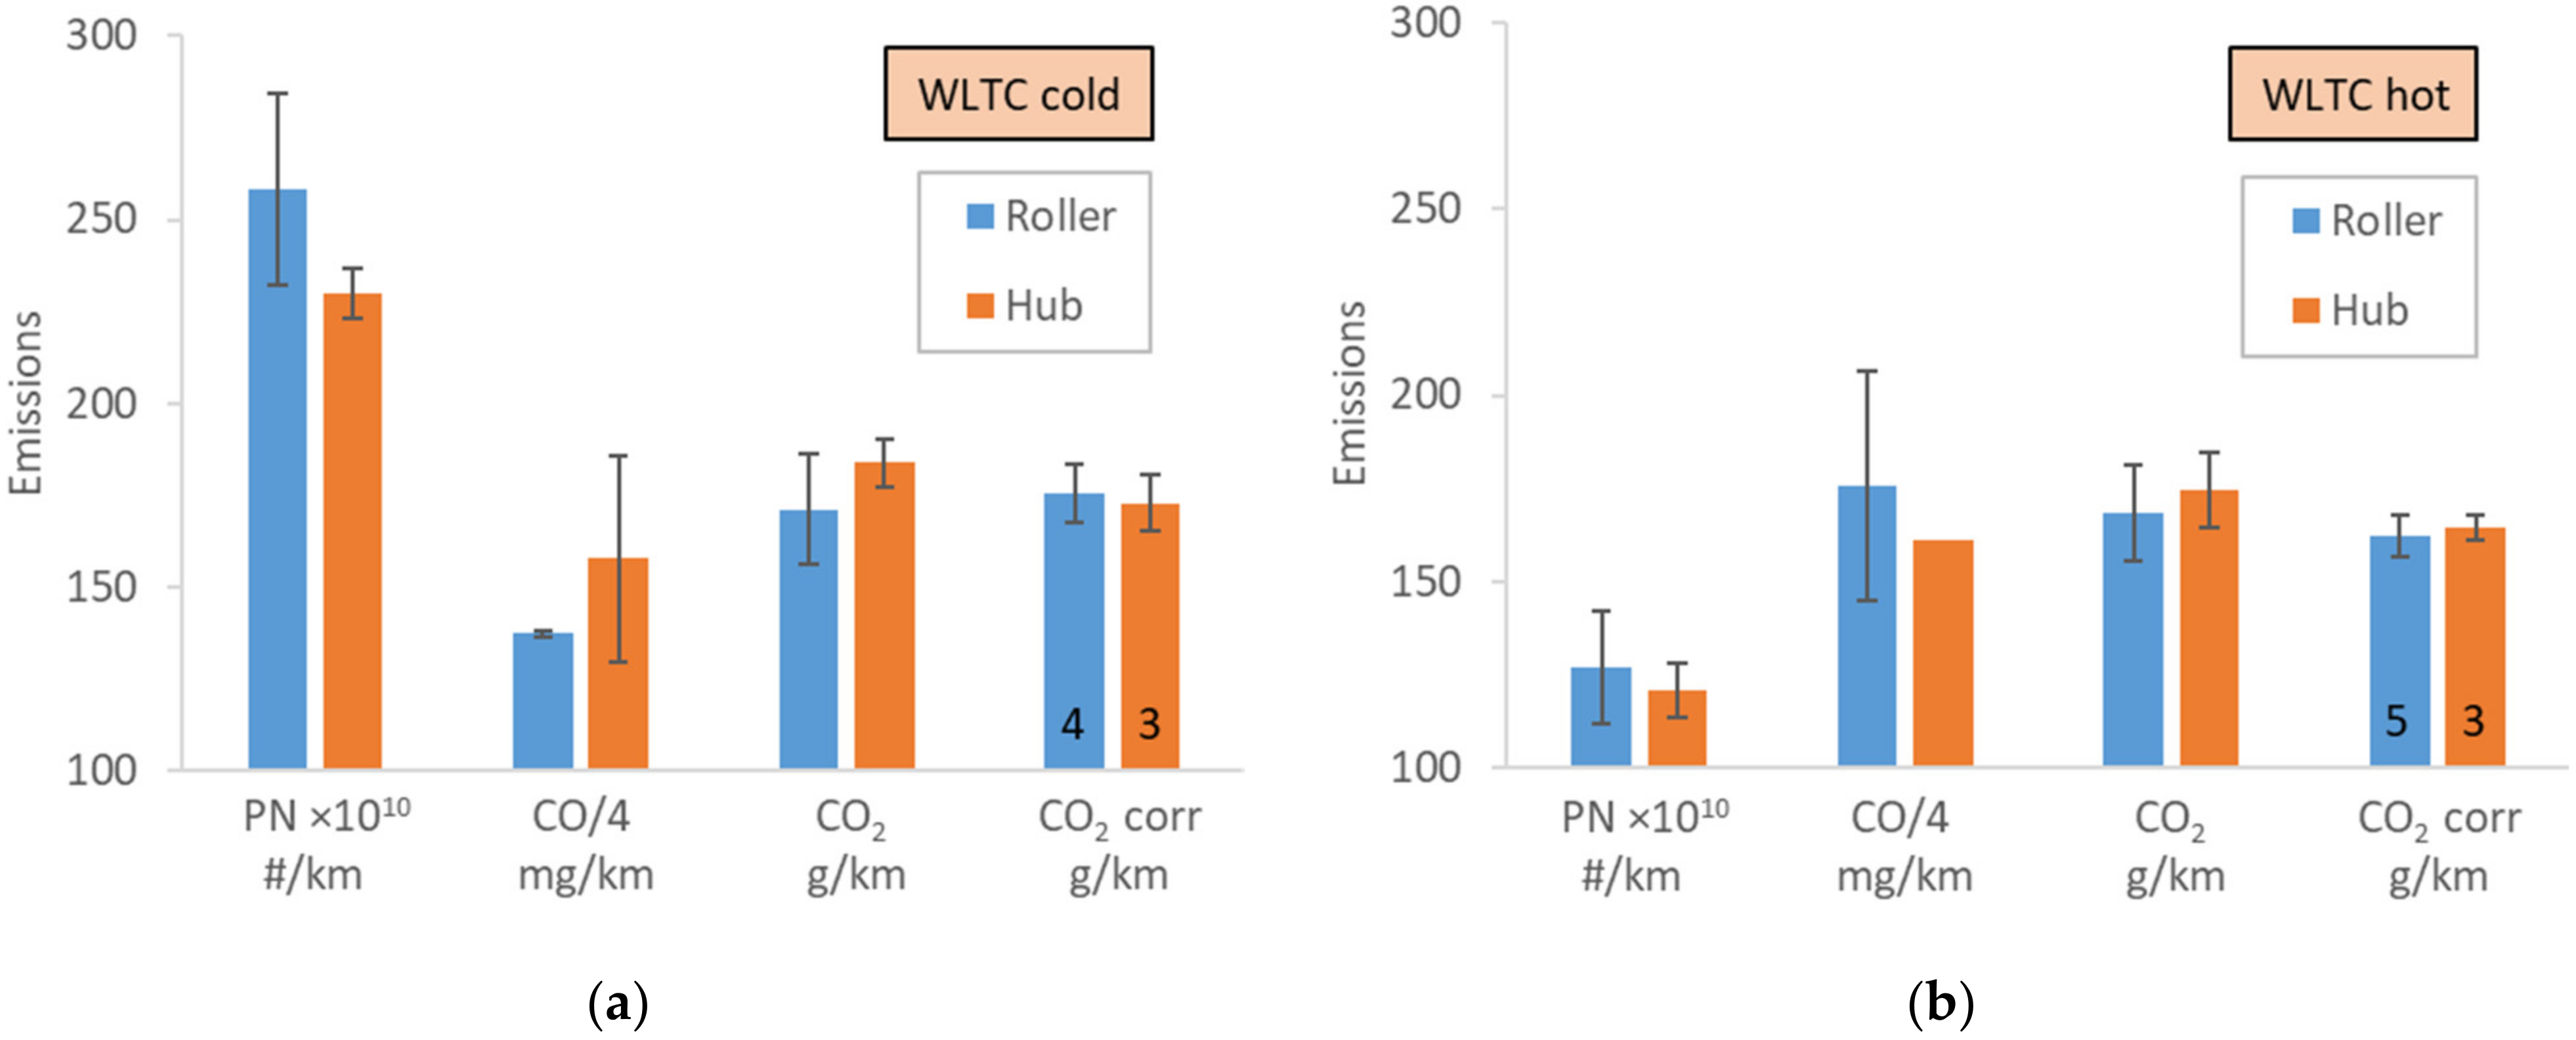
The integrated emissions of the plug-in gasoline vehicle as tested with the roller-type and the hub-type dynamometers in the same facility are plotted in Figure A3. The error bars are quite large, and the results are statistically equivalent. However, due to the high variability in the vehicles, it cannot be concluded whether there is an impact of the dynamometer types on the results.
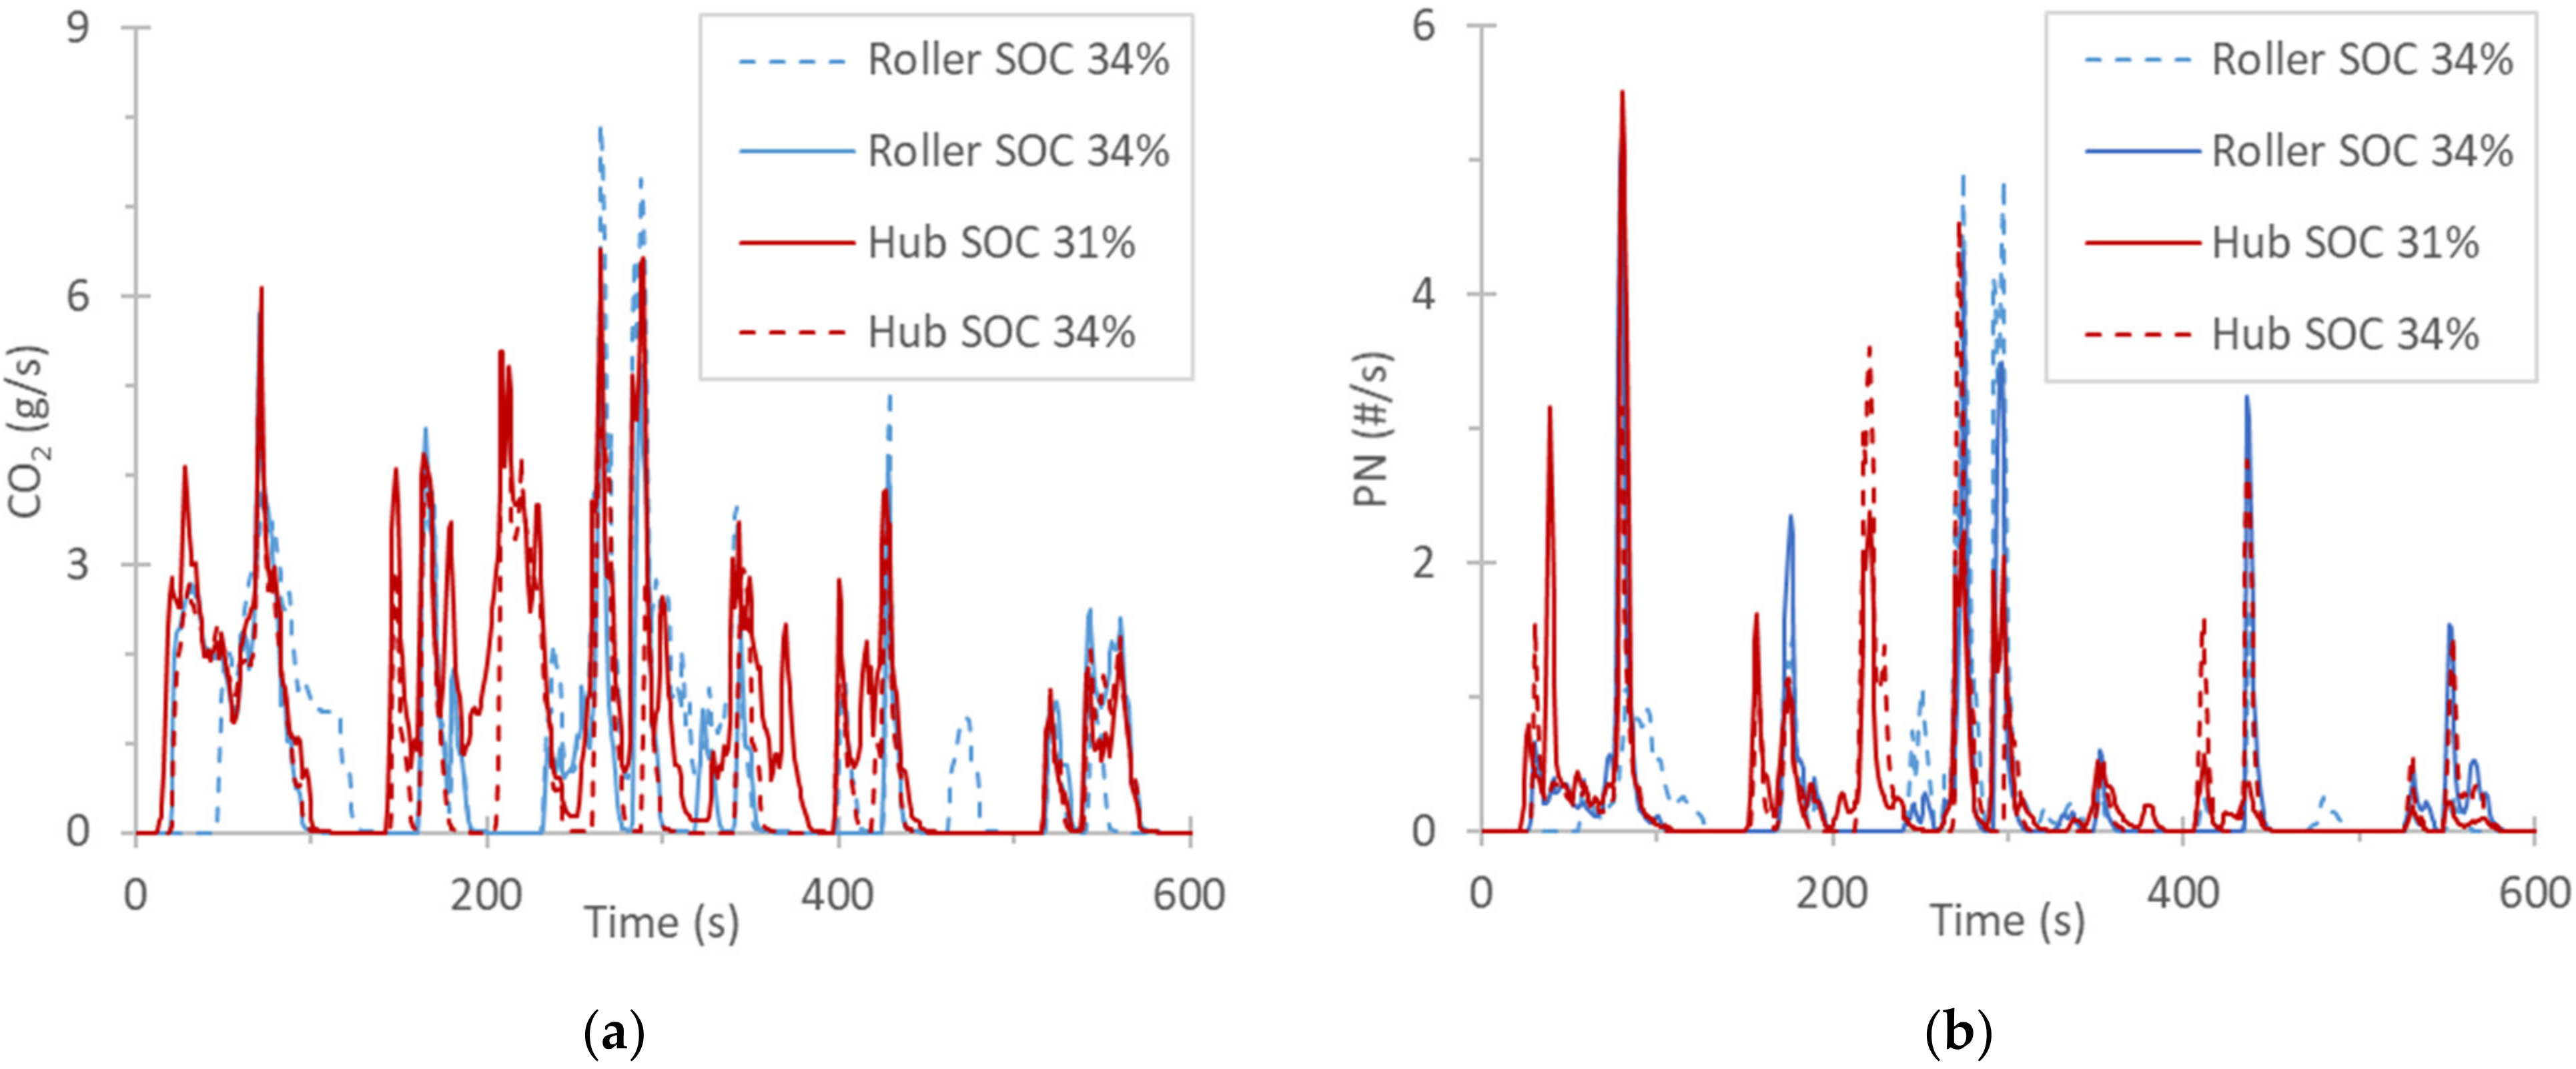
The high variability can be more easily explained with the example of Figure A4. Figure A4a plots the CO2 emissions during the first 600 s of the cold-start WLTCs with similar starting state-of-charge (SOC) levels (31–34% actual state and 0% at the dashboard). The switching on and off of the internal combustion engine (ICE) was different between the tests, even though the SOC was identical and the driver was following the cycle precisely. The SOC correction could reduce the variability in CO2 but could not help with the other pollutants that depend on when the ICE is switched on (Figure A3). This is better depicted in Figure A4b, where the particle number (PN) emissions appeared at the same time as the CO2 spikes (ICE switching on).
Figure A3.
Emissions of particle number (PN), CO, CO2 (uncorrected), and CO2 (corrected for speed–distance and battery state of charge): (a) cold-start WLTC; (b) hot-start WLTC. Error bars show one standard deviation of the number of repetitions shown in the bars.
Figure A3.
Emissions of particle number (PN), CO, CO2 (uncorrected), and CO2 (corrected for speed–distance and battery state of charge): (a) cold-start WLTC; (b) hot-start WLTC. Error bars show one standard deviation of the number of repetitions shown in the bars.

Figure A4.
Real-time emissions during the first 600 s of cold-start WLTCs for tests with similar starting state of charge (SOC) of the high-voltage battery: (a) CO2; (b) particle number (PN).
Figure A4.
Real-time emissions during the first 600 s of cold-start WLTCs for tests with similar starting state of charge (SOC) of the high-voltage battery: (a) CO2; (b) particle number (PN).

References
- Yogeeswaran, R.; Subramaniom, S.; Senthil Krishnan, S. Establishment of Chassis Dynamometers for Commercial Vehicles; SAE International: Warrendale, PA, USA, 2019. [Google Scholar] [CrossRef]
- Bielaczyc, P.; Klimkiewicz, D.; Woodburn, J.; Szczotka, A. Exhaust Emission Testing Methods–Bosmal’s Legislative and Development Emission Testing Laboratories. Combust. Engines 2019, 178, 88–98. [Google Scholar] [CrossRef]
- Kim, H.J.; Lee, S.H.; Kwon, S.I.; Park, S.; Lee, J.; Keel, J.H.; Lee, J.T.; Park, S. Investigation of the Emission Characteristics of Light-Duty Diesel Vehicles in Korea Based on EURO-VI Standards According to Type of After-Treatment System. Energies 2020, 13, 4936. [Google Scholar] [CrossRef]
- Park, G.; Mun, S.; Hong, H.; Chung, T.; Jung, S.; Kim, S.; Seo, S.; Kim, J.; Lee, J.; Kim, K.; et al. Characterization of Emission Factors Concerning Gasoline, LPG, and Diesel Vehicles via Transient Chassis-Dynamometer Tests. Appl. Sci. 2019, 9, 1573. [Google Scholar] [CrossRef] [Green Version]
- Valverde, V.; Giechaskiel, B. Assessment of Gaseous and Particulate Emissions of a Euro 6d-Temp Diesel Vehicle Driven >1300 Km Including Six Diesel Particulate Filter Regenerations. Atmosphere 2020, 11, 645. [Google Scholar] [CrossRef]
- Giechaskiel, B.; Valverde, V.; Kontses, A.; Suarez-Bertoa, R.; Selleri, T.; Melas, A.; Otura, M.; Ferrarese, C.; Martini, G.; Balazs, A.; et al. Effect of Extreme Temperatures and Driving Conditions on Gaseous Pollutants of a Euro 6d-Temp Gasoline Vehicle. Atmosphere 2021, 12, 1011. [Google Scholar] [CrossRef]
- Figenbaum, E.; Weber, C. Estimating Real-World Emissions of PHEVs in Norway by Combining Laboratory Measurement with User Surveys. WEVJ 2018, 9, 31. [Google Scholar] [CrossRef] [Green Version]
- Feinauer, M.; Ehrenberger, S.; Epple, F.; Schripp, T.; Grein, T. Investigating Particulate and Nitrogen Oxides Emissions of a Plug-In Hybrid Electric Vehicle for a Real-World Driving Scenario. Appl. Sci. 2022, 12, 1404. [Google Scholar] [CrossRef]
- Öberg, P.; Nyberg, P.; Nielsen, L. A New Chassis Dynamometer Laboratory for Vehicle Research. SAE Int. J. Passeng. Cars–Electron. Electr. Syst. 2013, 6, 152–161. [Google Scholar] [CrossRef]
- Fernández-Yáñez, P.; Soriano, J.A.; Mata, C.; Armas, O.; Pla, B.; Bermúdez, V. Simulation of Optimal Driving for Minimization of Fuel Consumption or NOx Emissions in a Diesel Vehicle. Energies 2021, 14, 5513. [Google Scholar] [CrossRef]
- Giechaskiel, B.; Casadei, S.; Mazzini, M.; Sammarco, M.; Montabone, G.; Tonelli, R.; Deana, M.; Costi, G.; Di Tanno, F.; Prati, M.; et al. Inter-Laboratory Correlation Exercise with Portable Emissions Measurement Systems (PEMS) on Chassis Dynamometers. Appl. Sci. 2018, 8, 2275. [Google Scholar] [CrossRef] [Green Version]
- Giechaskiel, B.; Casadei, S.; Rossi, T.; Forloni, F.; Di Domenico, A. Measurements of the Emissions of a “Golden” Vehicle at Seven Laboratories with Portable Emission Measurement Systems (PEMS). Sustainability 2021, 13, 8762. [Google Scholar] [CrossRef]
- Myung, C.L.; Lee, H.; Kwon, S.; Lee, S.; Jun, J.; Lee, Y.; Woo, Y.; Lee, M.; Bae, G.N.; Park, S. Inter-Laboratory Correlation Exercise on a Light-Duty Diesel Passenger Vehicle to Verify Nano-Particle Emission Characteristics by Korea Particle Measurement Program. J. Mech. Sci. Technol. 2009, 23, 729–738. [Google Scholar] [CrossRef]
- Zervas, E.; Dorlhène, P.; Forti, L.; Perrin, C.; Momique, J.C.; Monier, R.; Ing, H.; Lopez, B. Interlaboratory Test of Exhaust PM Using ELPI. Aerosol Sci. Technol. 2005, 39, 333–346. [Google Scholar] [CrossRef]
- Lawson, P.; Dhingra, S. Advancements in Powertrain Test Environment Delivering Productivity through Strategic Choice of Test Environment. In Proceedings of the AVL Product Development in Motion, Coverty, UK, 28 June 2018. [Google Scholar]
- Jaworski, A.; Mądziel, M.; Lew, K.; Campisi, T.; Woś, P.; Kuszewski, H.; Wojewoda, P.; Ustrzycki, A.; Balawender, K.; Jakubowski, M. Evaluation of the Effect of Chassis Dynamometer Load Setting on CO2 Emissions and Energy Demand of a Full Hybrid Vehicle. Energies 2021, 15, 122. [Google Scholar] [CrossRef]
- Gis, W.; Zoltowski, A.; Taubert, S. The Impact of Engine Cooling Fan Configuration on the Emission of Pollutants by Vehicle Exhaust Systems in Chassis Dynamometer Tests. KONES 2011, 18, 107–115. [Google Scholar]
- Giechaskiel, B.; Suarez-Bertoa, R.; Lahde, T.; Clairotte, M.; Carriero, M.; Bonnel, P.; Maggiore, M. Emissions of a Euro 6b Diesel Passenger Car Retrofitted with a Solid Ammonia Reduction System. Atmosphere 2019, 10, 180. [Google Scholar] [CrossRef] [Green Version]
- Giechaskiel, B.; Clairotte, M.; Valverde-Morales, V.; Bonnel, P.; Kregar, Z.; Franco, V.; Dilara, P. Framework for the Assessment of PEMS (Portable Emissions Measurement Systems) Uncertainty. Environ. Res. 2018, 166, 251–260. [Google Scholar] [CrossRef]
- Giechaskiel, B.; Lähde, T.; Melas, A.D.; Valverde, V.; Clairotte, M. Uncertainty of Laboratory and Portable Solid Particle Number Systems for Regulatory Measurements of Vehicle Emissions. Environ. Res. 2021, 197, 111068. [Google Scholar] [CrossRef]
- Brace, C.J.; Burke, R.; Moffa, J. Increasing Accuracy and Repeatability of Fuel Consumption Measurement in Chassis Dynamometer Testing. Proc. Inst. Mech. Eng. Part D J. Automob. Eng. 2009, 223, 1163–1177. [Google Scholar] [CrossRef] [Green Version]
- Galindo, E.; Blanco, D.; Brace, C.; Chappell, E.; Burke, R. Chassis Dynamometer Testing: Addressing the Challenges of New Global Legislation (WLTP and RDE); SAE International: Warrendale, PA, USA, 2017; ISBN 978-0-7680-8278-4. [Google Scholar]
- Fontaras, G.; Valverde, V.; Arcidiacono, V.; Tsiakmakis, S.; Anagnostopoulos, K.; Komnos, D.; Pavlovic, J.; Ciuffo, B. The Development and Validation of a Vehicle Simulator for the Introduction of Worldwide Harmonized Test Protocol in the European Light Duty Vehicle CO2 Certification Process. Appl. Energy 2018, 226, 784–796. [Google Scholar] [CrossRef]
- Kim, C.; Lee, H.; Park, Y.; Myung, C.L.; Park, S. Study on the Criteria for the Determination of the Road Load Correlation for Automobiles and an Analysis of Key Factors. Energies 2016, 9, 575. [Google Scholar] [CrossRef] [Green Version]
- Gillespie, T.D. Fundamentals of Vehicle Dynamics; Society of Automotive Engineers: Warrendale, PA, USA, 1992; ISBN 978-1-56091-199-9. [Google Scholar]
- Pacejka, H.B.; Besselink, I. Tire and Vehicle Dynamics, 3rd ed.; Butterworth-Heinemann Elsevier: Oxford, UK, 2012; ISBN 978-0-08-097016-5. [Google Scholar]
- Tsokolis, D.; Tsiakmakis, S.; Dimaratos, A.; Fontaras, G.; Pistikopoulos, P.; Ciuffo, B.; Samaras, Z. Fuel Consumption and CO2 Emissions of Passenger Cars over the New Worldwide Harmonized Test Protocol. Appl. Energy 2016, 179, 1152–1165. [Google Scholar] [CrossRef]
- SAE J2951 Drive Quality Evaluation for Chassis Dynamometer Testing J2951_201401 2014. Available online: https://www.sae.org/standards/content/j2951_201401/ (accessed on 16 March 2022).
- Frey, H.C.; Zheng, X.; Hu, J. Variability in Measured Real-World Operational Energy Use and Emission Rates of a Plug-In Hybrid Electric Vehicle. Energies 2020, 13, 1140. [Google Scholar] [CrossRef] [Green Version]
- Jaworski, A.; Kuszewski, H.; Ustrzycki, A.; Balawender, K.; Lejda, K.; Woś, P. Analysis of the Repeatability of the Exhaust Pollutants Emission Research Results for Cold and Hot Starts under Controlled Driving Cycle Conditions. Environ. Sci. Pollut. Res. 2018, 25, 17862–17877. [Google Scholar] [CrossRef] [PubMed] [Green Version]
- Giechaskiel, B. Gaseous and Particulate Emissions of a Euro 4 Motorcycle and Effect of Driving Style and Open or Closed Sampling Configuration. Sustainability 2020, 12, 9122. [Google Scholar] [CrossRef]
- Hwang, K.; Park, J.; Kim, H.; Kuc, T.Y.; Lim, S. Development of a Simple Robotic Driver System (SimRoDS) to Test Fuel Economy of Hybrid Electric and Plug-In Hybrid Electric Vehicles Using Fuzzy-PI Control. Electronics 2021, 10, 1444. [Google Scholar] [CrossRef]
Figure 1.
Experimental setup.

Figure 2.
Real time recordings: (a) Speed traces. (b) Accelerator pedal position with the roller-type and hub-type dynamometers (cold-start WLTC).
Figure 2.
Real time recordings: (a) Speed traces. (b) Accelerator pedal position with the roller-type and hub-type dynamometers (cold-start WLTC).


Figure 3.
Real-time emissions of NOx: (a) cold-start urban (low) part of WLTC; (b) motorway (high and extra high) part of WLTC.
Figure 3.
Real-time emissions of NOx: (a) cold-start urban (low) part of WLTC; (b) motorway (high and extra high) part of WLTC.

Figure 4.
Real-time CO2 emissions (cold-start WLTC) with the roller-type and hub-type dynamometers.

Figure 5.
NOx emissions: (a) cold-start WLTC; (b) hot-start WLTC. Error bars show one standard deviation of the number of repetitions shown in the bars. The results of the roller- and hub-type dynamometers are compared with a second roller-type dynamometer (Roller 2) with the same driver and a second driver (D2).

Figure 6.
CO2 emissions: (a) cold-start WLTC; (b) hot-start WLTC. Error bars show one standard deviation of the number of repetitions shown in the bars. The results of the roller- and hub-type dynamometers are compared with a second roller-type dynamometer (Roller 2) with the same driver and a second driver (D2).


Table 1.
Characteristics of dynamometers.
| Technical specifications | Hub-Type | Roller-Type | Roller-Type 2 |
|---|---|---|---|
| Manufacturer | Rototest | AVL Zöllner | Maha (AIP) |
| Model | Energy 4WD | Roadsim MIL 4 × 4 | ECDM 48M-4WD |
| Control system | Rototest HDC | MMI | DynoServer ECD |
| Base inertia/axle | 48 kg | 1365 kg | 1770 kg |
| Vehicle inertia simulation | 0 to 6100 kg 1,2 | 454 to 4500 kg 1 | 454 to 4500 kg 1 |
| Max force/axle (continuous) | 18,400 N 2 | 5000 N | 6000 N |
| Max power/axle (continuous) | 400 kW | 153 kW | 150 kW |
| Wheelbase adjustment | Any | 1800–4600 mm | 1800–4000 mm |
| Roller diameter | - | 1.22 m | 1.22 m |
| Roller surface | - | <0.25 mm | <0.25 mm |
| Forces accuracy | 0.05% FS | 0.1% FS | 0.1% FS |
| Time measurement accuracy | <0.001% | <0.001% | <0.001% |
| Speed measurement accuracy | <0.08 km/h 2 | <0.02 km/h | <0.08 km/h |
| Temperature range | −10 to 40 °C | −30 to 50 °C | −10 to 30 °C |
1 with 3 m/s2; 2 equivalent assuming 650 mm wheel diameter. FS = full scale.
Table 2.
Comparison of distances reported from the roller- and hub-type dynamometers for the cold- and hot-start WLTCs. D2 = second driver.
Table 2.
Comparison of distances reported from the roller- and hub-type dynamometers for the cold- and hot-start WLTCs. D2 = second driver.
| Dynamometer (WLTC) | Low Phase 1 | Medium Phase 2 | High Phase 3 | Extra High Phase 4 | WLTC All |
|---|---|---|---|---|---|
| Duration (s) | 589 | 433 | 455 | 323 | 1800 |
| Reference (km) | 3.095 | 4.756 | 7.162 | 8.254 | 23.266 |
| Hub (cold) (km) | 3.068 | 4.762 | 7.113 | 8.170 | 23.111 |
| Roller (cold) (km) | 3.062 | 4.722 | 7.141 | 8.230 | 23.154 |
| Roller 2 (cold) (km) | 3.105 | 4.751 | 7.187 | 8.264 | 23.307 |
| Roller 2 D2 (cold (km) | 3.096 | 4.749 | 7.156 | 8.276 | 23.277 |
| Hub (hot) (km) | 3.073 | 4.744 | 7.139 | 8.189 | 23.144 |
| Roller (hot) (km) | 3.062 | 4.703 | 7.146 | 8.230 | 23.141 |
| Roller 2 (hot) (km) | 3.091 | 4.759 | 7.168 | 8.258 | 23.276 |
| Roller 2 D2 (km) | 3.092 | 4.752 | 7.165 | 8.263 | 23.272 |
Table 3.
Total time violations with the roller- and hub-type dynamometers for the cold- and hot-start WLTCs. D2 = second driver.
Table 3.
Total time violations with the roller- and hub-type dynamometers for the cold- and hot-start WLTCs. D2 = second driver.
| Dynamometer (WLTC) | Low Phase 1 | Medium Phase 2 | High Phase 3 | Extra High Phase 4 | WLTC All |
|---|---|---|---|---|---|
| Hub (cold) (s) | 0.0 | 0.3 | 0.0 | 0.3 | 0.5 |
| Roller (cold) (s) | 0.6 | 0.0 | 0.0 | 0.0 | 0.6 |
| Roller 2 (cold) (s) | 1.2 | 0.1 | 0.0 | 0.0 | 1.3 |
| Roller 2 D2 (cold (s) | 0.0 | 0.0 | 0.0 | 0.0 | 0.0 |
| Hub (hot) (s) | 0.0 | 0.0 | 0.0 | 0.0 | 0.0 |
| Roller (hot) (s) | 0.0 | 0.5 | 0.3 | 0.0 | 0.8 |
| Roller 2 (hot) (s) | 0.0 | 0.0 | 1.5 | 0.0 | 1.5 |
| Roller 2 D2 (s) | 0.0 | 0.0 | 0.0 | 0.0 | 0.0 |
Table 4.
IWR (see Materials and Methods) with the roller- and hub-type dynamometers for the cold- and hot-start WLTCs. D2 = second driver.
Table 4.
IWR (see Materials and Methods) with the roller- and hub-type dynamometers for the cold- and hot-start WLTCs. D2 = second driver.
| Dynamometer (WLTC) | Low Phase 1 | Medium Phase 2 | High Phase 3 | Extra High Phase 4 | WLTC All |
|---|---|---|---|---|---|
| Hub (cold) (%) | 2.2 | 1.3 | 0.6 | 1.1 | 1.2 |
| Roller (cold) (%) | 3.6 | 1.8 | 0.8 | 2.6 | 2.1 |
| Roller 2 (cold) (%) | 3.7 | −0.2 | 1.3 | 3.8 | 2.1 |
| Roller 2 D2 (cold (%) | 3.1 | 1.9 | 1.8 | 1.8 | 2.1 |
| Hub (hot) (%) | 1.3 | 0.3 | 0.4 | 1.1 | 0.8 |
| Roller (hot) (%) | 3.3 | 0.6 | −0.1 | 2.2 | 1.4 |
| Roller 2 (hot) (%) | 2.8 | 1.0 | 1.9 | 3.7 | 2.3 |
| Roller 2 D2 (%) | 4.0 | 0.6 | 2.1 | 1.5 | 2.0 |
Publisher’s Note: MDPI stays neutral with regard to jurisdictional claims in published maps and institutional affiliations. |
© 2022 by the authors. Licensee MDPI, Basel, Switzerland. This article is an open access article distributed under the terms and conditions of the Creative Commons Attribution (CC BY) license (https://creativecommons.org/licenses/by/4.0/).
Share and Cite
MDPI and ACS Style
Giechaskiel, B.; Forloni, F.; Otura, M.; Engström, C.; Öberg, P. Experimental Comparison of Hub- and Roller-Type Chassis Dynamometers for Vehicle Exhaust Emissions. Energies 2022, 15, 2402. https://doi.org/10.3390/en15072402
AMA Style
Giechaskiel B, Forloni F, Otura M, Engström C, Öberg P. Experimental Comparison of Hub- and Roller-Type Chassis Dynamometers for Vehicle Exhaust Emissions. Energies. 2022; 15(7):2402. https://doi.org/10.3390/en15072402
Chicago/Turabian StyleGiechaskiel, Barouch, Fabrizio Forloni, Marcos Otura, Christian Engström, and Per Öberg. 2022. "Experimental Comparison of Hub- and Roller-Type Chassis Dynamometers for Vehicle Exhaust Emissions" Energies 15, no. 7: 2402. https://doi.org/10.3390/en15072402
Note that from the first issue of 2016, this journal uses article numbers instead of page numbers. See further details here.