
Plasma Scenarios for the DTT Tokamak with Optimized Poloidal Field Coil Current Waveforms


1
Consorzio CREATE, Via Claudio 21, 80125 Napoli, Italy
2
Dipartimento di Ingegneria Elettrica e delle Tecnologie Dell’informazione, Università degli Studi di Napoli “Federico II”, Via Claudio 21, 80125 Napoli, Italy
3
Consorzio per L’attuazione del Progetto Divertor Tokamak Test—DTT S.C. a.r.l., 00044 Frascati, Italy
4
Department of Economics, Engineering, Society and Business Organization (DEIM), Largo dell’Università, University of Tuscia, 01100 Viterbo, Italy
*
Author to whom correspondence should be addressed.
Energies 2022, 15(5), 1702; https://doi.org/10.3390/en15051702
Submission received: 4 February 2022
/
Revised: 20 February 2022
/
Accepted: 23 February 2022
/
Published: 24 February 2022
(This article belongs to the Special Issue Latest Theoretical, Technological, and Experimental Advances in Fusion Devices)
Abstract
:In the field of nuclear fusion, the power exhaust problem is still an open issue and represents one of the biggest problems for the realization of a commercial fusion power plant. According to the “European Fusion Roadmap”, a dedicated facility able to investigate possible solutions to heat exhaust is mandatory. For this purpose, the mission of the Divertor Tokamak Test (DTT) tokamak is the study of different solutions for the divertor. This paper presents the plasma scenarios for standard and alternative configurations in DTT. The Single Null scenario is described in detail. The alternative configurations are also presented, showing the good flexibility of the machine.
1. Introduction
The main goal of nuclear fusion is to generate electric energy, reproducing on earth the nuclear reactions that power the stars. Nuclear fusion is among the energy sources able to guarantee world sustainability without CO2 production, contributing to meeting the quick growth of global energy demand, which is expected to be doubled by 2050 due to the combined effect of the increase of world population and energy need per person in developing countries. However, different challenges must be addressed to make fusion a robust form of electric energy production.
Magnetically confined fusion uses a magnetic field to maintain the plasma (fully ionized gas) away from the wall. The most promising configuration of a magnetic fusion device is the tokamak, a toroidal device in which plasma plays the role of the secondary winding of a transformer that has to be kept in equilibrium by a set of poloidal field currents [1].
In 2012, the EUROFUSION consortium published the “European Fusion Roadmap” [1], in which eight missions have been identified and addressed to realize nuclear fusion by the end of the century. In particular, mission 2 refers to the power exhaust problem, which probably represents the main challenge towards the realization of magnetic confinement fusion. According to the roadmap, the “risk exists that the baseline strategy pursued in ITER cannot be extrapolated to a fusion power plant”, hence “a dedicated Divertor Tokamak Test (DTT) facility will be necessary”. The final aim of the DTT device, whose construction is starting at ENEA C.R. Frascati—Italy, is the test of different solutions for the divertor in view of a DEMOnstration fusion reactor (DEMO), such as alternative plasma configurations and innovative materials for the divertor able to cope with very large power fluxes (>10 MW/m2). In 2015, the first proposal of the DTT project was published [2], while in 2019, a revised version was released [3] after a careful revision of the project according to the suggestions of the EUROFUSION consortium.
This paper is focused on the description of DTT plasma scenarios, showing a revised version with respect to [4], while in [5], a detailed description of the Single Null (SN) scenario fluid modeling is provided. Even if a DTT PF (Poloidal Field)/CS (Central Solenoid) coil system is able to accommodate a comprehensive set of divertor configurations, including SN, X-Divertor (XD), Single Null with Negative-Triangularity (SN-NT), Double Null (DN) and Snowflake (SF), for the design of the DTT first divertor, priority has been given to the SN (reference configuration), XD and SN-NT scenarios [6,7].
The paper is organized as follows. Section 2 presents the DTT machine configuration, showing the position, dimension and number of turns of the poloidal field coils, highlighting the limits in terms of magnetic fields, forces, voltages and currents. Section 3 reports the plasma scenario for the SN configuration, including the ramp-up, flat-top and ramp-down phases. Section 4 shows the alternative configurations for a flat top, whereas Section 5 draws the main conclusions of the work.
2. DTT Machine Configuration and Constraints
In this section, the present design of a DTT device is shown, and the main constraints considered for the development of the plasma scenarios are summarized.
2.1. Machine Description
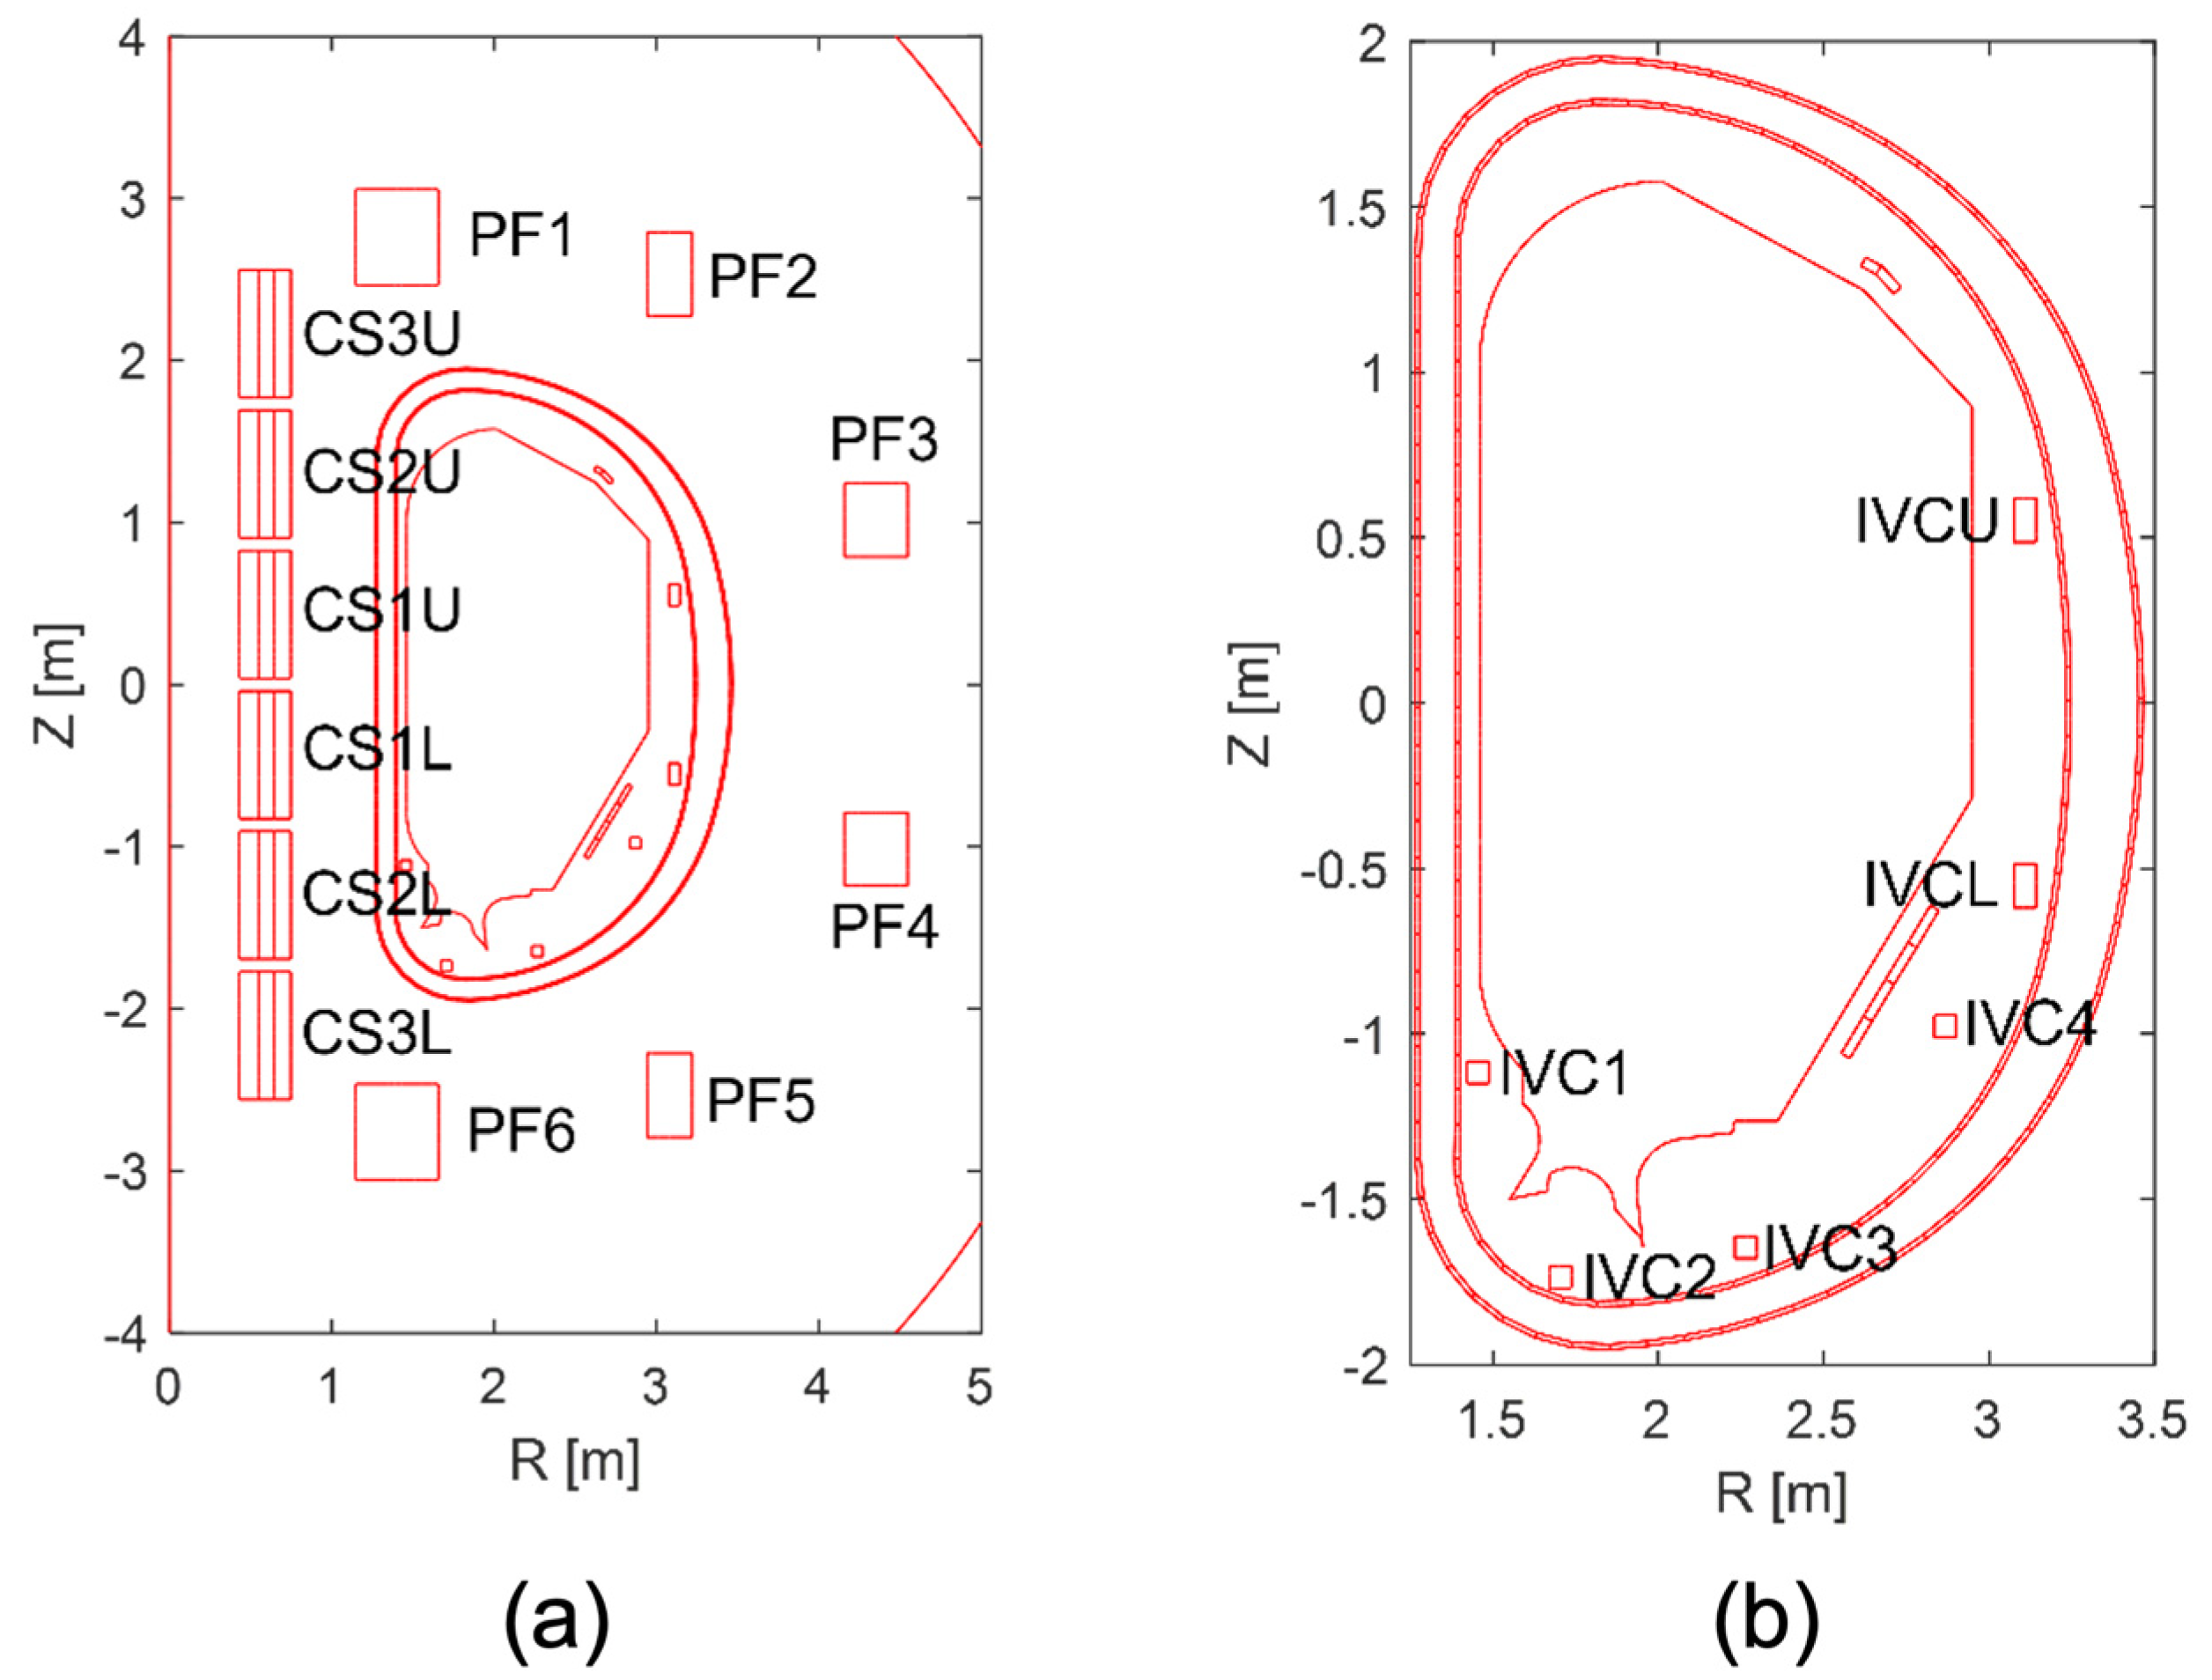
The current DTT design, whose poloidal section is illustrated in Figure 1, foresees a major radius = 2.19 m, a minor radius = 0.70 m with a maximum plasma current = 5.5 MA and a toroidal magnetic field = 6 T at R = 2.14 m.
DTT is characterized by two main passive structures, namely the vacuum vessel and the stabilizing plates. The vacuum vessel consists of two 15 mm thick shells in stainless steel 316LN. The in-vessel stabilizing plates consist of two loops with a thickness of 30 mm made of copper on the upper and lower side of the vessel, which are connected by a bridge so that the currents in the lower and upper part are anti-parallel and it only reacts to the net flux change of the plasma. The stabilizing plates allow DTT to have elongated plasmas with a relatively low growth rate of the vertical instability, with tolerable effects during the breakdown phase and robustness in the case of plasma disruptions.
The poloidal field magnetic coil system of DTT is characterized by 12 superconducting coils plus 6 in-vessel copper coils. The Central Solenoid (CS) is characterized by six modules, each of them consisting of the series of three conductors at high, medium and low fields realized in and capable of withstanding a peak magnetic field of = 13.6 T in the inner conductor. The current limit in the CS modules is = 31.34 kA. The six PF coils are realized in (PF1 and PF6) and (PF2, PF3, PF4 and PF5). In Table 1, the peak fields and the maximum currents of each PF coil are reported.
DTT is equipped with six in-vessel copper coils. Two up-down symmetric coils (IVCU and IVCL) are dedicated to the vertical stabilization of the plasma column and to the fast radial control of plasma centroid. Four additional coils (IVC1, IVC2, IVC3 and IVC4) located in the divertor region are dedicated to the control of quantities related to power exhaust and to the implementation of control strategies, such as strike-points sweeping [8]. It is important to remark that the nominal plasma scenarios are obtained without the contribution of the in-vessel coils. Table 2 reports the coordinates, the dimension and the number of turns of the superconducting magnets.
2.2. Plasma Scenarios Constraints
For the design of the plasma scenarios, the following constraints have been considered.
2.2.1. Vertical Forces
The force limits adopted on the CS/PF coils are:
- Maximum vertical force on the CS stack not exceeding 20 MN;
- Maximum separation force in the CS stack not exceeding 30 MN;
- Maximum vertical force not exceeding 30 MN for PF1/PF6;
- Maximum vertical force not exceeding 40 MN for PF2/PF5 and PF3/PF4.
2.2.2. Magnetic Fields
The maximum magnetic field at the location of the CS coils shall not exceed 13.6 T in the high field section, 10.8 T in the medium field section and 8.9 T in the low field section. The maximum magnetic field at the location of the PF coils changes as a function of the radial coordinate of the coils. Peak magnetic field values are reported in Table 1.
2.2.3. Plasma
- Minimum distance of 40 mm between the plasma and the inner side of the first wall;
- Minimum distance of 60 mm between the plasma and the outer side of the first wall;
- The maximum plasma current is 5.5 MA, whereas the plasma shape parameters should be similar to the present EU design of DEMO, with a (plasma triangularity) and (plasma elongation) ; with these parameters, taking into account the presence of the passive conductor, the plasma control system is able to stabilize the plasma vertically by means of the in-vessel coils.
2.2.4. CS/PF Voltages
The plasma scenarios have been designed according to the following voltage limits for CS/PF coils:
- Maximum voltage of 800 V for CS circuits;
- Maximum voltage of 2 kV for PF1 and PF6;
- Maximum voltage of 3 kV for PF2, PF3, PF4 and PF5.
3. SN Plasma Scenario
The reference SN scenario is characterized by a 5.5 MA plasma current at flat-top and a total duration of about 100 s. In the following, the details of the pre-magnetization, the ramp-up, flat top and ramp-down phases are presented. The plasma configurations have been produced by the CREATE-NL code [9] and optimized using the CREATE-L code [10].
3.1. Pre-Magnetization
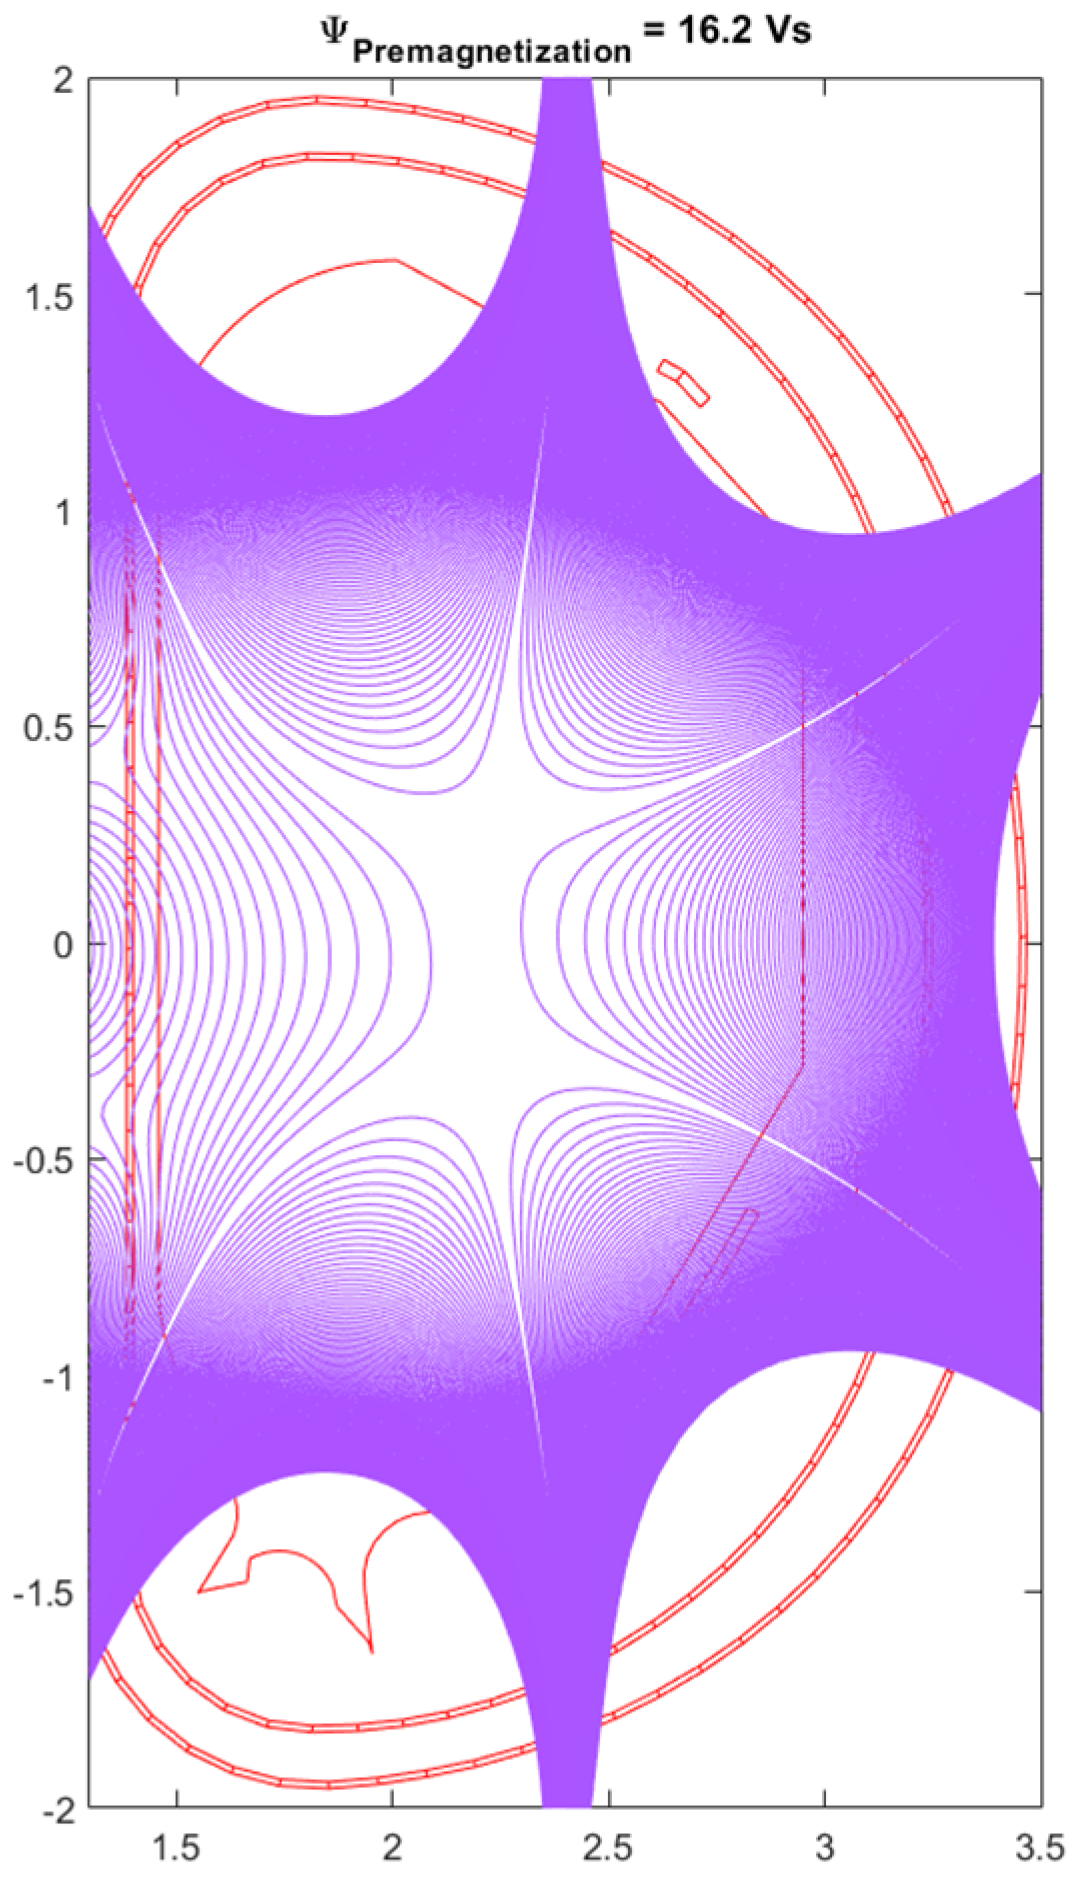
A good magnetic field null during the plasma breakdown (i.e., a large central hexapolar region even at the low field) can also be guaranteed in the most demanding case (ohmic breakdown without EC assistance) with a toroidal electric field of 0.8 V/m. This configuration can be obtained with various combinations of currents satisfying the constraints of Section 2.2, starting from a premagnetization characterized by a poloidal flux of 16.2 Vs (Figure 2).
3.2. Ramp-Up Phase
The ramp-up phase has been designed according to premagnetization flux of = 16.2 Vs (Figure 2) and applying the Ejima formula with = 0.35 [11]. Indeed, the flux at the start of the flat-top (SOF) turns out to be:
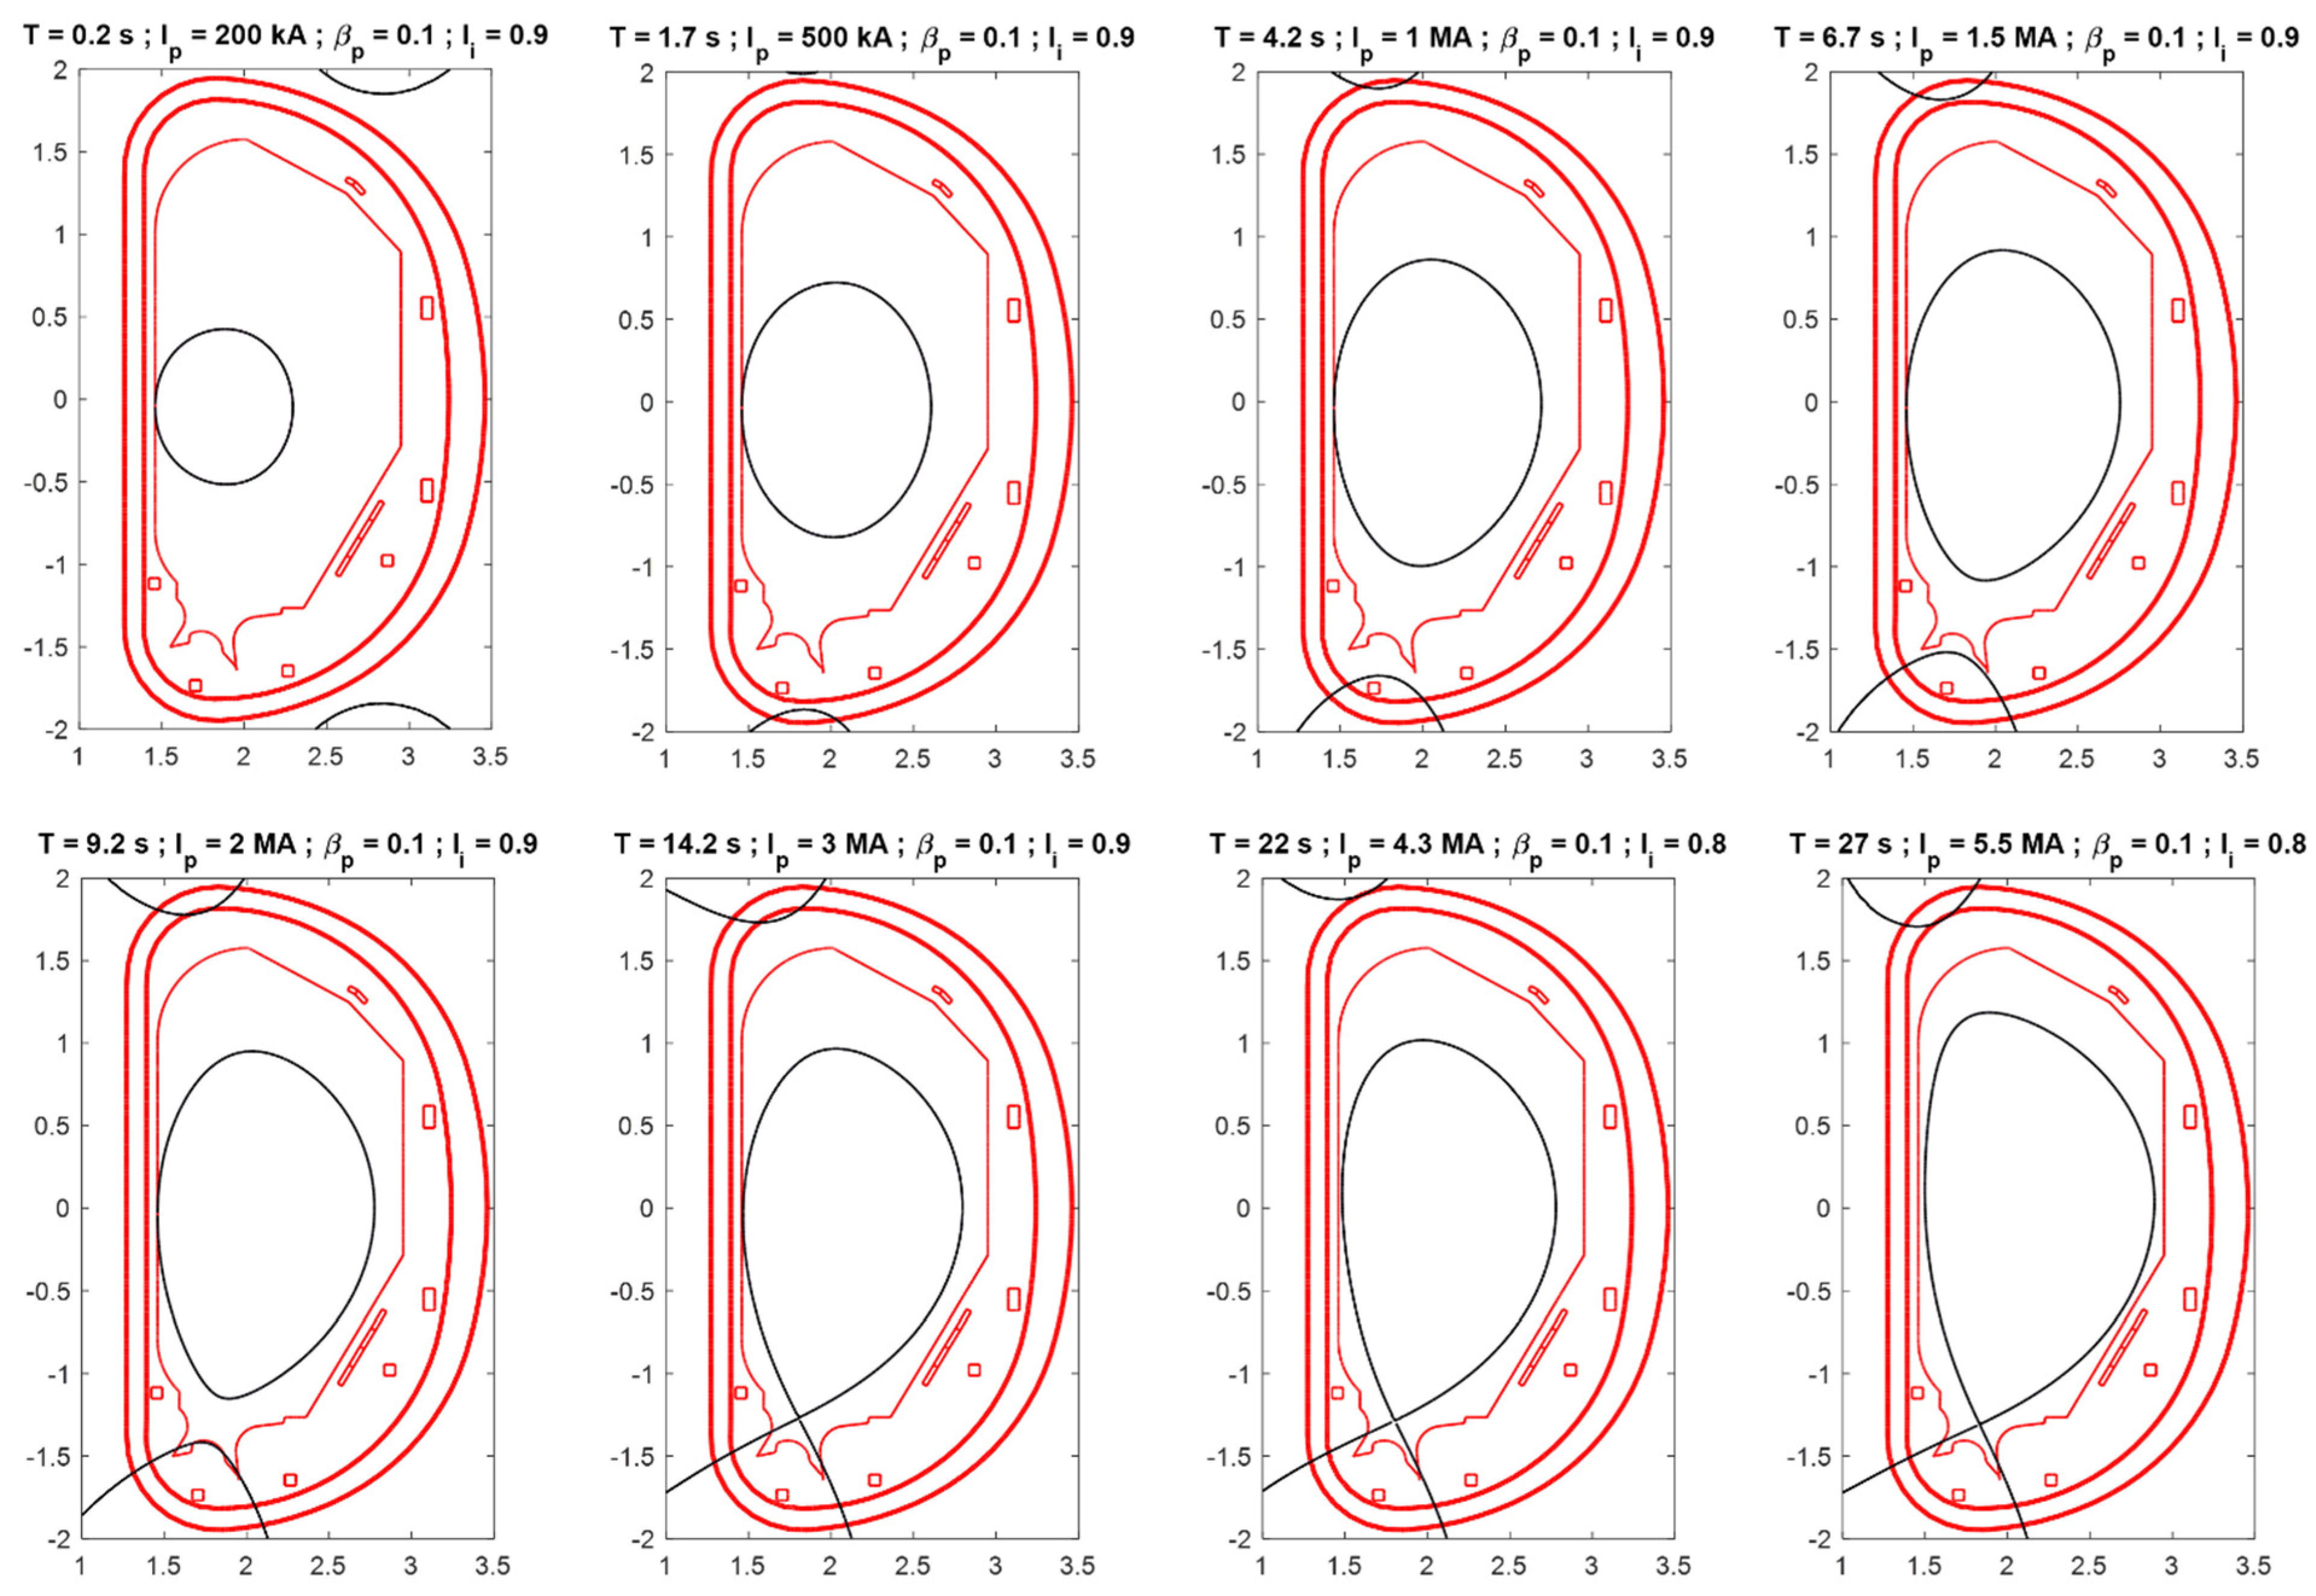
After the breakdown phase, with a hexapolar null point in the center of the chamber, at = 0.2 s a first circular plasma with = 200 kA, (poloidal beta) = 0.1 and (internal inductance) = 0.9 is obtained. Progressively, the plasma current is assumed to increase with a ramp rate of 200 kA/s, while the plasma shape evolves from a circular to an elliptical shape leaning on the inner side of the first wall. Between = 9.2 s and = 14.2 s, the plasma current rises up to 3 MA, achieving the X-point formation keeping and constant. In this ramp-up scenario, the plasma remains in a limited configuration for about 15 s. From = 14.2 s to = 27 s, the current reaches its flat-top value of 5.5 MA, and the plasma shape parameters achieve their target values while remains at a low value. It is worth mentioning that, according to the voltage limits presented in Section 2.2, the ramp-up phase can be realized with a maximum plasma current rate value of about 650 kA/s due to the 800 V limitation of CS power supplies.
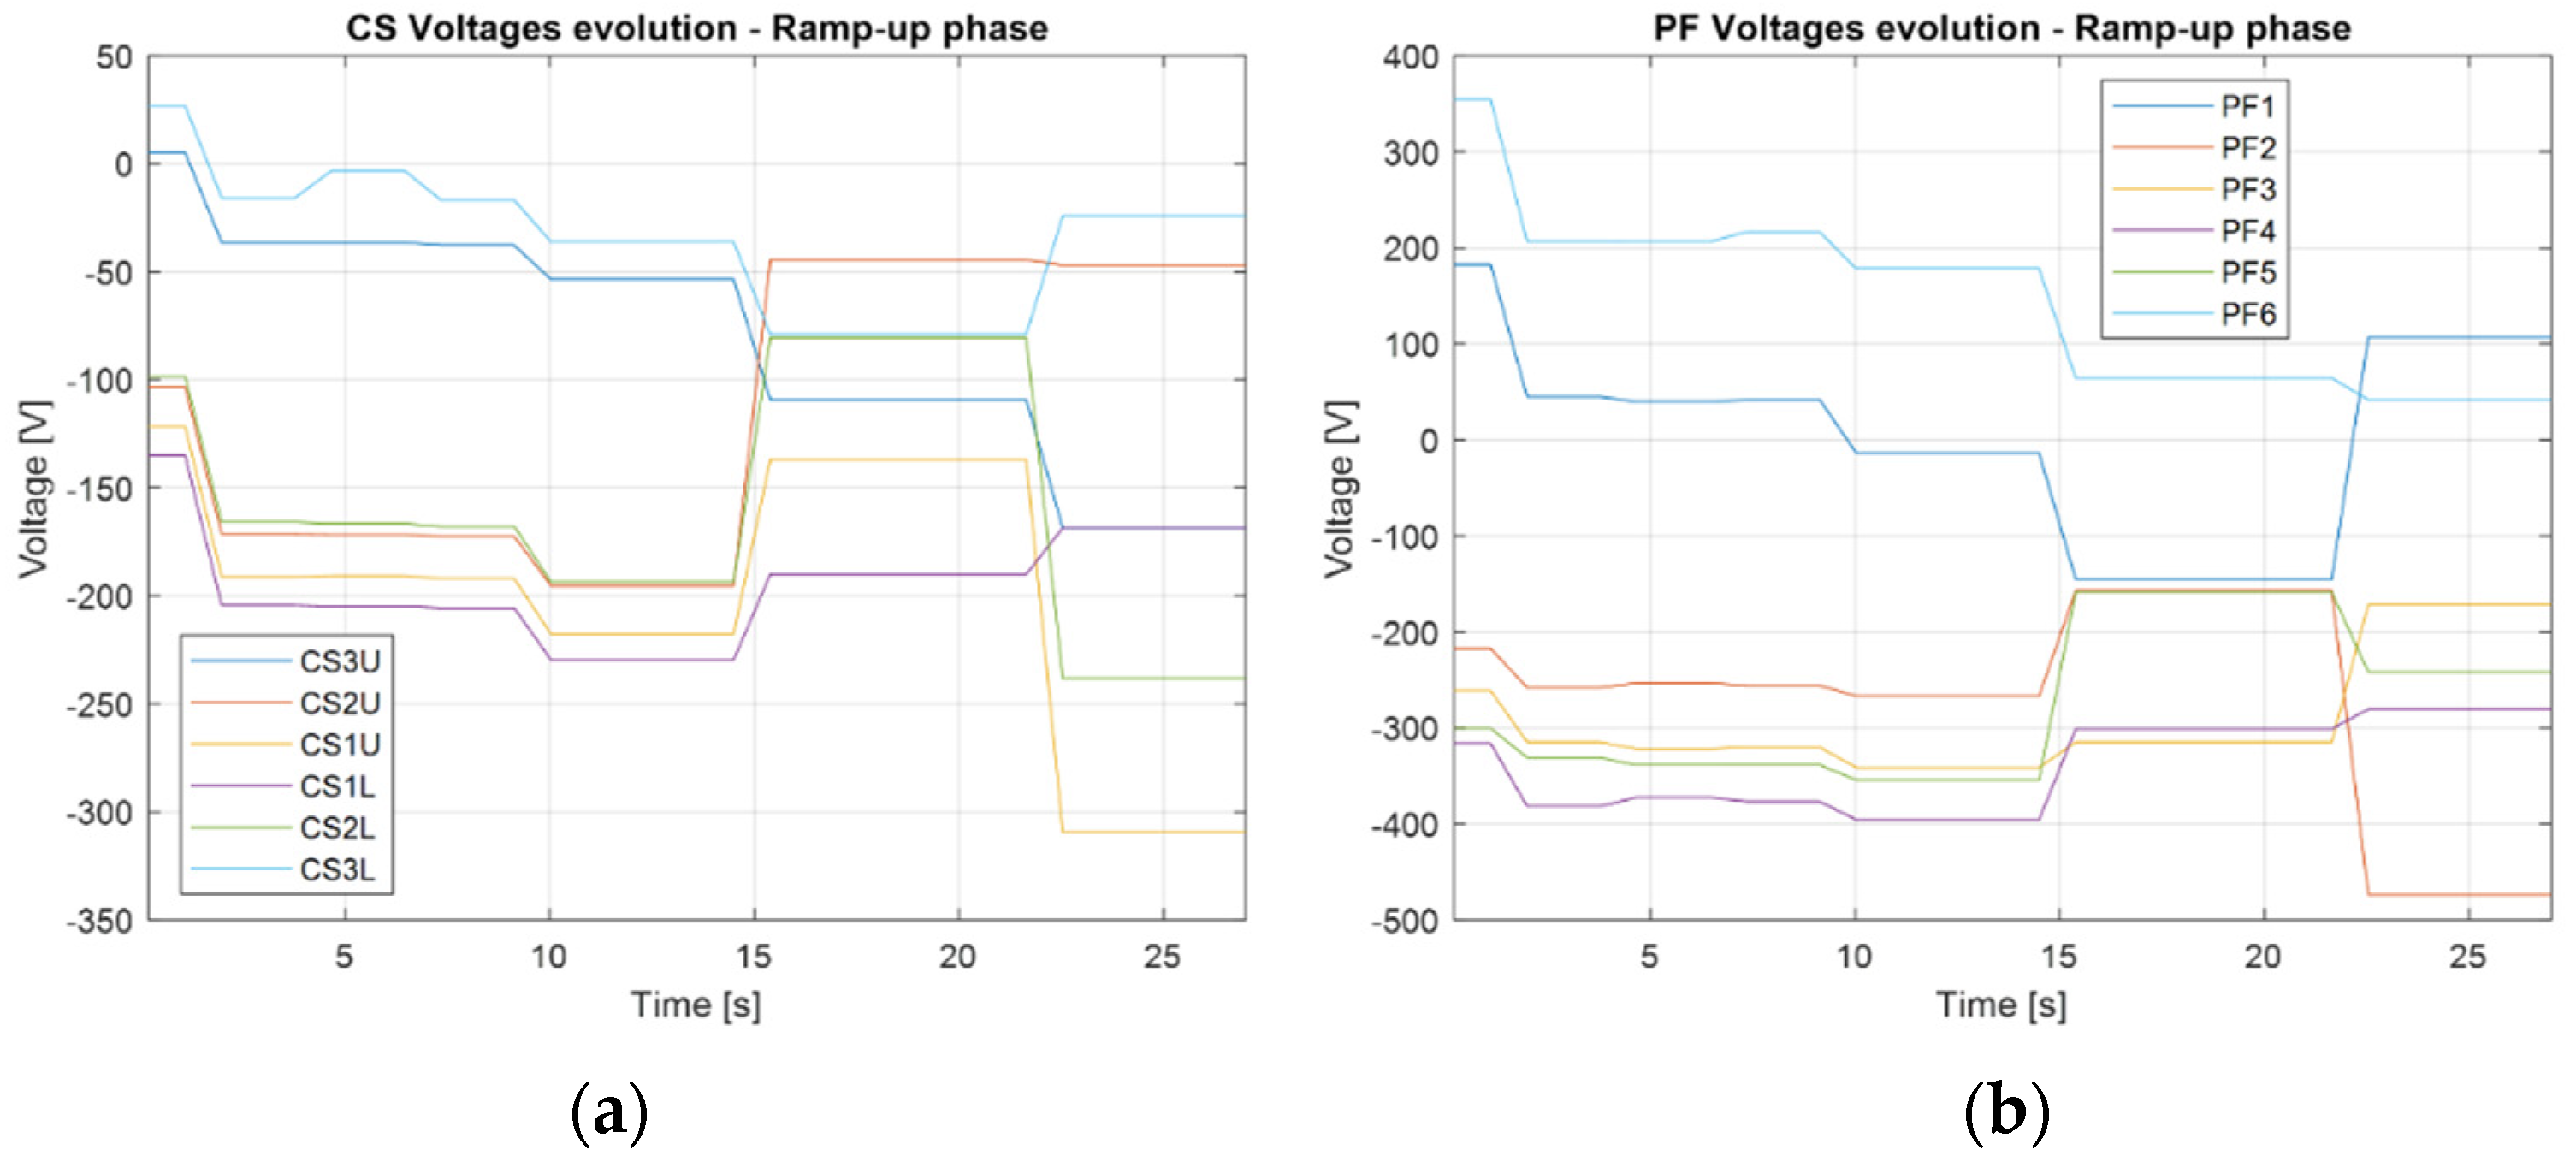
Figure 3 shows the time evolution of plasma shapes during the ramp-up phase, while Table 3 provides the evolution of CS/PF currents. In Figure 4, the time traces of CS/PF voltages during the ramp-up phase are reported, and in Table 4, the time evolution of main plasma parameters, such as radial and vertical position of plasma centroid ( and ), boundary flux (), safety factor (), plasma perimeter and volume ( and ), is reported.
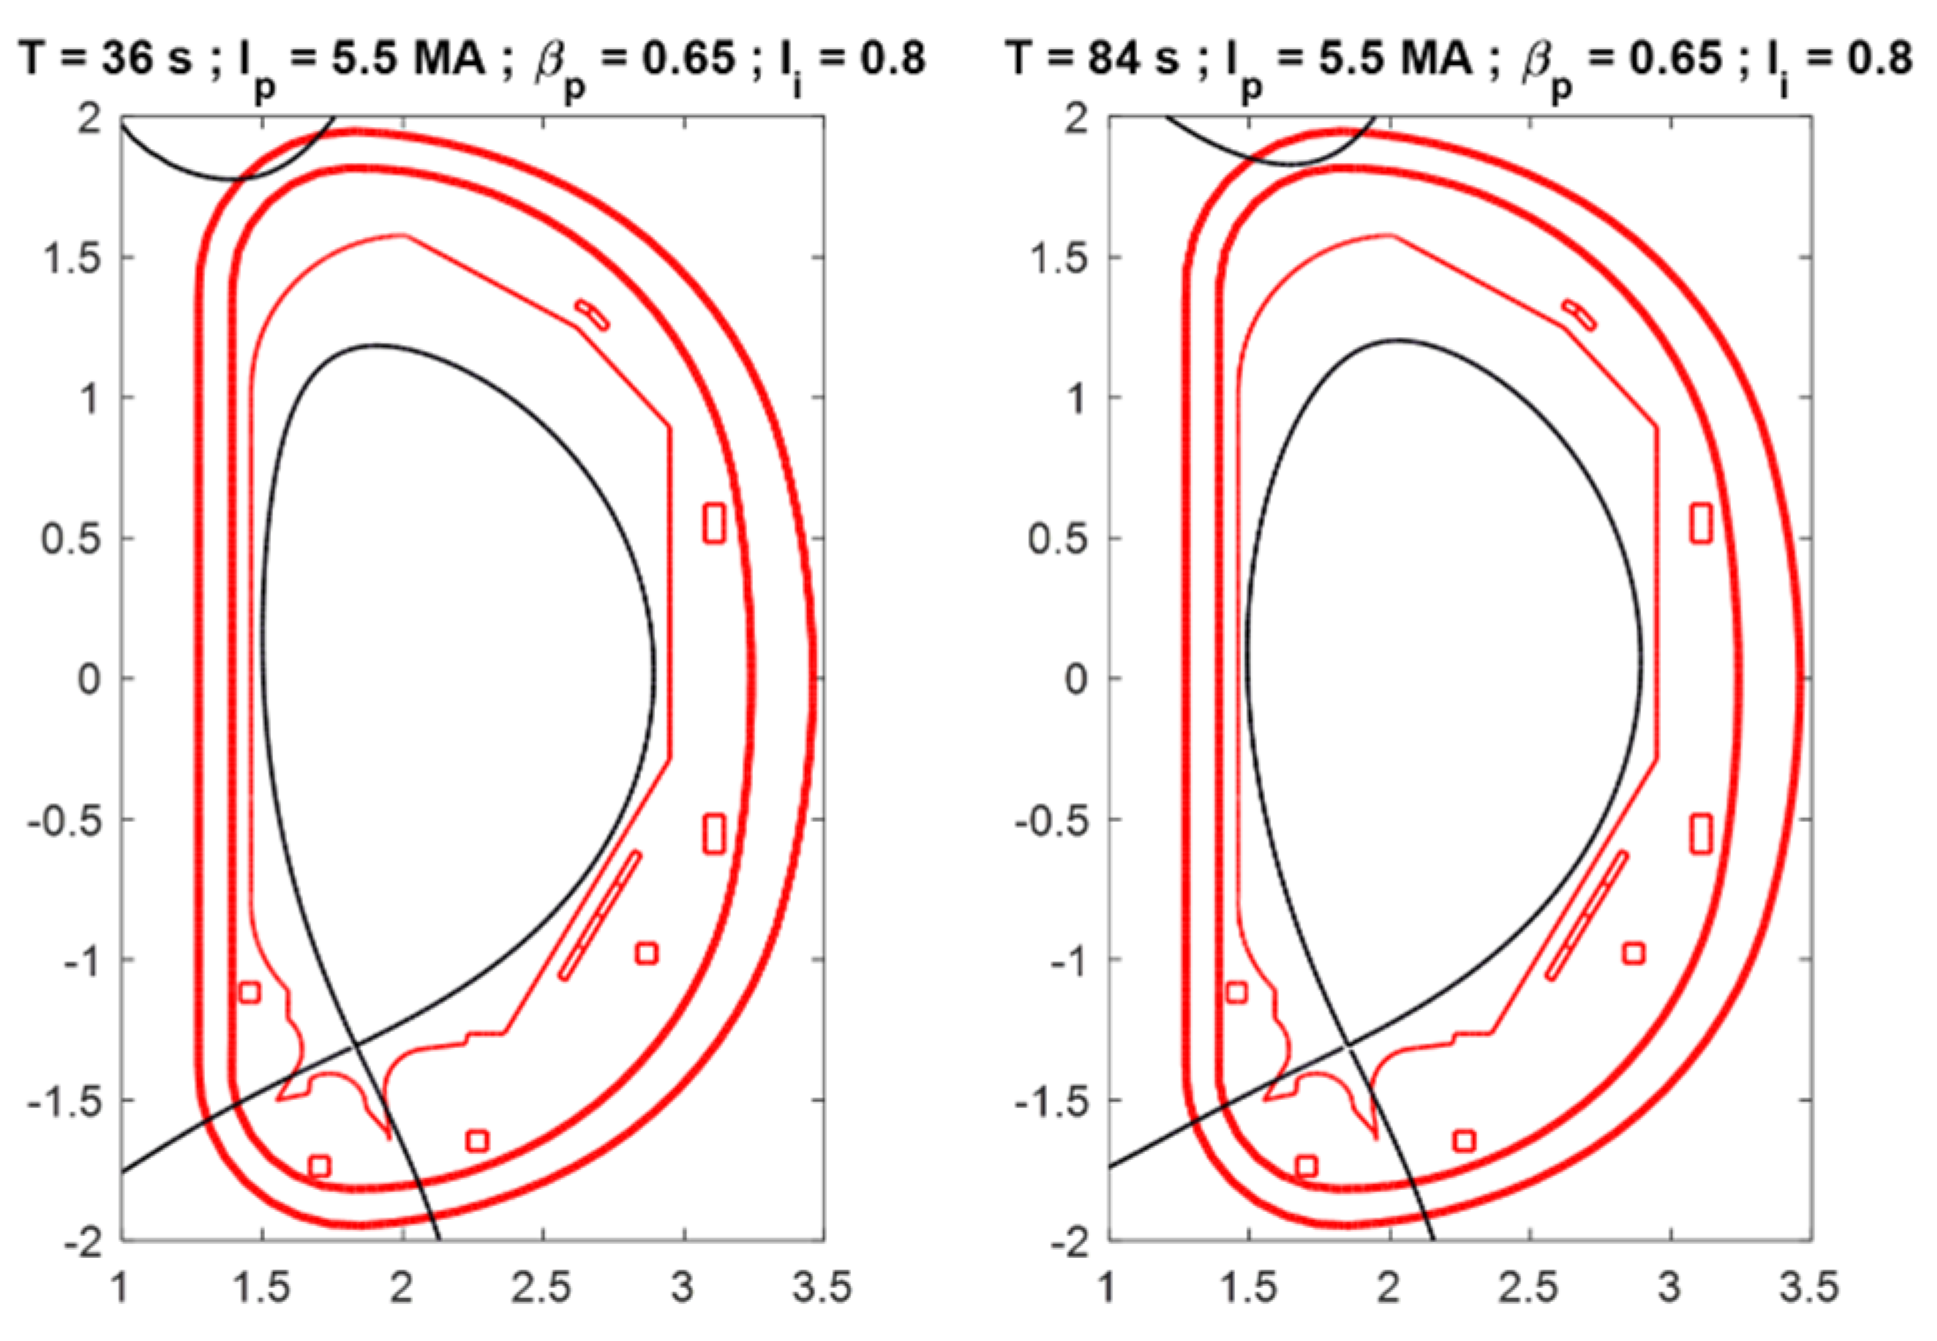
3.3. Flat-Top Phase
Once the current ramp-up phase is terminated at = 27 s, the plasma current has reached the reference flat top value of 5.5 MA while the poloidal beta is still 0.1.
The transition from low (L-mode) to high (H-mode) energy confinement time is obtained by introducing thermal energy into the plasma above a certain threshold value. The back H–L transition is also observed in some cases. These transitions are characterized by a significant change of .
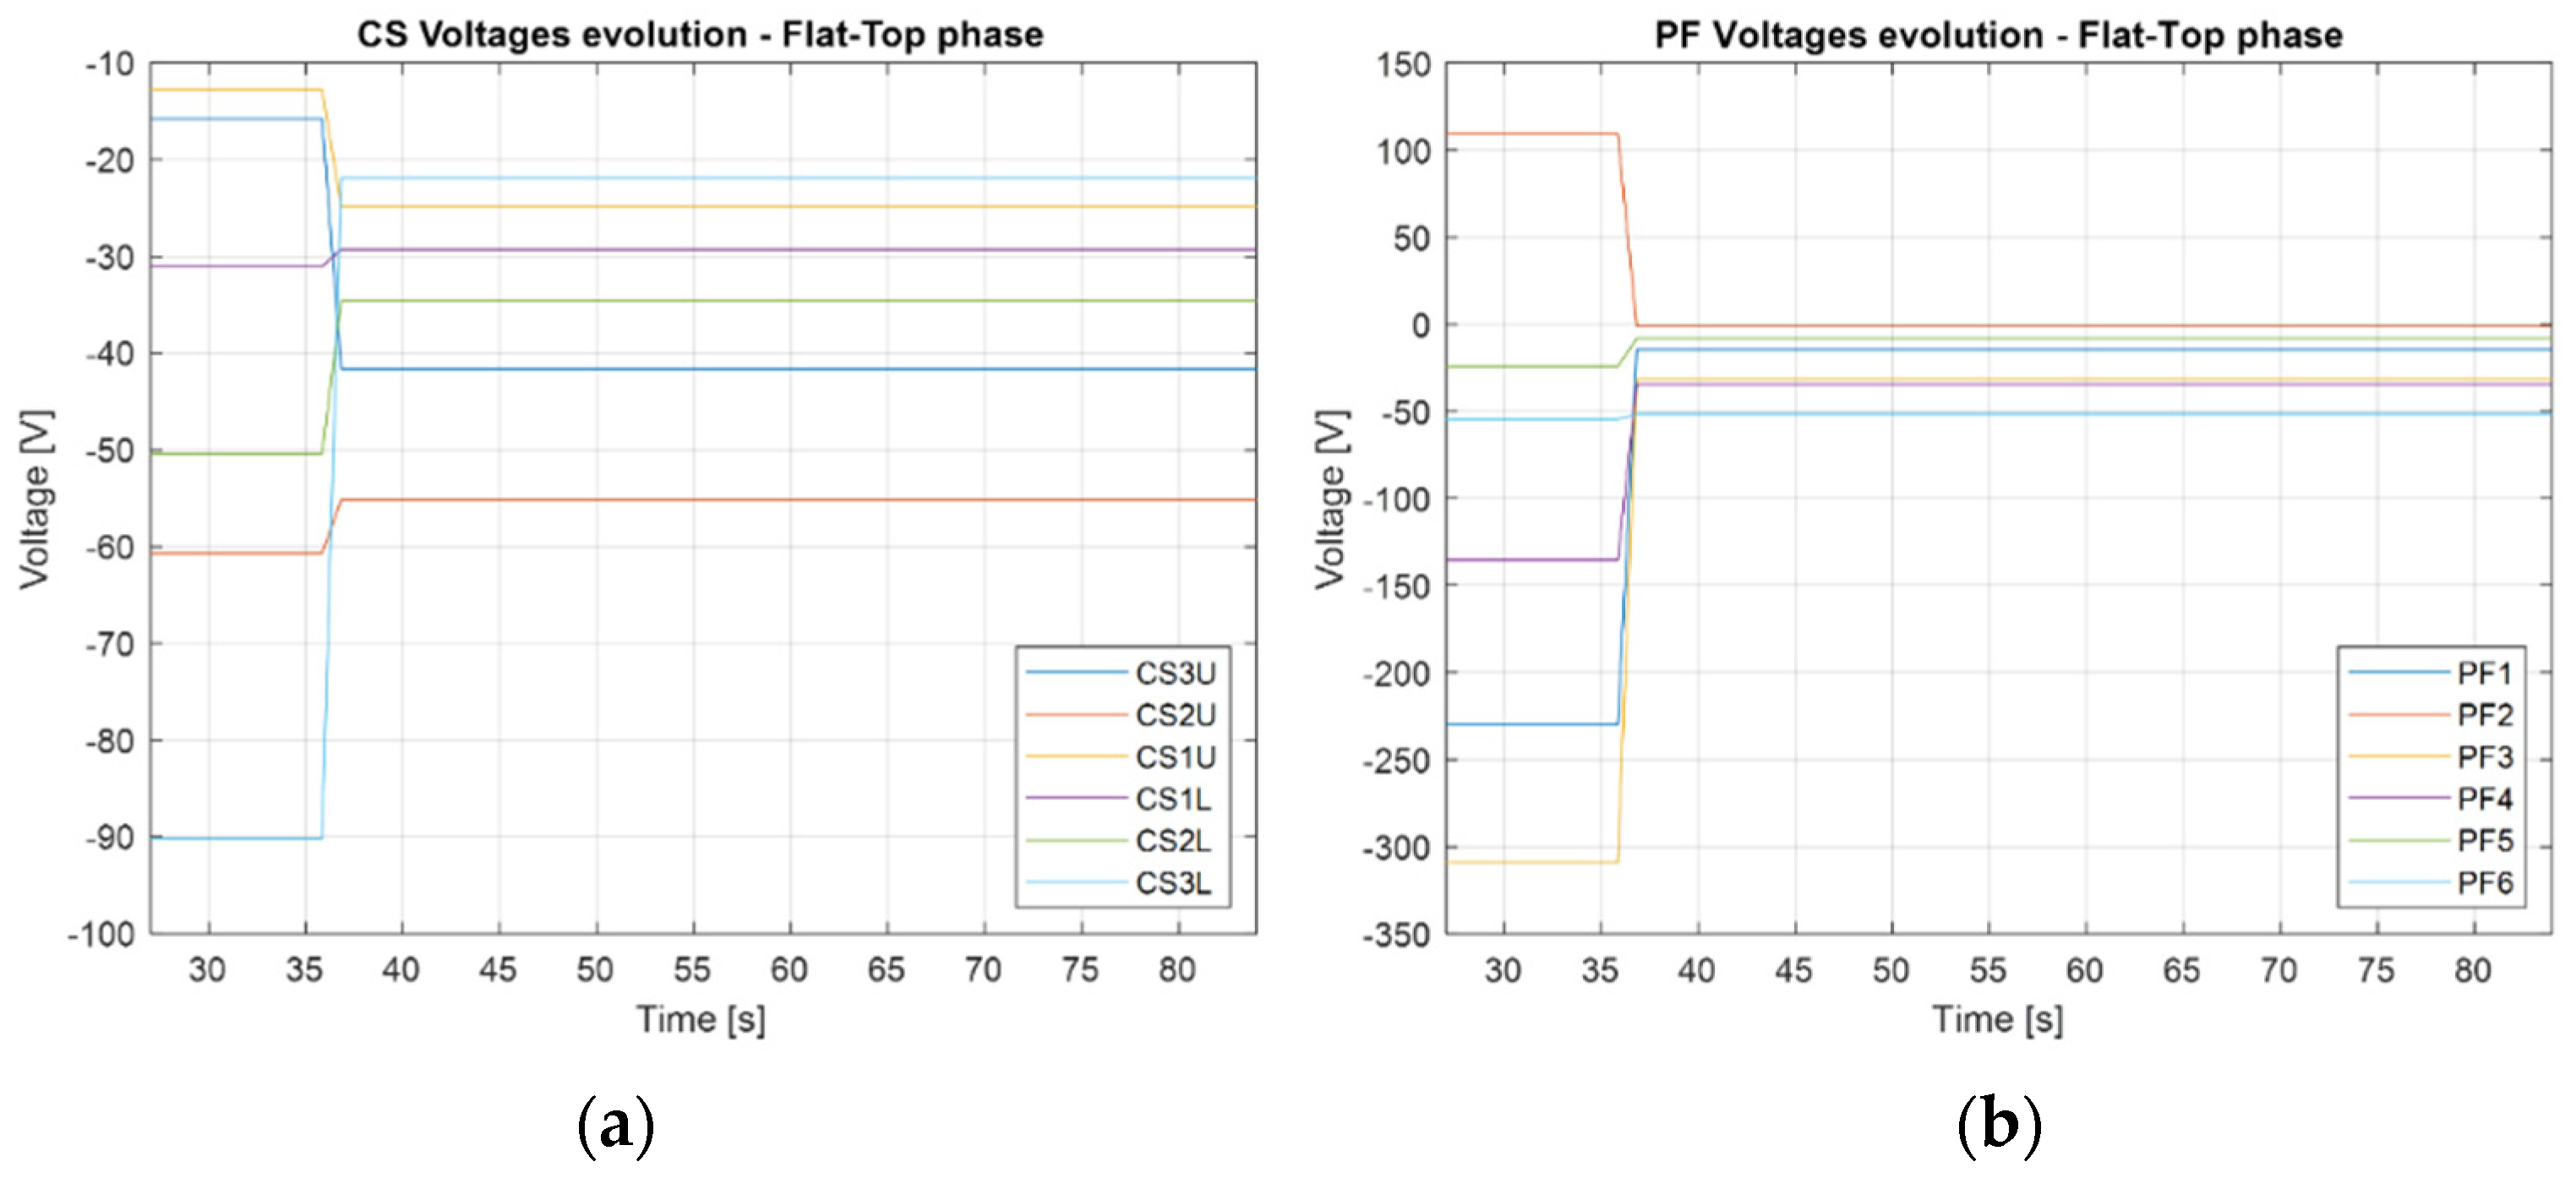
Waiting for a more detailed description of the L–H transition, we assume that at = 36 s full additional heating is applied, causing an increase of the internal kinetic energy on a time scale longer than the plasma energy confinement time with an increase of from 0.1 to the target value of 0.65. After = 36 s, all plasma physical parameters are assumed to remain nearly constant up to the end of the plasma current plateau at = 84 s. The duration of the flat-top is determined by the estimation of the loop voltage that in DTT is fixed at 0.16 Vs, assuming full additional power. It is worth mentioning that it would be possible to reach an end of flat-top configuration (EOF) at = 89 s, fulfilling all the engineering constraints reported in Section 2, but a margin needs to be stored to allow a safe H–L transition. In Figure 5, the time evolution of plasma shapes during the flat-top phase is illustrated, while in Figure 6 the behavior of voltages in the flat-top phase is presented. Table 5 and Table 6 report the behavior of currents and main plasma parameters.
3.4. Ramp-Down Phase
For the definition of the plasma snapshots during the ramp-down phase, the H–L transition has been modeled as a drop of from the flat-top value of 0.65 to 0.1 within a time interval of 1 s with fixed plasma current, assuming a mean value of among flat top case (0.16 Vs) and the ramp-down case (0.8 Vs). The main assumptions used for the design of the plasma ramp-down phase are hereafter reported:
- Constant ;
- An increase of from 0.8 at 5.5 MA to 1.2 at 1 MA;
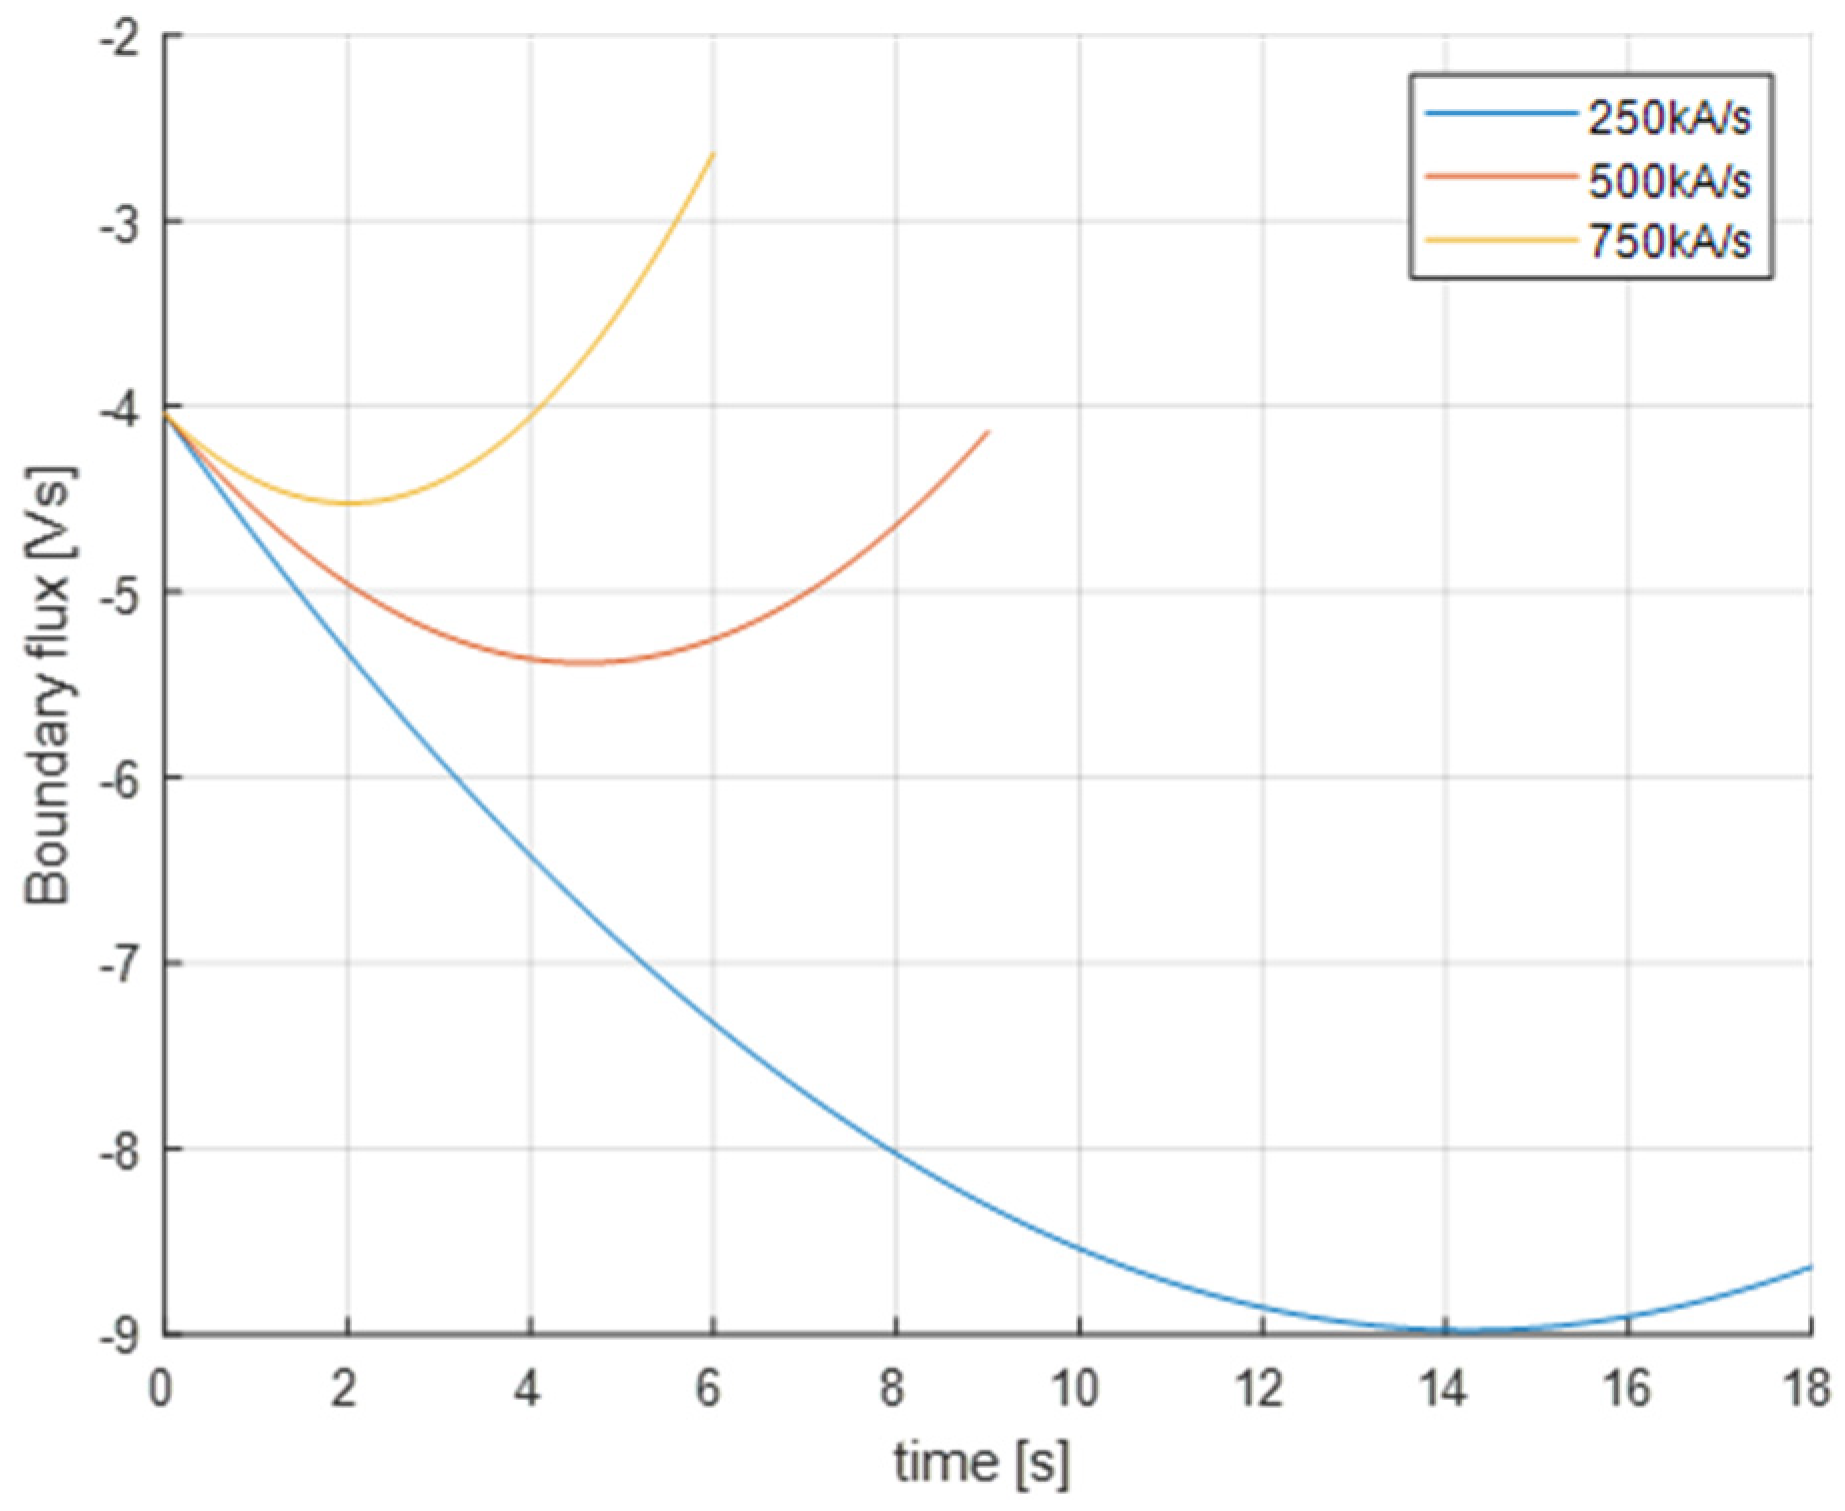
- Boundary flux variation:
We assume a decrease of from V at 5.5 MA to V at 1 MA (75% drop during ramp-down). In DTT, we have assumed three possible ramp rates for the ramp-down phase of 250 (natural ramp rate for DTT), 500 and 750 kA/s. In Figure 7, the behavior of the boundary flux , according to Formula (2), for different plasma current ramp rates is illustrated. For the sake of simplicity, in the following, we will focus on ramp-down with a 250 kA/s plasma current ramp rate.
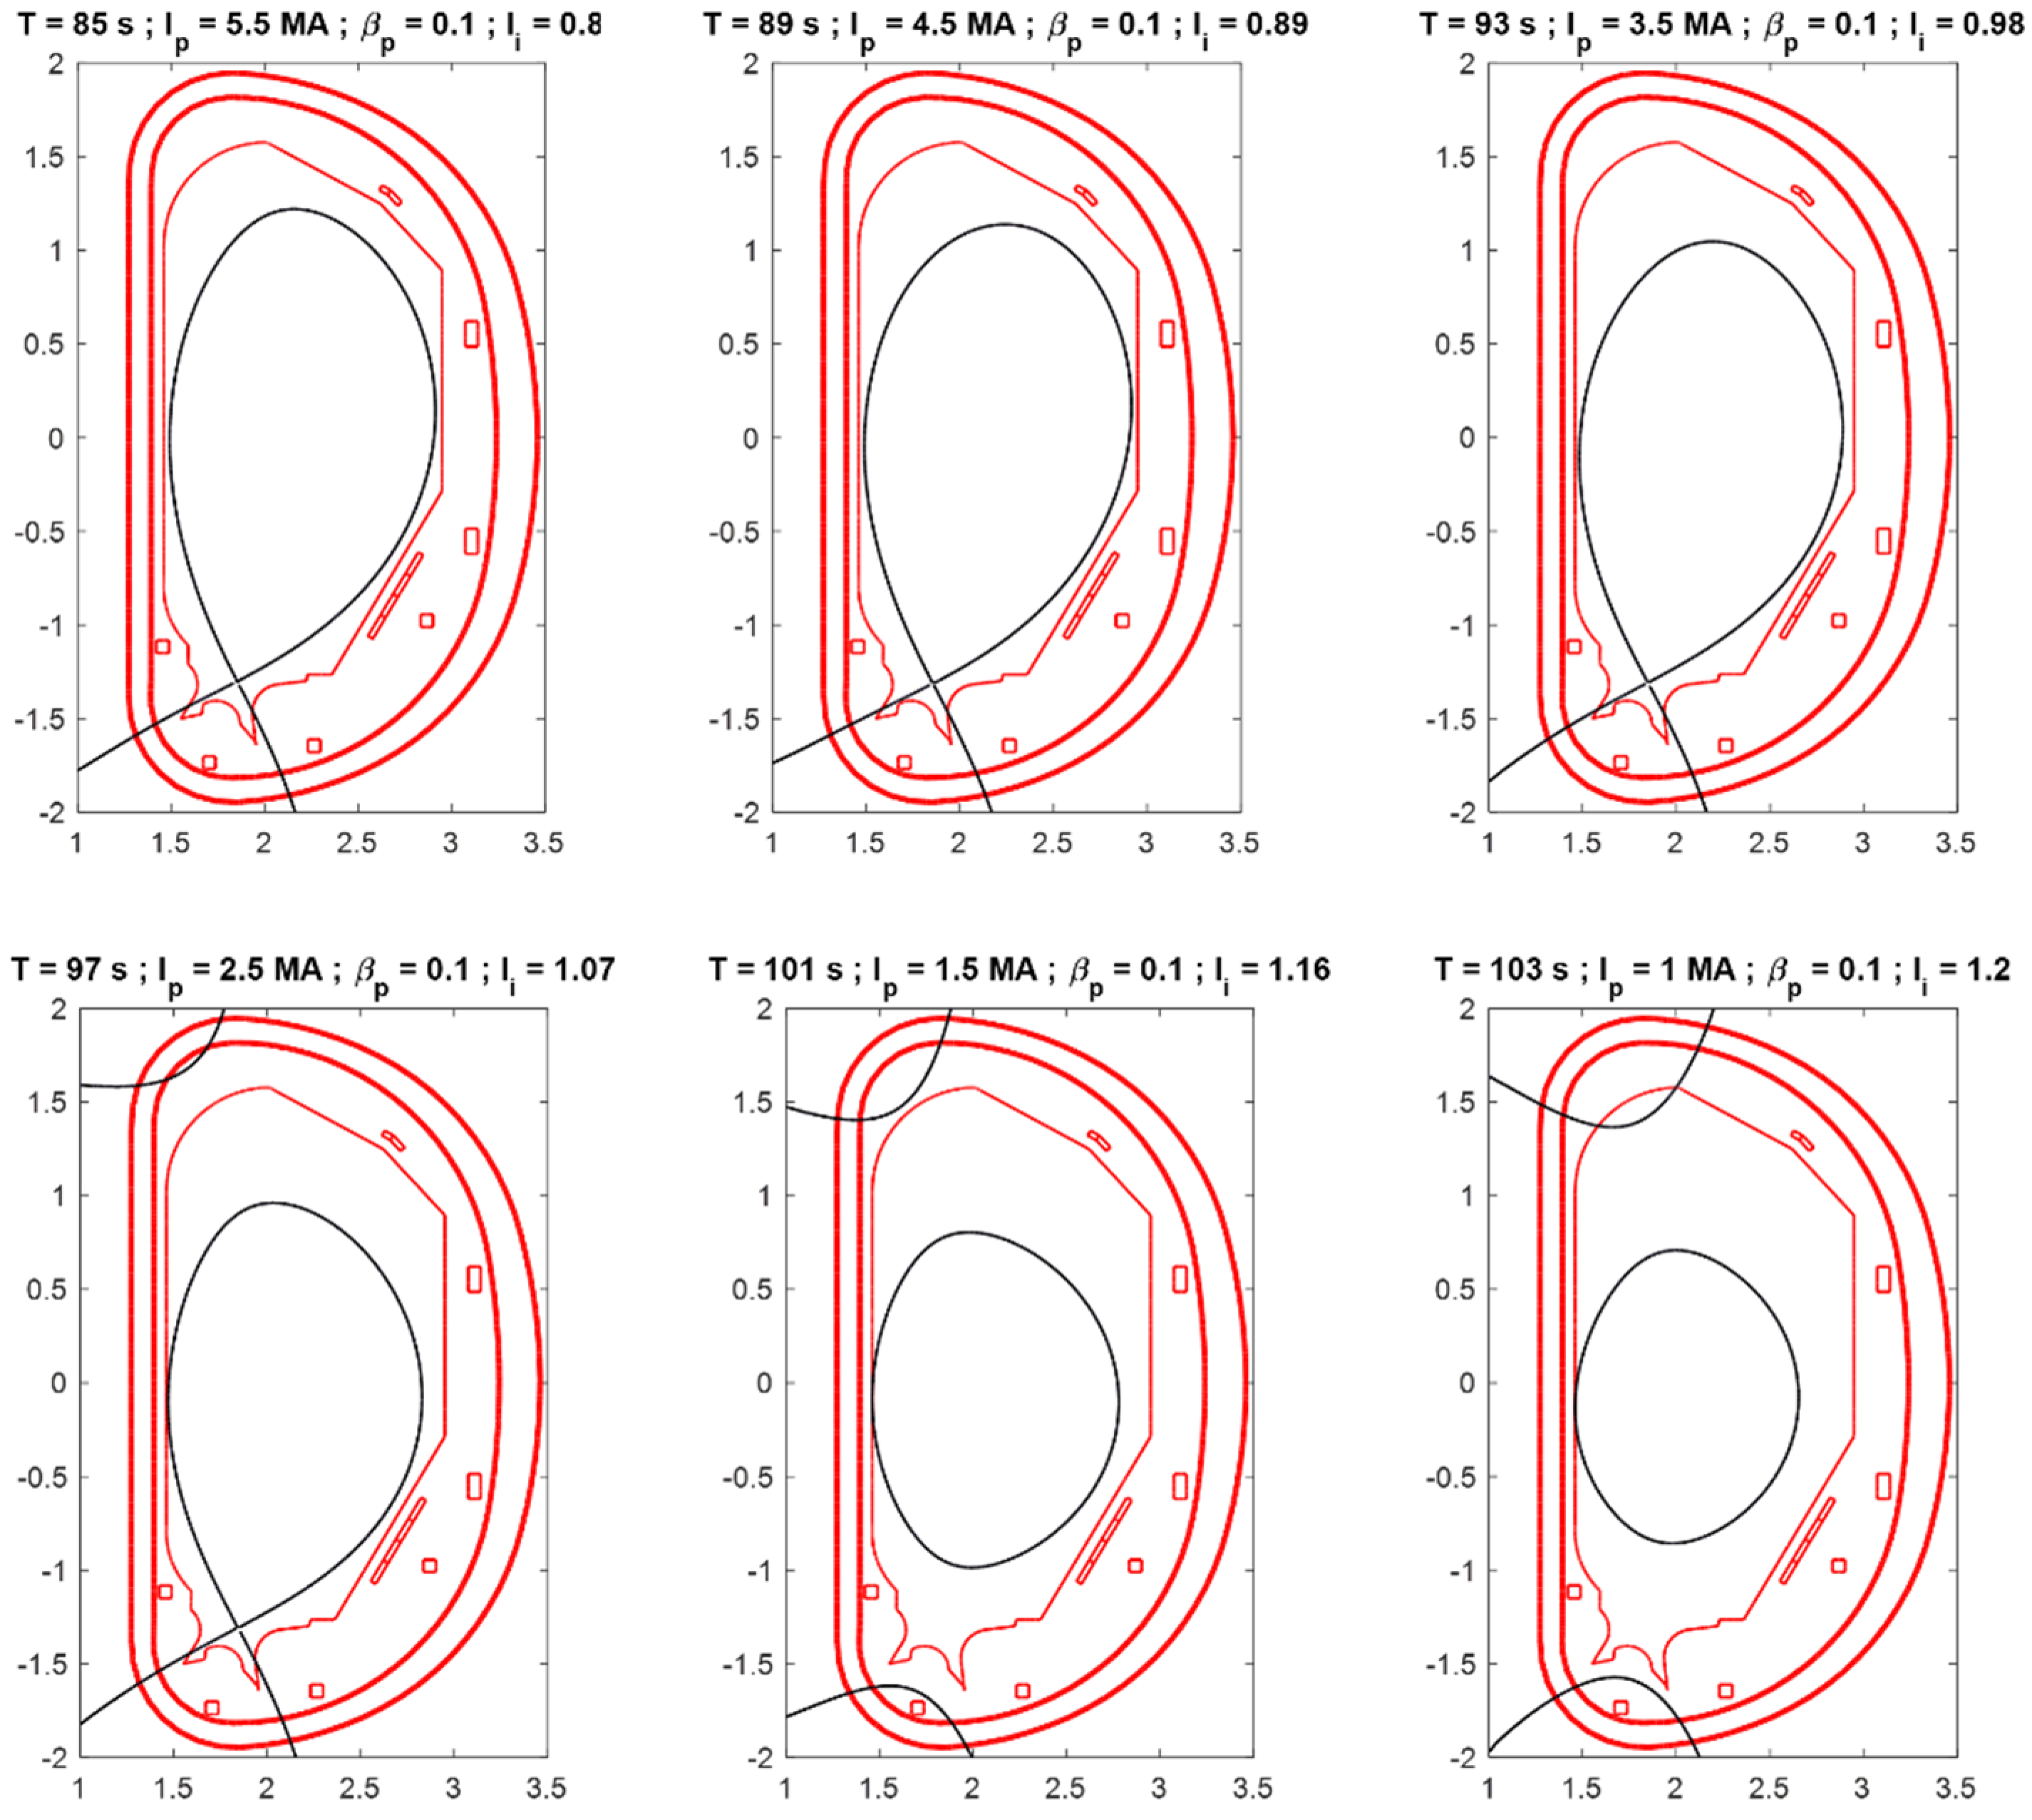
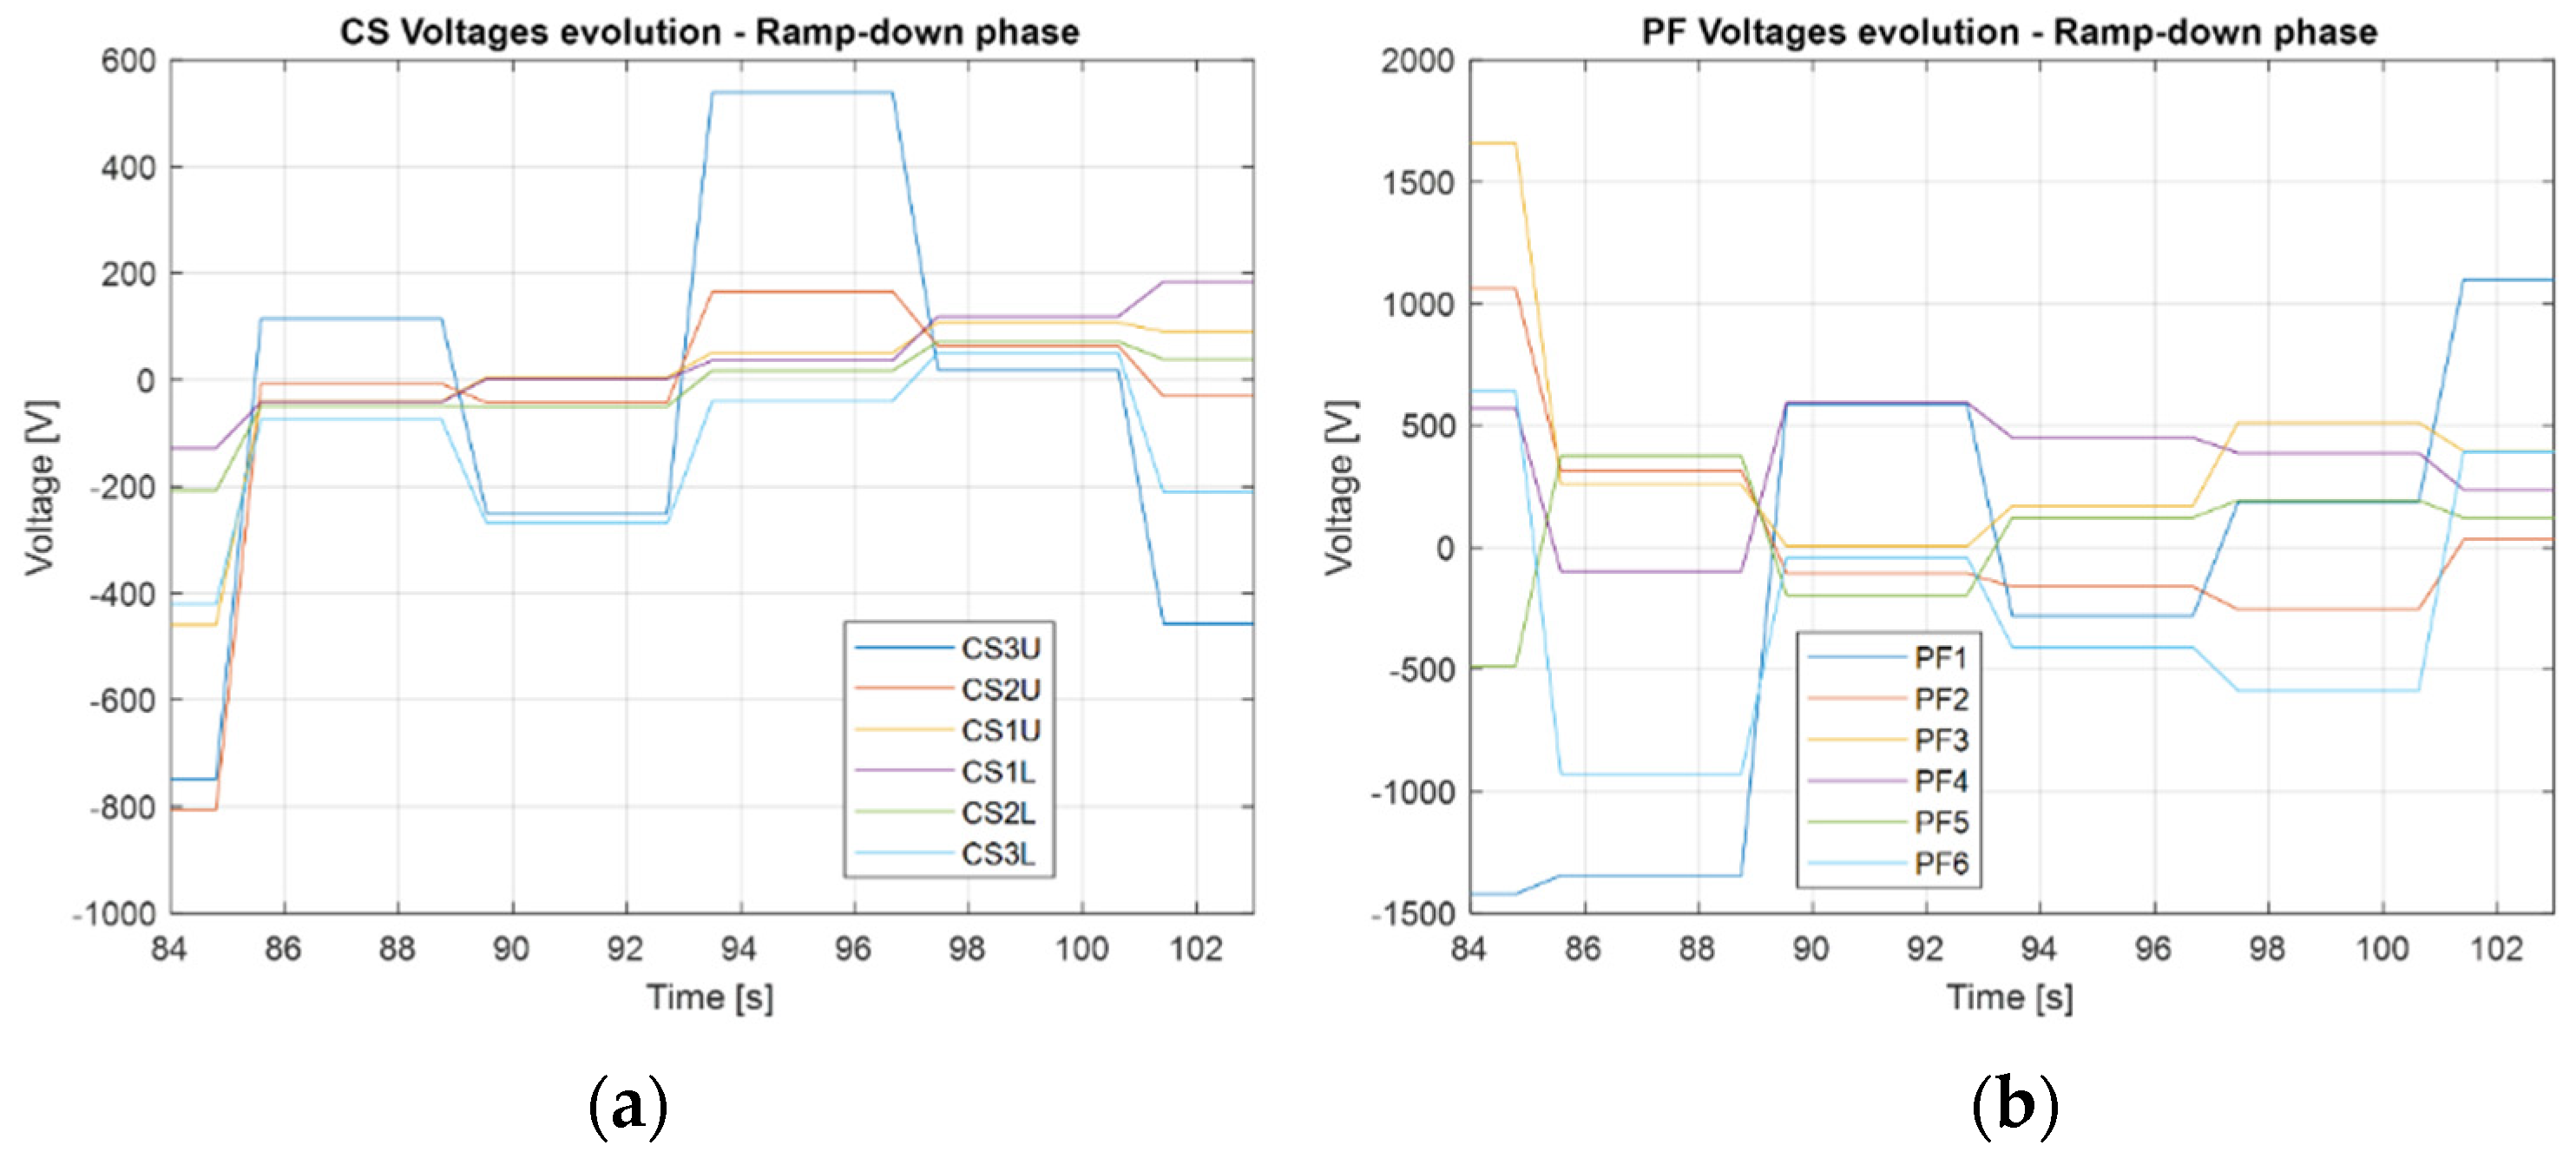
After the H–L transition, the plasma volume gradually reduces while is kept constant to 0.1 and linearly increases. Plasma shape evolves from an elliptical shape to a circular one, and in the time interval between 97 and 101 s, the divertor to limiter transition occurs. After 103 s, the plasma discharge is terminated. For future development, the possibility to delay the divertor–limiter transition is under analysis. In Figure 8 and Figure 9, the time evolution of plasma shapes and CS/PF voltages during the ramp-down phase are reported, respectively, while in Table 7 and Table 8, the behavior of currents and plasma parameters are presented.
4. Alternative Plasma Configurations
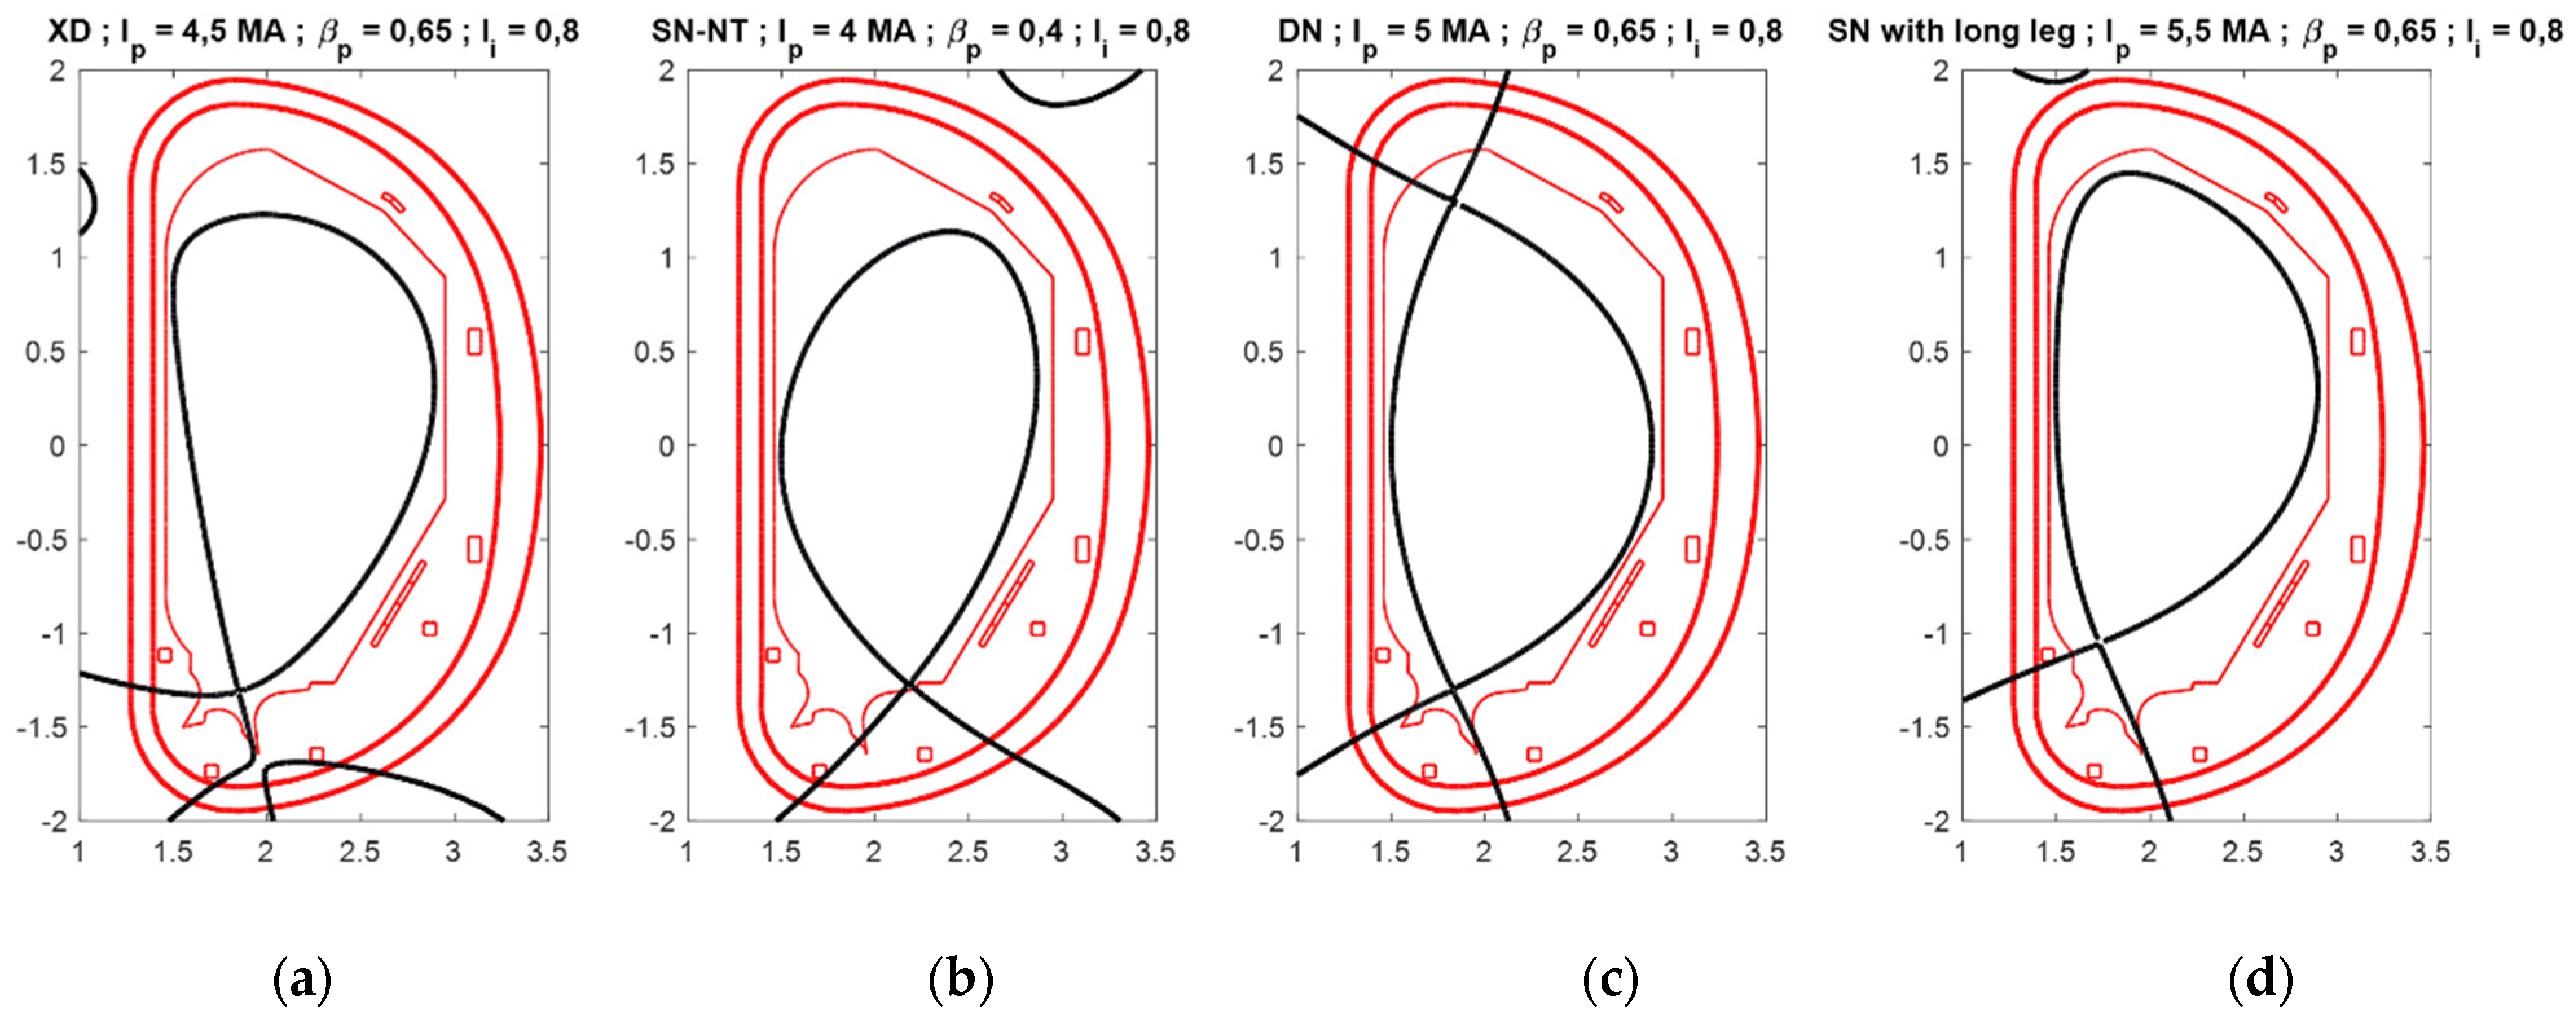
The flexibility of the DTT machine allows it to produce a wide range of alternative configurations, which increase divertor radiation without excessive core performance degradation, to study different solutions to the power exhaust problem. DTT tokamak is, in fact, capable of realizing XD at 4.5 MA, SN-NT at 4 MA, DN at 5 MA and SN with a long leg at 5.5 MA.
Impurity seeding is likely to be required for dissipation of the high values of power flux both for SN [5] and alternative configurations [12]. Impurity seeding increases the effective ion charge Zeff, which, in turn, has an effect on the flat-top duration.
Power flux density reduction on the divertor target is obtained by various means, e.g., plasma detachment, flaring of the magnetic field lines and strike point sweeping. Plasma detachment is characterized by the dissipation of power, momentum and particle flux along the open field lines from the midplane to the divertor, where the neutral particles are not obliged to spiral around magnetic field lines. The XD concept [13] seeks to flare flux surfaces near the divertor target by placing a second X-point behind the divertor plate, with a consequent increase of flux expansion. This flaring may introduce a mechanism that counteracts the upward movement of the detachment front and result in a more robust detachment [14], similar to the stability of a stationary shockwave in a supersonic nozzle flow. The DTT device is able to develop an XD divertor scenario at 4.5 MA characterized by a flat-top duration of 40 s. Furthermore, since DTT is equipped with four coils located in the divertor region, the local magnetic topology can be easily modified (e.g., the distance between the null points) in order to study possible beneficial effects on power exhaust-related quantities.
The main feature of SN-NT [15] configuration is to reach H-mode-level confinement, maintaining a low edge pressure so as to have ELM-free regimes. Encouraging results have been obtained on TCV [16] and DIII-D [17], with a consequent increasing interest towards the negative triangularity concept. In the DTT device an SN-NT scenario at 4 MA characterized by an upper triangularity = −0.30 and a flat-top duration of 70 s can be realized. According to the particular topology of the SN-NT plasma shape, a dedicated divertor able to accommodate such a configuration must be realized.
The DN configuration is characterized by a second null point located in the upper part of the main chamber. This diverts a significant fraction of the heat load to the inner divertor of a SN to a second target at a larger radius, which increases the wall interaction area and decreases the peak heat load reaching the targets. However, it also decreases the connection length to the target. In DTT tokamak, it is possible to realize a DN configuration at 5 MA thanks to the up-down symmetry of the CS/PF coils system. It is worth mentioning that, in order to realize the DN configuration, an upper divertor is mandatory.
The concept of SN with a long-leg is very similar to the Super-X (SX) [18], which aims to increase the total flux expansion by increasing the major radius of the divertor target. SN with long-leg at 5.5 MA has been realized in DTT by modifying the SN configuration. In particular, the outer leg length has been increased up to 55 cm while the upper part of the plasma has been moved toward the first wall in order to keep = 1.66.
5. Conclusions
In this paper, the SN and alternative plasma configurations for DTT tokamak have been presented. The SN plasma scenario has been analyzed in detail, showing the ramp-up, flat-top and ramp-down phases. The ramp-up phase has been optimized with a plasma current rate variation of 200 kA/s reaching the SOF configuration at = 27 s. However, a maximum plasma current ramp of 650 kA/s can be imposed, fulfilling all engineering constraints. Concerning the flat-top phase, to realize an H-L transition compatible with the coil voltage limits, the EOF equilibrium has been fixed at = 84 s (even the flat top might be extended up to = 89 s). Regarding the ramp-down phase, according to the constraints of Section 2, the current can decrease at a rate from 250 to 750 kA/s.
Furthermore, alternative plasma configurations have been presented, proving the good flexibility of the DTT device, which is capable of obtaining DN at 5 MA, XD at 4.5 MA, SN-NT at 4 MA and SN with a long leg at 5 MA. Although these configurations are feasible from an electromagnetic point of view, some modifications must be applied to the machine geometry in order to accommodate such plasma shapes. The need to develop and study alternative divertor concepts is the main feature of DTT, whose aim is to test different solutions in terms of power exhaust in view of DEMO design and implementation.
Author Contributions
Conceptualization, A.C., R.A. (Roberto Ambrosino) and R.A. (Raffaele Albanese); methodology, A.C., R.A. (Roberto Ambrosino), R.A. (Raffaele Albanese) and F.C.; software, R.A. (Roberto Ambrosino) and R.A. (Raffaele Albanese); validation, A.C., R.A. (Roberto Ambrosino), R.A. (Raffaele Albanese) and F.C.; writing—original draft preparation, A.C.; writing—review and editing, A.C.; supervision, R.A. (Roberto Ambrosino), R.A. (Raffaele Albanese) and F.C. All authors have read and agreed to the published version of the manuscript.
Funding
This work has been partially funded by the Italian Research Ministry under the PRIN 20177BZMAH on Modelling, identification and control of magnetically confined plasmas in transient phases of fusion devices in three-dimensional geometries.
Institutional Review Board Statement
The paper has been submitted to the DTT S.C. a.r.l review process and the journal submission has been approved.
Informed Consent Statement
Not applicable.
Data Availability Statement
Not applicable.
Conflicts of Interest
The authors declare no conflict of interest.
References
- Fusion Electricity—A Roadmap to the Realisation of Fusion Energy. 2012. Available online: http://users.euro-fusion.org/iterphysicswiki/images/9/9b/EFDA_Fusion_Roadmap_2M8JBG_v1_0.pdf (accessed on 3 November 2012).
- ENEA. DTT-Divertor Tokamak Test Facility. Project Proposal; DTT “Blue Book”; ENEA: Rome, Italy, 2015; ISBN 978-88-8286-318-0.
- ENEA. DTT-Divertor Tokamak Test Facility. Interim Design Report; DTT “Green Book”; ENEA: Rome, Italy, 2019; ISBN 978-88-8286-378-4. Available online: https://www.dtt-dms.enea.it/share/s/avvglhVQT2aSkSgV9vuEtw (accessed on 3 April 2019).
- Ambrosino, R.; With the Support of the DTT Community. DTT—Divertor Tokamak Test Facility: A Testbed for DEMO. Fusion Eng. Des. 2021, 167, 112330. [Google Scholar] [CrossRef]
- Balbinot, L.; Rubino, G.; Innocente, P. Development of DTT single null divertor scenario. Nucl. Mater. Energy 2021, 27, 100952. [Google Scholar] [CrossRef]
- DTT. Plant Integration Document (PID). 2021. Available online: https://www.dtt-dms.enea.it/share/page/site/dtt/document-details?nodeRef=workspace://SpacesStore/d24b16ec-b3da-4597-aa4e-bbc661288977 (accessed on 3 January 2022).
- Albanese, R.; on behalf of the WPDTT2 Team; The DTT Project Proposal Contributors. DTT: A divertor tokamak test facility for the study of the power exhaust issues in view of DEMO. Nucl. Fusion 2017, 57, 016010. [Google Scholar] [CrossRef] [Green Version]
- Ambrosino, R.; Ariola, M.; Bachmann, C.; Castaldo, A.; Maviglia, F.; Mattei, M.; Tartaglione, G. Sweeping control performance on DEMO device. Fusion Eng. Des. 2021, 17, 112640. [Google Scholar] [CrossRef]
- Albanese, R.; Ambrosino, R.; Mattei, M. CREATE-NL+: A robust control-oriented free boundary dynamic plasma equilibrium solver. Fusion Eng. Des. 2015, 96–97, 664–667. [Google Scholar] [CrossRef]
- Albanese, R.; Villone, F. The linearized CREATE-L plasma response model for the control of current, position and shape in tokamaks. Nucl. Fusion 1998, 38, 723–738. [Google Scholar] [CrossRef]
- Ejima, S.; Callis, R.; Luxon, J.L.; Stambaugh, R.D.; Taylor, T.S.; Wesley, J.V. Volt second analysis of D-III discharges. Nucl. Fusion 1982, 22, 1313. [Google Scholar] [CrossRef]
- Zheng, G.Y.; Cai, L.Z.; Duan, X.R.; Xu, X.Q.; Ryutov, D.D.; Cai, L.J.; Liu, X.; Li, J.X.; Pan, Y.D. Investigations on the heat flux and impurity for the HL-2M divertor. Nucl. Fusion 2016, 56, 126013. [Google Scholar] [CrossRef]
- Kotschenreuther, M.; Valanju, P.; Covele, B.; Mahajan, S. Magnetic geometry and physics of advanced divertors: The X-divertor and the snowflake. Phys. Plasmas 2013, 20, 102507. [Google Scholar] [CrossRef] [Green Version]
- Lipshultz, B.; Parra, F.I.; Hutchinson, I.H. Sensitivity of the detachment extent to magnetic configuration and external parameters. Nucl. Fusion 2016, 56, 056007. [Google Scholar] [CrossRef] [Green Version]
- Marinoni, A.; Austin, M.E.; Hyatt, A.W.; Saarelma, S.; Scotti, F.; Yan, Z.; Chrystal, C.; Coda, S.; Glass, F.; Hanson, J.M.; et al. Diverted negative triangularity plasmas on DIII-D: The benefit of high confinement without the liability of an edge pedestal. Nucl. Fusion 2021, 61, 11. [Google Scholar] [CrossRef]
- Camenen, Y.; Pochelon, A.; Behn, R.; Bottino, A.; Bortolon, A.; Coda, S.; Karpushov, A.; Sauter, O.; Zhuang, G.; The TCV Team. Impact of plasma triangularity and collisionality on electron transport in TCV L-mode plasmas. Nucl. Fusion 2007, 47, 7. [Google Scholar] [CrossRef]
- Austin, M.E.; Marinoni, A.; Walker, M.; Brookman, M.; de Grassie, J.; Hyatt, A.; McKee, G.; Petty, C.; Rhodes, T.; Smith, S.; et al. Achievement of Reactor-Relevant Performance in Negative Triangularity Shape in the DIII-D Tokamak. Phys. Rev. Lett. 2019, 122, 115001. [Google Scholar] [CrossRef] [PubMed] [Green Version]
- Valanju, P.M.; Kotschenreuther, M.; Mahajan, S.M.; Canik, J. Super-X divertors and high power density fusion devices. Phys. Plasmas 2009, 16, 056110. [Google Scholar] [CrossRef] [Green Version]
Figure 1.
Magnetic coils system of a DTT device: (a) CS/PF coils of DTT; (b) In-vessel coils of DTT.
Figure 1.
Magnetic coils system of a DTT device: (a) CS/PF coils of DTT; (b) In-vessel coils of DTT.

Figure 2.
DTT premagnetization with a poloidal flux of 16.2 Vs.

Figure 3.
Time evolution of plasma shapes of the DTT ramp-up phase with a plasma current rate equal to 200 kA/s.
Figure 3.
Time evolution of plasma shapes of the DTT ramp-up phase with a plasma current rate equal to 200 kA/s.

Figure 4.
Time evolution of voltages for the DTT ramp-up phase: (a) CS voltages; (b) PF voltages.

Figure 5.
Plasma shapes of SOF and EOF configurations of the SN scenario.

Figure 6.
Time evolution of voltages for the DTT flat-top phase: (a) CS voltages; (b) PF voltages.

Figure 7.
Boundary flux evolution for different plasma current ramp rates according to Formula (2).

Figure 8.
Time evolution of plasma shapes of the ramp-down phase with a plasma current rate equal to 250 kA/s.
Figure 8.
Time evolution of plasma shapes of the ramp-down phase with a plasma current rate equal to 250 kA/s.

Figure 9.
Time evolution of voltages for the DTT ramp-down phase: (a) CS voltages; (b) PF voltages.

Figure 10.
Plasma shapes at SOF of alternative configurations of the DTT device: (a) XD at 4.5 MA; (b) SN-NT at 4 MA; (c) DN at 5 MA; (d) SN with long leg at 5.5 MA.
Figure 10.
Plasma shapes at SOF of alternative configurations of the DTT device: (a) XD at 4.5 MA; (b) SN-NT at 4 MA; (c) DN at 5 MA; (d) SN with long leg at 5.5 MA.


Table 1.
Maximum currents and magnetic fields for PF coils.
| Coils | ||
|---|---|---|
| PF1-PF6 | 9.1 | 28.3 |
| PF2-PF5 | 4.2 | 27.1 |
| PF3-PF4 | 5.3 | 28.6 |
Table 2.
DTT superconducting coils: coordinates, dimensions and number of turns.
| Coils | R [m] | Z [m] | DR [m] | DZ [m] | Turns |
|---|---|---|---|---|---|
| CS3U_H | 0.490 | 2.166 | 0.121 | 0.788 | 68 |
| CS3U_M | 0.596 | 2.166 | 0.092 | 0.788 | 80 |
| CS3U_L | 0.694 | 2.166 | 0.104 | 0.788 | 144 |
| CS2U_H | 0.490 | 1.299 | 0.121 | 0.788 | 68 |
| CS2U_M | 0.596 | 1.299 | 0.092 | 0.788 | 80 |
| CS2U_L | 0.694 | 1.299 | 0.104 | 0.788 | 144 |
| CS1U_H | 0.490 | 0.433 | 0.121 | 0.788 | 68 |
| CS1U_M | 0.596 | 0.433 | 0.092 | 0.788 | 80 |
| CS1U_L | 0.694 | 0.433 | 0.104 | 0.788 | 144 |
| CS1L_H | 0.490 | −0.433 | 0.121 | 0.788 | 68 |
| CS1L_M | 0.596 | −0.433 | 0.092 | 0.788 | 80 |
| CS1L_L | 0.694 | −0.433 | 0.104 | 0.788 | 144 |
| CS2L_H | 0.490 | −1.299 | 0.121 | 0.788 | 68 |
| CS2L_M | 0.596 | −1.299 | 0.092 | 0.788 | 80 |
| CS2L_L | 0.694 | −1.299 | 0.104 | 0.788 | 144 |
| CS3L_H | 0.490 | −2.166 | 0.121 | 0.788 | 68 |
| CS3L_M | 0.596 | −2.166 | 0.092 | 0.788 | 80 |
| CS3L_L | 0.694 | −2.166 | 0.104 | 0.788 | 144 |
| PF1 | 1.400 | 2.760 | 0.510 | 0.590 | 360 |
| PF2 | 3.080 | 2.534 | 0.279 | 0.517 | 160 |
| PF3 | 4.351 | 1.015 | 0.390 | 0.452 | 196 |
| PF4 | 4.351 | −1.015 | 0.390 | 0.452 | 196 |
| PF5 | 3.080 | −2.534 | 0.279 | 0.517 | 160 |
| PF6 | 1.400 | −2.760 | 0.510 | 0.590 | 360 |
Table 3.
Time evolution of CS/PF currents of the SN ramp-up phase with a plasma current rate of 200 kA/s.
Table 3.
Time evolution of CS/PF currents of the SN ramp-up phase with a plasma current rate of 200 kA/s.
| Time | 0.2 s | 1.7 s | 4.2 s | 6.7 s | 9.2 s | 14.2 s | 22 s | 27 s |
|---|---|---|---|---|---|---|---|---|
| CS3U [kA] | 19.93 | 20.19 | 20.14 | 20.11 | 20.04 | 19.49 | 9.25 | −3.98 |
| CS2U [kA] | 31.34 | 29.52 | 25 | 20.45 | 15.91 | 5.89 | 7.57 | 12.91 |
| CS1U [kA] | 28.52 | 26.9 | 22.87 | 18.86 | 14.82 | 5.66 | −4.56 | −25.36 |
| CS1L [kA] | 28.52 | 26.48 | 21.74 | 17.00 | 12.24 | 1.86 | −15.12 | −17.71 |
| CS2L [kA] | 31.34 | 29.57 | 25.14 | 20.58 | 16.1 | 6.01 | 3.99 | −11.18 |
| CS3L [kA] | 19.93 | 20.28 | 20.37 | 20.94 | 20.98 | 20.31 | 12.13 | 14.32 |
| PF1 [kA] | 8.38 | 9.36 | 10.34 | 11.28 | 12.25 | 13.63 | 12.83 | 17.09 |
| PF2 [kA] | 3.27 | 2.09 | 0.12 | −1.79 | −3.73 | −7.51 | −9.89 | −18.97 |
| PF3 [kA] | −0.21 | −0.53 | −1.08 | −1.68 | −2.27 | −3.48 | −5.98 | −5.66 |
| PF4 [kA] | −0.21 | −0.66 | −1.51 | −2.30 | −3.11 | −4.75 | −7.06 | −8.41 |
| PF5 [kA] | 3.27 | 1.47 | −1.41 | −4.38 | −7.36 | −13.36 | −16.8 | −20.62 |
| PF6 [kA] | 8.38 | 10.08 | 12.19 | 14.26 | 16.45 | 20.55 | 23.89 | 25.69 |
Table 4.
Time evolution of main plasma parameters of the SN ramp-up phase with a plasma current rate of 200 kA/s.
Table 4.
Time evolution of main plasma parameters of the SN ramp-up phase with a plasma current rate of 200 kA/s.
| Time | 0.2 s | 1.7 s | 4.2 s | 6.7 s | 9.2 s | 14.2 s | 22 s | 27 s |
|---|---|---|---|---|---|---|---|---|
| [MA] | 0.20 | 0.50 | 1.00 | 1.50 | 2.00 | 3.00 | 4.30 | 5.50 |
| 0.10 | 0.10 | 0.10 | 0.10 | 0.10 | 0.10 | 0.10 | 0.10 | |
| 0.90 | 0.90 | 0.90 | 0.90 | 0.90 | 0.90 | 0.80 | 0.80 | |
| [Vs] | 15.33 | 15.08 | 13.98 | 12.89 | 11.78 | 9.15 | 6.87 | 4.40 |
| [m] | 1.88 | 2.04 | 2.09 | 2.10 | 2.11 | 2.12 | 2.11 | 2.16 |
| [m] | −0.02 | −0.04 | −0.05 | −0.05 | −0.05 | −0.05 | −0.03 | 0.03 |
| [m] | 1.88 | 2.03 | 2.09 | 2.11 | 2.12 | 2.13 | 2.13 | 2.20 |
| [m] | 0.42 | 0.57 | 0.63 | 0.65 | 0.66 | 0.66 | 0.65 | 0.70 |
| 18.08 | 14.86 | 9.86 | 7.43 | 6.02 | 4.22 | 3.15 | 2.84 | |
| −0.04 | 0.04 | 0.13 | 0.23 | 0.28 | 0.32 | 0.33 | 0.34 | |
| 1.13 | 1.34 | 1.45 | 1.51 | 1.54 | 1.56 | 1.65 | 1.66 | |
| [m] | 2.82 | 4.25 | 4.91 | 5.20 | 5.38 | 5.59 | 5.71 | 6.18 |
| [m3] | 7.44 | 17.75 | 23.53 | 25.95 | 27.35 | 28.41 | 28.76 | 34.18 |
Table 5.
Time evolution of CS/PF currents of the SN flat-top phase.
| Time | 36 s | 84 s |
|---|---|---|
| CS3U (kA) | −1.04 | −20.83 |
| CS2U (kA) | 5.85 | −22.89 |
| CS1U (kA) | −23.47 | −26.8 |
| CS1L (kA) | −19.79 | −30.88 |
| CS2L (kA) | −13.72 | −29.43 |
| CS3L (kA) | 4.33 | −2.11 |
| PF1 (kA) | 11.42 | 13.25 |
| PF2 (kA) | −11.94 | −9.78 |
| PF3 (kA) | −10.45 | −11.75 |
| PF4 (kA) | −9.26 | −10.62 |
| PF5 (kA) | −20.07 | −18.17 |
| PF6 (kA) | 25.92 | 21.67 |
Table 6.
Time evolution of main plasma parameters of the SN flat-top phase.
| Time | 36 s | 84 s |
|---|---|---|
| (MA) | 5.50 | 5.50 |
| 0.65 | 0.65 | |
| 0.80 | 0.80 | |
| (Vs) | 2.36 | −3.59 |
| (m) | 2.23 | 2.23 |
| (m) | 0.02 | 0.04 |
| (m) | 2.20 | 2.19 |
| (m) | 0.70 | 0.70 |
| 2.90 | 2.80 | |
| 0.34 | 0.25 | |
| 1.66 | 1.66 | |
| (m) | 6.19 | 6.17 |
| (m3) | 34.31 | 34.54 |
Table 7.
Time evolution of CS/PF currents of the SN ramp-down phase at 250 kA/s.
| Time | 85 s | 89 s | 93 s | 97 s | 101 s | 103 s |
|---|---|---|---|---|---|---|
| CS3U (kA) | −27.43 | −12.44 | −30.39 | 1.86 | 1.2 | −15.71 |
| CS2U (kA) | −30.87 | −31.34 | −30.14 | −28.1 | −25.74 | −24.13 |
| CS1U (kA) | −30.81 | −31.34 | −30.19 | −28.62 | −24.17 | −22.8 |
| CS1L (kA) | −30.88 | −31.34 | −30.35 | −28.53 | −23.15 | −18.43 |
| CS2L (kA) | −30.78 | −31.34 | −30.06 | −28.52 | −26.05 | −24.68 |
| CS3L (kA) | −8.69 | −7.1 | −22.44 | −22.62 | −17 | −24.75 |
| PF1 (kA) | 9.93 | −5.86 | 2.38 | −3.46 | −1.07 | 6.13 |
| PF2 (kA) | −5.47 | 2.67 | −0.1 | −2.4 | −8.03 | −9.51 |
| PF3 (kA) | −9.42 | −7.57 | −7.89 | −6.76 | −3.07 | −1.94 |
| PF4 (kA) | −9.96 | −11.41 | −6.42 | −3.38 | −1.53 | −1.11 |
| PF5 (kA) | −20.77 | −12.02 | −15.96 | −13.83 | −10.2 | −9.96 |
| PF6 (kA) | 24.33 | 14.05 | 15.68 | 11.18 | 4.02 | 6.58 |
Table 8.
Time evolution of main plasma parameters of the SN ramp-down phase at 250 kA/s.
| Time | 85 s | 89 s | 93 s | 97 s | 101 s | 103 s |
|---|---|---|---|---|---|---|
| (MA) | 5.50 | 4.50 | 3.50 | 2.50 | 1.50 | 1.00 |
| 0.10 | 0.10 | 0.10 | 0.10 | 0.10 | 0.10 | |
| 0.80 | 0.89 | 0.98 | 1.07 | 1.16 | 1.20 | |
| (Vs) | −4.04 | −6.41 | −8.02 | −8.84 | −8.90 | −8.63 |
| (m) | 2.19 | 2.20 | 2.19 | 2.15 | 2.12 | 2.07 |
| (m) | 0.06 | 0.03 | −0.03 | −0.09 | −0.09 | −0.08 |
| (m) | 2.20 | 2.20 | 2.19 | 2.15 | 2.12 | 2.06 |
| (m) | 0.71 | 0.71 | 0.70 | 0.68 | 0.66 | 0.60 |
| 2.69 | 3.12 | 3.74 | 5.04 | 6.23 | 7.39 | |
| 0.20 | 0.12 | 0.14 | 0.21 | 0.17 | 0.10 | |
| 1.65 | 1.59 | 1.55 | 1.53 | 1.32 | 1.29 | |
| (m) | 5.74 | 5.62 | 5.41 | 5.19 | 4.61 | 4.07 |
| (m3) | 35.42 | 34.75 | 32.48 | 29.66 | 23.84 | 18.30 |
Table 9.
Main plasma parameters of the DTT alternative configurations.
| Configs. | XD | SN-NT | DN | SN with Long Leg |
|---|---|---|---|---|
| (MA) | 4.5 | 4.00 | 5.00 | 5.50 |
| 0.65 | 0.40 | 0.65 | 0.65 | |
| 0.80 | 0.80 | 0.80 | 0.80 | |
| (Vs) | 3.00 | 5.02 | 3.77 | 2.37 |
| (m) | 2.25 | 2.23 | 2.23 | 2.22 |
| (m) | 0.19 | 0.08 | 0.00 | 0.28 |
| (m) | 2.20 | 2.18 | 2.20 | 2.20 |
| (m) | 0.70 | 0.68 | 0.69 | 0.70 |
| 3.64 | 3.20 | 3.15 | 3.05 | |
| 0.26 | −0.13 | 0.34 | 0.40 | |
| 1.67 | 1.64 | 1.67 | 1.66 | |
| (m) | 6.34 | 5.88 | 6.24 | 6.29 |
| (m3) | 34.01 | 31.77 | 33.77 | 34.70 |
Publisher’s Note: MDPI stays neutral with regard to jurisdictional claims in published maps and institutional affiliations. |
© 2022 by the authors. Licensee MDPI, Basel, Switzerland. This article is an open access article distributed under the terms and conditions of the Creative Commons Attribution (CC BY) license (https://creativecommons.org/licenses/by/4.0/).
Share and Cite
MDPI and ACS Style
Castaldo, A.; Albanese, R.; Ambrosino, R.; Crisanti, F. Plasma Scenarios for the DTT Tokamak with Optimized Poloidal Field Coil Current Waveforms. Energies 2022, 15, 1702. https://doi.org/10.3390/en15051702
AMA Style
Castaldo A, Albanese R, Ambrosino R, Crisanti F. Plasma Scenarios for the DTT Tokamak with Optimized Poloidal Field Coil Current Waveforms. Energies. 2022; 15(5):1702. https://doi.org/10.3390/en15051702
Chicago/Turabian StyleCastaldo, Antonio, Raffaele Albanese, Roberto Ambrosino, and Flavio Crisanti. 2022. "Plasma Scenarios for the DTT Tokamak with Optimized Poloidal Field Coil Current Waveforms" Energies 15, no. 5: 1702. https://doi.org/10.3390/en15051702
Note that from the first issue of 2016, this journal uses article numbers instead of page numbers. See further details here.