
Sustainable Development Programming of Airports by Identification of Non-Efficient Units


Department of Transport Management, Institute of Management, University of Szczecin, Cukrowa 8 Street, 71-004 Szczecin, Poland
*
Authors to whom correspondence should be addressed.
Energies 2022, 15(3), 932; https://doi.org/10.3390/en15030932
Submission received: 31 December 2021
/
Revised: 21 January 2022
/
Accepted: 24 January 2022
/
Published: 27 January 2022
(This article belongs to the Special Issue Energy Decision Making: Problems, Methods, and Tools)
Abstract
:This article concerns the identification of inefficient airports and the exploration of spatial autocorrelation for programming sustainable development. The first research question was: do domestic airports cooperate by shifting passenger service and traffic to the geographically closest airport to respect the idea of sustainable development (in view of the rationalization of energy consumption)? The second question was: do they excessively compete for passengers and the carriers serving them? The aim was to identify ineffective units (taking into account energy consumption, airplane traffic, and passenger movement) and to evaluate the spatial autocorrelation between national airports, which shows whether airports cooperate or compete with each other. The study was conducted on 12 airports. An innovative extension of the data envelopment analysis method using methods in the field of spatial econometrics (including two-dimensional Moran I statistics and local LISA statistics) and artificial intelligence was applied. It was verified that ineffective airports have a non-rationalized structure of inputs to outputs. Based on the map-graph of connections, airports have been identified to which part of airplane traffic service can be transferred. Based on Moran statistics and local LISA statistics, it was confirmed that airports compete with each other. There was a strong polarization of efficient airports.
1. Introduction
1.1. Presentation of Research Problems
Sustainable development is one of the megatrends of current civilization [1,2], in which there is a need to harmonize goals of an economic (not only chrematistic), social, and environmental nature [3,4,5] Furthermore, the need not to diminish the fulfillment of the needs of future generations through the prism of overconsumption of the current generations is emphasized [6]. Sustainable development is the subject of many studies [7,8,9], which have resulted in the development of many indicators of this concept [10,11]. However, there is still no assessment of airports at the interface between micro-, meso-, and macroeconomic levels. The implementation of the concept of sustainable development of airports is primarily associated with reducing the energy consumption of air transport and minimizing pollution by this transport [12,13,14], while meeting the transport needs of the public [15,16], performing the basic functions of airport economic activity [17,18,19,20], and stimulating the economic development of the country [21,22,23]. One of the solutions is the implementation of paradigms of sustainable development such as shift [24,25,26], i.e., shifting demand for transport services to other modes [27,28] or shifting transport activity (supply of transport services) to other regions, or decoupling [28], which is separating economic growth from the negative consequences of transport activity, e.g., by decarbonizing the economy [29,30,31]. As airports are embedded in a certain location, the dimension of air transport activity can be assigned precisely to the airports that serve passengers and airplane traffic in a given location, while assessing the degree of implementation of the idea of sustainable development.
This study is an attempt to operationalize the idea of sustainable development in the economic management of airports in the macro-, meso- and microeconomic dimensions. The integration of the non-parametric method (data envelopment analysis model) and spatial econometric methods is of particular importance as a contribution to the enrichment of airport management theory and airport economics. In practical terms, it allows the application of a methodology for the implementation and evaluation of the idea of sustainable development.
1.2. Organization of the Paper
This article focuses on the study of airport efficiency in the context of sustainable development programming. The research problem in the article is presented in the form of a research question: did domestic airports cooperate by shifting passenger service and traffic to the geographically closest airport to respect the idea of sustainable development, or did they excessively compete for passengers and carriers serving them? The article aimed to identify ineffective units (in terms of non-parametric relational efficiency assessment, taking into account three dimensions simultaneously: energy consumption, airplane traffic, and passenger movement) and to evaluate the spatial autocorrelation between national airports, which shows whether airports cooperate or compete with each other. The research hypothesis is as follows: national airports compete with each other for passengers and carriers (expressed as airplane traffic). The study concerns the case of Poland in 2019 (including only domestic air transport), before the impact of the COVID-19 pandemic. This was a deliberate choice, as the pandemic is a typically random factor, thus disrupting cause–effect relationships and reducing the efficiency of airports by limiting passenger traffic. The methods used were operational research (data envelopment analysis), spatial econometrics (taxonometric distance measure—Euclidean, weight matrix, Moran I statistics and local LISA statistics, connection map-graph), statistical methods (selected descriptive statistics, Pearson and Spearman correlations, FDR, Grubs test, Shapiro–Wilk test, Lilliefors test, Wald–Wolfowitz test, Mann–Kendall test, Bartels rank test). The combination of the above methods allows for detailed analysis of the research problem and the identification of cognitive gaps in the field of economics of air transport, economic management of air transport, and geography of transport. The combination of the above methods in one macro-, meso- and microeconomic research on air transport is a novelty.
The article consists of five parts. The first is an introduction. The second part contains a narrative review of the methodological literature on the application of the data envelopment analysis method to research airport efficiency. The third part is a description of the research and methodology. The fourth part contains empirical research results and their discussion. The article ends with conclusions.
2. Brief Literature Review
The data envelopment analysis (DEA) method is used to compare airports and resource allocation at airports. It can provide a tool for policymakers to identify best practices [32]. The application of this method is very wide, although this literature review is focused on airports.
The DEA method can be used to assess effectiveness in many dimensions. It is used to study the efficiency of airports in the structural and operational dimensions, as in the case of 43 airports in Turkey. There is a need to group airports (groupings) into separate groups for in-depth research. The DEA analysis is extended to include the machine learning technique and CART decision trees (Classification and Regression Tree) [33].
One of the studies that deserves particular attention is the research on the efficiency of management at 30 European airports. The authors not only used the DEA method, but also combined it with an innovative approach to the distance friction minimization (DFM) method. This function is based on the Euclidean distance metric. The authors found that the best efficiency improvement function is the multivariate function that can be derived from the multiple objective quadratic programming (MOQP) model. The study included the following: number of runways (input), terminal space (input), number of gates (input), number of employees (input), number of passengers (output), and aircraft movements (output). This approach allows for proper decision-making when setting price limits and defining the goals of regulatory policy [34].
It is worth noting that the researchers were also dealing with the integration of DEA with other methods, including the integration of DEA and AHP methods to analyze the energy efficiency of airport construction [35].
An interesting contribution to the application of the DEA method in the analysis of efficiency or effectiveness was made in 61 articles published in 2009–2017. Based on their findings, four motives for the use of the DEA method were determined. The first motive concerns the explanation of efficiency with exogenous factors. The second motive is related to the mapping of efficiency changes over time. The third motive focuses on the decomposition of efficiency. The fourth motive is publication comparing the DEA method with other techniques. Based on these studies, a methodological gap was observed in the field of systematic selection of inputs and outputs in the DEA model [32].
Another important study on the use of the DEA method was carried out on 12 major airports in Pakistan. The study consisted in identifying ineffective airports in terms of cost, production, and price. Researchers noted that airports are focusing on increasing economies of scale and that many of them are not scaled efficiently. They recommend not to invest in the capacity of large airports and to use smaller nearby airports to relieve the larger ones [36].
The combination of the above two articles can be found in the article by Pestana Barros and Dieke [37]. The authors first conducted in-depth research in the field of literature review, paying attention to four criteria: the method (DEA models), units (number of airports and possible time range), inputs, and output. Based on five models, they numbered a total of 30 inputs and 14 outputs, with some models appearing as (duplicating) similar inputs/outputs as others. The authors examined 31 airports in Italy using the DEA method for financial and operational efficiency. As inputs, they used labor costs, capital invested, and operational cost without labor cost. As outputs, they used number of planes, number of passengers, general cargo, handling receipts, aeronautical sales, and commercial sales. Using the DEA method, they verified three hypotheses [37]:
- “Large airport authorities are more efficient than small airport authorities”;
- “Airports under fully private management are more efficient than those under partially private management”;
- “Airports with higher WLU during the period are more efficient than airports with lower WLU” (WLU means workload unit).
Research on the effectiveness of 10 airports in East Asia was conducted in a similar vein. Researchers decomposed the study into two processes: one for the aviation service and one for the commercial service. The researchers also identified literature on the efficiency of Asian airports. Based on 17 items in the literature, they recognized the methods (apart from DEA, other methods were also used, mainly regression) and the outputs and inputs. The researchers combined the use of DEA and regression for panel (cross-time) data. As input, they used the following categories: runway area, staff cost, and other operating costs. For intermediate output/input, they used aircraft movements. For final outputs, they used passengers and cargo, and operating revenues [38].
Another study, carried out in 21 Turkish airports in 2009–2014, concerns the evaluation of efficiency through the prism of such variables such as number of flights and annual passenger throughput (the first output), annual cargo throughput (the second output), number of runways and dimension of runway units (the first input), and passenger terminal area (the second input). The productivity of airports was mainly influenced by the technical change index instead of the technical efficiency change index. Technological change is caused by external factors, such as changes in government policy and technological progress, and technical efficiency is influenced by operational efficiency [39].
Another global study covers 23 international airports from Europe, North America, and East Asia. This DEA study assumed that the inputs are land area, number of runway units, passenger terminal area, and cargo schedule area; that the outputs are number of flights, annual throughput, and annual cargo throughput. The authors of this DEA study also conducted an in-depth review of the literature, focusing on the results of 15 items in the literature. Based on the literature review, they selected inputs and outputs. This research shows that the productivity of airports was influenced by changes in government policy, technological progress (i.e., exogenous factors), and management practices (i.e., an endogenous factor) [40].
In an international (global) study, research is presented on 20 major airports in the world, classified into four groups. Using the DEA method, the authors verified that the economic growth rate of the country, the location of the airport, and the operation of the hub airport (the existence of a transfer airport) affect the operational efficiency of airports. On the other hand, the form of ownership and the size of an airport are not related to their operational performance. Moreover, the sensitivity analysis showed that the number of runways and the number of parking spaces affect the efficiency of the airport. Airports with higher operational efficiency were identified—these are those located in North America and Europe. Airports in Asia and Australia are characterized by lower operational efficiency [41].
The literature review conducted proves that the DEA method is the appropriate technique for examining airports’ effectiveness with respect to each other with a national and international perspective, and that the scope of defining effectiveness may be very wide. The authors combined various measures related to airport assessment, but no leading studies have been found that use energy consumption as a variables in the multidimensional efficiency construct. Therefore, this study takes into account an additional variable, namely energy consumption. Energy consumption expresses three dimensions: environmental (consumption of energy resources and related pollution), social (a resource that may be exhausted for future generations in the context of meeting the transport needs of the present generation), and economic (the prism of managing a scarce resource in the context of airport operations).
3. Data and Methods
3.1. Data
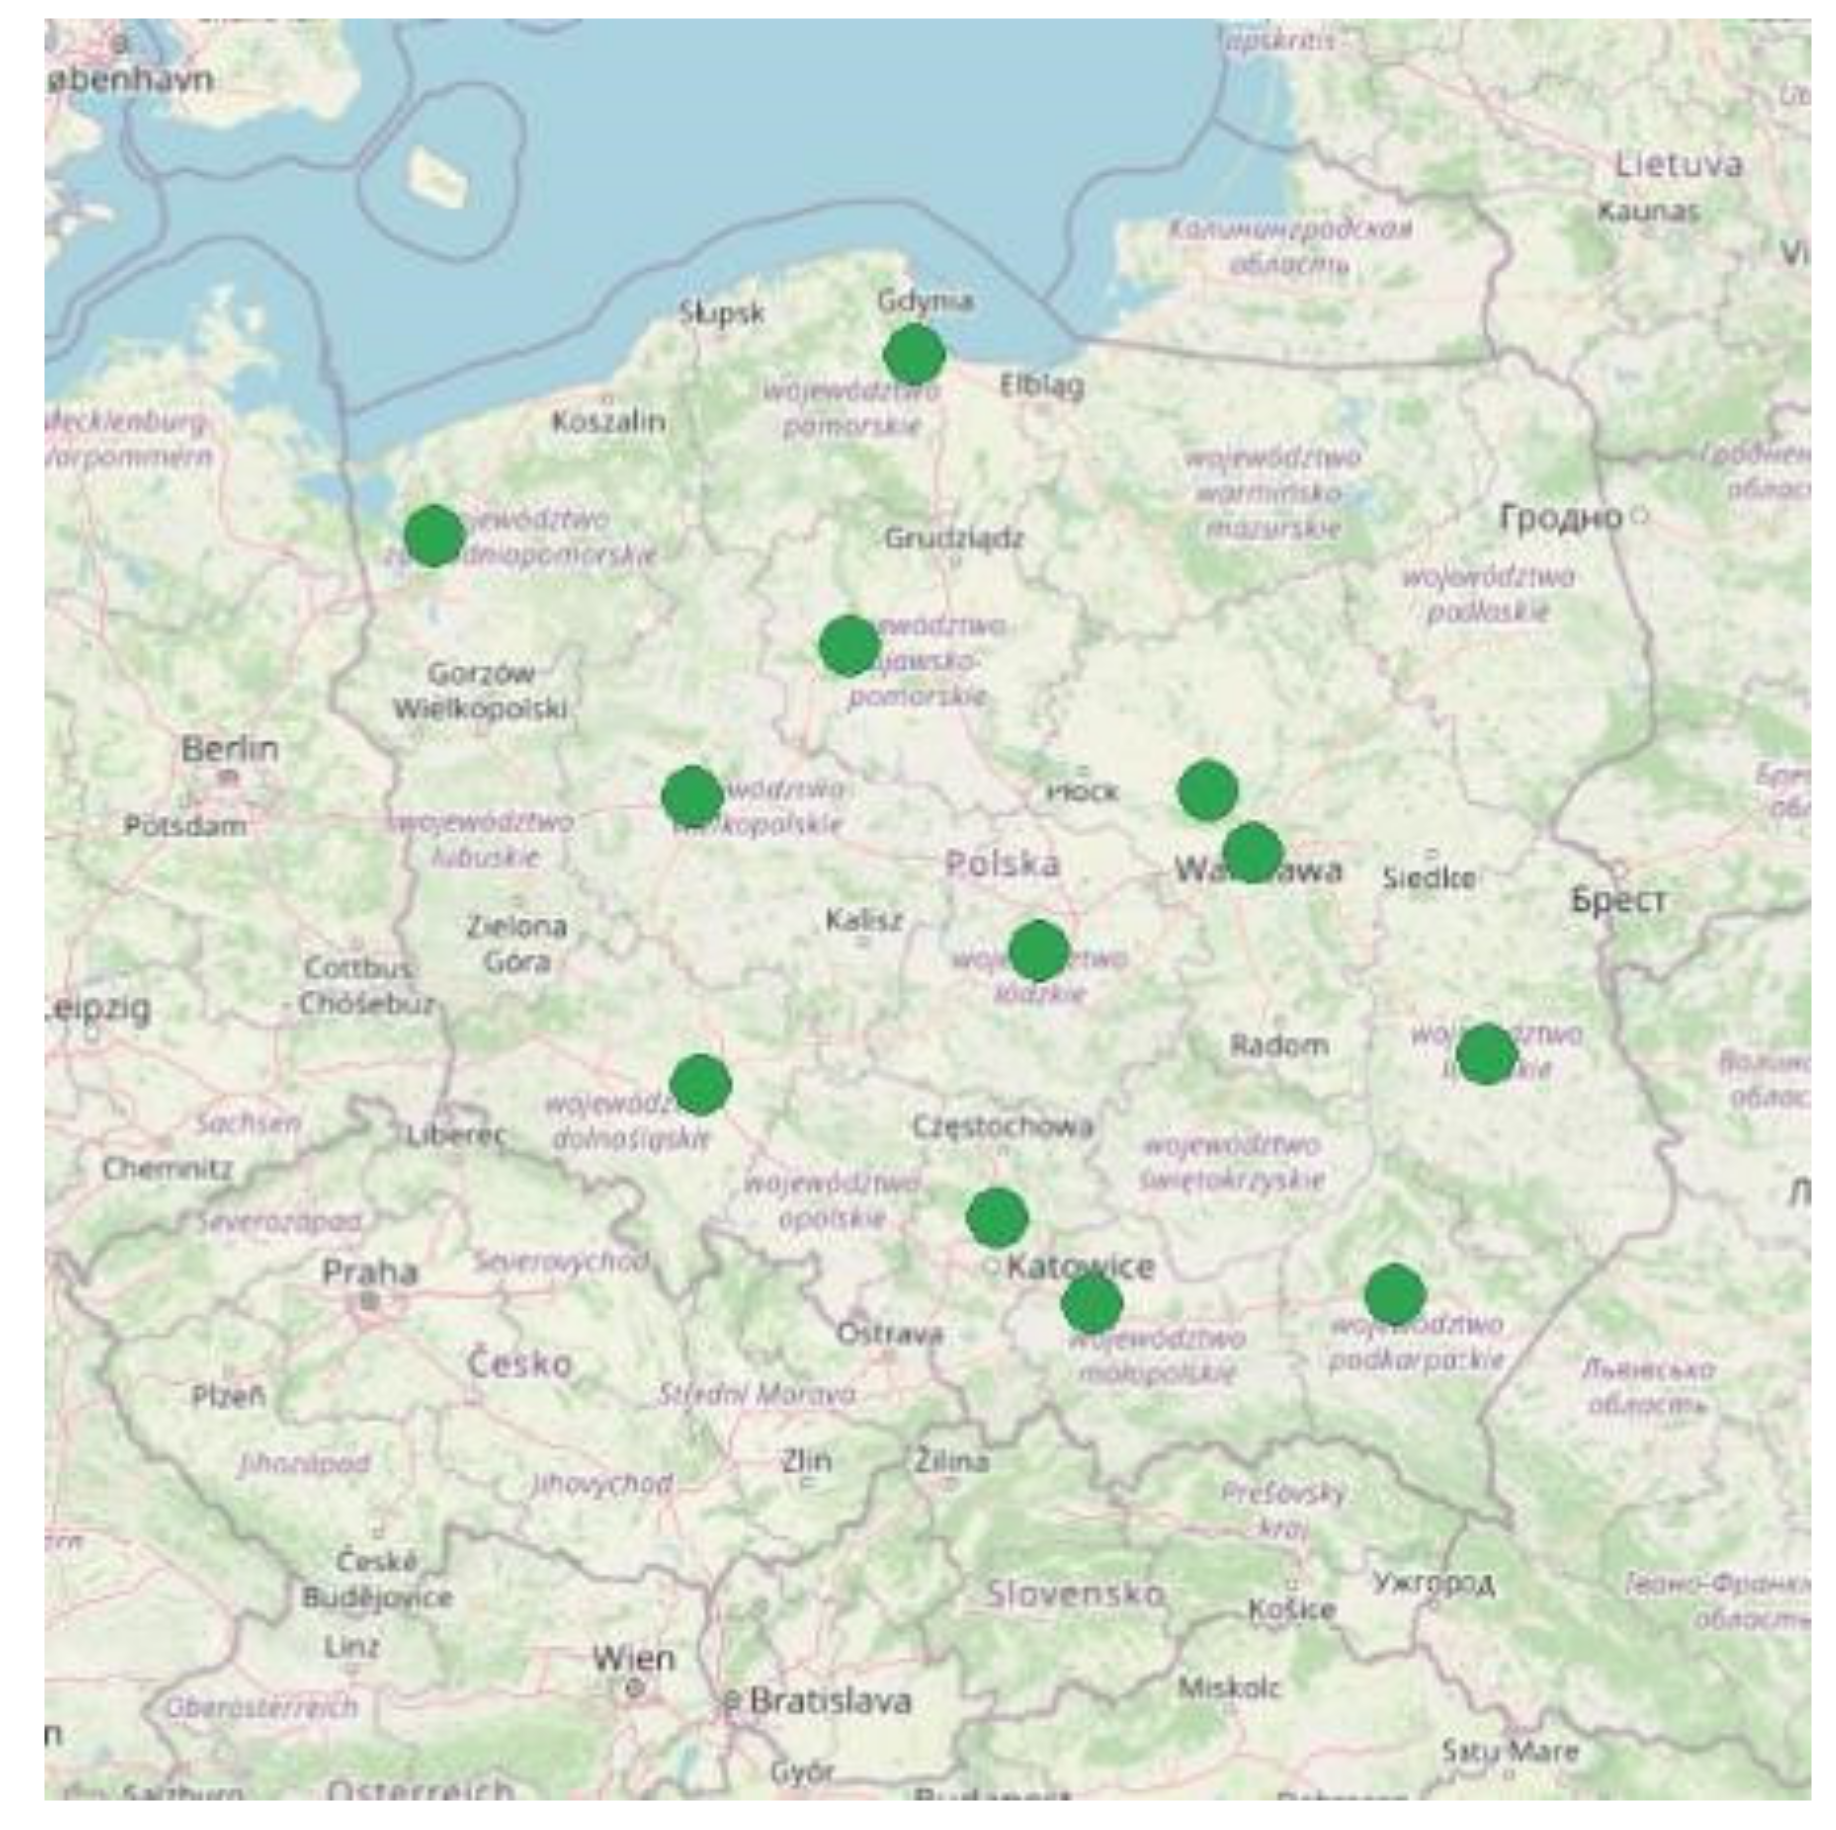
The analysis uses secondary data for 12 airports in Poland; these are: Bydgoszcz, Gdansk, Katowice, Krakow, Lublin, Lodz, Poznan, Rzeszow, Szczecin, Warsaw, Warsaw-Modlin, and Wroclaw. The remaining airports (i.e., Zielona Gora, Olsztyn, and Radom) were not part of the research, as their statistics were recorded jointly in the category of other airports, which would make it impossible to refer the results to a single airport. Table 1 presents the list of airports along with their assignment to the province in Poland and the ICAO (The International Civil Aviation Organization) code, DMU (decision making unit, for the DEA method), and geographic coordinates. The geographic coordinates of the airports were taken from the GeoHack database [42]. The numerical data used for the analyses, expressing energy consumption by means of air transport, airplane traffic, and passenger movement, came from the database DBW (Dziedzinowa Baza Wiedzy) [43]. These data were subject to processing, their own elaborations, and their own calculations (Table 2, Table 3 and Table 4, Figures 3–5, and Appendix A).
As shown in Table 1, each airport is located in one province; only Warsaw (EPWA) and Warsaw-Modlin (EPMO) airports are located in the same province. Figure 1 shows the locations of the studied airports on the map, which enables the identification of neighboring airports.
Table 2 contains selected descriptive statistics of airports in 2019 for energy consumption by means of air transport and airplane traffic (these will be treated as inputs in the further analysis), and passenger movement (this will be treated as a result in further analysis). Complementary descriptive statistics were also calculated for the relationship between each input and output.
As shown in Table 2, the annual average energy consumption by means of air transport in relation to airports is 126,926,580 MJ; the median was 80,251,892 MJ, which is lower than the average. Thus, more than 50% of airports had an energy consumption by air transport lower than 126,926,580 MJ. Exactly six airports had annual energy consumption by means of air transport not higher than 80,251,892 MJ, and the other half not lower than this value. The standard deviation, expressing the average range of variation of energy consumption positively or negatively from the average value, suggests that energy consumption by air transport means deviated on average by 123,428,251 MJ from the average value. The relation of the standard deviation to the mean is expressed by the coefficient of variation. In the case of energy consumption by means of air transport, it was high, at a level of approximately 97%, which means that the airports examined were not homogeneous in terms of energy consumption by means of air transport. A similar conclusion can be drawn from the airplane traffic; the indicator is identical. Higher values of this indicator were recorded for passenger movement (149%), the relation of energy consumption to passenger movement (342%), and the same indicator for the second relation: airplane traffic/passenger traffic.
The annual average traffic of airplanes in the analyzed airports was 11,002 airplanes and the median was 6957 airplanes, which means that in more than six airports, the airplane traffic was below the value of 11,002 airplanes; in exactly six airports, it was not less than 6957 airplanes, and in the remaining six, no more than 6957 airplanes. In the examined airports, the airplane traffic deviated from the average value of 11,002 by 10,699 airplanes on average, which proves the large diversity of the analyzed airports in terms of airplane traffic.
The annual average passenger movement at the airports was 324,100 people. This value, on average, deviated from the average by 483,263 people compared to the analyzed airports (negatively by a maximum of 324,100 people). As in the case of airplane traffic and energy consumption, a large diversity of airports were assessed from the point of view of passenger movement. Exactly six airports had a value for passenger movement of no less than 208,825 people, and the remaining six airports had no more than this value.
In skewness, which is a measure of asymmetry, a right-hand distribution is noted (the values are positive). High values of skewness, such as in the case of the relation energy consumption/passenger movement, airplane traffic/passenger movement, and passenger movement, suggest that there may be outliers. For this purpose, the Grubbs test was used to identify outliers. It showed that for energy consumption and airplane traffic, no outliers were indicated (the Grubbs statistic was 2.1652 with a p-value equal to 0.1751). However, outliers for passenger movement were indicated (Warsaw airport EPWA; the Grubbs statistic was 2.9674 with a p-value equal to 0.001) and the energy consumption/passenger movement relationship for up to three observations (Bydgoszcz airport—EPBY; Warsaw-Modlin airport—EPMO, Lodz airport—EPLL; the Grubbs statistic was 3.1753 with a p-value equal to 0). The same three observations were outliers for the relation airplane traffic/passenger movement (the Grubbs statistic and p-value were same).
Table 3 presents the coefficients of the Pearson’s linear correlation and the monotonic Spearman’s correlation between the inputs and the result, i.e., between energy consumption by means of air transport, air traffic, and passenger movement.
Based on Pearson’s linear correlation indicators, a strong and positive correlation can be seen between energy consumption by means of air transport and airplane traffic. This correlation is statistically significant for approximately 100% of cases. In the case of correlation between the results and each of the inputs, i.e., between passenger movement and energy consumption by means of transport and between passenger movement and airplane traffic, the linear correlation was positive and weak, at 0.4387. Based on the FDR (false discovery rate) coefficient, it is estimated that in about 15% of cases, there could be no linear correlation due to the occurrence of outliers. The lack of linear correlation in 15% of cases may indicate a type of correlation other than linear, which may be associated with the appearance of increasing or decreasing economies of scale, because linear correlation assumes the coexistence of the same rate of change for all variables. It may also be an indication of the existence of the saturation point of a given value, after which the relationships between the studied variables change. Spearman’s correlation assumes the coexistence of changes but at a different pace. Based on the monotonic Spearman’s correlation, which is more resistant to outliers, a weak positive correlation was also found between energy consumption by means of air transport and passenger movement and between airplane traffic and passenger movement. The FDR more than doubled, suggesting that approximately 30% of the observations were not characterized by a monotonic correlation. These results may suggest that 30% of the cases were non-monotonic. This is another premise for assuming that there could be scale effects of the studied units, but they may have a different character (sinusoid, U-shaped, etc.).
3.2. Methods
The article uses a number of statistical methods such as linear programming, artificial intelligence, geostatistics, and computer science, and combines various disciplines such as economics (at the meso and macro level), management, spatial planning, transport, statistics, operational research, and computer science. In the main part of the study, the data envelopment analysis method, weight matrices, and Moran and LISA statistics were used for exploratory data analysis. In the pre-analysis, descriptive statistics, Pearson’s or Spearman’s correlation, and Grubbs’ statistics were necessary. Due to the fact that the methods used in the pre-analysis do not need to be discussed due to their auxiliary nature and common knowledge, more attention has been paid to the methods used in the main analysis.
The data envelopment analysis method is a non-parametric approach to the analysis and evaluation of effectiveness, taking into account many inputs and many effects in its design [45]. It uses the Debreu–Farrell measures [45,46,47,48]:
where x is the inputs vector, y is the effects vector, λ represents the appropriately calculated weights, and P represents the production technology. The solution is the linear distance of the real production volume from the hypothetically determined efficiency limit.
Unlike classical methods and advanced econometric methods, the DEA method does not require determining the functional form (its specification, estimation, and verification). At the same time, there is no need to reduce the number of variables and relationships between them, as there is in econometric models (too many variables in econometric models may be associated with an insufficient number of degrees of freedom, the occurrence of a singular matrix, and apparent “perfect” fit). Several models can be constructed using the DEA method: an input-oriented model, an effect-oriented model, a model with constant scale effects, and a model with variable scale effects. This approach uses an input-oriented model with economies of scale.
In the DEA method, it is assumed that n decision-making units (DMUs) take part in the study. Each decision unit (DMUj, j = 1, 2, 3, …, n) generates the same type of results s (a result is otherwise an effect in the form of final goods, i.e., products and services, e.g., the number of aircraft produced or the number of passengers transported). These effects (results) yrj (r = 1, 2, 3, …, s) are produced in various sizes (in terms of volume or value) using m inputs of the same type xij (i = 1, 2, 3, …, m) in various sizes (in terms of volume or value). The size of inputs and effects is not less than 0, which results from the construction of indicators representing real values [49,50].
The DEA method adopts the assumptions known in the theory of economics, including Pareto efficiency. It can be defined by including it in the methodological core of the so-called Pareto optimum. The first definition (efficiency—extended Pareto–Koopmans definition) [50] is:
“Full (100%) efficiency is attained by any DMU if and only if none of its inputs or outputs can be improved without worsening some of its other inputs or outputs.”
The second definition (relative efficiency) [50] is:
“Full (100%) efficiency is attained by any DMU if and only if none of its inputs or outputs can be improved without worsening some of its other inputs or outputs.”
A dual linear programming program (dual LP) with the assumption of the above two definitions can be written as [50]:
means an optimal solution. If then the DMU is effective, and if then the DMU is ineffective.
There may also be “weak” performance when there is non-zero backlash. Then the problem of linear programming is extended by the following [50]:
where does not affect the optimal size , which is determined by the model (1).
Based on the second definition (relative efficiency), it is possible to define efficiency in the sense of DEA “strong” and “weak”. The definition of the (strong) efficiency of DEA [50] is:
“The performance of DMUo is fully (100%) efficient if and only if both (1) and (2) all slacks .”
The definition of weak DEA performance [50] is:
“The performance of DMUo is weakly efficient if and only if both (1) and (2) and/or for some i or r in some alternate optima.”
Thus, strong DEA efficiency means an optimal solution for which the “efficiency” index is 1 and there are no penalties for backlash. In the case of a low DEA effectiveness, there is an optimal solution for which the “efficiency” index is 1, but there may be penalties for backlash.
The CCR-DEA model takes the following formula [49,50]:
ε > 0 it is a non-Archimedean component, smaller than any positive real number, that allows solving an optimization problem for maximizing slacks without affecting the size of the Farrell measure [49,50].
Based on the theorem of Banker and Thrall [51], it is possible to give returns (economies) of scale (RTS) certain features that determine the type of economies of scale (constant, increasing, decreasing—CRS, IRS, DRS, respectively).
Theorem: the following conditions allow the determination of the type of economies of scale for the CCR model described by Formula (4) [49]:
- CRS prevails at ) if in any alternate optimum;
- DRS prevails at ) if for all alternate optima;
- IRS prevails at ) if for all alternate optima.
Based on the above assumptions, the efficiency indicators were calculated, which were later used together with geographic coordinates (as inputs to estimate the weight matrix) to determine the Moran I statistics, local LISA statistics, and connectivity map-graph. The asymmetric kernel method was used to determine the weight matrix, assuming that the average number of adjacent units is 5. The kernel function was uniform assuming diagonal weights = 1, and max knn distance as bandwidth = 5 (universal) was used.
The global Moran I statistic is used to study spatial autocorrelation, which can be expressed by the formula (for a non-standardized matrix of weights and original values) [52]:
where z is a column vector with elements: ,
is the sum of all elements of the weight matrix,
and are elements of the observation matrix for the variable X in different locations (i = 1, 2, …, n).
Assuming that the weight matrix is row-standardized, the sum of all matrix elements equals the number of rows, i.e., . The global Moran’s statistic is [52]:
The elements of a standardized weight matrix can be calculated using the formula [52]:
By standardizing the value of the variable X using the formula , Moran’s statistic takes the form [52]:
Local LISA statistics can be computed for both standardized and non-standardized X values (in this case the θ-efficiencies) and for a weight matrix that has been row-standardized or not. The local Moran Ii statistic takes the form of the value of a non-standardized and row-standardized variable of a weight matrix [52]:
In the case of standardized values of the variable X (), the local Moran’s statistic is [52]:
This study used a methodology based on formulas for standardized values for the variable X (θ) and a standardized weight matrix.
4. Results and Discussion
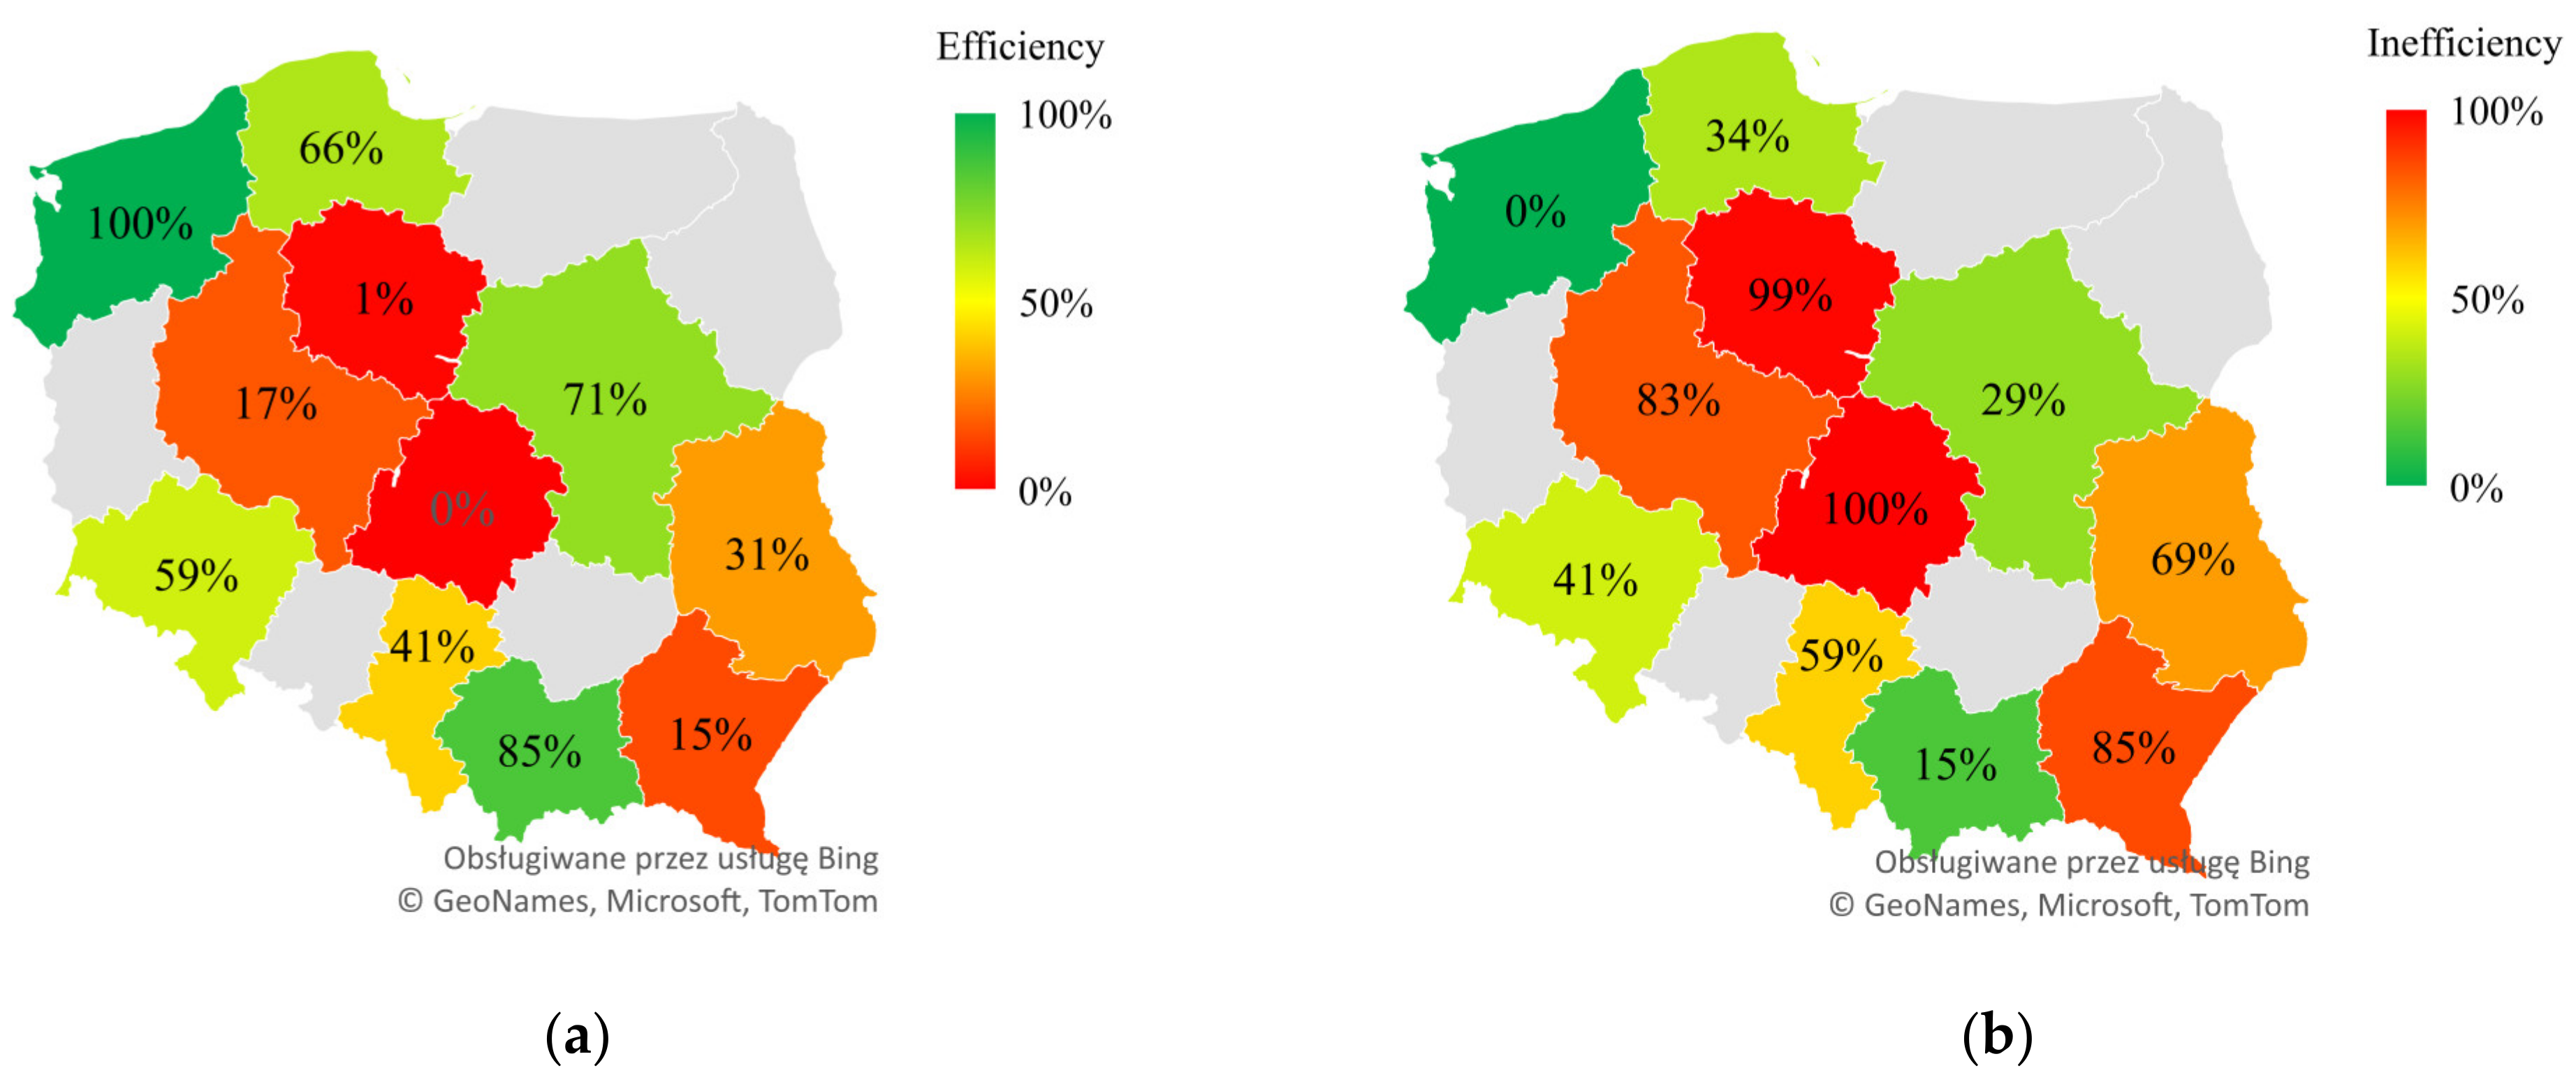
The choropleth maps (Figure 2) show the efficiency (left graphic) and ineffectiveness (right graphic) of Polish airports in 2019, broken down by provinces of Poland. Efficiency is synonymous with a rationalization of the use of inputs, and ineffectiveness is synonymous with irrational use of opportunities/inputs (wasting them, the so-called muda).
As shown in Figure 2, the highest efficiency of sustainable development was characteristic of the West Pomeranian Province, and the lowest in the Lodzkie and Kuyavian-Pomeranian Provinces. Figure 2 may show that there is no spatial autocorrelation between the examined airports (spatial correlation understood here as cooperation). Such a distribution of values may indicate competition between airports for passenger service (an in-depth analysis of this aspect will be provided later in the paper). Relatively high values do not lie in the vicinity of other high values (exceptions may be the West Pomeranian Province with high value and the Pomeranian Province with moderate value). However, it is noted that low or moderate values are distributed in high-value environments. In addition to spatial relationships, it makes sense to explain efficiency in terms of unused inputs, benchmarking, economies of scale, and slack. Table 4 shows the results of the DEA method for Polish airports, taking into account the ordering from the highest to the lowest efficiency. Theta is equal to efficiency and 1 minus theta is equal to ineffectiveness (see Figure 2). An extension of the DEA results is provided in Appendix A, Table A1 (non-zero columns are shown in Table 4).
Table 4 shows that four directions of rationalization of the tested efficiency have been identified. The first direction is the change of inputs in relation to those actually incurred in the area of global inefficiency. The second direction is to model the efficient airport. The third direction is related to the rationalization of inputs (in this case, minimization of energy consumption) in an isolated system (from the point of view of the entity, i.e., the airport). The fourth direction is associated with economies of scale.
The results of the DEA method from Table 4 show that the Szczecin airport (EPSC) is an effective unit (strong efficiency) and the slacks are zero. At the same time, constant economies of scale are noticeable for Szczecin Airport (EPSC). This unit is the reference unit for all other airports, which results from the non-zero values of lambda for AP9 assigned to the EPSC airport. In the case of the values for the airport in Warsaw-Modlin (EPMO) and Lodz (EPLL), there is a negligible need to model the airport in Szczecin (EPSC). The other airports did not play the role of a reference; the lambda values assigned to them were 0. It is worth noting that other airports should only use efficient units (high efficiency), in this case only the Szczecin airport (EPSC), because the others are ineffective. Lambda indicators, called intensity indicators, suggest the directions of improvement of results for ineffective airports in relation to the effective airport. At the same time, on their basis, it is possible to determine the proportion of the inputs of an ineffective airport that should change in relation to the inputs of an effective airport. For example, Katowice airport (EPKT) should use approximately 0.7 (70%) of Szczecin airport (EPSC) inputs to be an efficient unit. On the other hand, the airport in Bydgoszcz should use approx. 0.03 (3%) of the inputs of the airport in Szczecin to become effective. If there were more than one effective airport, then the efficiency could be obtained by using inputs that are the weighted sum of the inputs for the effective airports.
EPKA and EPWA airports also had relatively high efficiency (theta). EPGD and EPWR had moderate efficiency, EPKT had weak efficiency, EPPO and EPRZ had low inefficiency, and EPLL, EPMO, and EPBY had high ineffectiveness. The average efficiency (theta value) for all airports was around 40%. Theta ratios other than 1 suggest that if airports were to serve the same number of passengers at less than 1-theta than actually served, they would be efficient. For example, if the airport in Bydgoszcz (EPBY) served the same passenger movement with inputs approximately 99% lower than actually incurred, it would be effective. Similarly, if the airport in Gdansk served the same passenger movement with inputs lower by approximately 34%, it would be effective. These conclusions are also consistent with Figure 2.
Interesting in this context is the fact that there was no “backlash” in the result represented by passenger movement and airplane traffic. There was a gap in the first input, represented by energy consumption in only two airports in Katowice (EPKT) and Lublin (EPLB), at the level of 0.06 and 0.02, respectively, which means that in these airports, energy consumption should be rationalized by 0.06 MJ and 0.02 MJ, respectively.
Based on the effects of scale, which are the sum of the intensity indicators, it can be assumed that constant economies of scale were recorded for the airports in Szczecin (EPSC) and Rzeszow (EPRZ). Growing economies of scale can be attributed to the airports in Bydgoszcz (EPBY), Lublin (EPLB), Katowice (EPKT), and Poznan (EPPO). On the other hand, decreasing economies of scale occur in Warsaw (EPWA), Krakow (EPKK), Gdansk (EPGD), and Wroclaw (EPWR). There are no economies of scale in Warsaw-Modlin (EPMO) and Lodz (EPLL). In the case of constant economies of scale, it was noticed that an increase or decrease in inputs will cause a directly proportional increase or decrease in effects (in the same direction, i.e., increase-increase, decrease-decrease). For example, a double increase in inputs will double the passenger movement. Growing economies of scale mean that with an increase or decrease in inputs, there is a more intense increase or decrease in effects than inputs (for example, a 2.8-fold increase in inputs will result in a 4-fold increase in effects). Declining economies of scale indicate that with an increase or decrease in inputs, there is a less intense increase or decrease in effects than in inputs (for example, a 16.2-fold increase in inputs will result in a two-fold increase in effects). The economies of scale values can therefore be considered as a measure of efficiency improvement in the context of rationalization of energy consumption, airplane traffic, and passenger movement, and the assessment of the merits of the best option from the point of view of the airport’s interest. In this case, rationalization should be based on increasing the inputs of ineffective units and achieving growing economies of scale, and on reducing the inputs of ineffective units and achieving decreasing economies of scale. Declining economies of scale indicate that the level of saturation has been achieved (the scope for improving the efficiency of these airports is limited; they need to prioritize objectives), while increasing economies of scale provide a flexible area of improvement (multi-directional objectives) of rationalization for ineffective units.
Theta coefficients were verified for randomness (Table 5) and normal distribution (Table 6), which is crucial from the point of view of spatial analyzes (Moran statistics and local LISA statistics).
The following conclusions can be drawn from Table 5:
- Based on the result of the Wald–Wolfowitz series test for the mean p = 0.5448 at the significance level α = 0.05, there are no grounds to reject the hypothesis of the randomness of the ‘theta’ variable;
- Based on the result of the Wald–Wolfowitz series test for the median p = 0.5448 at the significance level α = 0.05, there are no grounds to reject the hypothesis of the randomness of the ‘theta’ variable;
- Based on the Mann–Kendall test result p = 0.9453 at the significance level α = 0.05, there are no grounds to reject the hypothesis of the randomness of the ‘theta’ variable;
- Based on the Bartels rank test result p = 0.9483 at the significance level α = 0.05, there are no grounds to reject the hypothesis of the randomness of the ‘theta’ variable.
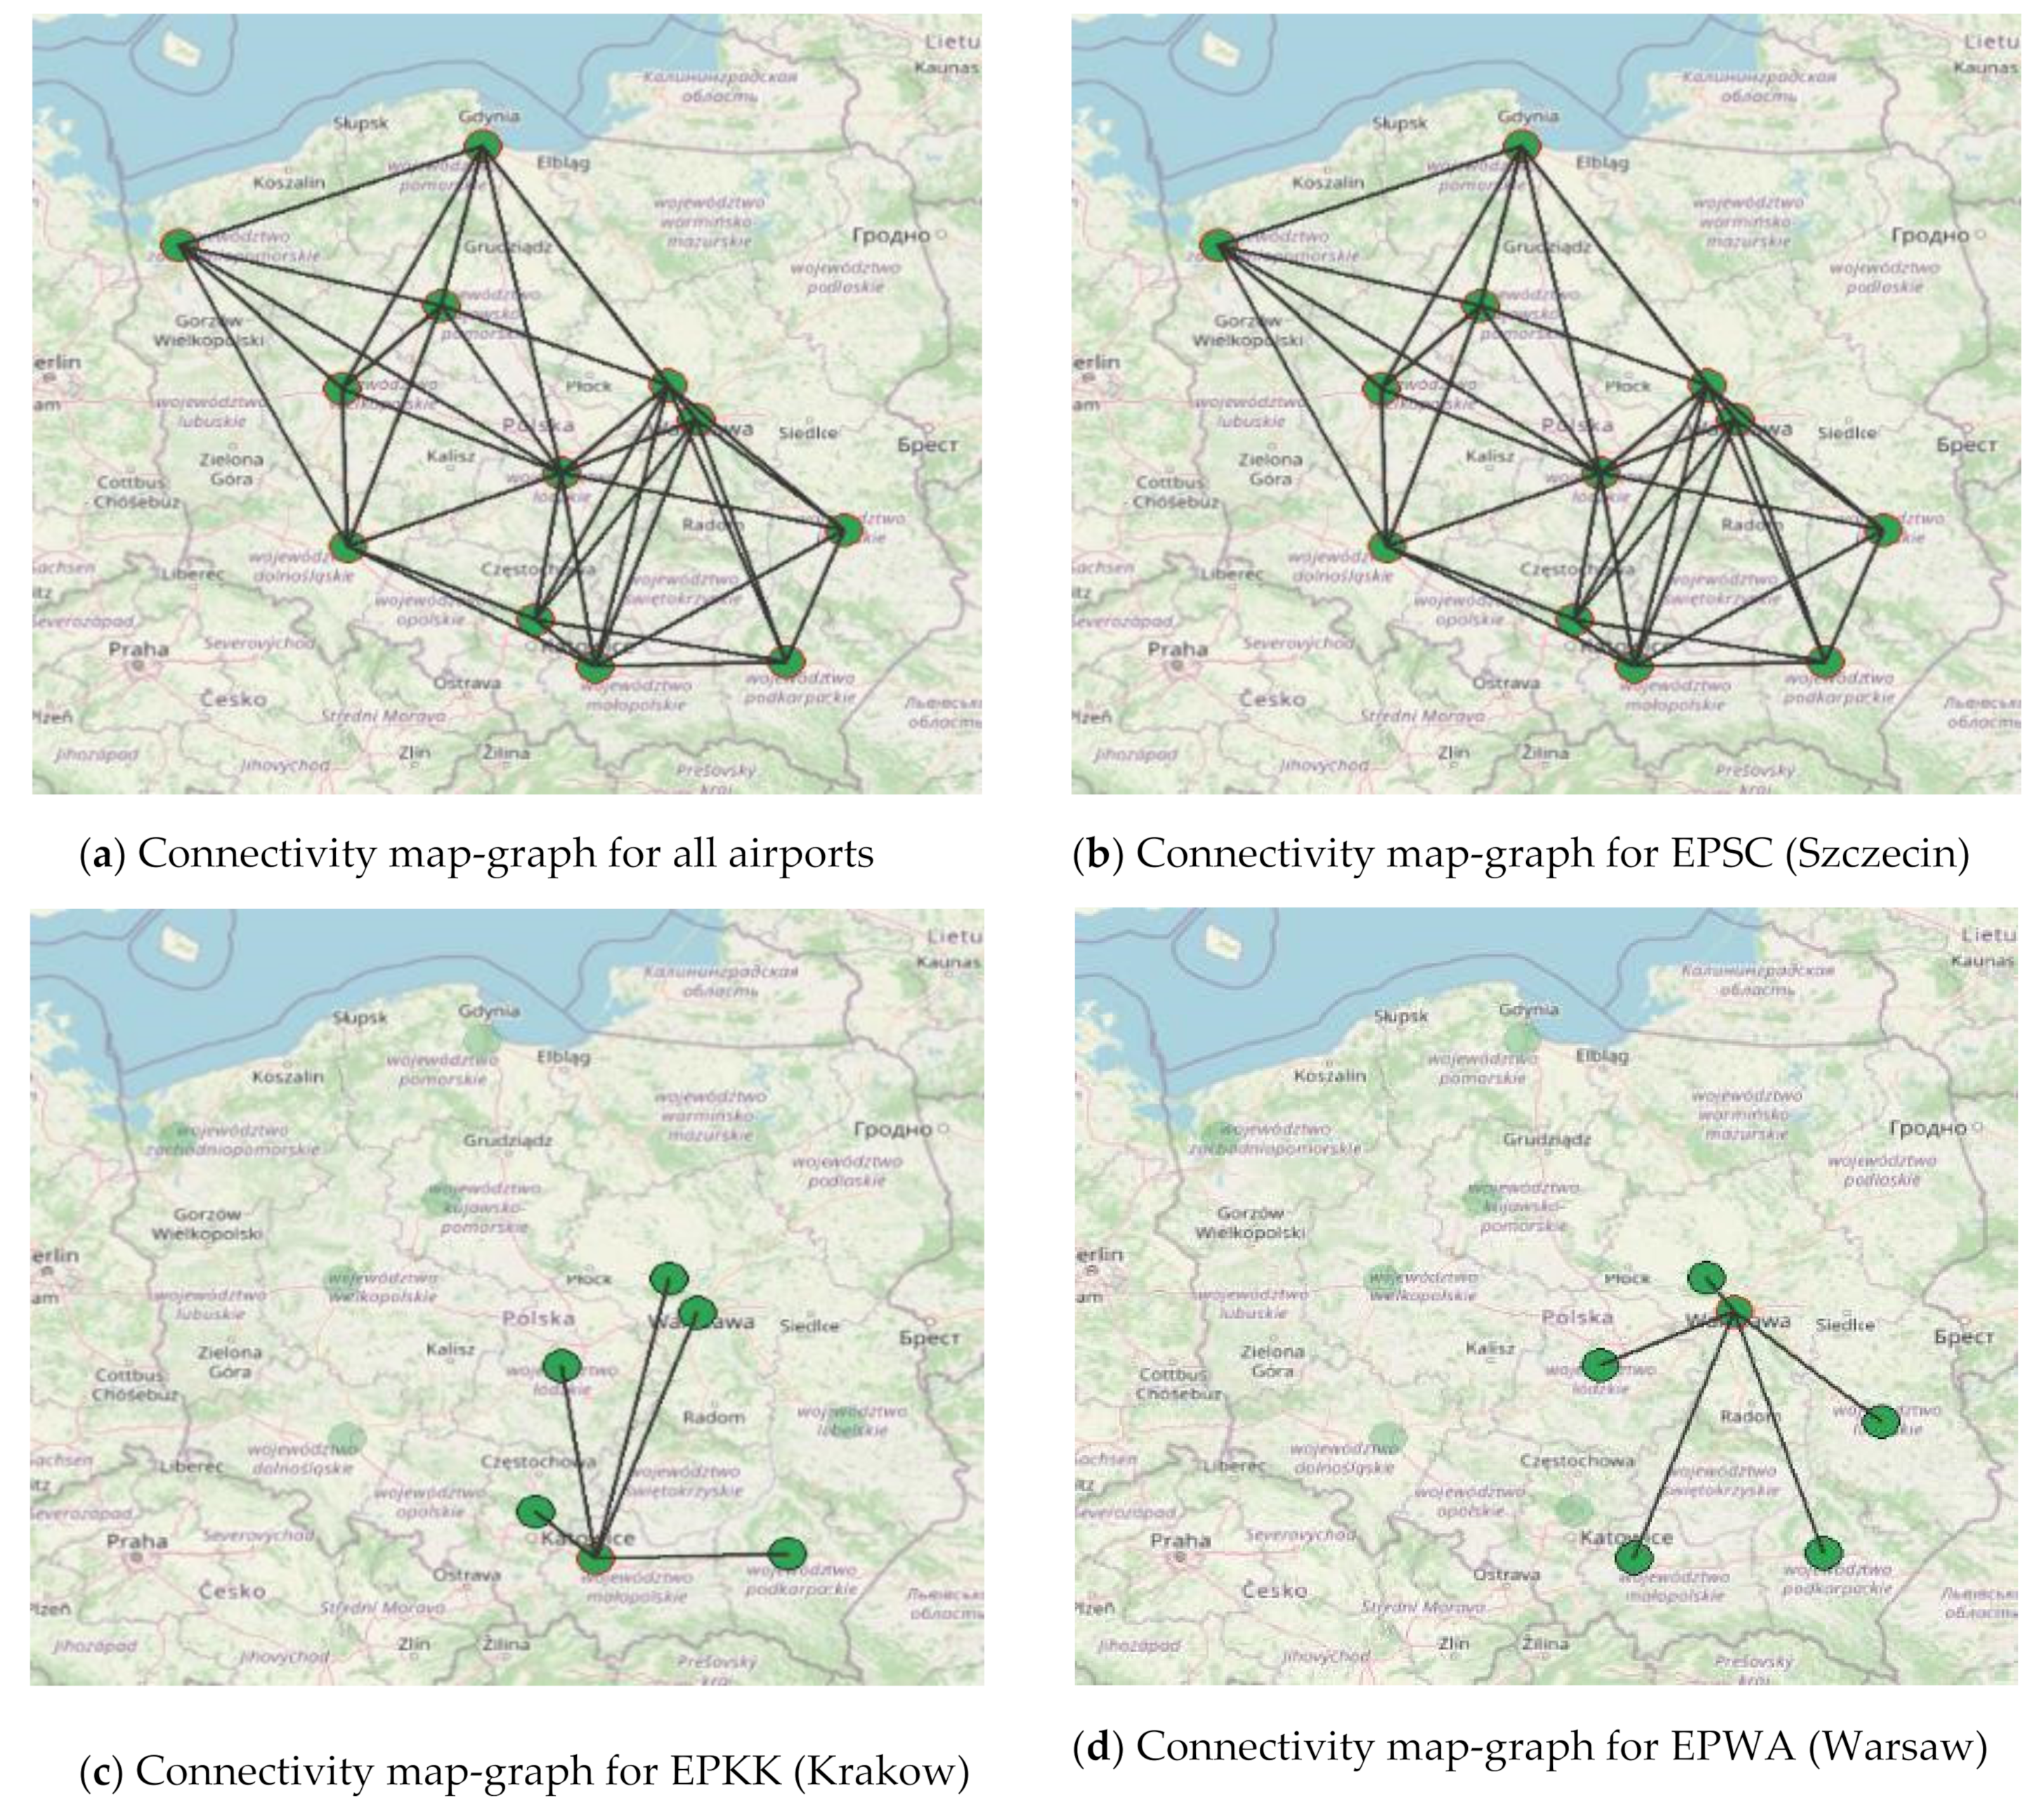
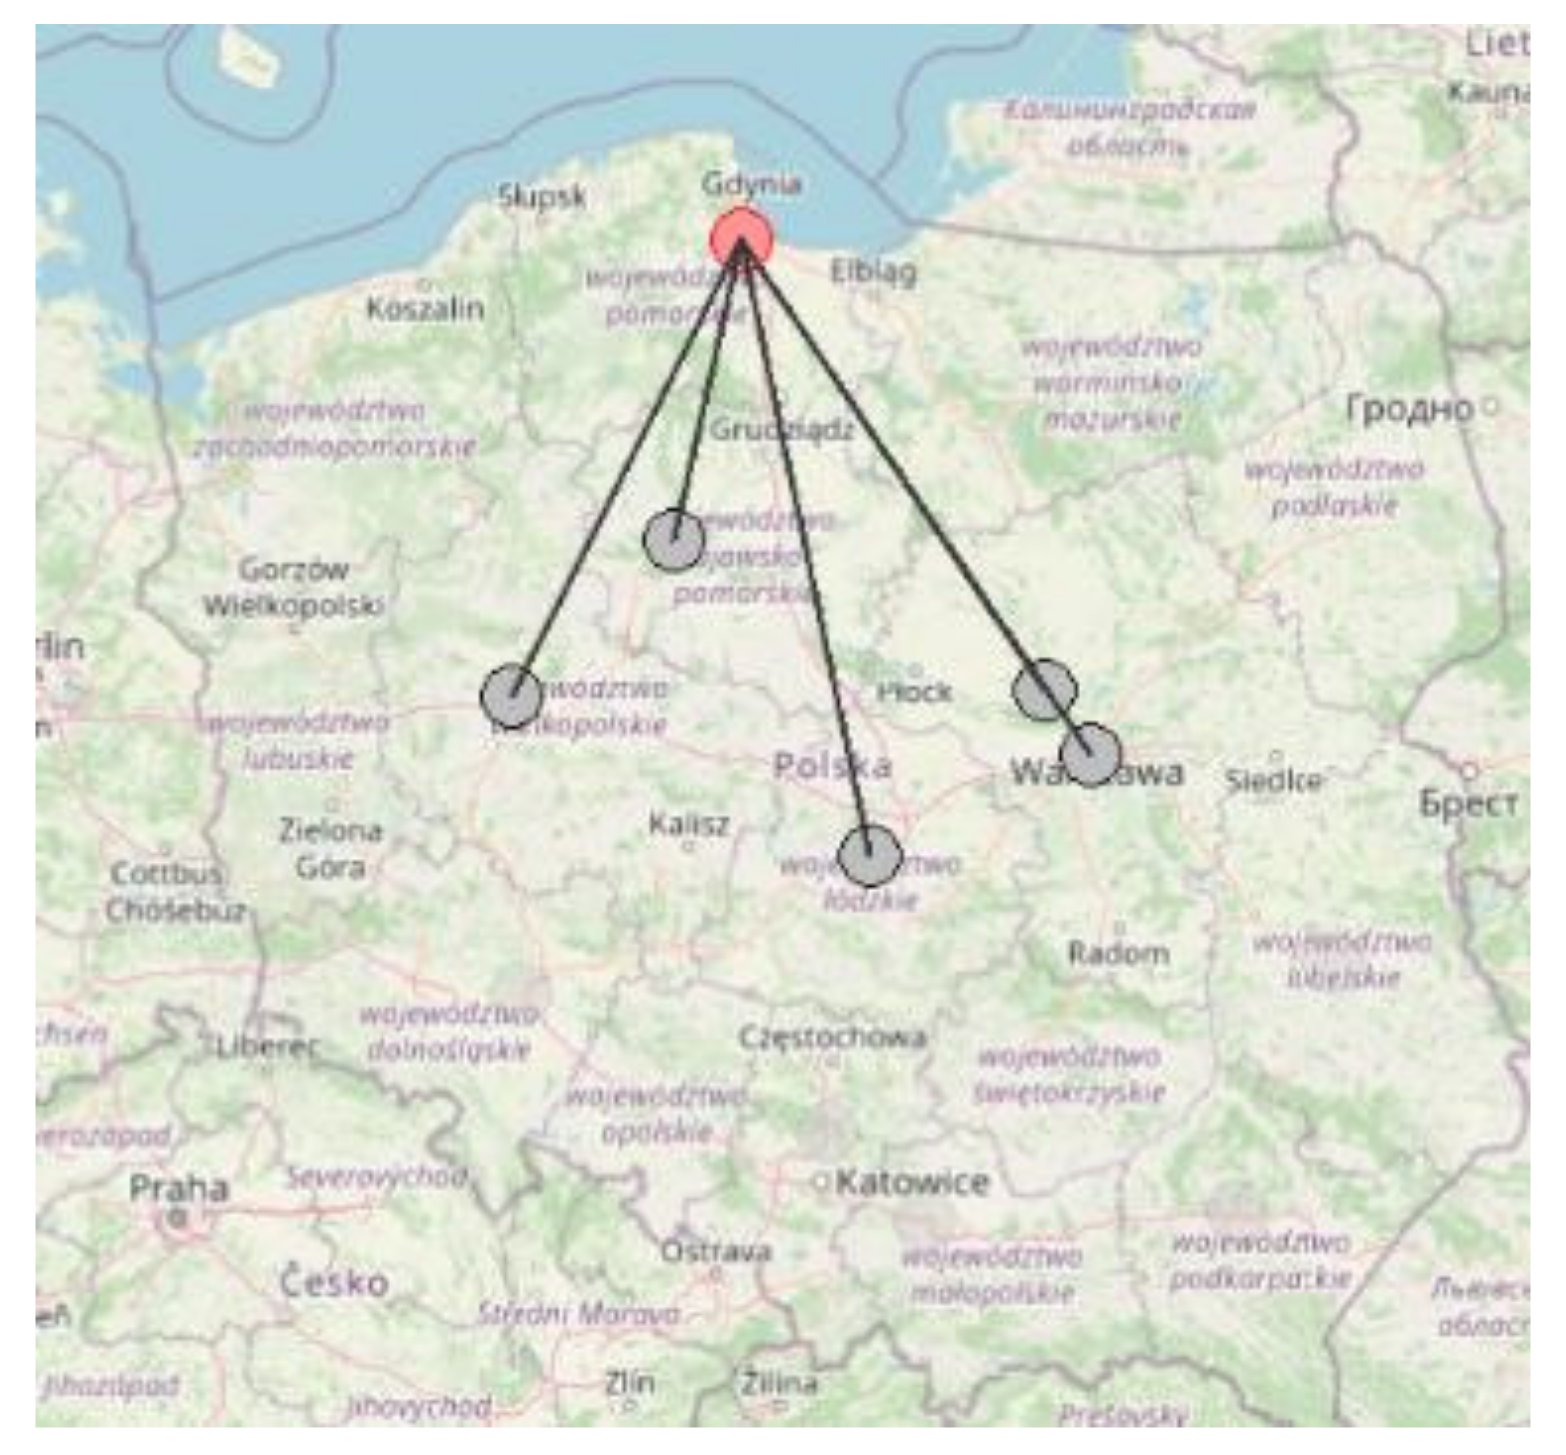
Taking into account the efficiency of individual airports and their location (geographical coordinates: latitude and longitude), a weight matrix and a map-graph of connections were determined (Figure 3). Based on the network, connections can be identified between locations, the nearest neighbors, and isolating units that are not connected, concerning three characteristics of performance (theta): latitude, longitude, and efficiency.
The following conclusions can be drawn from Table 6:
- Based on the Shapiro–Wilk test result p = 0.2745 at the significance level α = 0.05, there are no grounds to reject the hypothesis that the distribution of the ‘theta’ variable is normal;
- Based on the Lilliefors test result p > 0.20 at the significance level α = 0.05, there are no grounds to reject the hypothesis that the distribution of the ‘theta’ variable is normal.
The connection network (Figure 3) shows the connections due to the three characteristics of each airport with up to five closest neighbors based on a weight matrix calculated using the uniform kernel method resulting from the three above-mentioned characteristics. Figure 3a shows the superimposition of all these connections; the remaining connection graphs relate to the airports with the highest efficiency. The length of the connections indicates the spatial (geographical) distance between the airports examined. According to these connections, the closest neighbors of the Szczecin airport (EPSC) are the airports in Poznan (EPPO), Bydgoszcz (EPBY), Gdansk (EPGD), Wroclaw (EPWR), and Lodz (EPLL). The airport in Krakow (EPKK)’s closest neighbors are the airports in Katowice (EPKT) and Rzeszow (EPRZ), a bit further in Lodz (EPLL), and in Warsaw (EPWA) and Warsaw-Modlin (EPMO). Analyzing the connection graph of the airport in Warsaw (EPWA), the closest airports are Warsaw-Modlin (EPMO), Lodz (EPLL), Lublin (EPLB), Rzeszow (EPRZ), and Krakow (EPKK).
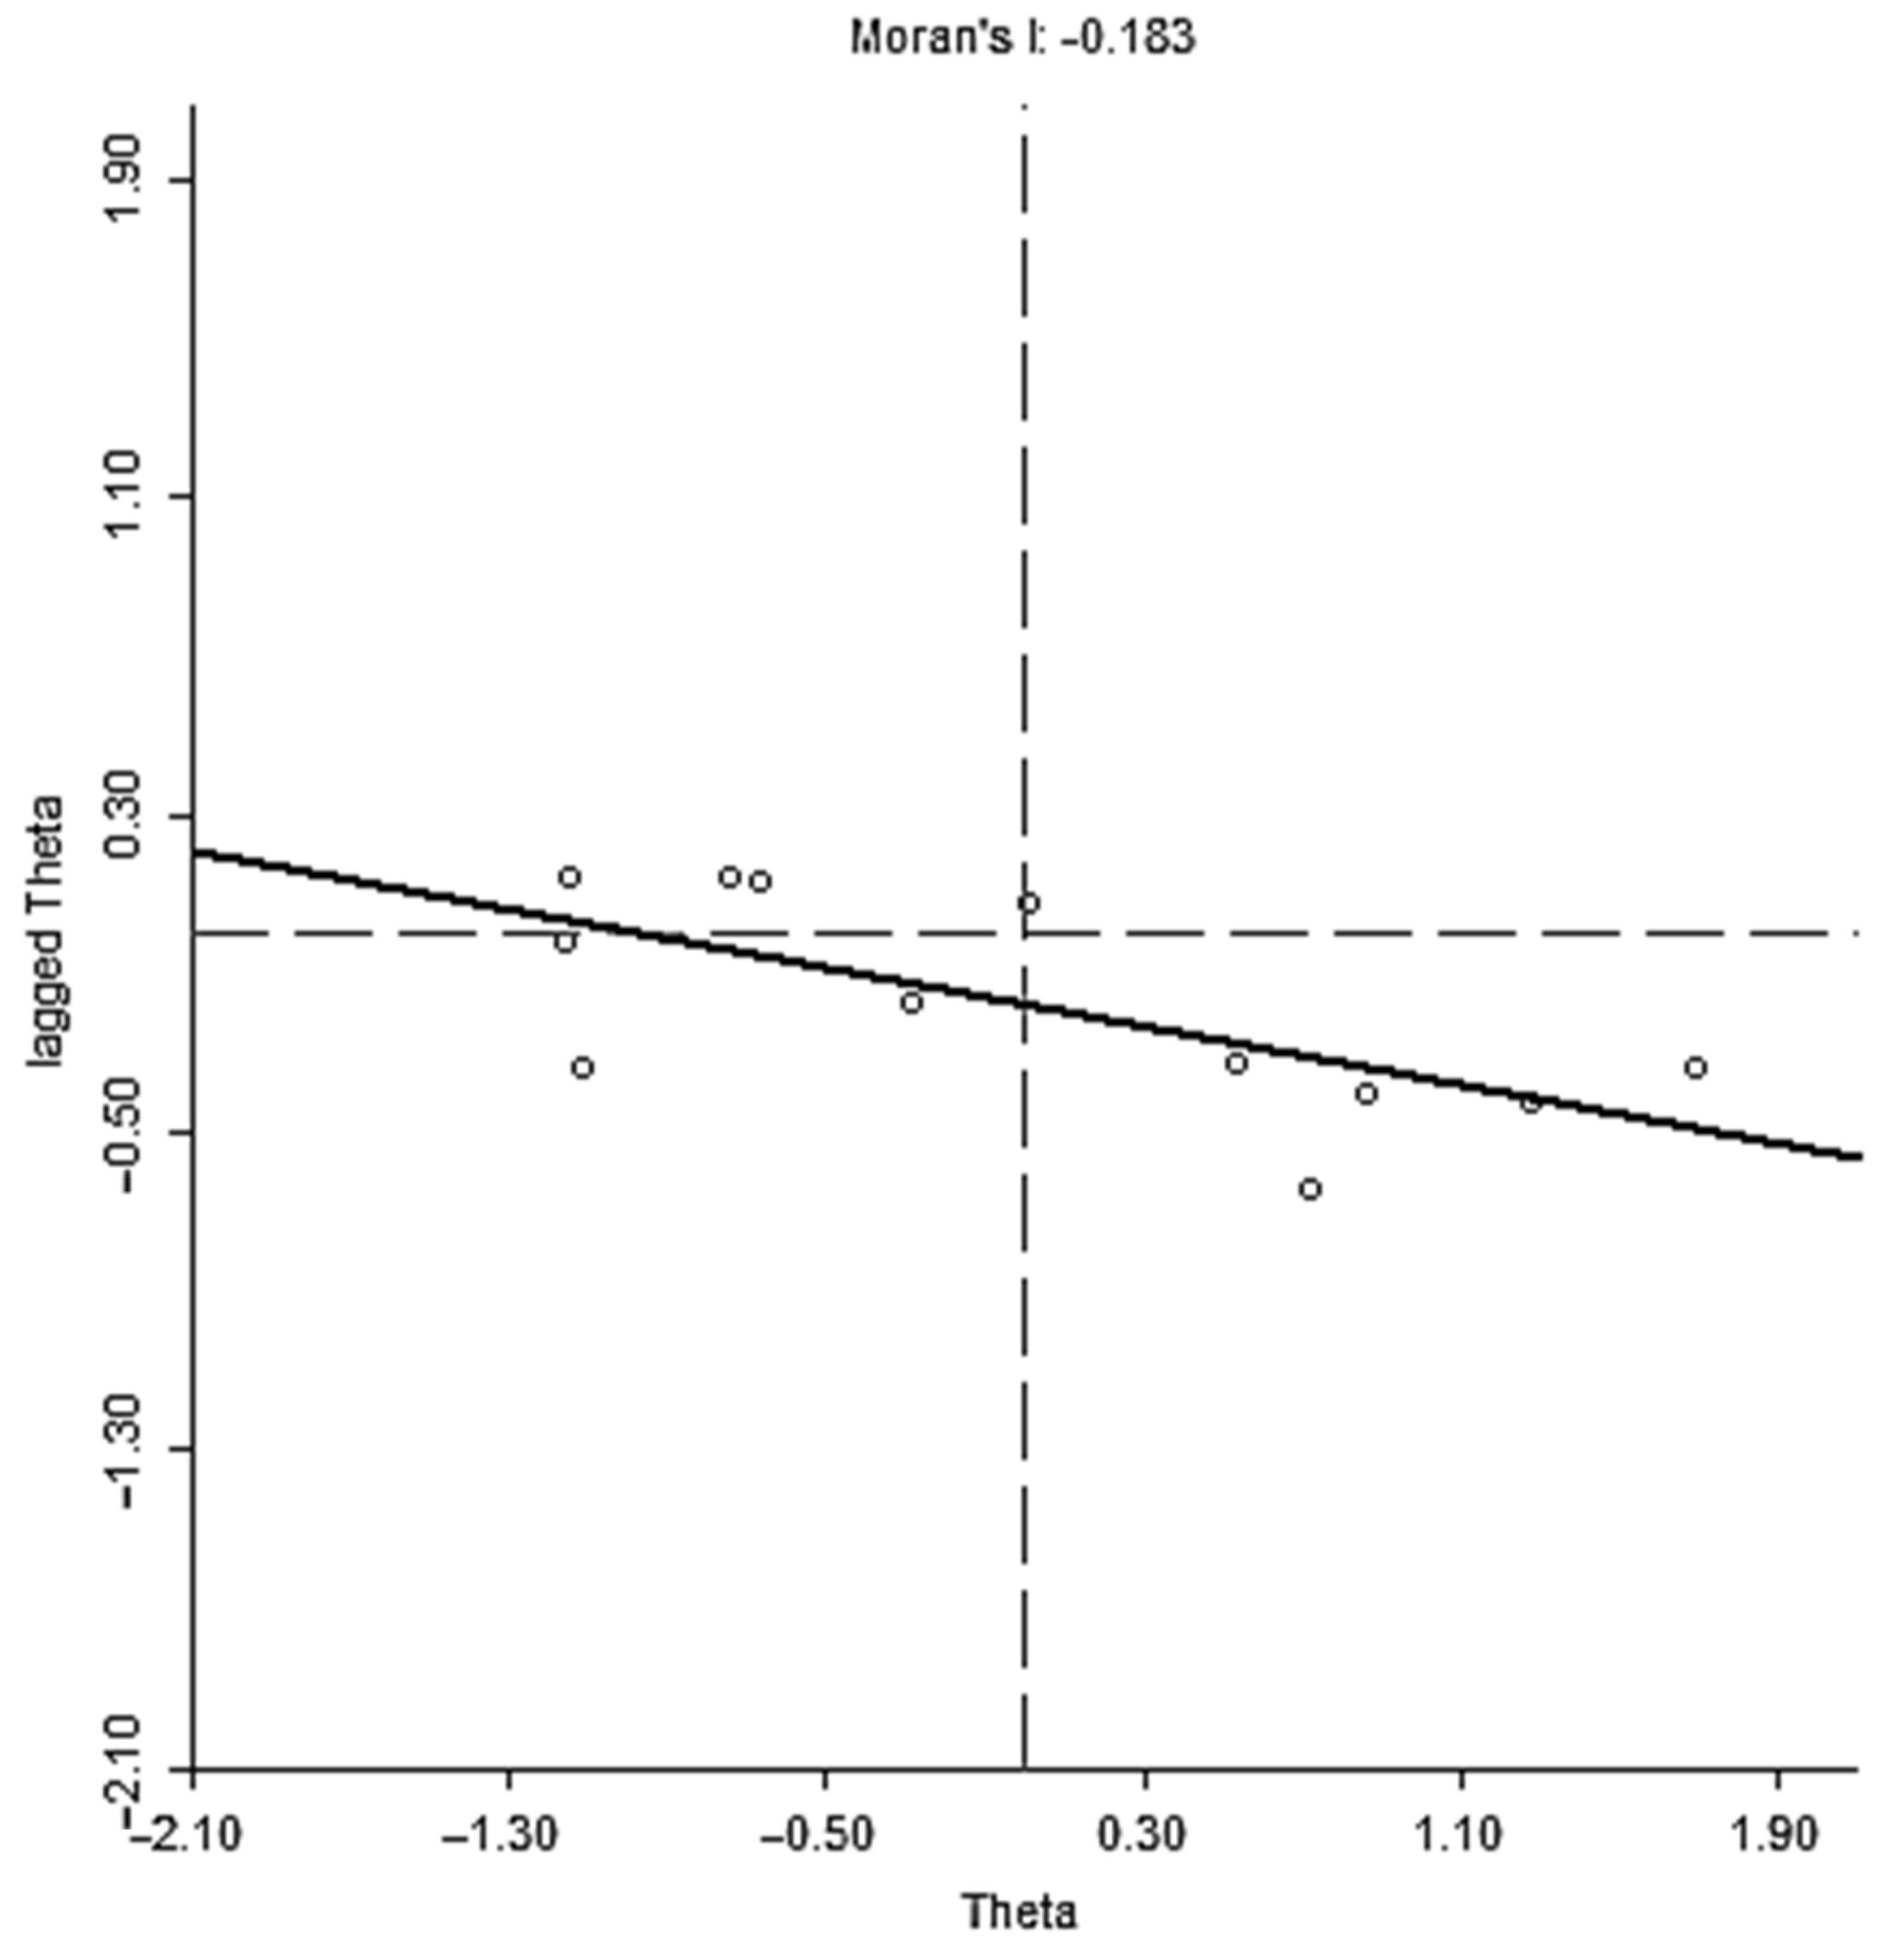
In order to confirm whether there is competition or cooperation between airports, using the previously estimated weight matrix, the global Moran I statistics (Figure 4) and local LISA statistics were calculated to determine the outlier observation (airport). The calculation of the I statistics allowed for a graphical representation of the pseudo-level significance coefficient of the permutation test performed for individual locations.
Based on Moran’s statistics, a negative and low value was unequivocally found between the theta and the spatially delayed theta, which suggests a negative, relatively weak autocorrelation, i.e., weak competition between airports. Thus, it was confirmed from earlier observations from the results of the DEA method and spatial differentiation that airports compete with each other in terms of outputs (passenger movement), but the market is so fragmented that the neighborhood plays a secondary role. Unfortunately, this carries with it another important premise, namely that the inputs (with the results of airplane traffic and energy consumption) are inefficiently managed in order to achieve results at the current level. Negative spatial autocorrelation (lack of cooperation) affects the satisfaction of individual interests and there are no shifts to rationalize air transport in order to mitigate the effects of irrational energy consumption and irrational airplane traffic in relation to passenger movement. This raises some concerns in the area of sustainable development and will probably be associated in the long term with a paradigm shift [26,28], i.e., shifts of passenger transport to other modes of transport. From the point of view of the paradigm shift, the complementary functions of transport are also important. Land transport (especially road and rail) determines the functioning of air and inland transport, as it connects these modes of transport with their target markets. The features of land transport determine the scope of access to inland and air transport services and indirectly affect the level of their competitiveness and efficiency [24].
Based on the LISA statistics, an outlier was determined that was located in the vicinity of airports (Figure 5). On the basis of the connections, it is possible to identify the airports with which the airport in Gdansk (EPGD) competes with the most. In the case of this airport, it could be confirmed (with permutations equal to 999) that there was a strong and significant competition between the closest neighbors; these are the following airports: Bydgoszcz (EPBY), Warsaw-Modlin (EPMO), Poznan (EPPO), and Warsaw (EPWA). Competition concentrated in the immediate area was noticed, while in other cases, the competition is more dispersed. In other words, the remaining airports compete, but not against the nearest neighbor, but against all domestic air transport services. It can be considered that EPGD is a growth pole compared to EPBY, EPMO, and EPPO, and this leads to a backwash effect, the second to the Gdansk airport (EPGD), and may also cause a drainage effect. In fact, the lack of cooperation deepens the divergence in airport potential and capabilities. There is also a strong polarization of airports, which achieves efficiency higher than the average (40%) in the case of airports in Szczecin (EPSC), Krakow (EPKK), Warsaw (EPWA), Gdansk (EPGD), Wroclaw (EPWR), and Katowice (EPKT), and is also related to the polarization of the region in which the airport operates.
In the context of the research results, a virtual communication node (the subject of research on quantum economy, or Q economy) may turn out to be quite an interesting solution, using the already existing potential of regional nodes—the studied airports—but also the existing rail and road transport infrastructure (important for the implementation of the paradigm shift). In addition, the virtual communication node can be a kind of panacea for the problems of sustainable development while implementing the European Union’s climate and digital strategy. Its role is virtual planning, but real service delivery in the real world. Its assumption is the optimization of processes to meet transport needs, and the goal would be to reduce the consumption of fuels in air transport [57]. Competition would take place between carriers and preferential ones would be those who would offer, for example, lower fuel consumption and thus lower greenhouse gas emissions in operational processes in the air and at the airport [58]. This solution would promote the rationalization of air transport in terms of energy consumption, airplane traffic, and passenger movement, criteria that have been thoroughly studied. Nevertheless, the question remains whether the virtual communication node will deepen the polarization of airports, or will if it will reverse this direction towards airport convergence. However, it would work in Poland in the time of the COVID-19 pandemic.
5. Conclusions
The presented analyses identifies ineffective airports (in terms of non-parametric relational efficiency assessment taking into account three dimensions simultaneously: energy consumption, airplane traffic, and passenger movement) from the point of view of statistical features, which were subjected to an in-depth study. It was also possible to verify the level of spatial autocorrelation, which proves that airports are competing with each other for passengers and carriers, instead of cooperating and shifting some traffic to geographically nearby airports. In this way, the paradigm of sustainable development—shift—would be realized. In addition, it has been noticed that the market is fragmented and that the neighborhood plays a secondary role. There is also a strong polarization of airports, which shows that efficient airports are sucking the market out. In the long term, this may contribute to the deepening of differences between airports; some airports will be more effective growth poles, and ineffective ones will not have a chance to improve within the entire airport network.
The aim of this article has been achieved, and the research hypotheses have been verified. The results of the research prove that the research problem is much wider than assumed in the introduction because, as shows, airports do not have a rationalized structure of inputs to results and strive to dominate the market.
The conducted research is innovative because so far in the analyzed literature there are no studies including the dimension of energy consumption in relation to other measures characterizing the airport potential. The selection of methods in the field of linear programming such as the non-parametric method (DEA model) and in the field of spatial econometrics (exploration of spatial autocorrelation by the dimension of different methods) is an innovative proposal to enrich the theory of airport management and to implement a methodology for airport assessment. This research is interdisciplinary and covers many research fields, such as management, economics, socio-economic geography, transport, statistics, and IT. The research results could be useful to airport managers, carriers, decision-makers in economic and crisis management, and scientists.
Author Contributions
Conceptualization, E.S. and E.Z.; methodology, E.S. and E.Z.; validation, E.S. and E.Z; formal analysis, E.S.; investigation, E.S. and E.Z.; resources, E.S. and E.Z.; writing—original draft preparation, E.S. and E.Z.; writing—review and editing, E.S. and E.Z.; visualization, E.S. and E.Z.; supervision, E.S. and E.Z.; project administration, E.S. and E.Z.; funding acquisition, E.S. and E.Z. All authors have read and agreed to the published version of the manuscript.
Funding
This research received no external funding.
Institutional Review Board Statement
Not applicable.
Informed Consent Statement
Not applicable.
Data Availability Statement
Conflicts of Interest
The authors declare no conflict of interest.
Appendix A

Table A1.
Full data envelopment analysis (DEA) results for Polish airports (λ means lambda).
| Airport | EPSC | EPKK | EPWA | EPGD | EPWR | EPKT | EPLB | EPPO | EPRZ | EPBY | EPMO | EPLL | |
|---|---|---|---|---|---|---|---|---|---|---|---|---|---|
| Code | AP9 | AP4 | AP10 | AP2 | AP12 | AP3 | AP5 | AP7 | AP8 | AP1 | AP11 | AP6 | |
| Theta | 1 | 0.8534 | 0.7095 | 0.6574 | 0.5921 | 0.4103 | 0.3053 | 0.1695 | 0.1457 | 0.0125 | 0.0041 | 0 | |
| λ | AP1 | 0 | 0 | 0 | 0 | 0 | 0 | 0 | 0 | 0 | 0 | 0 | 0 |
| λ | AP2 | 0 | 0 | 0 | 0 | 0 | 0 | 0 | 0 | 0 | 0 | 0 | 0 |
| λ | AP3 | 0 | 0 | 0 | 0 | 0 | 0 | 0 | 0 | 0 | 0 | 0 | 0 |
| λ | AP4 | 0 | 0 | 0 | 0 | 0 | 0 | 0 | 0 | 0 | 0 | 0 | 0 |
| λ | AP5 | 0 | 0 | 0 | 0 | 0 | 0 | 0 | 0 | 0 | 0 | 0 | 0 |
| λ | AP6 | 0 | 0 | 0 | 0 | 0 | 0 | 0 | 0 | 0 | 0 | 0 | 0 |
| λ | AP7 | 0 | 0 | 0 | 0 | 0 | 0 | 0 | 0 | 0 | 0 | 0 | 0 |
| λ | AP8 | 0 | 0 | 0 | 0 | 0 | 0 | 0 | 0 | 0 | 0 | 0 | 0 |
| λ | AP9 | 1 | 2.4241 | 8.1087 | 1.9796 | 1.5908 | 0.6983 | 0.171 | 0.9262 | 1.0017 | 0.033 | 0.0027 | 0.0005 |
| λ | AP10 | 0 | 0 | 0 | 0 | 0 | 0 | 0 | 0 | 0 | 0 | 0 | 0 |
| λ | AP11 | 0 | 0 | 0 | 0 | 0 | 0 | 0 | 0 | 0 | 0 | 0 | 0 |
| λ | AP12 | 0 | 0 | 0 | 0 | 0 | 0 | 0 | 0 | 0 | 0 | 0 | 0 |
| Slack −1 | 0 | 0 | 0 | 0 | 0 | 0.06 | 0.02 | 0 | 0 | 0 | 0 | 0 | |
| Slack −2 | 0 | 0 | 0 | 0 | 0 | 0 | 0 | 0 | 0 | 0 | 0 | 0 | |
| Slack +1 | 0 | 0 | 0 | 0 | 0 | 0 | 0 | 0 | 0 | 0 | 0 | 0 | |
| Scale’s effect | CRS | DRS | DRS | DRS | DRS | IRS | IRS | IRS | CRS | IRS | IRS | IRS | |
Note: CRS means the constant returns (economies) of scale; DRS means decreasing returns of scale; IRS means increasing returns of scale. Source: own calculations based on data from DBW (Dziedzinowa Baza Wiedzy) [43].
References
- Piwowarski, M.; Borawski, M.; Nermend, K. The Problem of Non-Typical Objects in the Multidimensional Comparative Analysis of the Level of Renewable Energy Development. Energies 2021, 14, 5803. [Google Scholar] [CrossRef]
- Szaruga, E.; Kłos-Adamkiewicz, Z.; Gozdek, A.; Załoga, E. Linkages between Energy Delivery and Economic Growth from the Point of View of Sustainable Development and Seaports. Energies 2021, 14, 4255. [Google Scholar] [CrossRef]
- Simionescu, M.; Wojciechowski, A.; Tomczyk, A.; Rabe, M. Revised Environmental Kuznets Curve for V4 Countries and Baltic States. Energies 2021, 14, 3302. [Google Scholar] [CrossRef]
- Mańkowska, M.; Pluciński, M.; Kotowska, I.; Filina-Dawidowicz, L. Seaports during the COVID-19 Pandemic: The Terminal Operators’ Tactical Responses to Disruptions in Maritime Supply Chains. Energies 2021, 14, 4339. [Google Scholar] [CrossRef]
- Rutkowska, M.; Bartoszczuk, P.; Singh, U.S. Management of GREEN Consumer Values in Renewable Energy Sources and Eco Innovation in INDIA. Energies 2021, 14, 7061. [Google Scholar] [CrossRef]
- Piwowarski, M.; Miłaszewicz, D.; Łatuszyńska, M.; Borawski, M.; Nermend, K. Application of the Vector Measure Construction Method and Technique for Order Preference by Similarity Ideal Solution for the Analysis of the Dynamics of Changes in the Poverty Levels in the European Union Countries. Sustainability 2018, 10, 2858. [Google Scholar] [CrossRef] [Green Version]
- Przybyłowski, P.; Przybyłowski, A.; Kałaska, A. Utility Method as an Instrument of the Quality of Life Assessment Using the Examples of Selected European Cities. Energies 2021, 14, 2770. [Google Scholar] [CrossRef]
- Brussel, M.; Zuidgeest, M.; Pfeffer, K.; van Maarseveen, M. Access or Accessibility? A Critique of the Urban Transport SDG Indicator. Int. J. Geo-Inf. 2019, 8, 67. [Google Scholar] [CrossRef] [Green Version]
- Yang, L.; van Dam, K.H.; Zhang, L. Developing Goals and Indicators for the Design of Sustainable and Integrated Transport Infrastructure and Urban Spaces. Sustainability 2020, 12, 9677. [Google Scholar] [CrossRef]
- Ahmed, T.; Moeinaddini, M.; Almoshaogeh, M.; Jamal, A.; Nawaz, I.; Alharbi, F. A New Pedestrian Crossing Level of Service (PCLOS) Method for Promoting Safe Pedestrian Crossing in Urban Areas. Int. J. Environ. Res. Public Health 2021, 18, 8813. [Google Scholar] [CrossRef]
- Nadi, P.A.; Murad, A. Modelling Sustainable Urban Transport Performance in the Jakarta City Region: A GIS Approach. Sustainability 2019, 11, 1879. [Google Scholar] [CrossRef] [Green Version]
- Mancinelli, E.; Canestrari, F.; Graziani, A.; Rizza, U.; Passerini, G. Sustainable Performances of Small to Medium-Sized Airports in the Adriatic Region. Sustainability 2021, 13, 13156. [Google Scholar] [CrossRef]
- Hemmings, P.; Mulheron, M.; Murphy, R.J.; Prescott, M. Investigating the Impact of COVID-19 Disruption on the Decarbonisation Agenda at Airports: Grounded or Ready for Take-Off? Sustainability 2021, 13, 12235. [Google Scholar] [CrossRef]
- Sulej-Suchomska, A.M.; Przybyłowski, P.; Polkowska, Ż. Potential Toxic Effects of Airport Runoff Water Samples on the Environment. Sustainability 2021, 13, 7490. [Google Scholar] [CrossRef]
- Kierzkowski, A.; Kisiel, T. Feasibility of Reducing Operator-to-Passenger Contact for Passenger Screening at the Airport with Respect to the Power Consumption of the System. Energies 2021, 14, 5943. [Google Scholar] [CrossRef]
- Jiang, Y.; Yang, R.; Zang, C.; Wei, Z.; Thompson, J.; Tran, T.H.; Encinas-Oropesa, A.; Williams, L. Toward Baggage-Free Airport Terminals: A Case Study of London City Airport. Sustainability 2022, 14, 212. [Google Scholar] [CrossRef]
- Sever, D.; Doler, D.; Kovačič, B. Modelling of Evenness of Runways as an Element of Sustainable Airport Maintenance. Appl. Sci. 2021, 11, 8697. [Google Scholar] [CrossRef]
- Mascio, P.D.; Moretti, L. Hourly Capacity of a Two Crossing Runway Airport. Infrastructures 2020, 5, 111. [Google Scholar] [CrossRef]
- Peng, Q.; Wan, L.; Zhang, T.; Wang, Z.; Tian, Y. A System Dynamics Prediction Model of Airport Environmental Carrying Capacity: Airport Development Mode Planning and Case Study. Aerospace 2021, 8, 397. [Google Scholar] [CrossRef]
- Mascio, P.D.; Rappoli, G.; Moretti, L. Analytical Method for Calculating Sustainable Airport Capacity. Sustainability 2020, 12, 9239. [Google Scholar] [CrossRef]
- Sedlin, T.; Beckmann, V.; Tan, R. Public Participation and Airport Development: The Case of the Site Selection for Berlin Brandenburg Airport (BER) in Germany. Sustainability 2020, 12, 10535. [Google Scholar] [CrossRef]
- Marciszewska, E.; Zagrajek, P.; Hoszman, A. Future of Air Cargo in Poland. In Transport Development Challenges in the 21st Century, Proceedings of the 2019 TranSopot Conference, Gdansk University, Sopot, Poland2, 7–29 May 2019; Suchanek, M., Ed.; Springer: Cham, Switzerland, 2021; pp. 101–110. [Google Scholar] [CrossRef]
- Tłoczyński, D. Convenience as a Factor Differentiating Air Transport Service. In Transport Development Challenges in the 21st Century, Proceedings of the 2019 TranSopot Conference, Gdansk University, Sopot, Poland2, 7–29 May 2019; Suchanek, M., Ed.; Springer: Cham, Switzerland, 2021; pp. 65–75. [Google Scholar] [CrossRef]
- Załoga, E. Nowa polityka transportowa Unii Europejskiej. In Transport. Nowe Wyzwania; Wojewódzka-Król, K., Załoga, E., Eds.; PWN: Warszawa, Poland, 2016; ISBN 978-83-01-18462-9. [Google Scholar]
- Kotowska, I.; Mańkowska, M.; Pluciński, M. Inland Shipping to Serve the Hinterland: The Challenge for Seaport Authorities. Sustainability 2018, 10, 3468. [Google Scholar] [CrossRef] [Green Version]
- Szaruga, E.; Skąpska, E.; Załoga, E.; Matwiejczuk, W. Trust and Distress Prediction in Modal Shift Potential of Long-Distance Road Freight in Containers: Modeling Approach in Transport Services for Sustainability. Sustainability 2018, 10, 2370. [Google Scholar] [CrossRef] [Green Version]
- Okraszewska, R.; Romanowska, A.; Wołek, M.; Oskarbski, J.; Birr, K.; Jamroz, K. Integration of a Multilevel Transport System Model into Sustainable Urban Mobility Planning. Sustainability 2018, 10, 479. [Google Scholar] [CrossRef] [Green Version]
- Załoga, E. Trendy w Transporcie Lądowym Unii Europejskiej; Wydawnictwo Naukowe Uniwersytetu Szczecińskiego: Szczecin, Poland, 2013; ISBN 978-83-7241-933-0. [Google Scholar]
- Mańkowska, M.; Pluciński, M.; Kotowska, I. Biomass Sea-Based Supply Chains and the Secondary Ports in the Era of Decarbonization. Energies 2021, 14, 1796. [Google Scholar] [CrossRef]
- Wołek, M.; Jagiełło, A.; Wolański, M. Multi-Criteria Analysis in the Decision-Making Process on the Electrification of Public Transport in Cities in Poland: A Case Study Analysis. Energies 2021, 14, 6391. [Google Scholar] [CrossRef]
- Wołek, M.; Szmelter-Jarosz, A.; Koniak, M.; Golejewska, A. Transformation of Trolleybus Transport in Poland. Does In-Motion Charging (Technology) Matter? Sustainability 2020, 12, 9744. [Google Scholar] [CrossRef]
- Iyer, K.C.; Jain, S. Performance Measurement of Airports Using Data Envelopment Analysis: A Review of Methods and Findings. J. Air Transp. Manag. 2019, 81, 101707. [Google Scholar] [CrossRef]
- Özsoy, V.S.; Örkcü, H.H. Structural and Operational Management of Turkish Airports: A Bootstrap Data Envelopment Analysis of Efficiency. Util. Policy 2021, 69, 101180. [Google Scholar] [CrossRef]
- Suzuki, S.; Nijkamp, P.; Rietveld, P.; Pels, E. A Distance Friction Minimization Approach in Data Envelopment Analysis: A Comparative Study on Airport Efficiency. Eur. J. Oper. Res. 2010, 207, 1104–1115. [Google Scholar] [CrossRef]
- Xiao-Yan, G. Performance Evaluation of Airport Construction Energy-Saving Based on DEA Network Design and Performance Analysis. Procedia Environ. Sci. 2011, 11, 358–364. [Google Scholar] [CrossRef] [Green Version]
- Ennen, D.; Batool, I. Airport Efficiency in Pakistan—A Data Envelopment Analysis with Weight Restrictions. J. Air Transp. Manag. 2018, 69, 205–212. [Google Scholar] [CrossRef]
- Pestana Barros, C.; Dieke, P.U.C. Performance Evaluation of Italian Airports: A Data Envelopment Analysis. J. Air Transp. Manag. 2007, 13, 184–191. [Google Scholar] [CrossRef]
- Liu, D. Measuring Aeronautical Service Efficiency and Commercial Service Efficiency of East Asia Airport Companies: An Application of Network Data Envelopment Analysis. J. Air Transp. Manag. 2016, 52, 12–22. [Google Scholar] [CrossRef]
- Örkcü, H.H.; Balıkçı, C.; Dogan, M.I.; Genç, A. An Evaluation of the Operational Efficiency of Turkish Airports Using Data Envelopment Analysis and the Malmquist Productivity Index: 2009–2014 Case. Transp. Policy 2016, 48, 92–104. [Google Scholar] [CrossRef]
- Ahn, Y.-H.; Min, H. Evaluating the Multi-Period Operating Efficiency of International Airports Using Data Envelopment Analysis and the Malmquist Productivity Index. J. Air Transp. Manag. 2014, 39, 12–22. [Google Scholar] [CrossRef]
- Lin, L.C.; Hong, C.H. Operational Performance Evaluation of International Major Airports: An Application of Data Envelopment Analysis. J. Air Transp. Manag. 2006, 12, 342–351. [Google Scholar] [CrossRef]
- GeoHack. Available online: https://geohack.toolforge.org/geohack.php?params=___N____E (accessed on 21 July 2021).
- DBW: Dziedzinowa Baza Wiedzy (Knowedge Databases). Available online: http://swaid.stat.gov.pl/SitePages/StronaGlownaDBW.aspx (accessed on 21 July 2021).
- OpenStreetMap. Available online: https://www.openstreetmap.org/copyright/en (accessed on 21 July 2021).
- Adamczyk, J.K. Programowanie Zrównoważonego Rozwoju Przedsiębiorstw; Polskie Wydawnictwo Ekonomiczne: Warsaw, Poland, 2007; ISBN 978-83-208-1705-8. [Google Scholar]
- Briec, W. A Graph-Type Extension of Farrell Technical Efficiency Measure. J. Product. Anal. 1997, 8, 95–110. [Google Scholar] [CrossRef]
- Cooper, W.W.; Ray, S.C.; Stone, M. A Response to M. Stone: ’How Not to Measure the Efficiency of Public Services (And How One Might)’ [with Reply]. J. R. Stat. Soc. Ser. A (Stat. Soc.) 2008, 171, 433–448. [Google Scholar] [CrossRef]
- Farrell, M.J. The Measurement of Productive Efficiency. J. R. Stat. Soc. Ser. A (Gen.) 1957, 120, 253–290. [Google Scholar] [CrossRef]
- Banker, R.; Cooper, W.; Seiford, L.; Zhu, J. Returns to Scale in DEA. In Handbook on Data Envelopment Analysis; Cooper, W.W., Lawrence, M., Seiford, M., Zhu, J., Eds.; Springer: New York, NY, USA, 2011; pp. 41–70. [Google Scholar]
- Cooper, W.W.; Lawrence, M.; Seiford, M.; Zhu, J. Data Envelopment Analysis: History, Models, and Interpretations. In Handbook on Data Envelopment Analysis; Cooper, W.W., Lawrence, M., Seiford, M., Zhu, J., Eds.; Springer: New York, NY, USA, 2011; pp. 1–39. [Google Scholar]
- Banker, R.D.; Thrall, R.M. Estimation of Returns to Scale Using Data Envelopment Analysis. Eur. J. Oper. Res. 1992, 62, 74–84. [Google Scholar] [CrossRef]
- Suchecki, B.; Olejnik, A. Miary i testy statystyczne w eksploracyjnej analizie danych przestrzennych. In Ekonometria Przestrzenna: Metody i Modele Analizy Danych Przestrzennych; Suchecki, B., Ed.; Wydawnictwo C.H. Beck: Warsaw, Poland, 2010; ISBN 978-83-255-1122-7. [Google Scholar]
- GeoNames. Available online: http://www.geonames.org/ (accessed on 21 July 2021).
- Microsoft—Create a Map Chart in Excel. Available online: https://support.microsoft.com/en-us/office/create-a-map-chart-in-excel-f2cfed55-d622-42cd-8ec9-ec8a358b593b (accessed on 21 July 2021).
- TomTom. Available online: https://www.tomtom.com/en_gb/ (accessed on 21 July 2021).
- Bing Maps Platform—A Mapping Platform from Microsoft. Available online: https://www.microsoft.com/en-us/maps (accessed on 21 July 2021).
- Paprocki, W. Virtual Airport Hub—A New Business Model to Reduce GHG Emissions in Continental Air Transport. Sustainability 2021, 13, 5076. [Google Scholar] [CrossRef]
- Paprocki, W. Wirtualny węzeł komunikacyjny w nadchodzącej epoce Q economy. In Rozważania o transporcie. Księga Jubileuszowa dedykowana Profesor Elżbiecie Załodze; Kwarciński, T., Ed.; Wydawnictwo Naukowe Uniwersytetu Szczecińskiego: Szczecin, Poland, 2020; ISBN 978-83-7972-405-5. [Google Scholar]
Figure 1.
Localizations of examined airports. Source: own elaboration based on data from Table 1. Base map from © OpenStreetMap contributors 2021 [44]. Distributed under a CC BY-SA License.

Figure 2.
(a) Limitation with data presentation: the map does not include the EPMO airport, Warsaw-Modlin (Masovian Province), the efficiency index of which was equal to 0%. Only the second airport was taken into account—EPWA: Warsaw—from the same province. (b) Limitation with data presentation: the map does not include the EPMO airport, Warsaw-Modlin (Masovian Province), the inefficiency index of which was equal to 100%. Only the second airport was taken into account—EPWA: Warsaw—from the same province. Efficiency and inefficiency of Polish airports in 2019 by DEA. Source: own elaboration based on data from Table 4. Basemap from © GeoNames [53], Microsoft [54], TomTom [55] (by Bing [56] service, map generated by MS Excel).

Figure 3.
Connectivity map-graphs for airports. Source: own elaboration based on data from Table 1 and Table 4. Basemap from © OpenStreetMap contributors 2021 [44]. Distributed under a CC BY-SA License.

Figure 4.
Moran’s scatter plot. Source: own calculations based on data from Table 4.
Figure 4.
Moran’s scatter plot. Source: own calculations based on data from Table 4.

Figure 5.
Connectivity map-graph for the outlier airport EPGD. Note: only EPGD is marked pink as a high-low outlier; at a significant level with p-value = 0.05. Other airports are marked as non-significant outliers. Source: own elaboration based on data from Table 1 and Table 4. Basemap from © OpenStreetMap contributors 2021 [44]. Distributed under a CC BY-SA License.

Table 1.
Polish airports in the analysis; their codes by ICAO and DMU.
| City of Airport | Province | ICAO | DMU | Latitude | Longitude |
|---|---|---|---|---|---|
| Bydgoszcz | Kuyavian-Pomeranian | EPBY | AP1 | 53.0967 | 17.9778 |
| Gdansk | Pomeranian | EPGD | AP2 | 54.3775 | 18.4661 |
| Katowice | Silesian | EPKT | AP3 | 50.4742 | 19.0800 |
| Krakow | Lesser Poland | EPKK | AP4 | 50.0778 | 19.7847 |
| Lublin | Lublin | EPLB | AP5 | 51.2393 | 22.7141 |
| Lodz | Lodzkie | EPLL | AP6 | 51.7219 | 19.3981 |
| Poznan | Greater Poland | EPPO | AP7 | 52.4211 | 16.8264 |
| Rzeszow | Podkarpackie | EPRZ | AP8 | 50.1100 | 22.0189 |
| Szczecin | West Pomeranian | EPSC | AP9 | 53.5847 | 14.9019 |
| Warsaw | Masovian | EPWA | AP10 | 52.1658 | 20.9672 |
| Warsaw-Modlin | Masovian | EPMO | AP11 | 52.4511 | 20.6517 |
| Wroclaw | Lower Silesia | EPWR | AP12 | 51.1094 | 16.8803 |
Source: own elaboration based on data from the GeoHack database [42].
Table 2.
Selected summary statistics for twelve Polish airports in 2019.
| Items | Input 1 | Input 2 | Output | Input 1/Output | Input 2/Output |
|---|---|---|---|---|---|
| Variable | Energy consumption | Airplane traffic | Passenger movement | Energy consumption/Passenger movement | Airplane traffic/Passenger movement |
| Unit of raw data for variable | MJ | Number of planes | Number of passengers | MJ/passenger | Number of planes/passenger |
| Average | 126,926,580 | 11,002 | 324,100 | 31.09 | 26.95 |
| Median | 80,251,892 | 6957 | 208,825 | 0.04 | 0.03 |
| Standard deviation | 123,428,251 | 10,699 | 483,263 | 106.22 | 92.08 |
| Coefficient of variation | 0.9724 | 0.9724 | 1.4911 | 3.4167 | 3.4167 |
| Kurtosis | 0.9391 | 0.9391 | 8.3065 | 11.9975 | 11.9975 |
| Skewness | 1.3758 | 1.3758 | 2.7313 | 3.4636 | 3.4636 |
| Minimum | 16,300,715 | 1413 | 107 | 0.0134 | 0.0116 |
| Maximum | 394,170,436 | 34,168 | 1,758,157 | 368.3836 | 319.3271 |
Source: own calculations based on annual data from DBW (Dziedzinowa Baza Wiedzy) [43].
Table 3.
Correlation between variables.
| Feature 1 | Feature 2 | Pearson’s Correlation | FDR (Pearson’s Corr.) | Spearman’s Correlation | FDR (Spearman’s Corr.) |
|---|---|---|---|---|---|
| Input 1 | Input 2 | 1 | 3.98 × 10−79 | 1 | 0 |
| Input 1 | Output | 0.4387 | 0.1536 | 0.322 | 0.3079 |
| Input 2 | Output | 0.4387 | 0.1536 | 0.322 | 0.3079 |
Source: our own calculations based on data from DBW (Dziedzinowa Baza Wiedzy) [43].
Table 4.
DEA results for Polish airports.
| Airport | Code | Theta | Lambda AP9 | Slack −1 | Scale’s Effect |
|---|---|---|---|---|---|
| EPSC | AP9 | 1.0000 | 1.0000 | 0 | CRS |
| EPKK | AP4 | 0.8534 | 2.4241 | 0 | DRS |
| EPWA | AP10 | 0.7095 | 8.1087 | 0 | DRS |
| EPGD | AP2 | 0.6574 | 1.9796 | 0 | DRS |
| EPWR | AP12 | 0.5921 | 1.5908 | 0 | DRS |
| EPKT | AP3 | 0.4103 | 0.6983 | 0.06 | IRS |
| EPLB | AP5 | 0.3053 | 0.1714 | 0.02 | IRS |
| EPPO | AP7 | 0.1695 | 0.9262 | 0 | IRS |
| EPRZ | AP8 | 0.1457 | 1.0017 | 0 | CRS |
| EPBY | AP1 | 0.0125 | 0.0330 | 0 | IRS |
| EPMO | AP11 | 0.0041 | 0.0027 | 0 | IRS |
| EPLL | AP6 | 0 | 0.0005 | 0 | IRS |
Source: own calculations based on data from DBW (Dziedzinowa Baza Wiedzy) [43].
Table 5.
Verification of the randomness of the ‘theta’ variable.
| Type of Test | Value of the Statistics | p-Value |
|---|---|---|
| Wald-Wolfowitz series test for average | −0.61 | 0.5448 |
| Wald-Wolfowitz series test for the median | −0.61 | 0.5448 |
| Mann-Kendall test | −0.07 | 0.9453 |
| Bartels rank test | 0.06 | 0.9483 |
Source: own calculations based on data from Table 4.
Table 6.
Verification of the normality distribution for the ‘theta’ variable.
| Type of Test | Value of the Statistics | p-Value |
|---|---|---|
| Shapiro-Wilk test | 0.92 | 0.2745 |
| Lilliefors test | 0.17 | p > 0.20 |
Source: own calculations based on data from Table 4.
Publisher’s Note: MDPI stays neutral with regard to jurisdictional claims in published maps and institutional affiliations. |
© 2022 by the authors. Licensee MDPI, Basel, Switzerland. This article is an open access article distributed under the terms and conditions of the Creative Commons Attribution (CC BY) license (https://creativecommons.org/licenses/by/4.0/).
Share and Cite
MDPI and ACS Style
Szaruga, E.; Załoga, E. Sustainable Development Programming of Airports by Identification of Non-Efficient Units. Energies 2022, 15, 932. https://doi.org/10.3390/en15030932
AMA Style
Szaruga E, Załoga E. Sustainable Development Programming of Airports by Identification of Non-Efficient Units. Energies. 2022; 15(3):932. https://doi.org/10.3390/en15030932
Chicago/Turabian StyleSzaruga, Elżbieta, and Elżbieta Załoga. 2022. "Sustainable Development Programming of Airports by Identification of Non-Efficient Units" Energies 15, no. 3: 932. https://doi.org/10.3390/en15030932
Note that from the first issue of 2016, this journal uses article numbers instead of page numbers. See further details here.