
The Second Generation Electromobility in Polish Urban Public Transport: The Factors and Mechanisms of Spatial Development

 ,
,  ,
,
Abstract
:1. Introduction
2. Literature Review
3. Aims of the Study and Research Methodology
3.1. Objectives
3.2. Research Hypotheses
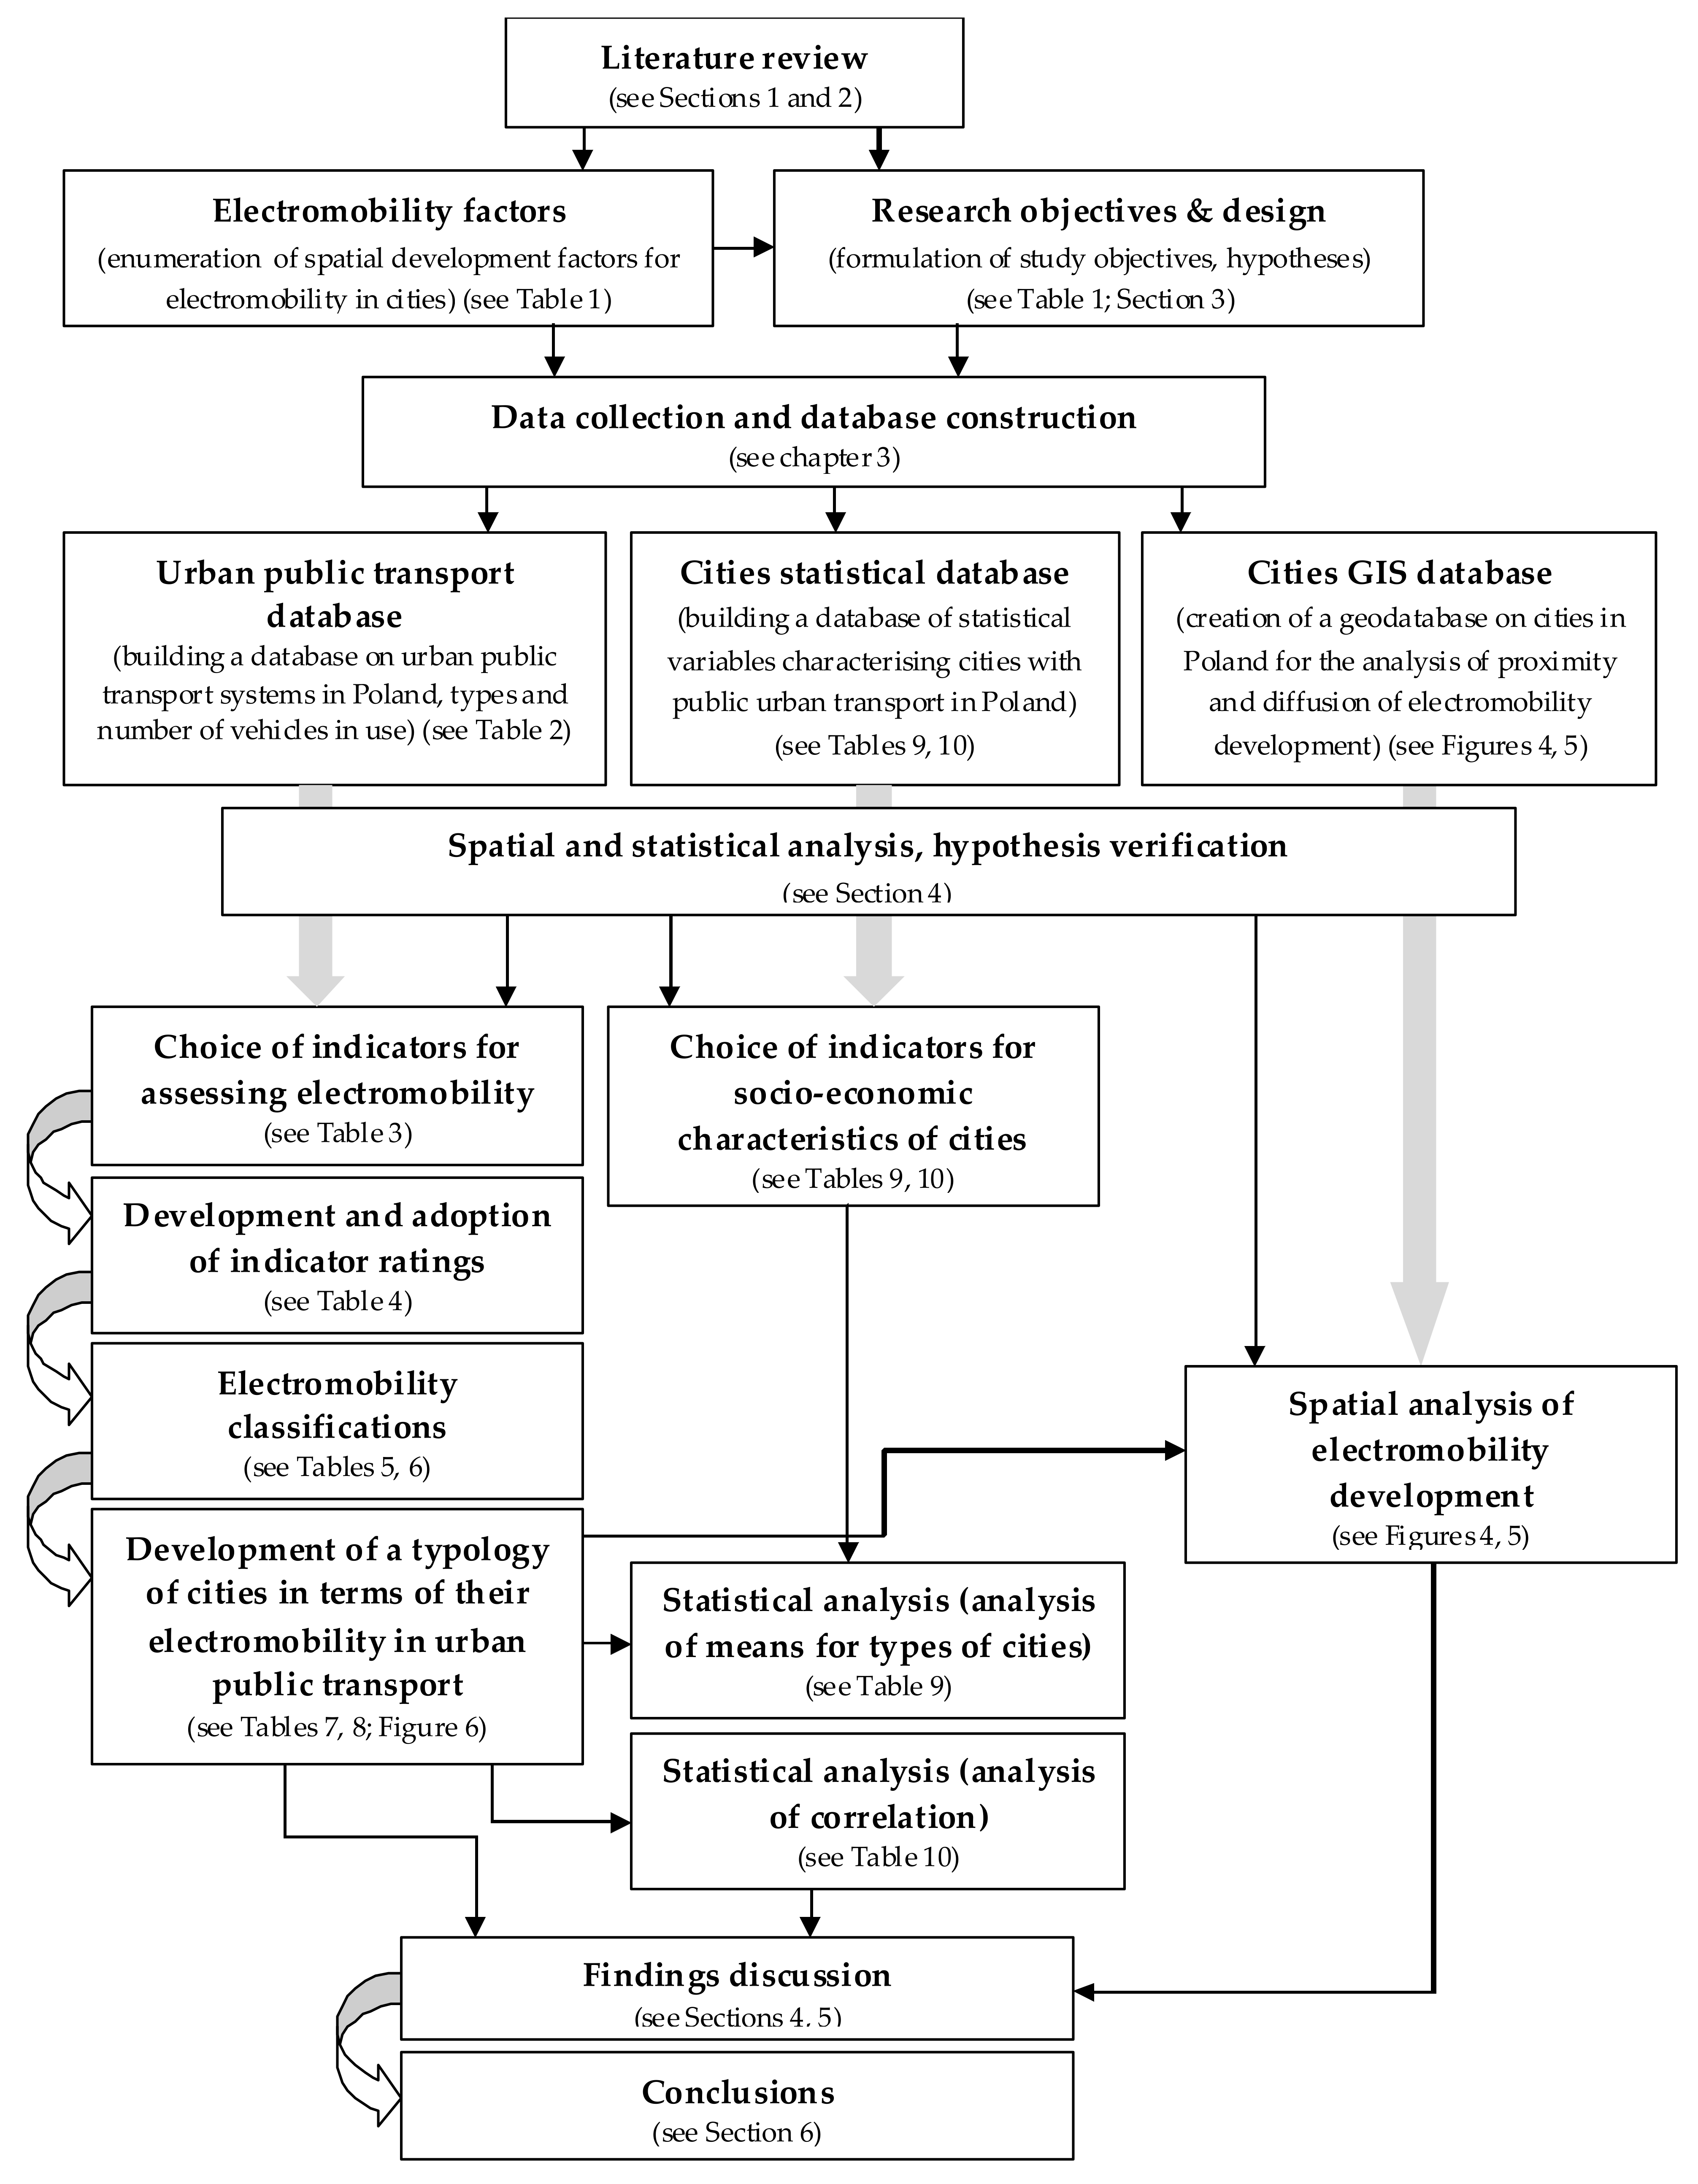
3.3. Research Procedure
3.4. Scoring and Synthetic Measures
3.5. Electromobility Classifications
4. Results
4.1. Distribution and Growth of Low-Emission Fleet
4.2. Classification of Cities in Terms of 2nd Generation Electromobility
4.3. Typology of Cities in Terms of Electromobility and Low-Emission Vehicles
4.4. Statistical Analysis
5. Discussion and Conclusions
Author Contributions
Funding
Informed Consent Statement
Data Availability Statement
Conflicts of Interest
References
- Thaller, A.; Posch, A.; Dugan, A.; Steiniger, K. How to design policy packages for sustainable transport: Balancing disruptiveness and implementability. Transp. Res. Part D 2021, 91, 102714. [Google Scholar] [CrossRef]
- Charabi, Y.; Al Nasiri, N.; Al Awadhi, T.; Choudri, B.S.; Al Bimani, A. GHG emissions from the transport sector in Oman: Trends and potential decarbonization pathways. Energy Strategy Rev. 2020, 32, 100548. [Google Scholar] [CrossRef]
- Danish, K.; Zhang, J.W.; Hassan, S.T.; Iqbal, K. Towards achieving environmental sustainability target in Organization for Economic Cooperation and Development countries: The role of real income, research and development, and transport infrastructure. Sustain. Dev. 2019, 28, 83–90. [Google Scholar] [CrossRef]
- Rattanachot, W.; Wang, Y.; Chong, D.; Suwansawas, S. Adaptation strategies of transport infrastructures to global climate change. Transp. Policy 2015, 41, 159–166. [Google Scholar] [CrossRef]
- Menezes, E.; Gori Maia, A.; Silva de Carvalho, C. Effectiveness of low-carbon development strategies: Evaluation of policy scenarios for the urban transport sector in a Brazilian megacity. Technol. Forecast. Soc. Chang. 2017, 114, 226–241. [Google Scholar] [CrossRef] [Green Version]
- Byrne, L.; Bach, V.; Finkbeiner, M. Urban transport assessment of emissions and resource demand of climate protection scenarios. Clean. Environ. Syst. 2021, 2, 100019. [Google Scholar] [CrossRef]
- Logan, K.G.; Nelson, J.D.; Hastings, A. Electric and hydrogen buses: Shifting from conventionally fuelled cars in the UK. Transp. Res. Part D 2020, 85, 102350. [Google Scholar] [CrossRef]
- Taczanowski, J.; Kołoś, A.; Gwosdz, K.; Domański, B.; Guzik, R. The development of low-emission public urban transport in Poland. Bull. Geogr. Socio-Econ. Ser. 2018, 41, 79–92. [Google Scholar] [CrossRef] [Green Version]
- Ustawa z dnia 11 stycznia 2018 r. o elektromobilności i paliwach alternatywnych. Dziennik Ustaw 2021 poz. 110.
- Połom, M. E-revolution in post-communist country? A critical review of electric public transport development in Poland. Energy Res. Soc. Sci. 2021, 80, 102227. [Google Scholar] [CrossRef]
- United Nations Climate Change. Available online: https://unfccc.int (accessed on 11 June 2021).
- Salawitch, R.J.; Canthy, T.P.; Hope, A.P.; Tribett, W.R.; Benett, B.F. Paris Climate Agreement: Beacon of Hope; Springer: Cham, Switzerland, 2017; ISBN 978-3-319-46939-3. [Google Scholar]
- Litman, T. Well Measured: Developing Indicators for Sustainable and Livable Transport Planning; Victoria Transport Policy Institute: Victoria, BC, Canada, 2021. [Google Scholar]
- Rao, S.-H. Transportation synthetic sustainability indices: A case of Taiwan intercity railway transport. Ecol. Indic. 2021, 127, 107753. [Google Scholar] [CrossRef]
- Illahi, U.; Mir, M.S. Assessment of transport sustainability using a hybrid approach: A comparison of four metropolitan cities of India. Case Stud. Transp. Policy 2021, 9, 703–714. [Google Scholar] [CrossRef]
- Tanguay, G.A.; Rajaonson, J.; Lefebvre, J.-F.; Lanoie, P. Measuring the sustainability of cities: An analysis of the use of local indicators. Ecol. Indic. 2010, 10, 407–418. [Google Scholar] [CrossRef]
- Połom, M.; Wiśniewski, P. Implementing Electromobility in Public Transport in Poland in 1990–2020. A Review of Experiences and Evaluation of the Current Development Directions. Sustainability 2021, 13, 4009. [Google Scholar] [CrossRef]
- Wimbadi, R.W.; Djalante, R.; Mori, A. Urban experiments with public transport for low carbon mobility transitions in cities: A systematic literature review (1990–2020). Sustain. Cities Soc. 2021, 72, 103023. [Google Scholar] [CrossRef]
- Figenbaum, E.; Assum, T.; Kolbenstvedt, M. Electromobility in Norway: Experiences and Opportunities. Res. Transp. Econ. 2015, 50, 29–38. [Google Scholar] [CrossRef]
- Holden, E.; Banister, D.; Gössling, S.; Gilpin, G.; Linneruda, K. Grand Narratives for sustainable mobility: A conceptual review. Energy Res. Soc. Sci. 2020, 65, 101454. [Google Scholar] [CrossRef]
- Gandoman, F.H.; Ahmadi, A.; Van den Bossche, P.; Van Mierlo, J.; Omar, N.; Nezhad, A.E.; Mavalizadeh, H.; Mayet, C. Status and future perspectives of reliability assessment for electric vehicles. Reliab. Eng. Syst. Saf. 2019, 183, 1–16. [Google Scholar] [CrossRef]
- Gandoman, F.H.; Ahmed, E.M.; Ali, Z.M.; Berecibar, M.; Zobaa, A.F.; Abdel Aleem, S.H.E. Reliability Evaluation of Lithium-Ion Batteries for E-Mobility Applications from Practical and Technical Perspectives: A Case Study. Sustainability 2021, 13, 11688. [Google Scholar] [CrossRef]
- Barbosa, J.C.; Gonçalves, R.; Costa, C.M.; Lanceros-Mendez, S. Recent Advances on Materials for Lithium-Ion Batteries. Energies 2021, 14, 3145. [Google Scholar] [CrossRef]
- Diouf, B.; Pode, R. Potential of lithium-ion batteries in renewable energy. Renew. Energy 2015, 76, 375–380. [Google Scholar] [CrossRef]
- Geisbauer, C.; Wöhrl, K.; Koch, D.; Wilhelm, G.; Schneider, G.; Schweiger, H.-G. Comparative Study on the Calendar Aging Behavior of Six Different Lithium-Ion Cell Chemistries in Terms of Parameter Variation. Energies 2021, 14, 3358. [Google Scholar] [CrossRef]
- Peters, J.F.; Baumann, M.; Zimmermann, B.; Braun, J.; Weil, M. The environmental impact of Li-Ion batteries and the role of key parameters—A review. Renew. Sustain. Energy Rev. 2017, 67, 491–506. [Google Scholar] [CrossRef]
- Sobianowska-Turek, A.; Urbańska, W.; Janicka, A.; Zawiślak, M.; Matla, J. The Necessity of Recycling of Waste Li-Ion Batteries Used in Electric Vehicles as Objects Posing a Threat to Human Health and the Environment. Recycling 2021, 6, 35. [Google Scholar] [CrossRef]
- Kersten, A.; Rodionov, A.; Kuder, M.; Hammarström, T.; Lesnicar, A.; Thiringer, T. Review of Technical Design and Safety Requirements for Vehicle Chargers and Their Infrastructure According to National Swedish and Harmonized European Standards. Energies 2021, 14, 3301. [Google Scholar] [CrossRef]
- Schmidt, M.; Żmuda-Trzebiatowski, P.; Kiciński, M.; Sawicki, P.; Lasak, K. Multiple-Criteria-Based Electric Vehicle Charging Infrastructure Design Problem. Energies 2021, 14, 3214. [Google Scholar] [CrossRef]
- Varga, B.O.; Sagoian, A.; Mariasiu, F. Prediction of Electric Vehicle Range: A Comprehensive Review of Current Issues and Challenges. Energies 2019, 12, 946. [Google Scholar] [CrossRef] [Green Version]
- Bi, J.; Wanga, Y.; Shaoa, S.; Cheng, Y. Residual range estimation for battery electric vehicle based on radial basis T function neural network. Measurement 2018, 128, 197–203. [Google Scholar] [CrossRef]
- Kambly, K.; Bradley, T.H. Geographical and temporal differences in electric vehicle range due to cabin conditioning energy consumption. J. Power Sources 2015, 275, 468–475. [Google Scholar] [CrossRef]
- Lazzeroni, P.; Caroleo, B.; Arnone, M.; Botta, C. A Simplified Approach to Estimate EV Charging Demand in Urban Area: An Italian Case Study. Energies 2021, 14, 6697. [Google Scholar] [CrossRef]
- Badea, G.; Felseghi, R.A.; Varlam, M.; Filote, C.; Culcer, M.; Iliescu, M.; Răboacă, M.S. Design and Simulation of Romanian Solar Energy. Energies 2019, 12, 74. [Google Scholar] [CrossRef] [Green Version]
- Liu, J.; Santos, G. Plug-In Hybrid Electric Vehicles’ Potential for Urban Transport in China: The Role of Energy Sources and Utility Factors. Int. J. Sustain. Transp. 2015, 9, 145–157. [Google Scholar] [CrossRef]
- Pielecha, J.; Skobiej, K.; Kurtyka, K. Exhaust Emissions and Energy Consumption Analysis of Conventional, Hybrid, and Electric Vehicles in Real Driving Cycles. Energies 2020, 13, 6423. [Google Scholar] [CrossRef]
- Muñoz-Villamizar, A.; Montoya-Torres, J.R.; Faulin, J. Impact of the use of electric vehicles in collaborative urban transport networks: A case study. Transp. Res. Part D 2017, 50, 40–54. [Google Scholar] [CrossRef]
- Tsakalidis, A.; Krause, J.; Julea, A.; Peduzzi, E.; Pisoni, E.; Thiel, C. Electric light commercial vehicles: Are they the sleeping giant of electromobility? Transp. Res. Part D 2020, 86, 102421. [Google Scholar] [CrossRef]
- Wróblewski, P.; Lewicki, W. A Method of Analyzing the Residual Values of Low-Emission Vehicles Based on a Selected Expert Method Taking into Account Stochastic Operational Parameters. Energies 2021, 14, 6859. [Google Scholar] [CrossRef]
- Lozanovski, A.; Whitehouse, N.; Ko, N.; Whitehouse, S. Sustainability Assessment of Fuel Cell Buses in Public Transport. Sustainability 2018, 10, 1480. [Google Scholar] [CrossRef] [Green Version]
- Drábik, P.; Krnáčová, P. Socio-economic barriers and development opportunities of electromobility as key technological innovation of transportation. Int. J. Multidiscip. Bus. Sci. 2018, 4, 91–98. [Google Scholar]
- Pietrzak, O.; Pietrzak, K. The Economic Effects of Electromobility in Sustainable Urban Public Transport. Energies 2021, 14, 878. [Google Scholar] [CrossRef]
- Wangsness, P.B.; Proost, S.; Rødseth, K.L. Optimal policies for electromobility: Joint assessment of transport and electricity distribution costs in Norway. Util. Policy 2021, 72, 101247. [Google Scholar] [CrossRef]
- Leal Filho, W.; Abubakar, I.R.; Kotter, R.; Grindsted, T.S.; Balogun, A.-L.; Salvia, A.L.; Aina, Y.A.; Wolf, F. Framing Electric Mobility for Urban Sustainability in a Circular Economy Context: An Overview of the Literature. Sustainability 2021, 13, 7786. [Google Scholar] [CrossRef]
- Wurster, W.; Heß, P.; Nauruschat, M.; Jütting, M. Sustainable Circular Mobility: User-Integrated Innovation and Specifics of Electric Vehicle Owners. Sustainability 2020, 12, 7900. [Google Scholar] [CrossRef]
- Motowidlak, U. An Assessment of the Effectiveness of Actions to Implement the Principles of Circular Economy in the Electromobility Ecosystem. Ann. Univ. Mariae Curie-Skłodowska Sect. H Oeconomia 2020, 54, 67–77. [Google Scholar] [CrossRef]
- Givoni, M. Alternative pathways to low carbon mobility. In Moving towards Low Carbon Mobility; Givoni, M., Banister, D., Eds.; Edward Elgar Publishing: Cheltenham, UK, 2013; pp. 209–230. ISBN 978-1-78100-722-8. [Google Scholar]
- Tapio, P. Towards a theory of decoupling: Degrees of decoupling in the EU and the case of road traffic in Finland between 1970 and 2001. Transp. Policy 2005, 12, 137–151. [Google Scholar] [CrossRef] [Green Version]
- Kveiborg, O.; Fosgerau, M. Decomposing the decoupling of Danish road freight traffic growth and economic growth. Transp. Policy 2007, 14, 39–48. [Google Scholar] [CrossRef]
- Wang, Q.; Zhao, M.; Li, R.; Su, M. Decomposition and decoupling analysis of carbon emissions from economic growth: A comparative study of China and the United States of America. J. Clean. Prod. 2018, 197, 178–184. [Google Scholar] [CrossRef]
- Wójcik-Jurkiewicz, M.; Czarnecka, M.; Kinelski, G.; Sadowska, B.; Bilińska-Reformat, K. Determinants of Decarbonisation in the Transformation of the Energy Sector: The Case of Poland. Energies 2021, 14, 1217. [Google Scholar] [CrossRef]
- Pietrzak, K.; Pietrzak, O. Environmental Effects of Electromobility in a Sustainable Urban Public Transport. Sustainability 2020, 12, 1052. [Google Scholar] [CrossRef] [Green Version]
- Zamasz, K.; Stęchły, J.; Komorowska, A.; Kaszyński, P. The Impact of Fleet Electrification on Carbon Emissions: A Case Studyfrom Poland. Energies 2021, 14, 6595. [Google Scholar] [CrossRef]
- Hansen, T.; Coenen, L. The geography of sustainability transitions: Review, synthesis and reflections on an emergent research field. Environ. Innov. Soc. Transit. 2015, 17, 92–109. [Google Scholar] [CrossRef] [Green Version]
- Zhang, R.; Zhang, J.; Long, Y.; Wu, W.; Liu, J.; Jiang, Y. Long-term implications of electric vehicle penetration in urban decarbonization scenarios: An integrated land use–transport–energy model. Sustain. Cities Soc. 2021, 68, 102800. [Google Scholar] [CrossRef]
- Domański, B.; Guzik, R.; Gwosdz, K.; Kołoś, A.; Taczanowski, J. European semi-periphery under environmental pressure: The case of urban public bus transportation and private bus-makers in Poland. Int. J. Autom. Technol. Manag. 2016, 16, 301–318. [Google Scholar] [CrossRef]
- Pelletier, S.; Jabali, O.; Mendoza, J.E.; Laporte, G. The electric bus fleet transition problem. Transp. Res. Part C Emerg. Technol. 2019, 109, 174–193. [Google Scholar] [CrossRef]
- Geels, F.W. From sectoral systems of innovation to socio-technical systems: Insights about dynamics and change from sociology and institutional theory. Res. Policy 2004, 33, 897–920. [Google Scholar] [CrossRef]
- Wirth, S.; Markard, J.; Truffer, B.; Rohracher, H. Informal institutions matter: Professional culture and the development of giogas technology. Environ. Innov. Soc. Transit. 2013, 8, 20–41. [Google Scholar] [CrossRef]
- Maté-Sánchez-Val, M.; Harris, R. The paradox of geographical proximity for innovators: A regional study of the Spanish agri-food sector. Land Use Policy 2018, 73, 458–467. [Google Scholar] [CrossRef] [Green Version]
- Boyne, G.A. Competition and Local Government: A Public Choice Perspective. Urban Studi. 1996, 33, 703–721. [Google Scholar] [CrossRef]
- Rallet, A.; Torre, A. Which need for geographical proximity in innovation networks at the era of global economy? In Proceedings of the ERSA Conference Papers, 39th Congress of the European Regional Science Association: “Regional Cohesion and Competitiveness in 21st Century Europe”, Dublin, Ireland, 23–27 August 1999. [Google Scholar]
- Desrochers, P. Geographical Proximity and the Transmission of Tacit Knowledge. Rev. Austrian Econ. 2001, 14, 25–46. [Google Scholar] [CrossRef]
- Boschma, R. Proximity and Innovation: A Critical Assessment. Reg. Stud. 2005, 39, 61–74. [Google Scholar] [CrossRef]
- Brown, L.A. Diffusion. In International Encyclopedia of Human Geography; Kitchin, R., Thrift, N., Eds.; Elsevier: Amsterdam, The Netherlands, 2009; pp. 170–184. ISBN 978-008-044-9104. [Google Scholar]
- Sorenson, O.; Rivkin, J.W.; Flemng, L. Complexity, networks and knowledge flow. Res. Policy 2006, 35, 994–1017. [Google Scholar] [CrossRef]
- Crescenzi, R.; Rodriguez-Pose, A. Infrastructure and regional growth in the European Union. Pap. Reg. Sci. 2012, 91, 487–513. [Google Scholar] [CrossRef]
- Crescenzi, R.; Di Cataldo, M.; Rodriguez-Pose, A. Government quality and the economic returns of transport infrastructure investment in European regions. J. Reg. Sci. 2016, 56, 555–582. [Google Scholar] [CrossRef] [Green Version]
- Pike, A.; Rodriguez-Pose, A.; Tomaney, T. Shifting horizons in local and regional development. Reg. Stud. 2017, 51, 46–57. [Google Scholar] [CrossRef] [Green Version]
- Storper, M. Keys to the City: How Economics, Institutions, Social Interaction and Politics Shape Development; Princeton University Press: Princeton, NJ, USA, 2013; p. 288. ISBN 978-069-114-3118. [Google Scholar]
- Gis, M.; Pielecha, J.; Gis, W. Exhaust emissions of buses LNG and Diesel in RDE tests. Open Eng. 2021, 11, 356–364. [Google Scholar] [CrossRef]
- Ally, J.; Pryor, J. Life-cycle assessment of diesel, natural gas and hydrogen fuel cell bus transportation systems. J. Power Sources 2007, 170, 401–411. [Google Scholar] [CrossRef] [Green Version]
- Mercik, A. Elektromobilność w autobusowym transporcie publicznym organizowanym przez Górnośląsko-Zagłębiowską Metropolię jako narzędzie realizacji idei zrównoważonej mobilności [Electromobility in bus public transport organised by the GZM Metropolis as a tool of sustainable mobility implementation]. Prace Komisji Geografii Komunikacji PTG 2020, 23, 18–33. [Google Scholar] [CrossRef]
- Połom, M. Koncepcja wzrostu znaczenia elektromobilności w transporcie zbiorowym Trójmiasta [The comcept of the growing importance of electromobility in the Tri-City public transport]. Zeszyty Naukowe Uniwersytetu Szczecińskiego. Probl. Transp. Logistyki 2014, 842, 181–193. [Google Scholar]
- Połom, M. European Union Funds as a Growth Stimulant of Electromobility on the Example of Electric Public Transport in Poland. Barom. Reg. 2015, 13, 89–96. [Google Scholar]
- Dybalski, J. Prezes MPK Wrocław: Zamiast Elektryków z NCBR Mogą być Gazowce. Available online: https://www.transport-publiczny.pl/wiadomosci/prezes-mpk-wroclaw-zamiast-elektrykow-z-ncbr-moga-byc-gazowce-61861.html (accessed on 6 June 2021).
- Rogala, B. 5 Wykresów Pokazujących, na Jakim Etapie Jest Elektryfikacja Transportu w Polskich Miastach. Available online: https://300gospodarka.pl/300klimat/5-wykresow-pokazujacych-jak-przebiega-proces-elektryfikacji-transportu-w-polskich-miastach (accessed on 9 June 2021).
- Duesenberry, J.S. Income, Saving and the Theory of Consumer Behavior; Harvard University Press: Cambridge, CA, USA, 1949. [Google Scholar]
- Haggett, P. Geography: A Modern Synthesis; Harper & Rwoe: London, UK, 1984; p. 670. ISBN 978-006-350-3298. [Google Scholar]
- Lengyel, B.; Bokányi, E.; Di Clemente, R.; Kertész, J.; González, M.C. The role of geography in the complex diffusion of innovations. Sci. Rep. 2020, 10, 15065. [Google Scholar] [CrossRef]
- Low, N.; Gleeson, B.; Rush, E. A multivalent conception of path dependence: The case of transport planning in metropolitan Melbourne, Australia. Environ. Sci. 2005, 2, 391–408. [Google Scholar] [CrossRef] [Green Version]
- Considine, M.; Lewis, J.M. Innovation and Innovators Inside Government: From Institutions to Networks. Governance 2007, 20, 581–607. [Google Scholar] [CrossRef]
- Kołoś, A. Rozwój Przestrzenny a Współczesne Funkcjonowanie Miejskiego Transportu Szynowego w Polsce [Relations between Spatial Evolution and Actual Functioning of Urban Rail Transport in Poland]; Instytut Geografii i Gospodarki Przestrzennej UJ: Kraków, Poland, 2006; ISBN 978-83-88424-21-2. [Google Scholar]
- Vance, J.E., Jr. Capturing the Horizon: The Historical Geography of Transportation since the Transportation Revolution of the Sixteenth Century; The Johns Hopkins University Press: Baltimore, MD, USA; London, UK, 1990; ISBN 978-0060468057. [Google Scholar]
- Hoyle, B.S.; Knowles, R. Modern Transport Geography; Willey: Hoboken, NJ, USA, 1999; ISBN 978-0-471-97777-3. [Google Scholar]
- Bartłomiejczyk, M.; Połom, M. Possibilities for Developing Electromobility by Using Autonomously Powered Trolleybuses Based on the Example of Gdynia. Energies 2021, 14, 2971. [Google Scholar] [CrossRef]


| Main Objective | Supporting Objectives/Examined Factors | Hypotheses |
|---|---|---|
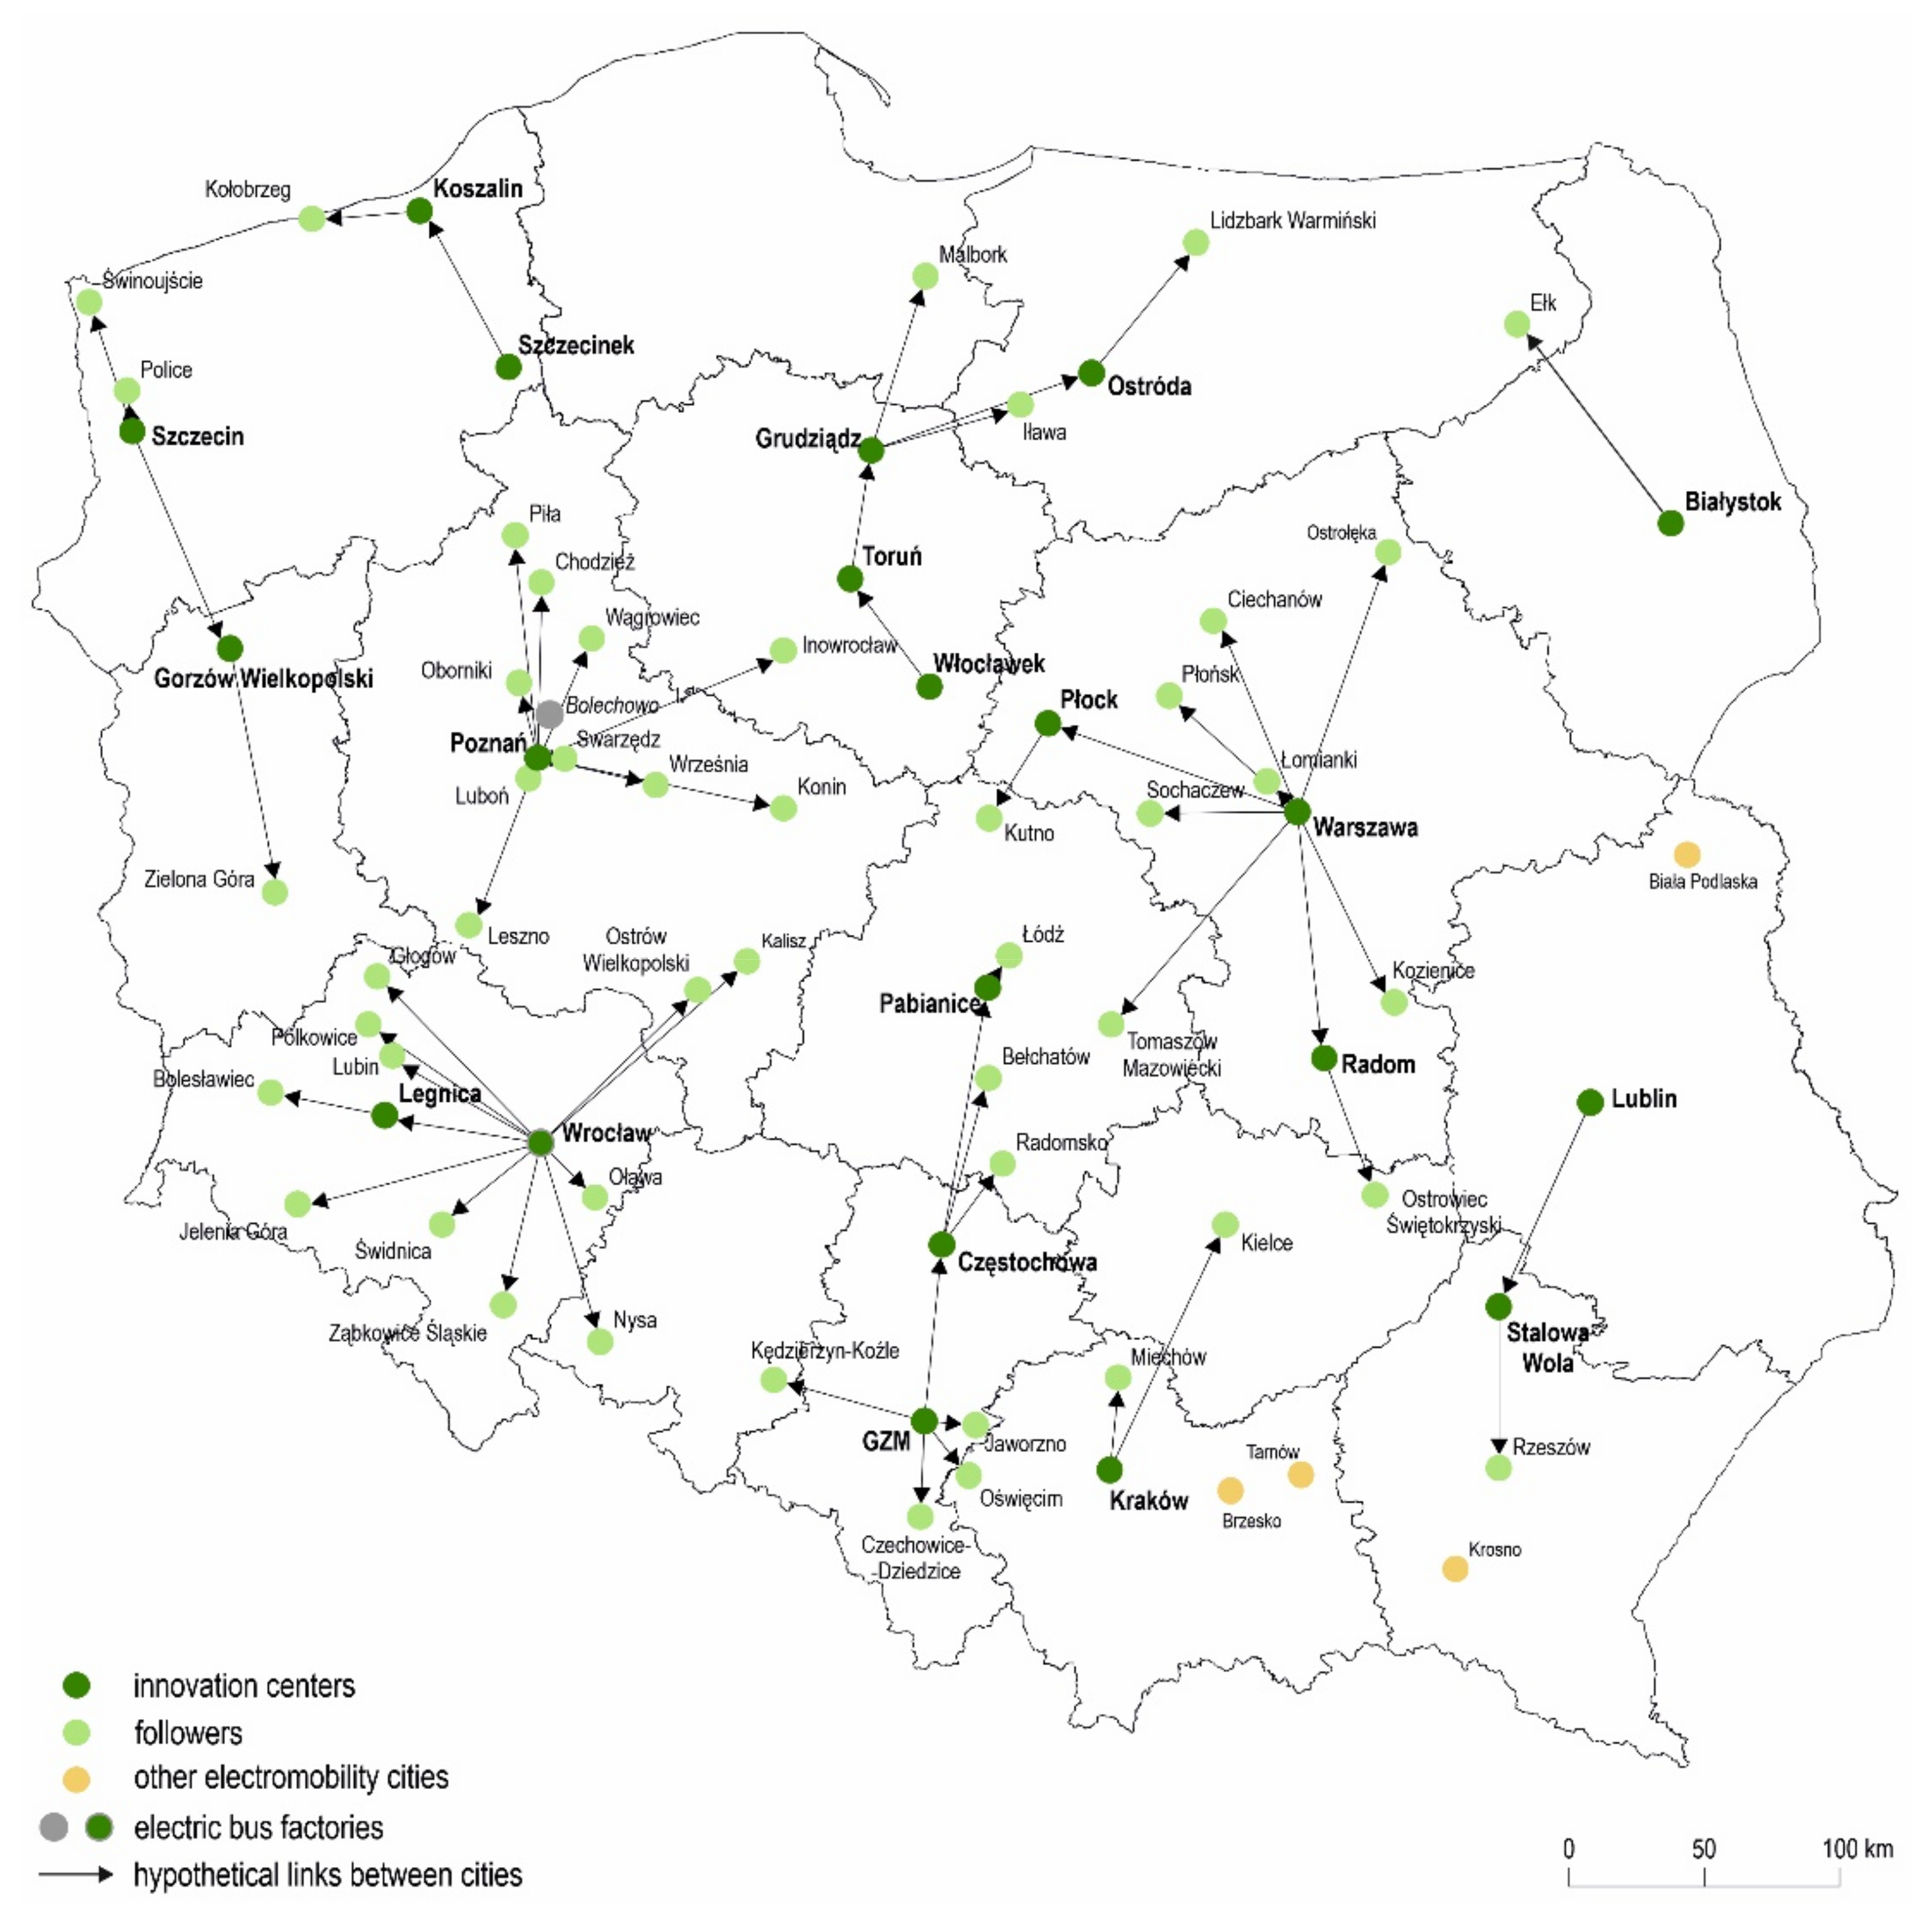
| To determine the pattern of the spatial development of the second generation electromobility in urban public transport in Poland and to examine the underlying factors | Proximity to plants of electric buses manufacturers; Proximity and linkages (geographical and institutional) to other cities with electromobility experiences. (diffusion of innovation); History and the development paths of urban public transport in long time-perspective | Hypothesis (1) |
| Type and size of the city; Rank of the city in the urban hierarchy | Hypothesis (2) | |
| Economic prosperity of the city; Level of human and social capital; Institutional * context including regional and national programmes, funds and incentives | Hypothesis (3) |
| Categories | Total | Metropolitan Railway and Metro | Tram Networks | Trolleybus Networks | Bus Networks—Diesel | Electric Buses | Hybrid Buses | GAS Buses | ||
|---|---|---|---|---|---|---|---|---|---|---|
| in Use | Planned | in Use | Planned | |||||||
| Cities and towns | 242 | 1 | 15 | 3 | 235 | 32 | 56 | 40 | 6 | 28 |
| Vehicles | 16,690 | 610 | 3099 | 246 | 11,106 | 415 | 836 | 497 | 35 | 717 |
| Code | Indicator | Unit | Max Value * | Min Value * |
|---|---|---|---|---|
| EIIC (current second-generation electromobility) | ||||
| C1 | Number of electric and hybrid buses | Piece | 230 (1) | 0 (179) |
| C2 | Share of electric and hybrid buses in the total number of buses | % | 100% (5) | 0 (177) |
| C3 | Number of electric and hybrid buses per 10,000 inhabitants | Piece/10,000 inh. | 4.83 (1) | 0 (179) |
| EIIF (future second-generation electromobility) | ||||
| F1 | Number of planned electric and hybrid buses | Piece | 121 (1) | 0 (182) |
| F2 | Share of electric and hybrid buses in the total number of buses | % | 120% (1) | 0 (182) |
| F3 | Number of planned electric and hybrid buses per 10,000 inhabitants | Piece/10,000 inh. | 4.84 (1) | 0 (182) |
| E (first and second-generation electromobility) | ||||
| E1 | Number of electric vehicles (including rail, metro, trams and trolleybuses) | Piece | 1496 (1) | 0 (198) |
| E2 | Share of electric vehicles (including rail, metro, trams and trolleybuses) in the total number of vehicles | % | 100% (3) | 0 (196) |
| E3 | Number of electric vehicles (including rail, metro, trams and trolleybuses) per 10,000 inhabitants | Piece/10,000 inh. | 8.35 (1) | 0 (198) |
| LE (“0” and low emission vehicles) | ||||
| L1 | Number of all electric, hybrid and gas vehicles | Piece | 1794 (1) | 0 (155) |
| L2 | Share of all electric, hybrid and gas vehicles in the fleet | % | 100% (5) | 0 (153) |
| L3 | Number of all electric, hybrid and gas vehicles per 10,000 inhabitants | Piece/10,000 inh. | 10.02 (1) | 0 (155) |
| Applies to Indicators: | C1, F1, E1, L1 | C2, F2, E2, L2 | C3, F3, E3, L3 |
|---|---|---|---|
| Points | Pieces | % | Pieces/10,000 inh. |
| 0 | 0 | 0 | 0 |
| 1 | 1–2 | 0–10.0 | 0–0.1 max |
| 2 | 3–4 | 10.1–20.0 | 0.1 max–0.2 max |
| 3 | 5–7 | 20.1–30.0 | 0.2 max–0.3 max |
| 4 | 8–10 | 30.1–40.0 | 0.3 max–0.4 max |
| 5 | 11–20 | 40.1–50.0 | 0.4 max–0.5 max |
| 6 | 21–30 | 50.1–60.0 | 0.5 max–0.6 max |
| 7 | 31–40 | 60.1–70.0 | 0.6 max–0.7 max |
| 8 | 41–50 | 70.1–80.0 | 0.7 max–0.8 max |
| 9 | 50–100 | 80.1–90.0 | 0.8 max–0.9 max |
| 10 | >100 | 90.1–100.0 | 0.9 max–max |
| Code | Name | Values | Total Number of Cities |
|---|---|---|---|
| A | Innovative-expanding | all scores for indicators >0; at least 1 indicator (EIIC or EIIF or EII) > average and rank above average | 19 |
| Aa | Innovative fleeing chased | all scores for indicators >0 but < average or at least 2 indicators >0 including 1 > average and if EIIC > average and EIIF = 0 | 18 |
| Ab | Innovative running late | all scores for indicators >0 but < average or at least 2 indicators >0 including 1 > average and if EIIC = 0 a EIIF > average | 14 |
| B | Intermediately innovative | all scores for indicators >0 but < average or at least 2 indicators >0 including 1 > average | 10 |
| C | Weakly innovative | at least 2 scores for indicators >0 or 1 indicator > average | 33 |
| D | Not innovative | indicators = 0 | 148 |
| Code | Name | Values | Total Number of Cities |
|---|---|---|---|
| 1 | Electromobile and low-emission | indicator E > average; indicator LE > average | 21 |
| NN * | Strongly electromobile | indicator E > average; indicator LE < average | no |
| 2 | Strongly low-emission | indicator E < average or = 0; indicator LE >average | 16 |
| 3 | Electromobile and weakly low-emission | indicator E < average; indicator LE < average | 18 |
| NN * | Weakly electromobile | indicator E > 0; indicator LE = 0 | no |
| 4 | Weakly low-emission | indicator LE > 0; indicator E = 0 | 32 |
| 5 | Not electromobile and not low-emission | indicators = 0 | 155 |
| Class Code: | A | Aa | Ab | B | C | D | ||
|---|---|---|---|---|---|---|---|---|
| Class Name | Innovative-Expanding | Innovative Fleeing Chased | Innovative Running Late | Intermediately Innovative | Weakly Innovative | Not Innovative | ||
| Total number of cities and towns | 19 | 18 | 14 | 10 | 33 | 148 | ||
| Average number of inhabitants | 304,296 | 159,605 | 81,056 | 68,532 | 106,452 | 31,248 | ||
| Classification indicators | EIIC | Average share of electric and hybrid buses in the total number of buses | 21% | 45% | 0% | 9% | 5% | 0% |
| Average number of electric and hybrid buses per 10,000 inh. | 1.4 | 2.2 | 0.0 | 0.6 | 0.3 | 0.0 | ||
| EIIF | Average share of planned buses in the total number of buses | 21% | 0% | 51% | 10% | 8% | 0% | |
| Average number of planned electric and hybrid buses per 10,000 inh. | 1.3 | 0.0 | 2.0 | 0.7 | 0.4 | 0 | ||
| E | Average number of electric vehicles per 10,000 inh. | 2.4 | 0.8 | 0.3 | 0.3 | 0.6 | 0.0 | |
| LE | Average number of ecological vehicles per 10,000 inh. | 3.1 | 2.7 | 0.5 | 0.8 | 1.1 | 0.2 | |
| Examples | Kraków, Zielona Góra, Jaworzno | Warszawa, Inowrocław, Miechów | Gdynia, Lidzbark Warmiński, Chełm, | Białystok, Ełk, Chodzież | Wrocław, Tarnów, Szczytno | Bydgoszcz, Żory, Brzesko | ||
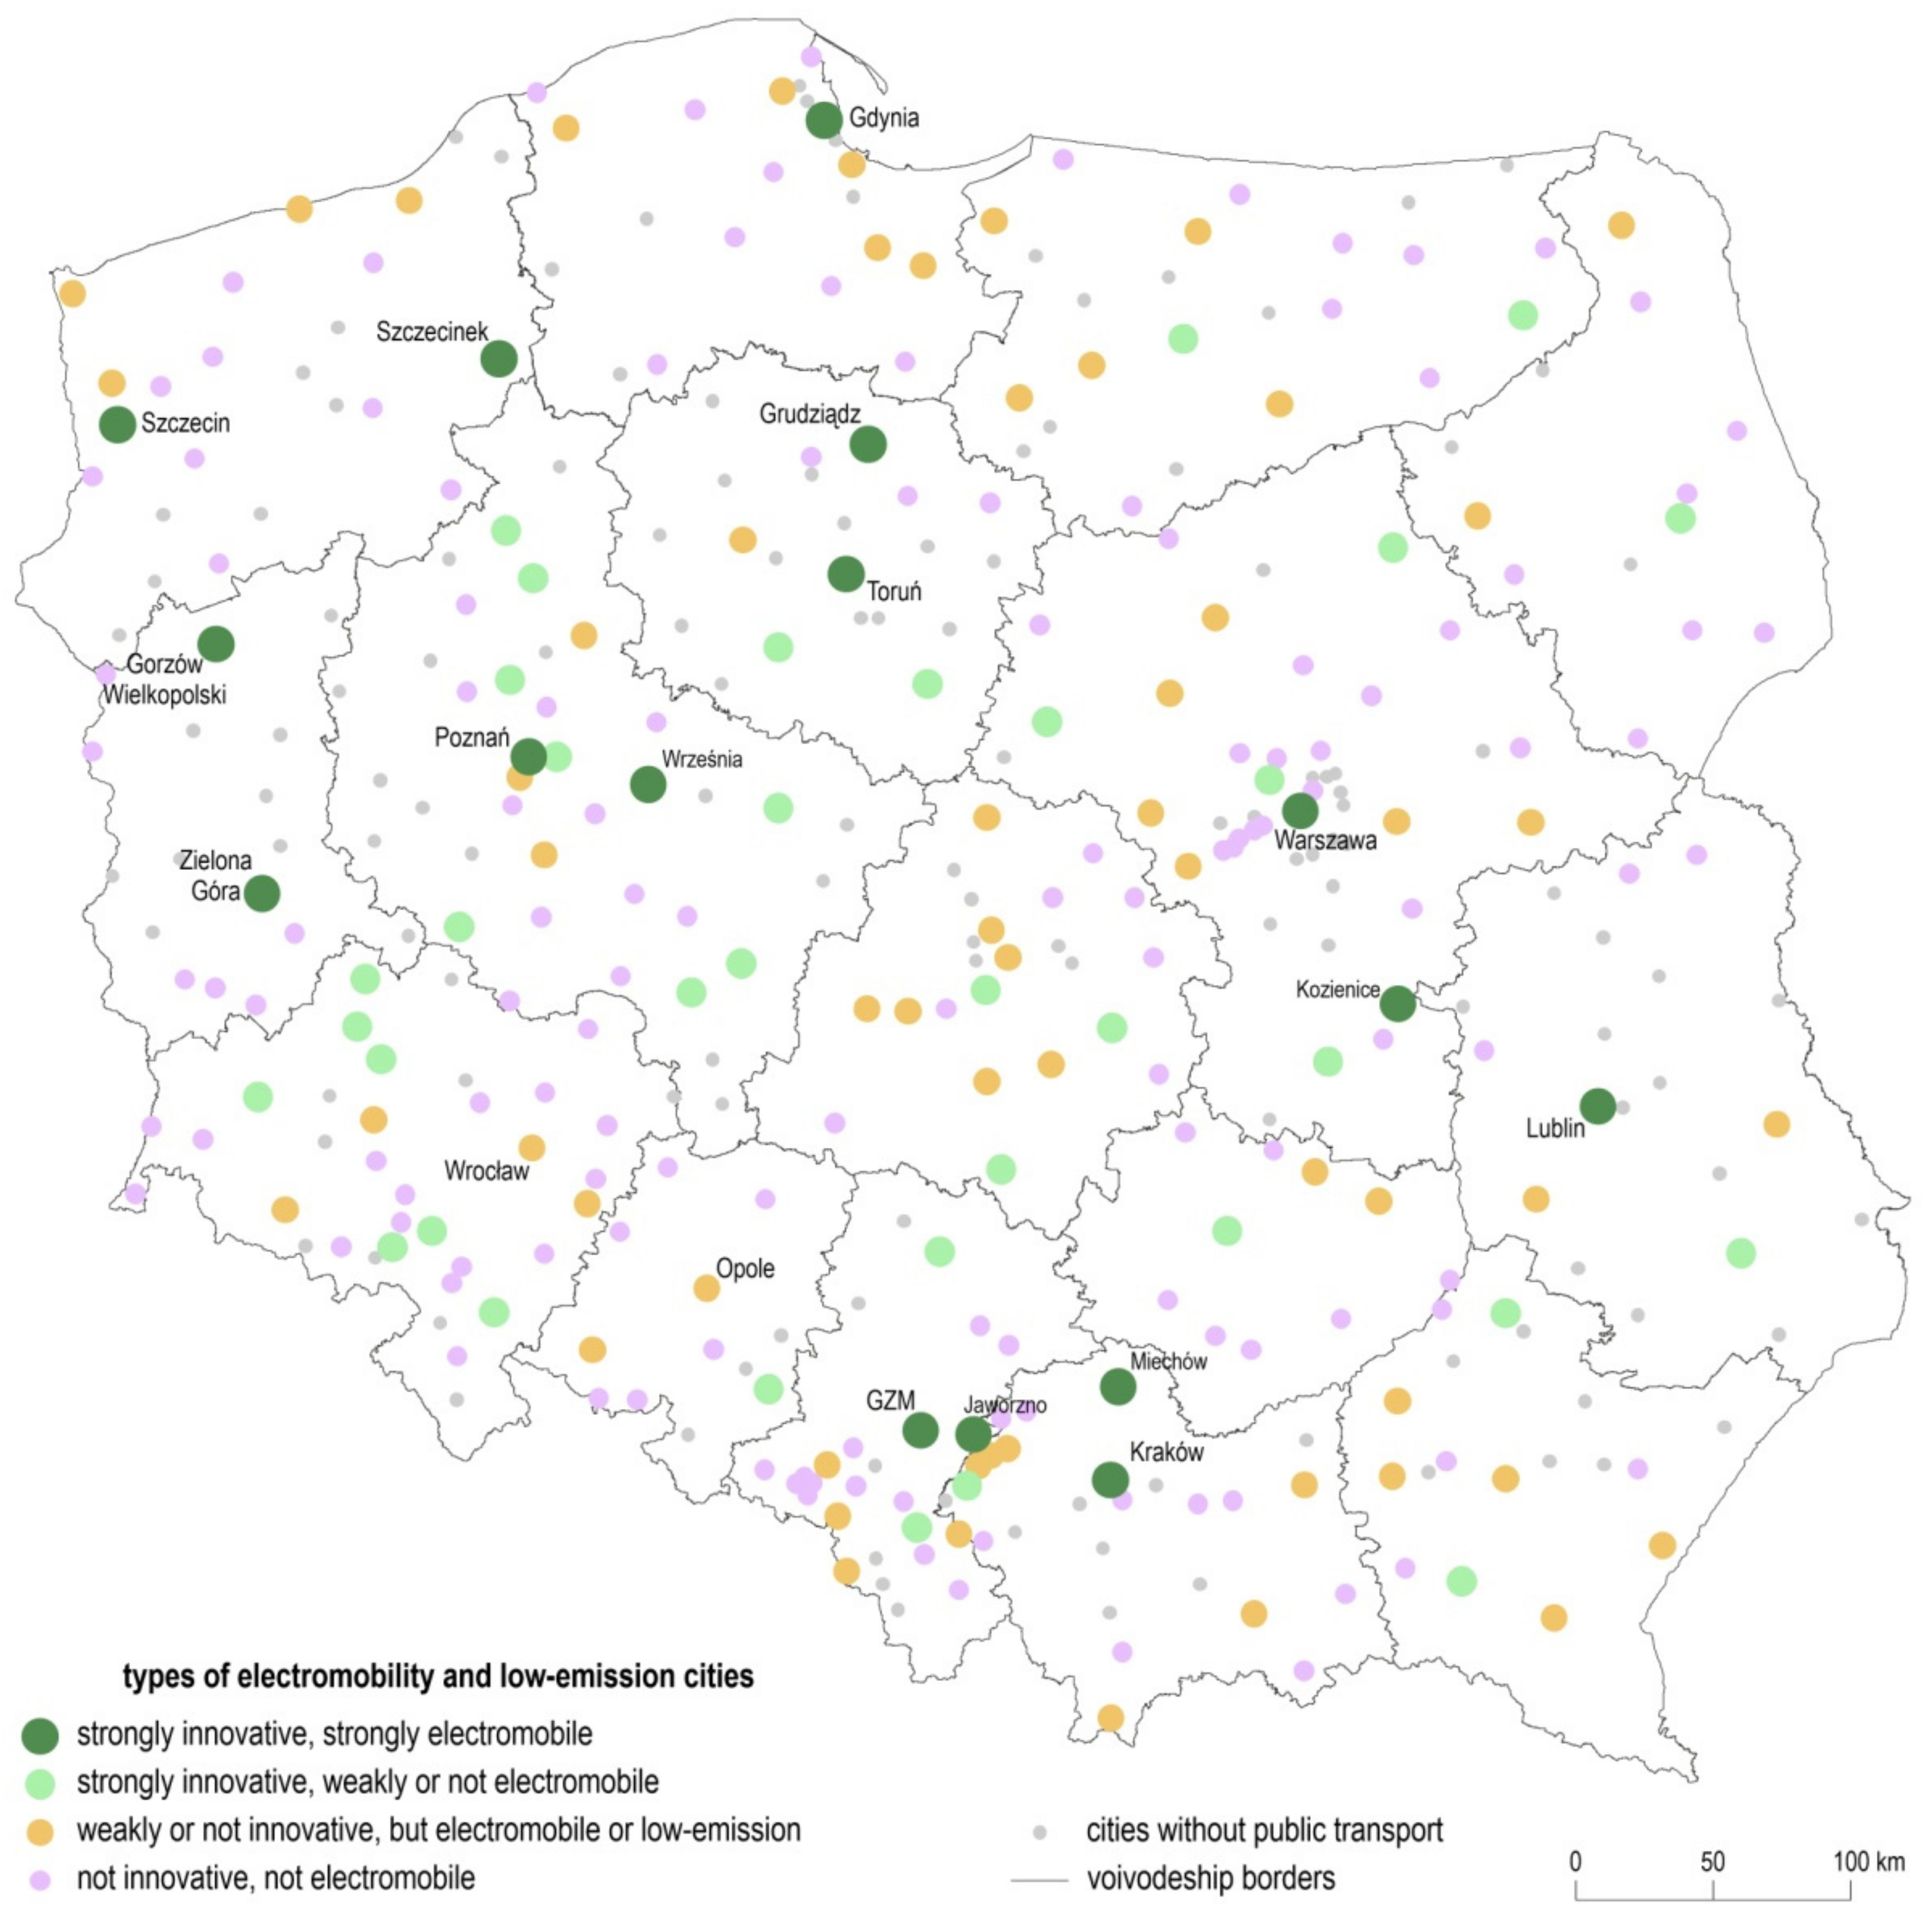
| Type Code | Strong S | Medium M | Weak W | No N | ||
|---|---|---|---|---|---|---|
| Type Name | Strongly Innovative, Strongly Electromobile | Strongly Innovative, Weakly or Not Electromobile | Weakly or Not Innovative, However, Electromobile or Low-Emission | Not Innovative, Not Electromobile | ||
| Classification codes * | A1, Aa1, Ab1, | A2, A3, A4, Aa2, Aa3, Aa4, Ab3, Ab4, B2, B3, B4, | Ab5, C1, C2, C3, C4, C5, D1, D2, D4 | D5 | ||
| Number of cities and towns | 16 | 35 | 58 | 133 | ||
| Average number of inhabitants | 443,348 | 81,126 | 89,571 | 26,197 | ||
| Classification Indicators | EII-c | Average share of electric and hybrid buses in the total number of buses | 32% | 23% | 3% | 0% |
| Average number of electric and hybrid buses per 10,000 inhabitants | 1.2 | 1.5 | 0.2 | 0.0 | ||
| EII-f | Average share of planned buses in the total number of buses | 13% | 11% | 15% | 0% | |
| Average number of planned electric and hybrid buses per 10,000 inh. | 0.9 | 0.7 | 0.6 | 0.0 | ||
| E | Average number of electric vehicles per 10,000 inh. | 3.4 | 0.4 | 0.4 | 0.0 | |
| LE | Average number of ecological vehicles per 10,000 inh. | 3.8 | 1.7 | 1.0 | 0.0 | |
| Examples of cities and towns | Warszawa, Gdynia, Jaworzno Miechów | Białystok, Inowrocław, Ełk, Chodzież, | Wrocław, Bydgoszcz, Tarnów, Szczytno, | Bielsko-Biała, Żory, Brzesko | ||
| Indicator | Unit | Year | Types of Localities According to Electromobility Adoption | |||||||
|---|---|---|---|---|---|---|---|---|---|---|
| Strong (S)—Strongly Innovative, Strongly Electromobile | Medium (M)—Strongly Innovative, Weakly or Not Electromobile | Weak (W)—Weakly or Not Innovative, However, Electromobile or Low-Emission | No (N)—Not Innovative, Not Electromobile | (X) Cities and Towns Not Organising Public Transport | Total | |||||
| number of localities | n | number | 2020 | 16 | 35 | 58 | 133 | 134 | 376 | |
| Size | area | X1 | square km | 2020 | 244.9 | 54.6 | 61.5 | 25.3 | 20.4 | 41.2 |
| number of inhabitants | X2 | thousands | 2020 | 432.1 | 81.1 | 89.6 | 26.2 | 16.6 | 54.9 | |
| population density | X3 | population per 1 km2 | 2020 | 1646 | 1629 | 1513 | 1269 | 1121 | 1304 | |
| Economic prosperity and entrepreneurship | average monthly gross wages and salaries | X4 | thousands of PLN | 2019 | 5.2 | 4.7 | 4.7 | 4.4 | 4.3 | 4.5 |
| own revenues of budget of cities per capita | X5 | thousands of PLN | Average for 2017–2020 | 10.6 | 9.1 | 8.2 | 7.1 | 6.8 | 7.5 | |
| average price per 1 m2 of residential premises | X6 | thousands of PLN | Average for 2017–2020 | 4.5 | 3.3 | 3.6 | 2.9 | 3.1 | 3.2 | |
| natural persons conducting economic activity per 100 population | X7 | number | 2019 | 10.1 | 8.5 | 8.7 | 8.5 | 8.6 | 8.7 | |
| value of grant contracts/decisions from EU funds per capita in thousands PLN | X8 | number | 2016–2020 | 24.3 | 18.5 | 19.0 | 17.3 | 18.4 | 18.4 | |
| dwelling stocks per 100 inhabitants | X9 | number | 2019 | 44.7 | 41.2 | 41.3 | 39.1 | 38.3 | 39.6 | |
| dwellings completed per 100 inhabitants | X10 | number | Average for 2017–2019 | 19.6 | 9.9 | 13.2 | 11.2 | 11.1 | 11.7 | |
| Human capital and innovativeness | Net internal and international migration for permanent residence per 1000 population | X11 | number | Average for 2017–2019 | 0.1 | −10.0 | −7.3 | −7.2 | −6.8 | −7.0 |
| Share of inhabitants aged 13 years and more with tertiary education | X12 | % | 2011 | 23.8 | 19.9 | 19.1 | 17.4 | 16.9 | 18.0 | |
| students in higher education institutions per 1000 inhabitants | X13 | number | 2019 | 64.4 | 20.0 | 24.7 | 2.8 | 1.7 | 10.0 | |
| patents granted by Patent Office of the Republic of Poland per 10,000 inhabitants | X14 | number | 2018–2019 | 25.9 | 12.6 | 10.4 | 5.1 | 5.2 | 7.5 | |
| Labour market and structure of local economy | number of entities in sections J, K, L, M, N and R in Poland PKD per 1000 inhabitants (information and communication services, business and financial services, real estate activities, research and science activities, arts activities) | X15 | number | 2019 | 30.1 | 21.5 | 21.4 | 19.1 | 18.6 | 19.9 |
| number of registered unemployed persons per 100 inhabitants | X16 | number | Average for 2017–2019 | 2.3 | 2.7 | 2.6 | 3.3 | 4.1 | 3.6 | |
| registered unemployment rate | X17 | % | Average for 2017–2019 | 4.9 | 6.2 | 6.5 | 7.5 | 8.4 | 7.5 | |
| employed persons per 100 inhabitants | X18 | number | 2019 | 34.7 | 35.0 | 30.5 | 29.4 | 29.6 | 30.4 | |
| employed persons in industry and construction per 100 inhabitants | X19 | number | 2019 | 9.2 | 11.8 | 9.9 | 8.4 | 7.8 | 8.7 | |
| employed persons in trade; repair of motor vehicles; transportation and storage; accommodation and catering; information and communications per 100 inhabitants | X20 | number | 2019 | 8.8 | 6.8 | 6.2 | 4.4 | 4.2 | 5.0 | |
| employed persons in financial and insurance activities; real estate activities per 100 inhabitants | X21 | number | 2019 | 1.7 | 0.8 | 0.8 | 0.5 | 0.4 | 0.6 | |
| Quality of living | medical doctors working per 1000 inhabitants | X22 | number | 2019 | 9.0 | 5.8 | 5.8 | 3.3 | 3.4 | 4.2 |
| share of children up to the age of 3 staying in nurseries | X23 | % | 2019 | 20.0 | 18.9 | 17.3 | 16.3 | 14.8 | 16.3 | |
| number of cultural events (concerts, exhibitions, performances, festivals) per 10,000 inhabitants | X24 | number | 2017–2019 | 10.7 | 12.4 | 7.9 | 6.0 | 4.9 | 6.7 | |
| Indicators of Urban Transport Greening | ||
|---|---|---|
| Indicators/Socio-Economic Characteristics | Number of Electric Buses per 10,000 Inhabitants (Y1) | Number of Environment Friendly Buses * per 10,000 Inhabitants (Y2) |
| Employed persons in financial and insurance activities; real estate activities per 100 inhabitants * (X20) | 0.746 | 0.709 |
| Number of population (city size) (X2) | 0.661 | 0.593 |
| Students in higher education institutions per 1000 inhabitants ** (X13) | 0.638 | 0.615 |
| Patents granted by Patent Office of the Republic of Poland per 10,000 inhabitants ** (X14) | 0.546 | 0.544 |
| Medical doctors working per 1000 inhabitants ** (X22) | 0.545 | 0.596 |
| Own revenues of budget of cities per capita (X5) | 0.521 | 0.499 |
| Employed persons in trade; repair of motor vehicles; transportation and storage; accommodation and catering; information and communications per 100 inhabitants ** (X19) | 0.507 | 0.556 |
| Dwelling stocks per 100 inhabitants (X9) | 0.493 | 0.452 |
| Number of entities in sections J, K, L, M, N and R in Poland PKD per 1000 inhabitants (information and communication services, business and financial services, real estate activities, research and science activities, arts activities) (X15) | 0.490 | 0.433 |
| Average price per 1 m2 of residential premises (X6) | 0.487 | 0.440 |
| Share of inhabitants aged 13 years and more with tertiary education (X12) | 0.438 | 0.416 |
Publisher’s Note: MDPI stays neutral with regard to jurisdictional claims in published maps and institutional affiliations. |
© 2021 by the authors. Licensee MDPI, Basel, Switzerland. This article is an open access article distributed under the terms and conditions of the Creative Commons Attribution (CC BY) license (https://creativecommons.org/licenses/by/4.0/).
Share and Cite
Guzik, R.; Kołoś, A.; Taczanowski, J.; Fiedeń, Ł.; Gwosdz, K.; Hetmańczyk, K.; Łodziński, J. The Second Generation Electromobility in Polish Urban Public Transport: The Factors and Mechanisms of Spatial Development. Energies 2021, 14, 7751. https://doi.org/10.3390/en14227751
Guzik R, Kołoś A, Taczanowski J, Fiedeń Ł, Gwosdz K, Hetmańczyk K, Łodziński J. The Second Generation Electromobility in Polish Urban Public Transport: The Factors and Mechanisms of Spatial Development. Energies. 2021; 14(22):7751. https://doi.org/10.3390/en14227751
Chicago/Turabian StyleGuzik, Robert, Arkadiusz Kołoś, Jakub Taczanowski, Łukasz Fiedeń, Krzysztof Gwosdz, Katarzyna Hetmańczyk, and Jakub Łodziński. 2021. "The Second Generation Electromobility in Polish Urban Public Transport: The Factors and Mechanisms of Spatial Development" Energies 14, no. 22: 7751. https://doi.org/10.3390/en14227751