Article

Development of Comfort and Safety Performance of Passenger Seats in Large City Buses

1
Institute of Civil Engineering, Warsaw University of Life Sciences, 159 Nowoursynowska St., 02-76 Warsaw, Poland
2
Department of Automotive Engineering, Lviv Polytechnic National University, 12 Stepana Bandery St., 79000 Lviv, Lviv Oblast, Ukraine
3
Lviv National Agrarian University, 1 Volodymyra Velykoho St., 30831 Dubliany, Lviv Oblast, Ukraine
*
Author to whom correspondence should be addressed.
Energies 2021, 14(22), 7471; https://doi.org/10.3390/en14227471
Submission received: 16 October 2021 / Revised: 5 November 2021 / Accepted: 6 November 2021 / Published: 9 November 2021
(This article belongs to the Special Issue Vehicle and Traffic Safety)

Abstract

:
A bus seat needs to be designed ergonomically for better seating comfort. The present study is intended to develop a cost-effective ergonomic bus seat design based on seat comfort and safety demands. As part of the proposed seat design procedure, seating comfort analysis, identifying preferred design features, and developing a seat design are included. An analysis of the bus seat back and seat pan profiles was conducted. Based on the results of the comfort analysis, the authors identified the preferred design features of bus seats during the design identification process. An improved bus seat prototype was developed based on selected design features in the design development stage. Seating comfort analyses were used to compare the achieved seat with the reference seat. The seat design developed in the present study may be applicable for various types of bus public transport.

Graphical Abstract

1. Introduction

Seating comfort is one of the most important indicators of automotive seat performance [1,2,3]. Around the world, there have been many studies on seating comfort, including car seats, truck seats [4], and bus and train seats [5]. A seat that is comfortable in static conditions may have poor dynamic characteristics that make it uncomfortable on the road. The profile of a bus seat needs to be designed ergonomically for various body sizes of passengers. Most automotive seats are not designed according to anthropometry, neither are the automakers willing to invest resources in designing components appeasing human ergonomics [6].
Nowadays, urban space, especially in large cities, faces several challenges resulting from the permanently increasing number of inhabitants. One of the urgent issues to be solved is a safe, comfortable, and quick way of commuting for the residents of urban agglomerations. However, along with overloaded and rapidly expanding urban space, along with modernization of the existing road infrastructure, the growth of traffic level is also significant [7,8,9,10,11].
A natural way of solving such a challenge is to develop collective transport and encourage the still undecided citizens to use it. Residents choosing the mode of transport in urban agglomerations analyze various factors, among which the largest impact on their decisions are safety and comfort (which affect visual, thermal, acoustic, and vibration aspects) [12]. Research studies have already shown that passenger comfort is a key factor in the choice of the means of transport, and its improvement may attract more users of urban transport [13,14,15,16,17]. Following investments in the safety and comfort of collective transport, the quality of life in contemporary cities may be improved. On the other hand, increased road safety could be achieved in many other ways, too (Figure 1). Passenger protection while travelling is one of them, i.e., the design of safe and comfortable seats along with safety belts. A seat’s dimensions must be designed to suit the anthropometry of passengers when designing ergonomic seats. Optimum passenger seat design according to passenger anthropometry can decrease fatigue and discomfort during long periods of sitting [18]. The passengers of the vehicle must be comfortable, as the discomfort can result in fatigue, which can lead to a condition of body imbalance, since the passenger seat used does not usually correspond with the wearer’s anthropometry (non-ergonomic). When it comes to the passenger seat design sector, an ergonomic factor and aspect will ensure greater comfort and less fatigue for passengers [19]. According to The Harvard School of Public Health, ergonomics is the science, art, and application of technology that aims to harmonize or balance between all facilities used at work and rest with human abilities and limitations so that the overall quality of life can be increased [20].
A literature review on the comfort of bus driver seats indicates several medical problems resulting from their long-term use [21,22,23]. Bus drivers are struggling with such problems as sleepiness, cramps, muscle fatigue, difficult circulation, spine pain, depression, stiffness, pain, numbness in the spine, and other musculoskeletal problems that may become chronic [24,25,26,27,28,29,30]. For that reason, to reduce these medical problems resulting from a malformed bus seat, further research should be carried out on the existing bus seat profile. Bearing that that in mind the authors tried to fill the knowledge gap by fully understanding the mechanisms of stress and strength distribution for a specific seat construction design, the present research focuses on specific solid plastic frame construction, which has not been fully studied in the available scientific literature. The study concerns bus seats occupied by an adult (50 years old) and a young (10 years old) passenger, concerning different seat solid plastic frame mounting scenarios.
A comparative analysis of existing bus seat profiles and their evaluation may be presented in the following aspects: (i) comfort evaluation and (ii) ergonomic evaluation. In the comfort evaluation part, 48 participants evaluated seven parts (headrest, upper-back support, lumbar support, seatback bolster, hip support, thigh support, and seat pan bolster) [25]. There are 12 components of the bus seat that directly affect passenger comfort, including seatbelts, armrests, recliners, headrests, dorsal support, lumbar support, side back support, seatback overall support, hip support, thigh support, and seat pan overall support. In addition, 17 ergonomic evaluation measures (such as reachability, controllability, tactile sensation, grip sensation, adjustability, size appropriateness, shape appropriateness, cushioning, and overall comfort) were selected to be assessed based on literature reviews [31,32,33].
In addition to comfort, safety is an essential requirement. The subject of traffic safety has been investigated by many researchers in the context of cars, buses, and coaches [34,35]. Rupp et al. [36] found that the fracture tolerance of the femur is 7.59 kN. In the US, the National Highway Traffic Safety Administration (NHTSA) specified a maximum femur load of 10 kN for a male dummy of the 50th percentile [37]. Leg femurs on both sides experienced 5.2 kN loads. Although within the safe limit, this model predicted a high pelvis load. Due to the dummy posture, the knees are the main point of contact between the seat back and the femurs. The pelvis injury tolerance was determined based on peak pelvis acceleration according to Haffner [38]. Using 130 g of acceleration on the pelvis, he proposed that the occupant’s pelvis can suffer serious injury. When the setback impact occurs, the model predicted a peak acceleration of 33 g for the pelvis [39]. There was a similar interval between the peak acceleration of the pelvis and the peak load of the femur. However, it is below the safe threshold of injury for the pelvis acceleration level. Mertz and Patrick [40] conducted a study showing showed that the human chest is capable of bearing a distributed load of 49 g. This value should not exceed 60 g, according to the FMVSS 208 test.
The development of the Bus Safety Standards (BSS) in different countries included seat testing, both in computer simulations and sledge testing (which replicates the collision forces in a repeatable way, but for testing just the seat in isolation and not the entire vehicle). This testing compared traditional low-back seats against medium (taller) back seats and high (for example coach style) back seats. In rear-facing seats, the BSS encourage high back seats. The additional weight of the different seats makes them difficult to implement throughout the entire bus. European Union Transport Politics aims to emphasize the importance of using public transport rather than private transport while focusing on the safety of the passengers and reducing pollution [41,42]. The World Health Organization (WHO) acknowledges this fact in its annual report on global road safety, where they advocate for better public transport that is safe, accessible, and affordable because it is vital to increase safety in urban areas where traffic has become more crowded [43,44,45].
For the purpose of the present research, the comfort and safety of solid plastic frame seat performance were evaluated based on stress deformation and kinematic behavior. The seats’ frame structure and the material used in the modeling and analyses are considered not to be fully investigated in the available literature, making the research performance the biggest motivation.

2. Materials and Methods

Seating comfort analysis can be performed using vibration evaluation, electromyography, electroencephalography, oxygen saturation, posture-image analysis, spinal loading, computer-aided engineering (CAE), pressure, temperature and humidity monitoring, etc. [46,47,48].
The experimental, purpose-built physical model of the bus that had a front seat and two rows of seats is presented in Figure 2. The model concerned a dummy hybrid representing a 50-year-old man (M50) and a dummy representing a 10-year-old child (P10). The position of the dummies, the seats, and the safety belts were adopted based on the assumed real event scenario. All the characteristic dimensions could be followed in detail in Table 1.
The Mathematical Dynamics Models for Applications (MADYMO) software program uses the method of multibody system dynamics for the formulation of a numerical model. Here, a chain of rigid bodies is linked together using kinematic pairs to copy or model an object. Several physical variables determine the bodies as well as the kinematic joints, which make it possible to solve the equations governing movement. There are three parameters used to describe rigid bodies: mass, moment of inertia, and center of gravity. The kinematic pairs defined specify the bodies that are joined with each kinematic pair. In addition, the coordinate location of those bodies is determined as well.
A general equation, Equation (1), is used to describe the relationship between the position of a local coordinate system and the global coordinate system, where Xi is the matrix of the coordinates of the position vector, ri is the matrix of the coordinates of the vector joining the beginnings of both coordinate systems, Ai is the matrix of direction cosines, and xi is the matrix of the coordinates of the vector of local displacement of the coordinate system.
X i = r i + A i x i
The numerical model for the solution to the general equation of motion Equation (2) uses a modified single-phase Euler’s method with a constant time step ts:
M x ¨ + C x ˙ + K x t = P t
where M—mass matrix; C—matrix defining the damping of the system; K—rigidity matrix; xt—displacement; Pt—matrix defining external loads applied to the system. This matrix is usually adopted in the form of the so-called proportional damping (depending on K and M matrices).
There are 3 types of mechanical models, in which fuzzy models and neural networks are not used because of their non-linearity. Unfortunately, due to the nature of the experiment, the ramification cannot be used to achieve the desired damping force in an open control system. In this case, the Bouc–Wen model was used. As described by Spencer et al. [50], the model is commonly used to elaborate the MR damper hysteretic characteristics. In the present experimental study, the controlled MR damper has high vibration restitution when compared with the passive MR damper. A controlled MR damper presents the better performance by 24% of road-holding vehicles when compared with fully active and 22% on an ideal semi-active suspension system [51].
The hysteretic behavior of the MR damper was depicted with the help of the Bouc–Wen model [50]. A scheme of the mechanical diagram of the MR damper is shown in Figure 3. The dampers can be used as comfort and noise protection elements, too [41,42,43,44,45,46,47,48,49,50,51,52,53,54]. Figure 3 presents the general view of the soundproof partition of the bus motor. The cross-section shows the bus septum, where 1—engine compartment, 2—passenger compartment, 3—DVA, 4—internal part of the partition. The partition has an elastic fastening, which is the external part of the sound absorber of reinforcing elements. A damper on the driver’s seat is a required feature. However, transport comfort can be increased by fitting dampers to the passenger seats as well.
From the empirical point of view, the mechanical model is governed by the following equations
y ˙ = 1 c 0 + c 1 α z + k 0 ( x y ) + c 0 x ˙
z ˙ = γ x ˙ y ˙ z n 1 z μ ( x ˙ y ˙ ) z n + A ( x ˙ y ˙ )
f M R = c 1 y ˙ + k 1 ( x x 0 ) .
Based on dimensional differences, 12 bus seats were classified based on their features for the purpose of the study. Accordingly, lumbar supports were classified in reference to dimensional differences between extracted centerline and seat pan lines measured for the measured bus seat profiles. This means that the lumbar was shaped for ≥25 mm (mean) or flattened to achieve the lumbar shape of <25 mm on the center line, and the designed side lumbar support was shaped for ≥45 mm or flattened to achieve the side lumbar support shape <45 mm than the side lumbar support on the seat pan lines (Figure 4) [48].

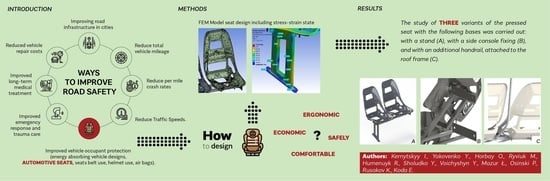
3. Results and Discussion

Unlike nowadays, in the past, the seat designs were made mostly of the tubular profile. However, stamped designs of passenger bus seats still need further experimental analyses. In this case, a stamped construction with a thickness of 2 mm, made of Steel 20, was used in the 3D modeling (Figure 5). The software allowing stress distribution evaluation was the one presenting the traditional approach for solving and presenting the distribution of internal stresses in various structures. Dynamic analysis was conducted to determine the stress deformation and kinematic behavior of the mechanism with consideration of the elastic–plastic behavior of individual parts of the mechanism.
While building the model, the first step was to reduce weight, which weakens the supporting frame, and to increase its compliance, the model seat was cut out. The cut-out is very important for obtaining the necessary movements at checkpoints following the requirements of static tests proposed by the Economic Commission for Europe of the United Nations Regulation No. 80 [55].
The loading height H1 of load P1 was 781 mm concerning the base surface, and the loading height H2 of load P2 was 533 mm, respectively. The values of loads P1 and P2 applied to the back seat were parallel to the horizontal plane and the longitudinal axis of the bus and could be calculated as follows in Equations (6) and (7):
P 1 = 1000 H 1 ± 50 = 1000 0.781 + 50 = 1330 N
P 2 = 2000 H 2 ± 100 = 2000 0.533 + 100 = 3852 N
A further performance of the research on the seat frame conforming to the requirements of UNECE Regulation No. 80 [55] is the analysis of the structure strength presented in the form of a solid-state model (solid model). This would ensure higher accuracy of the calculation and would allow taking into account the plastic deformations (allowing physical non-linearity). The main advantage of the solid model is the possibility of transition from the nodal connections of the rods to the actual volumetric connections of pipes and other elements of the design corresponding to the actual scenario. In contrast to the beam performance, the solid-state model is much more complex in terms of its construction and analysis, because the model needs to be split into sets of sizes and configurations.
The study of three variants of the seats loaded with the following scenarios was carried out: with a stand (Figure 6a), with a side fixing console (Figure 6b), and with an additional handrail, which was attached to the roof frame (Figure 6c).
The first example (Figure 6a) consists of a vertical rack, which was made of a 2 mm thick profile and with a hole in the center to save material; however, it was not reducing the structure’s stiffness. The bottom of the rack is welded to a 3 mm thick plate with two holes of 10 mm in diameter, under a bolted connection. In the model, the welded connection of the plate is simulated, which acts as the flange fastening the base to the wheel arches of the bus and the rack’s frame (Figure 6a).
The second scenario (Figure 6b) is relevant for low-entry and low-floor vehicles, allowing efficient bus floor maintenance. Its base is not fixed to the racks on the floor but is firmly tied to the side of the bus through two supporting circular pipes of 20 × 2 mm in size (Figure 6b). These pipes are welded to a steel plate (265 × 50 × 3 mm in size) with two holes for a bolted connection of 10 mm. The flanges are attached to the side of the seat at a height of 200 mm.
Starting from the fact that the second scenario (Figure 6b) is characterized by higher optimization potential, in comparison with the classical variant (Figure 6a) with a stable floor mount, which has a much smaller distance between the mount supports, and therefore a significantly greater moment of action from the forces, it is advisable to strengthen it by the introducing an additional rail attached to the roof frame (Figure 6c). It is worth noting that it is often possible to find a construction variant with a handrail attached to the frame of one of the seats. Thus, as a result of loads following UNECE Regulation No. 80, different values of displacement and absorbed energy are obtained for the back and the right-sided seats.
In general, each node has 6 degrees of free space (three linear movements and three angles of rotation), but for a particular task, certain degrees of free space may not be possible. For instance, in the solving process of deforming a flat five-point fastening of the base of the seat loaded by plane forces, the basic functions describing the displacement of the peak plane can be omitted, since their value is zero.
The description type includes here the topology of an element (flat triangle, flat quadrilateral, a polygon with curved sides, bulk element-tetrahedron, hexagon, etc.). For such shapes, the basic functions (a quadrilateral with 6 degrees of free space in the node, quadrilateral with 2 degrees of free space in the node, etc.) and formulas for calculating elastic energy are used. The solution of a set of equations of FEM (finite elements method) by the prediction of displacement will be the components of nodal displacements of the discrete design of a passenger seat.
In general, the base model with a stand consists of 19 constituent elements. Its weight is 15.1 kg. The number of finite elements of the FEM model approaches 40,000 and the number of nodes is 85,376. The results of the calculations indicate that despite being identical to one another, the left and right seats are divided into different amounts of finite elements (FE): the left consists of 16,160 elements joined by 33,265 nodes and the right consists of 16,189 items with 33,309 nodes. Similar conditions can be observed for absolutely identical M8 bolts fastening the base. There may be several explanations: firstly, the Ansys Workbench algorithm generates a grid every time individually (adapting to the set conditions of the calculation), and may start, for example, not from the seat mounting area, but its upper part, showing signs of an artificial neural network. Secondly, the base to which the seat is fixed is not symmetrical (different degrees of detail in its various areas).
The model of the seat with a console mount consists of 19 constituent elements and is heavier by 0.6 kg. The number of end-points of the FEM model increases to 42,699, and the number of the corresponding nodes is almost 5000 units.
All elements that are part of the seat model have nonlinear characteristics of the material, including its physical nonlinearity (Nonlinear Effects = Yes). For example, one of the M8 bolts consists of 198 elements and 408 knots, and the corresponding nut consists of 66 elements and 473 knots. The contact sensitivity parameter that is automatically set in the Ansys Workbench environment is 3.4712 mm (Tolerance Value). In general, the model is more complex, concerning the rack sample, and it requires a more detailed breakdown of key elements: the degree of detail in the partition is determined by the Relevance parameter, which is assumed to be 0.35 for the model under study (as part of the Ansys Workbench software functionality, the maximum value for Relevance is −100). Compared with the first scenario (Figure 5a) and despite the absence of a rack mount to the floor, the overall height of the model (Length Y) increased from 791.09 to 1184 mm. The difference in overall height is due to the presence of a high rail, which is fixed to the system of railings on the roof of the cabin. Compared with the second scenario (Figure 5b), the number of FEs increased by 7%, and the number of nodes increased by 7.5%, respectively.
The weight of the model with a handrail is 16.6 kg, and the number of constituent elements of assembly increased not as much. Data on the FEM-wire rail were as follows: the number of FE railings is 3792, and the number of nodes is 7426. Its dimensional height was 971.5 mm, and the weight of the whole model was 0.9 kg.
During the computer simulation of seat frame tests, the behavior of the component elements with the corresponding steel–steel friction pairs has also been determined. For steel–steel pairs, the coefficient of friction is set to 0.2, which corresponds to the typical value in rest. In addition to the bolted joints, all contact pairs have a friction coefficient of 0.2. The hard type bonded (motionless) joint provides a bolted connection (for example, Bonded—M8 bolt to bolt connection).
It should be noted that the statement about the direct correlation of the growth of relevance to the accuracy of the calculation is false. In the split configuration on the FE, the Relevance Center parameter is set to Fine, which means an improved detail of the element at the curves of the model and complex transitions (bolted connections, etc.). The minimum value of the edge length of the finite element was 5,8838e−004 mm.
Firstly, the stress values of the base model with the rack were analyzed. The maximum value reached was 431.74 MPa. The rack was fixed using the bolted connection at the left bracket, which was mounted along with the movement of the seat to the base in its front part. At the same time, the maximum stress value of mounting bolts was 199.43 MPa. In the place where the seat frame was fixed with a bolted connection, the stress value was 240 MPa. The constituent elements reached maximum stresses at different times, which is presented in Figure 7.
When considering the stress–strain state of the design at the stage of full absorption of the impact energy presented in Figure 7, the maximum stress value, equal to 374.74 MPa, is recorded in the frame of the right-hand drive of the bus in the area of the seat bend. This is as expected due to the greatest bending moments passing through this area. The stress values in the rack vary from 5 MPa in the flange with an increase of 45 MPa in the bolted joints and up to 270 MPa in the rack (Figure 8). Structurally, the seat leg is a welded structure consisting of a pressed sheet with a thickness of 2 mm and a flat flange fastened to the floor with a thickness of 3 mm.
Together with the base of the seat (welded square tube frame), the rack and flange mounted to the bracket of the seat arch forms a single inseparable structure. The structure demonstrated a maximum stress value of 339.81 MPa, which is fixed in the right seat mount bracket.
The variant of the seat base, designed for the installation in low-entry buses, has a one-way mount attached to the bus sidewall, and therefore, in theory, it has a lower equilibrium than the previous design. The maximum value of stresses recorded during the loading process was 434.33 MPa. It corresponds to the contact area of the anterior nut with the left seat frame. Such conditions and detection of the maximum stress design fully correspond with the previous case. In both cases, the nut will withstand the force reactions transmitted from the bolt while maintaining the design integrity. The maximum stress value is 390.02 MPa, which is 3–5% more compared to the previous version. This value corresponds to the area of the left-hand drive of the seated bus, which is the opposite of the seat with a stand (the right seat was more loaded).
In a reverse case, the value of the maximum stress occurs at the base of the seat, with 305.81 MPa versus 339.81 MPa for the rack variant. Although the area where the extremum of stress is fixed coincides with the same seat mount bracket. Thus, the bracket is in lower load conditions as part of the console construction. Even though the absolute value of stresses is lower in the console variant, the average value of stresses is 30–35% higher when referring to 270–300 MPa for pipe profiles (25 × 2 mm) against 220–250 MPa for a variant providing a stable mounting.
In general, the console structure in terms of stresses has a sufficient margin of safety, but a significant part of the constituent elements is outside the yield strength of the material (Steel 20–250 MPa). This is because the seat performs the bearing function, which may result in increased displacement under regular loads following UNECE Regulation No. 80.
For the third variant of the base with a console fastening and additional armor with a stress map, a decrease by 5% in the value of stresses was noticed. The maximum value corresponds to the area of the left seat bend. In general, the relative equilibrium of the construction of the seat together with an additional handrail may be estimated: the oscillation of the voltage value is at 30–40% between the model components, meaning there are no overloaded elements or those with an excess safety margin.
Although the seat base showed a maximum stress value of 5 MPa more than in two other cases, the average value of stresses in round profiles, 20 × 2 mm in size, at 15–20% is lower due to stress redistribution. A significant contribution to stress redistribution has a vertical additional handrail, absorbing a significant part of the energy when struck. The voltage map of this handhold shows the effectiveness of its work: the maximum stress value was 266.77 MPa. As expected, this value is fixed in the area of the seat mounting to its base.

4. Conclusions

Bearing in mind that there is a number of factors influencing the general performance of bus seats, the present paper aimed to focus on an aspect considered crucial in urban public transportation, which is safety and comfort. The comfort analyses were performed using purpose-built models on seat profiles occupied by an adult (M50) and a young (M10) passenger. The safety analyses were based on analyzing the frame strength and stress distribution for three variants of seat mounts: a seat with a stand, a side control seat fixing, and a seat-supporting handrail attached to the roof frame.
All considered models were solid-based and created using computer-aided design and a computer-aided engineering software environment; then, they were imported into the software package for Finite Element Method analysis. In general, the base model with a stand consists of 19 constituent elements. The number of finite elements of the Finite Element Method model approached 40,000, and the number of nodes exceeded 80,000.
The simulation of different scenarios for seat loading complies with Economic Commission for Europe of the United Nations Regulation No. 80 [54]. The common seat frame types with various mounting types used in standard or low floor buses were tested, giving a promising correlation between the simulation and test results according to the Economic Commission for Europe of the United Nations Regulation No. 80. For different seat mounting scenarios, the achieved maximum stresses were 431.74 MPa for a base model, 374.74 MPa at the stage of full absorption of the impact energy, and 339.8 MPa for the rack and flange mounted to the bracket of the seat arch. For the variant of the seat base, which was designed for installation in low-floor buses, the maximum value of stresses recorded during the loading process was 434.33 MPa.
The present study is a primary investigation focusing on particular events concerning two passengers with assumed seating locations and coordinates. The study should be further developed to evaluate seating comfort and safety for all passengers located at different seating spots. Bearing in mind that the results of the present study could be applied in urban public transportation only, the outcomes would allow understanding how to improve the comfort zone preventing potential physical discomfort or injuries.

Author Contributions

Conceptualization, I.K., O.H. and E.K.; methodology, O.H. and M.R.; software, Y.Y., M.R., R.H. and Y.S.; validation, Y.V., P.O. and K.R.; formal analysis, I.K. and O.H.; investigation, I.K., Y.Y., M.R., R.H., Y.S. and Y.V.; resources, I.K., O.H. and M.R.; data curation, P.O. and K.R.; writing—original draft preparation, O.H. and P.O.; writing—review and editing, P.O. and E.K.; visualization, R.H., Y.S., Y.V. and Ł.M.; supervision, E.K. All authors have read and agreed to the published version of the manuscript.

Funding

This research received no external funding.

Institutional Review Board Statement

Not applicable.

Informed Consent Statement

Not applicable.

Data Availability Statement

Not applicable.

Conflicts of Interest

The authors declare no conflict of interest.

References

  1. Da Silva, L.; Bortolotti, S.L.V.; Campos, I.C.M.; Merino, E.A.D. Comfort model for automobile seat. Work 2012, 41, 295–302. [Google Scholar] [CrossRef] [PubMed] [Green Version]
  2. Molenbroek, J.; Albin, T.; Vink, P. Thirty years of anthropometric changes relevant to the width and depth of transportation seating spaces, present and future. Appl. Ergon. 2017, 65, 130–138. [Google Scholar] [CrossRef] [Green Version]
  3. Pijls, R.; Galetzka, M.; Groen, B.H.; Pruyn, A.T. Comfortable seating: The influence of seating comfort and acoustic comfort on customers’ experience of hospitality in a self-service restaurant. Appl. Ergon. 2019, 81, 102902. [Google Scholar] [CrossRef] [PubMed]
  4. Iftekhar, H.; Khan, U.; Asghar, R.M.W.; Qadeer, M.A.; Umair, A.; Nawab, M.; Hamdani, S.T.A. Study of comfort performance of novel car seat design for long drive. Proc. Inst. Mech. Eng. Part D J. Automob. Eng. 2020, 234, 645–651. [Google Scholar] [CrossRef]
  5. Brunoro, C.; Sznelwar, L.I.; Bolis, I.; Abrahão, J. Contributions of ergonomics to the construction of bus drivers health and excellence in public transport and at work. Work 2012, 41, 30–35. [Google Scholar] [CrossRef] [PubMed] [Green Version]
  6. Gowtham, S.; Ramnaath, M.; Sudharsan, S.; Kumar, B.V.L.; Praneeth, V.; Dinesh, S.; Subramaniyam, M. Seating comfort analysis: A virtual ergonomics study of bus drivers in private transportation. IOP Conf. Ser. Mater. Sci. Eng. 2020, 912. [Google Scholar] [CrossRef]
  7. Castañeda, K.; Sánchez, O.; Herrera, R.F.; Pellicer, E.; Porras, H. BIM-based traffic analysis and simulation at road intersection design. Autom. Constr. 2021, 131, 103911. [Google Scholar] [CrossRef]
  8. Gu, W.; Mei, Y.; Chen, H.; Xuan, Y.; Luo, X. An integrated intersection design for promoting bus and car traffic. Transp. Res. Part C Emerg. Technol. 2021, 128, 103211. [Google Scholar] [CrossRef]
  9. Muro, F.-J.M.; Skorin-Kapov, N.; Pavon-Marino, P. Revisiting core traffic growth in the presence of expanding CDNs. Comput. Netw. 2019, 154, 1–11. [Google Scholar] [CrossRef]
  10. Oskarbski, J.; Birr, K.; Żarski, K. Bicycle Traffic Model for Sustainable Urban Mobility Planning. Energies 2021, 14, 5970. [Google Scholar] [CrossRef]
  11. Sołowczuk, A. Effect of Traffic Calming in a Downtown District of Szczecin, Poland. Energies 2021, 14, 5838. [Google Scholar] [CrossRef]
  12. Litman, T.; Fitzroy, S. Distance-Based Vehicle Insurance Feasibility. Costs and Benefits; Victoria Transport Policy Institute: Victoria, BC, Canada, 2018. [Google Scholar]
  13. Dell’Olio, L.; Ibeas, A.; Cecin, P. The quality of service desired by public transport users. Transp. Policy 2011, 18, 217–227. [Google Scholar] [CrossRef]
  14. Atombo, C.; Dzigbordi, W.T. Indicators for commuter’s satisfaction and usage of high occupancy public bus transport service in Ghana. Transp. Res. Interdiscip. Perspect. 2021, 11, 100458. [Google Scholar]
  15. Barabino, B.; Eboli, L.; Mazzulla, G.; Mozzoni, S.; Murru, R.; Pungillo, G. An innovative methodology to define the bus comfort level. Transp. Res. Procedia 2019, 41, 461–470. [Google Scholar] [CrossRef]
  16. Barone, V.; Festa, D.C.; Mongelli, D.W.E.; Tassitani, A. Comfort Index CI(bus): A methodology to measure the comfort on board. Procedia Comput. Sci. 2018, 134, 439–444. [Google Scholar] [CrossRef]
  17. Karekla, X.; Fang, C. Upper body balancing mechanisms and their contribution to increasing bus passenger safety. Saf. Sci. 2021, 133, 105014. [Google Scholar] [CrossRef]
  18. Rao, M.J.; Sivapirakasam, S.P.; Phanindra, K.H.; Vishnu, B.R. Prediction and analysis of semi low floor bus driver seat vibrations by using the response surface methodology. Int. J. Heavy Veh. Syst. 2021, 28, 409–422. [Google Scholar] [CrossRef]
  19. Fittipaldi, F.; Ranzo, P.; &Veneziano, R. Ergonomic Design Approach for an Urban Bus. In Proceedings of the International Conference on Applied Human Factors and Ergonomics, New York, NY, USA, 25–29 June 2021; Springer: Cham, Switzerland, 2021. [Google Scholar]
  20. Nguyen, T.; Nguyen-Phuoc, D.Q.; Wong, Y.D. Developing artificial neural networks to estimate real-time onboard bus ride comfort. Neural Comput. Appl. 2021, 33, 5287–5299. [Google Scholar] [CrossRef]
  21. Jianghong, Z.; Long, T. An evaluation of comfort of a bus seat. Appl. Ergon. 1994, 25, 386–392. [Google Scholar] [CrossRef]
  22. Jonsson, P.M.; Rynell, P.W.; Hagberg, M.; Johnson, P.W. Comparison of whole-body vibration exposures in buses: Effects and interactions of bus and seat design. Ergonomics 2014, 58, 1133–1142. [Google Scholar] [CrossRef]
  23. Lim, S.; Chung, M.K.; Jung, J.; Na, S.H. The Effect of Lumbar Support Prominence on Driver’s Comfort and Body Pressure Distribution. In Proceedings of the Human Factors and Ergonomics Society Annual Meeting. Proc. Hum. Factors Ergon. 2000, 44, 308–311. [Google Scholar]
  24. Chung, Y.-S.; Wong, J.-T. Developing effective professional bus driver health programs: An investigation of self-rated health. Accid. Anal. Prev. 2011, 43, 2093–2103. [Google Scholar] [CrossRef] [PubMed]
  25. Park, J.; Lee, H.; Choi, Y.; Park, K.; Kim, M.; You, H. Development of an Ergonomic Bus Seat Profile Design Protocol. Proc. Hum. Factors Ergon. Soc. Annu. Meet. 2014, 58, 1825–1828. [Google Scholar] [CrossRef]
  26. Anund, A.; Fors, C.; Ihlström, J.; Kecklund, G. An on-road study of sleepiness in split shifts among city bus drivers. Accid. Anal. Prev. 2018, 114, 71–76. [Google Scholar] [CrossRef] [PubMed]
  27. Heberle, S.M.; Lorini, C.; Rosa, M.S.; Barros, N. Evaluation of bus driver exposure to nitrogen dioxide levels during working hours. Atmos. Environ. 2019, 216, 116906. [Google Scholar] [CrossRef]
  28. Anto, E.O.; Owiredu, W.; Adu, E.A.; Obirikorang, C.; Fondjo, L.A.; Annani-Akollor, M.E.; Acheampong, E.; Asamoah, E.A.; Roberts, P.; Wang, W.; et al. Prevalence and lifestyle-related risk factors of obesity and unrecognized hypertension among bus drivers in Ghana. Heliyon 2020, 6, e03147. [Google Scholar] [CrossRef] [Green Version]
  29. Golinko, V.; Cheberyachko, S.; Deryugin, O.; Tretyak, O.; Dusmatova, O. Assessment of the Risks of Occupational Diseases of the Passenger Bus Drivers. Saf. Health Work 2020, 11, 543–549. [Google Scholar] [CrossRef]
  30. Wang, X.; Wang, K.; Huang, K.; Wu, X.; Huang, W.; Yang, L. The association between demographic characteristics, personality, and mental health of bus drivers in China: A structural equation model. Physiol. Behav. 2021, 229, 113247. [Google Scholar] [CrossRef]
  31. Kim, J.; Na, H.; Cho, D.; Shin, Y.; Park, S.; Kim, J. Development of Questionnaire for Automobile Seat Comfort Evaluation. J. Kor. Soc. E Sens. 2010, 13, 381–390. [Google Scholar]
  32. Kolich, M. Automobile seat comfort: Occupant preferences vs. anthropometric accommodation. Appl. Ergon. 2003, 34, 177–184. [Google Scholar] [CrossRef]
  33. Smith, D.R.; Andrews, D.M.; Wawrow, P.T. Development and evaluation of the Automotive Seating Discomfort Questionnaire (ASDQ). Int. J. Ind. Ergon. 2006, 36, 141–149. [Google Scholar] [CrossRef]
  34. Hamid, A.I.; Li, Q.M. New definitions of deformation index for the measurement of bus survival space in crash. Proc. Inst. Mech. Eng. Part D J. Automob. Eng. 2018, 233, 2108–2119. [Google Scholar] [CrossRef]
  35. Law, T.H.; Daud, M.S.; Hamid, H.; Haron, N.A. Development of safety performance index for intercity buses: An exploratory factor analysis approach. Transp. Policy 2017, 58, 46–52. [Google Scholar] [CrossRef]
  36. Rupp, J.D.; Reed, M.P.; Van Ee, C.A.; Kuppa, S.; Wang, S.C.; Goulet, J.A.; Schneider, L.W. The tolerance of the human hip to dynamic knee loading. Stapp Car Crash J. 2002, 46, 211–228. [Google Scholar] [CrossRef] [PubMed]
  37. Kleinberger, M.; Sun, E.; Eppinger, R. Development of Improved Injury Criteria for the Assessment of Advanced Automotive Restraint Systems. II; National Highway Traffic Safety Administration, U.S., Department of Transportation: Washington, DC, USA, 1998; p. 180. [Google Scholar]
  38. Haffner, M. Synthesis of Pelvic Fracture Criteria for Lateral Impact Loading; Technical Paper; SAE International: Warrendale, PA, USA, 1985. [Google Scholar]
  39. Sharma, S.; Sharma, S.; Gupta, U.; Joshi, R.; Pawar, S. Finite Element Analysis and Validation of Bus Seat Structure as per AIS023: Safety Features Evaluation of Bus Seat using Hybrid III Dummy. SAE Tech. Pap. Ser. 2015, 1. [Google Scholar] [CrossRef]
  40. Mertz, H.J.; Patrick, L.M. Strength and Response of the Human Neck; SAE Technical Paper; SAE International: Warrendale, PA, USA, 1971. [Google Scholar]
  41. Martinez, L.; Espantaleón, M.; de Loma-Ossorio, M.; Alcalá, E.; Torres, C.R. Adult and Child Dummies Tests for Safety Assessment of Seated Occupants in Urban Bus Collisions. In Proceedings of the 25th International Technical Conference on the Enhanced Safety of Vehicles (ESV) National Highway Traffic Safety Administration, Detroit, MI, USA, 5–8 June 2017. [Google Scholar]
  42. Peters, S.E.; Grogan, H.; Henderson, G.M.; Gómez, M.A.L.; Maldonado, M.M.; Sanhueza, I.S.; Dennerlein, J.T. Working Conditions Influencing Drivers’ Safety and Well-Being in the Transportation Industry: “On Board” Program. Int. J. Environ. Res. Public Health 2021, 18, 10173. [Google Scholar] [CrossRef] [PubMed]
  43. Mousavi, S.M.; Osman, O.A.; Lord, D.; Dixon, K.K.; Dadashova, B. Investigating the safety and operational benefits of mixed traffic environments with different automated vehicle market penetration rates in the proximity of a driveway on an urban arterial. Accid. Anal. Prev. 2021, 152, 105982. [Google Scholar] [CrossRef]
  44. Peters, S.E.; Trieu, H.D.; Manjourides, J.; Katz, J.N.; Dennerlein, J.T. Designing a Participatory Total Worker Health® Organizational Intervention for Commercial Construction Subcontractors to Improve Worker Safety, Health, and Well-Being: The “ARM for Subs” Trial. Int. J. Environ. Res. Public Health 2020, 17, 5093. [Google Scholar] [CrossRef]
  45. Sorensen, G.; Dennerlein, J.T.; Peters, S.E.; Sabbath, E.L.; Kelly, E.L.; Wagner, G.R. The future of research on work, safety, health and wellbeing: A guiding conceptual framework. Soc. Sci. Med. 2021, 269, 113593. [Google Scholar] [CrossRef]
  46. Tan, C.F.; Chen, W.; Delbressine, F.; Rauterberg, M. Objectifying discomfort seat measurement for next generation truck driver’s seat. Int. Fed. Aut. Eng. Soc. 2008, 28, F2008-SC-028. [Google Scholar]
  47. Halder, P.; Mahmud, T.; Sarker, E.; Karmaker, C.; Kundu, S.; Patel, S.; Setiawan, A.; Shah, K. Ergonomic considerations for designing truck drivers’ seats: The case of Bangladesh. J. Occup. Health 2018, 60, 64–73. [Google Scholar] [CrossRef] [PubMed] [Green Version]
  48. Dama, K.; Babu, V.S.; Rao, R.N.; Madhava, Y. A Review on Automotive Seat Comfort Design. Int. J. Eng. Res. 2015, 4, 678–683. [Google Scholar] [CrossRef]
  49. Jamroziak, K.; Joszko, K.; Wolanski, W.; Gzik, M.; Burkacki, M.; Suchon, S.; Zielonka, K. Experimental and modelling research on coach passengers’ safety in frontal impacts. Arch. Civ. Mech. Eng. 2020, 20, 1–13. [Google Scholar] [CrossRef]
  50. Spencer, B.F., Jr.; Dyke, S.J.; Sain, M.K.; Carlson, J.D. Phenomenological Model for Magnetorheological Dampers. J. Eng. Mech. 1997, 123, 230–238. [Google Scholar] [CrossRef]
  51. Hatwalane, S.; Kothavale, B.S.; Ohol, A.; Girish, P. Review of Driver Seat Suspension using MR Fluid Damper. Int. J. Curr. Eng. Technol. 2011, 4, 333–336. [Google Scholar]
  52. Kernytskyy, I.; Diveyev, B.; Hlobchak, M.; Horbaj, O.; Kopytko-Kernytska, M.; Zachek, O. Optimization of the impact multi-mass vibration absorbers. Sci. Rev. Eng. Environ. Sci. 2017, 26, 394–400. [Google Scholar] [CrossRef] [Green Version]
  53. Horbay, O.; Diveyev, B.; Kernytskyy, I.; Humenyuk, R. Some components of safety and comfort of a car: Current Problems of Transport. In Proceedings of the ICCPT 2019, Ternopil, Ukraine, 28–29 May 2019. [Google Scholar]
  54. Snitynskyy, V.; Diveyev, B.; Horbay, O.; Humenyuk, R.; Kernytskyy, I.; Kokhana, T.; Koruniak, P. Impact and particle vibration absorbers optimal design. Acta Sci. Pol.—Arch. Bud. 2020, 19, 93–102. [Google Scholar] [CrossRef]
  55. UNECE Regulation No. 80. Uniform provisions concerning the approval of seats of large passenger vehicles and of these vehicles with regard to the strength of the seats and their anchorages. E/ECE/324/Rev.1/Add.79/Rev.2. United Nations. GE.12-24958. 2012. Available online: https://eur-lex.europa.eu/legal-content/EN/ALL/?uri=CELEX:42013X0824(01) (accessed on 3 April 2021).
Figure 1. Examples of ways to improve road safety.
Energies 14 07471 g001
Figure 2. Dimensions describing the dummy position concerning the seat and safety belt location: (a) front view M50, (b) front view P10, (c) side view (modified after [49]).
Energies 14 07471 g002
Figure 3. Mechanical model of MR damper (a), and general appearance of a bus soundproofing system (b).
Energies 14 07471 g003
Figure 4. Critical cross-sections and outlines of a bus seat profile.
Energies 14 07471 g004
Figure 5. Seat model made of pressed sheet: (a) solid model; (b) Finite Element Method (FEM) model.
Energies 14 07471 g005
Figure 6. Three-dimensional model of a seat with a stand (a), a side control fixing (b), and a handrail attached to the roof frame (c).
Energies 14 07471 g006
Figure 7. Tension diagrams depending on load steps: (a) nut; (b) bolt.
Energies 14 07471 g007
Figure 8. Strength map of the rack.
Energies 14 07471 g008
Table 1. Distances describing the position of the dummies.
SpecimenFront ViewSide View
SymbolDistance (mm)SymbolDistance (mm)
M50 dummyHG100HGT220
HBPW225HGP350
HBR50HT430
HRR205HB490
HRO40HK100
HBO85HS295–300
HKR175
HSR245
HSO155
P10 dummyPG90–100PGT0
PBPW330PGP515
PBR330PT540–545
PRR70PB575–580
PRO282PK255
PBO105PS40
PKR150
PSR85
PSO250
Publisher’s Note: MDPI stays neutral with regard to jurisdictional claims in published maps and institutional affiliations.

