1. Introduction
The development and optimization of the key components of proton exchange membrane fuel cells (PEMFCs) are necessary for the material cost reduction needed for the adoption of PEMFC technology in everyday life [
1,
2,
3,
4]. One such key components to be optimized is the catalyst layer of the MEA. To tackle this task, the identification of crucial electrode parameters and their influence on the voltage loss is necessary.
Electrochemical impedance spectroscopy (EIS) is a very powerful method to investigate the contributions of individual effects on overall fuel cell performance in laboratory research and system development. The interpretation of the obtained data is, however, rather challenging and can potentially lead to false conclusions. Adding to the difficulty is the multitude of different models presented in literature that often leave researchers puzzled as to their choices for interpreting their data. This is especially true for the description of low-frequency features in the range of 2 to 0.01 Hz, where diffusion-related impedance signals appear [
5,
6,
7,
8]. The higher spectrum within this range (2–0.2 Hz) often produces a third semicircle in the negative impedance plane, defined as a negative low frequency impedance (NLFI) [
7,
8,
9,
10,
11]. The lower spectrum of this frequency range (0.2–0.01) produces a semicircle in the positive impedance plane [
5,
12,
13,
14], defined as positive low-frequency impedance (PLFI) for easier distinction from NLFI.
PLFI has been interpreted as having stemmed from various different effects, namely [
5,
12]:
- (i)
Side reactions with intermediate species on the catalyst surface; for PEMFC, the oxidation of adsorbed intermediates (Oads, OHads or O2Hads).
- (ii)
Water transport phenomena in the catalyst layer.
- (iii)
Poisoning of the catalyst layer with carbon monoxide.
- (iv)
Changing temperatures, through joule heating, from the excitation current.
Based on the provided examples it can be understood that the interpretations of the EIS data varies greatly, depending on the nature of the underlying phenomena behind it. The most probable cause, from a mechanistic point of view, for the oxygen reduction reaction is an adsorption step or the formation of PtO [
5,
15].
Since both the NLFI and PLFI loops are directly adjacent to each other, they can influence the results of an impedance analysis if one is not considered.
Some of the initial studies on equivalent circuit models for PEMFC were performed approximately twenty-five years ago. These were mostly based on planar electrodes, consisting of a resistor and a capacitor, in parallel, for each electrode, and a resistor, in series, for the electrolyte and current collector resistances [
16]. If the time constants of the two electrodes are far enough apart, the two electrodes can be distinguished in the impedance spectrum of normal H
2/O
2 operation [
16,
17]. One way to determine this is by recording impedance spectra in a half cell setup or using a reference electrode in situ [
18,
19]. However, the position of the reference electrode largely influences the results. It should be positioned in the centre of the electrolyte, close to the electrode, with its dimensions being small compared to electrolyte thickness. During the stages of the first EIS studies in the early 2000s typical membrane thickness was around 100–200 µm and pseudo references had to keep thicknesses of <20–50 µm [
18,
20]. As membranes became thinner over time—reaching already 10 µm in some cases [
21]—this task became even more challenging. To circumvent this challenge, the time constants of the half-cell reactions can be determined by so-called “symmetric-cell” experiments, where the cell is identical on both electrodes and fed with hydrogen or oxygen on both sides. An impedance spectrum is recorded at OCV to determine the charge transfer of the corresponding electrode. Following these first experiments it was observed that, generally, the charge transfer resistance is much larger for the cathode than for the anode and can, therefore, be distinguished during normal operation [
17,
18,
19,
20].
The classical equivalent circuit model to describe non-planar electrodes is the transmission line model for porous electrodes [
16]. This consists of several RC elements connected to one another by resistances and forming a complex “ladder”. Each RC—element represents a volume fraction of the porous electrode. As this model is most certainly the best representation of the electrodes in a PEMFC, it is also very work-intensive to parametrize and needs significant processing power for the used CPU. This means that it is not well-suited for applications in on-board analysis or quick assessments during experimental work in the laboratory.
Certain boundary conditions must be met for the equivalent circuit modelling approach to be correct. Using high stoichiometry and an ensuring even distribution of the double layer capacitance, the simple planar electrode models can be used to analyse data from the impedance spectra [
16]. The simple equivalent circuit approach has, therefore, been used in a high number of studies and practical models for system monitoring in fuel-cell technology [
7,
8,
11,
12,
22,
23,
24]. In the system monitoring application, EIS is very attractive as it (i) requires only minimal additions in the required hardware and (ii) enables for a significantly faster means of obtaining data in contrast to recording of a complete polarization curve [
13].
Some of the first attempts to describe diffusion related arcs in the NLFI spectrum were from M. Schulze and N. Wagner in their respective works [
7,
11]. They were among the first to use two RC elements to simulate the two electrodes respectively and to use a third RC element for the diffusion through the electrodes. Their model has since been reused in a few studies aimed at stack performance and degradation diagnostics [
25,
26].
As much as these models prove to be simple and practicable in their application, they fail to simulate PLFI features. Such features are being consistently reported by many researchers in their work [
5,
12,
13] and models for their discussion have been proposed. Pivac et al. have used an inductivity in parallel with the charge-transfer resistance of the electrode and capacitance of the electrochemical double layer to reproduce this feature in their simulation [
13]. In contrast D. Klotz correctly argues that an inductivity shows high impedance values only at high frequencies and, therefore, a capacitance with negative value must be used for simulating PLFI features [
5]. Both however, do not include a third time constant in the negative plain, as in the models by Schulze and Wagner, and, therefore, fail to correctly simulate diffusion-related signals in the NLFI spectrum.
As membrane electrode assembly (MEA) performance strongly influences EIS signals, it is common to use the technique in MEA design studies [
4,
7,
27,
28,
29,
30]. Furthermore, various cathode catalyst systems have been developed with high-mass activities to decrease the amount of used platinum [
31,
32,
33,
34,
35], yet few transferred these high mass activities into the expected high power output in a single-cell configuration [
36,
37]. The reason for this could be the very complex nature of the MEA and its operating conditions, for which it is difficult to identify all the crucial parameters in electrode composition that need to be optimized and to precisely control all parameters during operation. Namely, highly kinetic activities for oxygen reduction reactions (ORR), as measured in half-cell liquid electrolyte setups, often do not necessarily translate into high power outputs in the solid electrolyte MEAs. At the same time, one parameter that certainly has a high influence on power output is the finite diffusion of the reactant gases to the active sites. One means of influencing the mass transport of gases is by their ionomer content [
4,
27,
28]. While enough ionomers need to be present to enable good proton conductivity, too much ionomer content inhibits mass transport by retaining larger amounts of product water and by forming thicker polymer films around the catalyst [
4,
27]. In the humidity range of 30 to 60% relative humidity (cathode), optimal ionomer content was determined to be between 25 and 40 wt% with an ionomer-to-carbon (I/C) ratio between 0.7 and 1 [
27,
28]. In addition, investigations in a very early stage of PEMFC technology showed that the porosity and thickness of the active layer and GDL play an important role in the diffusion processes [
29]. More recent experimental studies performed by J. Lee et al. could find hard evidence for the nature of this effect [
38]. Using synchrotron X-ray radiography, the liquid water content of two GDLs with identical material and of different thickness was determined. Using EIS, it was determined that the diffusion resistance was increased for the GDL, which was 80 µm thicker. The presented EIS data also revealed an influence on the electrolyte resistance. Since the thicker GDL retained more liquid water, the membrane was better wetted and more conductive of protons. This led to an average decrease of the high-frequency resistance (electrolyte resistance) by 9 × 10
−3 Ω cm
2 (~10% of the measured values).
Another, less-studied way to influence mass transport could be the thickness of the catalyst layer, as the mean diffusion length of the gases will be higher for thicker catalyst layers. The first signs of this effect were measured by N. Wagner et al. in their studies on electrode composition, however, the effect was not the focus of that particular study [
7]. To study the gas-permeability properties of a catalyst layer it is important to know that the ink composition (I/C ratio, solid content), rheological properties and method of coating strongly influence the proton- and oxygen-transport properties of the resulting catalyst layer [
39,
40]. It is important to control these parameters during experiments concerned with studying the oxygen permeability of catalyst layers.
The influence of platinum distribution on the diffusion resistance was investigated by J. P. Owejan et al. and a small change in transport resistance was observed when varying the platinum’s dispersion at low platinum loadings of 0.025 mg
Pt/cm
2 [
30]. A model describing the impact of catalyst-layer geometry on water management was presented in the early 2000s and came to the conclusion that the porosity and thickness of the catalyst layer determine the water-content and wetting properties of the catalyst layer and membrane [
41]. However, to the best knowledge of the authors, there is no thorough experimental study in the literature concerning the effect of the catalyst layer thickness on the transport of gases to the active sites and its effect on EIS signals.
The scope of this work is to present an equivalent circuit model, which includes both approaches presented by Wagner–Schulze and Pivac–Klotz [
7,
8,
11,
42] for complete simulation of the low frequency impedance spectrum. Experimental data obtained from in-house manufactured MEAs is presented and the combined model is applied for the optimization work of the catalyst-layer structure and the identification of crucial parameters influencing voltage loss during polarization.
2. Experimental
2.1. Materials and Methods
All materials used were standard components already well-studied in the literature, to exclude unknowns from material properties.
Two platinum-on-carbon analogues, HiSpec 3000 (nominally 20 wt% Pt on carbon) and HiSpec 4000 (nominally 40 wt% Pt on carbon), were used as catalysts to fabricate catalyst layers. NS 5 Nafion—ionomer dispersion of 5 wt% in water/isopropanol was used and purchased from QuinTech (QuinTech e.K., Göppingen, Germany). The electrolyte for RDE-CV measurements consisted of Merck, Suprapur, 70%, diluted by Milli-Q, 18.2 MΩ cm. Ag|AgCl was used as a reference and a Pt wire as a counter electrode. The working electrode was a glassy carbon disc embedded in Teflon (Pine Instruments Company, Grove City, PA, USA) with a geometric surface area of 0.196 cm2. Polishing paste for the working electrode was Al2O3 paste with particle size 0.05 µm purchased from Buehler (Buehler AG, Uzwil, Switzerland).
For MEA preparation, standard NM212 Nafion membranes with a thickness of 50 µm were used to minimize hydrogen crossover effects during the experiments. Sigracet 39 BC carbon coated carbon paper was used as GDL.
An ExactaCoat OP3 Ultrasonic Spray Coater (Sono-Tek Corporation, Milton, NY, USA) with a 120 kHz nozzle was used to prepare catalyst coated membranes with exact thickness control.
The cell hardware consisted of a 25 cm2 single cell (S++ simulation services, Murnau-Westried, Germany), using a triple serpentine flow field on both sides. The integrated segmented plate allows the measurement of current and temperature distribution. Current and potential were controlled by a Zahner IM6ex potentiostat combined with a PP240 power-potentiostat for high current loads (Zahner-elektrik GmbH & Co. KG, Kronach-Gundelsdorf, Germany). For RDE-CV a CompactStat (Ivium Technologies B.V., Eindhoven, The Netherlands) potentiostat was used.
2.2. MEA Preparation and Single Cell Assembly
Electrocatalyst ink preparation—Two different catalyst inks were used for this study. One containing the HiSpec 3000 and the other containing the HiSpec 4000 catalyst. In both cases, the ionomer content within the ink was kept constant at 30 wt% of the dry electrocatalyst mass. This resulted in I/C ratios of 0.8 for HiSpec 4000 and 0.6 for HiSpec 3000. The mass concentration of electrocatalyst inks was 4 mgcatalyst per mL of solvent. To obtain stable inks, ratio of 97:3 between 2-propanol and water (Milli-Q) was used.
Prior to the preparation of the catalyst-coated membranes (CCMs), all electrocatalyst inks were ultrasonicated for 45 min in an ice-cooled ultrasound bath.
Electrocatalyst loading determination and CCM preparation—For preparation of all the CCMs, an Ultrasonic Spray Coater (Sonotech ExactaCoat OP3) with a 120 kHz nozzle was used. Three MEAs were prepared with varying cathode compositions. Two cathodes were prepared using the HiSpec 4000 catalyst with Pt-loadings of 0.125 and 0.250 mg
Pt cm
−2. One MEA was prepared with a cathode of HiSpec 3000 and 0.125 mg
Pt cm
−2. The Pt loading and the electrocatalyst were kept constant for the anode at 0.05 mg
Pt cm
−2 using the HiSpec 3000 catalyst. Prior to the preparation of the CCMs a gas diffusion layer (Sigracet 39 BC) was first coated to determine the number of necessary spraying cycles (weight per cycle) to reach the desired loading. For that, 60 layers of each catalyst ink were sprayed on the GDL. This experiment was performed three times to ensure repeatability. The mass change was noted and averaged to determine the weight of electrocatalyst per spraying cycle. For the preparation of the CCMs, the electrocatalyst inks were sprayed directly on the Nafion NM212 membrane, which was fixed on a heated, porous, PTFE substrate using vacuum suction. Care was taken to ensure that the surface temperature of the membrane fixed onto the substrate remained at 80 ± 1 °C. After the spray process, the CCMs were left to dry on the substrate for fifteen minutes. The prepared MEAs are listed in
Table 1.
2.3. Electrochemical Measurements (RDE-CV, In-Situ ECSA, Single Cell Polarization and EIS Measurements)
RDE-CV measurements were performed to determine the difference in activity and electrochemically active surface area (ECSA) between the two commercially available catalysts used in this study, supporting the determination of structural differences using STEM measurements. These were conducted in a two-compartment electrochemical cell in 0.1 M HClO
4 electrolyte with a conventional three-electrode system. The Ag|AgCl reference was separated from both the working and counter electrode via a salt bridge to avoid Cl
− ion contamination. Prior to each experiment, the two-compartment electrochemical cell was boiled in Milli-Q water for 1 h, and the electrode was polished to a mirror finish with a polishing cloth and with Al
2O
3 paste. Then, 20 µL of 1 mg mL
−1 water-based well-dispersed electrocatalysts ink was pipetted on the glassy carbon electrode, completely covering it, and was dried under ambient conditions. Afterwards it was immersed in an Ar-saturated electrolyte under potential control at 0.05 V
RHE. Both electrocatalysts were electrochemically activated (EA) for 200 cycles between 0.05 and 1.2 V
RHE with a scan rate of 300 mV s
−1 with 600 rpm of rotation. After EA, the electrolyte was exchanged with a fresh one and the electrode was removed from external potential control (i.e., the conditions corresponded to the open circuit potential—OCP). ORR polarization curves were measured in an oxygen-saturated electrolyte with rotation at 1600 rpm in the potential window 0.05–1.0 V
RHE with a scan rate of 20 mV s
−1. For ECSA determination by CO-stripping, the electrolyte was purged with CO under potentiostatic mode (0.05 V
RHE) to ensure successful CO adsorption. Afterwards the electrolyte was saturated with Ar. CO electrooxidation was performed using the same potential window and scan rate as in ORR, but without rotation and in an argon-saturated electrolyte. After subtraction of background current due to capacitive currents, kinetic parameters were calculated at 0.9 V
RHE by using the Koutecky–Levich equation [
43]. The electrochemically active surface area (ECSA
CO) was determined by integrating the charge in CO-stripping experiments, as described in reference [
44].
Cell assembly, break-in and in-situ ECSA measurement—The finished CCMs were placed in between two gas-diffusion layers (Sigracet 39 BC) and fixed into a commercial 25 cm2 testing-cell (S++ Simulation Services) using a triple serpentine flow-field on a graphite bipolar plate on both sides. After gas-tightness check, the cells were fixed into a fully automated in-house testing station with humidity monitoring shortly before and after the cell inlets to ensure correct reactant gas humidification. The gas inlet temperature was controlled at 85 °C and cell temperature was kept at 80 °C. Electrochemical measurements were recorded using an IM6ex modular electrochemical workstation coupled with a PP240 power-potentiostat (Zahner-elektrik GmbH & Co., KG, Kronach-Gundelsdorf, GER). Cell break-in consisted of a potential ramp-up and ramp-down (3.3 mV s−1), from 0.4 to 0.6 V, by holding the potential for thirty seconds at 0.5 V, 0.6 V and 0.7 V in between. The reactant gases supplied during break-in were 600 mL min−1 air/H2, at atmospheric pressure and 100% RH. Afterwards, hydrogen crossover was tested to ensure membrane integrity was not affected by the coating process and cell assembly. The cells were supplied with H2/N2 500 mL min−1 100% RH until OCV was stable at 0.125 V, indicating that the cathode side was air-free. Then a linear sweep with 1 mV s−1 from OCV to 0.5 V was recorded. This was repeated for an excess pressure on the hydrogen side of 0 mbar, 50 mbar and 100 mbar. Membrane integrity was confirmed if the crossover current density did not exceed 15 mA cm−2 over the potential range of the sweep; it did not exceed 1 mA cm−2 for any MEA studied.
After the cross-over tests were successfully performed, the pressure difference between anode and cathode was reset to 0 mbar and the potential swept with 50 mV s−1 and between 70 and 600 mV for three cycles to determine in-situ ECSA. The third cycle was used to calculate the ECSA from the HUPD—peak charge (determined via integration of the peak), using the specific platinum charge of 210 µC cmPt−2.
Single-cell polarization measurement was performed in the 25 cm2 cell using a triple serpentine flow field, initial gas conditioning was performed with gases bypassing the cell. Only when desired conditions were achieved were the gases supplied to the cell. All polarization curves were recorded with a reactant gas supply of H2/air at 1.5 bar (g), 60% RH and 600 mL min−1 constant flow. This is equivalent to an air stoichiometry of 1.2 at the highest current density recorded (1.2 A cm−2), while over the whole polarization curve, the hydrogen stoichiometry was above 2.9. This way the influence of the anode’s limitations can be neglected. All polarization points were recorded in galvanostatic mode, over a period of 5 min, in steady state operation.
Electrochemical Impedance Spectra (EIS)—Operating points were held for at least five minutes before recording, to achieve steady-state conditions. The impedance was recorded between 50 kHz and 0.1 Hz with an amplitude of 8% of the operating point. The operating conditions were kept exactly the same as for polarization recording. Simulation and fitting of the impedance spectra were performed with the software ZView® (Scribner Associates Inc., Sounthern Pines, NC, USA).
2.4. Structural Analysis of the Catalyst Powders and MEA Cross Sections
Structural TEM analysis of the two catalyst powders was carried out in a probe Cs-corrected scanning transmission electron microscope Jeol ARM 200 CF equipped with a SDD Jeol Centuria Energy-dispersive X-ray (EDX) spectrometer. The operational voltage was set to 80 kV. High-angle annular dark field (HAADF) images were taken with at 68 and 180 mrad for the inner and outer semiangles. The convergence angle was set to 25 mrad.
SEM analysis of the MEA cross sections was carried out in a field emission scanning electron microscope Zeiss Ultra+ equipped with an SDD X-MAX 50 Energy-dispersive X-ray (EDX) spectrometer. Cross-sectional images were taken at 1 kV (50 pA) with standard secondary electron (SE) detector. Phase-contrast images were acquired with an Energy Selective Backscattered detector (EsB) at 1 kV (50 pA) and the energy-filtering grid was set to 400 V. EDX analysis was acquired at 7 kV with a probe current set to 200 pA. Prior to the SEM analysis, cryo-cut samples were mechanically prepared by razor blade while submerged in liquid nitrogen.
The powder X-ray diffraction (XRD) measurements of the benchmark catalysts were carried out on a PANalytical X’Pert PRO MPD diffractometer with Cu Kα1 radiation (λ = 1.5406 Å) in the 2θ range from 10° to 60° with a 0.034o step per 100 s, using a fully opened X’Celerator detector. Samples were prepared on a zero-background Si holder.
2.5. Simulation
For the construction of our new equivalent circuit model, the base models from literature were integrated and extended in order to ensure the correct simulation of the low frequency range of EIS. In addition, it is important to estimate the correct order of magnitude of the starting values in order to find meaningful parameter values to the measured data. Otherwise, the fitting algorithm could be trapped in a local minimum and could find a solution with physically impossible values.
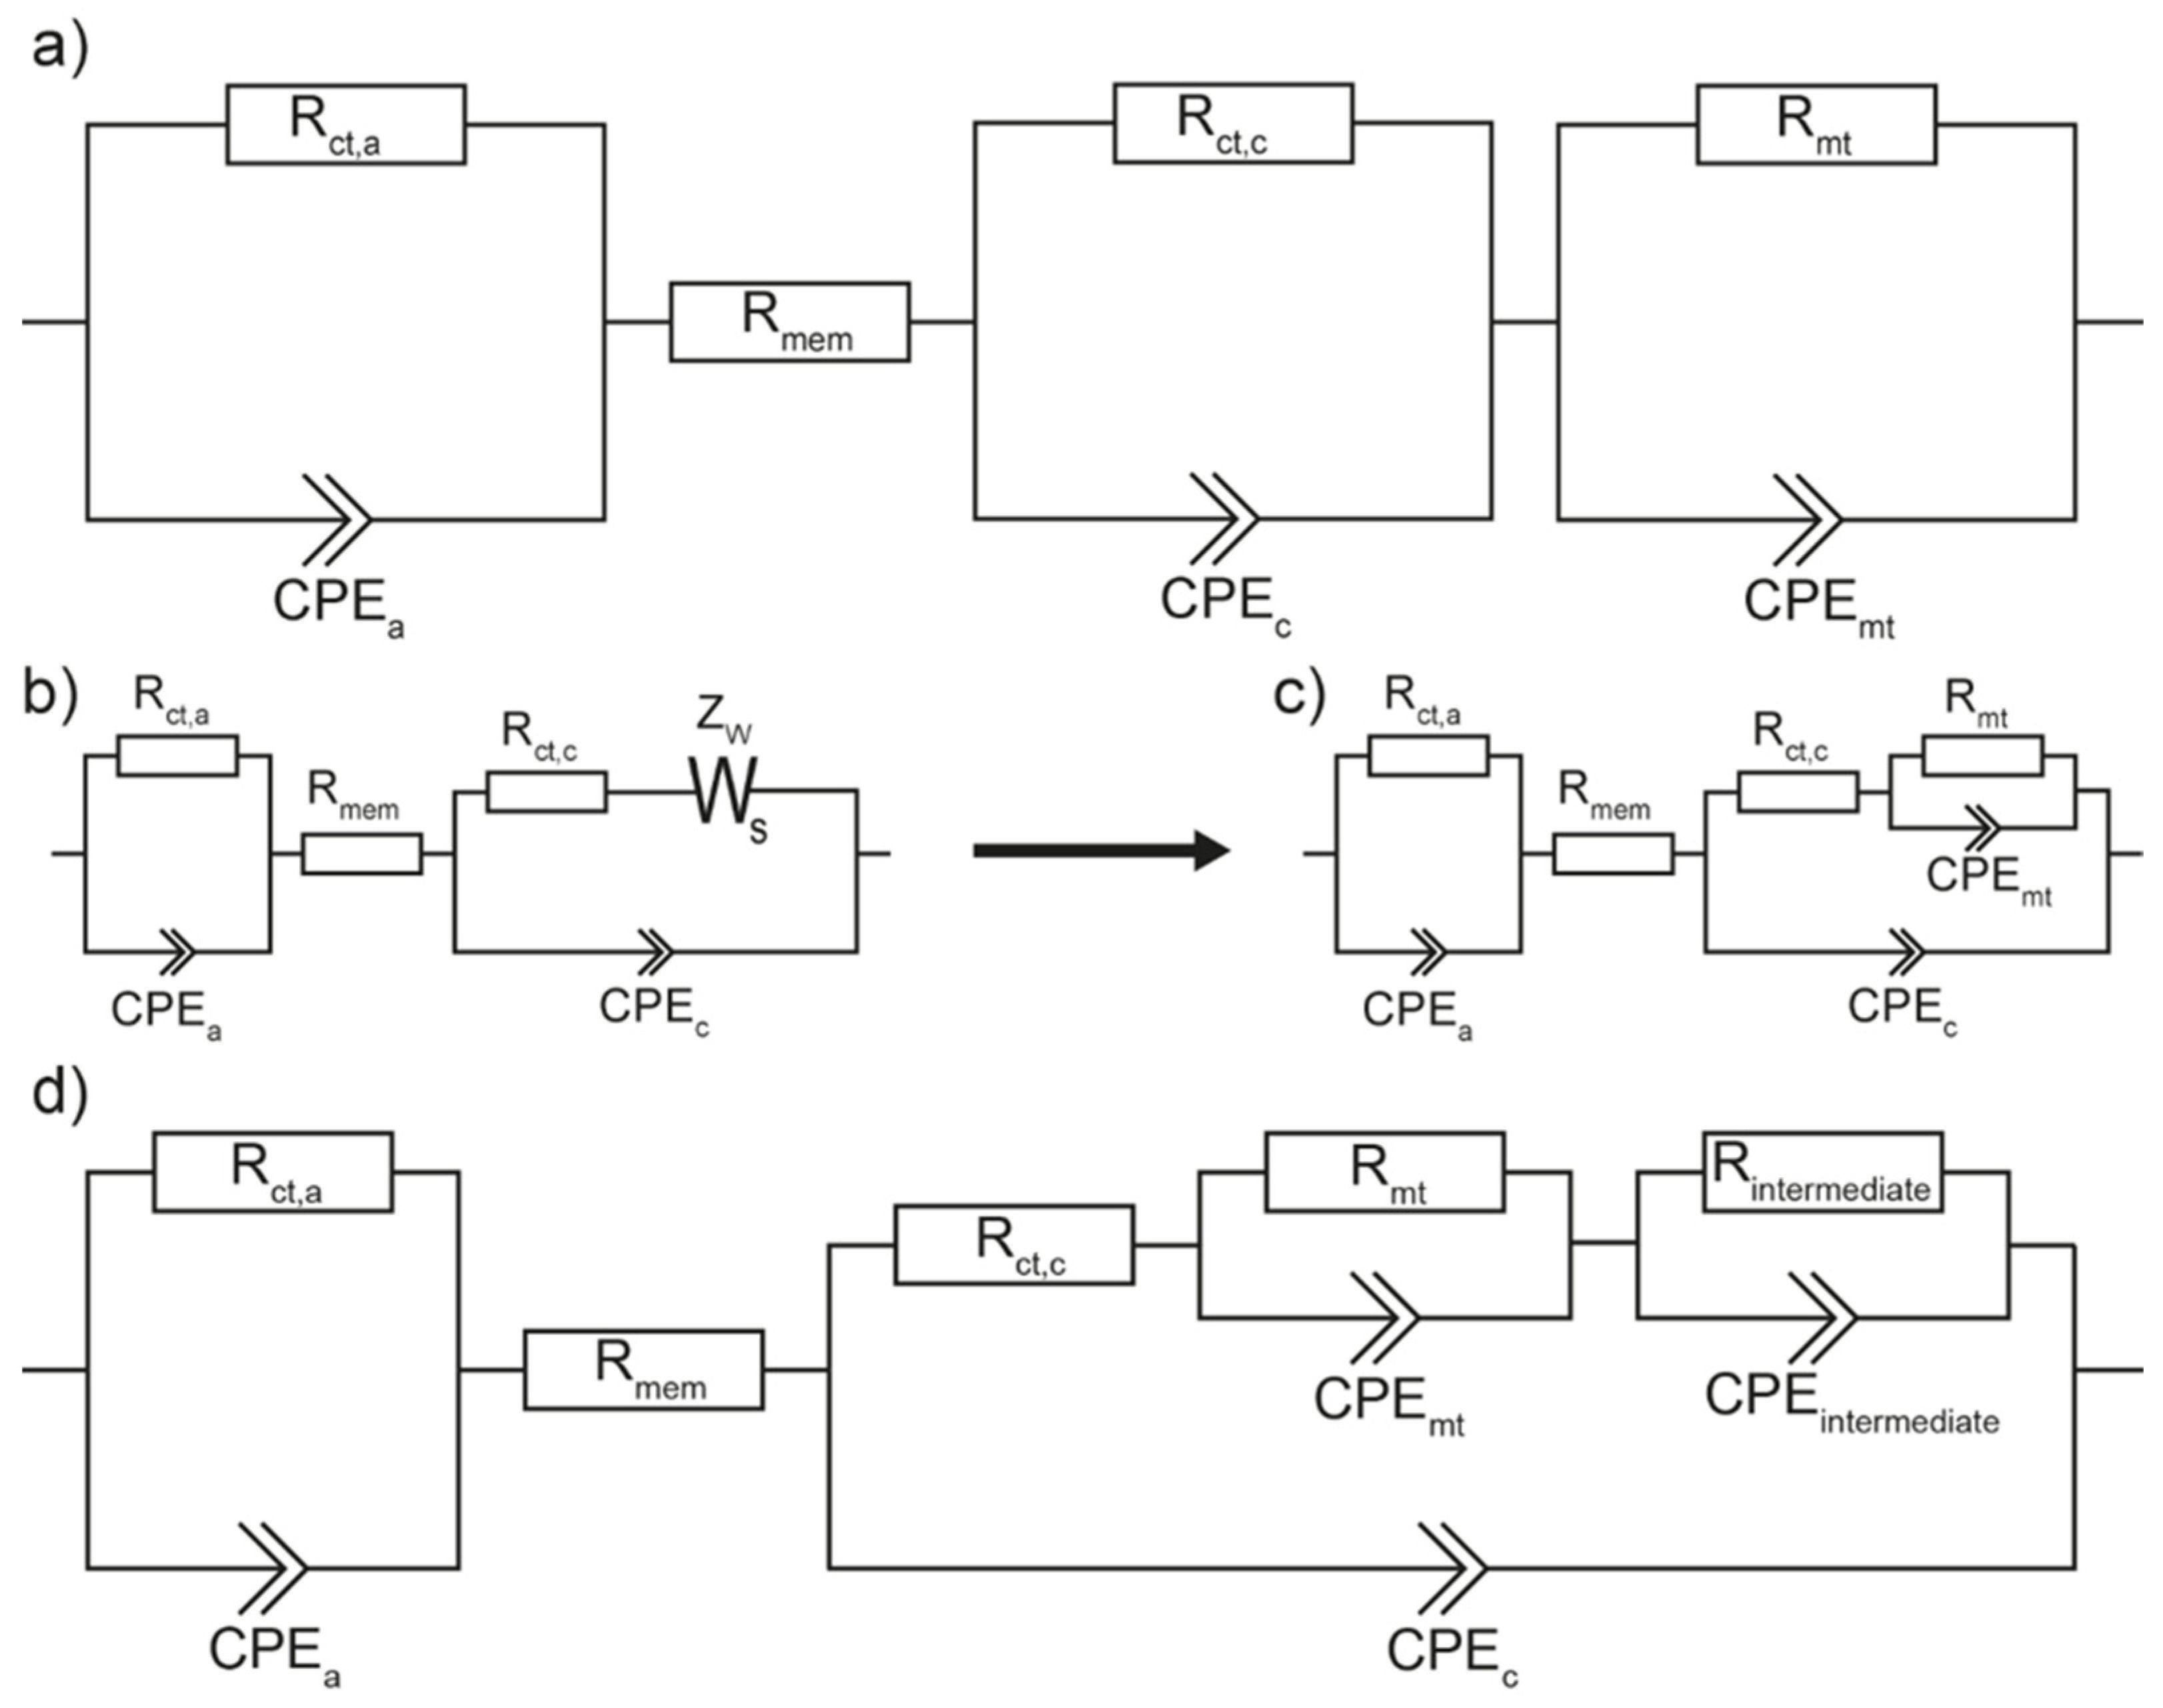
Therefore, a first visual inspection of our impedance spectra was performed to get first estimates of the parameters and the underlying processes. With these estimates, the values of the equivalent circuit model from Wagner, Schulze et al. (see
Figure 1a) were evaluated in a second step.
This equivalent-circuit model, called Model 1 hereafter, consists of a resistance Rmem illustrating the membrane resistance. Then three R-CPE elements are in series with Rmem. The first two R-CPE elements (Rct,a-CPEa, Rct,c-CPEc) represent the charge transfer at the anode and cathode side, respectively, and the electrochemical double layer capacitance between the respective electrodes and electrolyte.
The third R
mt-CPE
mt element stands for the finite diffusion of the oxygen through the gas diffusion layer and catalyst layer to the active sites and can be associated with the NFLI-loop in the impedance spectra [
7,
8,
9,
10,
11]. The starting point of our proposed extended equivalent circuit model, called Model 2 hereafter, is the equivalent circuit model illustrated in
Figure 1b. In this model, the membrane resistance R
mem is again in series with the R
ct,a-CPE
a element and in series with a Randles circuit, that describes the charge transfer and the electrochemical double layer capacitance at the cathode side (R
ct,c, CPE
c) and the diffusion of oxygen to the active sites (Z
W).
In a next step, the finite length Warburg impedance is substituted by an R
mt-CPE
mt element (see
Figure 1c). This simplification is justified because the finite length Warburg element can be also represented as a finite series connection of R-CPE elements, which can be combined to one R-CPE element [
45,
46,
47,
48,
49]. Until now, the semicircles for the charge transfer at both electrodes as well as the NFLI-loop can be evaluated, but the PFLI-loop is neglected. Therefore, to conclude Model 2, the equivalent circuit model of D. Klotz is incorporated into the model by placing an R
intermediate-CPE
intermediate element in series with R
ct,c and the R
mt-CPE
mt element (see
Figure 1d). The values of R
intermediate and Q in the CPE
intermediate are negative.
As all impedance spectra are recorded in the linear region of polarization curve, an estimate for Rintermediate can be found by subtracting the low frequency intercept of the real axis from the slope of the polarization curve at the respective operating point. In all cases the resistance estimate was approximately −7 mΩ. Value estimates for the negative Q value of the CPE were obtained from the time constant at which the maximum of the PLFI-loop was identified in the spectrum.
To consider the inductivity of the measuring cables both models, Model 1 and Model 2, have an inductance in series to Rmem.
To check for physical correctness, the following criteria were used:
The characteristic frequency of each RC-element should be in the correct order of magnitude: 1.1–1.4 Hz for Rmt, 50–200 Hz for Rct,c and 600–3000 Hz for Rct,a.
The sum of all positive resistances should be equal to the low-frequency intercept in the corresponding EIS spectrum.
For the CPE, values of P should be 0 < p ≤ 1.
Kramers–Kronig (K–K) and ZHIT analysis was performed on the measured impedance data. For more detailed information, see
supporting information.
To check for numerical correctness, the following criteria were used:
3. Results and Discussion
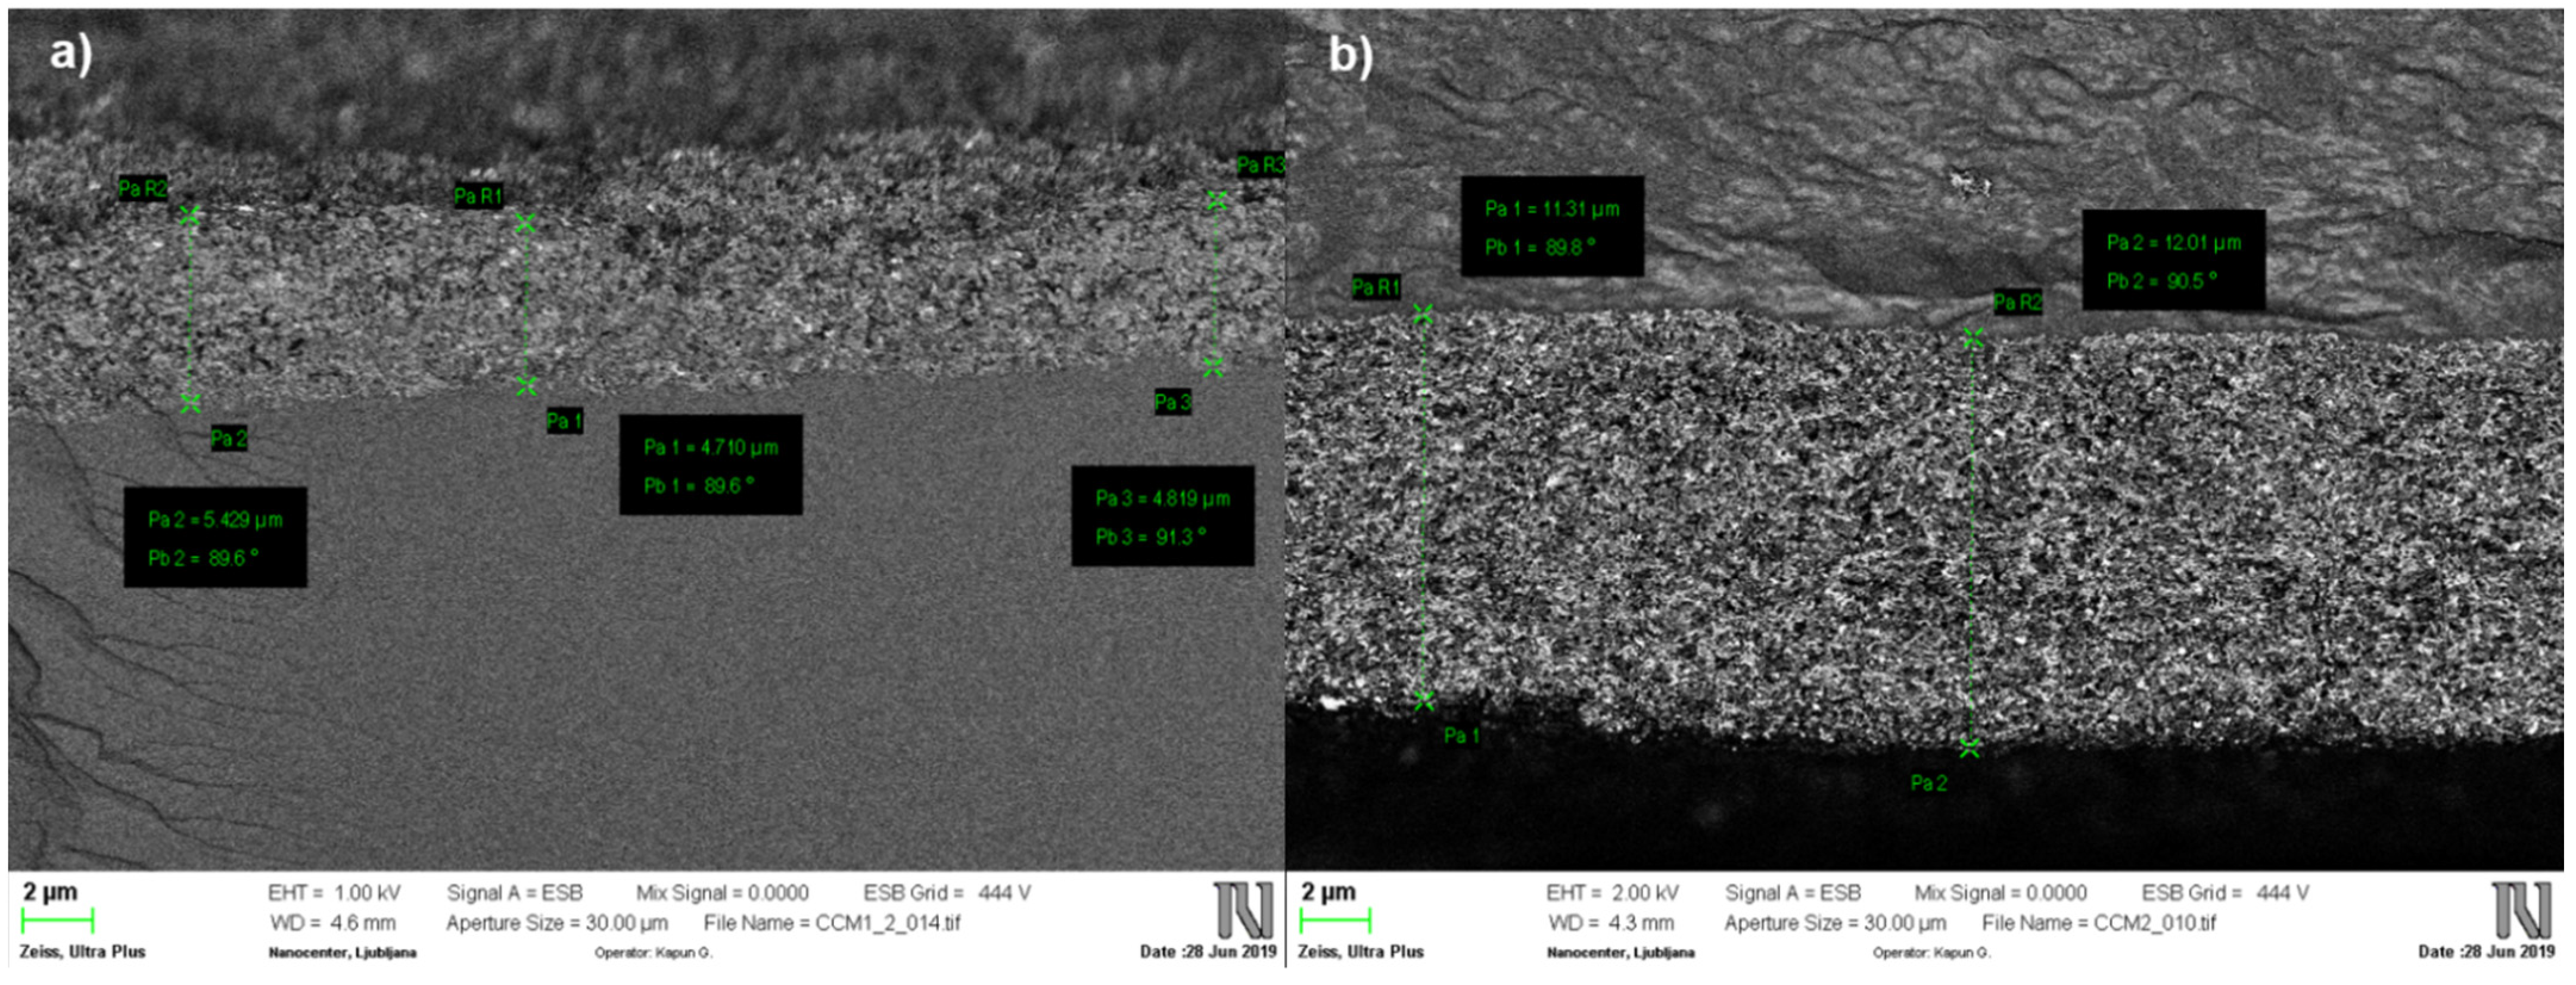
Cross sectional SEM results in
Figure 2 and the summary in
Table 2 show that the catalyst layer thickness is increased either by keeping the catalyst loading constant and decreasing the ratio of platinum in the catalyst, or by increasing the loading. While a catalyst layer using HiSpec 4000 with 40 wt% Pt on carbon and 0.125 mg
Pt cm
−2 resulted in an average thickness of 4.4 µm, the thickness increased by the factor 2.7 when the catalyst was changed to HiSpec 3000 with 20 wt% Pt on carbon. On the other hand, when the loading was reduced by a factor of 2.5 with the same ink-composition, the thickness decreased by a factor of 2.7.
Table 2 shows that acceptably high precision and repeatability was achieved with the coating process. The error in between different spraying processes was determined to be 7.0–8.0%, confirming good repeatability. The good uniformity of the sprayed material is indicated by the low random deviation of the thickness at different locations of the same sample (2.2–5.7%).
STEM and XRD analysis of the catalyst powders, reported in
Figure 3, showed that lower platinum content led to a finer distribution of the platinum and therefore smaller particle sizes. On average, the platinum particles are smaller on HiSpec 3000 with 20 wt% of platinum on carbon then on HiSpec 4000 with 40 wt% of platinum on carbon.
The XRD spectra show that platinum crystallite size is increasing in the following order: Hi-spec 3000 < Hi-spec 4000. According to the conclusions made by J. P. Owejan et al. [
30] this should lead to slightly increased diffusion resistance at the same catalyst layer thickness for the MEA using HiSpec 4000. Additional factors influencing oxygen and proton transport in the catalyst layer are the I/C ratio and rheological properties of the ink used for the coating process [
39,
40]. Since the I/C ratio is slightly lower in the HiSpec 3000 catalyst layers, the porosity and ionomer distribution will inherently be different then in HiSpec 4000 catalyst layers. In summary, the resistance stemming from oxygen transport increases with decreasing platinum surface area under constant platinum loading and with the same ink composition of the coating process.
Results of RDE-CV analysis can be seen in
Figure 4. The values for mass activity, surface activity and ECSA are found in
Table 3. These show very well that the catalysts have very similar specific (surface) activities, indicating that the particles have very similar crystal lattice structures at the surface. However, the much larger ECSA of HiSpec 3000, results in an almost doubled mass activity. This is the effect of the finer distribution of Pt on the carbon surface, leading to smaller particles.
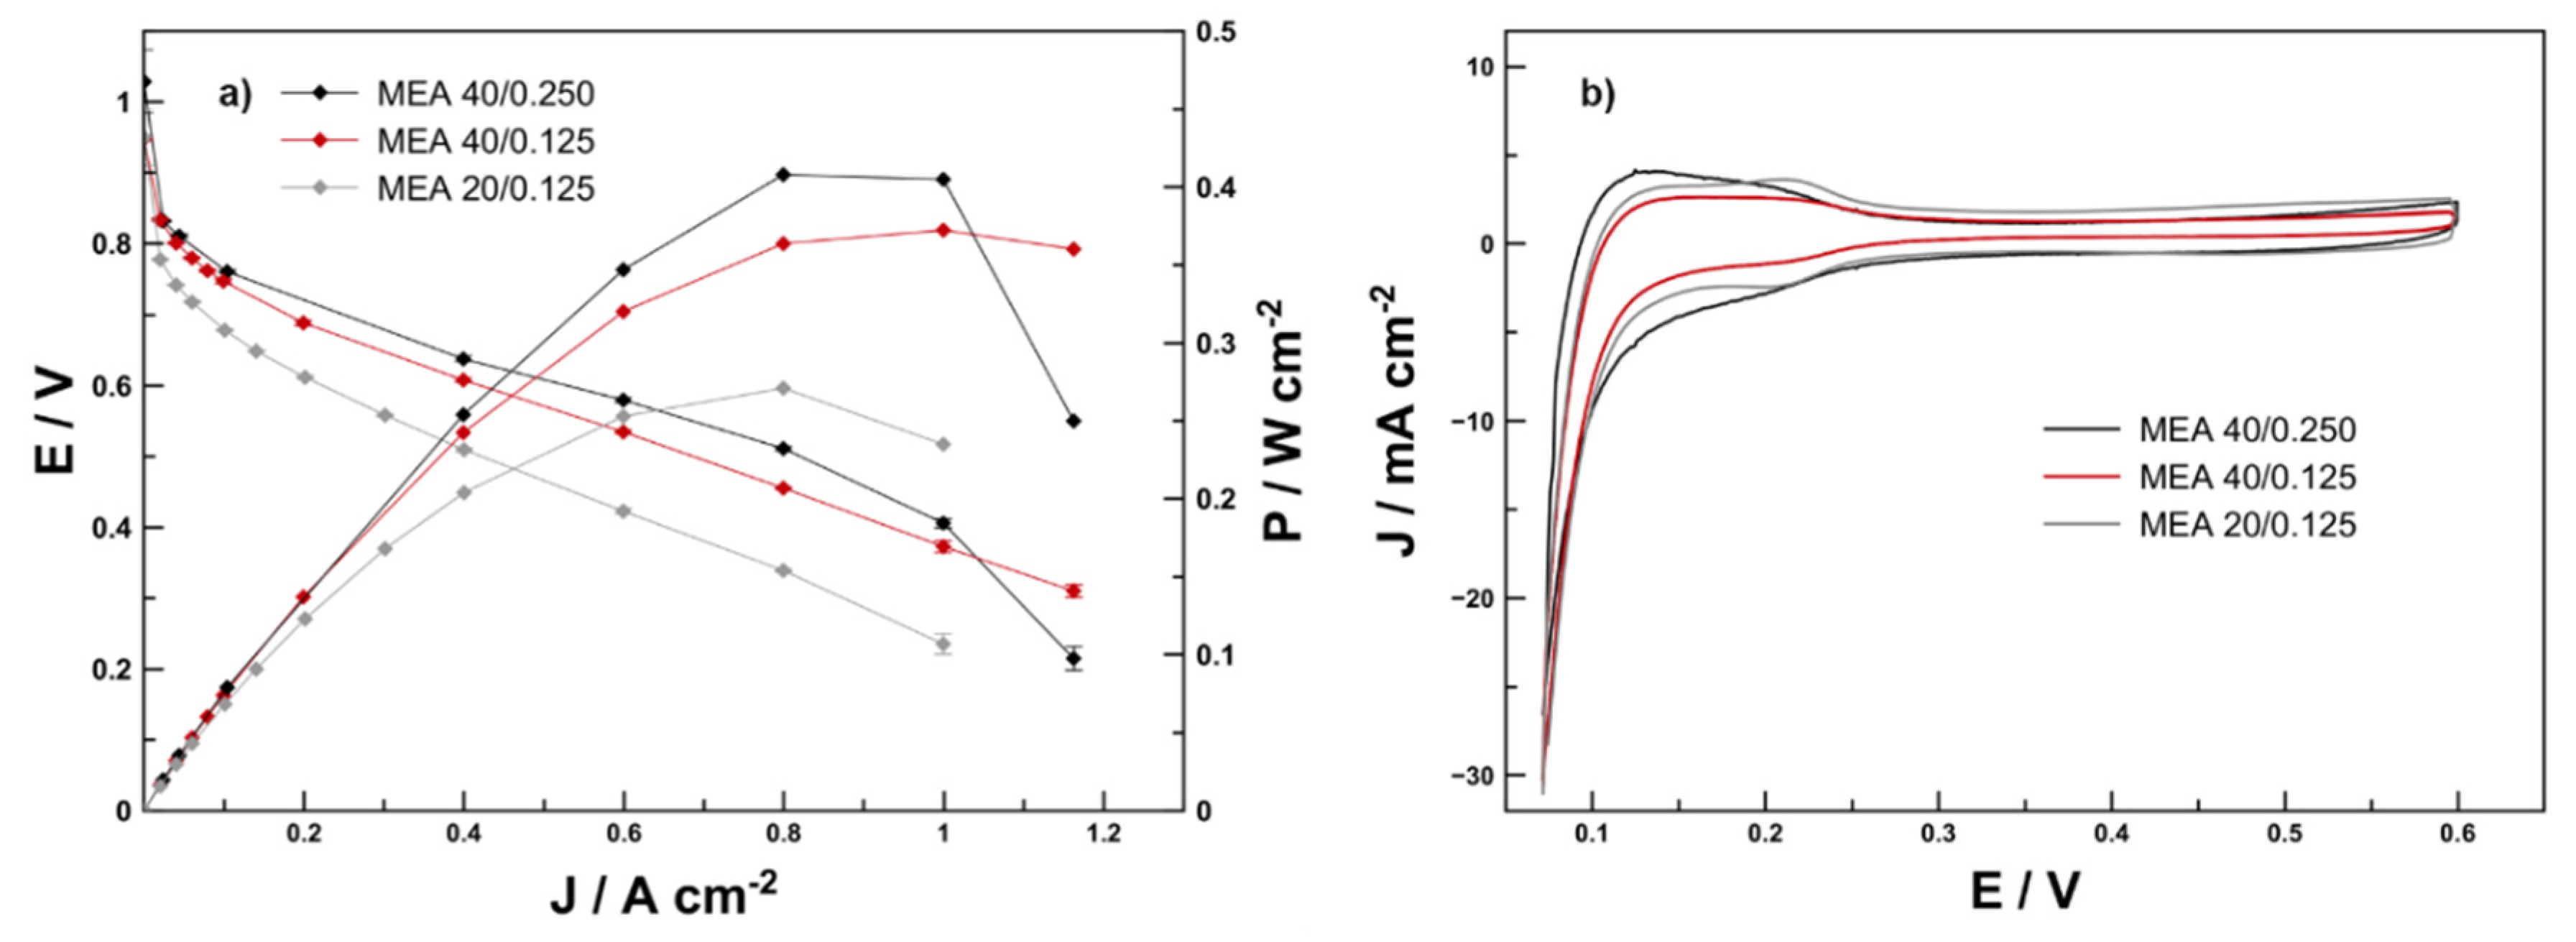
The results of the in-situ ECSA measurements are seen in
Figure 5b. Evaluation showed that in-situ ECSA values are very similar for the cathodes of MEA 40/125 and MEA 40/250 as they were prepared using the same ink-composition. The value calculated from the HUPD peak integral was 43 m
2 g
−1 for MEA 20/0.125, while it amounted to 33 and 35 m
2 g
−1 for MEA 40/0.250 and MEA 40/0.125, respectively. The last two were prepared using the same ink, while the first one had a slightly lower I/C ratio (0.6 vs. 0.8) and HiSpec 3000 as a catalyst. This is consistent with the results of ex-situ ECSA—HiSpec 3000 had a much higher ECSA then HiSpec 4000. There seems to be a difference between the in-situ and ex-situ values. While ex-situ ECSA was generally higher and increased by a factor of 1.6 (comparing HiSpec 4000 vs. HiSpec 3000), in situ the factor was 1.3. This is attributed to the difference in I/C-ratio between the HiSpec 3000 and HiSpec 4000 catalyst layers and the general difference in the measurement setups (different electrolyte and atmosphere). Nevertheless, the trend is very similar.
The polarization curves of the three membrane electrode assemblies are compared in
Figure 5a. As expected, MEA 40/0.250 showed the highest performance with peak power density of 404 mW cm
−2.
In contrast MEA 40/0.125 showed a performance of 390 mW cm−2 and MEA 20/0.125 reached 350 mW cm−2. When normalized to the platinum loading, the highest-performing was MEA 40/0.125 with 2.3 kW gPt−1 followed by MEA 20/0.125 with 2 kW gPt−1 and MEA 40/0.250 with 1.4 kW gPt−1. Large deviation from linear behaviour is recognisable for MEA 40/0.250 and MEA 20/0.125 starting at 0.8 A cm−2. Contrary to this, MEA 40/0.125 shows only a small deviation from linear behaviour starting at 0.8 A cm−2. This is a sign for the influence of catalyst layer thickness: the two MEAs with a 11.7-µm thick catalyst layer seemed to be affected, to a greater degree, by diffusion limitation than the MEA 40/0.125 with a 4.4-µm thick catalyst layer. This is even more visible from the steeper drop in power density after the maximum power point is reached.
The EIS measurements were performed to determine the voltage loss contributions and confirm the presented equivalent circuit model. The model by N. Wagner (Model 1) and our extended model (Model 2) were used to simulate the curves. An exemplary simulation result, from each model, can be seen in
Figure 6. The deviation between simulated and measured data is represented by the sum of squares and the relative residuals. In the case of Model 2, a low sum of squares of 0.07–0.02 at every operating point and with every MEA dataset was found.
Using Model 1, low values around 0.02–0.04 were only obtained when simulating in the negative impedance plane for low frequency, without consideration of data in the positive impedance plane. This can be seen as the inability of Model 1 to simulate a signal as soon as the imaginary impedance becomes positive again in the low-frequency region. This limitation is also clearly shown in
Figure 6, as the simulation curve of Model 1 simply stops at the
x-axis crossing and points that should appear in the positive impedance plane are simply shifted into the negative plain. This leads to high deviations from the dataset with a sum of squares between 0.1–0.3. Relative residuals between model and experimental data further show the high inaccuracy of Model 1.
Our extended Model 2 was able to correctly simulate the completely measured frequency range, including the PLFI signals with sum of squares of 0.02–0.05, indicating the lower deviations of simulation and experimental data. Relative residuals between model and experimental data are very low and reach maximum values of 1% for all measured impedance spectra. For these reasons, the data calculated from Model 2 is much more trustworthy than data calculated by Model 1.
The characteristic frequencies for the anode charge transfer elements obtained were in the region of 3000–600 Hz, while the cathode charge transfer elements resulted in characteristic frequencies of 400–60 Hz. Both models resulted in very similar characteristic frequencies for the equivalent circuit elements. Diffusion-related resistance elements resulted in much lower characteristic frequencies of 1–1.2 Hz and the corresponding semicircles are also well visible at the same frequency in the EIS data. These characteristic frequencies correspond to visible semicircle maxima in the measured impedance spectra.
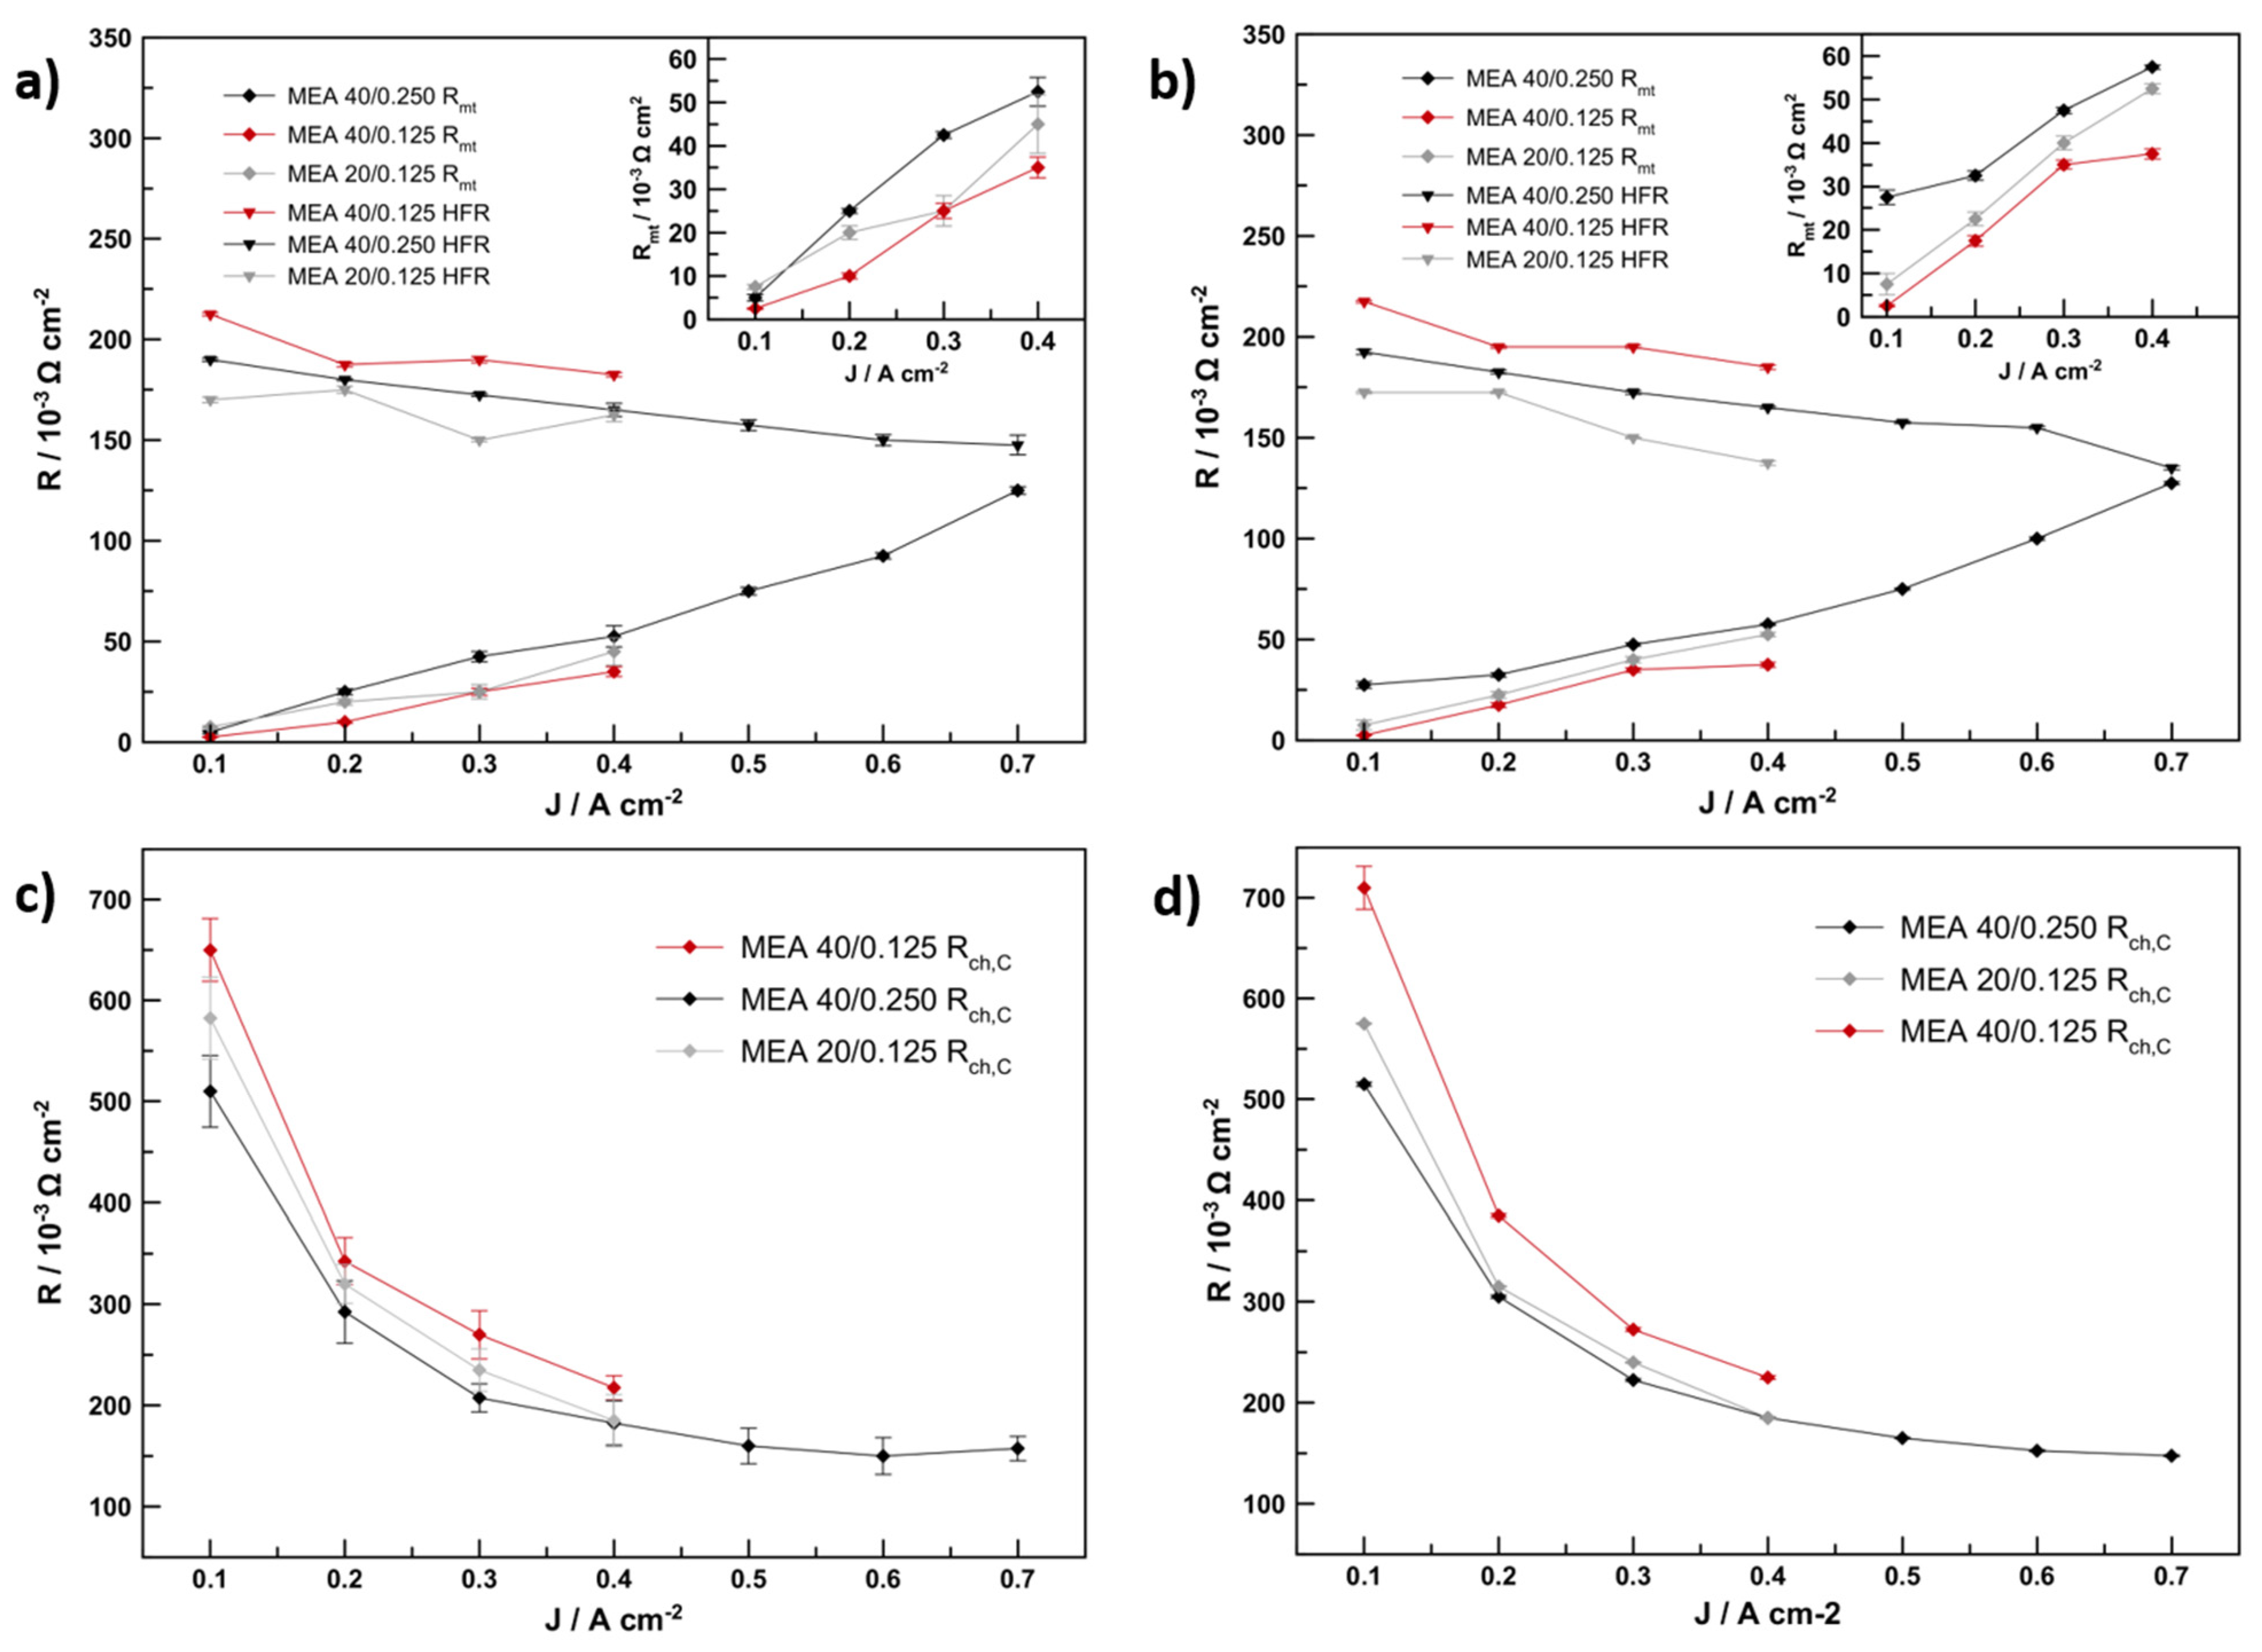
The trend of the cathode charge transfer resistance, R
ct,c, in
Figure 7, is very similar if the results of Models 1 and 2 are compared and no significant change can be observed. A decrease of charge transfer resistance and an approximation to a final value is indicative of the kinetic nature of this resistance contribution. Overall, MEA 40/0.125 showed the highest R
ct,c, while MEA 20/0.125 and MEA 40/0.250 showed similarly lower values. This is consistent with the activity trend determined on the RDE (
Figure 4). HiSpec 3000 was determined to be 1.5 times more active (mass activity) than HiSpec 4000 and MEA 40/0.250 which contained 0.250 mg
Pt cm
−2 in the cathode, while MEA20/0.125 contained only 0.125 mg
Pt cm
−2 in the cathode.
The high-frequency resistance of the MEAs, which is the sum of the current collector’s and electrolyte resistance, is strongly influenced by the catalyst-layer’s thickness. MEA 40/0.125, with the thinnest catalyst layer, has the highest electrolyte resistance: the electrolyte resistance determined with Model 2 from the measured data is, on average, 9% lower for MEA 40/0.250 and 17% lower for MEA 20/0.125 than the average electrolyte resistance of MEA 40/0.125. This is consistent with data and models presented by other researchers that show a clear impact of the thickness and porosity of the catalyst layer and the GDL on the water content in the electrodes and membrane [
38,
41].
The element errors for the diffusion related circuit elements were slightly higher for Model 1 at current densities between 0.3 and 0.7 A cm
−2 than the errors calculated in Model 2. While Model 2 produced errors of 1.5 to 4%, Model 1 produced errors of 6–10%. Both models produced high errors of >10% at 0.1 A cm
−2, indicating their limits for the determination of diffusion resistance (R
mt). This can be seen in
Figure 7a,b where the modelled diffusion resistance is plotted against the current density with the corresponding errors of fit shown as error bars. The trend described by both resistances confirms that a significant increase in diffusion resistance is the result of doubling catalyst layer thickness from 4.4 to 11.7 µm. EIS of MEA 40/0.125 (4.4 µm cathode catalyst layer) consistently resulted in lower R
mt values in the measured range then MEA 20/0.125 and MEA 40/0.250 (both ~12 µm cathode AL). In average R
mt was 264% higher for MEA 40/0.250 and 67% higher for MEA 20/0.125 than R
mt determined for MEA 40/0.125. The difference in these numbers can be explained by the different current trend in R
mt of MEA 20/0.125, which is in between that of MEA 40/0.250 and MEA 40/0.125 when considering Model 2. This could be either an effect of the slightly better platinum particle distribution and surface of the HiSpec 3000 catalyst (
Figure 3), or the lower I/C ratio (0.6 vs. 0.8). Most probably, the sum of both effects was measured [
30,
39,
40]. A mechanistic explanation for this increase in R
mt can be found in the previously presented modelling and experimental studies. With similar electrode composition, the water content of the catalyst layer, membrane and GDL was found to be influenced by their thicknesses and porosities [
38,
41], with thicker layers retaining higher volumes of product water. These higher volumes of liquid water in the catalyst layer present a diffusion barrier that blocks the movement of the reactant gases to the active sites. While this effect was studied for the GDL in an experimental study by J. Lee et al. [
38], it has only been theoretically discussed in a modelling study by M. Eikerling [
41].
The trend in
Figure 7a,b also shows that this increase in R
mt can become a relevant total for cell performance at current densities above 0.5 A cm
−2, as it approaches the values for charge transfer and high frequency resistance, finally constituting ~1/3 of the cell’s resistance in the negative impedance plane above 0.6 A cm
−2.
The physical nature of the PLFI signal can be discussed in theory and the most plausible assumptions can be made based on the explanation provided by D. Klotz [
5]. One explanation is simply put: It is a measurement artefact stemming from joule heating by the current change during EIS. A remedy would be provided by an experimental setup with highly efficient cooling channels, able to completely remove the generated heat in a time frame of at least <5 s to keep the temperature constant during measurement in the frequency range of 0.2–0.01 Hz. This is not a common feature in single-cell testing hardware. In such a case, the negative capacitance and resistance can be used as an empirical correction factor to account for this measurement artefact, when simulating the transport related resistance directly adjacent. Another possible explanation could be the two-step nature of the oxygen reduction reaction through an intermediate state [
5,
15]. It is possible that the time constant of reaction one (oxygen hydrogen peroxide) is much larger than the time constant of reaction two (hydrogen peroxide water). Apart from the physical nature of the negative R
intermediate-CPE
intermediate, the additional degrees of freedom introduced by this circuit element and its ability to mathematically represent the PLFI loop (in contrast to a model without it) lead to a higher precision of determination for the other well-defined circuit elements. The second and most commonly cited reason for the appearance of the PLFI loop is the resistance introduced by the oxidation of an intermediate product, namely PtO/PtOH or PtO
2H [
5,
15].


 ,
, 


