Assessing Uncertainties of Life-Cycle CO2 Emissions Using Hydrogen Energy for Power Generation


Global Zero Emission Research Center, National Institute of Advanced Industrial Science and Technology, 16-1 Onogawa, Tsukuba 305-8569, Japan
*
Author to whom correspondence should be addressed.
Energies 2021, 14(21), 6943; https://doi.org/10.3390/en14216943
Submission received: 17 August 2021
/
Revised: 7 September 2021
/
Accepted: 13 September 2021
/
Published: 22 October 2021
(This article belongs to the Special Issue Environmental Aspects and Impacts of Hydrogen Technologies)
Abstract
:Hydrogen and its energy carriers, such as liquid hydrogen (LH2), methylcyclohexane (MCH), and ammonia (NH3), are essential components of low-carbon energy systems. To utilize hydrogen energy, the complete environmental merits of its supply chain should be evaluated. To understand the expected environmental benefit under the uncertainty of hydrogen technology development, we conducted life-cycle inventory analysis and calculated CO2 emissions and their uncertainties attributed to the entire supply chain of hydrogen and NH3 power generation (co-firing and mono-firing) in Japan. Hydrogen was assumed to be produced from overseas renewable energy sources with LH2/MCH as the carrier, and NH3 from natural gas or renewable energy sources. The Japanese life-cycle inventory database was used to calculate emissions. Monte Carlo simulations were performed to evaluate emission uncertainty and mitigation factors using hydrogen energy. For LH2, CO2 emission uncertainty during hydrogen liquefaction can be reduced by using low-carbon fuel. For MCH, CO2 emissions were not significantly affected by power consumption of overseas processes; however, it can be reduced by implementing low-carbon fuel and waste-heat utilization during MCH dehydrogenation. Low-carbon NH3 production processes significantly affected power generation, whereas carbon capture and storage during NH3 production showed the greatest reduction in CO2 emission. In conclusion, reducing CO2 emissions during the production of hydrogen and NH3 is key to realize low-carbon hydrogen energy systems.
1. Introduction
Hydrogen energy (hydrogen and its energy carriers such as liquid hydrogen (LH2), methylcyclohexane (MCH), and ammonia (NH3)) are attracting attention for realizing carbon neutrality and preventing global warming. Hydrogen does not emit carbon dioxide (CO2) during the utilization phase and can be produced with low-carbon emissions through water electrolysis, or by combining natural gas reforming and coal gasification processes with carbon capture and storage (CCS) technology. Therefore, energy-related CO2 emissions can be drastically reduced by replacing fossil fuel combustion with low-carbon hydrogen utilization. According to the International Energy Agency’s roadmap to reach net-zero global emissions by 2050 [1], global hydrogen and hydrogen-based fuel use will expand from 87 Mt in 2020 to 528 Mt in 2050, and 98% of hydrogen in 2050 will be produced from low-carbon methods.
Innovation is essential for establishing a hydrogen economy. Japan is one of the leading countries in research, development, and demonstration (RD&D) of hydrogen technologies. In December 2017, the Japanese government formulated the Basic Hydrogen Strategy [2] which provides a shared vision for the public and private sectors to realize a hydrogen society by 2050. Considering this approach, the Strategic Road Map for Hydrogen and Fuel Cells was revised in March 2019. This scheme presented future milestones and action plans to achieve the new targets indicated in the Basic Hydrogen Strategy. For both the strategy and road map, Japan set the future price of hydrogen at 30 JPY/Nm3 by 2030 and 20 JPY/Nm3 by 2050. To achieve the target price, hydrogen would need to be imported from overseas renewable electricity or be produced from cheap, unused energy resources with CCS. Japan plans to develop commercial-scale hydrogen supply chains by 2030 to procure 300 kt of hydrogen annually. Liquid hydrogen energy carriers (e.g., LH2, MCH, and NH3) are suitable for international transportation due to their advantage of easy handling and high energy storage compared to gaseous hydrogen. Demonstration projects for the hydrogen supply chains using liquid hydrogen energy carriers is underway [3,4,5]. On the other hand, the use of hydrogen energy in the electricity sector has attracted attention from the perspective of its end use [6,7,8]. Replacing existing thermal power generation with hydrogen energy generation is expected to reduce carbon emissions as well as serve as a regulated power supply and backup power source required for expanding renewable energy [2]. As hydrogen energy generation consumes a large quantity of hydrogen constantly, it is positioned as a technology that will be commercialized by 2030, in parallel with the construction of an international supply chain. A demonstration experiment conducted in Kobe in April 2018 achieved the world’s first cogeneration of heat and electricity using a gas turbine that exclusively burns hydrogen [9]. Among the energy carriers, NH3 can be directly combusted to generate electricity. NH3 co-firing experiments in coal-fired power plants [10] and the development of low nitrogen oxide (NOx) NH3 gas turbines [11] are in progress.
Evaluation of hydrogen technologies is also important for establishing a low-carbon hydrogen society. The world’s first ministerial-level meeting on realizing a hydrogen society, termed the Hydrogen Energy Ministerial Meeting, was held in Tokyo on 23 October 2018. The Chair’s summary of the meeting, known as the Tokyo Statement [12] stresses the importance of investigating and evaluating the potential of hydrogen to reduce CO2 and other pollutants in realizing a hydrogen society. As mentioned above, hydrogen does not emit CO2 during the utilization phase; however, CO2 emissions are generated by the resource and utility inputs (electricity, fuel, water, etc.) during the production, storage, and transportation stages of hydrogen and energy carriers. Therefore, to demonstrate the environmental superiority of hydrogen energy, it is necessary to evaluate the emissions of the entire supply chain through a life-cycle inventory (LCI) analysis. LCI analysis for hydrogen supply chains has been conducted in many studies on the well-to-tank greenhouse gas (GHG)/CO2 emissions of hydrogen for mobility use [13,14,15,16,17,18,19]. In terms of LCI analysis of other applications, Ozawa et al. [20] analyzed life-cycle CO2 emissions of hydrogen and NH3 power generation, and Chisalita et al. [21] conducted a cradle-to-gate environmental assessment of European NH3 production considering various hydrogen supply chains.
Although these studies could provide some implications for establishing low-carbon hydrogen supply chains, they rarely deal with the uncertainties of parameters related to supply chains. Since most technologies that compose hydrogen supply chains are in the development and demonstration stages, there may be a large degree of uncertainty about the environmental value of the entire supply chain at the practical application stage. Such analysis can provide researchers and policymakers with useful feedback that can help in robust decision-making regarding RD&D of hydrogen technologies. LCI analysis often involves assessing the probable impact of several variables in the target supply chains on life-cycle GHG/CO2 emissions through Monte Carlo simulations [22]. However, LCI analysis that considers the uncertainties in life-cycle GHG/CO2 emissions from hydrogen supply chains is limited to studies that focus on the use of hydrogen for smobility [13,19].
In most LCI studies, specific values are assumed for supply chain parameters [14,15,16,17,18,20,21]. However, essential technologies that compose hydrogen supply chains for power generation are still in the development and demonstration stages, and we recognize that their specification (e.g., energy input and CO2 emissions intensity) at the practical application stage should have a certain degree of uncertainty, which have not been fully considered in previous research. This study aims to evaluate uncertainties regarding the environmental benefits of hydrogen in the electricity sector by applying the Monte Carlo method for LCI analysis. While hydrogen energy is attracting attention in the context of lowering the carbon emissions of energy systems in Japan, its environmental effects can range depending on the future performance of elements that make up hydrogen supply chains. The purpose of this study is to identify and understand the important factors involved in electricity generation using hydrogen energy by conducting a stochastic LCI analysis using Monte Carlo simulations. The variations in the parameters related to the operation of hydrogen supply chains were collected by literature surveys, and the uncertainties involved in life-cycle CO2 emissions from hydrogen and NH3 power generation were estimated. Please note here that the life-cycle CO2 emissions attributed to capital goods necessary to operate the hydrogen supply chain were out of the scope of this study. The results obtained are compared with those of coal- and liquefied natural gas (LNG)-fired power generation, and the effect of the use of hydrogen energy on reducing CO2 emissions over the entire life-cycle is discussed.
2. Method and Assumptions
2.1. Outline
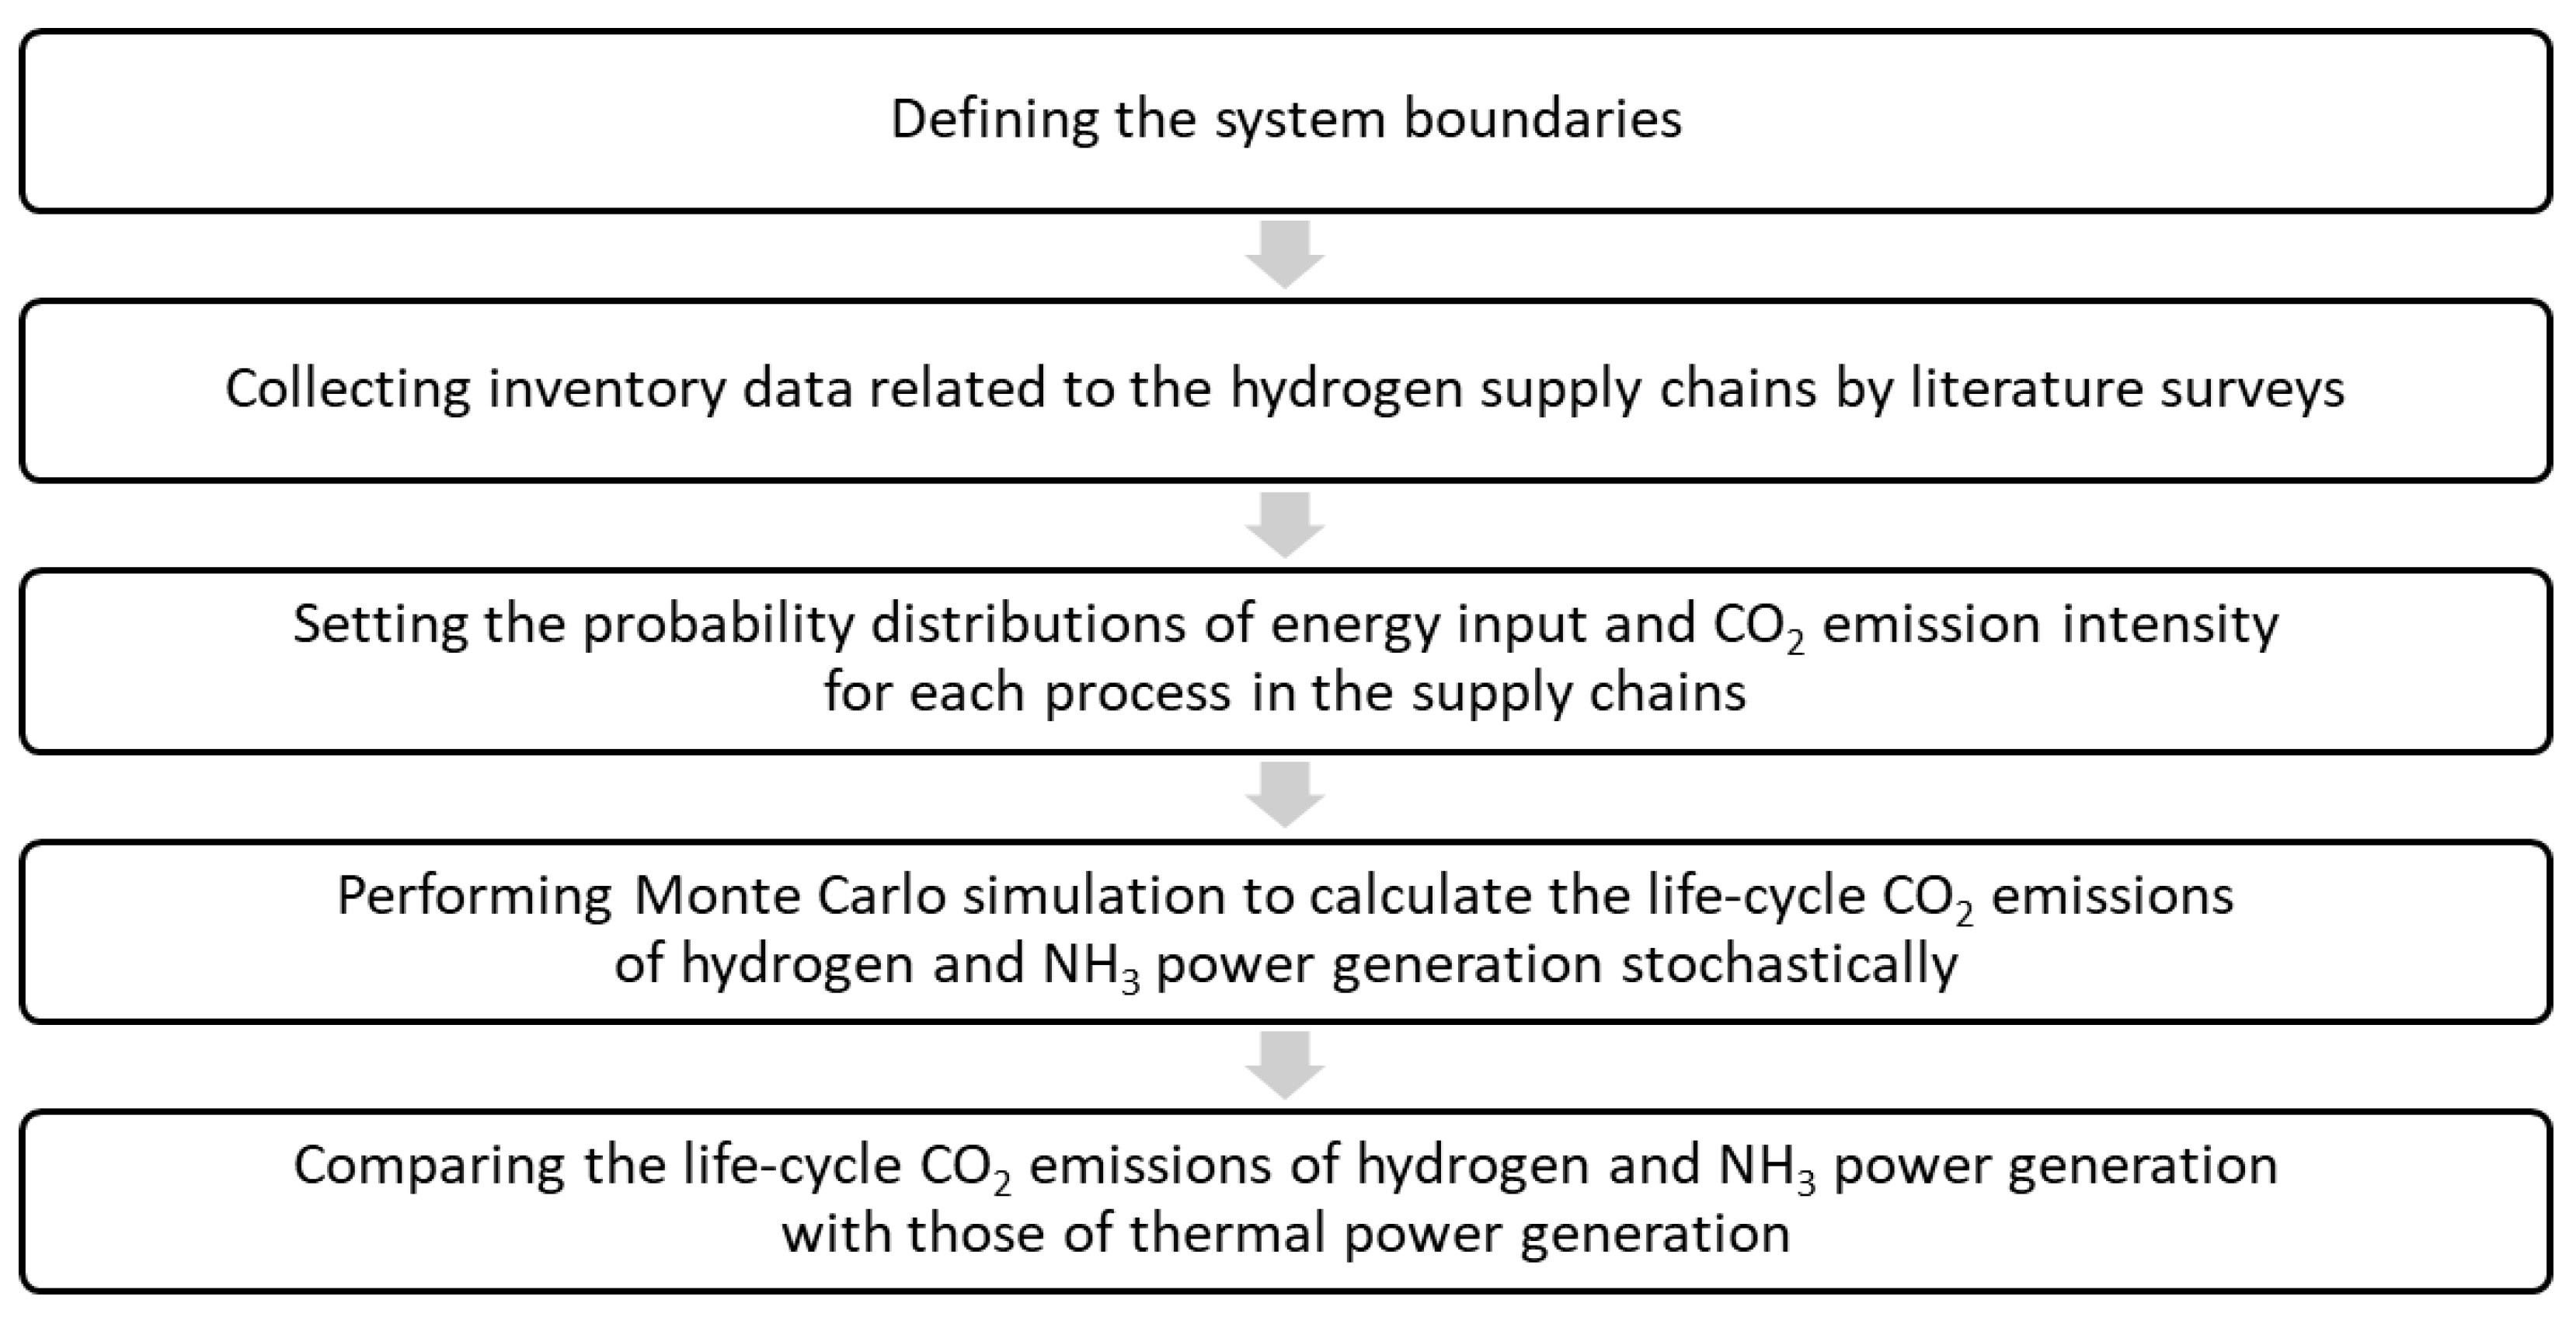
Figure 1 illustrates the research methodology of this study. Firstly, the system boundaries are defined to determine which unit processes to be included in this study. Secondly, inventory data related to the operation of the hydrogen supply chains are collected by literature survey. This study focuses on the life-cycle CO2 emissions due to the operation of the supply chains and the emissions for capital goods are out of scope. Thirdly, based on the collected data, the probability distributions of energy input and CO2 emission intensity are set for each process in the supply chains. Fourthly, according to the given probability distributions, Monte Carlo simulations are performed to calculate the life-cycle CO2 emissions of hydrogen and NH3 power generation stochastically. Finally, the calculated life-cycle CO2 emissions are compared with those of thermal power generation to discuss the environmental benefits of hydrogen energy for power generation.
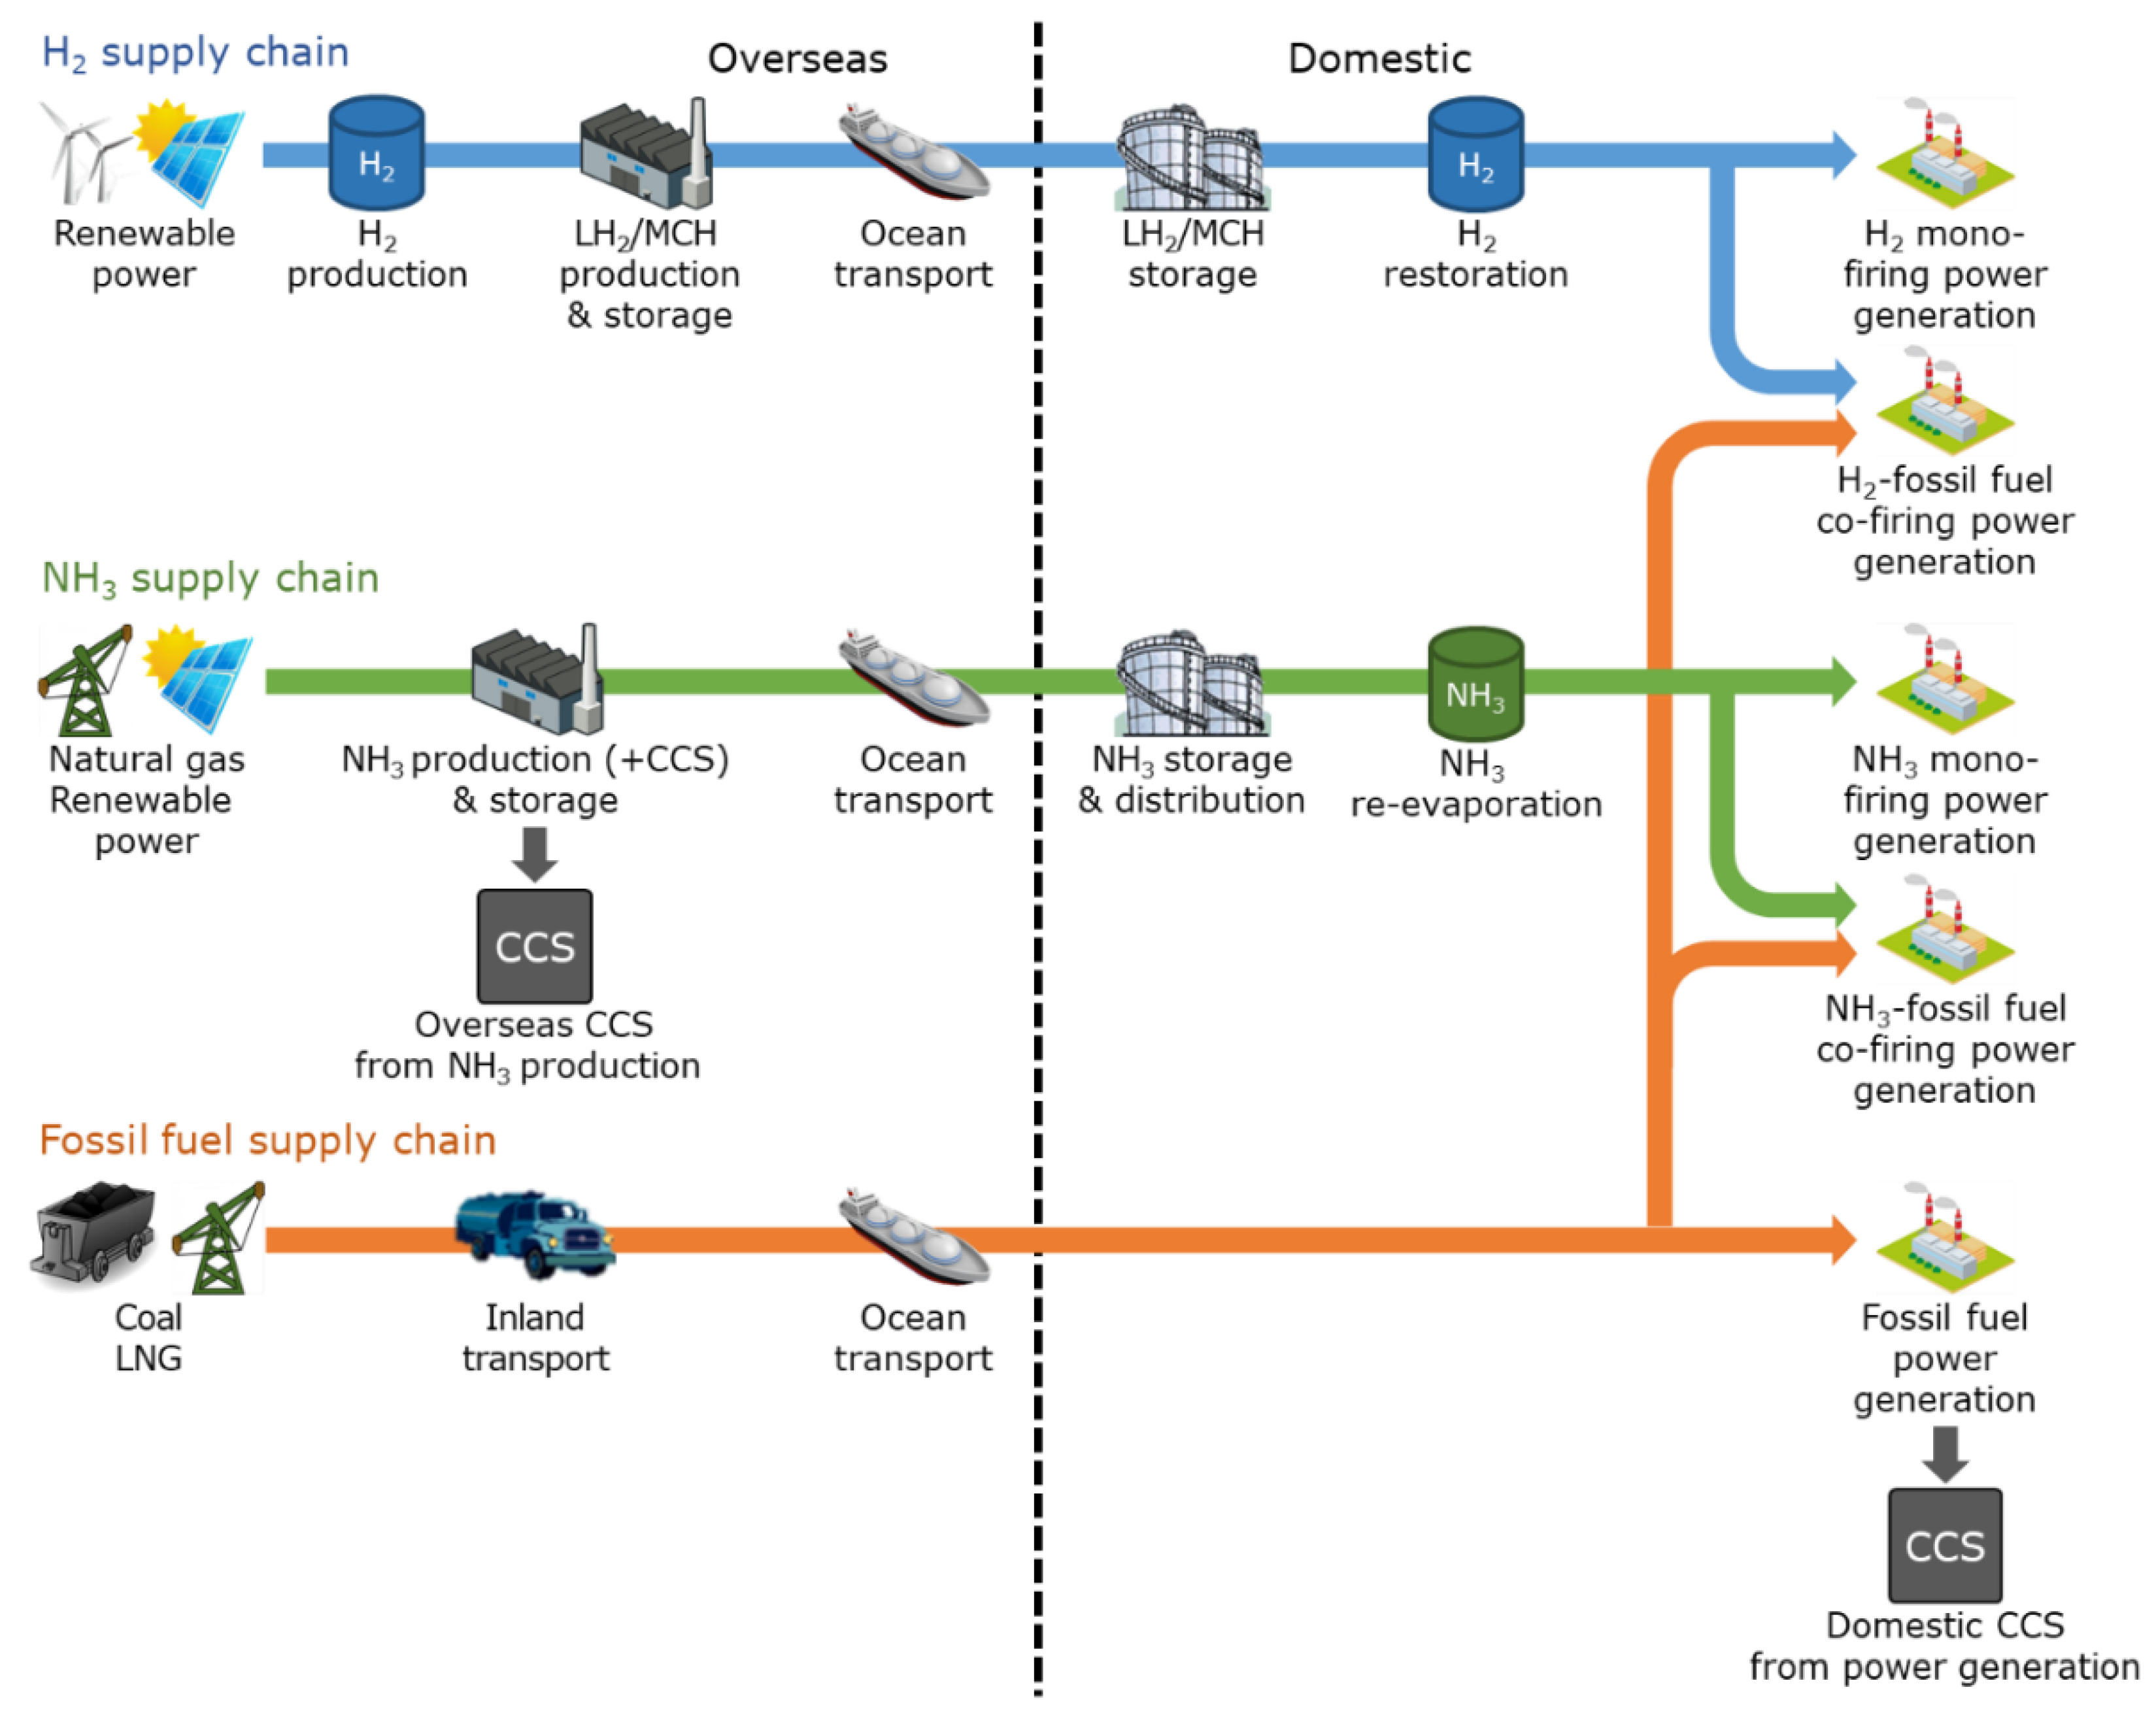
Figure 2 shows the power generation technologies and energy supply chain envisioned in this study. Respectively, both hydrogen and NH3 power generation (co-firing and mono-firing) are the subjects of analyses, whereas coal- and LNG-fired power generation are used for comparison. The hydrogen supply chain sequentially consists of hydrogen production from renewable energy sources overseas; production of energy carriers; storage at the loading port (LH2 or MCH); international transportation; storage at the unloading port; and finally, hydrogen restoration. In contrast, the NH3 supply chain consists of its production from renewable energy or natural gas overseas; storage at the loading port; international transportation; storage and transportation at the unloading port; and re-evaporation. The supply chain for coal and LNG consists of mining and pre-processing; domestic transportation; and international transportation. The CO2 emission reduction effect of applying CCS technology was also evaluated for NH3 production from natural gas and coal- and LNG-fired power generation.
Regarding cost analyses of hydrogen and energy carriers [23,24], Australia (AUS), Norway (NOR), and the United Arab Emirates (UAE) were selected as the hydrogen-producing countries; and the UAE as the NH3-producing country. The one-way distances between NOR, AUS, the UAE, and Japan were considered as 20,000 km; 10,000 km; and 12,000 km, respectively.
The LCI analysis conducted in this study considers the entire life-cycle of products and services (the series of processes from resource extraction to manufacturing, distribution, use, and disposal), and quantifies the consumption of resources and utilities, as well as the emission of environmentally hazardous substances in each process. Life-cycle CO2 emissions, , which is the result of the analysis, can be obtained using Equation (1):
where is the consumption of input in process , and is the CO2 emission intensity due to the consumption of . In this study, the probability distribution of each parameter was set according to the procedure provided in Appendix A to perform an uncertainty analysis of CO2 emissions from overseas renewable energy generation and by using the energy consumption of each process as variable factors. The Japanese LCI Inventory Database for Environmental Analysis (IDEA) v2.2 [25]—the largest life-cycle inventory database in Japan which has been developed by National Institute of Advanced Industrial Science and Technology (AIST), Tsukuba, Japan—was used for domestic processes to estimate the CO2 emission intensity of consumption by other utilities. It has been developed since 2008 by the Safety Science Research Division of the National Institute of Advanced Industrial Science and Technology and is packaged with data of ~3800 processes based on the Japanese Standard Industrial Classification. To estimate the CO2 emission intensity of overseas processes, the 2015 statistics of the International Energy Agency [26] were used for electricity inputs and direct CO2 emission factors were used as fuel inputs, while IDEA v2.2 values were used for non-energy inputs.
2.2. Overseas Renewable Energy Power Generation
In this study, onshore wind (NOR and AUS) and solar photovoltaics (PVs) (AUS and the UAE) were assumed to be renewable energy resources. Life-cycle CO2 emissions per kWh of electricity at the transmission end were calculated on the assumption that the basic components for constructing a power plant are procured in the hydrogen- and NH3-producing countries, whereas other components (nacelle and hub of wind turbine, solar panels, etc.) are manufactured in Japan and exported to hydrogen- and NH3-producing countries. The probability distribution for this is listed in Appendix A Table A1. Inputs to the power plant () were based on data from Ozawa et al. [20]. The facility utilization rate, in-service rate, and service life of the power plant were set assuming overseas wind and sunshine conditions [20,23,27]. The specifications of the power plant are listed in Table 1. Parameters listed in Table 1 were set by collecting data from literature surveys [20].
2.3. Hydrogen Supply Chain
For the “base case” (denoted as Base in the figures) of this study, it was assumed that only the hydrogen production process uses renewable energy power generation, while the electricity input to the other overseas processes uses grid electricity. However, for countries such as AUS and the UAE, where the CO2 emission intensity of grid electricity is large, the emission from the entire supply chain can be decreased by substituting overseas processes with available renewable energy electricity into the grid electricity input. Therefore, in the analysis, it was also considered that for the hydrogen supply chain from AUS and the UAE, the electricity necessary to operate the overseas processes is from the same renewable energy sources as renewable hydrogen production—denoted the “low-carbon case” (LC) in the figures. It was also assumed that the electricity input into domestic processes was supplied by hydrogen power generation.
2.3.1. Hydrogen Production from Renewable Energy
It is expected that hydrogen produced from renewable energy should play a major role in the future hydrogen economy. In 2050, more than 300 Mt of green hydrogen will be produced by water electrolysis to achieve global carbon-neutrality by 2050 [1]. In this study, hydrogen is produced from onshore wind or solar PV power via alkaline or solid polymer water electrolysis. The probability distribution of electricity consumption was set as shown in Appendix A Table A2 based on published data [28,29], and the consumption of pure water was estimated to be 0.804 kg/Nm3-H2 based on the theoretical value.
2.3.2. LH2 Supply Chain
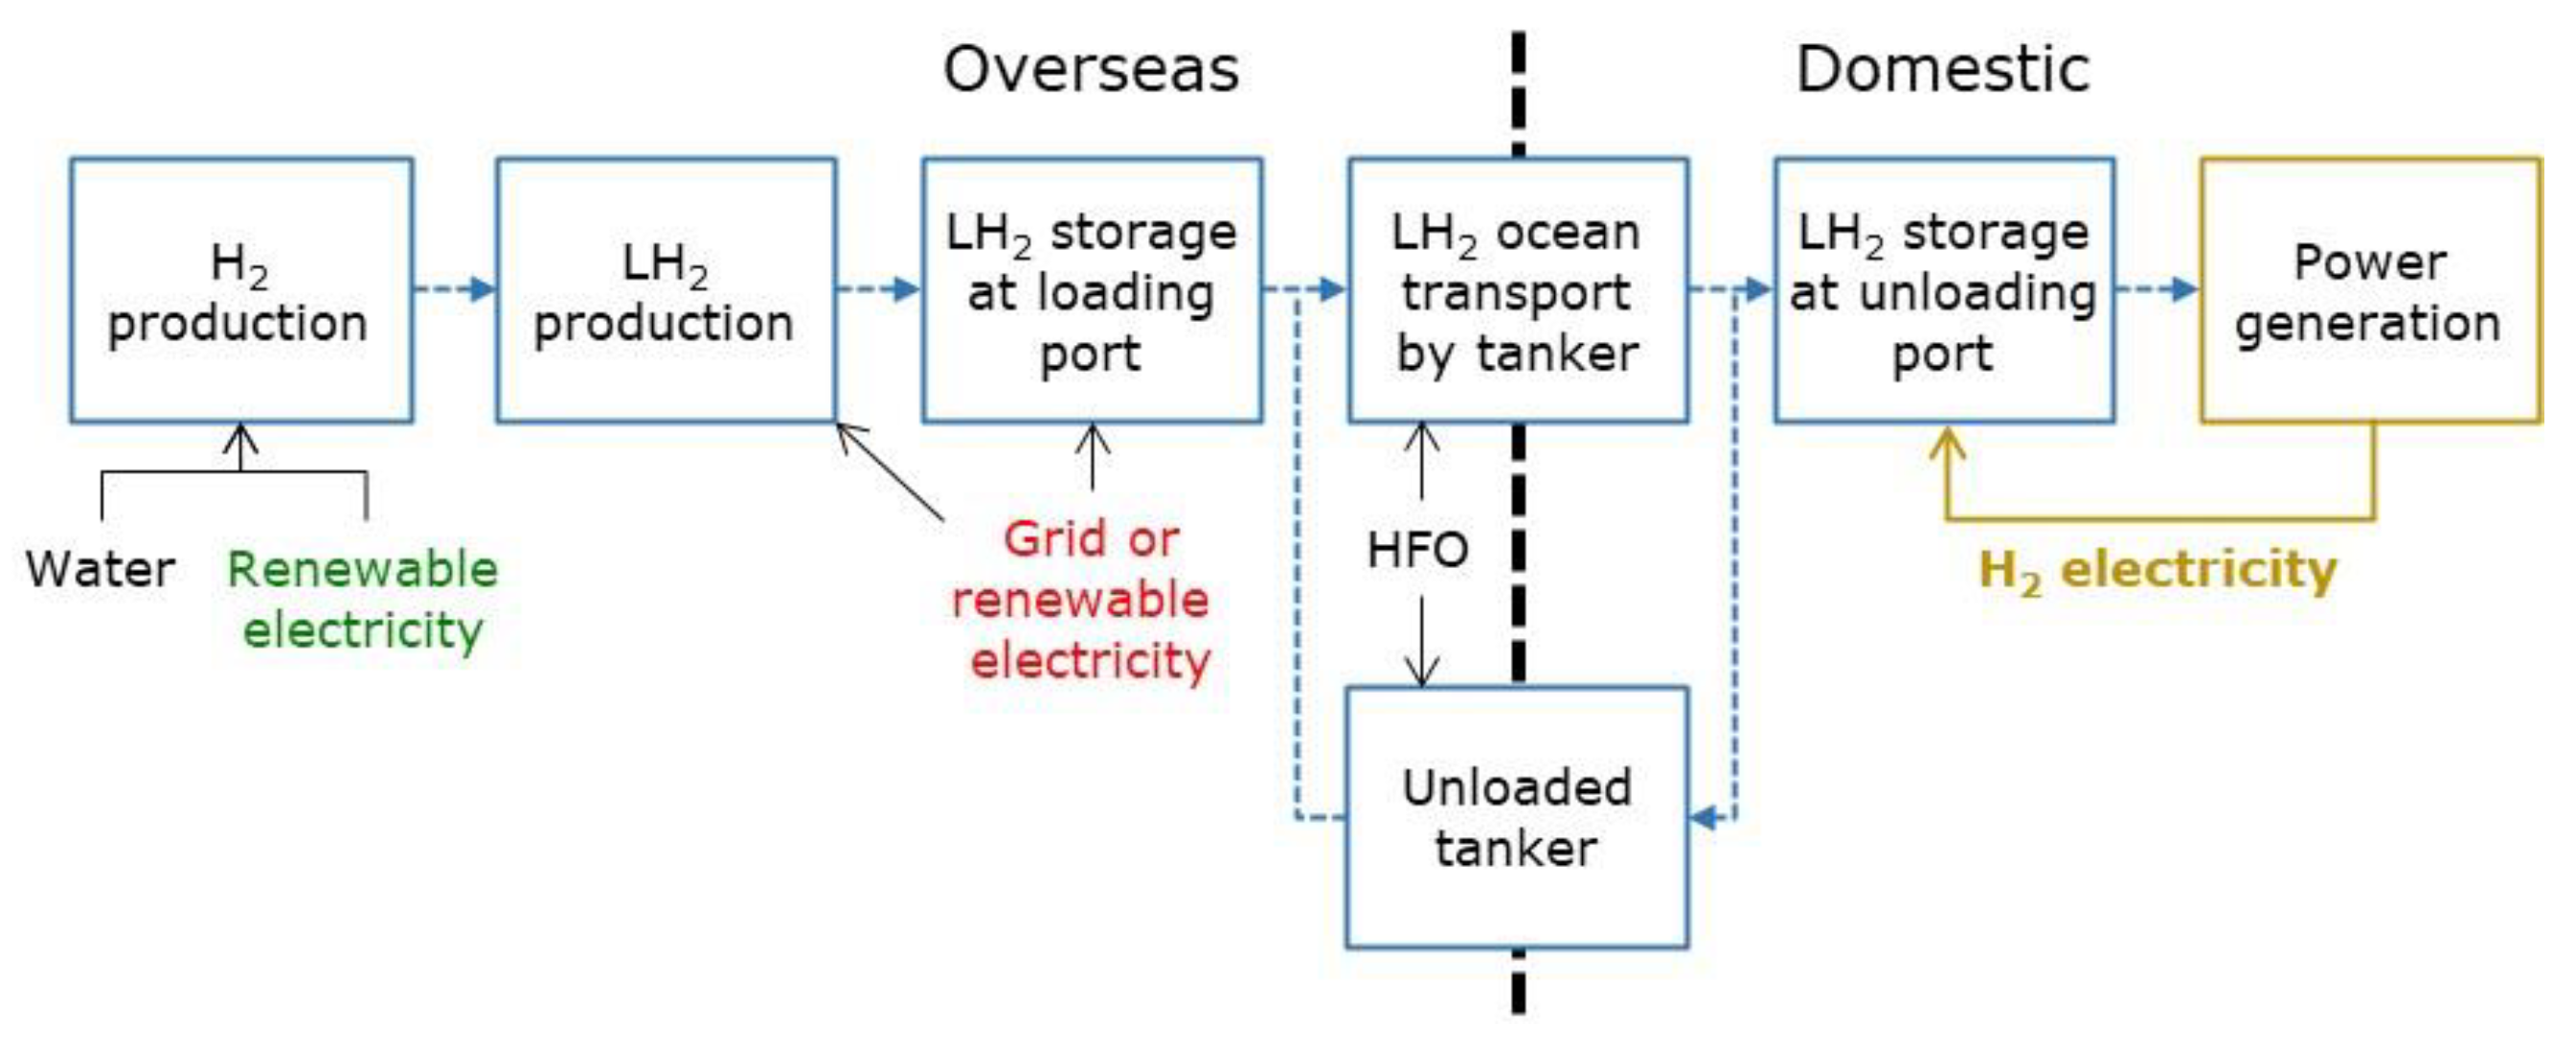
Figure 3 shows the supply chain for the use of LH2 as an energy carrier. Hydrogen gas is liquefied to produce LH2, which is stored in insulated tanks at the loading site, and then transported from the hydrogen-producing country to Japan by an LH2 tanker (capacity: 160,000 m3 at cruising speed: 16 knots). Because detailed information on the energy consumption performance of the LH2 tanker during navigation was not available, its CO2 emission intensity was estimated with reference to LNG tanker transport in IDEA v2.2, it was assumed that heavy fuel oil (HFO) and LH2 boil-off gas were used as marine fuel. Here, CO2 emissions associated with the transportation of LH2 by tankers consider the unladen voyage of the tanker from Japan to the hydrogen-producing country and its return from the hydrogen-producing country to Japan laden with LH2. The imported LH2 is stored in insulated tanks at the unloading port and supplied to the power plant. The probability distributions of electricity consumption due to hydrogen liquefaction and LH2 storage, and the LH2 boil-off rate due to international transportation were set based on published data as shown in Appendix A Table A2 [18,30,31,32,33,34,35,36].
2.3.3. MCH Supply Chain
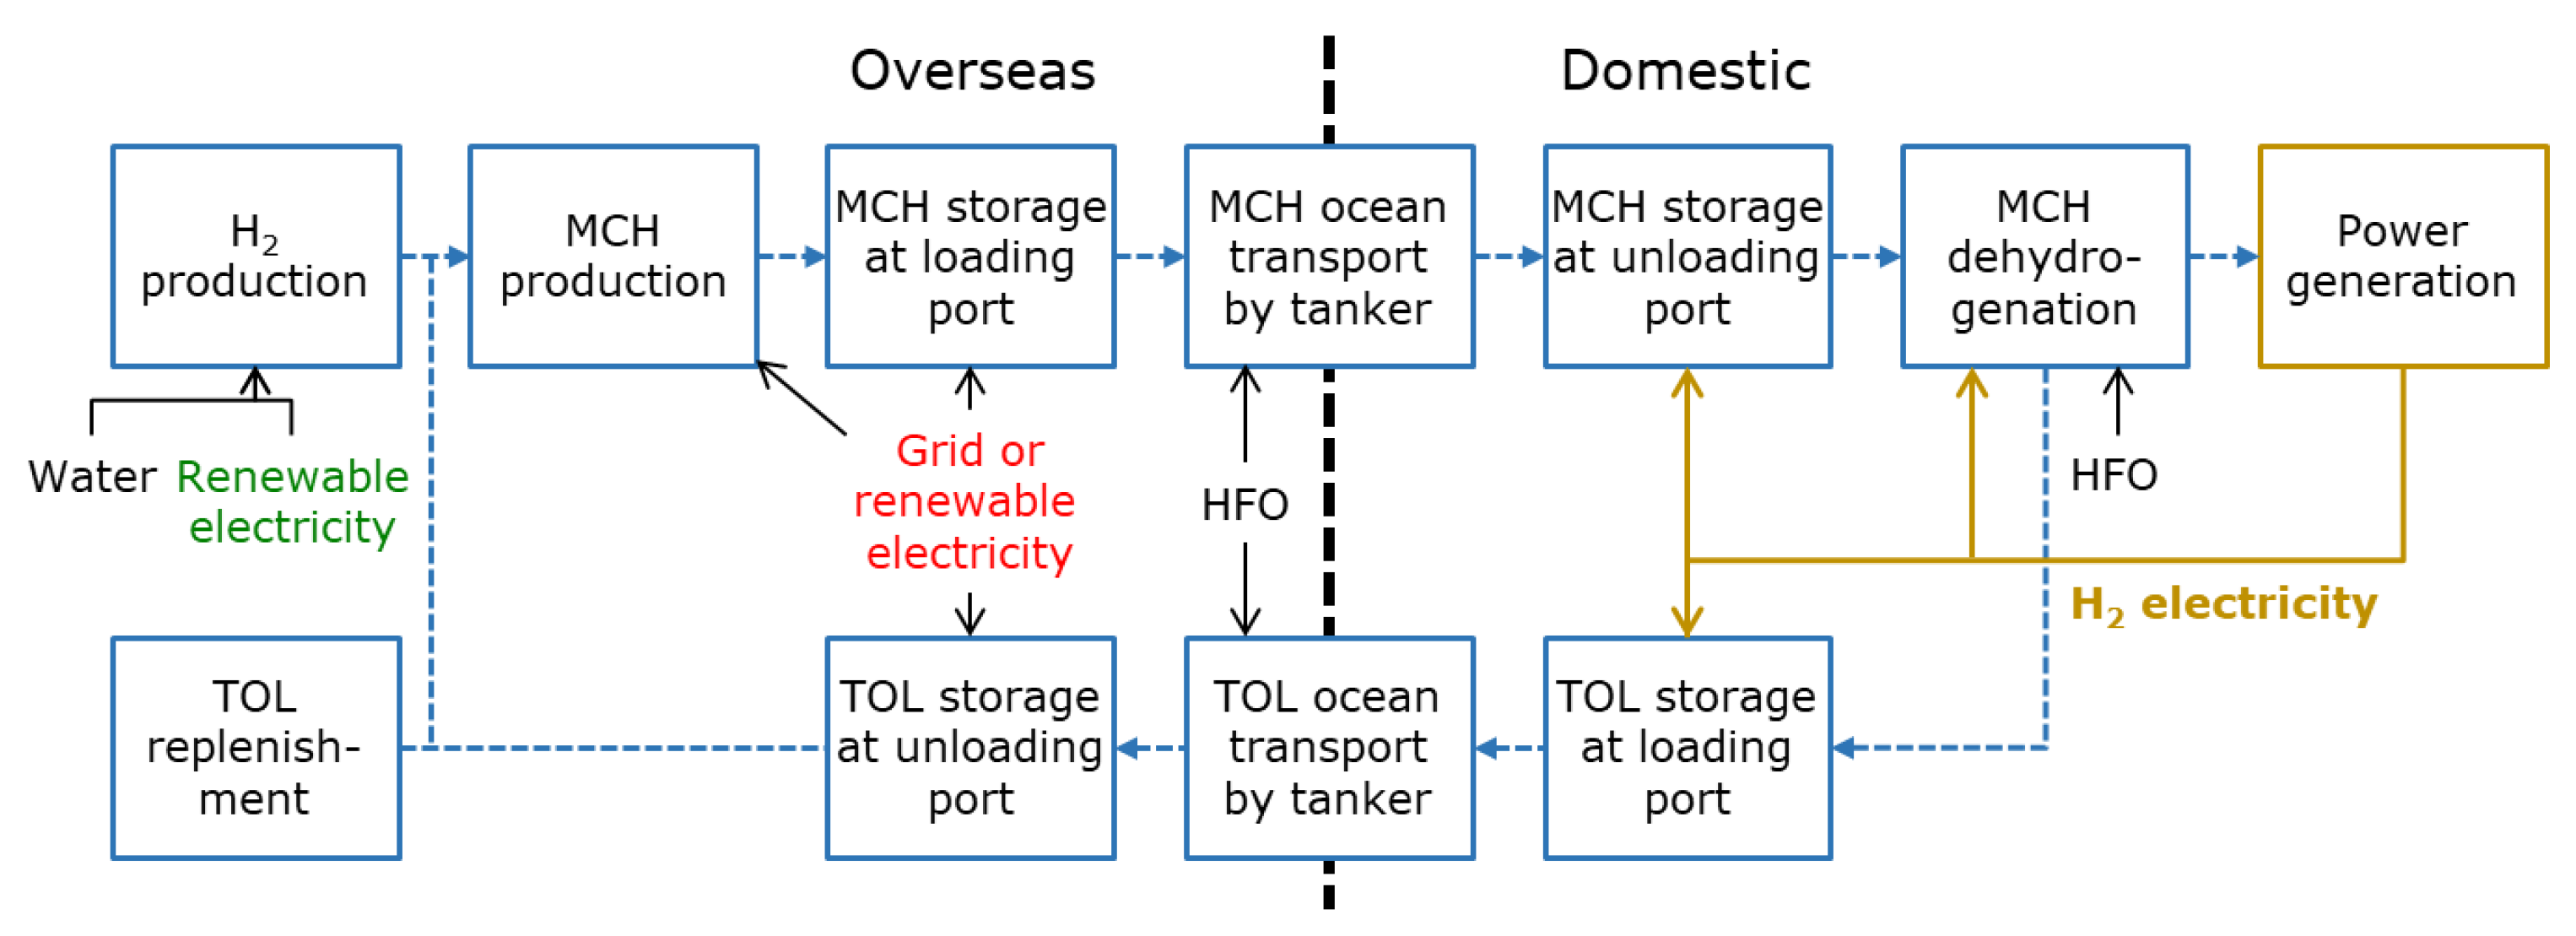
Figure 4 shows the supply chain for the use of MCH as an energy carrier, and Table 2 lists the specifications for each process (“Value” in Table 2, Table 3, Table 4 and Table 5 means the specific values assumed for the parameters of each process in the supply chains). Parameters listed in Table 2 were set by collecting data from literature surveys [30,37,38].
MCH is produced from hydrogen and toluene (TOL) and stored in cone-roof tanks at the loading port. TOL is produced from oil refining and naphtha reforming in Japan and is transported to a hydrogen-producing country by chemical tankers. The MCH produced using TOL is then transported from a hydrogen-producing country to Japan by chemical tankers. The petroleum product tanker transport of IDEA v2.2 was used to evaluate the CO2 emission intensity of the chemical tankers. The imported MCH is stored in cone-roof tanks at the unloading port and then converted back to hydrogen and TOL by dehydrogenation. Hydrogen is supplied to the power plant, and the TOL is transported to the hydrogen-producing country for reuse. The heat required for dehydrogenation is assumed to be supplied by the combustion of HFO. TOL degraded by side reactions (formation of benzene and methane by demethylation reaction, paraffin by ring-opening reaction, cyclopentane by isomerization, and alkyl biphenyls by dimerization [28,37]) was assumed to be replenished. The probability distributions of electricity consumption due to MCH production, storage, dehydrogenation, and TOL storage were set as shown in Appendix A Table A2 based on published data [20,26].
2.4. NH3 Supply Chain
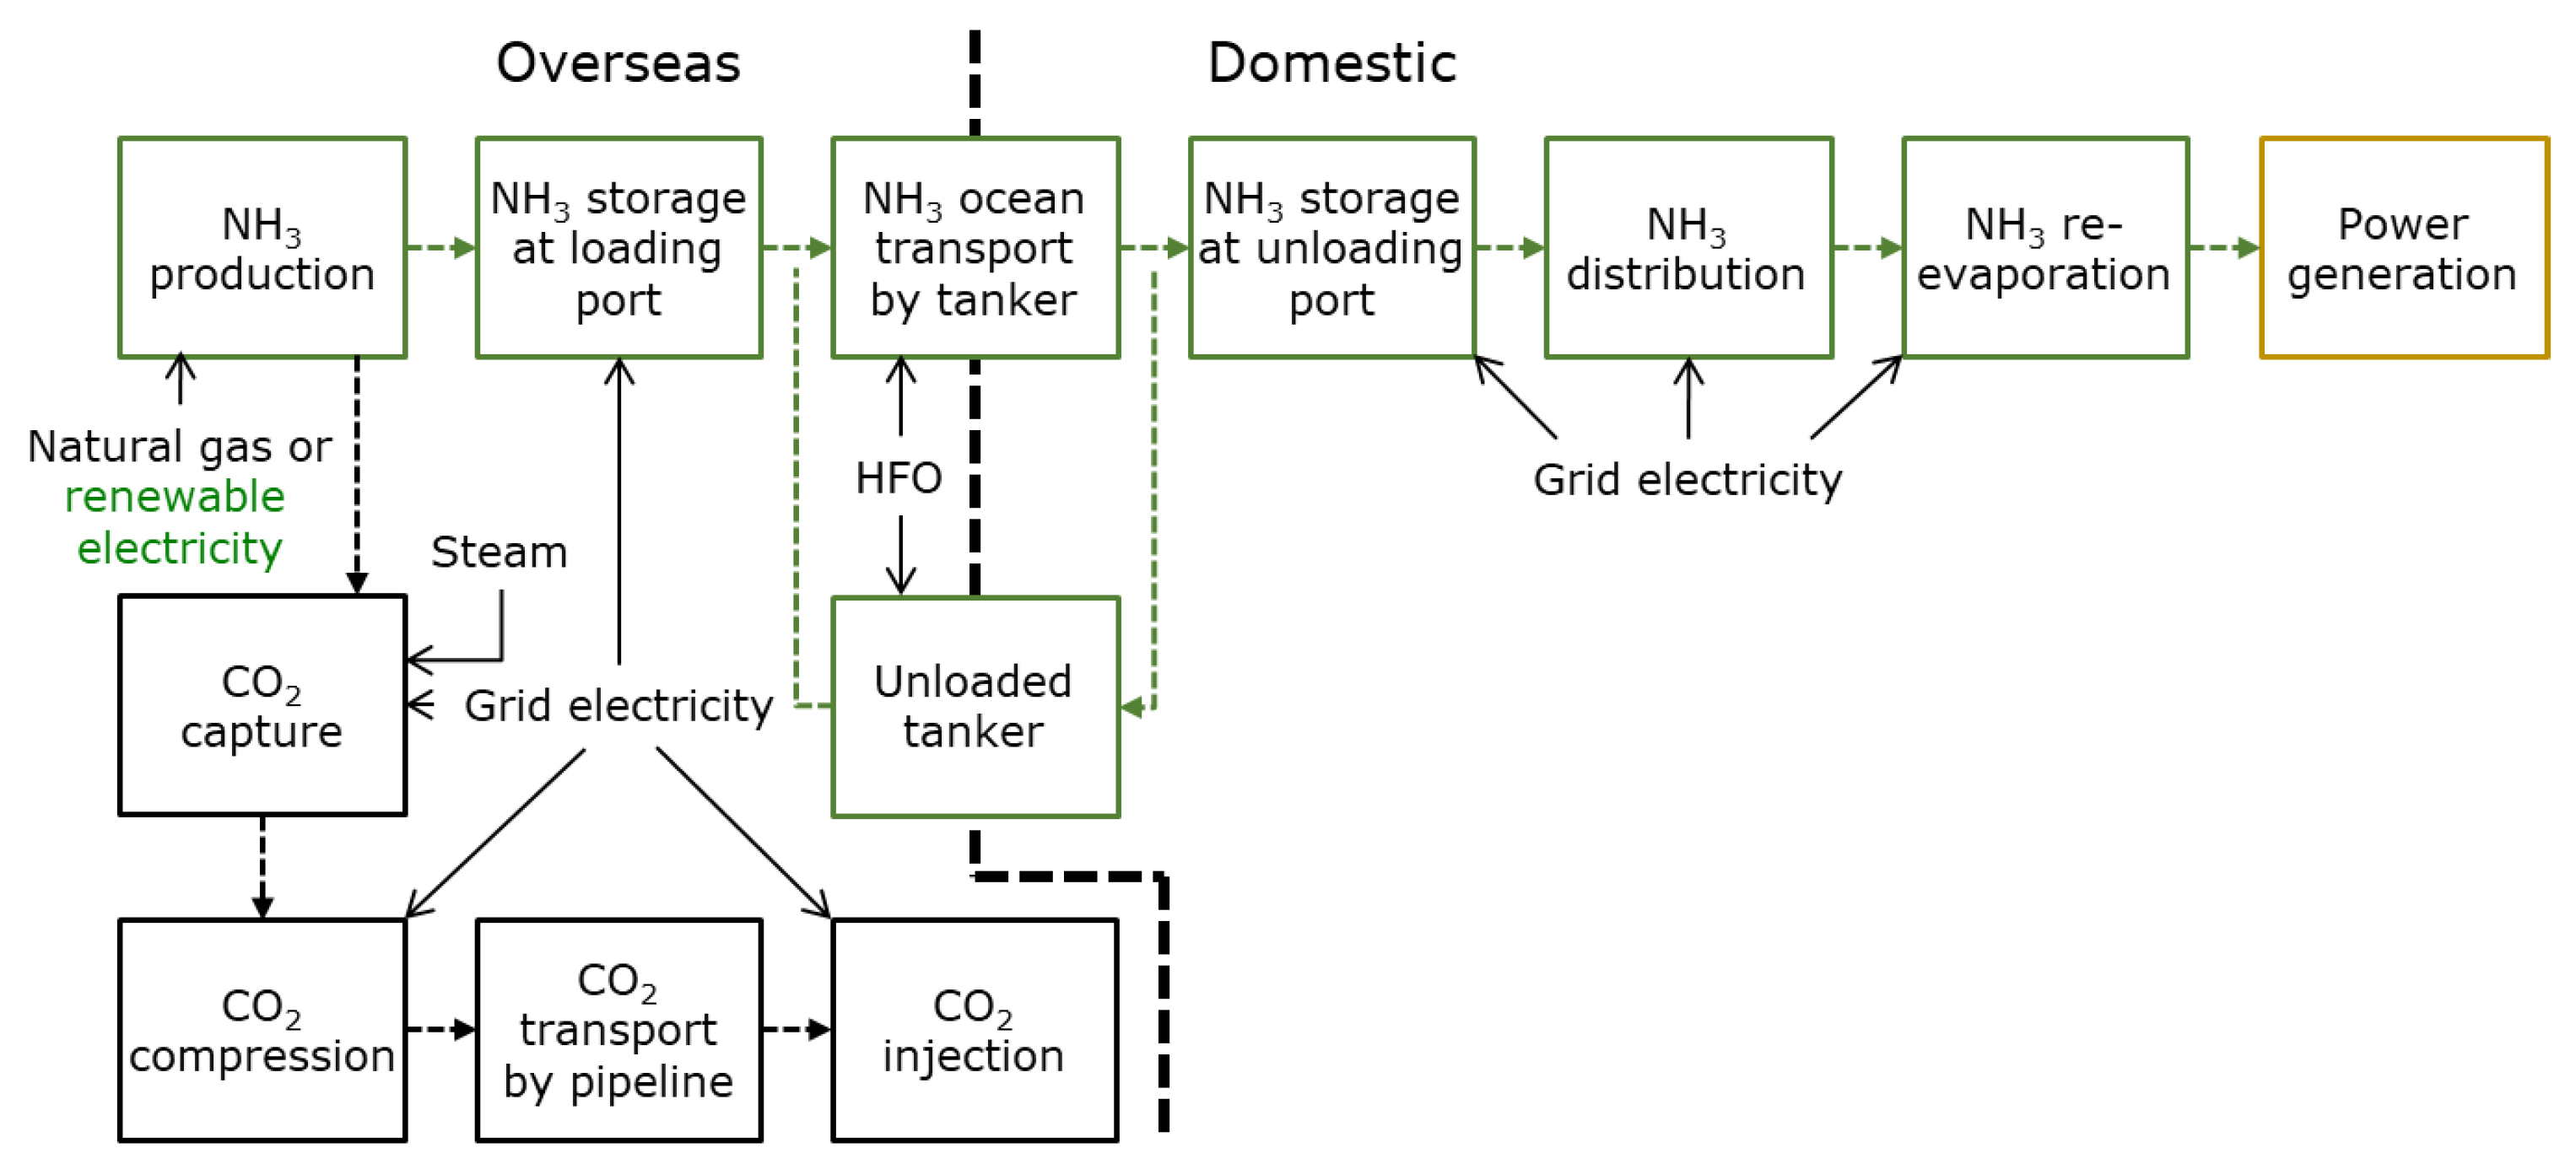
Figure 5 shows the NH3 supply chain, and Table 3 lists the specifications for each process. Parameters listed in Table 3 were set by collecting data from literature surveys [39,40,41].
2.4.1. NH3 Production from Renewable Energy
NH3 is synthesized and liquefied by the Haber–Bosch process from hydrogen produced by alkaline or solid polymer water electrolysis using solar PV power. Nitrogen was obtained via air separation. The consumption of electricity and pure water for hydrogen production was set as described in Section 2.3.1. The probability distributions of electricity consumption for nitrogen and NH3 production were set as shown in Appendix A Table A3 based on published data [39,42,43,44,45,46].
2.4.2. NH3 Production from Natural Gas
For the process of NH3 production from natural gas, the input/output relationship was established based on the NH3 production process of IDEA v2.2 from AIST, Tsukuba, Japan. In this process, natural gas is used as a feedstock for NH3 and as a fuel for the reactor. The probability distributions of the utility natural gas and electricity consumption were set as shown in Appendix A Table A3.
Application of CCS is effective to mitigate CO2 from NH3 production process from natural gas. CCS consists of CO2 capture, compression, pipeline transportation, and injection processes. Utility-derived CO2 was recovered using the chemical absorption method (recovery rate: 90%). On the other hand, feedstock-derived CO2 is emitted with high density from the NH3 synthesis process; hence, a recovery process is not necessary. The recovered utility-derived CO2 is compressed together with all the feedstock-derived CO2, which is transported by pipeline to a CO2 reservoir (transport distance: 50 km) and injected into the reservoir. The probability distributions of steam consumption due to CO2 capture, electricity consumption due to CO2 capture, compression, and injection were set as shown in Appendix A Table A3 based on published data [25,40,41,47,48,49,50,51]. As for the CO2 emission intensity of steam required for chemical absorption, the probability distribution of Appendix A Table A3 was set with a minimum value of 0 (assuming steam can be supplied by waste heat) and the maximum value given by steam production from the HFO-fired boiler of IDEA v2.2 from AIST, Tsukuba, Japan.
2.4.3. NH3 Storage, Transportation, and Regasification
The produced NH3 is stored in tanks at the loading port and transported from the NH3-producing country to Japan by NH3 tankers (capacity: 38,000 m3 at a cruising speed of 17 knots). For the CO2 emission intensity of the NH3 tanker, the petroleum product tanker transportation of IDEA v2.2 was used by considering CO2 emissions during round trips between Japan and the NH3-producing country. After storage in tanks at the unloading port, the imported NH3 is transported by pipeline to the power plant, where it is re-gasified and used as fuel for power generation. The probability distribution of electricity consumption due to NH3 storage and transportation was set as shown in Appendix A Table A3, based on published data [20].
2.5. Fossil Fuel Supply Chain
We calculated CO2 emissions from the coal and LNG supply chains based on data from Ozawa et al. [20] and statistics on import destinations [52]. In this analysis, coal-fired and LNG-fired power plants are considered commercialized technologies, and the uncertainty of the fossil fuel supply chain is not considered.
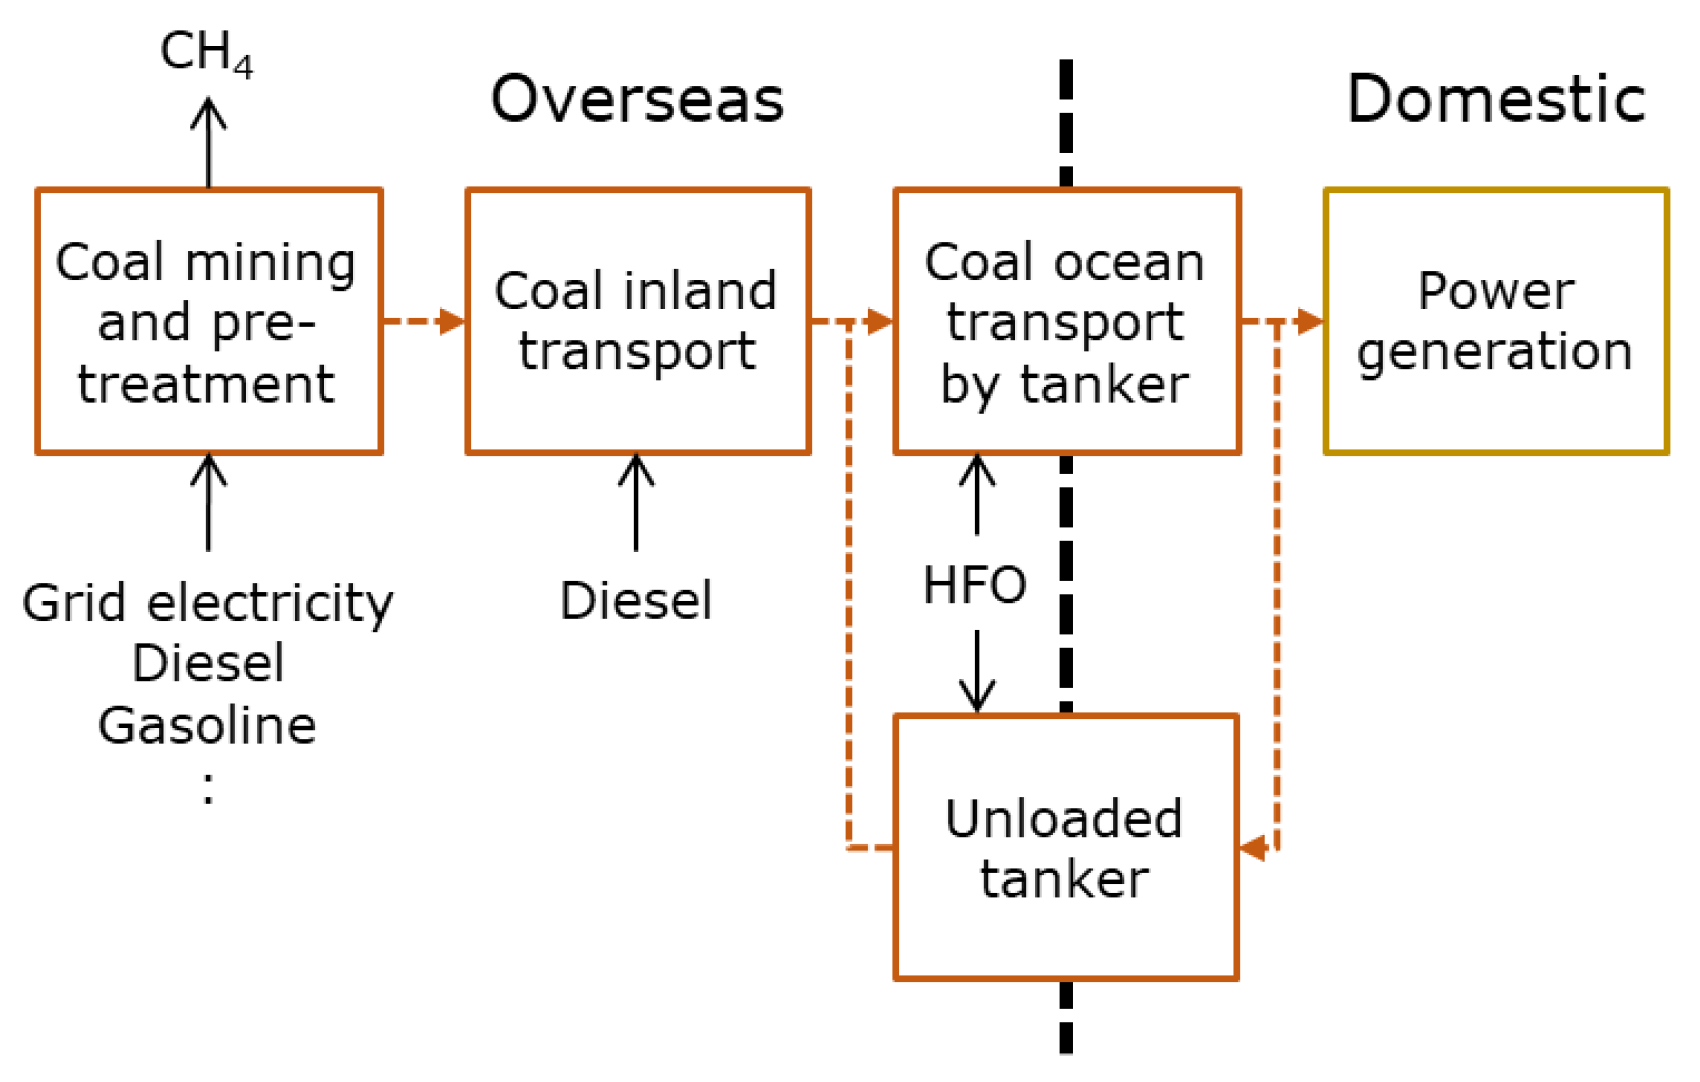
Figure 6 shows the coal supply chain, and Table 4 lists the specifications for each process. Coal mined overseas first undergoes pre-processing. Methane emissions from coal mines and CO2 emissions from consumables during mining (steel, explosives, etc.) were also considered. The coal is then transported by rail (fueled by diesel) to the port, where it is transported by coal carriers to power plants in Japan. For international transportation, CO2 emissions for the round trip between Japan and the coal-producing country were considered, and the fuel was assumed to be HFO.
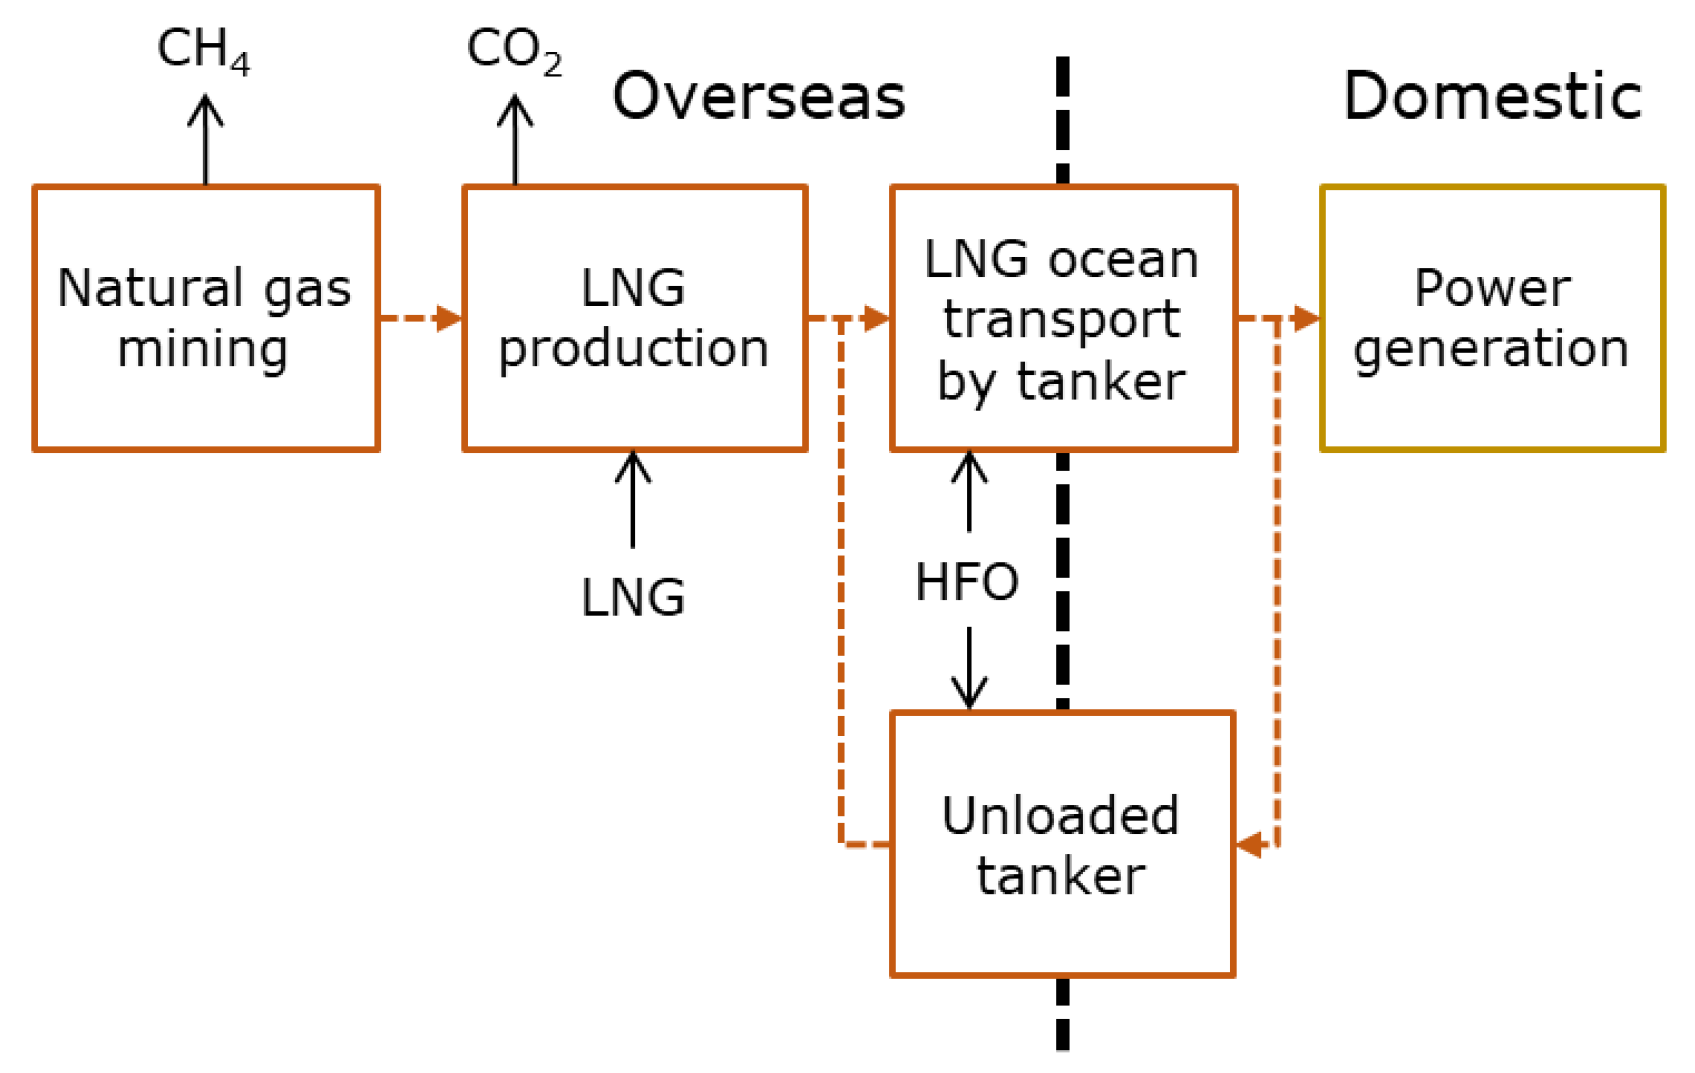
Figure 7 shows the LNG supply chain, and Table 5 lists the specifications for each process. First, natural gas is extracted from overseas gas fields and liquefied. Consideration is also given to methane emissions from natural gas mining and CO2 emissions from crude gas during liquefaction. LNG is then transported by a tanker to a power plant in Japan. For international transportation, CO2 emissions for the round trip between Japan and the gas-producing country were considered, and the fuel was assumed to be boil-off gas and HFO.
2.6. Power Generation and CCS
Table 6 shows the specifications of the hydrogen and NH3 power generation processes that were analyzed, and the thermal power generation process used for comparison. Five types of power generation were examined: hydrogen–LNG co-firing, hydrogen mono-firing, NH3–coal co-firing, NH3–LNG co-firing, and NH3 mono-firing. The co-firing ratio of hydrogen and NH3 to existing fuels was set at 20% (based on a high heating value) in all cases. The efficiency of hydrogen mono-fired power generation was set to be lower than that of LNG-fired power generation [53]. The efficiencies of hydrogen co-firing power generation and NH3 mono-firing/co-firing power generation were set to be the same as those of LNG-fired power generation. Thermal power generation was assumed to be ultra-supercritical coal-fired power generation (600 °C class) and LNG combined-cycle power generation (1500 °C class), and CO2 emissions from coal ash disposal were also considered [23].
Table 7 lists the specifications for the CCS in thermal power plants (“Value” in Table 7 means the specific values assumed for the parameters of each process in the supply chains). Parameters listed in Table 7 were set by collecting data from literature surveys [40,41]. The emitted CO2 is liquefied after being collected using the chemical absorption technique, transported by ship to a CO2 reservoir (transport distance: 50 km), and injected into the reservoir. The electricity consumption required for CO2 capture, liquefaction, and injection was assumed to be supplied by power generation by increasing the internal consumption rate.
2.7. Uncertainty Analysis
Uncertainty analysis aims at quantifying the variability of the calculation results attributed to the variation of the parameter input, and it helps robust decision making under uncertainty. As an example of uncertainty analysis, some financial studies focus on the effect of mitigating commodity pricing volatility in supply chains for supply chain risk management [54,55].
In terms of environmental profile of supply chains, there are two methods for dealing with uncertainty in the LCI analysis. One method is to conduct sensitivity analyses. The International Organization for Standardization (ISO) 14044 guidelines suggest that sensitivity analyses should include a wide range of factors to determine the influence of variations in assumptions, methods, and data [56]. An alternative option, the uncertainty analysis, employs probabilistic simulations based on the Monte Carlo method to evaluate the combined influence of multiple uncertain factors on the results. Here, probability distributions were assumed for the input parameters of the system. Repeated calculations with different input values yield a probability frequency distribution of the total GHG emissions from the entire system [57].
In this study, we performed a Monte Carlo simulation to calculate the life-cycle CO2 emissions of hydrogen and NH3 power generation. We treated energy consumption () and CO2 emission intensity () for each process in the supply chains as uncertain parameters and calculated the life-cycle CO2 emissions () stochastically using Equation (1). Based on the variations in the parameters collected by literature survey, probability distributions were assumed for each uncertain parameter, as shown in Appendix A Table A1, Table A2 and Table A3. Either normal distribution or triangular distribution was applied for the parameters’ probability density function. If a normal distribution was applied for a parameter , the probability distribution of was defined as Equation (2):
where and were the mean and standard deviation of , respectively.
If a triangular distribution was applied, was defined as Equation (3):
where and were the minimum and maximum values of , respectively. In Appendix A, the probability distributions of the uncertain parameters assumed in this study are described in detail. Monte Carlo simulations were performed using Oracle’s Crystal Ball, and the number of iterations was set to 100,000.
3. Results and Discussion
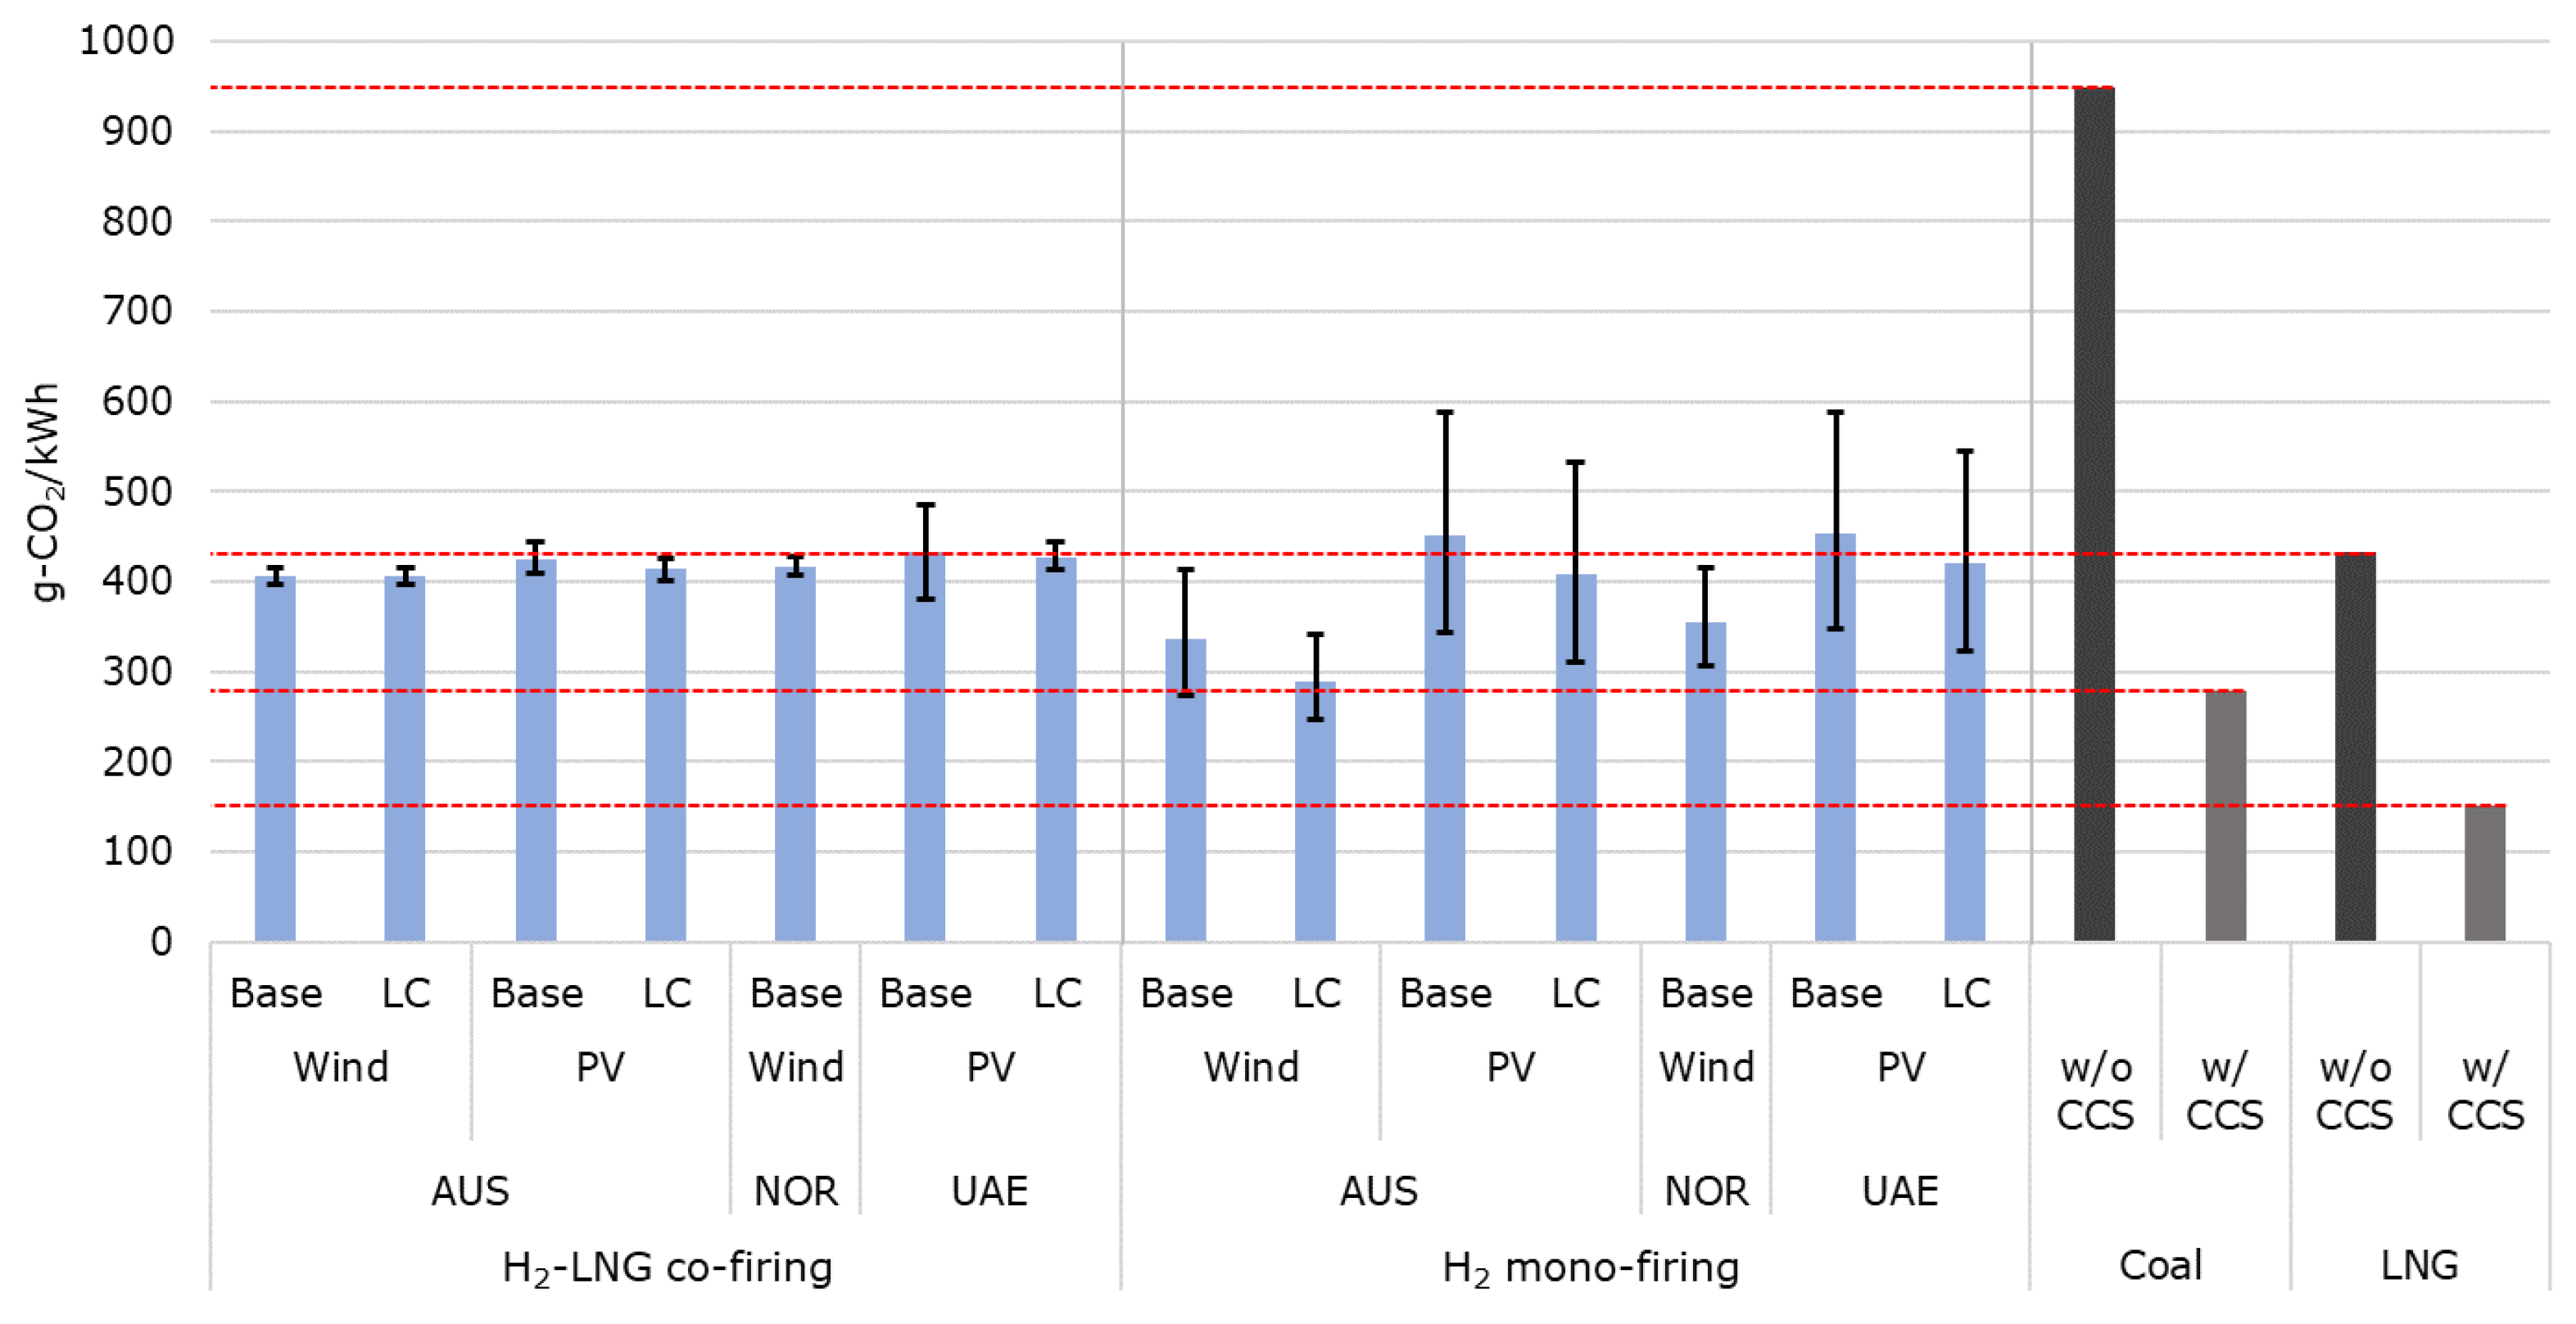
We conducted an LCI analysis of both hydrogen and NH3 power generation (co-firing and mono-firing), while considering the uncertainties, to identify and understand the factors that are important for realizing low-carbon generation using hydrogen energy in the electric power sector. Hydrogen was assumed to be produced from renewable energy sources in AUS, NOR, and the UAE and stored and transported using LH2 and MCH as carriers, while NH3 was assumed to be produced from renewable energy or natural gas in the UAE. Parameters related to the supply chain were collected from the literature, and the Japanese life-cycle inventory database IDEA was used to calculate emissions. The probability distributions of each parameter were established using the energy consumption and CO2 emissions of each process in the supply chain as variables, and the uncertainties of life-cycle CO2 emissions were calculated stochastically using Monte Carlo simulation. We compared the life-cycle CO2 emissions of hydrogen and NH3 power generation obtained from the Monte Carlo simulations with those of thermal power generation, as shown in Figure 8, Figure 9 and Figure 10. The bars represent the mean of the results, and the error bars represent the 99.7% confidence interval (corresponding to 3σ if a normal distribution is assumed). Probability distributions of the life-cycle CO2 emissions of hydrogen and NH3 power generation are also illustrated in Appendix B Figure A1, Figure A2, Figure A3, Figure A4, Figure A5, Figure A6 and Figure A7 (see Appendix B).
3.1. Hydrogen Power Generation
Figure 8 shows life-cycle CO2 emissions of hydrogen power generation when LH2 is used as the energy carrier. The leftmost seven bars illustrate the emissions of hydrogen–LNG co-firing power generation (hydrogen co-firing ratio: 20%). If hydrogen is produced in AUS and the UAE and the base case is selected (grid electricity is used for overseas processes other than hydrogen production), the range of emission variation from hydrogen–LNG co-firing power generation includes those from LNG-fired power generation without CCS, which indicate that the two power generations are comparable with each other. On the other hand, in the low-carbon cases of AUS and the UAE (where all electricity consumption in overseas processes is covered by renewable energy) and in the case of hydrogen production in NOR, emissions are lower than those from LNG-fired power generation without CCS, indicating that the co-firing of hydrogen can reduce CO2 emissions from LNG power plants. NOR has low emissions in the base case owing to the low CO2 emission intensity of its grid electricity. It is also confirmed that emissions from hydrogen–LNG co-firing power generation is higher than those from coal- or LNG-fired power generation with CCS in all cases.
The differences between the cases become even more pronounced with hydrogen mono-firing. When hydrogen is produced in AUS and the UAE and the base case is selected, the range of emission variation is very large, and the emissions can reach those from coal-fired power generation in the worst case. The main reason for this is the effect of electricity consumption on the hydrogen liquefaction. As shown in Appendix A Table A2, the probability distribution of electricity consumption for hydrogen liquefaction has a large standard deviation. If grid electricity from AUS and the UAE (having high CO2 emission intensities) is used for hydrogen liquefaction, the uncertainty attributed to this process will affect the emissions of the entire supply chain.
This uncertainty can be reduced by selecting a low-carbon case. In the low-carbon case of solar PV in AUS or the UAE, CO2 emissions from electricity consumption are reduced by using renewable energy for hydrogen liquefaction, while life-cycle CO2 emissions are lower than those from coal-fired power generation with CCS and comparable to LNG-fired power generation with CCS. If hydrogen is produced from wind power in AUS and the low-carbon case is chosen, or if hydrogen is produced in NOR, emissions will be lower than those of LNG-fired power generation with CCS.
Thus, if LH2 is used as the energy carrier, the life-cycle CO2 emissions of hydrogen power generation can be reduced by using renewable energy and grid electricity with low CO2 emission intensity for hydrogen liquefaction.
Figure 9 shows life-cycle CO2 emissions of hydrogen power generation when MCH is used as the energy carrier. In the case of hydrogen–LNG co-firing power generation (at a hydrogen mixed combustion ratio of 20%), the range of emission variation is comparable to those of LNG-fired power generation without CCS, except in cases where hydrogen is produced by wind power in AUS. Even in the AUS wind cases, the superiority to LNG-fired power generation is limited, indicating that the effect of CO2 emission reduction of hydrogen co-firing is smaller when MCH is used as the energy carrier rather than LH2. On the other hand, a comparison of hydrogen mono-firing with LNG-fired power generation without CCS shows that the emissions from hydrogen mono-firing are lower when hydrogen is produced by wind power in AUS and NOR. Especially if hydrogen is produced by wind power in AUS and the low-carbon case is selected, emissions is comparable to those from coal-fired power generation with CCS.
A comparison of the base case with the low-carbon case shows no significant difference in terms of emissions, which indicates that the effect of low-carbon electricity consumption in the overseas process is small because the power consumption is smaller than that of LH2. In addition, a large amount of heat is required during MCH dehydrogenation, and CO2 emissions from heat consumption account for 0~45% of the total. If the fuel for the dehydrogenation reaction is changed from HFO to city gas, CO2 emissions from heat consumption can be reduced by ~20%. These results suggest the possibility of reducing CO2 emissions by using a low-carbon fuel or implementing waste-heat utilization in the MCH dehydrogenation process.
3.2. NH3 Power Generation
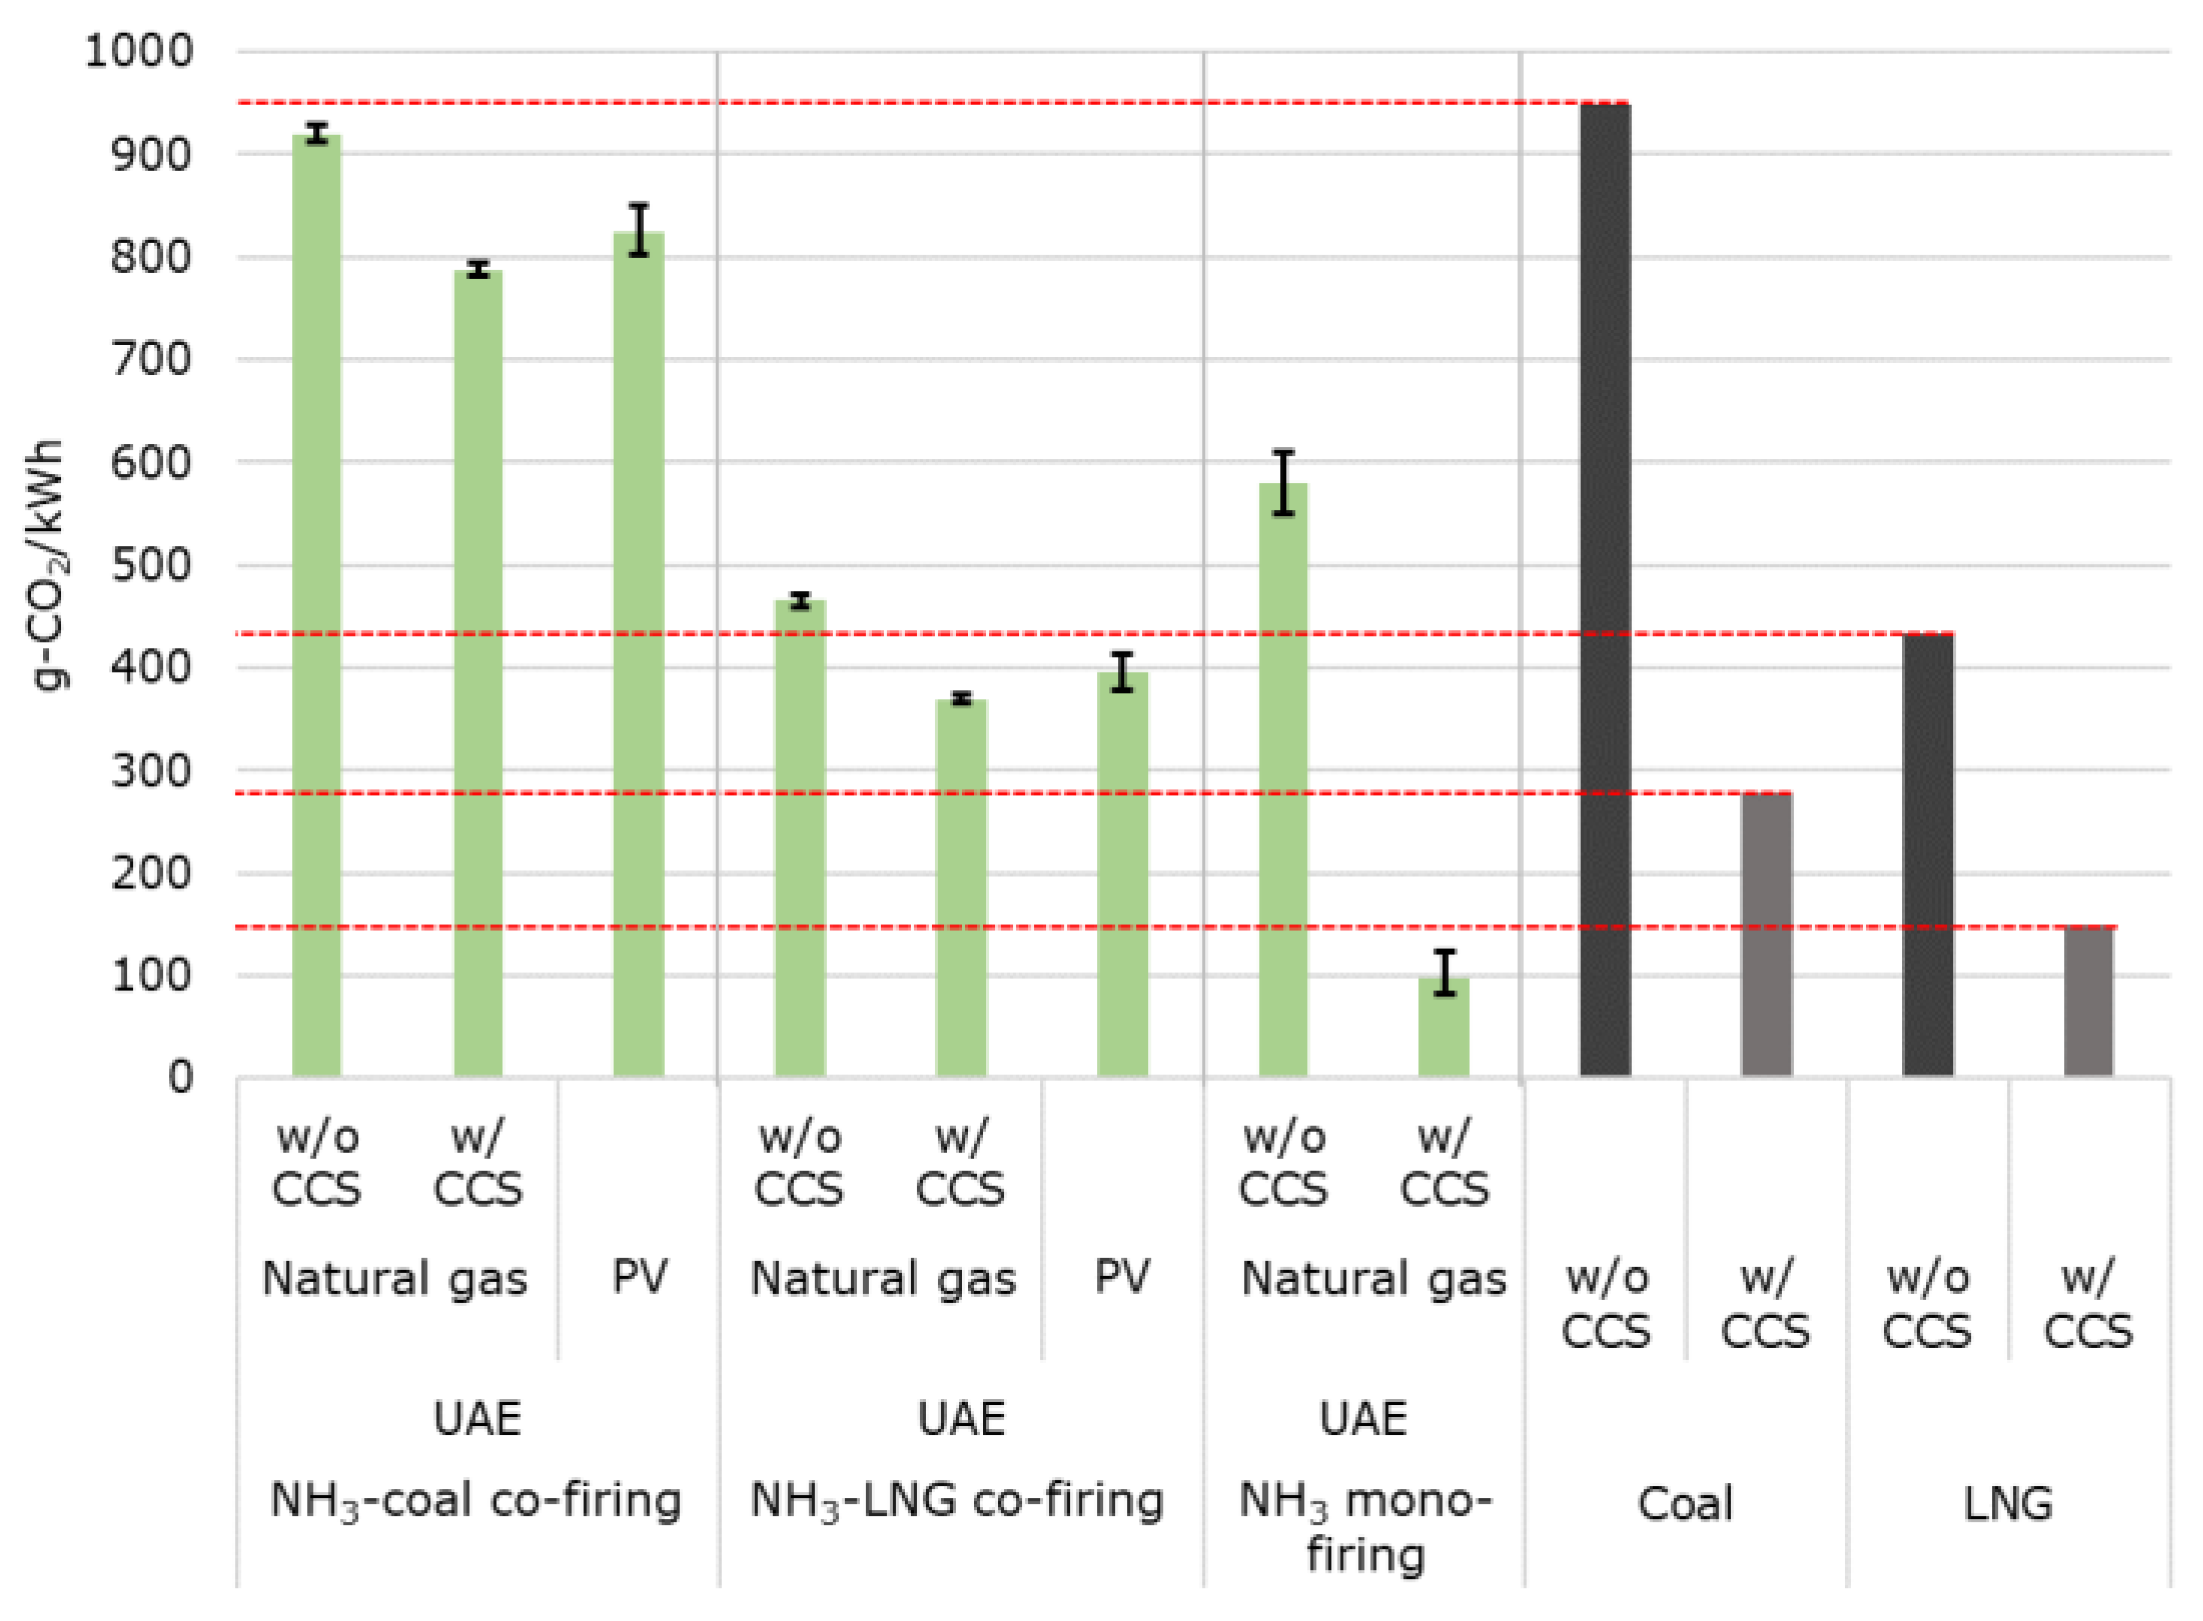
Figure 10 shows life-cycle CO2 emissions of NH3 power generation. The result for NH3–coal co-firing (at an NH3 co-firing rate of 20%) shows that the range of emission variation is lower than those from coal-fired power generation without CCS in all cases, indicating that NH3 co-firing is effective in reducing CO2 emissions from coal power plants. In contrast, when comparing NH3–LNG co-firing (at an NH3 co-firing rate of 20%) and LNG-fired power generation without CCS, the emissions from NH3–coal co-firing are lower if CCS is implemented, or when solar PV power is used in NH3 production process. This result indicates that environmental benefits of NH3 co-firing in LNG power plants can be gained when a low-carbon NH3 production process is selected.
For NH3 mono-firing, it is observed that the range of emission variation without CCS during NH3 production from natural gas is higher than those of LNG-fired power generation without CCS, while the range of emission variation with CCS is lower than those of LNG-fired power generation with CCS. The latter result implies that the effect of CO2 emission reduction of CCS during NH3 production is greater than that of CCS during power generation, because the NH3 production process emits highly pure CO2 derived from the raw material and CCS is easier to implement than in thermal power generation. These results show that the use of CCS in the NH3 production process can reduce the life-cycle CO2 emissions of NH3 power generation.
3.3. Summary of Results
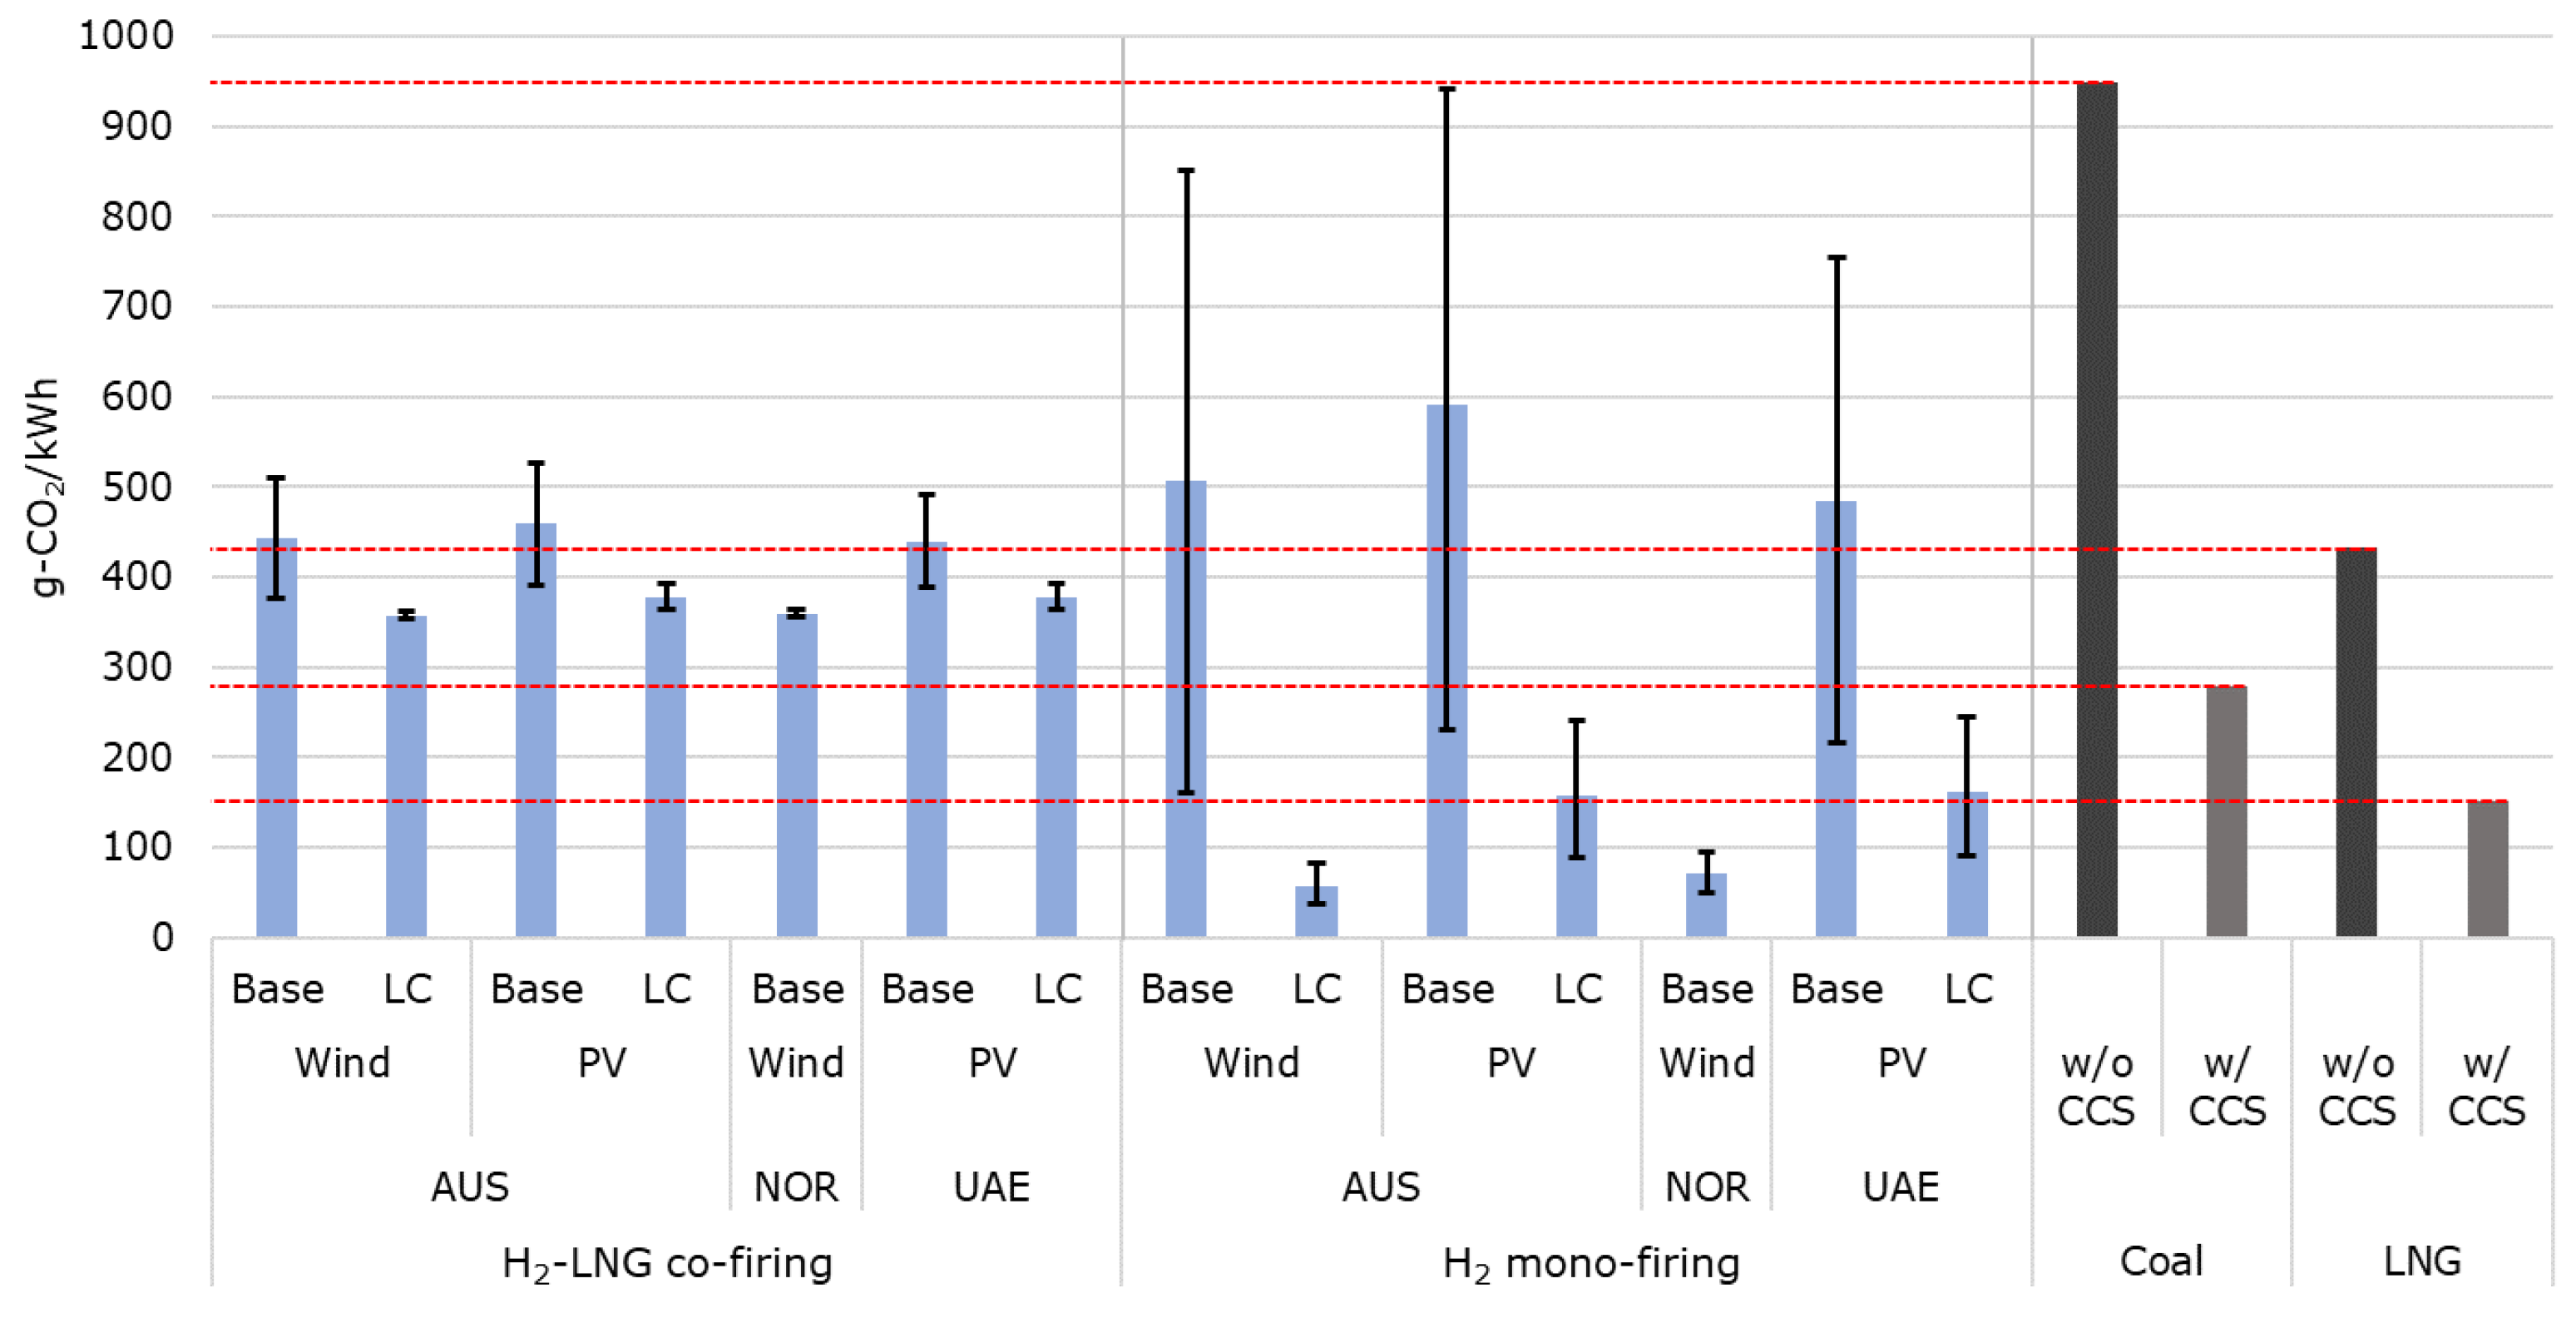
Figure 11 and Table 8 summarize representative results on life-cycle CO2 emissions of hydrogen and NH3 power generation. The results show that life-cycle CO2 emissions of hydrogen mono-firing power generation using LH2 should be lower than those of LNG-fired power generation with CCS if hydrogen is produced from wind power in AUS and the low-carbon case is chosen, or if hydrogen is produced in NOR. Since electricity consumption for hydrogen liquefaction has a wide range of uncertainty, the total emissions can be decreased by utilizing low-carbon electricity for this process. Therefore, large-scale renewable power plants are required for supplying electricity to hydrogen production and liquefaction processes in hydrogen-producing countries. The results also indicate that life-cycle CO2 emissions of NH3 mono-firing power generation should be lower than those of LNG-fired power generation with CCS if CCS is available for NH3 production process in the UAE. Since the CO2 from NH3 synthesis process has a high density, CO2 capture from NH3 production process is more efficient than post-combustion CO2 capture from power plants.
This study focuses on the environmental benefit of using hydrogen and NH3 produced from renewable energy or natural gas as a power generation fuel. The LCI and its uncertainty analysis techniques used in this study can also be applied to other technology value chains where technological parameters are available. Moreover, the Monte Carlo method can be applied for uncertainty analysis of procurement cost for any technology value chain by assuming investment cost, operation and management cost, and commodity prices for each process.
4. Conclusions
This study evaluated uncertainties regarding the environmental benefits of hydrogen use in the electricity sector by applying the Monte Carlo method for LCI analysis. The results show that the life-cycle CO2 emissions of hydrogen power generation using LH2 is influenced by the uncertainty of electricity consumption during hydrogen liquefaction, whereas using low-carbon power sources (such as renewable energy for this process) can reduce uncertainty and CO2 emissions. In the case of using MCH, while CO2 emissions are not significantly affected by the power consumption of overseas processes, it is suggested that CO2 emissions be reduced by implementing low-carbon fuel and waste-heat utilization during MCH dehydrogenation. The life-cycle CO2 emissions of NH3 power generation are significantly affected by a low-carbon NH3 production process, and in particular, CCS during NH3 production has a greater CO2 emission reduction effect than CCS during power generation.
An assessment of the entire hydrogen energy supply chain provides important insights for realizing a significant reduction in the carbon emissions of hydrogen energy. In this study, we focused on the production of hydrogen and NH3 using renewable energy or natural gas. In the future, it may be necessary to conduct similar analyses of lignite gasification and hydrogen production using domestic resources to examine various possibilities for realizing a low-carbon energy system through hydrogen energy. Similarly, we note that conducting life-cycle analysis to include economic, social, and other environmental impacts as a part of multiple criteria analyses will also be increasingly important for the deliberation of hydrogen’s potential role as an energy medium [58,59,60,61].
Author Contributions
Conceptualization, Y.K.; methodology, A.O., and Y.K.; software, A.O.; formal analysis, A.O.; investigation, A.O.; resources, A.O. and Y.K.; data curation, A.O. and Y.K.; writing—original draft preparation, A.O.; writing—review and editing, Y.K.; visualization, A.O.; supervision, Y.K.; project administration, Y.K.; funding acquisition, Y.K. All authors have read and agreed to the published version of the manuscript.
Funding
This research received no external funding.
Institutional Review Board Statement
Not applicable.
Informed Consent Statement
Not applicable.
Data Availability Statement
Not applicable.
Conflicts of Interest
The authors declare no conflict of interest.
Abbreviations
| AIST | National Institute of Advanced Industrial Science and Technology |
| AUS | Australia |
| CCS | Carbon capture and storage |
| CO2 | Carbon dioxide |
| GHG | Greenhouse gas |
| CH4 | Methane |
| CRIEPI | Central Research Institute of Electric Power Industry |
| HFO | Heavy fuel oil |
| HHV | Higher heating value |
| IDEA | Inventory Database for Environmental Analysis |
| IEA | International Energy Agency |
| IRENA | International Renewable Energy Agency |
| ISO | International Organization for Standardization |
| JHFC | Japan Hydrogen & Fuel Cell Demonstration |
| JPEC | Japan Petroleum Energy Center |
| JRC-IET | Joint Research Centre Institute for Energy and Transport |
| LC | Low-carbon |
| LCI | Life-cycle inventory |
| LH2 | Liquid hydrogen |
| LNG | Liquefied natural gas |
| MCH | Methylcyclohexane |
| METI | Ministry of Economy, Trade and Industry |
| NETL | National Energy Technology Laboratory |
| NH3 | Ammonia |
| NOR | Norway |
| NOx | Nitrogen oxide |
| Probability density function | |
| PV | Photovoltaic |
| RD&D | Research, development, and demonstration |
| RITE | Research Institute of Innovative Technology for the Earth |
| SD | Standard deviation |
| TOL | Toluene |
| UAE | United Arab Emirates |
Appendix A
This section describes the probability distributions of the parameters related to the hydrogen supply chains. This study followed the method described in a previous study [19]. First, the variations in a parameter are collected by literature surveys, and their mean () and standard deviation () are obtained as shown in Equations (A1) and (A2):
It is assumed that the parameter follows a normal distribution with mean and standard deviation , if is equal to or smaller than one-third of (). On the other hand, a triangular distribution is assumed for the parameter , and its median, and lower and upper limits are set as the mean, minimum, and maximum values of , if is larger than one-third of (), which is due to the prevention of energy input or CO2 emission intensity from taking a negative value. If only one data point can be obtained for a parameter (), it is assumed that the parameter follows a normal distribution with mean and standard deviation . Table A1, Table A2 and Table A3 show the probability distributions set in this study.

Table A1.
Uncertainty parameters for renewable power generation.
| Parameter [Unit] | Mean | SD | Reference(s) | |
|---|---|---|---|---|
| CO2 emissions for wind power in AUS [g-CO2/kWh] | Normal | 12.4 | 1.2 | [20,23,27] |
| CO2 emissions for solar PV in AUS [g-CO2/kWh] | Normal | 39.2 | 3.9 | [20,23,27] |
| CO2 emissions for wind power in NOR [g-CO2/kWh] | Normal | 12.1 | 1.2 | [20,23,27] |
| CO2 emissions for solar PV in UAE [g-CO2/kWh] | Normal | 39.9 | 4.0 | [20,23,27] |
AUS, Australia; NOR, Norway; PDF, probability density function; PV, photovoltaic; SD, standard deviation; UAE, United Arab Emirates.
Table A2.
Uncertainty parameters for H2 supply chain.
| Parameter [Unit] | Mean | SD | Min. | Max. | Reference(s) | |
|---|---|---|---|---|---|---|
| Electricity input for hydrogen production via water electrolysis [kWh/Nm3-H2] | Normal | 4.88 | 0.80 | [28,29] | ||
| Electricity input for liquefaction of gaseous hydrogen to produce LH2 [kWh/Nm3-H2] | Normal | 0.906 | 0.244 | [30,31,32,33,34,35] | ||
| Electricity input for LH2 storage at loading port [kWh/Nm3-H2] | Normal | 0.055 | 0.006 | [18] | ||
| LH2 Boil-off rate during ocean transport [%/day] | Triangular | 0.30 | 0.20 | 0.40 | [30,31] | |
| Electricity input for LH2 storage at unloading port [kWh/Nm3-H2] | Normal | 0.017 | 0.002 | [18] | ||
| Electricity input for MCH production [kWh/t-MCH] | Triangular | 40.68 | 7.54 | 93.30 | [30,31,36] | |
| Electricity input for MCH storage at loading/unloading port [kWh/t-MCH] | Normal | 0.915 | 0.120 | [30,31] | ||
| Electricity input for MCH dehydrogenization [kWh/Nm3-H2] | Normal | 0.310 | 0.058 | [30,31,36] | ||
| Electricity input for TOL storage at loading/unloading port [kWh/t-TOL] | Normal | 0.915 | 0.120 | [30,31] |
LH2, liquid hydrogen; MCH, methylcyclohexane; PDF, probability density function; PV, photovoltaic; SD, standard deviation; TOL, toluene.
Table A3.
Uncertainty parameters for NH3 supply chain.
| Parameter [Unit] | Mean | SD | Min. | Max. | Reference(s) | |
|---|---|---|---|---|---|---|
| Electricity input for nitrogen separation from air [kWh/Nm3-N2] | Triangular | 0.249 | 0.195 | 0.380 | [43,44,46] | |
| Electricity input for NH3 production from renewable hydrogen [kWh/kg-NH3] | Triangular | 0.457 | 0.177 | 0.849 | [39,42,45,46] | |
| Natural gas input as a fuel for NH3 production from natural gas [MJ-NG(HHV)/kg-NH3] | Normal | *a | *b | [25] | ||
| Electricity input for NH3 production from natural gas [kWh/kg-NH3] | Normal | *a | *b | [25] | ||
| Steam input for CO2 capture [GJ/t-CO2 captured] | Normal | 2.48 | 0.70 | [40,41,47,48,49,50,51] | ||
| CO2 emissions for steam input for CO2 capture [g-CO2/kg-steam] | Triangular | *c | 0 | *d | [25] | |
| Electricity input for CO2 capture [kWh/t-CO2 captured] | Normal | 23.6 | 2.4 | [40,41] | ||
| Electricity input for CO2 compression [kWh/t-CO2 captured] | Normal | 127.8 | 12.8 | [40,41] | ||
| Electricity input for CO2 injection [kWh/t-CO2 captured] | Normal | 7.0 | 0.7 | [40,41] | ||
| Electricity input for NH3 storage at loading port [kWh/t-NH3] | Normal | 0.83 | 0.08 | [20] | ||
| Electricity input for NH3 storage at unloading port [kWh/t-NH3] | Normal | 2.77 | 0.28 | [20] | ||
| Electricity input for NH3 distribution [kWh/t-NH3] | Normal | 0.57 | 0.06 | [20] | ||
| Electricity input for NH3 re-evaporation [kWh/t-NH3] | Normal | 0.022 | 0.002 | [20] |
*a Data retrieved from the NH3 production process of IDEA v2.2. *b 10% of the data retrieved from the NH3 production process of IDEA v2.2. *c 50% of the data retrieved from steam production by the HFO-fired boiler of IDEA v2.2. *d Data retrieved from steam production by the HFO-fired boiler of IDEA v2.2. HFO, heavy fuel oil; HHV, higher heating value; NG, natural gas; PDF, probability density function; SD, standard deviation.
Appendix B
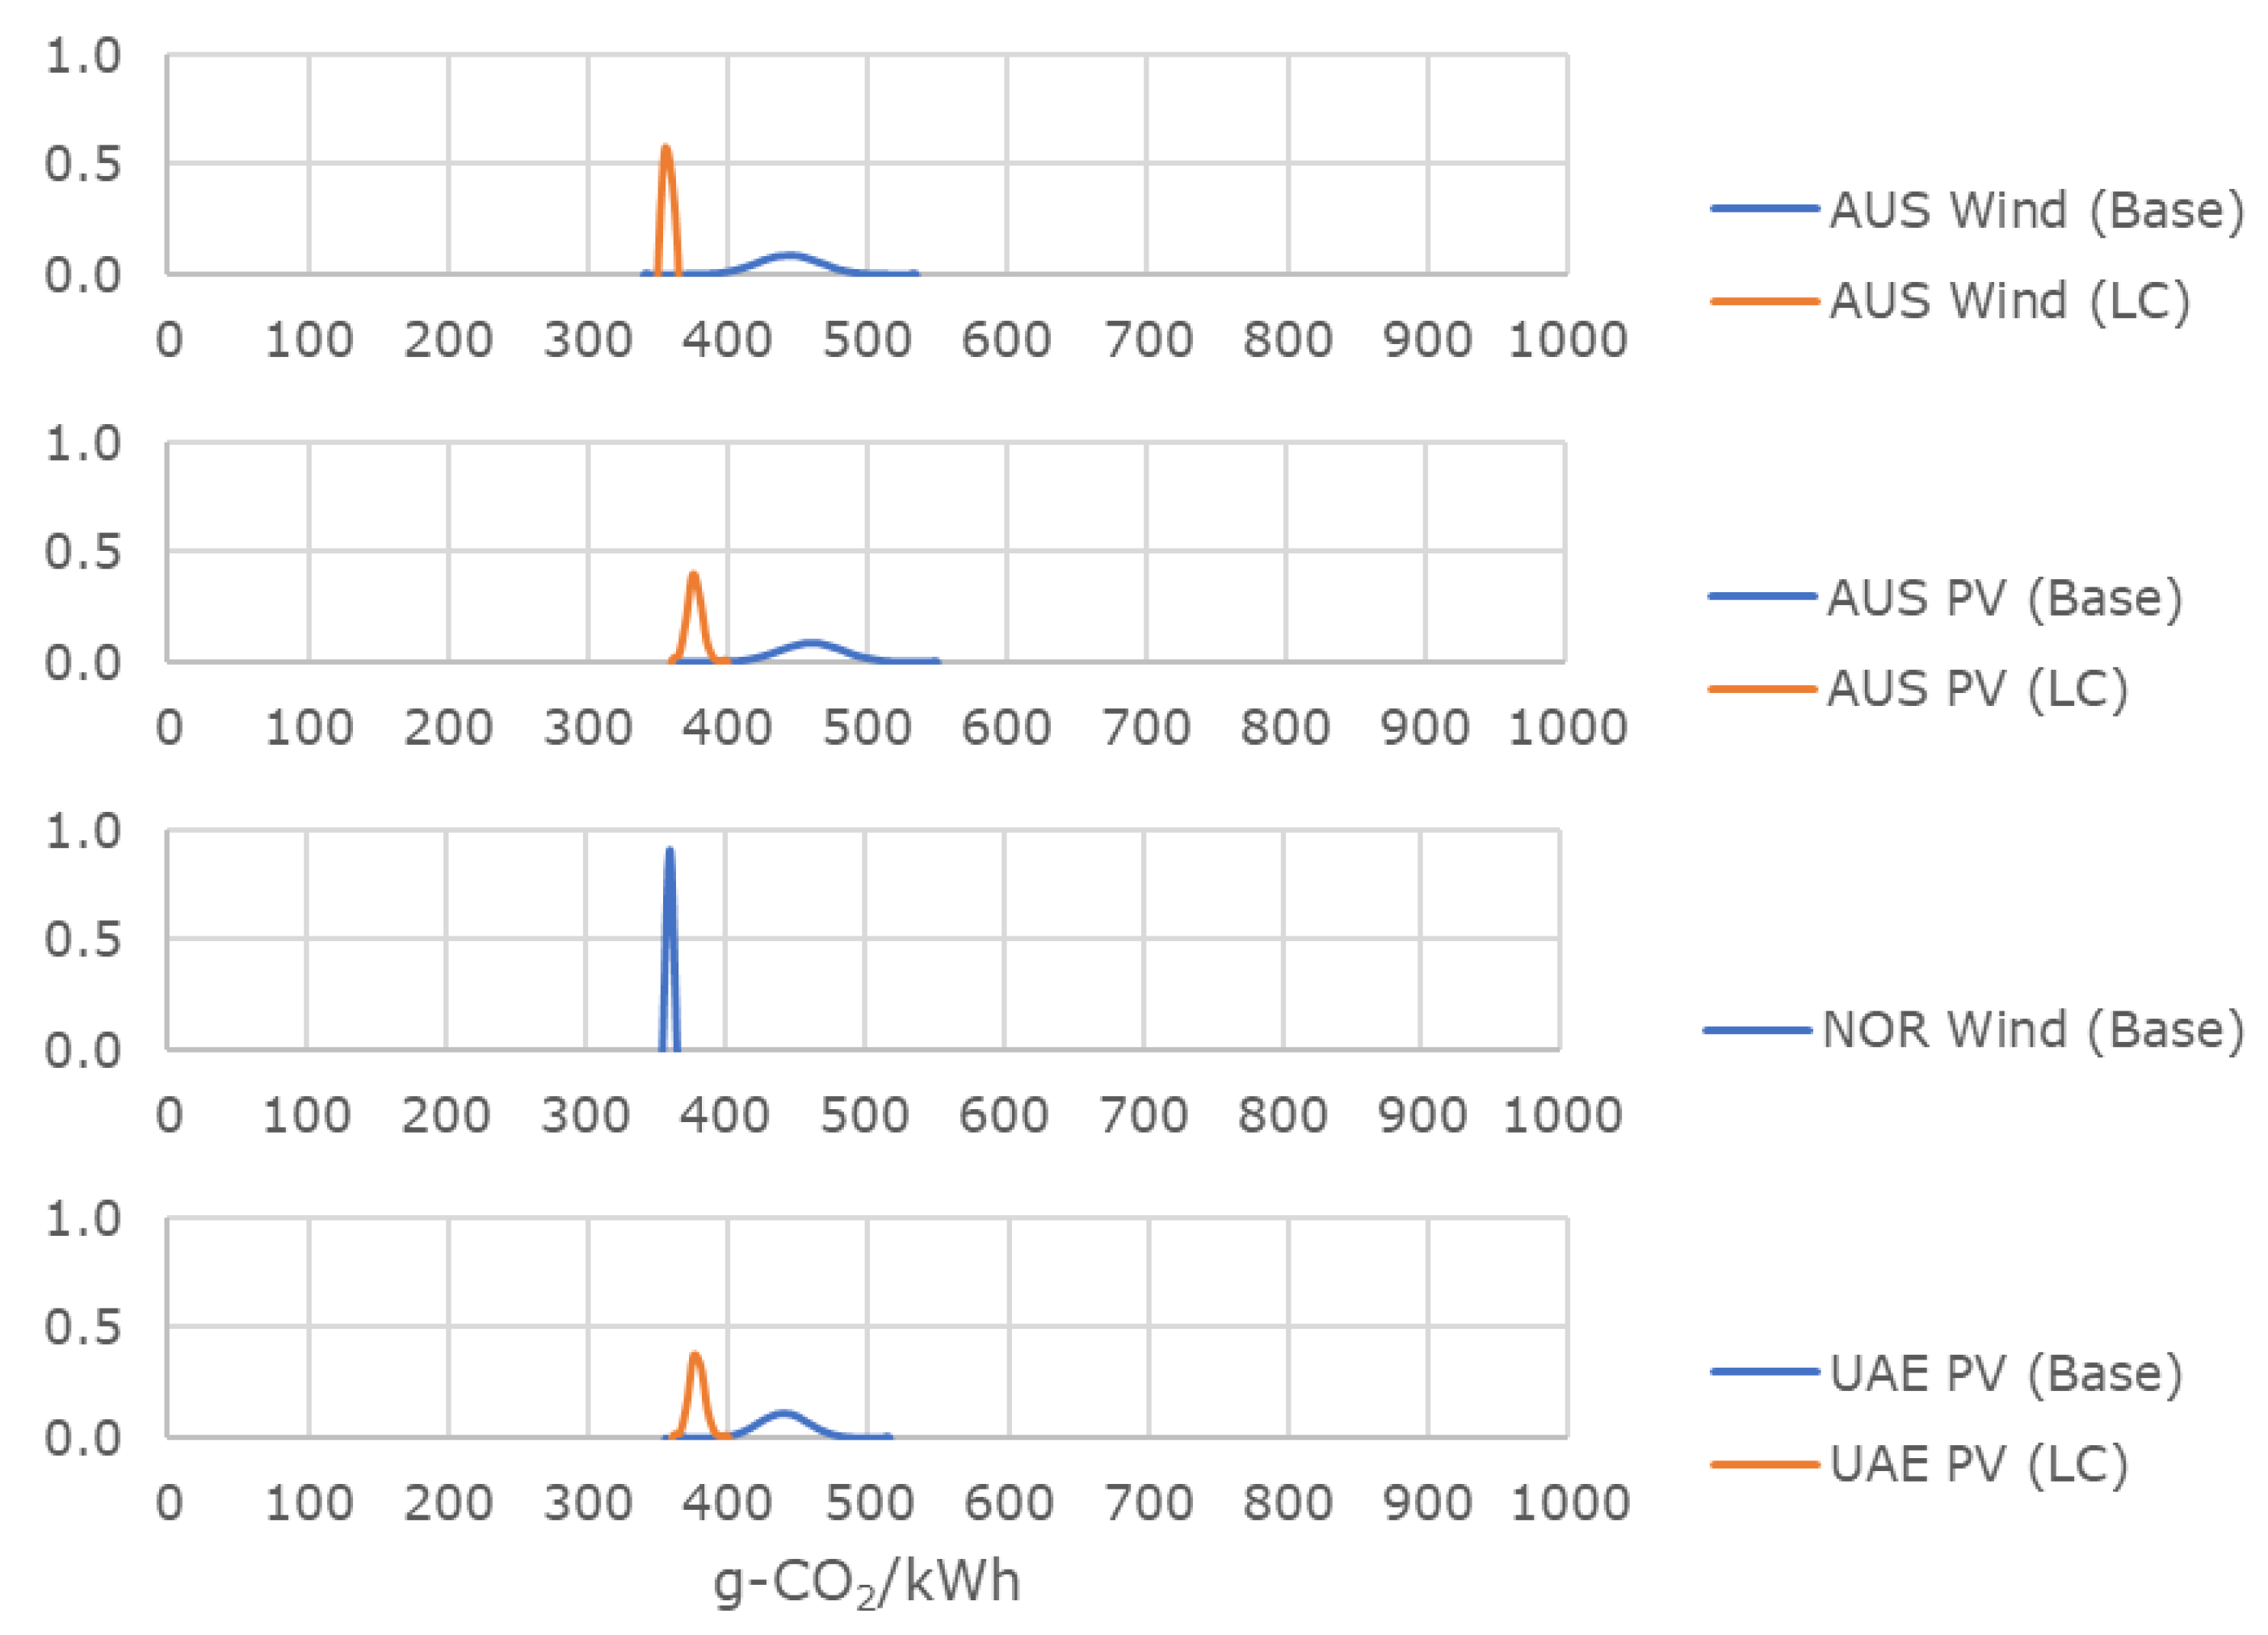
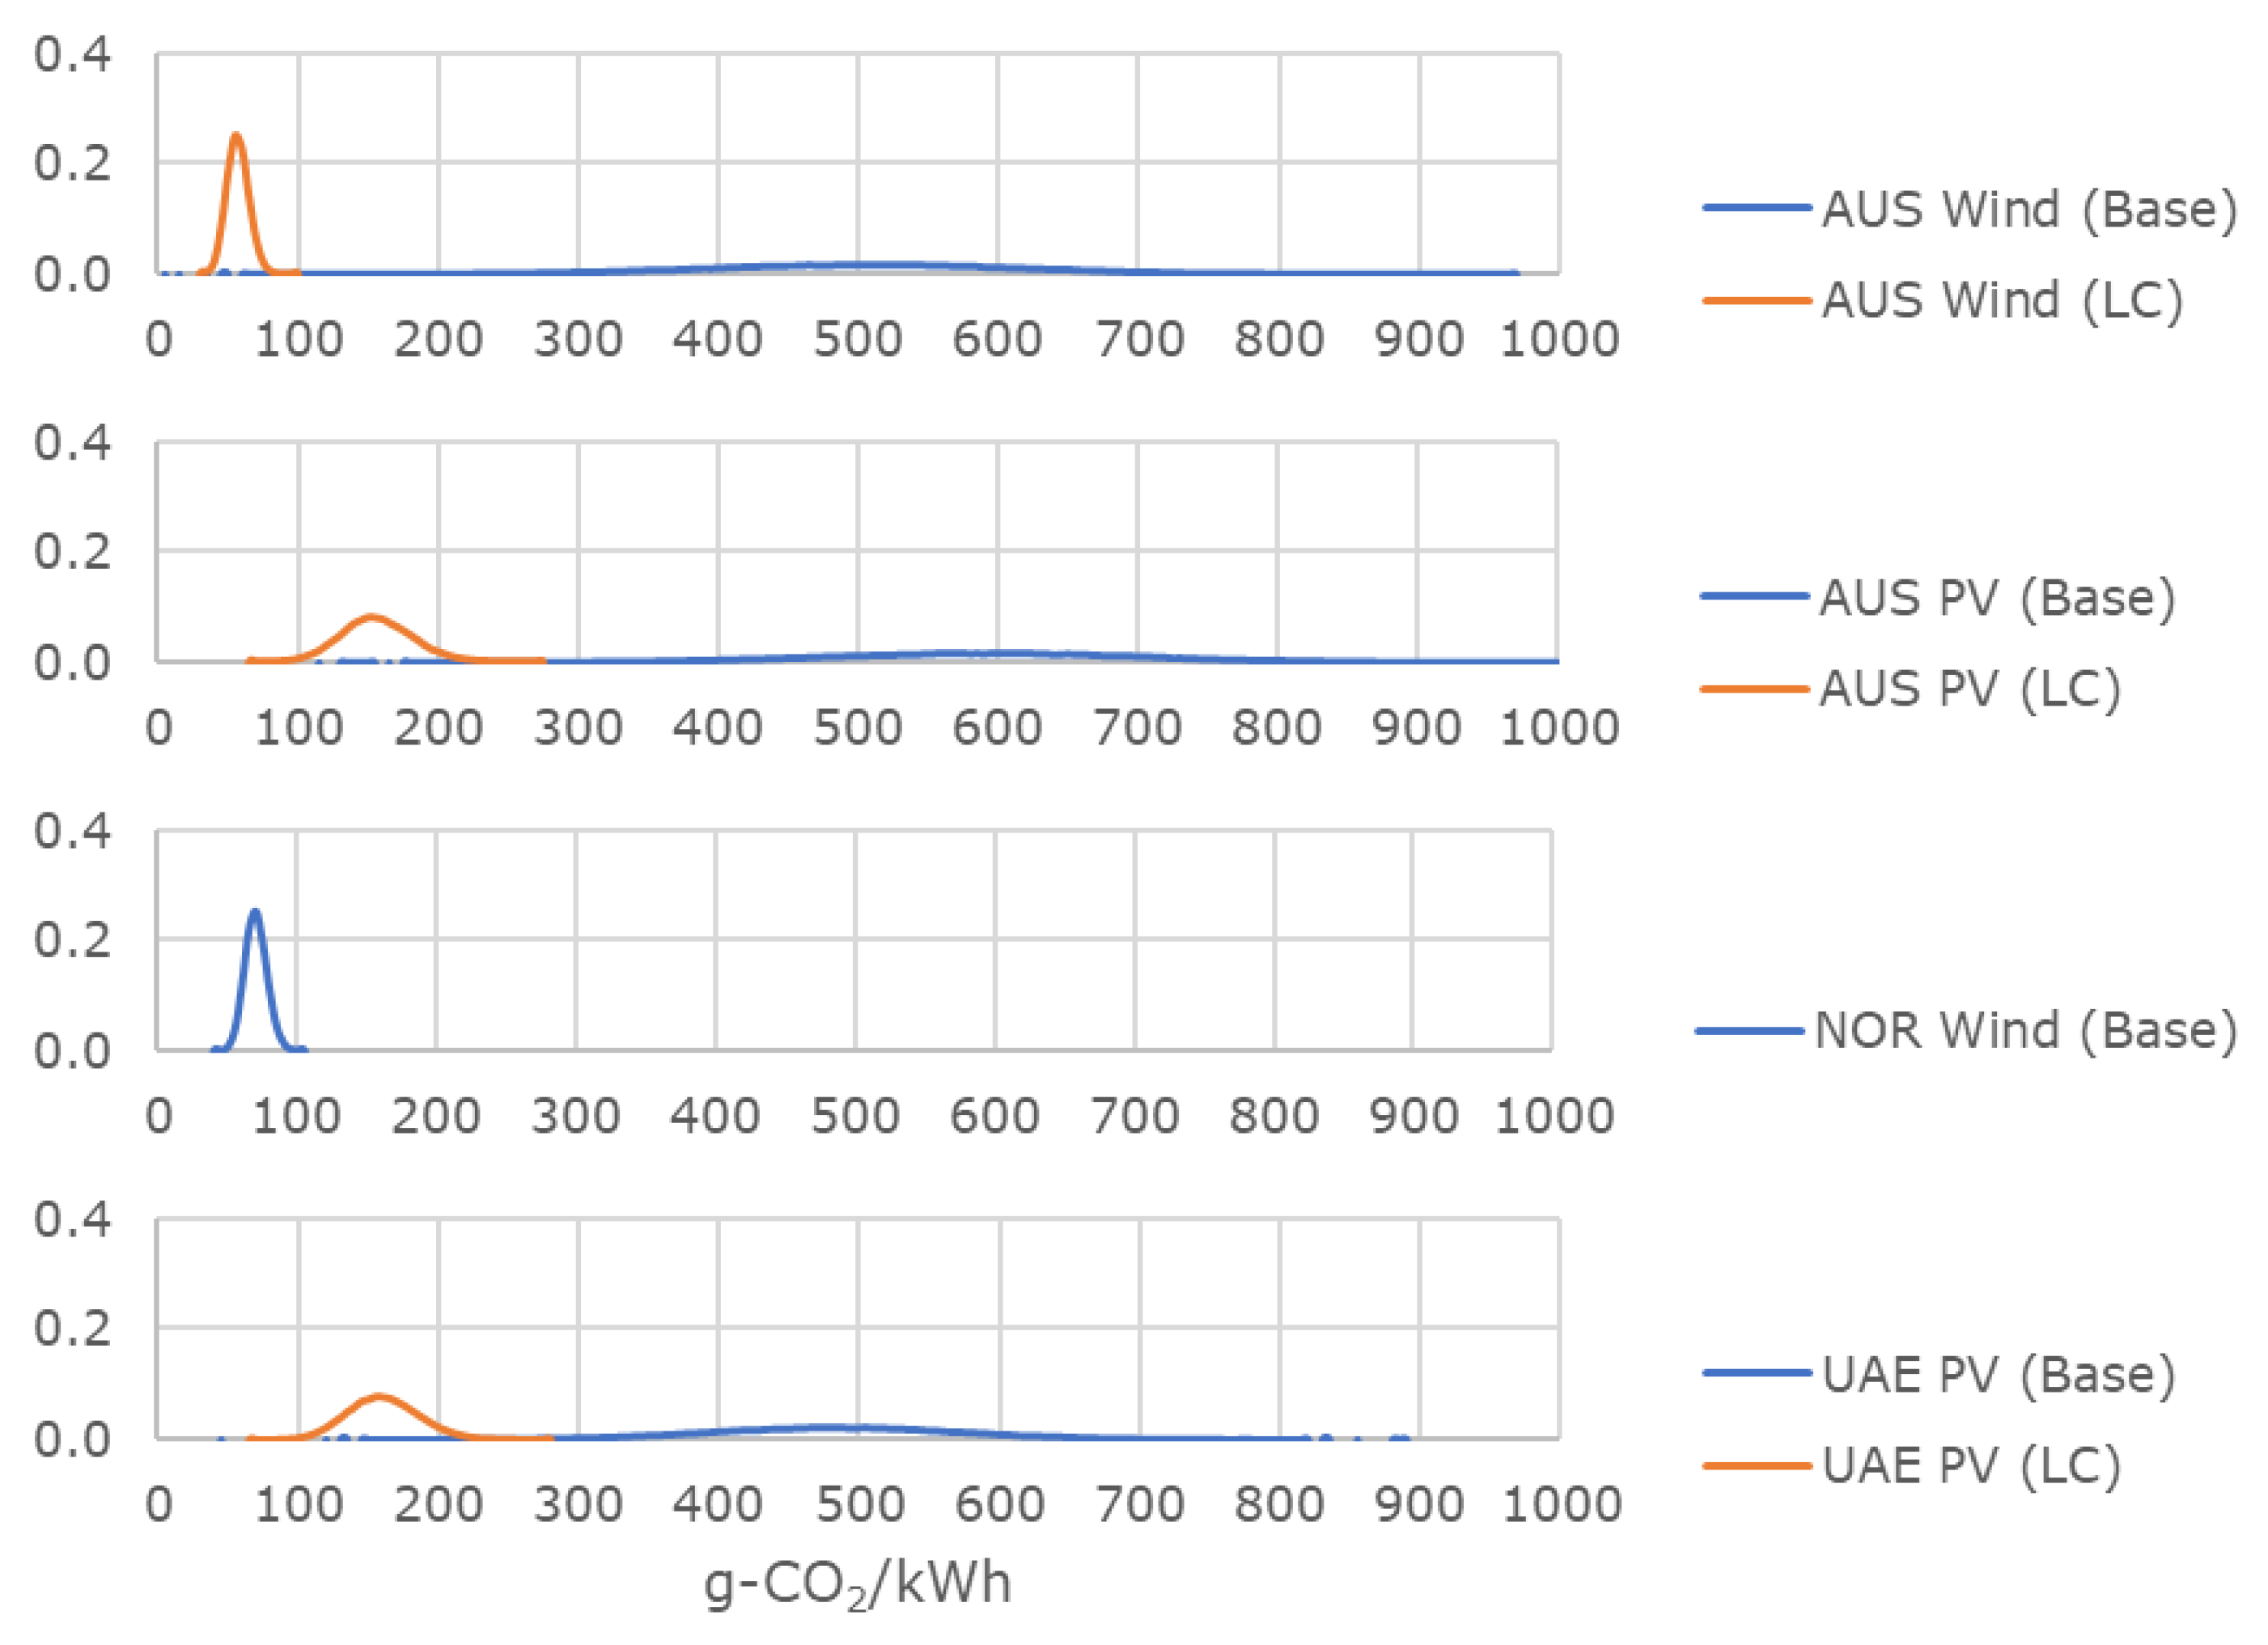
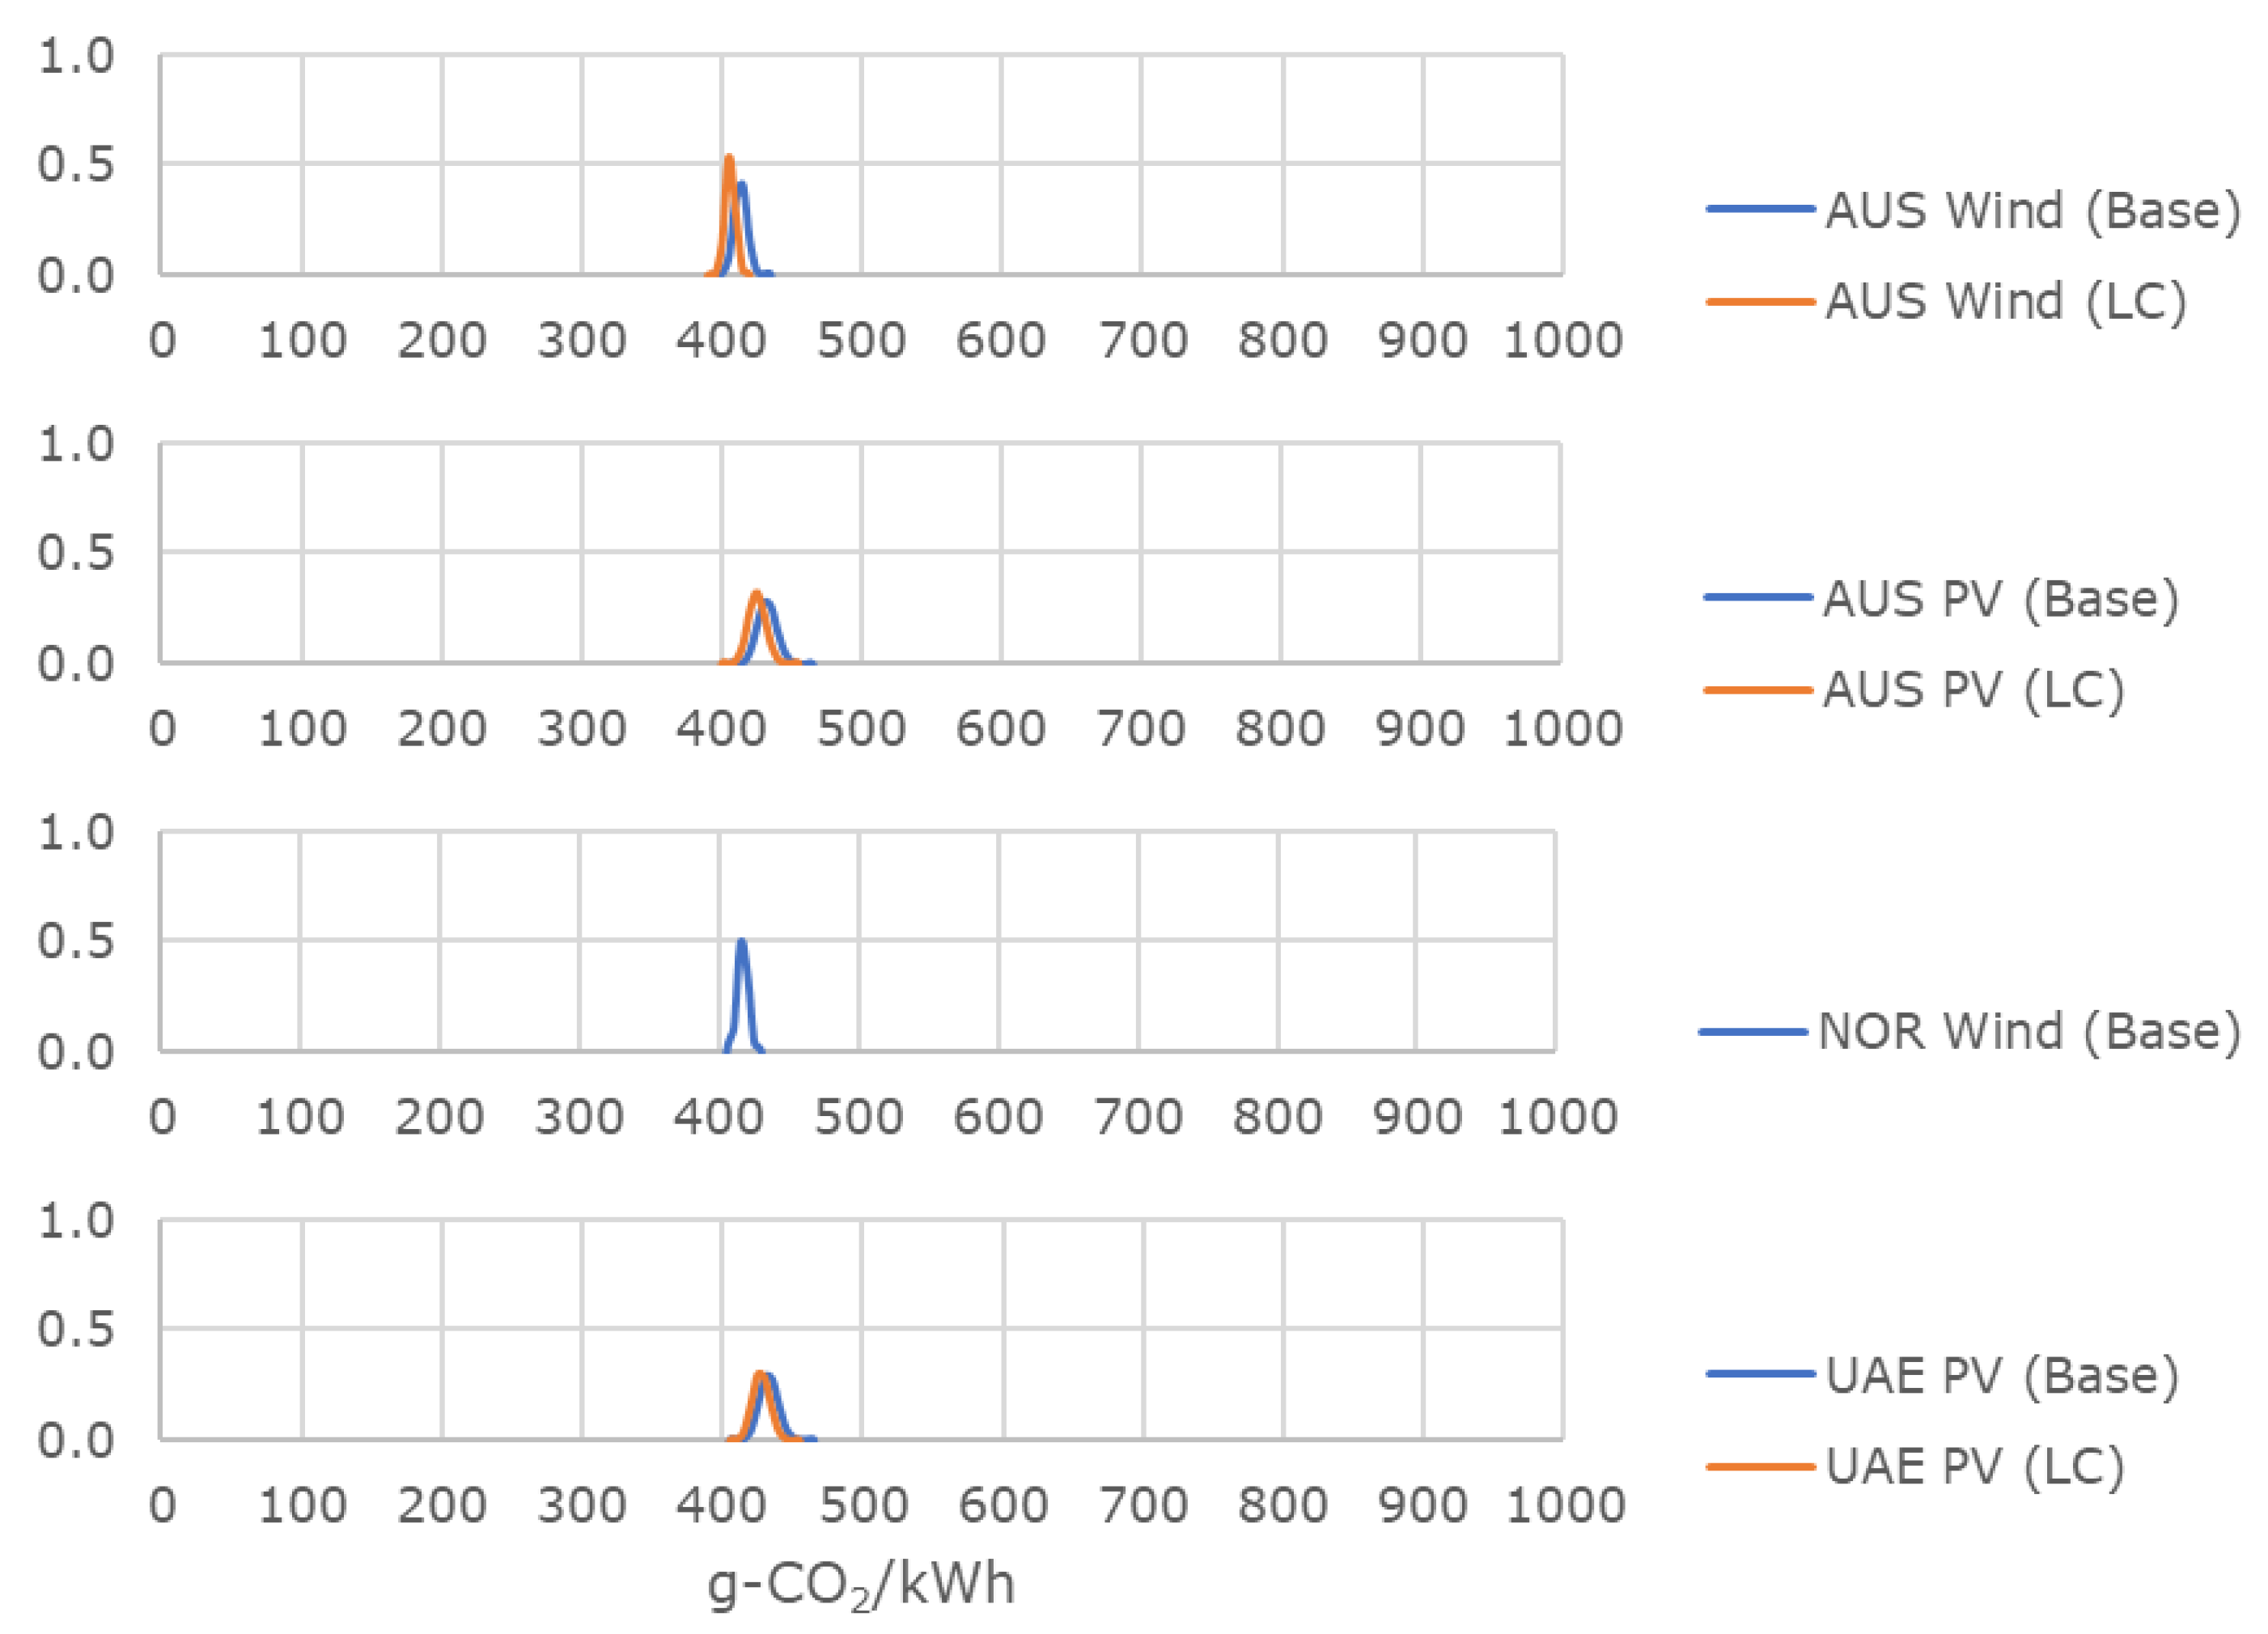
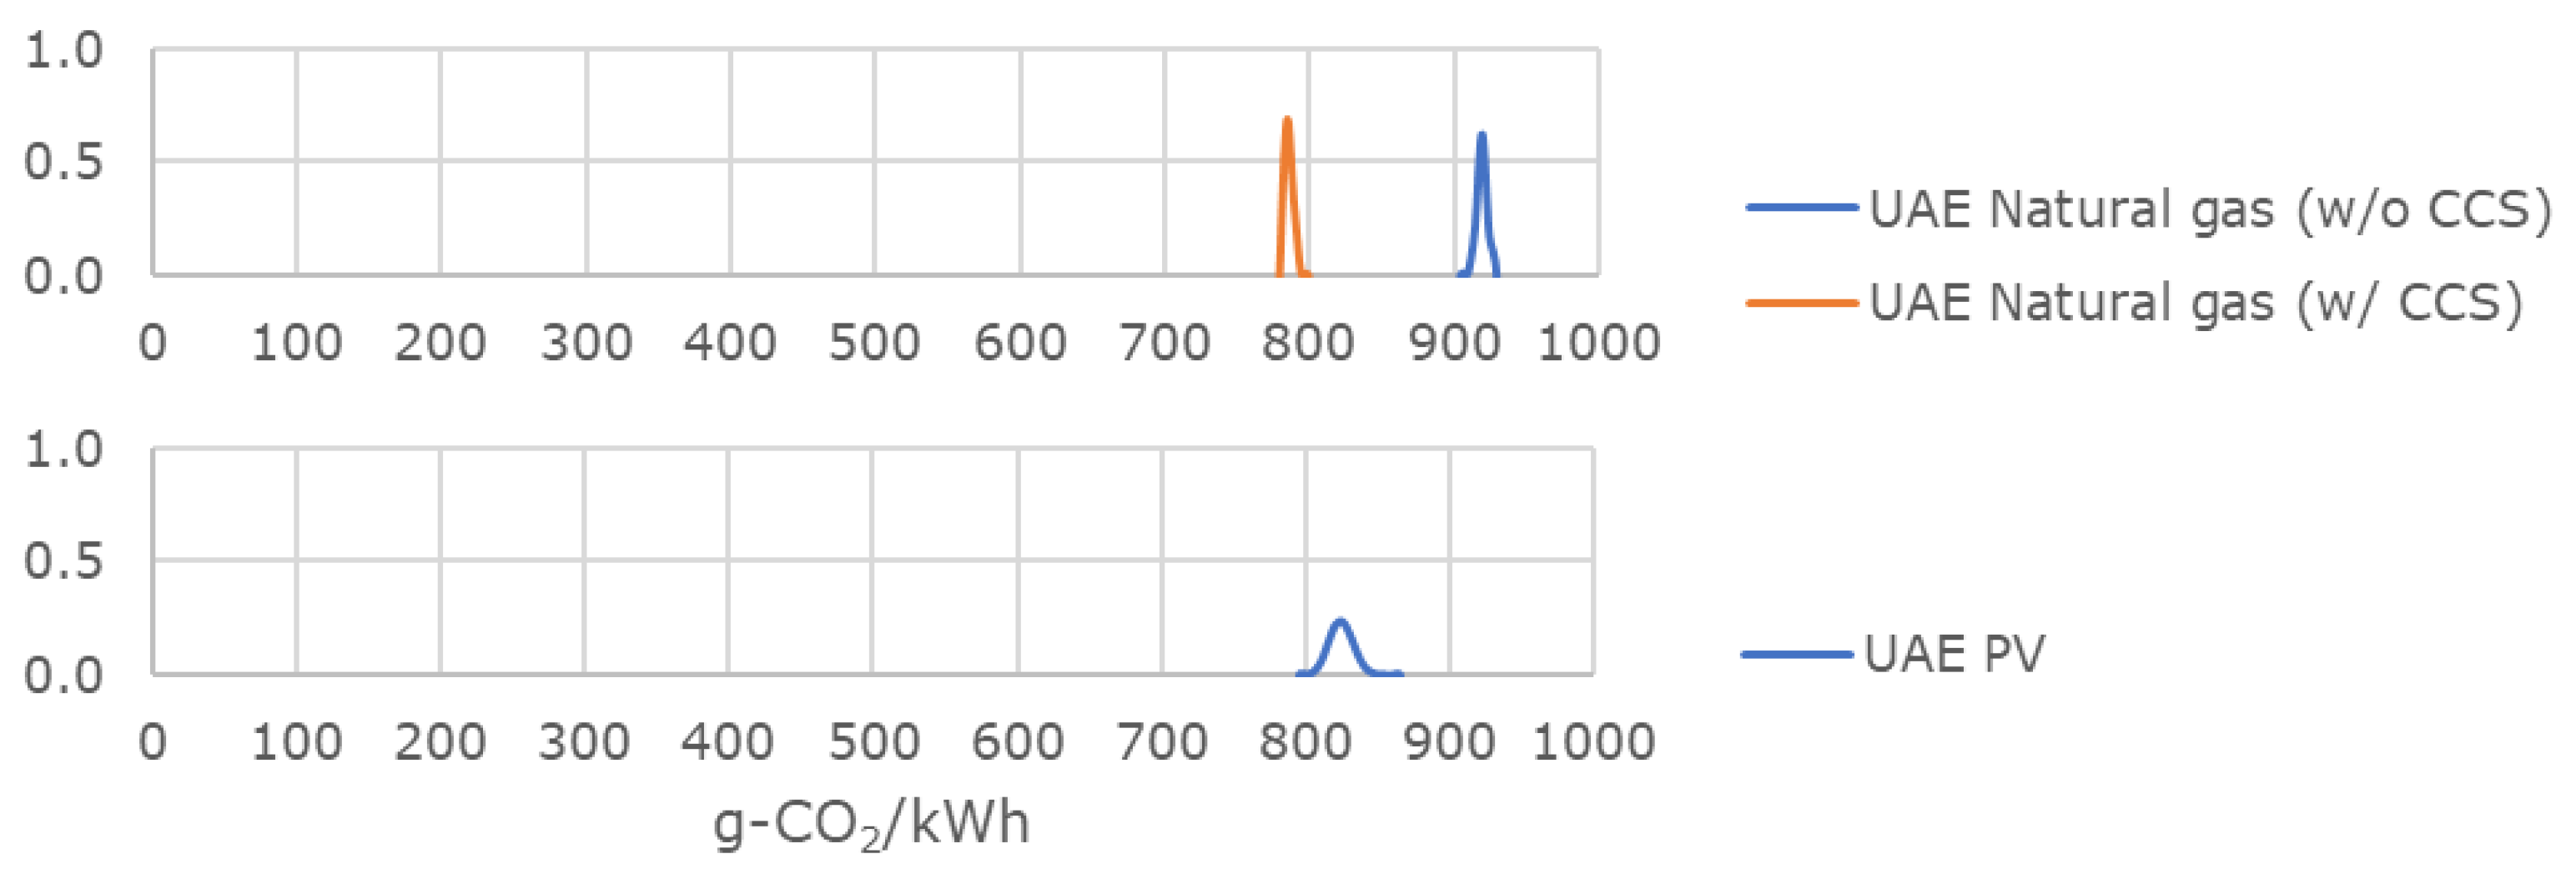
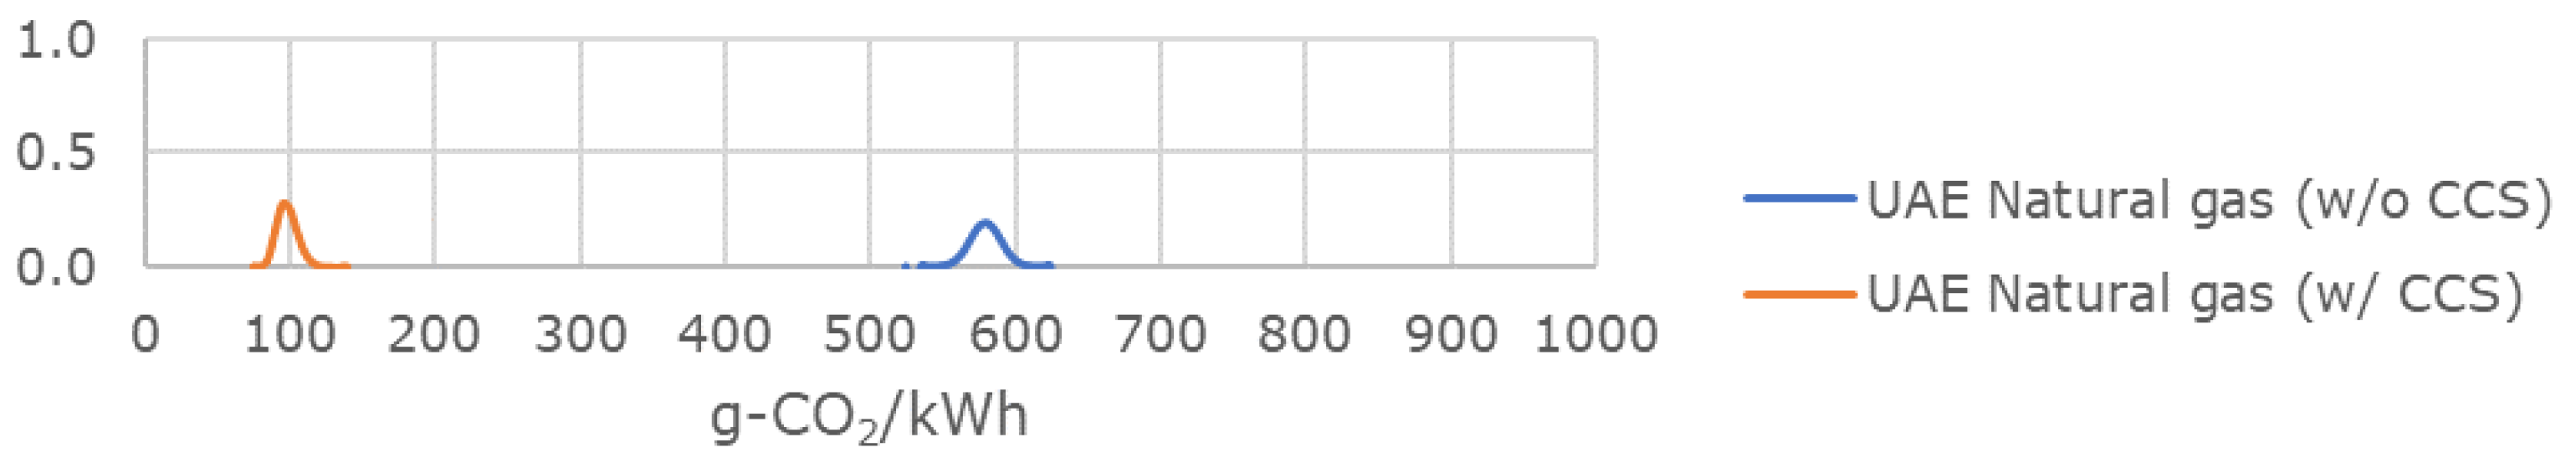
Figure A1, Figure A2, Figure A3, Figure A4, Figure A5, Figure A6 and Figure A7 illustrate probability distributions of life-cycle CO2 emissions of hydrogen and NH3 power generation.
Figure A1.
Probability distributions of life-cycle CO2 emissions of hydrogen-LNG co-firing power generation when LH2 is used as the energy carrier.
Figure A1.
Probability distributions of life-cycle CO2 emissions of hydrogen-LNG co-firing power generation when LH2 is used as the energy carrier.

Figure A2.
Probability distributions of life-cycle CO2 emissions of hydrogen mono-firing power generation when LH2 is used as the energy carrier.
Figure A2.
Probability distributions of life-cycle CO2 emissions of hydrogen mono-firing power generation when LH2 is used as the energy carrier.

Figure A3.
Probability distributions of life-cycle CO2 emissions of hydrogen-LNG co-firing power generation when MCH is used as the energy carrier.
Figure A3.
Probability distributions of life-cycle CO2 emissions of hydrogen-LNG co-firing power generation when MCH is used as the energy carrier.

Figure A4.
Probability distributions of life-cycle CO2 emissions of hydrogen mono-firing power generation when MCH is used as the energy carrier.
Figure A4.
Probability distributions of life-cycle CO2 emissions of hydrogen mono-firing power generation when MCH is used as the energy carrier.

Figure A5.
Probability distributions of life-cycle CO2 emissions of NH3-coal co-firing power generation.
Figure A5.
Probability distributions of life-cycle CO2 emissions of NH3-coal co-firing power generation.

Figure A6.
Probability distributions of life-cycle CO2 emissions of NH3-LNG co-firing power generation.
Figure A6.
Probability distributions of life-cycle CO2 emissions of NH3-LNG co-firing power generation.

Figure A7.
Probability distributions of life-cycle CO2 emissions of NH3 mono-firing power generation.
Figure A7.
Probability distributions of life-cycle CO2 emissions of NH3 mono-firing power generation.

References
- International Energy Agency (IAE). Net Zero by 2050; International Energy Agency (IAE): Paris, France, 2021; Available online: https://www.iea.org/reports/net-zero-by-2050/ (accessed on 4 August 2021).
- Ministry of Economy, Trade and Industry (METI). The Ministerial Council on Renewable Energy Hydrogen and Related Issues. The Basic Hydrogen Strategy; Ministry of Economy, Trade and Industry (METI): Tokyo, Japan, 2017. [Google Scholar]
- Kawasaki Heavy Industries. Kawasaki Hydrogen Road: Paving the Way for a Hydrogen-Based Society. Available online: https://global.kawasaki.com/en/stories/hydrogen/ (accessed on 4 August 2021).
- Chiyoda Corporation SPERA Hydrogen® Chiyoda’s Hydrogen Supply Business. Available online: https://www.chiyodacorp.com/en/service/spera-hydrogen/ (accessed on 4 August 2021).
- Clean Fuel Ammonia Association Clean Fuel Ammonia Association. Available online: https://greenammonia.org/en/ (accessed on 4 August 2021).
- Ozawa, A.; Kudoh, Y.; Murata, A.; Honda, T.; Saita, I.; Takagi, H. Hydrogen in low-carbon energy systems in Japan by 2050: The uncertainties of technology development and implementation. Int. J. Hydrogen Energy 2018, 43, 18083–18094. [Google Scholar] [CrossRef]
- Pambudi, N.A.; Itaoka, K.; Kurosawa, A.; Yamakawa, N. Impact of Hydrogen fuel for CO2 Emission Reduction in Power Generation Sector in Japan. Energy Procedia 2017, 105, 3075–3082. [Google Scholar] [CrossRef]
- Lu, Z.; Kawakami, Y.; Hirai, H. A Study on the Utilization of Ammonia as Energy in Japan; IEEJ: Tokyo, Japan, 2018. [Google Scholar]
- New Energy and Industrial Technology Development Organization (NEDO). World’s First Heat and Electricity Supplied in an Urban Area Using 100% Hydrogen. Available online: http://www.nedo.go.jp/english/news/AA5en_100382.html (accessed on 4 August 2021).
- Ammonia Energy IHI First to Reach 20% Ammonia-Coal Co-Firing Milestone—Ammonia Energy. Available online: http://www.ammoniaenergy.org/ihi-first-to-reach-20-ammonia-coal-co-firing-milestone/ (accessed on 4 August 2021).
- Iki, N.; Kurata, O.; Matsunuma, T.; Inoue, T.; Tsujimura, T.; Furutani, H.; Kobayashi, H.; Hayakawa, A.; Arakawa, Y.; Ichikawa, A. Micro Gas Turbine Firing Ammonia. In Proceedings of the Volume 8: Microturbines, Turbochargers and Small Turbomachines; Steam Turbines; ASME: New York, NY, USA, 2016; p. V008T23A018. [Google Scholar]
- Hydrogen Energy Ministerial Meeting. In Tokyo Statement—Chair’s Summary of Hydrogen Energy Ministerial Meeting; Ministry of Economy, Trade and Industry (METI): Tokyo, Japan, 2018.
- Argonne National Laboratory GREET® Model: The Greenhouse gases, Regulated Emissions, and Energy use in Transportation Model. Available online: https://greet.es.anl.gov/ (accessed on 4 August 2021).
- European Commission Joint Research Centre Institute for Energy and Transport (JRC-IET). Well-to-Tank Report: Version 4.a; European Commission Joint Research Centre Institute for Energy and Transport (JRC-IET): Ispra, Italy, 2014. [Google Scholar]
- Wulf, C.; Kaltschmitt, M. Hydrogen Supply Chains for Mobility—Environmental and Economic Assessment. Sustainability 2018, 10, 1699. [Google Scholar] [CrossRef] [Green Version]
- Ren, L.; Zhou, S.; Ou, X. Life-cycle energy consumption and greenhouse-gas emissions of hydrogen supply chains for fuel-cell vehicles in China. Energy 2020, 209, 118482. [Google Scholar] [CrossRef]
- Toyota Motor Corporation; Mizuho Information & Research Institute. Well-to-Wheel Analysis of Greenhouse Gas. Emissions of Automotive Fuels in the Japanese Context; Toyota Motor Corporation; Mizuho Information & Research Institute: Tokyo, Japan, 2004. [Google Scholar]
- Japan Hydrogen & Fuel Cell Demonstration (JHFC) Project. Analysis of Total Efficiency and GHG Emission; Japan Hydrogen & Fuel Cell Demonstration (JHFC) Project: Tokyo, Japan, 2011. (In Japanese) [Google Scholar]
- Ozawa, A.; Inoue, M.; Kitagawa, N.; Muramatsu, R.; Anzai, Y.; Genchi, Y.; Kudoh, Y. Assessing uncertainties of Well-To-Tank greenhouse gas emissions from hydrogen supply Chains. Sustainability 2017, 9, 1105. [Google Scholar] [CrossRef] [Green Version]
- Ozawa, A.; Kudoh, Y.; Kitagawa, N.; Muramatsu, R. Life cycle CO2 emissions from power generation using hydrogen energy carriers. Int. J. Hydrogen Energy 2019, 44, 11219–11232. [Google Scholar] [CrossRef]
- Chisalita, D.A.; Petrescu, L.; Cormos, C.C. Environmental evaluation of European ammonia production considering various hydrogen supply chains. Renew. Sustain. Energy Rev. 2020, 130, 109964. [Google Scholar] [CrossRef]
- Michiels, F.; Geeraerd, A. How to decide and visualize whether uncertainty or variability is dominating in life cycle assessment results: A systematic review. Environ. Model. Softw. 2020, 133, 104841. [Google Scholar] [CrossRef]
- Kato, T. Possibility of hydrogen production from renewable energy. J. Japan Inst. Energy 2015, 94, 7–18. (In Japanese) [Google Scholar]
- Hiraoka, K.; Fujimura, Y.; Watanabe, Y.; Kai, M.; Sakata, K.; Ishimoto, Y.; Mizuno, Y. Cost evaluation study on CO2-free ammonia and coal co-fired power generation integrated with cost of CCS. In Proceedings of the 15th Annual NH3 Fuel Conference, Pittsburgh, PA, USA, 31 October–1 November 2018. [Google Scholar]
- National Institute of Advanced Industrial Science and Technology (AIST). IDEA (Inventory Database for Environmental Analysis). Available online: http://www.idea-lca.jp/index.html (accessed on 4 August 2021).
- International Energy Agency (IEA). CO2 Emissions from Fuel Combustion 2017; OECD: Paris, France, 2017; ISBN 9789264278189. [Google Scholar]
- International Renewable Energy Agency (IRENA). Renewable Power Generation Costs in 2014; International Renewable Energy Agency (IRENA): Abu Dhabi, UAE, 2015. [Google Scholar]
- Asaoka, Y.; Uotani, M.; Iwahori, T.; Terada, N. Hydrogen Station Model in the Introduction Phase of Hydrogen Energy and its Cost Assessment. Role of Hydrogen Production by Electrolysis; Central Research Institute of Electric Power Industry (CRIEPI): Tokyo, Japan, 2004. (In Japanese) [Google Scholar]
- New Energy and Industrial Technology Development Organization. Guidebook of Hydrogen Utilization; New Energy and Industrial Technology Development Organization: Tokyo, Japan, 2008. (In Japanese) [Google Scholar]
- Institute of Applied Energy (IAE). Study of Intercontinental Renewable Energy Transportation Technology from Foreign Countries; Institute of Applied Energy (IAE): Kanagawa, Japan, 2010. (In Japanese) [Google Scholar]
- Institute of Applied Energy (IAE). Economical Evaluation and Characteristic Analyses for Energy Carrier Systems (FY2014-FY2015) Final Report; Institute of Applied Energy (IAE): Kanagawa, Japan, 2016. (In Japanese) [Google Scholar]
- Institute of Applied Energy (IAE); Iwatani Corporation; Kawasaki Heavy Industries; Kansai Electric Power Company; Shimizu Corporation; Mitsubishi Heavy Industries; Chiyoda Corporation. Feasibility Study in Response to Hydrogen Carriers; Institute of Applied Energy (IAE): Kanagawa, Japan, 2009. (In Japanese) [Google Scholar]
- European Commission Joint Research Centre Institute for Energy and Transport (JRC-IET). WELL-to-WHEELS Report Version 3; European Commission Joint Research Centre Institute for Energy and Transport (JRC-IET): Ispra, Italy, 2008. [Google Scholar]
- Japan Hydrogen & Fuel Cell Demonstration (JHFC) Project. Report on the 4th JHFC Seminar; Japan Hydrogen & Fuel Cell Demonstration (JHFC) Project: Tokyo, Japan, 2005. (In Japanese) [Google Scholar]
- Kawasaki Heavy Industries. Feasibility Study to Realize a Future Energy System (Hydrogen Supply Chain) Using Carbon-free Fuel Derived from Low Rank Coal (FY2012-2013); Kawasaki Heavy Industries: Kanagawa, Japan, 2012. (In Japanese) [Google Scholar]
- Hondo, H.; Morizumi, Y.; Usui, T. Life cycle environmental analysis of hydrogen storage technology using organic hydride: Energy requirement and CO2 emission. J. Japan Inst. Energy 2008, 87, 753–762. (In Japanese) [Google Scholar] [CrossRef]
- Japan Petroleum Energy Center (JPEC). Development of Component Technologies for Off-Site Hydrogen Supply Using Organic Hydrides; Japan Petroleum Energy Center (JPEC): Tokyo, Japan, 2008. (In Japanese) [Google Scholar]
- Japan Petroleum Energy Center (JPEC). Research on Possibilities of Massive Hydrogen Transport Using Organic Hydride; Japan Petroleum Energy Center (JPEC): Tokyo, Japan, 2010. (In Japanese) [Google Scholar]
- Zegers, P. Fuel cell commercialization: The key to a hydrogen economy. J. Power Sources 2006, 154, 497–502. [Google Scholar] [CrossRef]
- Tang, L.; Yokoyama, T.; Kubota, H.; Simoda, A. Life Cycle Assessment of a Pulverized Coal Power Generation with CCS Technology in Japan. Energy Procedia 2014, 63, 7437–7443. [Google Scholar] [CrossRef] [Green Version]
- Tang, L.; Yokoyama, T.; Kubota, H.; Simoda, A. Life Cycle Assessment of a Pulverized Coal Power Generation with CCS Technology in Japan (Part. 2)—Comparative Study on Environmental Impact of Photovoltaic and Geothermal Power Generation; Central Research Institute of Electric Power Industry (CRIEPI): Tokyo, Japan, 2014. (In Japanese) [Google Scholar]
- Olson, N.; Holbrook, J. NH3—The Other Hydrogen. Available online: https://docplayer.net/34545227-Nh3-the-other-hydrogen-tm-n-olson-p-e-j-holbrook-ph-d-1-introduction.html (accessed on 15 September 2021).
- Taiyo Nippon Sonso Corporation. Pure Nitrogen Generator with Power Consumption of 0.195kWh/Nm3; Taiyo Nippon Sonso Corporation: Tokyo, Japan, 2006. (In Japanese) [Google Scholar]
- Taiyo Nippon Sonso Corporation. Latest Energy Saving Nitrogen Generator; Taiyo Nippon Sonso Corporation: Tokyo, Japan, 2010. (In Japanese) [Google Scholar]
- I’MSEP Corporation. A Novel Electrolytic Ammonia Synthesis Process under Atmospheric Pressure and The Ammonia Economy; I’MSEP Corporation: Kyoto, Japan, 2010. (In Japanese) [Google Scholar]
- National Institute of Advanced Industrial Science and Technology (AIST). Technology Development for the Storage and Transport. of Renewable Energy, Scenario Study for Implementing Total System (FY2013) Annual Report; National Institute of Advanced Industrial Science and Technology (AIST): Ibaraki, Japan, 2014. [Google Scholar]
- Research Institute of Innovative Technology for the Earth (RITE). Final Report on Cost Saving CO2 Capture System by Utilizing Low-Grade Waste Heat; Research Institute of Innovative Technology for the Earth (RITE): Kyoto, Japan, 2008. [Google Scholar]
- Japanese Ministry of Economy Trade and Industry (METI). Ex-Post Evaluation Report on Cost Saving CO2 Capture System by Utilizing Low-Grade Waste Heat; Japanese Ministry of Economy Trade and Industry (METI): Tokyo, Japan, 2010. [Google Scholar]
- Kawai, S. Efforts in the EAGLE project. J. Chem. Eng. Japan 2015, 79, 835–836. (In Japanese) [Google Scholar]
- Morales Mora, M.A.; Vergara, C.P.; Leiva, M.A.; Martínez Delgadillo, S.A.; Rosa-Domínguez, E.R. Life cycle assessment of carbon capture and utilization from ammonia process in Mexico. J. Environ. Manage. 2016, 183, 998–1008. [Google Scholar] [CrossRef] [PubMed]
- National Energy Technology Laboratory (NETL). Life Cycle Inventory Data Process. Documentation File Process. Name: CO2 Captured from Ammonia Production Reference Flow: 1 kg of CO2; National Energy Technology Laboratory (NETL): Albany, NY, USA, 2012. [Google Scholar]
- Japanese Ministry of Economy Trade and Industry (METI). FY2017 Annual Report on Energy (Energy White Paper 2018). Available online: http://www.enecho.meti.go.jp/about/whitepaper/2018html/ (accessed on 15 September 2021).
- Chiesa, P.; Lozza, G.; Mazzocchi, L. Using hydrogen as gas turbine fuel. J. Eng. Gas. Turbines Power 2005, 127, 73–80. [Google Scholar] [CrossRef] [Green Version]
- Pellegrino, R.; Costantino, N.; Tauro, D. Supply Chain Finance: A supply chain-oriented perspective to mitigate commodity risk and pricing volatility. J. Purch. Supply Manag. 2019, 25, 118–133. [Google Scholar] [CrossRef]
- Gaudenzi, B.; Zsidisin, G.A.; Pellegrino, R. Measuring the financial effects of mitigating commodity price volatility in supply chains. Supply Chain Manag. An. Int. J. 2020, 26, 17–31. [Google Scholar] [CrossRef]
- ISO 14044 Environmental Management—Life Cycle Assessment—Requirements and Guidelines; International Organization for Standardization (ISO): Geneva, Switzerland, 2006; pp. 1–46.
- Vergragt, P.; Groenewegen, P. New technological developments and technology assessment: A plea for an integrated approach. Proj. Apprais. 1989, 4, 29–35. [Google Scholar] [CrossRef]
- Steinberger-Wilckens, R.; Sampson, B. Chapter 8—Market, Commercialization, and Deployment—Toward Appreciating Total Owner Cost of Hydrogen Energy Technologies. In Science and Engineering of Hydrogen-Based Energy Technologies; de Miranda, P.E.V., Ed.; Academic Press: Cambridge, MA, USA, 2019; pp. 383–403. ISBN 978-0-12-814251-6. [Google Scholar]
- Yin, L.; Xiao, Y.; Zhong, K.Q.; Shu, C.M.; Tian, Y. Temperature effects on thermal diffusivity of bituminous coal using different pre-oxidation levels in a nitrogenous atmosphere. Fuel 2021, 288, 119640. [Google Scholar] [CrossRef]
- Tsai, Y.-T.; Yang, Y.; Huang, H.-C.; Shu, C.-M. Inhibitory effects of three chemical dust suppressants on nitrocellulose dust cloud explosion. AIChE J. 2020, 66, e16888. [Google Scholar] [CrossRef]
- Tsai, Y.-T.; Huang, G.-T.; Zhao, J.-Q.; Shu, C.-M. Dust cloud explosion characteristics and mechanisms in MgH2-based hydrogen storage materials. AIChE J. 2021, 67, e17302. [Google Scholar] [CrossRef]
Figure 1.
Process flow charts showing stages within the system’s boundaries.

Figure 2.
Process flow charts showing stages within the system’s boundaries.

Figure 3.
H2 supply chain using LH2.

Figure 4.
H2 supply chain using MCH.

Figure 5.
NH3 supply chain.

Figure 6.
Coal supply chain.

Figure 7.
LNG supply chain.

Figure 8.
Life-cycle CO2 emissions of hydrogen power generation using LH2.

Figure 9.
Life-cycle CO2 emissions of H2 power generation using MCH.

Figure 10.
Life-cycle CO2 emissions of NH3 power generation.

Figure 11.
Representative results on life-cycle CO2 emissions of H2 and NH3 power generation.

Table 1.
Specifications of renewable power plants.
| Parameter [Unit] | Wind | Solar PV |
|---|---|---|
| Capacity [MW] | 40 | 10 |
| Capacity factor [%] | 35 | 20 |
| Auxiliary power ratio [%] | 10 | 3 |
| Lifetime [year] | 30 | 30 |
Table 2.
Specifications of H2 supply chain using MCH.
| Process | Parameter [Unit] | Value |
|---|---|---|
| MCH production | Reaction yield of H2 addition to TOL [%] | 99.8 |
| H2 consumption rate [%] | 97.9 | |
| MCH dehydrogenation | Conversion rate [%] | 95.0 |
| Selectivity [%] | 99.9 | |
| H2 yield [%] | 90.0 | |
| TOL replenishment | Annual replenishment rate of TOL [%] | 3.0 |
Table 3.
Specifications of NH3 supply chain.
| Process | Parameter [Unit] | Value |
|---|---|---|
| NH3 production from renewable hydrogen | Hydrogen loss rate during NH3 synthesis [%] | 4.9 |
| NH3 loss rate during NH3 liquefaction [%] | 0.1 | |
| CO2 capture | Rate of CO2 capture [%] | 90 |
| Monoethanolamine input [kg/t-CO2 captured] | 2.41 | |
| Sodium hydroxide input [kg/t-CO2 captured] | 0.13 | |
| Activated carbon input [kg/t-CO2 captured] | 0.08 | |
| CO2 compression | CO2 leakage from CO2 compressor [t-CO2/MW/year] | 23.2 |
| CO2 transport | CO2 leakage rate from pipelines [%] | 0.00367 |
Table 4.
Specifications of coal supply chain.
| Process | Parameter [Unit] | Value |
|---|---|---|
| Coal mining and pretreatment | Electricity input [kWh/t-coal] | 13.2 |
| Diesel input [liter /t-coal] | 3.88 | |
| Gasoline input [liter /t-coal] | 0.0309 | |
| Steel input [kg/t-coal] | 0.0170 | |
| Explosive input [kg/t-coal] | 2.81 | |
| Cement input [kg/t-coal] | 0.0108 | |
| Rubber input [kg/t-coal] | 0.000238 | |
| CH4 emissions during coal mining [kg-CO2/t-coal] | 121 | |
| Coal inland transport | Diesel input [liter/t-coal] | 5.98 |
| Coal ocean transport | Heavy fuel oil (HFO) input [kg/t-coal] | 8.74 |
Table 5.
Specifications of LNG supply chain.
| Process | Parameter [Unit] | Value |
|---|---|---|
| Natural gas mining | CH4 emissions [kg-CO2/t-natural gas] | 60.7 |
| LNG production | CO2 emissions [kg-CO2/t-natural gas] | 99.0 |
| LNG input [kg/t-LNG] | 139 | |
| LNG ocean transport | LNG input [kg/t-LNG] | 30.4 |
| HFO input [kg/t-LNG] | 13.2 |
Table 6.
Specifications of thermal power plants.
| Parameter [Unit] | H2–LNG Co-Firing | H2 Mono-Firing | NH3–Coal Co-Firing | NH3–LNG Co-Firing | NH3 Mono-Firing | Coal | LNG |
|---|---|---|---|---|---|---|---|
| Co-firing ratio of H2/NH3 [%] (on HHV basis) | 20 | - | 20 | 20 | - | - | - |
| Capacity [MW] | 1000 | 1000 | 1000 | 1000 | 1000 | 1000 | 1000 |
| Capacity factor [%] | - | 70 | 70 | 70 | 70 | 70 | 70 |
| Efficiency (HHV) [%] | 53.0 | 51.3 | 39.6 | 53.0 | 53.0 | 39.6 | 53.0 |
| Auxiliary power ratio without CCS [%] | 2.08 | 2.08 | 5.06 | 2.08 | 2.08 | 5.06 | 2.08 |
| Electricity generated without CCS [MWh/year] | 6,004,454 | 6,004,454 | 5,821,721 | 6,004,454 | 6,004,454 | 5,821,721 | 6,004,454 |
| Auxiliary power ratio with CCS [%] | - | - | - | - | - | 36.89 | 15.03 |
| Electricity generated with CCS [MWh/year] | - | - | - | - | - | 3,869,743 | 5,210,228 |
HHV, higher heating value.
| Process | Parameter [Unit] | Value |
|---|---|---|
| CO2 capture | CO2 capture rate [%] | 90 |
| Steam input [GJ/t-CO2 captured] | 3 | |
| Electricity input [kWh/t-CO2 captured] | 23.6 | |
| Monoethanolamine input [kg/t-CO2 captured] | 2.41 | |
| Sodium hydroxide input [kg/t-CO2 captured] | 0.13 | |
| Activated carbon input [kg/t-CO2 captured] | 0.08 | |
| CO2 compression | CO2 leakage from CO2 compressor [t-CO2/MW/year] | 23.2 |
| CO2 transport | HFO input for CO2 transport by ship [kg/t-CO2 transported] | 1.316 |
| CO2 injection | HFO input for CO2 injection [kg/t-CO2 injected] | 3.666 |
Table 8.
Representative results on life-cycle CO2 emissions of H2 and NH3 power generation.
| Power Generation | H2/NH3-Producing Country | Energy Source | Energy Carrier | Case | Life-Cycle CO2 Emissions Mean (99.7% CI) [g-CO2/kWh] |
|---|---|---|---|---|---|
| H2–LNG co-firing | AUS | Wind | LH2 | LC | 357.3 (353.4–362.2) |
| MCH | LC | 405.9 (396.5–415.8) | |||
| PV | LH2 | LC | 376.5 (363.5–392.5) | ||
| MCH | LC | 413.4 (401.5–426.3) | |||
| NOR | Wind | LH2 | Base | 359.9 (355.9–364.7) | |
| MCH | Base | 416.6 (407.0–426.8) | |||
| UAE | PV | LH2 | LC | 377.2 (363.9–393.3) | |
| MCH | LC | 427.4 (414.1–443.4) | |||
| H2 mono-firing | AUS | Wind | LH2 | LC | 56.9 (36.2–82.3) |
| MCH | LC | 289.7 (247.2–342.4) | |||
| PV | LH2 | LC | 156.5 (89.1–240.3) | ||
| MCH | LC | 407.9 (310.2–532.6) | |||
| NOR | Wind | LH2 | Base | 70.1 (49.4–95.2) | |
| MCH | Base | 355.3 (306.3–416.0) | |||
| UAE | PV | LH2 | LC | 160.7 (91.3–244.1) | |
| MCH | LC | 421.5 (322.4–545.2) | |||
| NH3–coal co-firing | UAE | Natural gas | NH3 | w/o CCS | 919.9 (911.6–928.3) |
| w/CCS | 786.7 (782.2–793.6) | ||||
| PV | NH3 | 824.1 (801.8–849.5) | |||
| NH3–LNG co-firing | UAE | Natural gas | NH3 | w/o CCS | 465.3 (459.2–471.4) |
| w/CCS | 368.1 (364.8–373.2) | ||||
| PV | NH3 | 395.4 (379.2–413.9) | |||
| NH3 mono-firing | UAE | Natural gas | NH3 | w/o CCS | 579.9 (550.0–610.5) |
| w/CCS | 98.7 (82.2–123.7) | ||||
| Coal | w/o CCS | 949.3 | |||
| w/CCS | 278.1 | ||||
| LNG | w/o CCS | 432.1 | |||
| w/CCS | 150.4 |
AUS, Australia; CI, confidence interval; NOR, Norway; LC, low-carbon; PV, photovoltaic; UAE, United Arab Emirates.
Publisher’s Note: MDPI stays neutral with regard to jurisdictional claims in published maps and institutional affiliations. |
© 2021 by the authors. Licensee MDPI, Basel, Switzerland. This article is an open access article distributed under the terms and conditions of the Creative Commons Attribution (CC BY) license (https://creativecommons.org/licenses/by/4.0/).
Share and Cite
MDPI and ACS Style
Ozawa, A.; Kudoh, Y. Assessing Uncertainties of Life-Cycle CO2 Emissions Using Hydrogen Energy for Power Generation. Energies 2021, 14, 6943. https://doi.org/10.3390/en14216943
AMA Style
Ozawa A, Kudoh Y. Assessing Uncertainties of Life-Cycle CO2 Emissions Using Hydrogen Energy for Power Generation. Energies. 2021; 14(21):6943. https://doi.org/10.3390/en14216943
Chicago/Turabian StyleOzawa, Akito, and Yuki Kudoh. 2021. "Assessing Uncertainties of Life-Cycle CO2 Emissions Using Hydrogen Energy for Power Generation" Energies 14, no. 21: 6943. https://doi.org/10.3390/en14216943
Note that from the first issue of 2016, this journal uses article numbers instead of page numbers. See further details here.