
Optimal Location-Allocation of Printing Devices for Energy Saving Using a Novel MILP Approach


1
Division of Energy Economics, Mineral and Energy Economy Research Institute of the Polish Academy of Sciences, ul. J. Wybickiego 7A, 31-261 Kraków, Poland
2
Faculty of Electronics and Information Technology, Institute of Control and Computation Engineering, Warsaw University of Technology, 00-665 Warsaw, Poland
3
CTO, Bluebrain, ul. ks. Franciszka Trockiego 22, 30-394 Kraków, Poland
*
Authors to whom correspondence should be addressed.
Energies 2021, 14(19), 6353; https://doi.org/10.3390/en14196353
Submission received: 12 July 2021
/
Revised: 21 September 2021
/
Accepted: 30 September 2021
/
Published: 5 October 2021
(This article belongs to the Special Issue Mixed-Integer Linear and Nonlinear Programming Methods for Energy Aware Traffic Control in Stationary Networks and Clouds)
Abstract
:In recent years, a growing number of enterprises have taken different steps to reduce the energy consumption and carbon emissions of information and communication technology (ICT) assets. Because of the expansion of digitalization and the need for rapid access to information, enterprises have been compelled to optimize the location and utilization of their ICT hardware. In this context, this paper presents a novel method based on a mixed-integer linear programming approach for optimizing the physical location and task allocation of printing devices in office floor plans considering the power usage of the ICT assets, the costs related to the purchase and service of the individual devices, operating costs, and distance between employees and printing devices. The applicability of the proposed model is illustrated using the case study of a company with 100 functional departments located in several office buildings across Poland. The results reveal that the model guarantees the execution of all printing tasks and satisfies the functionality requirements expressed by the users of the workstations. Moreover, the selection of more energy-efficient printing devices leads to a considerable reduction in electricity consumption, related not only to the direct operation of these devices but also to their modes of operation (work, idle, or sleep). Such results also bring tangible effects in reducing carbon dioxide emissions, which is particularly important for businesses operating in countries where fossil fuels still dominate the energy mix.
1. Introduction
The challenges posed by global warming have increasingly incited governments to implement new policies, regulations, and tools that would accelerate the decarbonization of the power industry and other economic sectors. In the last decades, a variety of policy actions have been taken in the European Union and other developed economies to support the green digital transformation of the tertiary or service sector (e.g., communications, transport, finance, trade, and others). Furthermore, various mechanisms have been employed in the EU to expand the use of renewable electricity technologies in households and businesses and increase the energy efficiency of services (reduce energy consumption). In the European Union, carbon emission pricing has been an effective instrument for incentivizing the energy transformation of the tertiary sector and preventing greenhouse gas emissions. Nowadays, businesses account for the fact that electricity bills play a major role in the financial success of their operations. Therefore, companies operating in this sector frequently look for novel methods and solutions that would further increase their energy efficiency, reduce operating costs, and pave the way for a more sustainable operation. In some EU Member States, the application of innovative solutions has become a priority for enterprises, institutions, and public offices, since the reduction of energy consumption and carbon footprint is an essential objective in corporate social responsibility (CSR). Moreover, the adoption of innovative measures for energy efficiency and mitigation in enterprises, institutions, and public offices can have a broader impact since they can benefit from the economies of scale.
The present study focuses on the problem generally identified in the literature as the location-allocation problem. The relevant literature defines the problem as locating a set of new facilities such that (1) the transportation cost from facilities to customers is minimized and (2) the optimal number of facilities placed in an area of interest satisfy the customer demand [1]. The initial formulation of the location-allocation model was proposed by Cooper in [2], as a linear programming model. Nowadays, computational approaches to this problem vary from precise LP or MILP optimization models to metaheuristics (tabu search, simulated annealing, among others). These methods are mainly used to solve optimization problems related to location-allocation of factories [3], supply chains [4,5], or public services (e.g., hospitals [6], urban waste facilities [7]). However, they are also applied to problems in web services location-allocation [8], and small-scale edge computing servers’ location-allocation [9]. For instance, the problem for network location-production-allocation is considered in [10]. Moreover, some enterprises have employed optimization methods to schedule tasks, allocate resources, and reduce energy consumption in cloud computing services [11], multi-core servers [12], and data centers [13].
Optimization models have not only been used in the tertiary sector and industries related to information and communication technologies but also in other branches of the economy. For instance, decision-support tools based on mathematical programming methods have been employed to reduce costs and energy consumption [14] or optimize the quality of service in clouds [15]. In the work of Benalcazar and Kamiński, a mathematical model was proposed for optimizing the location of warehouses and reducing the costs of warehouse management in a company [16]. Malec et al., addressed the issues related to the optimal location of gas network service points with a mixed-integer linear programming model [17]. Olszewski et al., proposed a sketch of a decision-support tool based on cooperative game theory for investment policy for small biogas power plants [18]. The objective function minimized the total costs of operation considering the travel distance between service points.
Nowadays, because of the significance of digitalization and the need for rapid access to information, enterprises have been compelled to optimize the location and utilization of information and communication technology (ICT) assets. Moreover, in recent years, a growing number of enterprises have taken different steps to reduce the energy consumption and carbon emissions of ICT hardware. Although the optimization of location and allocation of devices, facilities, or services to minimize the travel distance or ensure the broadest access to services is a well-documented subject, only one study so far has reported on the optimization of locating printing devices. Sun et al. proposed a hybrid approach to solve the printer location problem in a university campus [19]. The authors used a p–median mathematical model [20] to obtain the optimal location of the printing devices and validated the results using agent-based simulations developed in AnyLogic software. However, it is worth noting that the study only focused on optimizing the total travel distance between printers and users. Moreover, it did not address the problem of allocating printing orders to printing devices in office floor plans considering the power consumption of different modes of operation (work, idle, or sleep), nor the costs of copying and print services, service and maintenance costs, and acquisition costs of new devices.
From the studies reviewed above and considering the limited literature on the subject, this paper presents a novel method based on a mixed-integer linear programming (MILP) approach to (1) optimize the location (physical location of the device) and allocation (of the tasks to the device) of printing devices in office floor plans considering the power usage of the ICT assets, and (2) minimize the total monthly cost of the system. In this context, to the best of the authors’ knowledge, this work is the first to propose a MILP model to determine the optimal location of printers and multi-function devices considering the layout of an office floor plan and the power usage of devices already installed and in inventory. The novelties and contributions of the paper can be outlined as follows:
- The model includes several constraints that reflect the product specifications of the printers and multi-function devices. Furthermore, the costs associated with the (1) power consumption of different operating modes/states of the printers and multi-function devices (i.e., work, standby, and sleep), (2) costs of copying and print services, (3) service and maintenance costs, (4) and acquisition costs of new devices are also incorporated in the objective function.
- The second contribution is provided by the findings of the case study. It demonstrates the effectiveness of the novel MILP model in minimizing the electricity usage of large printer ‘fleets’. Still, more importantly, the results reveal that there is an unquestionable economic and environmental benefit for enterprises to optimize their selection of printing devices. Generally, enterprises, institutions, and public offices optimize printing costs by outsourcing such services to commercial printing companies and make decisions based only on the comparison of the unit cost of printing. By contrast, our method combines variable and fixed costs of printing and the costs related to the walking distance between workstations and printing devices, which constitutes the third contribution of this study.
The remainder of this paper is organized as follows: Section 2 defines the problem addressed in this work; Section 3 outlines the main assumptions adopted to formulate the problem as a mixed-integer linear program, followed by a description of the mathematical model in Section 4. Section 5 discusses the case study, and the results of the analysis are presented in Section 6. Finally, Section 7 concludes the paper.
2. Problem Definition
In this paper, we address the problem faced by a company that has a significant number of functional departments located in different buildings and offices across the country. Because of the rising costs of electricity and the growing number of printer/multi-function devices and models installed in the departments, the company is interested in optimizing the location and utilization of its information and communication technology (ICT) assets, specifically the printing and multi-function devices used daily for its business operations. Moreover, due to the complexity of the system and the specific needs of the company’s employees for printing and document processing, a decision-support tool is needed to assist this decision-making process. First, the model must include the general elements and relationships existing in the real-world system such as the number of workstations, printers, printout demand. Second, to solve the problem of the optimal selection and location of printing devices, the distances measured in the office floor plan between the printer candidate location and the workstation location must be transposed into a workstation-printer distance matrix. This type of matrix should be generated automatically from the room layout or blueprints.
From the company’s standpoint, an essential requirement is to meet the total printing and copying demand considering the employees’ specific needs while reducing the fixed and variable costs associated with the purchase and operation of the printing devices. Keeping this in mind, the selected approach must focus on minimizing costs related to the purchase and service of individual devices, costs associated with the distance between employees and printing devices, and operating costs of printing and electricity consumption.
Additionally, the model should consider the specific demand for printouts of a particular workstation and the different users’ requirements regarding the characteristics of these printouts, such as:
- maximum page size (printout format—A4, A3, etc.),
- color of printouts (monochrome or color),
- other features/functions (copying, scanning, faxing, etc.),
- printing technology (laser, inkjet, etc.),
- the option to have a device close to the workstation.
Therefore, it is necessary to build a database containing the technical and economic parameters of the existing devices and new devices in the company’s inventory. The database should include information regarding the following parameters:
- printer/MFD model and available functions/features:
- o
- printing, scanning, copying, faxing, etc.
- print technology and printouts color:
- o
- inkjet (color, monochrome), laser (color, monochrome), dot matrix, etc.
- recommended and maximum monthly print volume
- power consumption depending on the operating mode of the device
- the unit cost of printing 1 page in a given format and color
- cost of purchasing a new printing device
- the unit cost of service and maintenance of the printing device
- size and specific purpose of the printing device:
- o
- small personal printer,
- o
- medium size printer for workgroup use,
- o
- large size printer for departmental use.
3. Problem Assumptions
The main assumptions adopted for the formulation of the mixed-integer programming model are based on the expert knowledge of the print management company and the requirements of its clients. The assumptions are as follows:
- Printers and multi-function devices represent the supply side of the problem. The devices satisfy the requirements of printing services in the company.
- Workstations represent the demand side of the problem. Each workstation has a specific demand for printouts in a given month and some particular requirements regarding the characteristics of these printouts (i.e., paper size and color, service type: printing or copying).
- The devices selected by the mathematical model must satisfy the total demand for printouts.
- The printout volume of a given device is equal to the sum of all pages sent from several workstations.
- The devices selected by the mathematical model must meet all the requirements specified by the users of the workstations regarding format, color, and additional functions of the printing devices.
- The total cost of printer acquisition and printing/document processing in the company is modeled as the sum of the following components:
- o
- costs of purchasing and operating the devices (purchase, printing costs, maintenance, etc.),
- o
- electricity consumption costs,
- o
- costs associated with the distance between workstations/employees and devices locations.
- Only a limited number of workstations can be assigned to a printer/multi-function device.
- It is impossible to install a device larger than its available physical space or a predefined printer size in a candidate location.
- Only one printing device can be installed at each available location.
- The choice of devices and models is limited to the company’s predefined printer/MFD inventory.
- For every printer/MFD model available in inventory, there is a limited number of devices.
- Each device (printer/MFD) has a unique identification name and can only be selected by the mathematical model once.
Note that the mathematical optimization model consists of two components: a set of equations and data (set elements, parameters). The problem-specific equations are universal and can be applied in other domains and uses. Although the data is application-specific in this study, multiple datasets may be used to investigate other printing systems and cases.
4. Method
As mentioned in the previous sections, the purpose of the mathematical model is to determine the optimal location and allocation of printing devices. To achieve this goal, the model must guarantee the execution of all printing tasks and satisfy the functionality requirements expressed by the users of the workstations (such as paper size, print color, printing technology, etc.) at the minimum system cost. Consequently, the model considers the costs of purchasing and operating the printing devices, the costs of electricity consumption, and the costs related to the distance between workstations and the candidate installation locations.
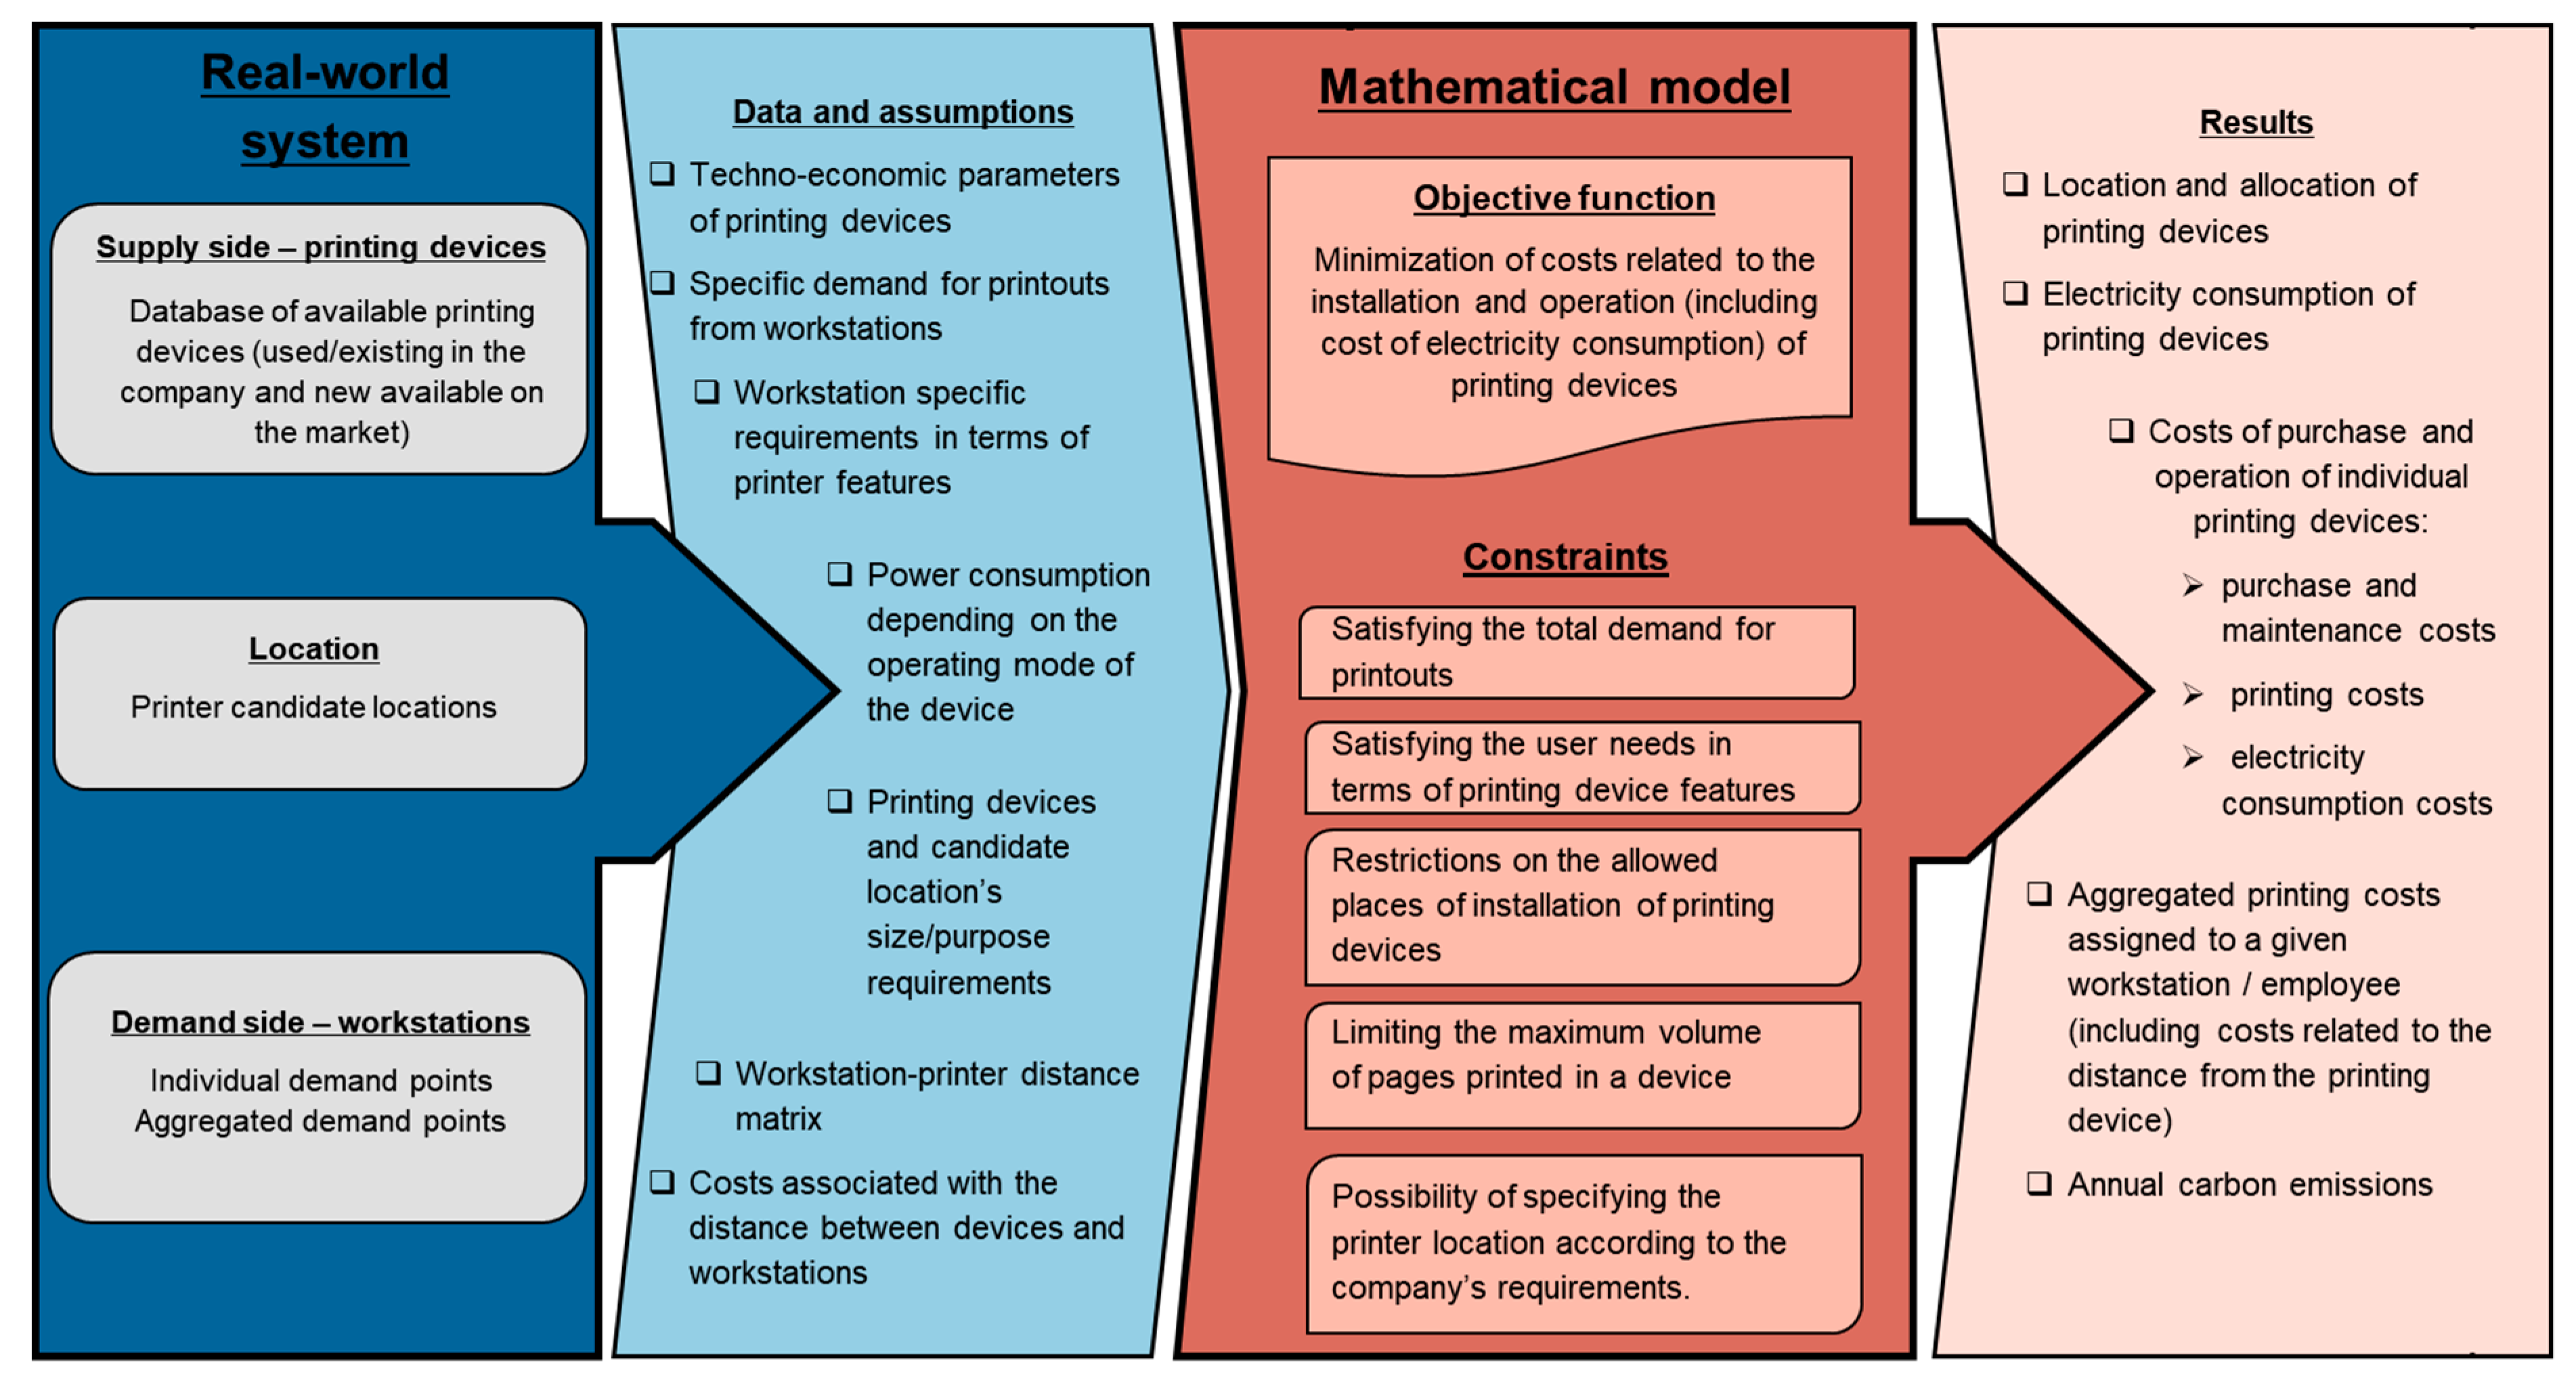
This section defines the equations used to describe the most important elements and relationships of the office printing system The model is an abstract representation of the real-world system with its input parameters, variables, constraints, and objective function. A simplified scheme of the mathematical framework for the optimal selection and location of printing devices is shown in Figure 1.
In this study, a mixed-integer linear programming (MILP) approach is used to solve the abovementioned problem. This approach has been widely and successfully used to address location-allocation issues with a significant number of binary variables. In the following subsections, binary variables indicate the selection of a device and its corresponding location— “1” if the device is selected and “0” if not.
There are two general approaches to formulate mathematical optimization models. The first approach uses short (one-or two-letter) acronyms for variables, parameters, and index sets. Due to its brevity, it is a common practice to describe small mathematical models. However, the above-described approach becomes cumbersome to describe larger models with several variables and parameters that use similar names. This is mainly due to the difficulty in tracking and identifying the appropriate acronyms. Therefore, the present study adopts the latter approach and employs long self-explanatory names.
4.1. Objective Function
The objective function minimizes the total cost of (i) printer acquisition and (ii) printing and document processing in a given company. The costs considered in the objective function are the following:
- Operating costs, taking into consideration variable costs of electricity consumption.
- Costs related to the time needed for employees to reach the printing devices.
- Costs of purchasing new printers, including fixed electricity consumption costs in idle/standby and sleep mode.
The first group of costs includes the (1) costs of printing pages of a specific type based on the optimized print volume (, , other), (2) unit costs of monochrome printing and copying , (3) unit cost of color printing and copying , (4) costs of printing and copying other types of paper, (5) unit electricity consumption costs related to printing 1 page on a given device , as well as (6) unit service and maintenance costs .
The second group of costs associated with the time needed for employees to reach the printing devices is calculated as the product of the distance matrix , the auxiliary variable , and the scalar , which is a weighting factor for this cost component.
The third group of costs in the objective function is attributed to the acquisition costs of a given printer (), fixed costs of electricity consumption related to the total time when the device was in idle/standby and sleep mode, and the binary variable that defines in which instance the printer/device p is used to perform the tasks ordered by the workstations ().
4.2. Model Constraints
4.2.1. Printer Capacity Limit
The total number of pages printed (all types, ) is restricted by the recommended monthly volume of the given device (printer/MFD) of model including an allowed excess margin of the recommended monthly print volume .
4.2.2. Print-Copy Balance Equations
Equations (3)–(10) describe the demand balances for printouts and copies depending on the page size and color.
- Printout demand balance—monochrome, page size A4
The product of the variable and the matrix must be greater than or equal to the demand for A4 sized monochrome pages ) from workstation .
- Printout demand balance—color, page size A4
The total number of color A4 sized pages printed in devices (printer/MFD) of models having the required features must be greater than or equal to the total demand for color A4 sized pages from workstation .
- Printout demand balance—monochrome, page size A3
The total volume of monochrome A3 sized pages printed in devices (printers/MFD) of models having the required features (), must be greater than or equal to the total demand for monochrome A3 pages from workstation .
- Copy demand balance—monochrome, page size A4
The total volume of monochrome A4 copies printed in devices (printers/MFD) of models having the required features (), must be greater than or equal to the total demand for monochrome A4 copies from workstation .
- Printout demand balance—color, page size A3
The total volume of color A3 pages printed in devices (printers/MFD) of models having the required features (), must be greater than or equal to the total demand for color A3 pages from workstation .
- Copy demand balance—color, page size A4
The total volume of color A4 copies printed in devices (printers/MFD) of models having the required features (), must be greater than or equal to the total demand for color A4 copies from workstation .
- Copy demand balance—monochrome, page size A3
The total volume of monochrome A3 copies printed in devices (printers/MFD) of models having the required features (), must be greater than or equal to the total demand for monochrome A3 copies from workstation .
- Copy demand balance—color, page size A3
The total volume of color A3 copies printed in devices (printers/MFD) of models having the required features ), must be greater than or equal to the total demand for color A3 copies from workstation .
4.2.3. Printer-Workstation Limits
Equation (11) describes that the number of devices installed in locations and that are accessible from workstations must be less than or equal to the maximum number of workstations that can be assigned to a given device of printer model . The maximum number of workstations that can be assigned to a given device is a parameter defined by the workgroup administrator.
Equation (12) guarantees that the total number of devices (printers/MFDs) of models installed in locations and that are accessible from workstations must be greater than or equal to the minimum number of printing devices required by workstation . The minimum number of printing devices needed for a given workstation is a parameter defined by the workgroup administrator.
4.2.4. Printer Requirement Fulfillment
Equation (13) ensures that all devices (printers/MFDs) of models installed in locations meet the quantitative and qualitative features required by workstation . The product of the variable and the matrix describing the specific qualitative and quantitative features/parameters of printing models must greater than or equal to the elements in the matrix containing the workstations requirements .
4.2.5. Must Install Devices
Equation (14) guarantees that some specific devices (printers/MFDs) of models are included in the model solution. This equation enables the workgroup administrator to indicate the installation of existing or new devices without predefining their location.
4.2.6. Printer-Candidate Location Physical Space Limit
Equation (15) models the assignment of the appropriate size/purpose category of each model type and device according to the physical space of the candidate location . The product of the variable and the matrix containing information about the size/purpose category of printer models cannot be greater than the values in the matrix storing the requirements for the size/purpose of each candidate location .
4.2.7. Device Assignment and Operational Indicator
Equation (16) models the relation between the (i) devices (printers/MFDs) of models installed in locations that are accessible for workstations and (ii) the devices and models that are active and operational. The variable that reflects the assignment of a device of model to a given location accessed from workstation () must be less than or equal to the variable that indicates if a device (printer/MFD) of model is active and being used to satisfy the printout/copy demand.
4.2.8. Restriction for Unique Devices Active
This Equation (17) defines the maximum number of available devices (printers/MFDs) of a given model . The sum of the variable for all printers/MFDs must be less than or equal to the maximum number of devices in inventory ——for each model .
4.2.9. Device Distance Limit
Equation (18) guarantees that the assignment of a device (printers/MFDs) of model to a given installation location and accessible to workstation is in accordance with a matrix that describes the allowed connections between workstations and candidate locations. The binary variable is set to 0 when a given connection between the workstation and the installation location is not allowed.
4.2.10. Restriction on the Number of Devices at Candidate Locations
Equation (19) restricts the number of devices (printers/MFDs) of model that can be installed at a candidate location.
4.2.11. Assignment of Devices to Candidate Locations
Equation (20) enforces the assignment of a device (printer/MFD) of model to the installation place . The variable can take the value of 1 or greater if the parameter is equal to 1.
4.2.12. Total Print/Copy Volume
Equation (21) describes the total print volume (all page types, color, and monochrome) in devices of models sent from workstation w∈W using the variable .
4.2.13. Total Print Volume Limit
Equation (22) limits the total print volume (all page types, color, and monochrome) in devices of models sent from workstation w∈W to be less than or equal to the total page demand from all workstations (TotPage).
4.2.14. Linking Constraints
- Device location-allocation
Equation (23) links the variable that represents the volume of (different size and colors) pages printed in device (printer/MFD) e∈E model p∈P sent from workstation w∈W (PrinterPageQuantityp,e,w,…,PrinterA3CopyColorPageQuantityp,e,w) denoted as with the variable that reflects the assignment of a device of model to a given location accessed from workstation () using a Big-M formulation.
- Candidate to selected locations
Equation (24) links the binary variable that reflects the number of devices (printers/MFDs) of model that can be installed at a candidate location with the variable .
4.2.15. Auxiliary Constraints
Equations (25) and (26) describe the approach employed to linearize the product of the binary variable and the continuous variable .
4.3. Model Performance
The mixed-integer linear programming model was implemented in the General Algebraic Modeling System (GAMS) [21,22]. Appendix A provides a detailed description of the sets, parameters and variables used in the model. To illustrate the size and complexity of the optimization problem, Table 1 presents the basic statistics of the model computation. The database of input parameters contained 11 device models (for each model there were 7 unique devices available in inventory), 9 workstations, and 7 candidate locations for the installation of printers. In this particular example, the equation system generated by the GAMS compiler contained over 27.3 thousand individual equations, 16.5 thousand single variables, 4.8 thousand integer variables, and over 170.4 thousand non-zero elements. The total computation time was 13.7 s. The optimization was carried out using GAMS version 26.1.0 (64bit / MS Windows platform) and the solver IBM ILOG CPLEX version 12.8.0.0. All calculations were performed using a computing server equipped with an Intel (R) Core (TM) i7-8086K CPU @ 4.00GHz processor and 48 GB of RAM.
The results of the sensitivity analysis are presented in Figure 2, Figure 3 and Figure 4. The figures show the computation times of the optimization model with different numbers of: (i) printing devices, (ii) workstations, and (iii) combinations of these two parameters.
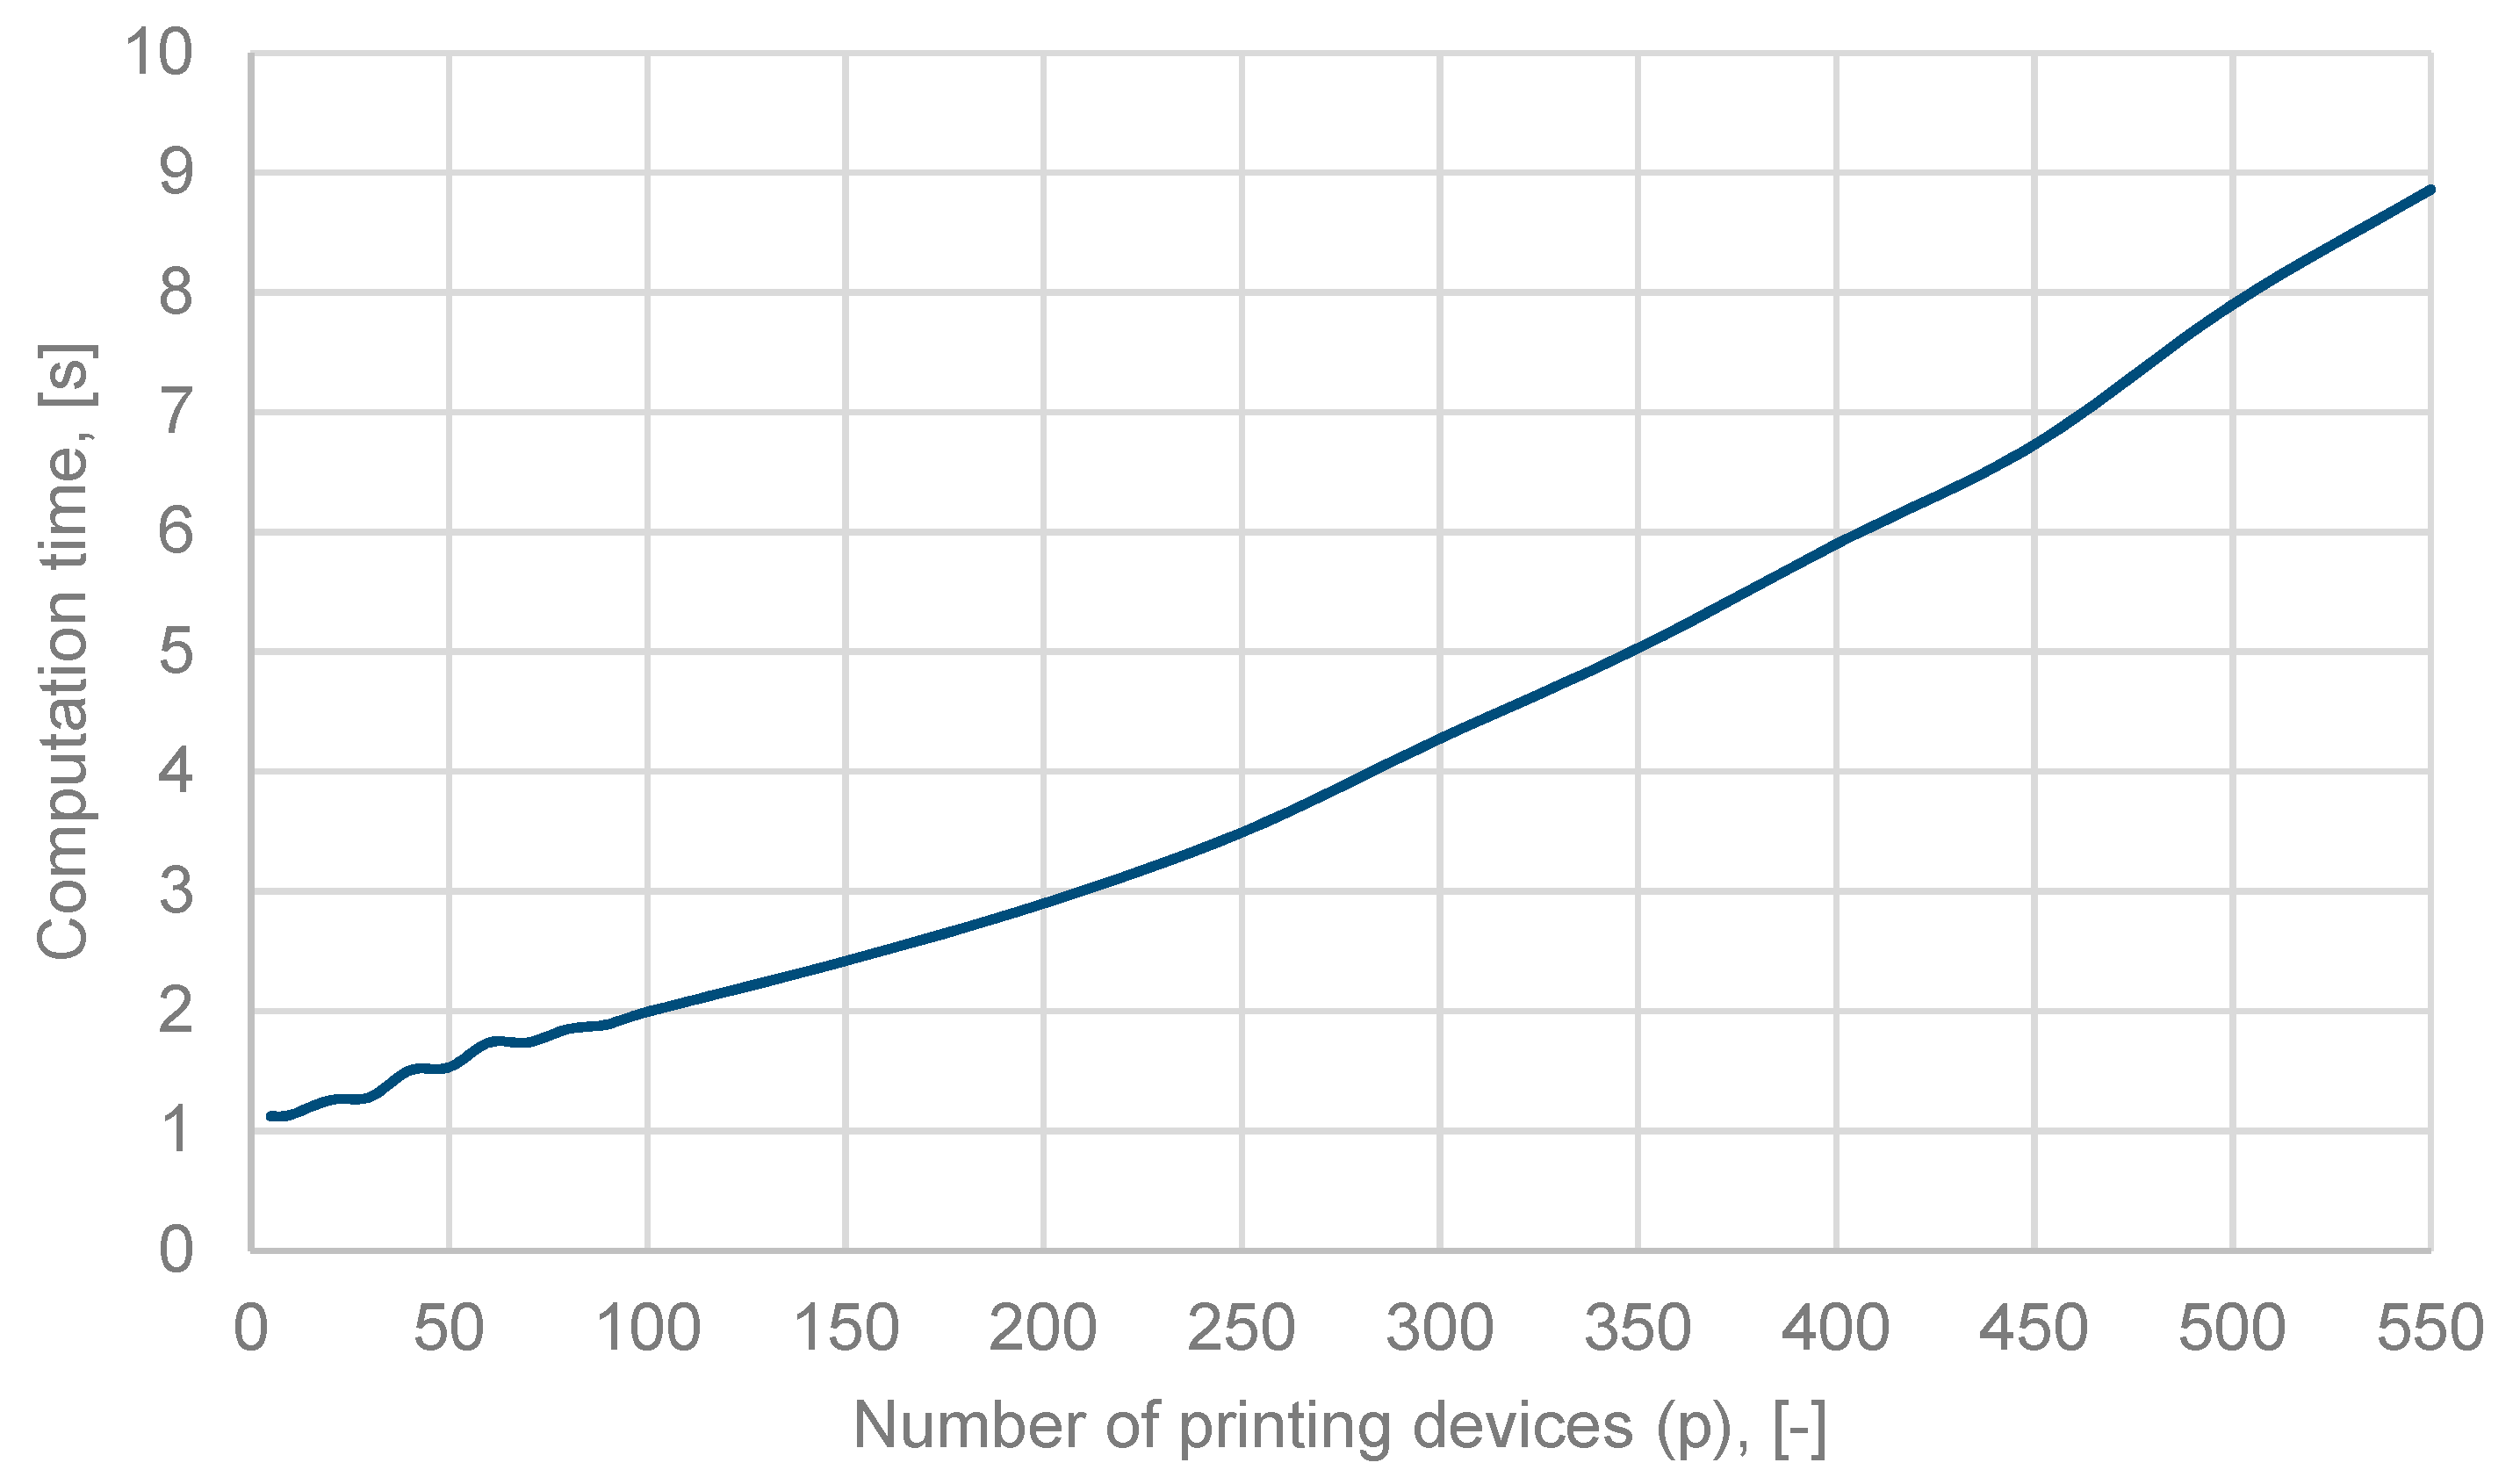
The sensitivity analysis involved three stages. The first stage consisted in increasing the number of printing devices and evaluating the computation time (keeping the number of workstations fixed at 5). Figure 2 demonstrates that in the tested range of 1 to 550 printing devices, the computation time did not exceed 10 s.
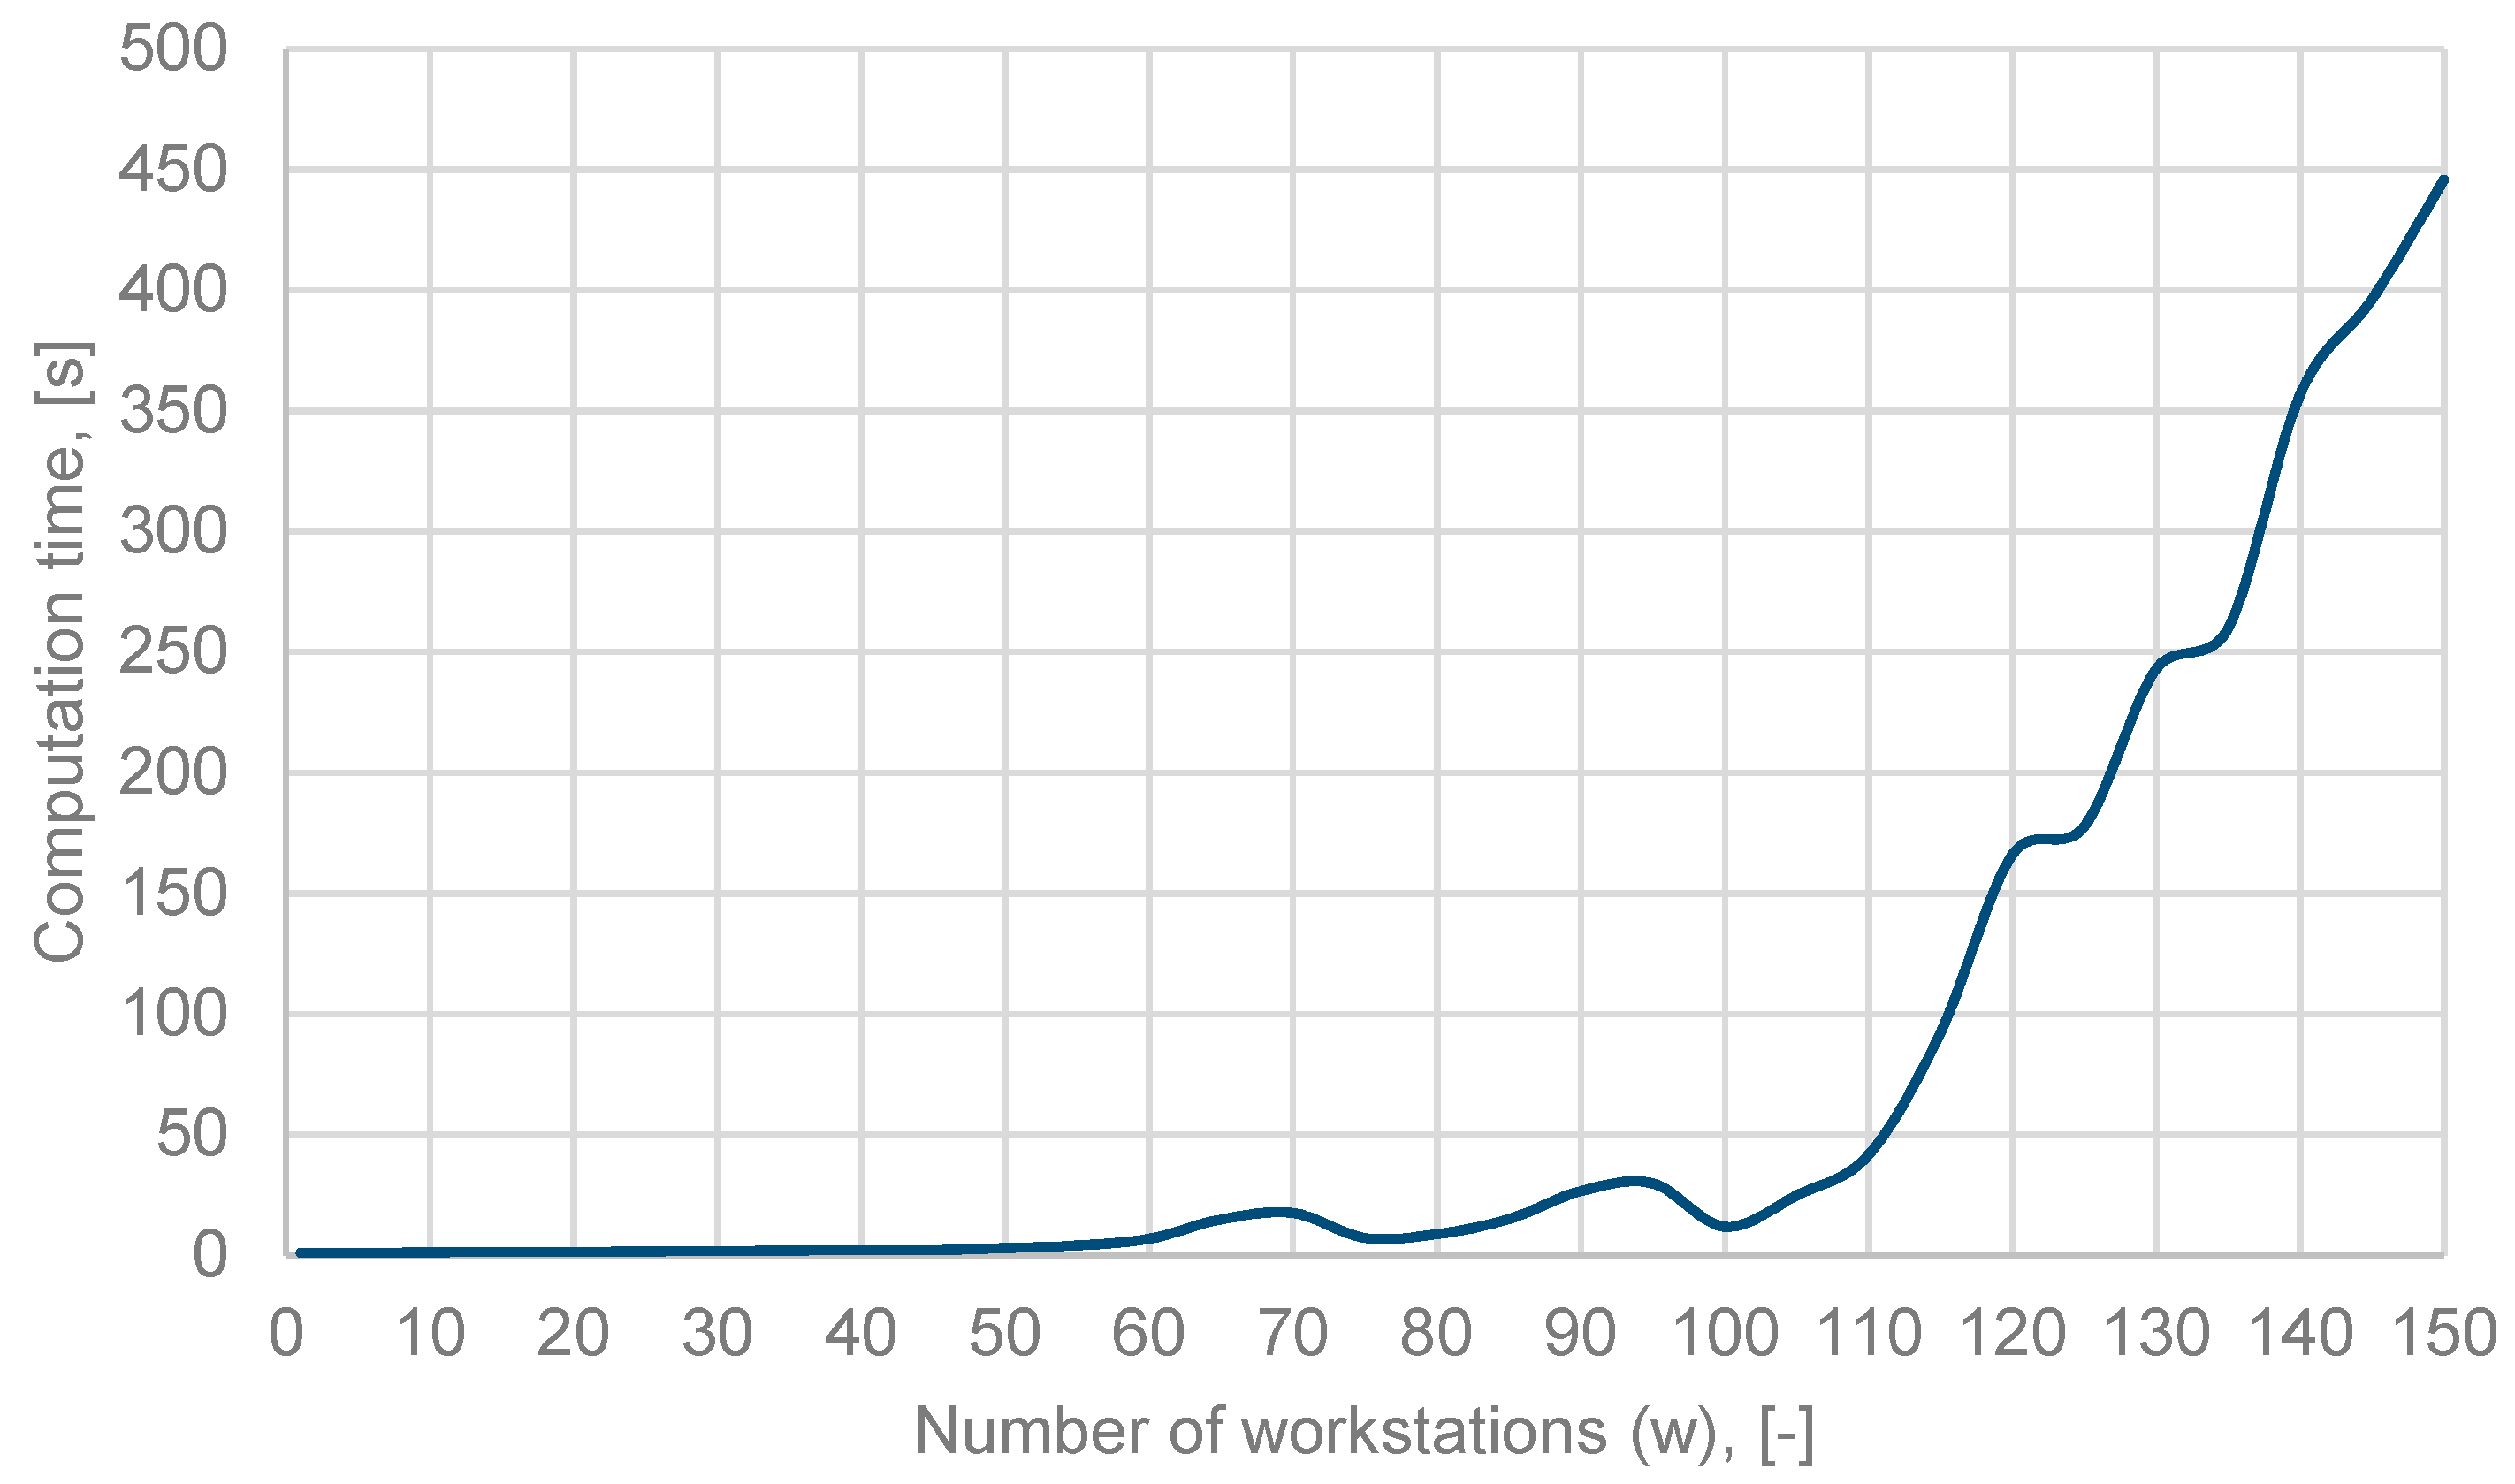
The second stage investigated the effects of the number of workstations on the computation time (keeping the number of printing devices fixed at 5). As can be observed in Figure 3, below the number of 110 workstations, the computation time does not exceed 20 s. However, it increases exponentially as the number of workstations increase (to the level of 445 s for 150 workstations).
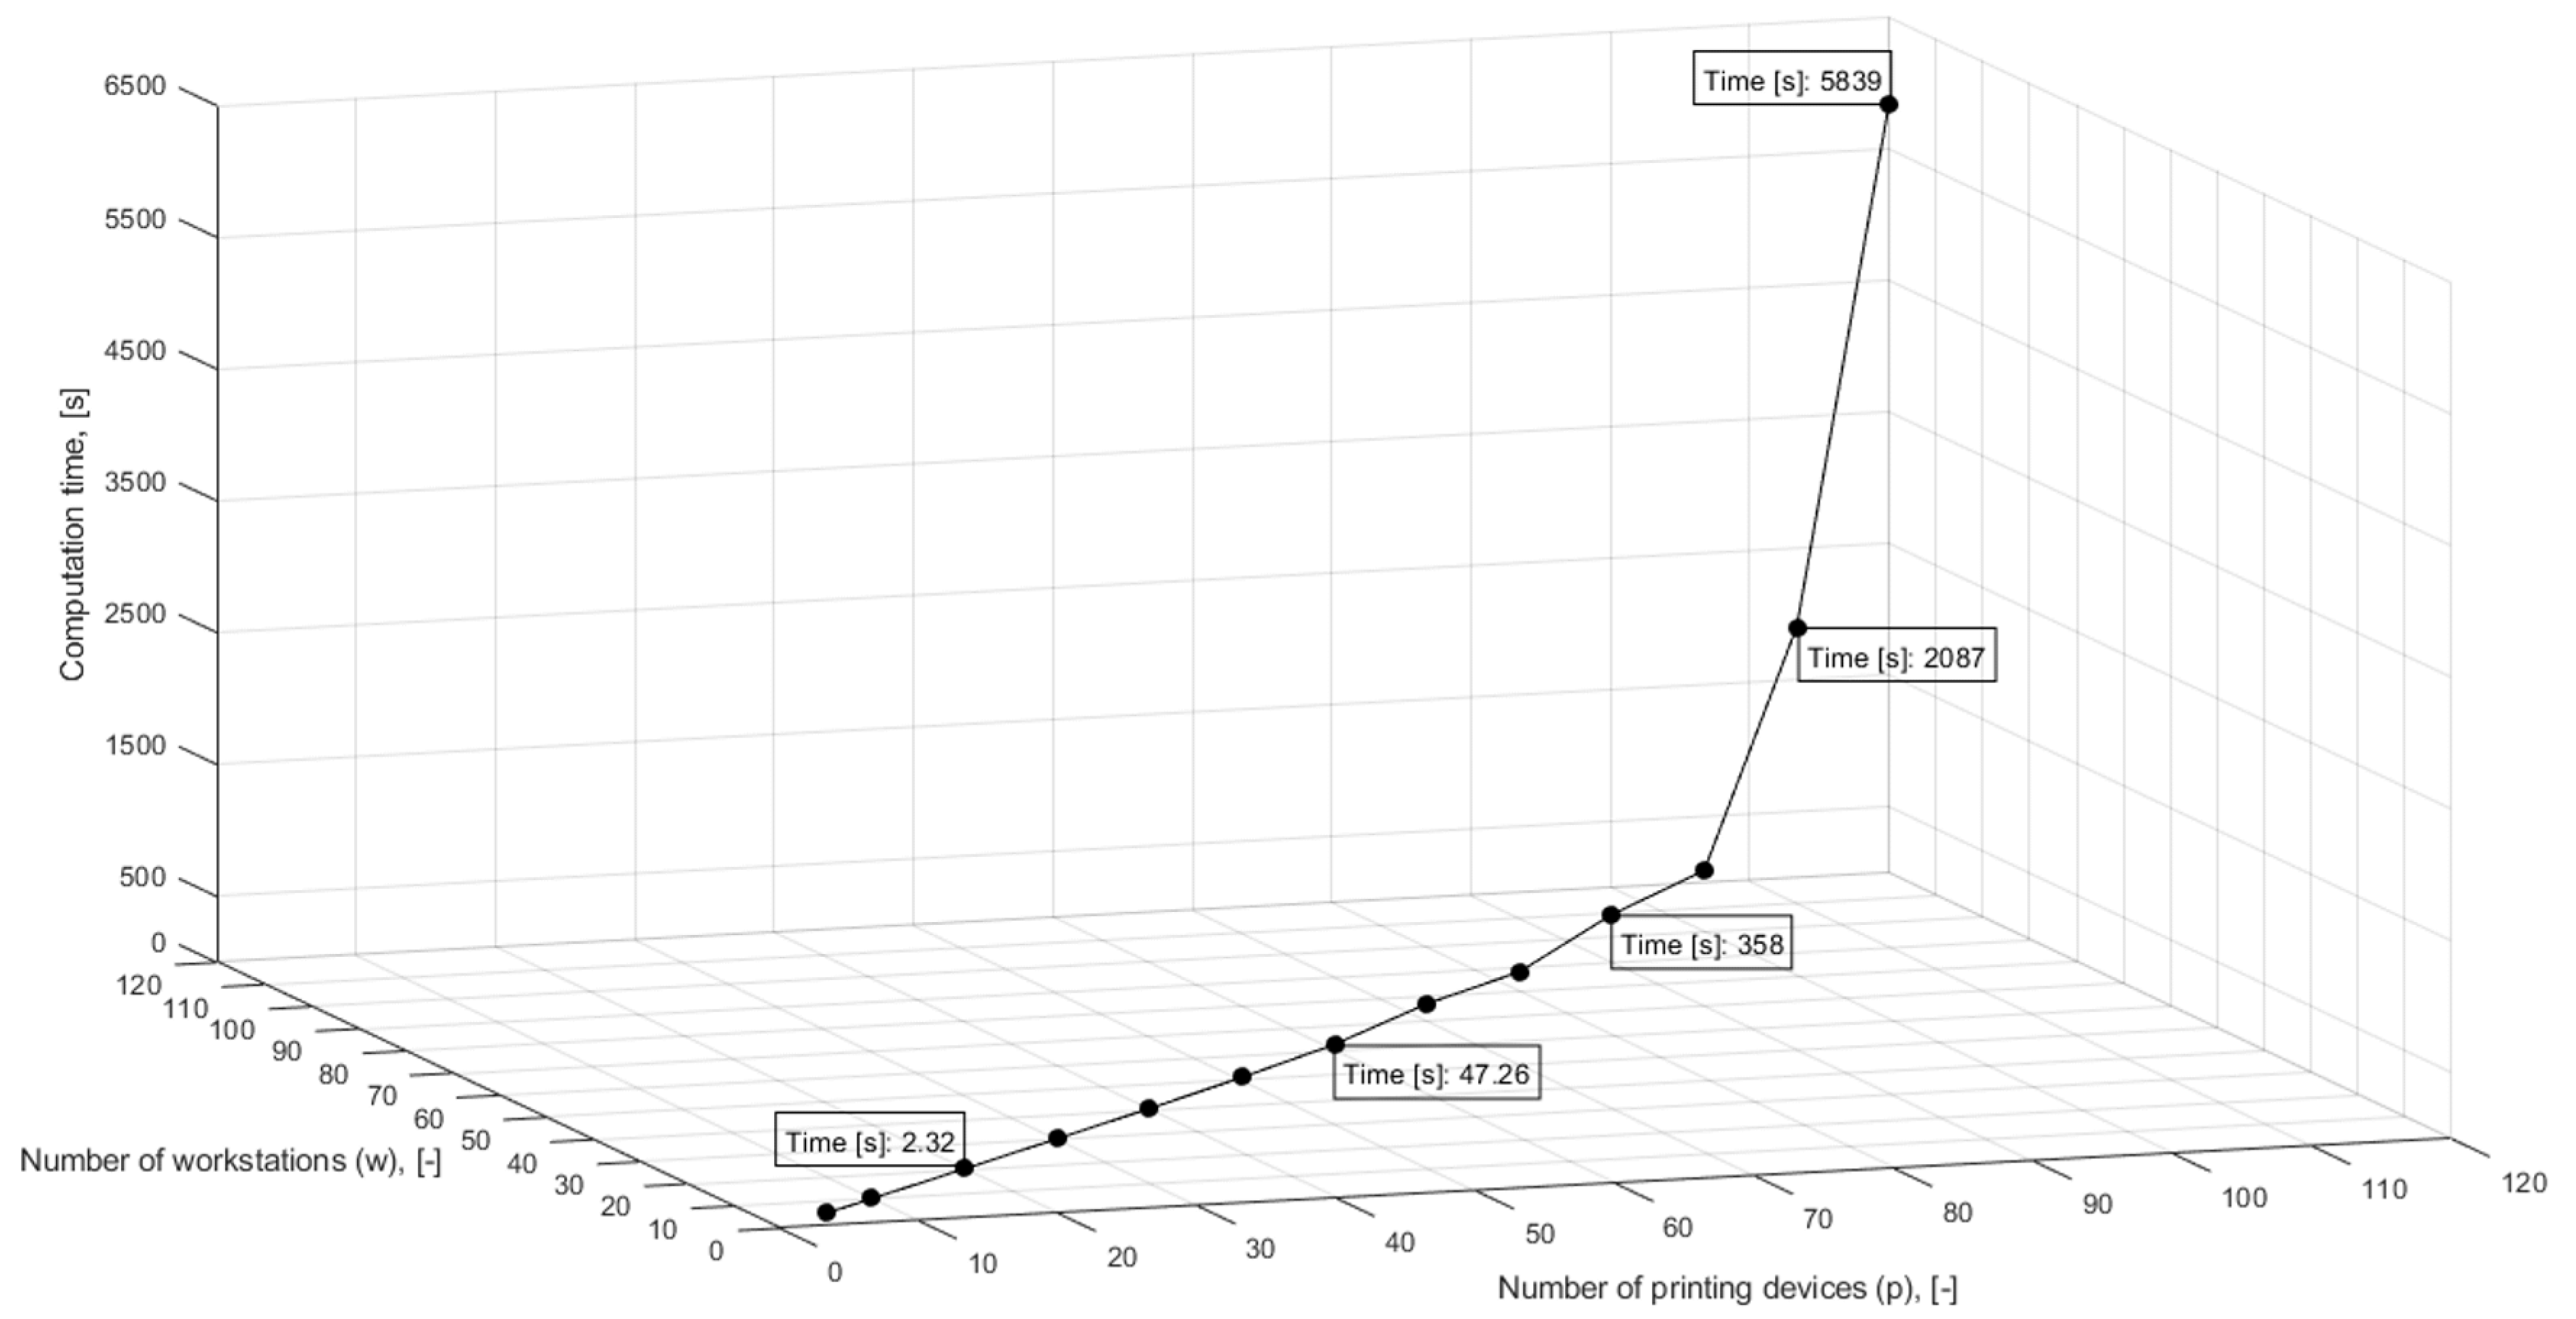
The last stage of the sensitivity analysis was a combination of the previous two. The number of printing devices and workstations were varied simultaneously. Figure 4 indicates that below 100 printing devices and workstations, the computation time does not exceed the reasonable threshold of 600 s (10 min). However, the computation time for 120 printing devices and workstations increased exponentially to 5839 s (over 1 h and 37 min).
5. Case Study
The case study aims to show one of the examples considered by the authors. The versatility of the mathematical model enables the optimization of various hardware, cost, and spatial configurations. This can be achieved by changing the specific input data.
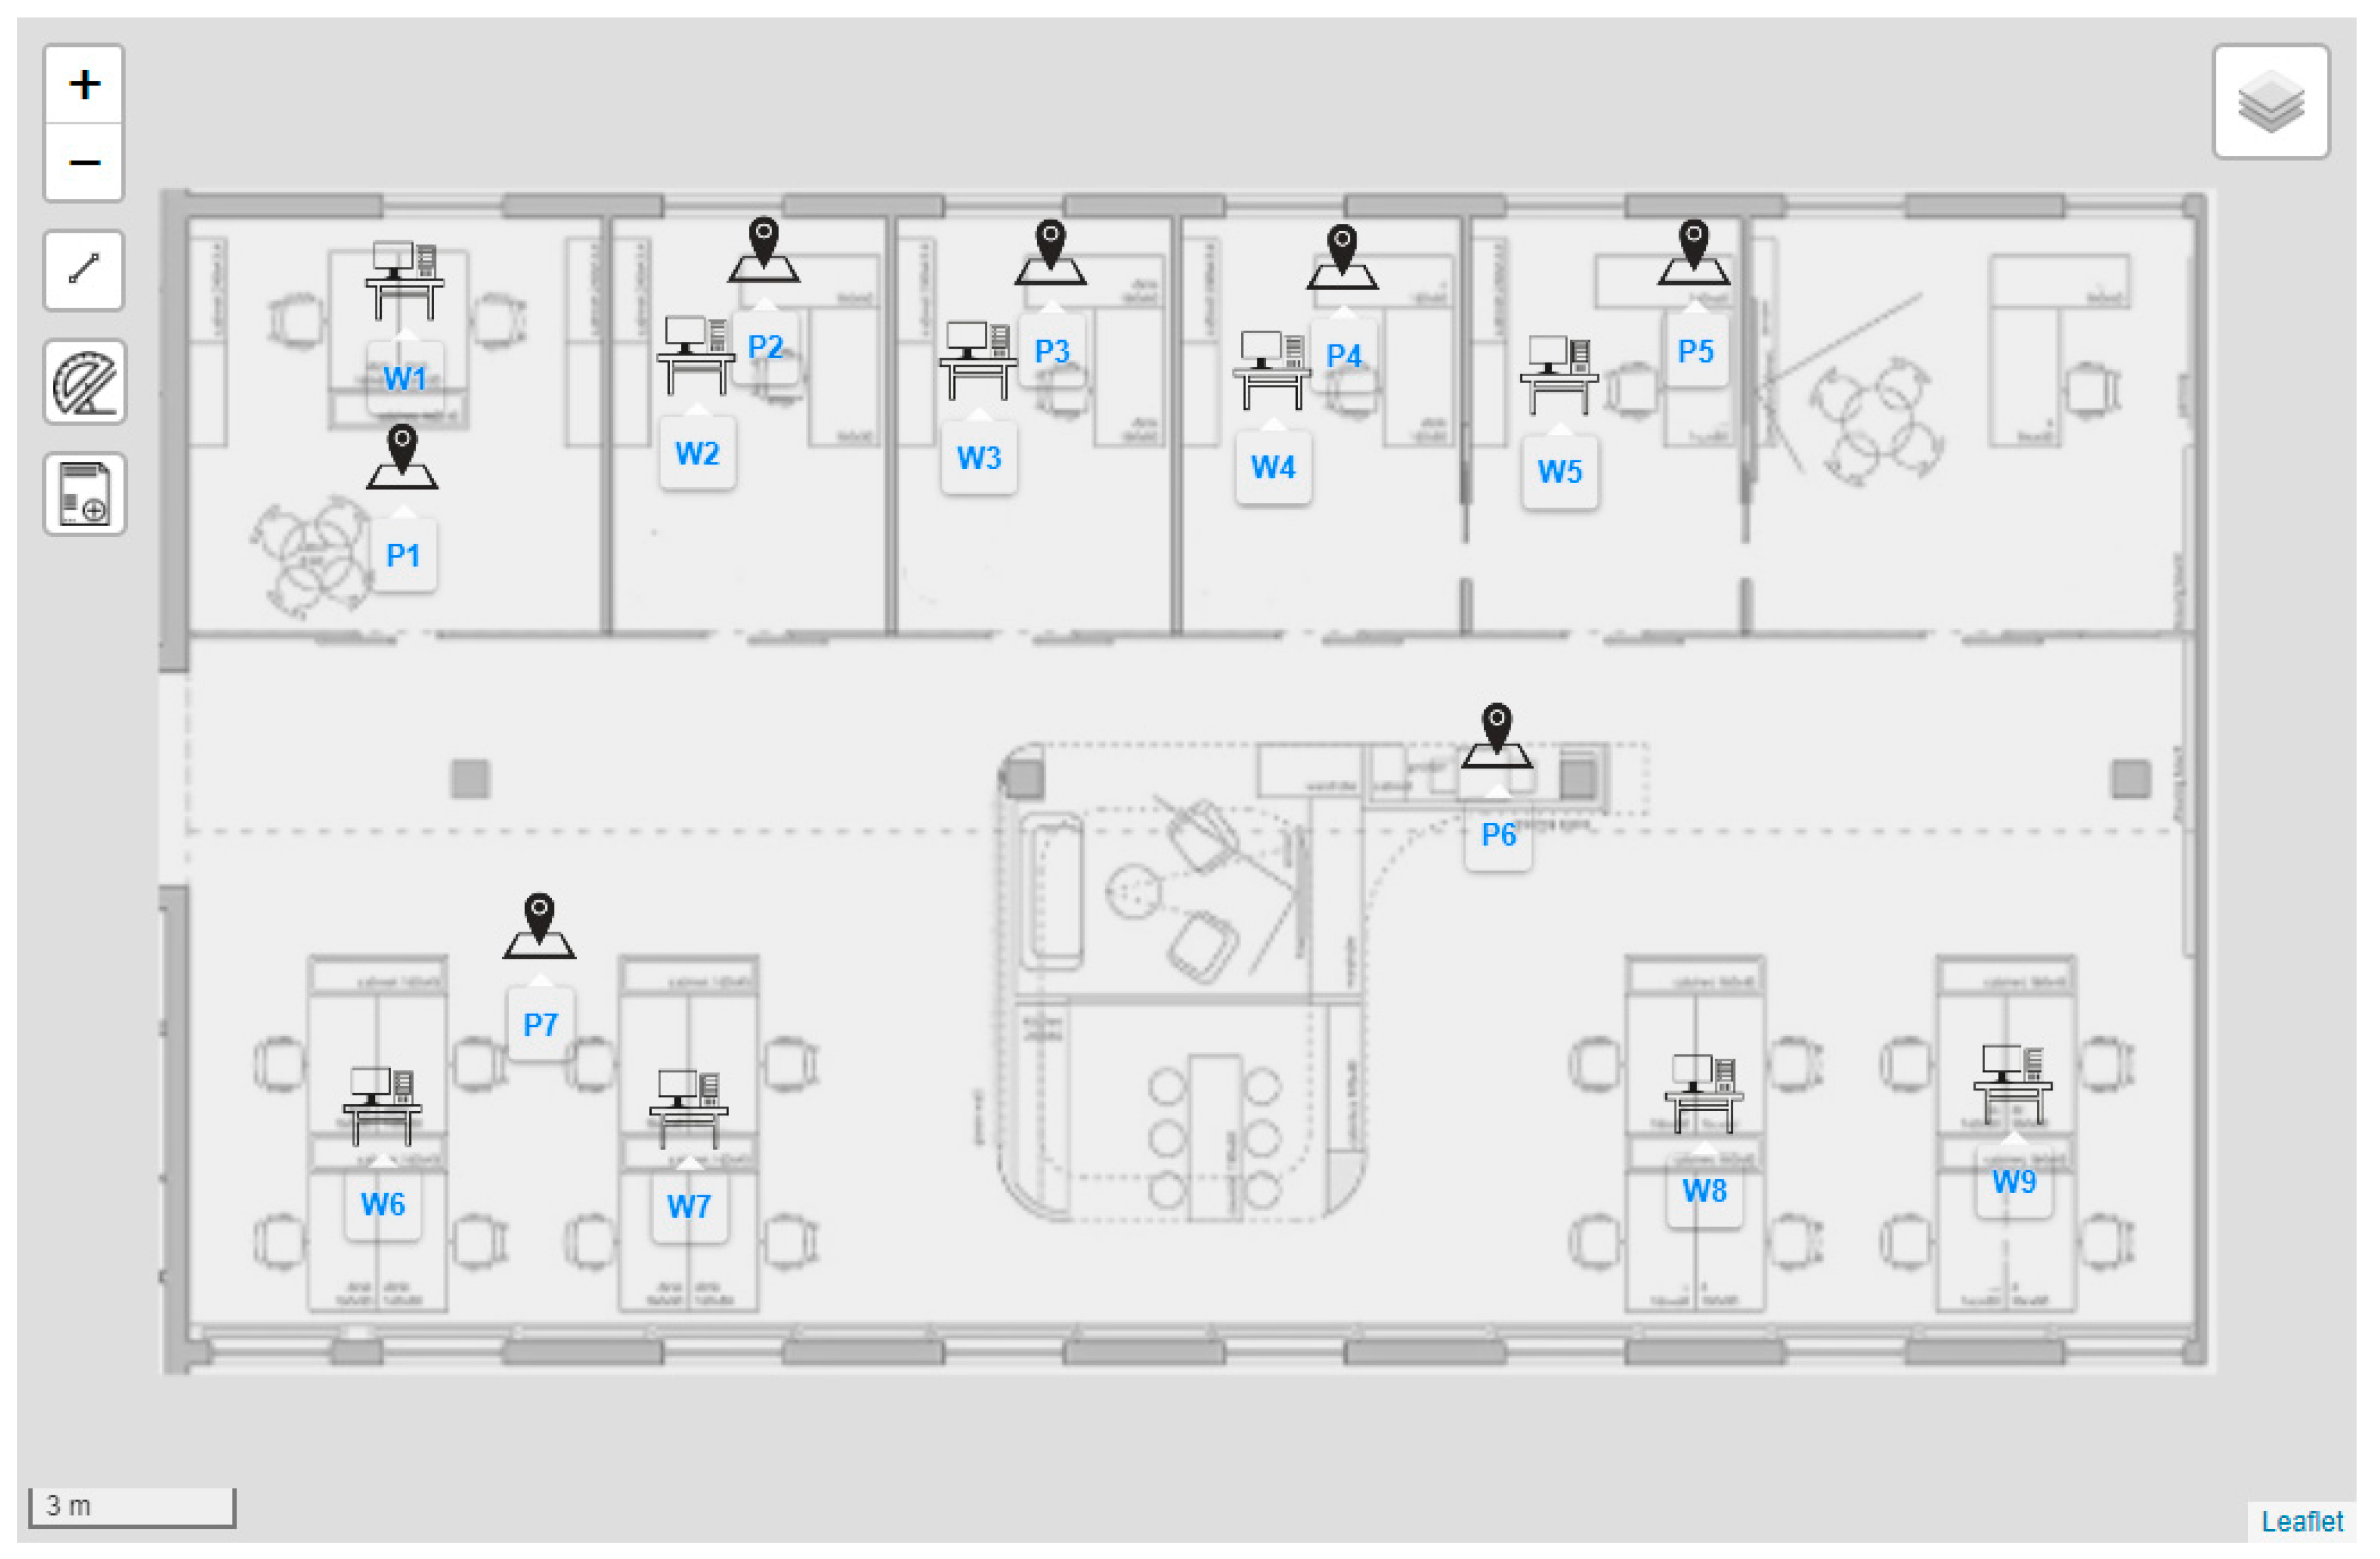
The decision-support tool described in Section 4 is used for the case study of a company with 100 functional departments located in several office buildings across Poland. The buildings have between 3 to 8 floors (totaling 500 floors throughout the country), where employees work about five days a week in individual rooms and open office spaces. An example of a typical floor plan in the abovementioned company is shown in Figure 5. In the figure, workstations marked with the symbol W1–W5 represent individual (copying and printing) demand points, while workstations W6–W9 represent aggregated demand points. The aggregated demand points reflect open office spaces where four employees work side-by-side with individual computers.
In the floor plan, points P1–P7 are predefined candidate locations for the installation of printing devices. The physical spaces available in locations P1–P5 only meet the physical requirement of small personal printers. The space available in point P6 allows for installing a large multi-function (departmental) device, while in point P7 only a medium-sized workgroup device can be installed.
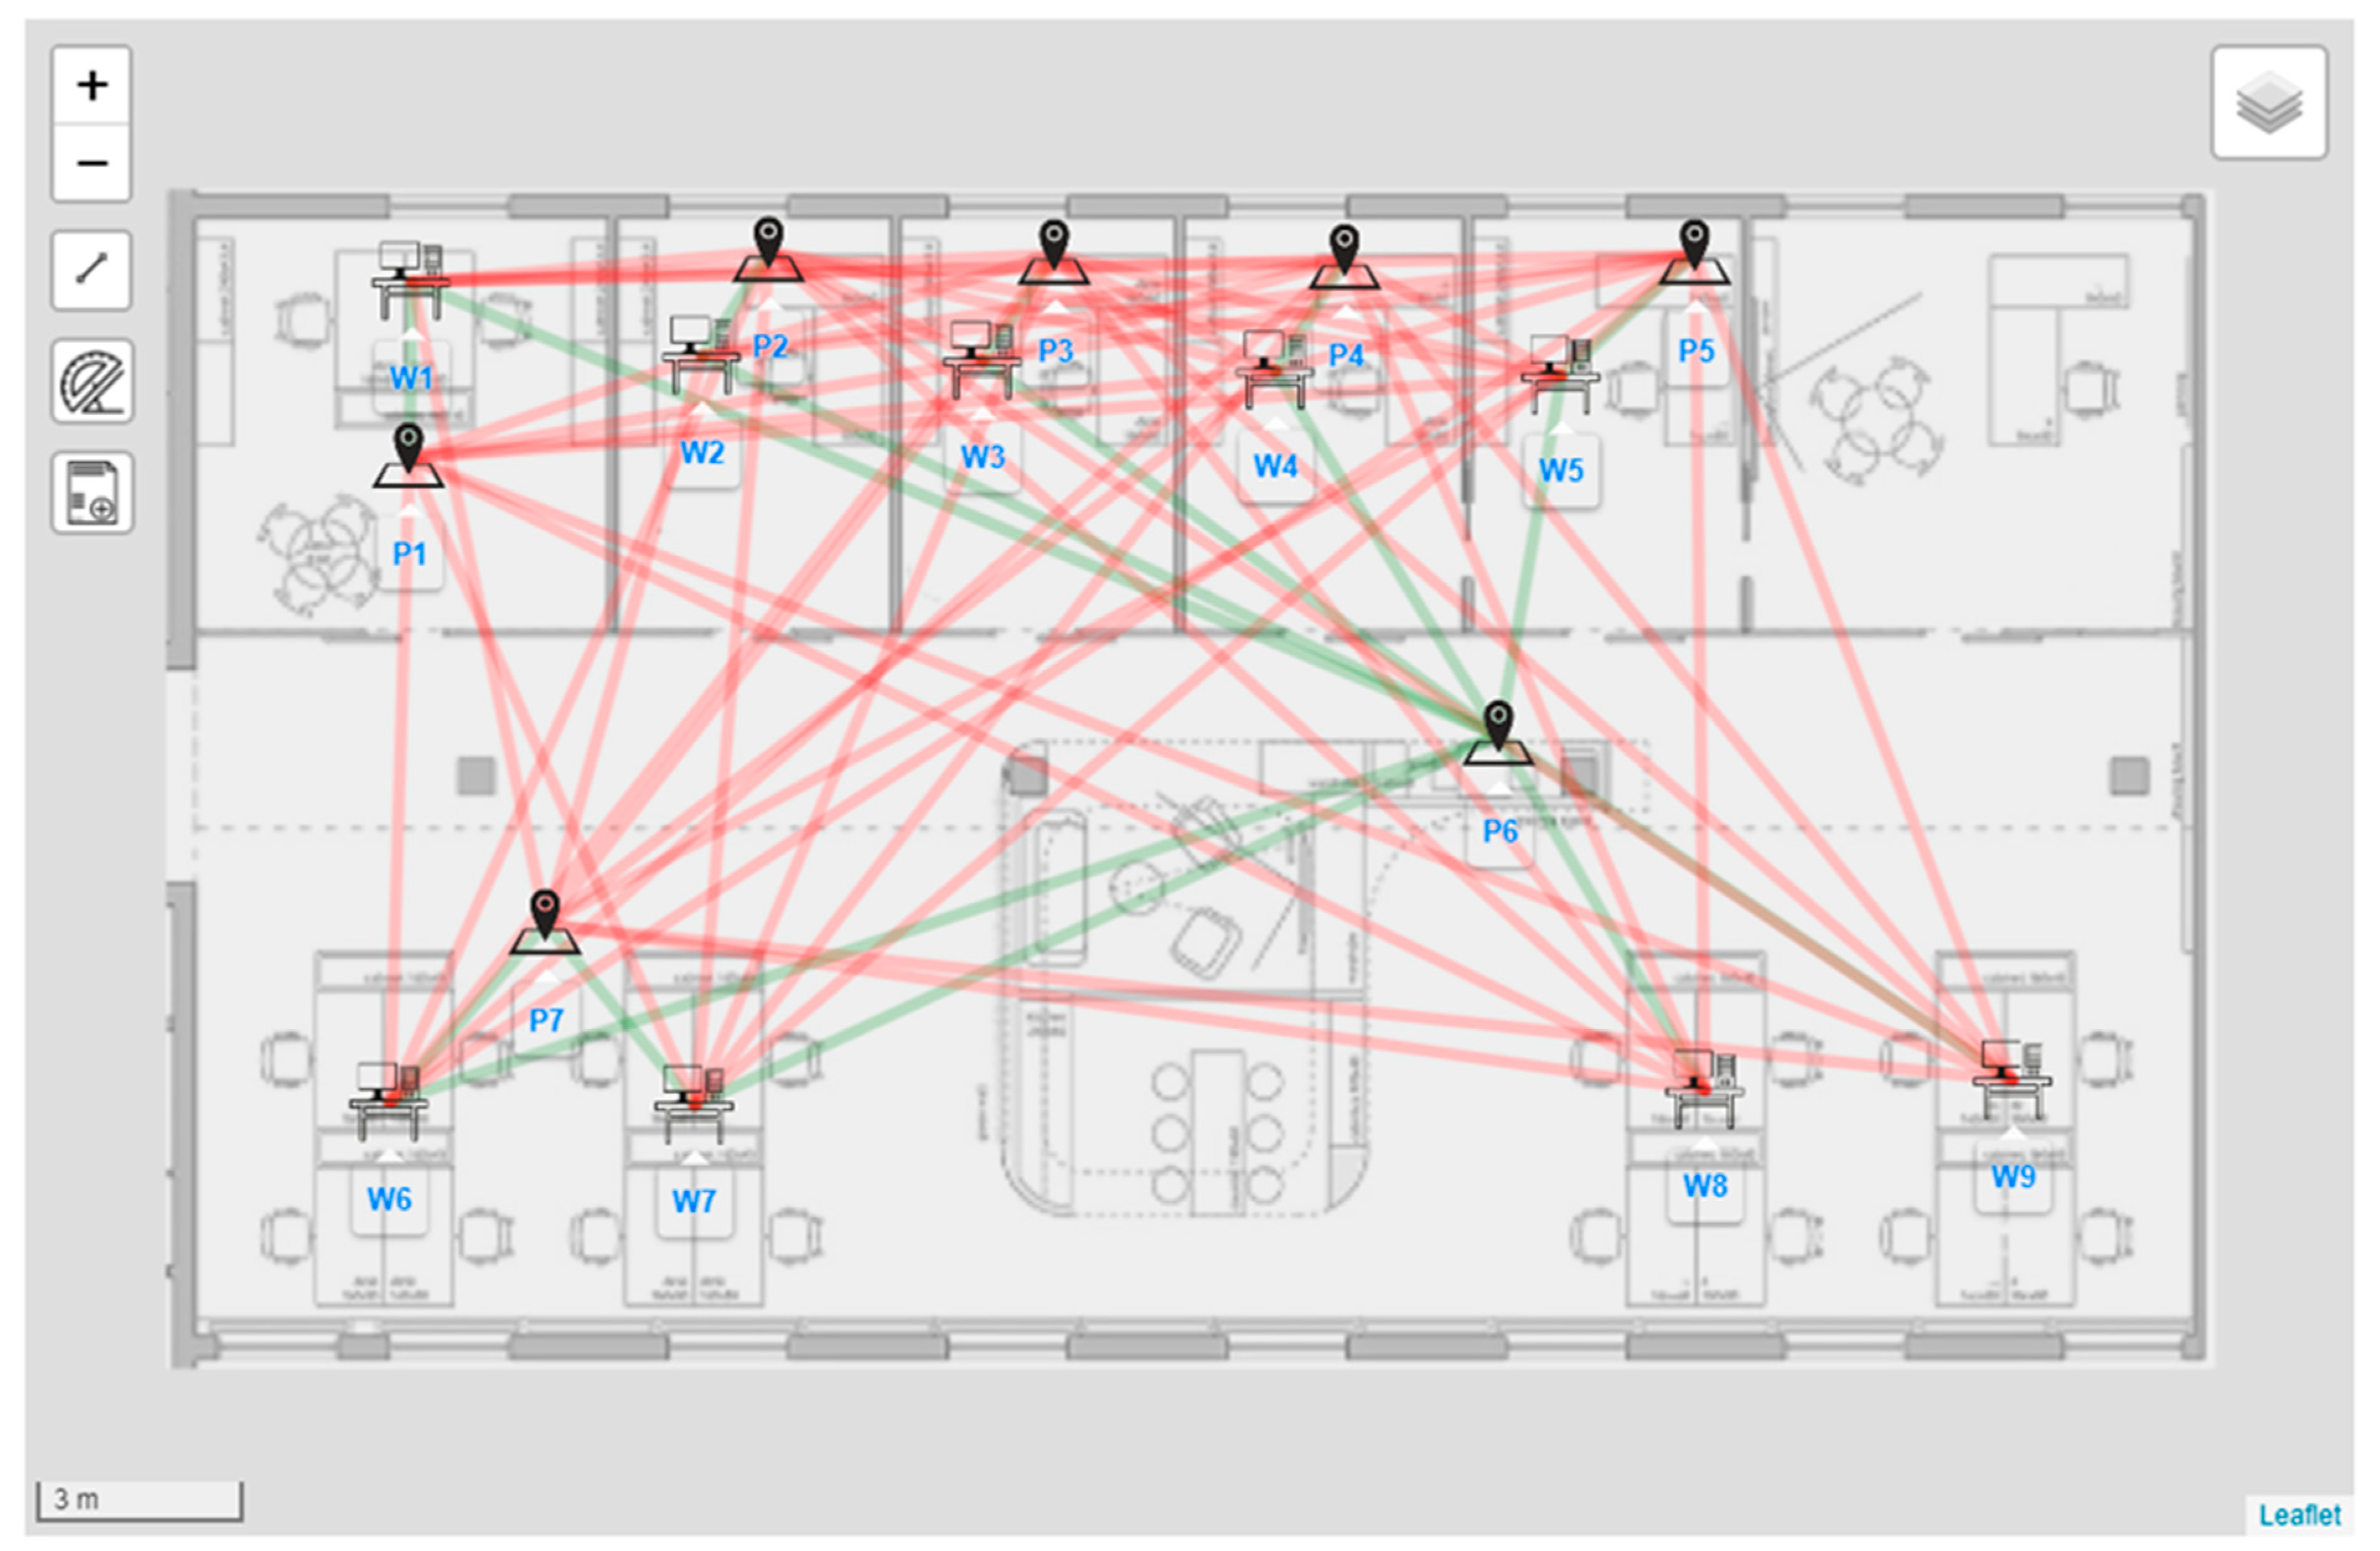
Figure 6 illustrates the correlation between print/copy access of workstations to specific devices and candidate printer locations. The links (lines connecting different nodes, also commonly defined as edges) show the planned printer network permission, in other words, how the workgroup administrator will manage the printer access. For example, the figure shows that all employees may have access to the printing device installed at the candidate location P6 and other devices within their physical vicinity (green colored links in Figure 6). The links in red color indicate the restricted access to specific devices.
Each workstation has (1) a specific demand for printouts in a given month and (2) some particular requirements regarding the characteristics of these printouts (i.e., paper size and color, service type: printing or copying). Table 2 provides a breakdown in qualitative and quantitative terms of the total pages printed per workstation in a month. Furthermore, the table presents the total number of printed pages corresponding to the total demand for a typical floor in one of the office buildings owned or rented by the company. Additionally, note that the values considered in the case study are based on real-world data from a company operating in Poland.
The optimization model described in Section 4 helps workgroup/company administrators identify the most cost-effective printers/multi-function devices (including specific models) and locations from a database. The database comprises a list of printing devices and candidate locations. The candidate locations are categorized based on the physical space requirements of the printing/multi-function device. The location and allocation decision of such devices is optimized considering the criteria (printer features) required by the users of workstations W1–W9. The database mentioned above includes 11 types of printing devices, both inkjet and laser, distinguished by their power consumption in various operating modes (such as work, idle/standby, sleep), service and maintenance costs, and printing costs. The detailed technical and economic parameters of these devices are presented in Table 3 and Table 4.
Research Scenarios
The developed model is used to study the impact of energy consumption on the optimal selection and location of printing devices in the 100 functional departments located across Poland. Moreover, the results from the model are employed to assess the total carbon dioxide (CO2) emissions generated from all print and copy services in the company.
Additionally, the model’s capability in optimizing the total cost of (1) printer acquisition and (2) printing/document processing in the company is illustrated with the help of two research scenarios. The research scenarios mainly differ in the definition (formulation) of the objective function:
- REF scenario—This scenario serves as the reference for comparison. The objective function in this scenario includes the operating costs of printing/copying, service and maintenance, costs associated with the time needed for employees to reach the printing devices, and the costs of acquiring printers and multi-function devices. In this scenario, the objective function does not include the cost components associated with energy consumption.
- REF + EC scenario—In this scenario, besides the costs considered in the REF scenario, the objective function includes the cost components associated with the electricity consumption of the printer/MFD fleet —namely unit electricity consumption costs of printing 1 page on a given device , fixed costs of electricity consumption related to the total time when the device was in idle/standby () and sleep () mode.
A summary of the cost components considered in the scenarios is presented in Table 5.
The analysis using the developed decision-support and a discussion of the results obtained from the research scenarios are presented in Section 6.
6. Results
The results of the model calculations are presented in this section. Two fundamental differences exist between the research scenarios analyzed in this study. In the reference scenario (REF), the electricity consumption of the printers/MFDs and their related costs are not included in the objective function. In contrast, in the REF + EC scenario, the power usage of the printing devices was taken into account and used to determine their optimal location and allocation while minimizing the total cost of printer acquisition and printing/ document processing in the given company.
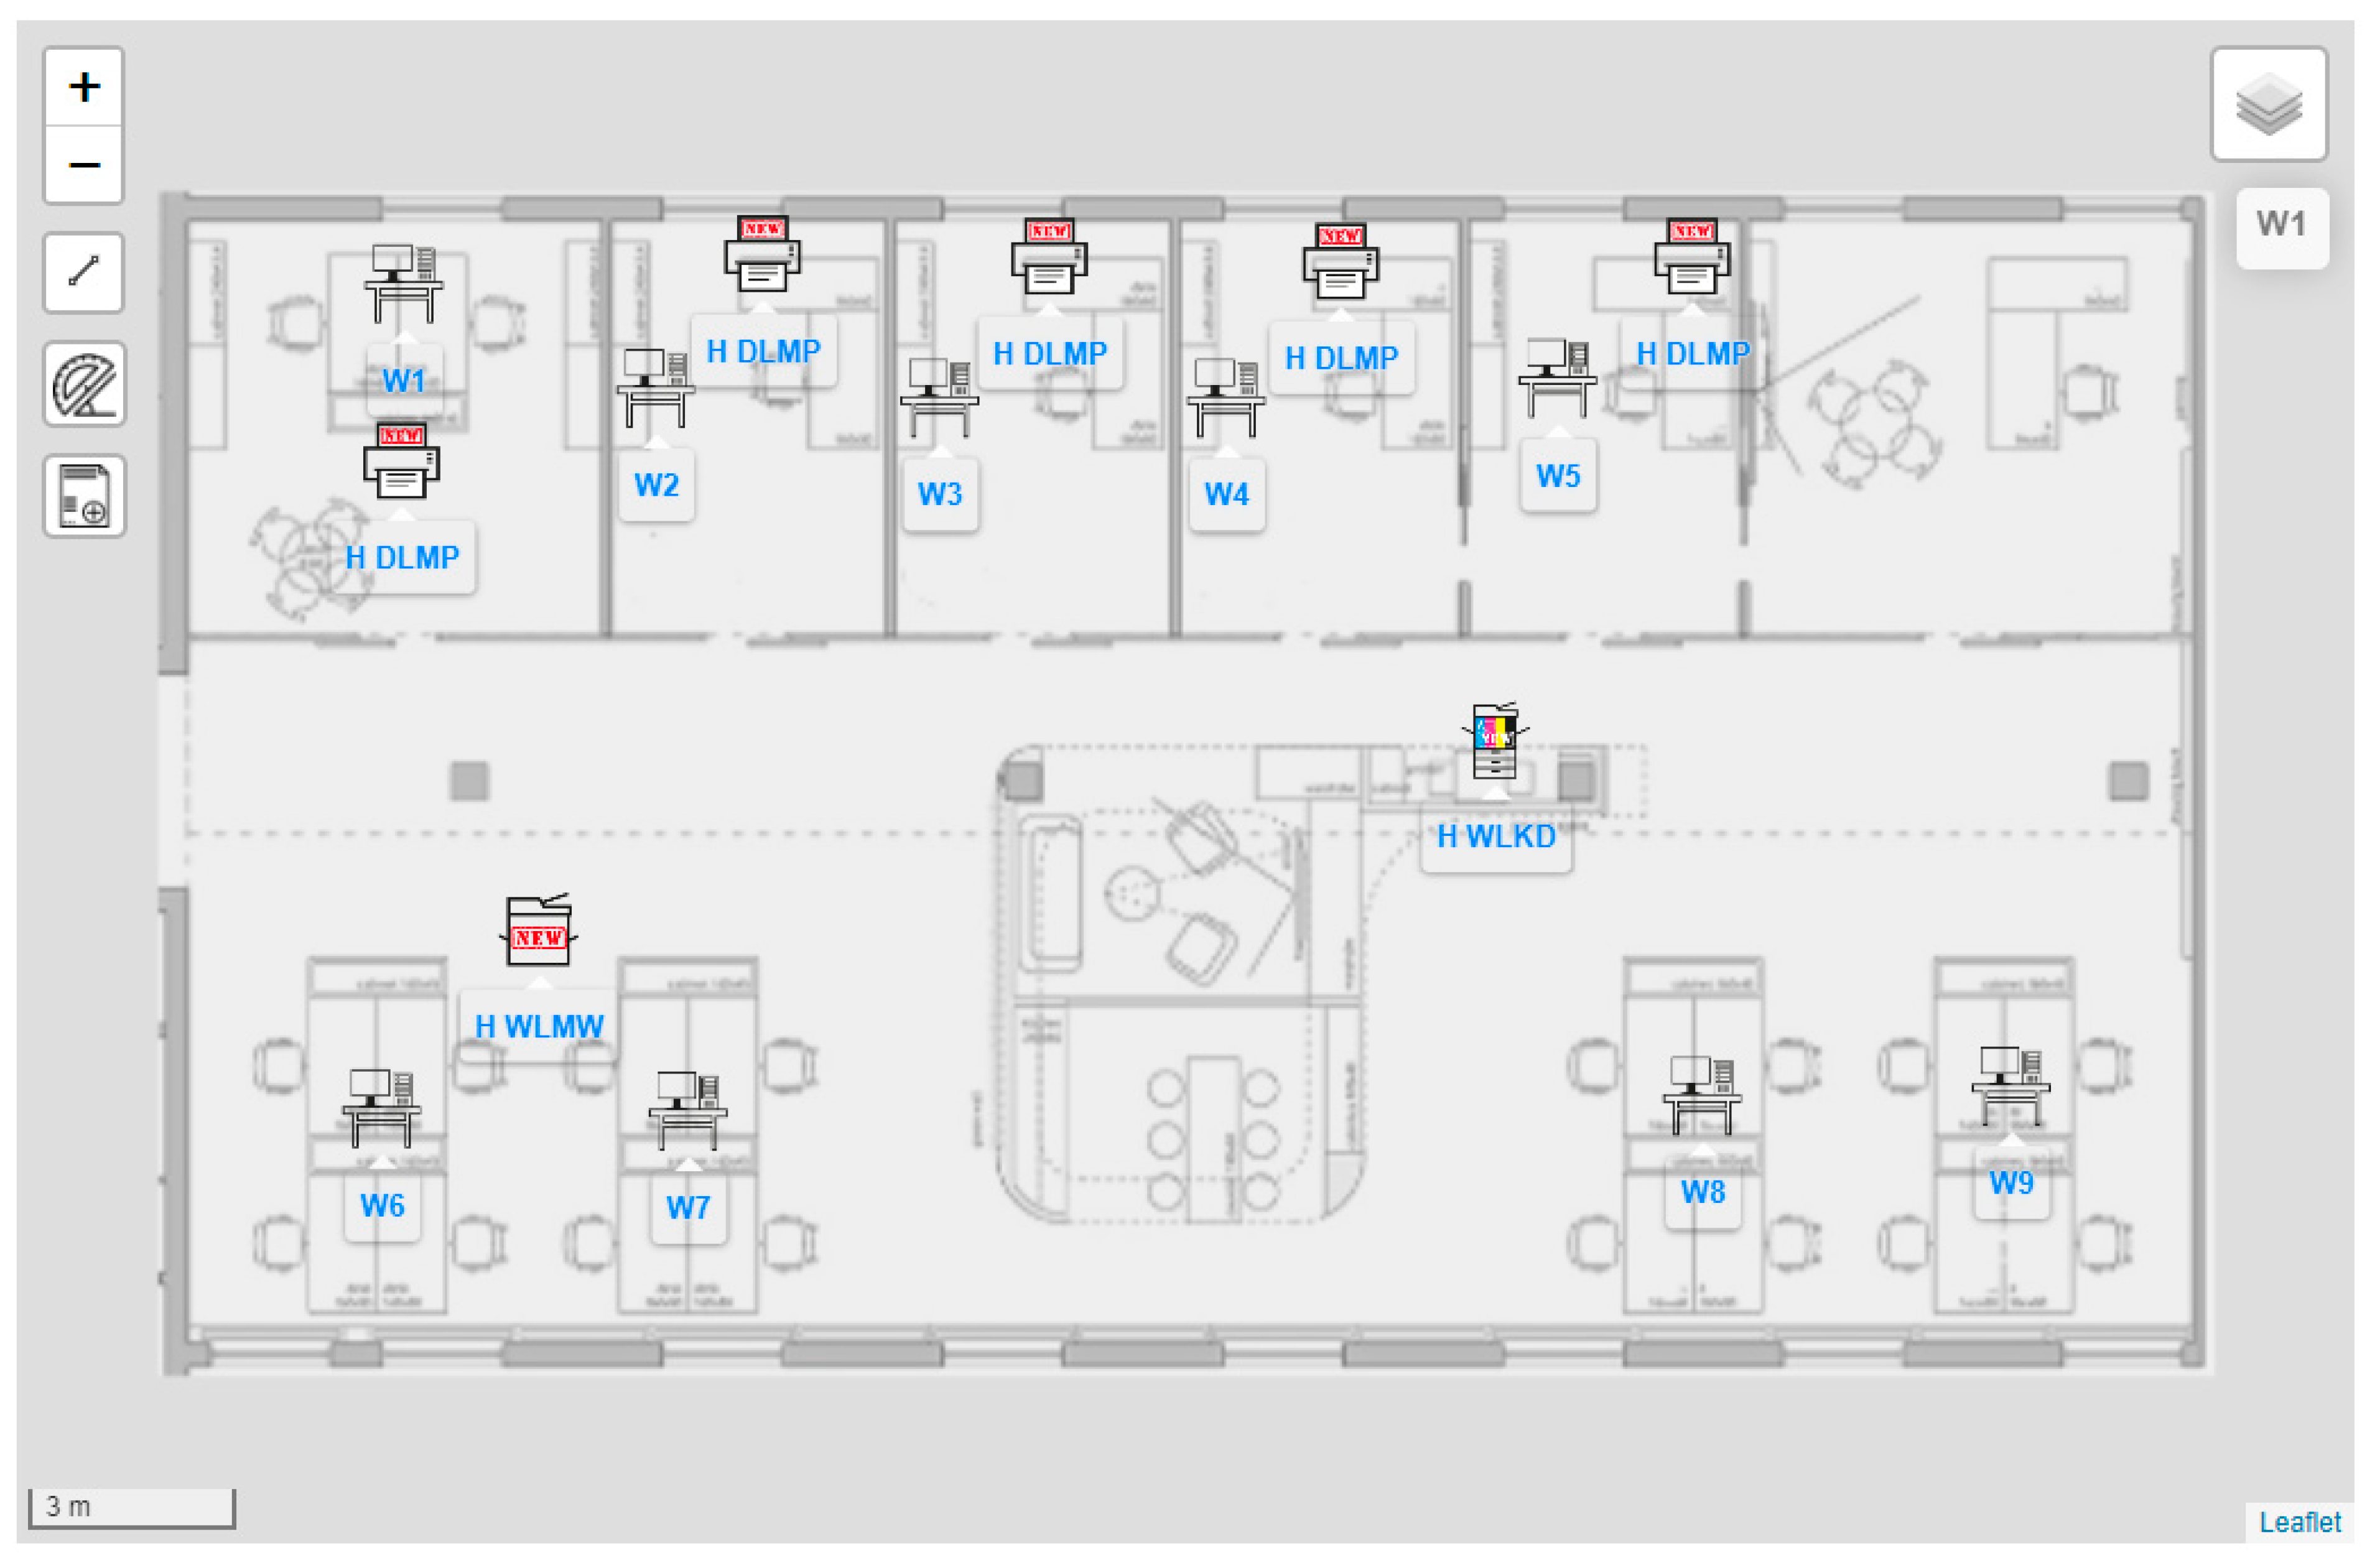
The results obtained in the REF scenario are presented in Figure 7. It is worth highlighting that the reference scenario does not consider the power consumption of the devices. In this scenario, the optimization model selected seven printers/MFDs using laser printing technology, among which three types of devices can be distinguished: DLMP (small personal printer), WLMW (device for workgroups), and WLKD (large multifunctional departmental device). As shown in the figure, all the candidate locations were selected, and each workstation was assigned a specific device (Table 6).
Table 6 presents a breakdown of each device’s total number of pages (according to the copy/print demand from a given workstation). The demand for monochrome A4 pages from workstations W1–W7 was met by the devices in the direct vicinity. In contrast, the special requirements for color printing and copying, including A3 format, were satisfied on a multi-function device (WLKD) incorporating these features.
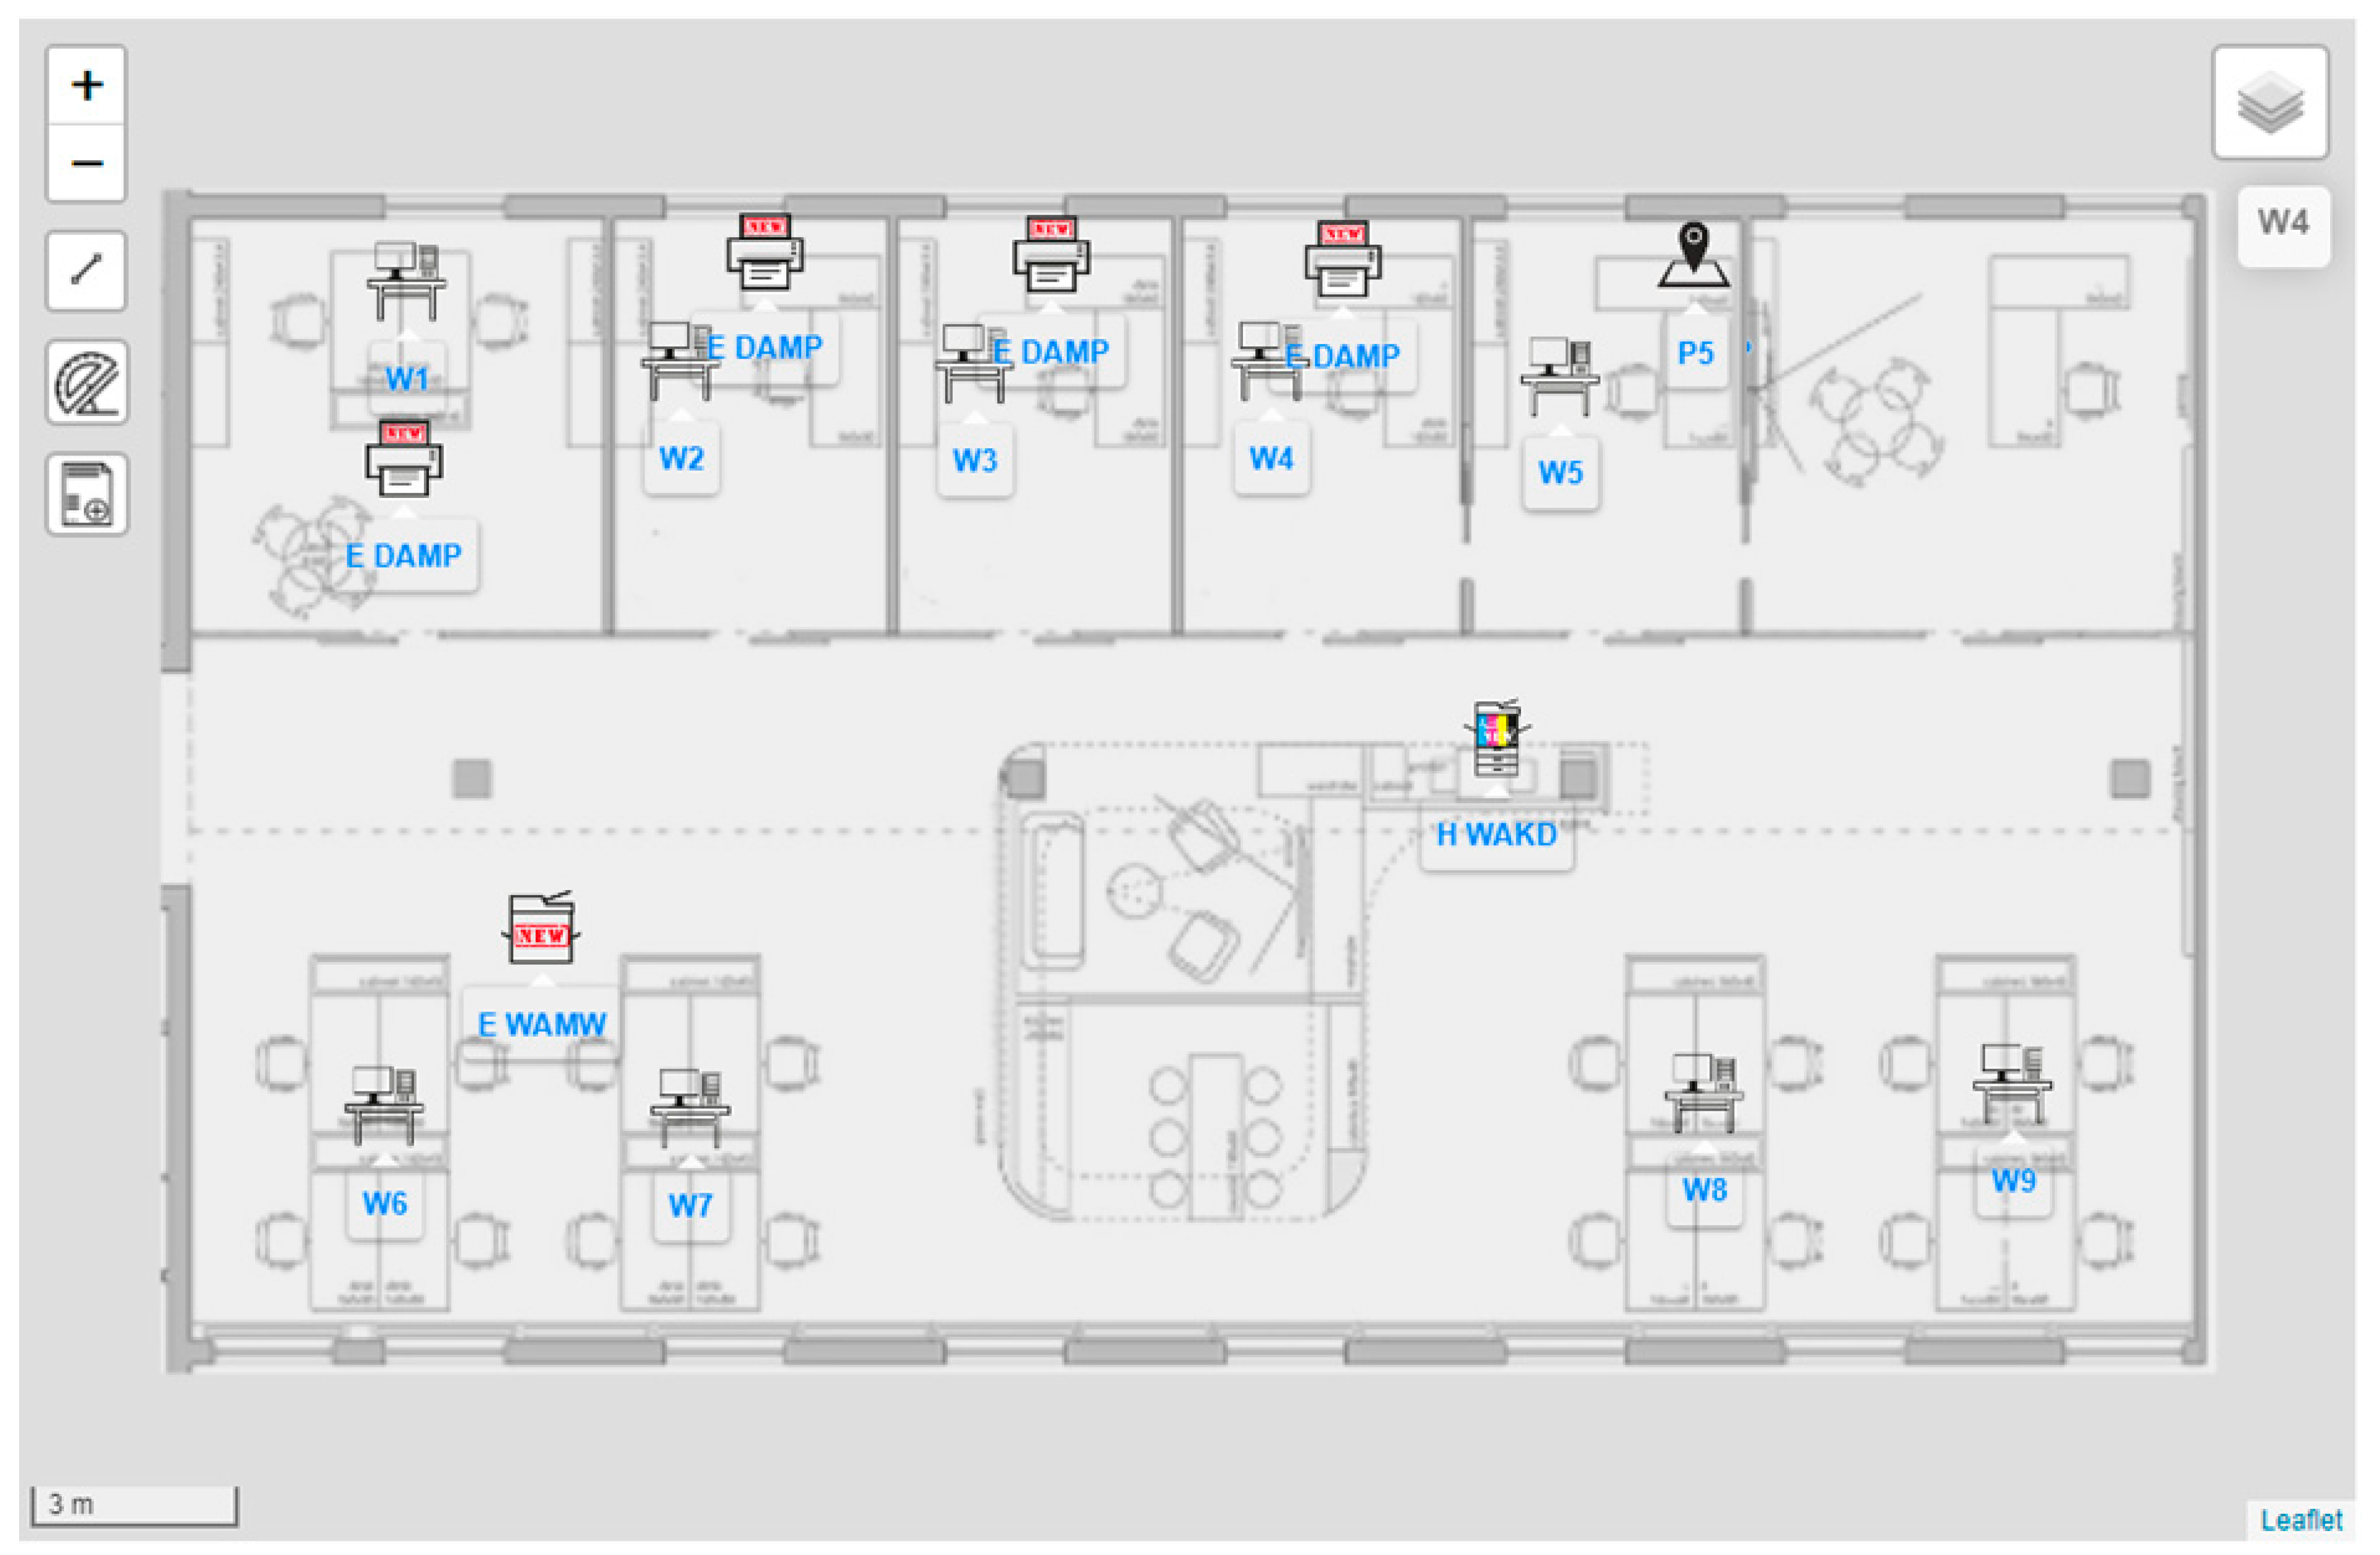
Different printing technologies were selected in the second scenario (REF + EC scenario). Despite that some of the devices in this scenario have higher printing costs (unit costs for mono and color printing) than the devices deployed in the REF scenario, they possess energy-saving capabilities (energy-efficient printers) that help reduce electricity costs. Additionally, the results indicated that the total system costs are minimized when location P5 is empty (no device installed unless strictly needed, as illustrated in Figure 8). In the REF + EC scenario, the workstations were assigned small personal printers (DAMP to W1–W4), medium-sized workgroup devices (WAMW assigned to W6 and W7), and a large departmental device (WAKD). The large departmental device satisfied the aggregate printout demand of workstations W8, W9, and W5, as shown in Table 7.
Table 8 compares the monthly costs associated with the installation and operation of the printing devices on the analyzed floor. Note that in the REF scenario, electricity consumption costs were not included in the objective function. Therefore, the cost components related to the power usage (as shown in Table 7) were estimated after the optimization process. More energy-efficient devices were selected in the second scenario (REF + EC), resulting in a relatively small increase in printing costs (2.5% and 10% increase for monochrome and color pages, respectively, compared to the REF scenario). The costs associated with the distance between devices and workstations increased by 9.3%, mainly due to the lack of a personal printer in location P5. As a result, the total monthly system costs in the REF + EC scenario decreased from EUR 217.2 to EUR 206.3, or approximately 5.1%. The changes were due to the drastic reduction in electricity consumption. As a result, the power consumption costs in the REF + EC scenario are lower by almost 72% (compared to the REF scenario), with the most significant reduction cause by the devices operating in work mode. Additionally, the costs of purchasing printing devices also slightly decreased, a decrease of 3.1% compared to the REF scenario.
The results presented in this section show that the mathematical model developed in this paper facilitates the planning and management of information technologies such as printing devices in a company. Moreover, it is a suitable approach for achieving significant savings in a company, particularly in the context of rising electricity prices. The selection of more energy-efficient printing devices leads to a considerable reduction in electricity consumption, related not only to the direct operation of these devices but also to their modes of operation (work, idle, or sleep). Such actions also bring tangible effects in reducing carbon dioxide emissions. This is particularly important for carbon intensity economies such as Poland-where fossil fuels still dominate the energy mix (e.g., hard coal and lignite).
Table 9 presents a breakdown of the electricity consumption and carbon dioxide emissions in the representative floor and the 500 floors located in several office buildings. The results of the representative floor are presented in monthly amounts. In contrast, the total values for the case study are presented in annual terms (computed for the 100 functional departments in Poland). The carbon dioxide emissions were estimated using the CO2 emission factor for electricity consumption (end-users) reported by the National Centre for Emissions Management (KOBiZE) [23]. The average value in 2019 was 719 kg CO2/MWh. In the representative floor of the REF+EC scenario, the deployment of energy-efficient devices led to a reduction in electricity consumption of nearly 34.2 kWh per month. This translates into a reduction in carbon emissions of about 24.6 kg/month (compared to the reference REF scenario). Further, by scaling up the electricity savings of one floor to 500 floors, the annual electricity savings of the entire company is approximately 205 MWh, which eliminates over 147 Mg of carbon dioxide emissions annually.
7. Conclusions
In this paper, we propose a novel method for optimizing the location and allocation of printers and MFDs in enterprises, institutions, and public offices taking into consideration the power usage of the devices already installed and in inventory. The mathematical model, which is based on a mixed-integer linear programming (MILP) approach, minimizes the total monthly cost of the office printing system (i.e., printer acquisition and printing and document processing). The findings obtained from the model application, including the scenario analysis, support the following conclusions:
- The optimization model can select the most suitable location for the installation of printers and MFDs in an office floor plan considering the requirements expressed by the users of the workstations. The model described in this work also considers the distance between the devices and workstations, the demand for printouts, and the locations’ physical space or predefined printer size.
- The REF + EC scenario confirmed that the implementation in the objective function of the cost components associated with the printer/MFD fleet (e.g., different operating modes/states of devices) leads to a reduction in total system costs. For the analyzed case study, the total system costs decreased by 5.1%, while the total energy consumption costs dropped by 71.8%. These results were achieved by installing devices, in this particular case inkjet printers, with slightly higher unit printing costs and significantly lower power consumption than laser printers.
- Because of the flexible structure of the model and the objective function, companies can investigate the impact of essential parameters such as printing costs, acquisition costs of new devices, distance costs, or electricity consumption costs on the optimal configuration of the office printing system.
- The allocation of more energy-efficient printing devices leads to a considerable reduction in electricity consumption and brings tangible effects in reducing carbon dioxide emissions. The total electricity savings of the company described in the case study is approximately 205 MWh, reducing around 147 Mg of carbon dioxide emissions annually. This is particularly important for the company’s social and environmental responsibility efforts.
Author Contributions
Conceptualization, P.K., P.B., R.R. and P.P.; methodology, P.P., P.K. and P.B.; software, P.K., P.P., R.R and M.M.; validation, P.K., P.B., P.P. and R.R.; formal analysis, P.K., P.B., R.R., M.M. and P.P.; investigation, P.K., P.B., R.R., M.M. and P.P.; resources, P.K., P.B., R.R., M.M. and P.P.; data curation, P.K., P.B., R.R. and M.M.; writing—original draft preparation, P.K., P.B. and M.M.; writing—review and editing, P.K., P.B., R.R., M.M. and P.P. visualization, P.K., P.B., R.R. and M.M.; supervision, P.B., R.R. and P.P.; project administration, R.R.; funding acquisition, R.R. All authors have read and agreed to the published version of the manuscript.
Funding
This research was funded by European Regional Development Fund under the Regional Operational Programme for the Małopolska Region for 2014–2020, project title “Model matematyczny jako integralny element systemu optymalizującego dobór i lokalizację urządzeń drukujących dla redukcji kosztów druku”.
Acknowledgments
This study was conducted as part of the statutory research of the Mineral and Energy Economy Research Institute of the Polish Academy of Sciences.
Conflicts of Interest
The authors declare no conflict of interest. The funders had no role in the design of the study; in the collection, analyses, or interpretation of data; in the writing of the manuscript, or in the decision to publish the results.
Abbreviations
| MFD | Multifunctional Devices |
| ICT | Information and Communication Technologies |
| CSR | Corporate Social Responsibility |
| DLMP | Laser, monochromatic, personal printer |
| DLMW | Laser, monochromatic, workgroup printer |
| WLMW | Laser, monochromatic, workgroup MFD |
| DLMD | Laser, monochromatic, departmental printer |
| DLKW | Laser, color, workgroup printer |
| WLKD | Laser, color, departmental MFD |
| WAKW | Inkjet, color, workgroup MFD |
| WAMW | Inkjet, monochromatic, workgroup MFD |
| WAKD | Inkjet, color, departmental MFD |
| DAMP | Inkjet, monochromatic, personal printer |
Appendix A

Table A1.
Sets of the mathematical model.
| Sets | Alias | Description |
|---|---|---|
| AllPrinter | p | Set of all printing devices-printers and multifunctional printing devices (MFD)-models, |
| WorkStation | w | Set of workstations, |
| PrinterInstallationPlace | pl | Set of candidate locations for the installation of printers, |
| PrinterApplicationType | pa | Set of printer size/purpose categories (application types: small-personal; medium-workgroups; big-departmental), |
| PrinterItem | e | Set of unique printing devices (printers/MFDs) in inventory |
| PrinterTechnology | k | Set of qualitative (technology type, color, paper size, document processing functions) and quantitative features/parameters (recommended monthly print volume, maximum monthly print volume, power consumption in work, idle and sleep mode; print speed) of printers/multifunctional printing devices, |
Table A2.
Parameters of the mathematical model.
| Parameters | Description |
|---|---|
| WorkstationSpecRequirementsk,w | Specific requirement of workstation for printer feature – matrix, 1 if the workstation w requires a particular feature k; otherwise 0 |
| DBPrinterParametersk,p | Assignment of specific qualitative and quantitative feature/parameter to device model |
| RecMonthlyPageVolp | Recommended monthly print volume of device model |
| Recommended_print_marginp | Allowed excess margin of the recommended monthly print volume of device model |
| MaxNoPrinterItemp | Maximum number of devices of model in inventory |
| ColorPrintCostp | Unit cost of printing 1 color page (A4 format) on a given device of model |
| MonoPrintCostp | Unit cost of printing 1 monochrome page (A4 format) on a given device of model |
| MaintenanceCostp | Unit cost of service and maintenance of a printing device of model |
| PowerUsageCostp | Unit cost of power consumption of printing 1 page on a given device of model (based on the power consumption in work mode, printing speed of the device, and assumed electricity price) |
| SleepPowerUsageCostp | Cost of power consumption of device model in sleep mode (for non-working hours) |
| IdlePowerUsageCostp | Cost of power consumption of device model in idle mode (for working hours) |
| AcquisitionCostp | Cost of purchasing a new printing device of model |
| PrinterColorPagesw | Total demand (color A4 page size) from workstation |
| PrinterMonoPagesw | Total demand (monochrome, A4 page size) from workstation |
| PrinterA3Pagesw | Total demand (monochrome A3, page size) from workstation |
| PrinterCopyPagesw | Total demand (monochrome copy, A4 page size) from workstation |
| PrinterA3ColorPagesw | Total demand (color A3, page size) from workstation |
| PrinterCopyColorPagesw | Total demand (color copy, A4 page size) from workstation |
| PrinterA3CopyPagesw | Total demand (monochrome copy, A3 page size) from workstation |
| PrinterA3CopyColorPagesw | Total demand (color copy, A3 page size) from workstation |
| PrinterAllowedInstallation PlaceDistancew,pl | Distance between workstation and candidate location |
| MustBeInstalledp,e | Parameter indicating that (without indicating the place of installation) device of model must be included in the model solution (1 if the device must be installed, otherwise 0) |
| DBPrinterApplicationp,pa | Parameter indicating the size/purpose category of device model (1 if the device matches the category; otherwise 0) |
| PrinterApplicationPlace Requirementspl,pa | Parameter indicating the size/purpose category of candidate location (1 if the location pl can be used to install a device of category pa; otherwise 0) |
| PrinterItemToWorkstationLimp,e | Maximum number of workstations that can be assigned to device of model |
| WorkstationToPrinterLimw | Minimum number of printing devices that a workstation must be assigned |
| PrinterItemToPlaceMRpl,p,e | Parameter assigning a given device of model to location |
| WorkstationToPlaceAllowedw,pl | Parameter indicating the links between workstation and candidate location o |
| TotPage | Total number of pages printed (copied) by all workstations (total demand) |
| DistFactor | Weighting factor of the cost component related to the distance between workstations and printing devices |
| BigM | Sufficiently large number |
Table A3.
Variables of the mathematical model.
| Variables | Description |
|---|---|
| Continuous variables | |
| PrinterPageQuantityp,e,w | Total print volume (monochrome, A4 page size) of device of model sent from workstation |
| PrinterColorPageQuantityp,e,w | Total print volume (color, A4 page size) of device of model sent from workstation |
| PrinterA3PageQuantityp,e,w | Total print volume (monochrome, A3 page size) of device of model sent from workstation |
| PrinterCopyPageQuantityp,e,w | Total print volume (monochrome copy, A4 page size) of device of model sent from workstation |
| PrinterA3ColorPageQuantityp,e,w | Total print volume (color, A3 page size) of device of model sent from workstation |
| PrinterCopyColorPage Quantityp,e,w | Total print volume (color copy, A4 page size) of device of model sent from workstation |
| PrinterA3CopyPage Quantityp,e,w | Total print volume (monochrome copy, A3 page size) of device of model sent from workstation |
| PrinterA3CopyColorPage Quantityp,e,w | Total print volume (color copy, A3 page size) of device of model sent from workstation |
| PrinterPageQuantityVariablesp,e,w | Auxiliary variable, represents all printer page quantity variables present in Equation (13) |
| PrinterPageAllp,e,w | Total print volume (all page types) sent from workstation in device of model |
| LinPQLocpl,p,e,w | Auxiliary variable employed to linearize the product of two variables |
| TotalCosts | Total system costs related to the installation and operation of the printing devices (including the cost of electricity consumption) |
| Binary variables | |
| AssignedPrinterItemToPlace ToWorkstationpl,p,e.w | Variable indicating whether device of model is assigned to candidate location and workstation |
| PrinterItemActivep,e | Variable indicating whether the printing device of model is active; 1 if device is active; 0 otherwise |
| PrinterItemLocalizationp,e,pl | Variable indicating whether printer/MFD of model is assigned to candidate location |
References
- Azarmand, Z.; Neishabouri, E. Location Allocation Problem. In Facility Location: Concepts, Models, Algorithms and Case Studies; Zanjirani Farahani, R., Hekmatfar, M., Eds.; Physica-Verlag HD: Heidelberg/Berlin, Germany, 2009; pp. 93–109. ISBN 978-3-7908-2151-2. [Google Scholar]
- Cooper, L. Location-Allocation Problems. Open. Res. 1963, 11, 331–343. [Google Scholar] [CrossRef]
- Moellmann, J.; Thomas, V.M. Social enterprise factory location and allocation model: Small scale manufacturing for East Africa. Socioecon. Plann. Sci. 2019, 68, 100694. [Google Scholar] [CrossRef]
- Rabbani, M.; Hosseini-Mokhallesun, S.A.A.; Ordibazar, A.H.; Farrokhi-Asl, H. A hybrid robust possibilistic approach for a sustainable supply chain location-allocation network design. Int. J. Syst. Sci. Oper. Logist. 2020, 7, 60–75. [Google Scholar] [CrossRef]
- Fathollahi Fard, A.M.; Hajaghaei-Keshteli, M. A tri-level location-allocation model for forward/reverse supply chain. Appl. Soft Comput. J. 2018, 62, 328–346. [Google Scholar] [CrossRef]
- Kaveh, M.; Kaveh, M.; Mesgari, M.S.; Paland, R.S. Multiple criteria decision-making for hospital location-allocation based on improved genetic algorithm. Appl. Geomat. 2020, 12, 291–306. [Google Scholar] [CrossRef]
- Tirkolaee, E.B.; Mahdavi, I.; Esfahani, M.M.S.; Weber, G.W. A robust green location-allocation-inventory problem to design an urban waste management system under uncertainty. Waste Manag. 2020, 102, 340–350. [Google Scholar] [CrossRef] [PubMed]
- Tan, B.; Ma, H.; Mei, Y.; Zhang, M. Evolutionary Multi-Objective Optimization for Web Service Location Allocation Problem. IEEE Trans. Serv. Comput. 2021, 14, 458–471. [Google Scholar] [CrossRef] [Green Version]
- Lähderanta, T.; Leppänen, T.; Ruha, L.; Lovén, L.; Harjula, E.; Ylianttila, M.; Riekki, J.; Sillanpää, M.J. Edge computing server placement with capacitated location allocation. J. Parallel Distrib. Comput. 2021, 153, 130–149. [Google Scholar] [CrossRef]
- Louis Hakimi, S.; Kuo, C.C. On a general network location-production-allocation problem. Eur. J. Oper. Res. 1991, 55, 31–45. [Google Scholar] [CrossRef]
- Lin, W.; Wang, W.; Wu, W.; Pang, X.; Liu, B.; Zhang, Y. A heuristic task scheduling algorithm based on server power efficiency model in cloud environments. Sustain. Comput. Inform. Syst. 2018, 20, 56–65. [Google Scholar] [CrossRef]
- Asghari, N.M.; Mandjes, M.; Walid, A. Energy-efficient scheduling in multi-core servers. Comput. Netw. 2014, 59, 33–43. [Google Scholar] [CrossRef]
- Karthikeyan, G.K.; Jayachandran, P.; Venkataraman, N. Energy aware network scheduling for a data centre. Int. J. Big Data Intell. 2015, 2, 37. [Google Scholar] [CrossRef]
- Méndez-Piñero, M.I.; Colón-Vázquez, M. Economic analysis of alternatives for optimizing energy use in manufacturing companies. Energy Econ. 2013, 40, 146–154. [Google Scholar] [CrossRef]
- Guérout, T.; Gaoua, Y.; Artigues, C.; Da Costa, G.; Lopez, P.; Monteil, T. Mixed integer linear programming for quality of service optimization in Clouds. Future Gener. Comput. Syst. 2017, 71, 1–17. [Google Scholar] [CrossRef] [Green Version]
- Benalcazar, P.; Kamiński, J.; Saługa, P.W. The storage location problem in a coal supply chain: Background and methodological approach. Gospod. Surowcami Miner. 2017, 33, 5–14. [Google Scholar] [CrossRef] [Green Version]
- Malec, M.; Benalcazar, P.; Kaszyński, P. Optimal location of gas network maintenance centres: A case study from Poland. J. Nat. Gas Sci. Eng. 2020, 83, 103569. [Google Scholar] [CrossRef]
- Olszewski, R.; Pałka, P.; Wendland, A.; Majdzińska, K. Application of cooperative game theory in a spatial context: An example of the application of the community-led local development instrument for the decision support system of biogas plants construction. Land Use Policy 2021, 108, 105485. [Google Scholar] [CrossRef]
- Sun, X.; Yu, H.; Solvang, W.D. Solving the Location Problem of Printers in a University Campus Using p-Median Location Model and AnyLogic Simulation. In Lecture Notes in Electrical Engineering; Springer: Singapore, 2020; Volume 634, pp. 577–584. ISBN 9789811523403. [Google Scholar]
- Hakimi, S.L. Optimum Distribution of Switching Centers in a Communication Network and Some Related Graph Theoretic Problems. Oper. Res. 1965, 13, 462–475. [Google Scholar] [CrossRef]
- Rosenthal, R.E. GAMS—A User’s Guide; GAMS Development Corporation: Washington, DC, USA, 2007. [Google Scholar]
- Bussieck, M.R.; Meeraus, A. General Algebraic Modeling System (GAMS). In Modeling Languages in Mathematical Optimization. Applied Optimization; Kallrath, J., Ed.; Springer: Boston, MA, USA, 2004; Volume 88. [Google Scholar] [CrossRef]
- Krajowy Ośrodek Bilansowania i Zarządzania Emisjami. WSKAŹNIKI EMISYJNOŚCI CO2, SO2, NOx, CO i Pyłu Całkowitego DLA ENERGII ELEKTRYCZNEJ na Podstawie Informacji Zawartych w Krajowej Bazie o Emisjach Gazów Cieplarnianych i Innych Substancji za 2019 Rok; IOŚ-PIB: Warszawa, Poland, 2020. [Google Scholar]
Figure 1.
Scheme of the optimization framework.

Figure 2.
Model computation time as a function of the number of printing devices.

Figure 3.
Model computation time as a function of the number of workstations.

Figure 4.
Model computation time as a function of the number of printing devices and the number of workstations.
Figure 4.
Model computation time as a function of the number of printing devices and the number of workstations.

Figure 5.
Case study floor plan-candidate locations, workstations, and printing devices.

Figure 6.
Case study floor plan-local printer permissions for specific workstations (W1–W9) and printers installed at candidate locations (P1–P7).
Figure 6.
Case study floor plan-local printer permissions for specific workstations (W1–W9) and printers installed at candidate locations (P1–P7).

Figure 7.
Reference (REF) scenario results—assignment of printing devices to places and workstations.
Figure 7.
Reference (REF) scenario results—assignment of printing devices to places and workstations.

Figure 8.
REF + EC scenario results—assignment of printing devices to places and workstations.

Table 1.
Model statistics.
| Parameter | Value | Parameter | Value |
|---|---|---|---|
| Blocks of equations | 34 | Single equations | 27,321 |
| Blocks of variables | 14 | Single variables | 16,556 |
| Non-zero elements | 170,423 | Discrete variables | 4851 |
Table 2.
Demand for different types of printouts.
| Work- Station | Demand-Number of Printed Pages | ||||||||
|---|---|---|---|---|---|---|---|---|---|
| A4 Mono | A3 Mono | A4 Color | A3 Color | Total | |||||
| Copy | Copy | Copy | Copy | ||||||
| W1 | 2000 | 0 | 0 | 0 | 0 | 0 | 0 | 0 | 2000 |
| W2 | 2500 | 375 | 79 | 19 | 165 | 42 | 109 | 2 | 3291 |
| W3 | 1500 | 375 | 79 | 19 | 165 | 42 | 9 | 2 | 2191 |
| W4 | 3001 | 0 | 0 | 0 | 0 | 0 | 0 | 0 | 3001 |
| W5 | 2500 | 0 | 0 | 0 | 0 | 0 | 0 | 0 | 2500 |
| W6 | 4000 | 1000 | 212 | 52 | 440 | 112 | 24 | 5 | 5845 |
| W7 | 1000 | 250 | 53 | 13 | 110 | 28 | 6 | 1 | 1461 |
| W8 | 2000 | 500 | 106 | 26 | 220 | 56 | 12 | 2 | 2922 |
| W9 | 2000 | 500 | 106 | 26 | 220 | 56 | 12 | 2 | 2922 |
| Total | 20,501 | 3000 | 635 | 155 | 1320 | 336 | 172 | 14 | 26,133 |
Table 3.
Basic features of the printing devices used in the case study.
| Name | Print Technology | Speed | Max Paper Format | Color Support | Scan Support | Copy Support |
|---|---|---|---|---|---|---|
| ppm | 1 = Yes; 0 = No | |||||
| DLMP | laser | 38 | A4 | 0 | 0 | 0 |
| DLMW | laser | 61 | A4 | 0 | 0 | 0 |
| WLMW | laser | 40 | A4 | 0 | 1 | 1 |
| DLMD | laser | 52 | A4 | 0 | 1 | 1 |
| DLKW | laser | 38 | A4 | 1 | 0 | 0 |
| WLKD | laser | 50 | A3 | 1 | 1 | 1 |
| WAKW | ink | 40 | A4 | 1 | 1 | 1 |
| WAMW | ink | 40 | A4 | 0 | 1 | 1 |
| WAKD | ink | 60 | A3 | 1 | 1 | 1 |
| WLKD2 | laser | 56 | A4 | 1 | 1 | 1 |
| DAMP | ink | 30 | A4 | 0 | 0 | 0 |
Table 4.
Techno-economic parameters of the printing devices used in the case study.
| Name | Suggested Load | Mono Cost | Color Cost | Maintenance Cost | Purchase Cost | Power Consumption | ||
|---|---|---|---|---|---|---|---|---|
| Work Mode | Idle Mode | Sleep Mode | ||||||
| Pages | EURcent | EURcent | EURcent | EUR | W | |||
| DLMP | 4000 | 0.225 | - | 0.045 | 224.8 | 495.00 | 15.00 | 1.50 |
| DLMW | 40,000 | 0.382 | - | 0.090 | 562.5 | 780.00 | 15.30 | 3.10 |
| WLMW | 7000 | 0.247 | - | 0.045 | 562.2 | 790.00 | 22.20 | 4.30 |
| DLMD | 40,000 | 0.337 | - | 0.090 | 1124.9 | 740.00 | 29.00 | 3.30 |
| DLKW | 15,000 | 0.495 | 3.150 | 0.022 | 472.5 | 617.00 | 33.70 | 3.95 |
| WLKD | 45,000 | 0.202 | 1.012 | 0.067 | 2024.8 | 951.00 | 65.00 | 12.00 |
| WAKW | 5000 | 0.427 | 3.262 | 0.090 | 477.0 | 30.00 | 10.00 | 1.80 |
| WAMW | 7000 | 0.247 | - | 0.056 | 562.5 | 12.00 | 5.50 | 0.90 |
| WAKD | 40,000 | 0.225 | 1.125 | 0.045 | 2024.8 | 137.00 | 42.00 | 1.60 |
| WLKD2 | 30,000 | 0.517 | 2.475 | 0.067 | 2924.8 | 900.00 | 47.00 | 0.90 |
| DAMP | 4000 | 0.225 | - | 0.045 | 225.0 | 14.00 | 3.00 | 0.70 |
Table 5.
Summary of costs considered in the research scenarios.
| Objective Function Components | REF Scenario | REF + EC Scenario |
|---|---|---|
| Printing costs | ● | ● |
| Maintenance/service costs | ● | ● |
| Hardware costs | ● | ● |
| Distance costs | ● | ● |
| Power consumption costs | ● |
Table 6.
Reference (REF) scenario results —printed/copied page volume of each printing device.
| W1 | W2 | W3 | W4 | W5 | W6 | W7 | W8 | W9 | |||
|---|---|---|---|---|---|---|---|---|---|---|---|
| (Print/Copy) | (Print/Copy) | (Print/Copy) | (Print/Copy) | (Print/Copy) | (Print/Copy) | (Print/Copy) | (Print/Copy) | (Print/Copy) | |||
| DLMP (P1) A4 Mono | |||||||||||
| 2000/0 | |||||||||||
| DLMP (P2) A4 Mono | |||||||||||
| 2500/0 | |||||||||||
| DLMP (P3) A4 Mono | |||||||||||
| 1500/0 | |||||||||||
| DLMP (P4) A4 Mono | |||||||||||
| 3001/0 | |||||||||||
| DLMP (P5) A4 Mono | |||||||||||
| 2500/0 | |||||||||||
| WLMW (P6) A4 Mono | |||||||||||
| 4000/1000 | 1000/250 | ||||||||||
| WLKD (P7) A3 Color A3 Mono A4 Mono A4 Color | |||||||||||
| 109/2 | 9/2 | 24/5 | 6/1 | 12/2 | 12/2 | ||||||
| 79/19 | 79/19 | 212/52 | 53/13 | 106/26 | 106/26 | ||||||
| 0/375 | 0/375 | 0/0 | 0/0 | 2000/500 | 2000/500 | ||||||
| 165/42 | 165/42 | 440/112 | 110/28 | 220/56 | 220/56 | ||||||
Table 7.
REF + EC scenario results—printed/copied page volume of each printing device.
| W1 | W2 | W3 | W4 | W5 | W6 | W7 | W8 | W9 | |||
|---|---|---|---|---|---|---|---|---|---|---|---|
| (Print/Copy) | (Print/Copy) | (Print/Copy) | (Print/Copy) | (Print/Copy) | (Print/Copy) | (Print/Copy) | (Print/Copy) | (Print/Copy) | |||
| DAMP (P1) A4 Mono | |||||||||||
| 2000/0 | |||||||||||
| DAMP (P2) A4 Mono | |||||||||||
| 2500/0 | |||||||||||
| DAMP (P3) A4 Mono | |||||||||||
| 1500/0 | |||||||||||
| DAMP (P4) A4 Mono | |||||||||||
| 3001/0 | |||||||||||
| WAMW (P6) A4 Mono | |||||||||||
| 4000/1000 | 1000/250 | ||||||||||
| WAKD (P7) A3 Color A3 Mono A4 Mono A4 Color | |||||||||||
| 109/2 | 9/2 | 24/5 | 6/1 | 12/2 | 12/2 | ||||||
| 79/19 | 79/19 | 212/52 | 53/13 | 106/26 | 106/26 | ||||||
| 0/375 | 0/375 | 2500/0 | 0/0 | 0/0 | 2000/500 | 2000/500 | |||||
| 165/42 | 165/42 | 440/112 | 110/28 | 220/56 | 220/56 | ||||||
Table 8.
Comparison of total monthly costs.
| Monthly Print Cost, EUR | Scenario REF | Scenario REF + EC | Difference | % of Change |
|---|---|---|---|---|
| Mono print cost | 55.36 | 56.73 | 1.37 | 2.5% |
| Color print cost | 20.53 | 22.59 | 2.05 | 10.0% |
| Maintenance cost | 13.90 | 12.46 | −1.44 | −10.4% |
| Power consumption costs | 21.42 | 6.05 | −15.37 | −71.8% |
| Work | 3.24 | 0.23 | −3.01 | −92.9% |
| Idle | 12.26 | 4.50 | −7.76 | −63.3% |
| Sleep | 5.91 | 1.32 | −4.60 | −77.7% |
| Distance cost | 46.03 | 50.32 | 4.28 | 9.3% |
| Purchase cost | 59.99 | 58.12 | −1.87 | −3.1% |
| Total cost (monthly) | 217.24 | 206.26 | −10.98 | −5.1% |
Table 9.
Comparison of energy and carbon emission reduction.
| Energy and Emission Savings | Unit | Scenario REF | Scenario REF + EC | Difference |
|---|---|---|---|---|
| Monthly values for 1 floor | ||||
| Energy consumption | kWh | 47.6 | 13.4 | −34.2 |
| Work mode | kWh | 7.2 | 0.5 | −6.7 |
| Idle mode | 27.3 | 10.0 | −17.3 | |
| Sleep mode | 13.1 | 2.9 | −10.2 | |
| CO2 emissions | kg | 34.2 | 9.7 | −24.6 |
| Yearly values for the entire company (100 departments, 500 floors) | ||||
| Energy consumption | MWh | 285.6 | 80.6 | −205.0 |
| Work mode | MWh | 43.3 | 3.1 | −40.2 |
| Idle mode | 163.5 | 60.0 | −103.5 | |
| Sleep mode | 78.8 | 17.6 | −61.3 | |
| CO2 emissions | Mg | 205.3 | 58.0 | −147.4 |
Publisher’s Note: MDPI stays neutral with regard to jurisdictional claims in published maps and institutional affiliations. |
© 2021 by the authors. Licensee MDPI, Basel, Switzerland. This article is an open access article distributed under the terms and conditions of the Creative Commons Attribution (CC BY) license (https://creativecommons.org/licenses/by/4.0/).
Share and Cite
MDPI and ACS Style
Kaszyński, P.; Benalcazar, P.; Pałka, P.; Rój, R.; Malec, M. Optimal Location-Allocation of Printing Devices for Energy Saving Using a Novel MILP Approach. Energies 2021, 14, 6353. https://doi.org/10.3390/en14196353
AMA Style
Kaszyński P, Benalcazar P, Pałka P, Rój R, Malec M. Optimal Location-Allocation of Printing Devices for Energy Saving Using a Novel MILP Approach. Energies. 2021; 14(19):6353. https://doi.org/10.3390/en14196353
Chicago/Turabian StyleKaszyński, Przemysław, Pablo Benalcazar, Piotr Pałka, Roman Rój, and Marcin Malec. 2021. "Optimal Location-Allocation of Printing Devices for Energy Saving Using a Novel MILP Approach" Energies 14, no. 19: 6353. https://doi.org/10.3390/en14196353
Note that from the first issue of 2016, this journal uses article numbers instead of page numbers. See further details here.