Article

Integration of Open-Source URBANopt and Dragonfly Energy Modeling Capabilities into Practitioner Workflows for District-Scale Planning and Design

1
Building Technologies and Science Center, National Renewable Energy Laboratory, Golden, CO 80401, USA
2
Ladybug Tools LLC, Fairfax, VA 22031-0000, USA
3
Skidmore, Owings & Merrill, Chicago, IL 60604, USA
*
Author to whom correspondence should be addressed.
The author completed the research while at Skidmore, Owings & Merrill, but is at the Massachusetts Institute of Technology at the time of publishing.
The author completed the research while at the National Renewable Energy Laboratory, but is at Camus Energy at the time of publishing.
Energies 2021, 14(18), 5931; https://doi.org/10.3390/en14185931
Submission received: 30 July 2021 / Revised: 14 September 2021 / Accepted: 15 September 2021 / Published: 18 September 2021
(This article belongs to the Special Issue Energy Efficiency of Buildings at the District Scale)

Abstract

:
High-performance districts and communities offer opportunities for reducing energy use, emissions, and costs, and can be instrumental in helping cities achieve their climate goals. The design of such communities requires identification of opportunities early on and their re-evaluation throughout the planning process. There is a need for energy modeling tools that connect 3D Computer-Aided Design (CAD) platforms to simulation engines, enabling detailed energy analysis of districts within the workflows and tools used by practitioners. This paper introduces the Dragonfly and URBANoptTM combined toolset that supports the creation of urban models from a range of geometry formats typically used by designers and planners, and provides an integrated pathway to simulate district-scale energy systems. The toolset is piloted by a global architecture and master planning firm to evaluate several key urban-scale technical questions for the design of a district in Chicago. The findings indicate that, while energy savings can be achieved through traditional architectural studies and enhancements to individual building efficiency, the modeling toolset helps identify additional savings and insights that can be achieved when considering district-scale energy systems. Finally, this study demonstrates how the Dragonfly/URBANopt toolset can integrate with master planning workflows, thereby enabling an iterative performance-based design process.

1. Introduction

1.1. Background

Cities are at the nexus of economic growth and development, and are facing rapid urbanization. More than half of the world’s population lives in urban areas and this statistic is projected to increase to 68% by 2050—representing an additional 2.5 billion people between 2018 and 2050 [1]. Cities now consume approximately two-thirds of the world’s energy, and account for 70% of the global greenhouse gas (GHG) emissions [2].
As countries across the world pledge to limit global warming to a 1.5 °C increase in global mean temperature as part of the Paris Climate Agreement, many cities are recognizing this challenge and leading the transition to a clean-energy future by adopting policies to reduce GHG emissions. More than 100 cities committed to net-zero carbon emissions by 2050 at the September 2019 United Nations Climate Summit [3]. Approximately 400 cities have released strategies with net-zero energy goals and more than 200 cities have developed policies and legislation incorporating net-zero energy targets as part of the Race to Zero campaign by the United Nations Framework Convention on Climate Change [4].
An energy-efficient and energy-flexible building stock will play an important role in achieving these commitments because building-related carbon dioxide (CO2) emissions reached an all-time high in 2019, amounting to 28% of the global energy-related CO2 emissions [5]. Between 2018 and 2050, buildings’ contribution to global energy consumption is expected to grow at the rate of 1.3% per year on average as per the International Energy Outlook 2019 Reference Case [6]. Both ultra-high-efficiency new buildings and efficiency retrofits, including building demand flexibility technologies to support the integration of more variable renewable generation into the grid, present a tremendous opportunity to decrease energy use and associated emissions worldwide. Within the United States, as part of the Department of Energy’s (DOE) Better Building Challenge, several businesses, cities, states and universities have committed to improving the energy efficiency of their portfolio of buildings by at least 20% over 10 years [7]. The DOE has set a national goal to increase energy efficiency and demand flexibility in the building sector to 3-fold what it was in 2020 by 2030 [8]. The U.S. General Services Administration has also committed to 100% renewable electricity sources for its 186 million square-foot real estate portfolio to tackle the climate crisis [9].
While climate commitments are being made at larger scales across cities and countries, it is at smaller scales where many specific projects, especially those that reduce emissions in the buildings sector, will occur. Within cities, the district or community scale, representing tens to hundreds of buildings, can be ideal for implementing change [10]. Greenfield development and brownfield redevelopment projects often take place at this scale. Districts and communities can act as testbeds or incubators for evaluating new technology integration approaches and development models which can then be replicated and scaled across cities. Improvements at a community scale may also be faster to implement compared to city-level initiatives, but can still be significant enough to have a positive impact as they can involve hundreds of thousands of square meters of conditioned building space in one project [11]. Design and implementation at the community scale has potential to be more human centered, compared to at the city scale, as solutions can be tailored to the specific needs of the community to be sustainable, resilient, equitable and flexible.
Moreover, designing energy systems at the district scale presents several potential opportunities and advantages in terms of energy, emissions and cost savings that are not possible at an individual building level [12,13,14]. It enables the design of more efficient energy infrastructure and systems by tapping into interdependencies between energy supply and demand. District thermal energy systems can be deployed to take advantage of thermal load diversity, where shared assets can efficiently address peak loads in different buildings at different times. For example, modern heat pump-based district thermal systems allow waste heat from buildings that are cooling to be shared with neighboring buildings that need heating. Energy storage and generation across buildings can increase resilience for a collection of buildings, offering more cost-effective solutions, capitalizing on economies of scale and higher asset utilization when shared across diverse groups of buildings.

1.2. Urban-Scale Energy Modeling

Urban-scale modeling is needed to identify and quantify these opportunities early on and throughout the planning process to develop integrated solutions and to achieve cost-effectiveness [12]. Urban building energy modeling (UBEM) refers to the modeling and performance-based simulation of a group of buildings within a district or a city, and has gained importance in recent years [15,16]. Within UBEM, there are two general categories of modeling approaches: top-down and bottom-up. The top-down approach starts at an aggregated level, considering a collection of buildings as a single unit, and works its way to an individual building level. It can estimate energy consumption for an individual building; however, it typically does not differentiate between energy end uses within the building [17]. The bottom-up approach builds up from a component level, estimating the end uses and energy consumption for an individual building and aggregating it to the district or urban scale. Within the bottom-up modeling approach, physics-based modeling uses dynamic thermal building models to predict energy use at granular timesteps and study the impact of energy efficiency measures at a district scale [18]. The bottom-up physics-based approach is often suitable for planning at an urban scale by planners, architects and utilities [15,19,20], particularly because it allows “what-if” questions to be investigated using physics-based models to predict the impacts of changes in designs or upgrades to existing conditions.
Several papers have reviewed the UBEM tools available and discussed their characteristics [20,21,22,23]. T. Hong et al. [20] provide a comprehensive view of all aspects in the UBEM ecosystem, discussing potential applications of UBEM, challenges and future research opportunities. M. Ferrando et al. [21] review bottom-up physics-based tools on the basis of required inputs, reported outputs, tool workflows, applicability and potential users to assist in selecting the appropriate UBEM tool for specific applications. A. Sola et al. [22] review multi-domain integrated tools, modeling the energy demand, generation and distribution at an urban scale through interaction of submodels.
Some examples of UBEM tools capable of physics-based, bottom-up district-scale analysis are City Energy Analyst (CEA), SimStadt, umi, District Zero and CitySim. CEA [24] runs as an extension of ArcGIS and provides a framework for optimization of building energy systems for districts. It uses simplified dynamic models for demand forecasting, simulation of conversion, distribution and storage technologies and enables evaluation of the energy, cost and financial benefits of multiple design scenarios. A linkage of CEA to Grasshopper is also available to automate iterative simulations in CEA through parametric modeling in Grasshopper [25]. The SimStadt urban energy simulation platform [26] is based on the CityGML file format and can calculate monthly heating demand for buildings using International Organization for Standardization (ISO)/European Committee for Standardization (CEN) standards. It can also analyze photovoltaic (PV) potential and renewable energy supply scenarios for low-carbon city districts. CEA and SimStadt utilize simplified reduced-order calculation methods and can be used for early design stages to evaluate several options quickly [27]. umi [28] is an urban modeling design tool based on the Rhinoceros 3D Computer Aided Design (CAD) platform for evaluating operational energy, daylighting and walkability for neighborhoods. It utilizes the EnergyPlus™ [29] and Radiance [30] simulation engines as well as Grasshopper and Python scripts for running analyses. District Zero [31] has a web-based graphical user interface that connects to a Geographic Information Systems (GIS) server. It enables creation of detailed EnergyPlus models and can perform district/cluster optimization and multi-criteria decision analysis.

1.3. Challenges in Urban Energy Modeling

GIS file formats, such as CityGML and GeoJSON, are open standards and commonly used to store building information at an urban scale [22,23]. Several UBEM tools directly integrate with GIS platforms, leveraging the building information that is assigned to georeferenced geometry. While such an integration is often useful for simulating existing districts, integration with a 3D CAD platform is often preferred when dealing with new districts with changing geometry [21]. In particular, there is an unsatisfied need for tools supporting the creation of urban models from the wide range of geometry sources that designers typically use at different stages of the design and planning process (e.g., 2D building footprints, 3D building massing, 2D zoned floor plans, detailed 3D room volumes). Having a CAD-integrated platform capable of handling this wide range of geometry formats could not only aid in the evaluation of building performance early in the planning process but could also help ensure that findings of these early stages are carried through to the later stages of design.
In addition to geometric limitations, detailed UBEM often requires the assignment of hundreds of properties to this geometry, from thermal transmittance of various material layers to performance curves for individual heating, ventilation and air conditioning (HVAC) components. These detailed properties are almost never found within the data sets from which UBEM models are built and so, in order to create models that sufficiently represent the complexity of reality, modelers need libraries of standards with reasonable assumptions to help fill information gaps. Ideally, such libraries are organized in a manner that can be easily applied to geometry and customized based on what is known about a district.
Lastly, even if modelers are able to get a geometric representation of a district’s buildings assembled with reasonable properties assigned to it, districts involve a number of integrated systems and networks, and historically, these systems are often modeled by different simulation engines with different input files. An integrated means of sending data from one engine to another and of unifying assumptions across engines and reporting back results, is critical to modeling systems like district thermal energy networks, local electrical grids, energy storage, and centralized and distributed renewable energy generation. For this reason, energy supply models are often not represented within urban-scale energy models and the integration of urban building energy models with such district energy system models is a key area in need of development [32,33,34,35].

1.4. Dragonfly and URBANopt™ Urban Energy Modeling Toolset

To address these gaps in existing workflows, this paper introduces the combined Dragonfly and URBANopt toolset, referred to as “Dragonfly/URBANopt toolset” or “Dragonfly/URBANopt workflows” henceforth, to represent separately licensed modeling platforms that have been integrated to achieve various UBEM workflows, for bottom-up urban energy modeling of buildings and urban systems. The URBANopt codebase can be found at Available online: https://github.com/urbanopt (accessed on 28 July 2021). For this study the URBANopt CLI version 0.5.0 was used. URBANopt [36] is an open-source (Berkeley Software Distribution [BSD] 3-Clause license) simulation platform based primarily on EnergyPlus, the OpenStudio® SDK [37], and the Modelica Buildings Library [38] aimed at enabling district- and campus-scale thermal and electrical analysis. Its modules are designed to be flexible and customizable, coordinating inputs of several simulation engines to simulate and optimize subsystems within districts such as Grid-Interactive Efficient Buildings (GEBs), distributed energy resources (DERs), electrical distribution networks and district thermal energy systems. The URBANopt SDK also exposes OpenStudio data libraries based on standards that can apply detailed properties to models at an urban scale. URBANopt is not an end-user tool or user interface, but instead is an SDK that is meant to be leveraged by commercial software developers and software-as-a-service companies within their user-facing tools to enable district-scale energy modeling.
Ladybug Tools LLC is the first collaborator to build on top of the URBANopt SDK and provide a user interface for district-scale modeling using URBANopt. The Ladybug Tools software [39] consists of a core SDK for managing/translating geometry and a CAD plugin for Rhino/Grasshopper called Dragonfly. The Ladybug Tools software suite can be downloaded from Available online: https://www.food4rhino.com/en/app/ladybug-tools (accessed on 28 July 2021), and the source code can be found at Available online: https://github.com/ladybug-tools (accessed on 28 July 2021). For this study the Ladybug Tools software version 1.2.0 was used. All Ladybug Tools core libraries and the user interface of the Dragonfly plugin are open source and available for use by other software developers under an Affero General Public License (AGPL). The Dragonfly plugin includes several features that support the creation and editing of urban models, their export to core URBANopt file formats, and the execution of the URBANopt command-line interface (CLI). The Ladybug Tools platform thus connects the Rhino/Grasshopper 3D CAD platform and the URBANopt SDK to run district-scale simulations. In the process of developing the Dragonfly plugin, Ladybug Tools solved a number of major issues related to the export of detailed geometry from a wide range of sources into formats that conform to the rules of the underlying simulation engines. The core geometry libraries that Ladybug Tools has written for this purpose enable the creation of models from several common sources (Figure 1) and support an unprecedented level of geometric detail at the urban scale.
Recognizing that collaboration between software developers, researchers and practitioners is needed to accelerate UBEM adoption and achieve larger societal impact [20], the URBANopt SDK is being developed as an open-source project with contributors from multiple National Laboratories, academia, and industry. The integration of the Ladybug Tools platform with URBANopt provides capabilities that can be leveraged by urban planners and architects and incorporated within their existing workflows. For this study, Skidmore, Owings and Merrill (SOM), a global architecture and master planning firm, served as an industry liaison to evaluate the Dragonfly/URBANopt analytical capabilities and help guide toolset capability development. This paper documents how SOM piloted Dragonfly/URBANopt capabilities for an urban revitalization district in Chicago to investigate key technical questions related to district-scale energy approaches and opportunities. This was done with the objective of exploring the benefits and synergies of these new capabilities with SOM’s existing design processes and assessing their effectiveness in urban-scale design. A collaborative and iterative piloting process was adopted to provide feedback and guide further development of capabilities to enhance the applicability and performance of the tool.
In summary, the overall objectives of this paper are to (1) introduce the combined Dragonfly/URBANopt workflows and capabilities, which are composed of open-source software and available to the broader UBEM community; (2) demonstrate how SOM utilized these capabilities to investigate key district-scale technical questions for the Chicago pilot district; and (3) describe how new capabilities can be integrated into typical architecture and master planning processes to ultimately make better-informed design decisions. The remainder of this paper is organized as follows: Section 2.1 describes the URBANopt and Ladybug Tools software integration approach. Section 2.2 describes the details of the Chicago pilot case study, including the definition of baseline, high-efficiency, and district-scale systems scenarios. Section 3 presents and discusses the results of applying the integrated software to the Chicago pilot case study. Finally, conclusions are presented in Section 4. The benefits of a district-scale design/simulation approach are documented and results from the analysis are used to inform design and aid decision making for the project.

2. Materials and Methods

2.1. URBANopt and Ladybug Tools Software Integration Approach

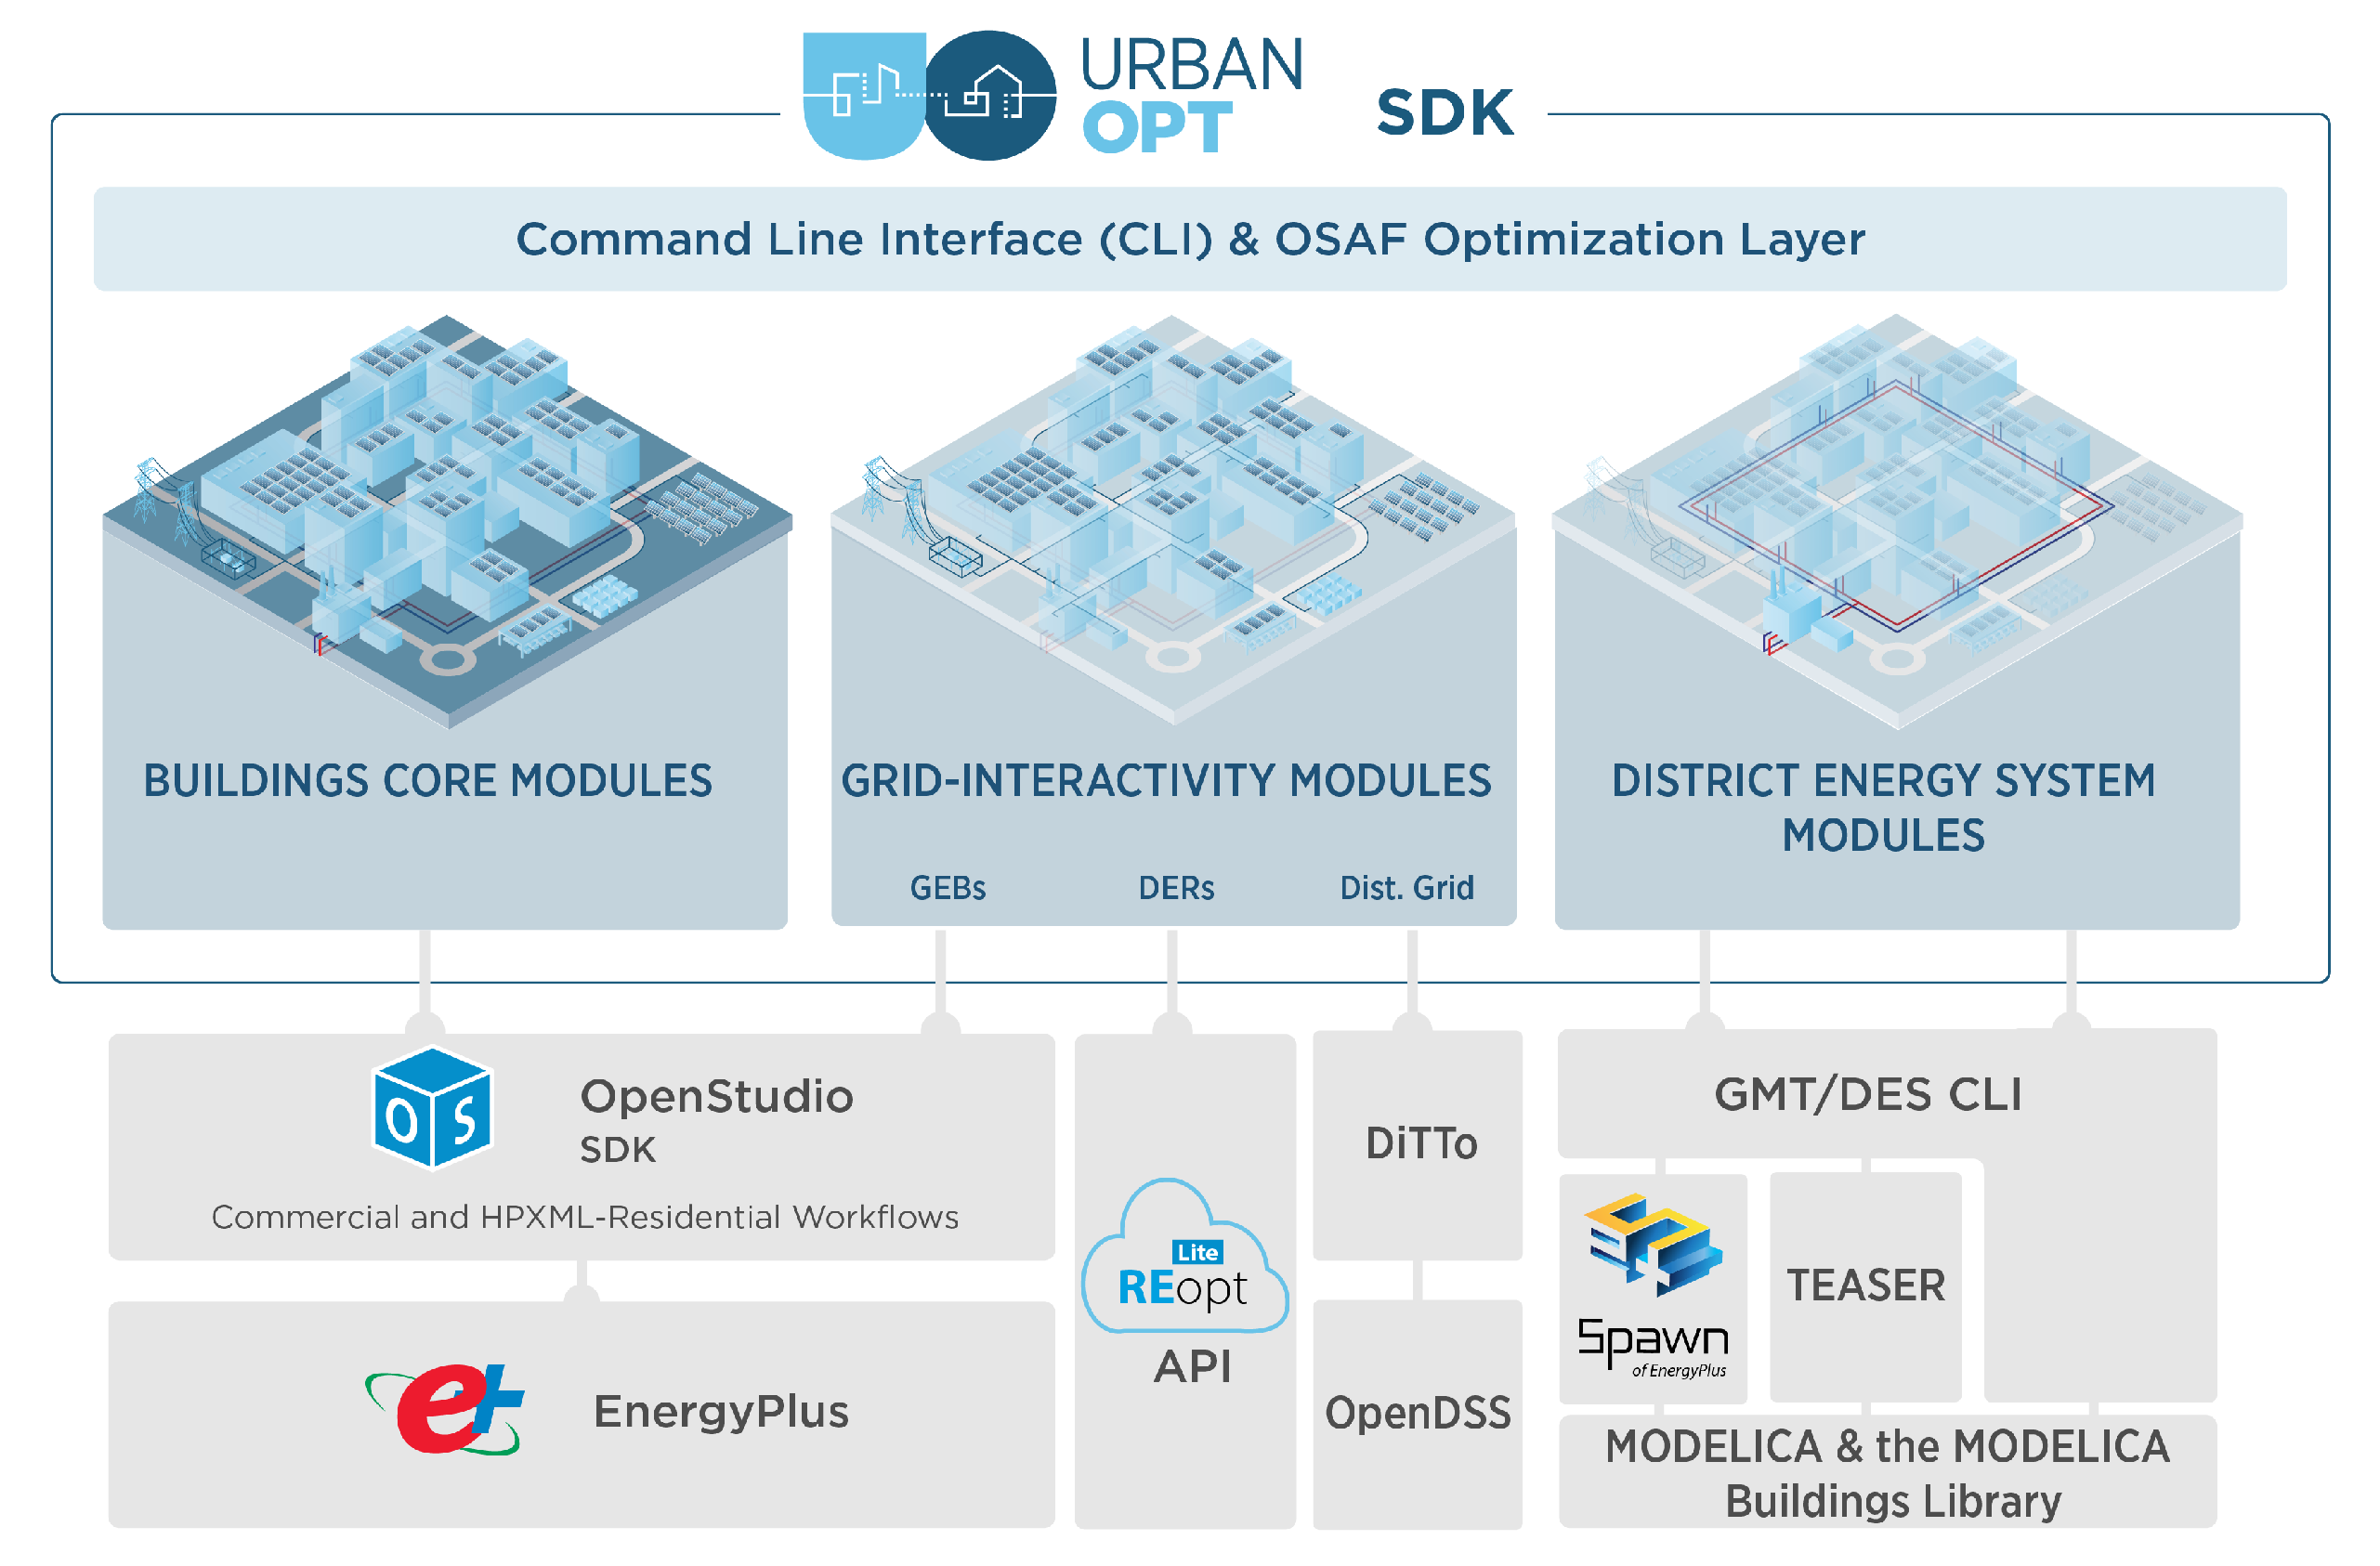
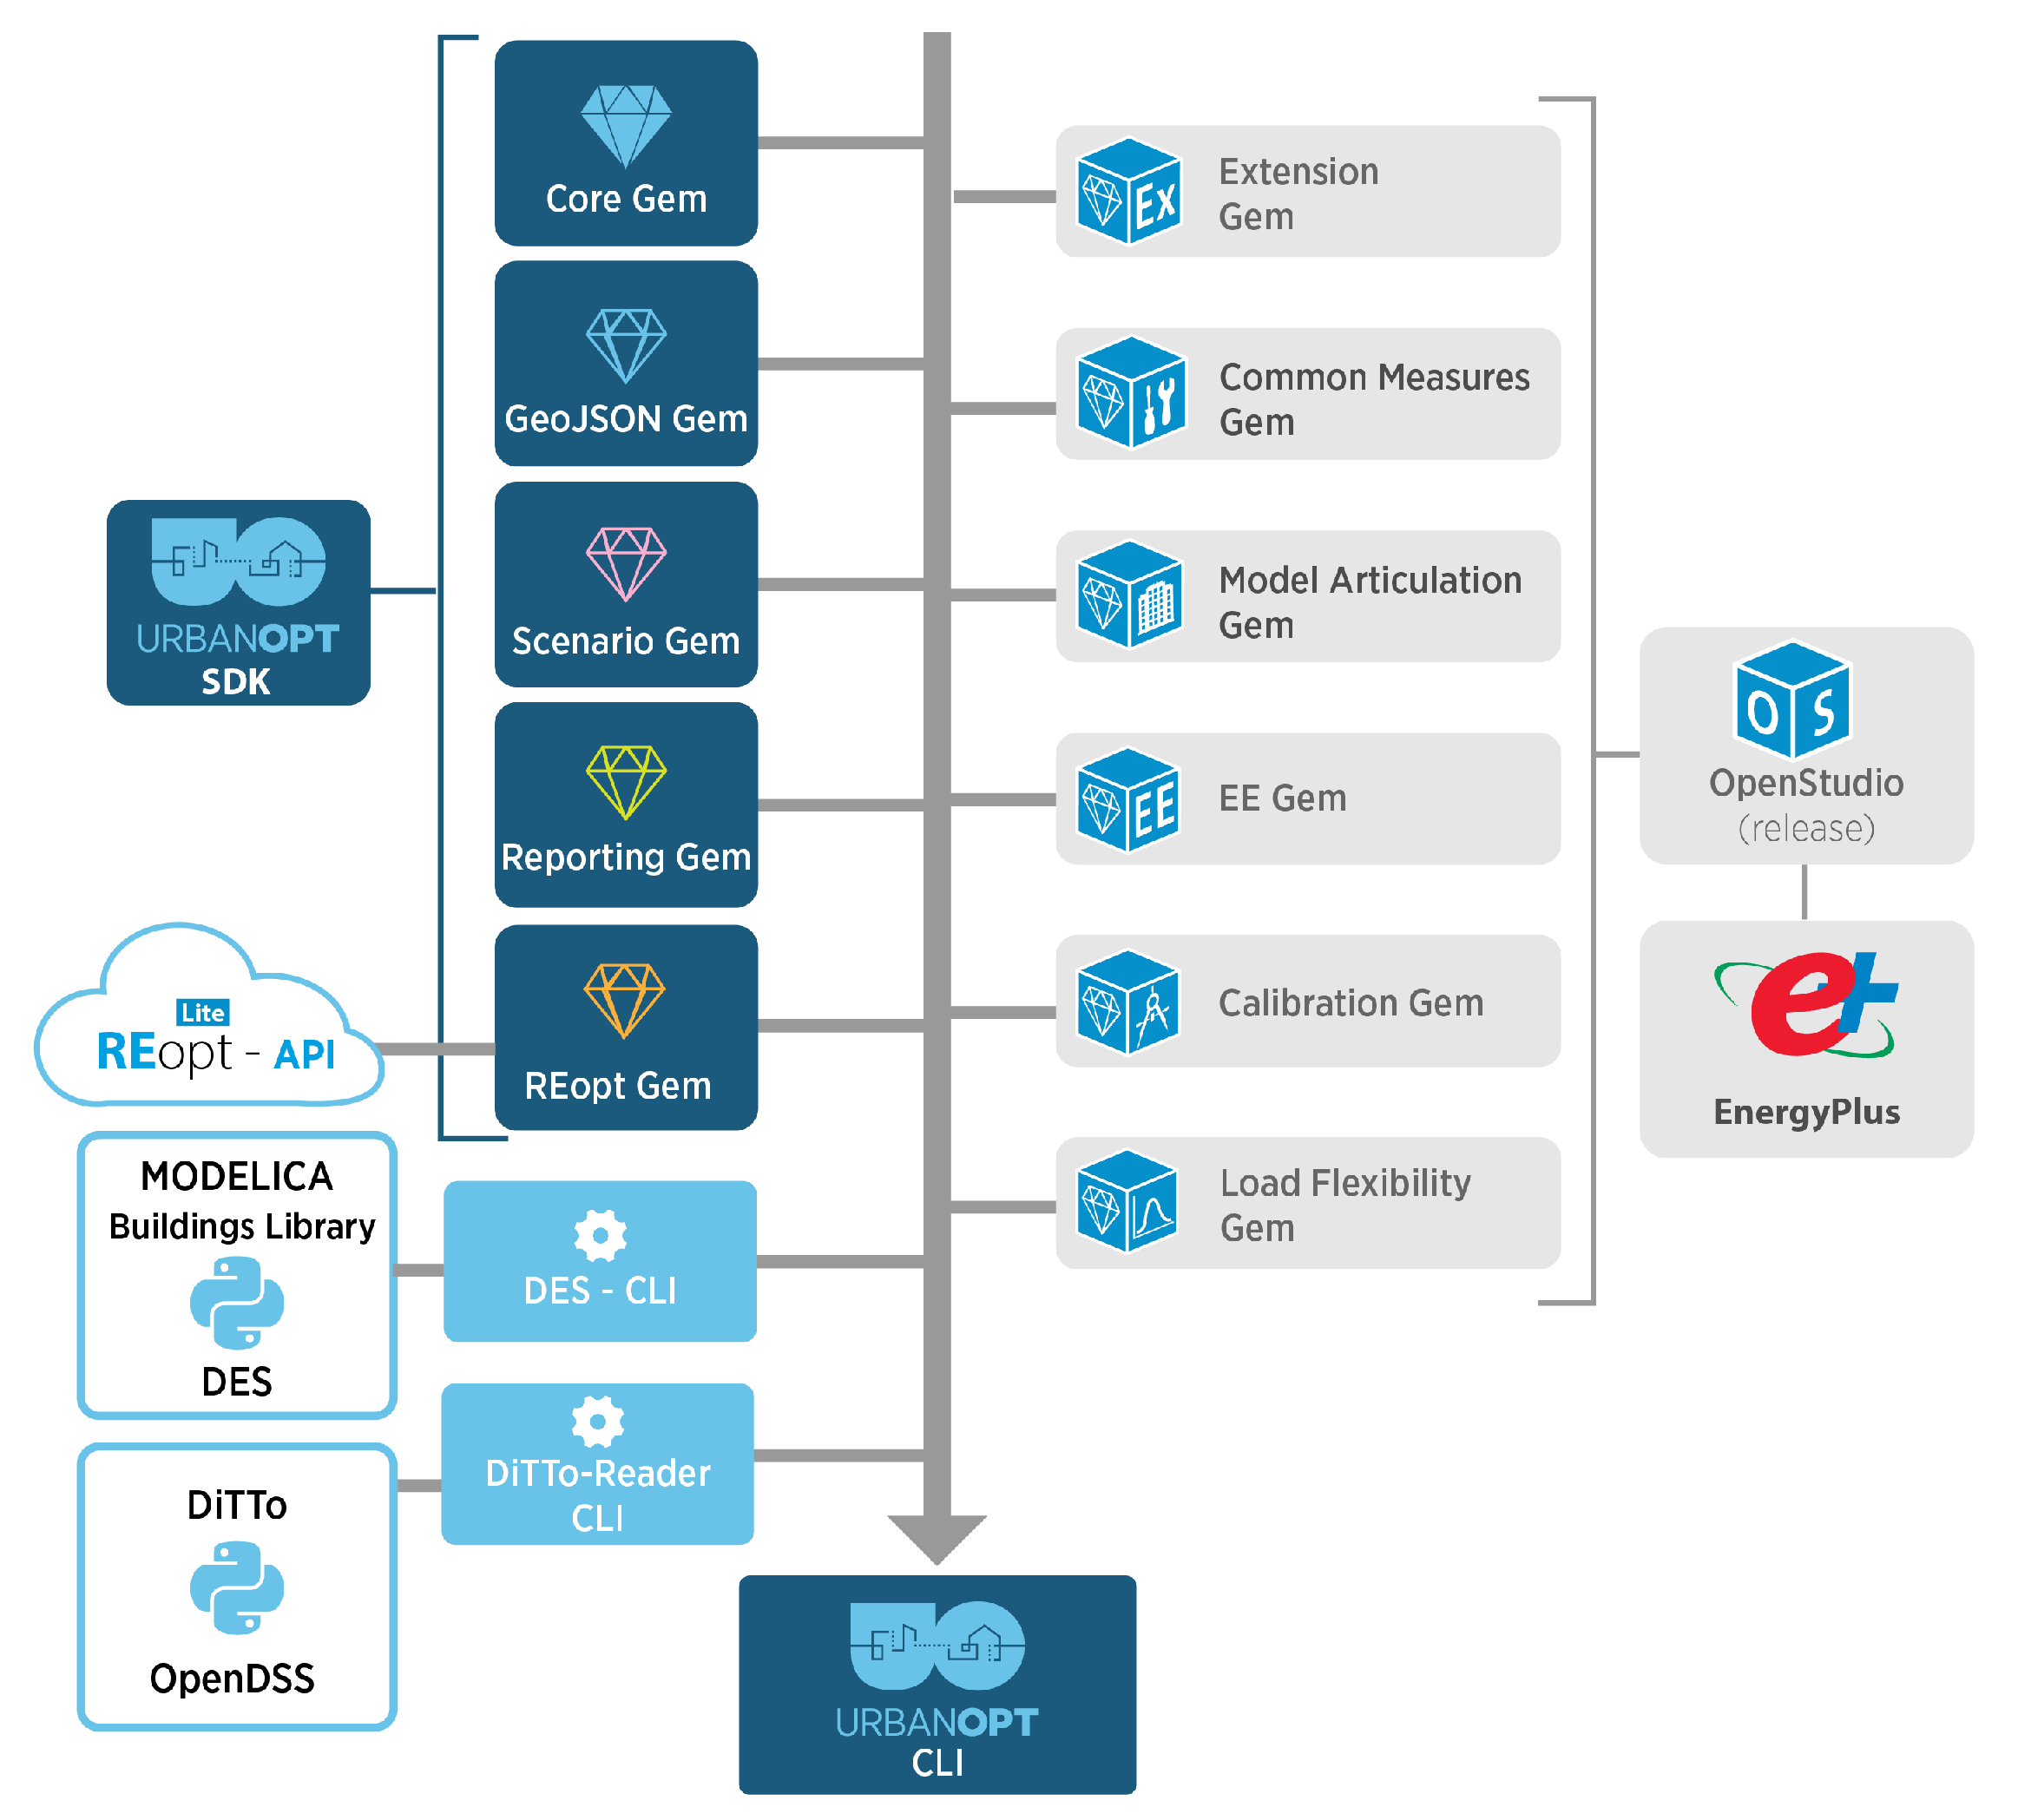
2.1.1. Overview of the URBANopt SDK

The URBANopt SDK is designed to be flexible, modular and highly customizable. It consists of several open-source modules that are linked together to support creating and running workflows for district-scale simulations. The URBANopt SDK aims to address three primary use cases: (1) the design of high-performance campuses and districts through a multi-building scenario analysis approach, (2) the design and optimization of GEBs in conjunction with DERs and electric distribution systems at a district scale, and (3) the design of district thermal energy systems [40]. To support these primary use cases, the URBANopt modules are divided into Building Core Modules [36], Grid Interactivity Modules and District Energy System Modules. As shown in Figure 2, the modules map user inputs to various simulation engines, tools and libraries such as OpenStudio, EnergyPlus, Open Distribution System Simulator (OpenDSS) [41], the Renewable Energy Integration and Optimization (REopt™) Lite tool [42] and the Modelica Building Library to analyze components of a district or community.
To make use of their modularity and encourage collaboration, the URBANopt modules have clearly defined inputs and outputs. They are written in a variety of software languages to support different tools and simulation engines, and interoperability is ensured by storing information in language-agnostic and human-readable file formats such as JSON, GeoJSON and CSV. A CLI was created to facilitate module usage and to provide access to the URBANopt SDK from different platforms. The URBANopt CLI has commands to create, run, post-process, and visualize simulations, as well as integrate the tools listed above for more advanced workflows.
Some common terms used in URBANopt are defined to maintain consistency across URBANopt modules [40]:
Feature: Refers to a single object such as a building, district system or transformer used in a district-scale analysis. Each Feature has geometry associated with it (e.g., 2D GeoJSON footprint) and may contain additional properties specific to the Feature (e.g., Floor Area and Number of Stories to describe a building Feature).
FeatureFile: The FeatureFile includes all the data related to Features and can be written using a third-party application or user interface. The current FeatureFile format supported by URBANopt is the GeoJSON file format.
Simulation Mapper: A Simulation Mapper is a Ruby class that translates information regarding a Feature from the FeatureFile and maps it onto inputs used by simulation engines. It can enable and disable measures that can be applied to Features as well as modify measure arguments.
Scenario: Represents a potential realization of the project to evaluate the impact of certain conditions, technologies or enhancements on the project. Each scenario includes a Scenario CSV file that assigns Simulation Mappers for that Scenario to Features from the FeatureFile. Examples of scenarios in the URBANopt Project are a baseline scenario that simulates the district as is and a high-efficiency scenario that evaluates the impact of energy efficiency measures on the district.
Project: An URBANopt project folder includes one or more FeatureFiles and Simulation Mappers and can be used to analyze various Scenarios for a given site or for multiple sites. Within the URBANopt project, simulation results are gathered at the Feature and Scenario level. Multiple Scenarios can also be compared against each other to gain more insights.
Building Core Modules: These modules organize geospatial information for buildings and district-scale energy systems, manage and run scenario analyses, and aggregate simulation results. They achieve this by coordinating the application of user-specified OpenStudio Measures across urban models. OpenStudio Measures [43] are Ruby scripts that leverage the OpenStudio SDK to perform a wide variety of functions related to energy modeling. Typical examples include the creation of energy models from different input file formats, the assignment of programs or HVAC logic across the spaces/zones of a model, the application of energy conservation strategies, and the translation of simulation results into formats that are consumable by other interfaces. These measures are packaged as Ruby Gems to ensure ease of reusability. Notably, the Standards Gem [44] can be leveraged by these measures to assign properties to models following the ASHRAE 90.1 standard, the Database for Energy Efficient Resources and/or the DOE commercial reference buildings. The Standards Gem organizes the properties associated with these codes into reusable objects like construction sets, which contain the logic by which different building envelope elements are assigned constructions, and space types, which contain all loads and schedules defining the usage of a space. It also supports many customization options including hours of operation and HVAC system type selection. Such reusable objects and customization options make it particularly straightforward to build large urban models using reasonable assumptions derived from standards and then adjust these assumptions as needed. Both the National Renewable Energy Laboratory and the wider community of OpenStudio users have publicly shared more than a thousand measures for various energy modeling operations through the Building Component Library [45].
URBANopt-specific OpenStudio Measures were also created to perform functions within the URBANopt SDK, such as coordinating and running simulations across a district. These measures are packaged within the URBANopt Gems. The OpenStudio and URBANopt Gems are represented in Figure 3. The Building Core Modules consist of the Core Gem, GeoJSON Gem, Scenario Gem and the Reporting Gem [36]. They form the spine of the URBANopt SDK, and all other modules interact with them during an URBANopt project run.
The Core Gem houses the Feature and FeatureFile class definitions. The GeoJSON and Scenario Gem inherit these class definitions from the Core Gem. The GeoJSON Gem includes schemas for the FeatureFile and Features, providing a common framework for organizing information within these files. It has measures to validate FeatureFiles and thereby establishes a standard set of Feature property names, which are used as input arguments for the various measures included in the URBANopt simulation. The Scenario Gem measures run simulations and aggregate results. The Reporting Gem includes measures to support the creation of reports that include the aggregated simulation results such as the total energy consumed for the simulation period, the breakdown of energy by end use, parameters such as building floor and roof area, and aggregate timeseries data.
Grid Interactivity Modules: These modules enable modeling and optimizing design of GEBs along with DERs, electrical distribution systems, and electric vehicles (EVs). They can be used to calculate the optimal sizing and dispatch of PV and electric batteries at a community scale using REopt Lite, to design/verify electric distribution system power flow performance using OpenDSS, and to evaluate the impact of EV charging on building and district load profiles.
The Grid Interactivity Modules include the URBANopt REopt Gem that connects URBANopt to the REopt Lite application programming interface (API) and the URBANopt DiTTo Reader Gem that connects URBANopt to the OpenDSS simulation engine. The ability to model EV charging is added using a measure to add EV loads in the OpenStudio Common Measures gem.
DER design and optimization: REopt Lite is a techno-economic decision-making tool for cost-optimal design of DERs such as PV, battery storage, wind and generator technologies. Formulated as a mixed-integer linear program, it provides optimal sizing of DERs, the associated hourly annual dispatch of selected technologies, and key economic metrics of the system. The URBANopt REopt Gem parses inputs required by the REopt Lite API from the URBANopt simulation results such as the electric load profiles and available roof area of Building Features. The REopt Lite optimization results include electricity produced by PV, wind or a generator, electricity charged/discharged for batteries, as well as economic parameters such as the life cycle costs and net present value of the optimized systems. Additionally, assessment of district resilience to electrical grid outages may be evaluated through the resilience endpoints of the REopt Lite API, showing hours that certain features may self-power during a grid outage.
Electrical network design and optimization: OpenDSS is an open-source tool for simulating quasi-steady state powerflow in electrical distribution systems, and modeling components of the electrical infrastructure such as power lines, electrical nodes, loads, transformers, and PV systems, among others. The URBANopt GeoJSON FeatureFile is used as the model data file for electrical network simulations using OpenDSS. It represents the district’s electrical distribution system by storing the layout of electrical wires, junctions, transformers, capacitors and substations. Equipment identifiers describing additional information such as the type of transformer or wire are also added. These identifiers are referenced from an electrical database JSON file, which specifies detailed electrical characteristics of every component in the network such as the wire resistance, phase, diameter and other characteristics that are required by OpenDSS.
The Distribution Transformation Tool (DiTTo) [46] is an open-source conversion tool written in Python to simplify converting data to and from electrical distribution tools such as OpenDSS. It contains a reader module that parses and extracts network information from the GeoJSON model data file and a writer module that takes the network information and writes it in a format that can be simulated by the electrical modeling tool, in this case OpenDSS.
Simulations using URBANopt/OpenDSS can be used to evaluate different district design scenarios, determining the electrical infrastructure performance in each case. URBANopt reporting focuses on key metrics such as transformer overloads, line overloads, and over- and under-voltages. The URBANopt DiTTo Reader Gem contains the DiTTo Reader module, the model data file and a DiTTo CLI.
The OpenDSS simulation is run after simulating and post-processing results for the Building Features and DERs, if present. The total electricity consumption timeseries results from the URBANopt Feature reports are read into the DiTTo reader to provide loads for the electric network. When DERs are present the timeseries power generation load values are also supplied to OpenDSS. The DiTTo CLI calls the DiTTo modules to convert data from the URBANopt GeoJSON FeatureFile to OpenDSS file formats, supply the timeseries results from the URBANopt simulations and run an OpenDSS simulation.
Electric vehicles load modeling: The Add EV Loads measure uses static load profiles for power draw and represents different EV charging behaviour scenarios [47]. These profiles are generated as part of study by Wood et al. [48], leveraging output from the EVI-Pro Tool. They are generated for residential, public and workplace charging stations. The number of EVs is assumed to be the same as the occupancy of the building, and the magnitude of load due to the EVs on site can be adjusted.
District Energy System Modules: These modules can be used for designing district thermal systems for heating and cooling of multiple buildings. The thermal network type, district plant efficiency and building energy efficiency can also be customized within these models. Currently, these capabilities reside in the URBANopt SDK and their integration with the Ladybug Tools platform is part of ongoing development work, and thus are not a focus of the current study.
Module Integration: While URBANopt provides the analytics and underlying capabilities to run district-scale simulations, as mentioned earlier, it is an SDK and not an end-user facing tool. These URBANopt modules are designed to be integrated with a wide range of end-user tools by means of its CLI and language-agnostic file schemas. For this study, we demonstrate the integration of the URBANopt SDK with Ladybug Tools through the Dragonfly plugin, described further in the following section, which provides an interface for the 3D Grasshopper CAD platform.

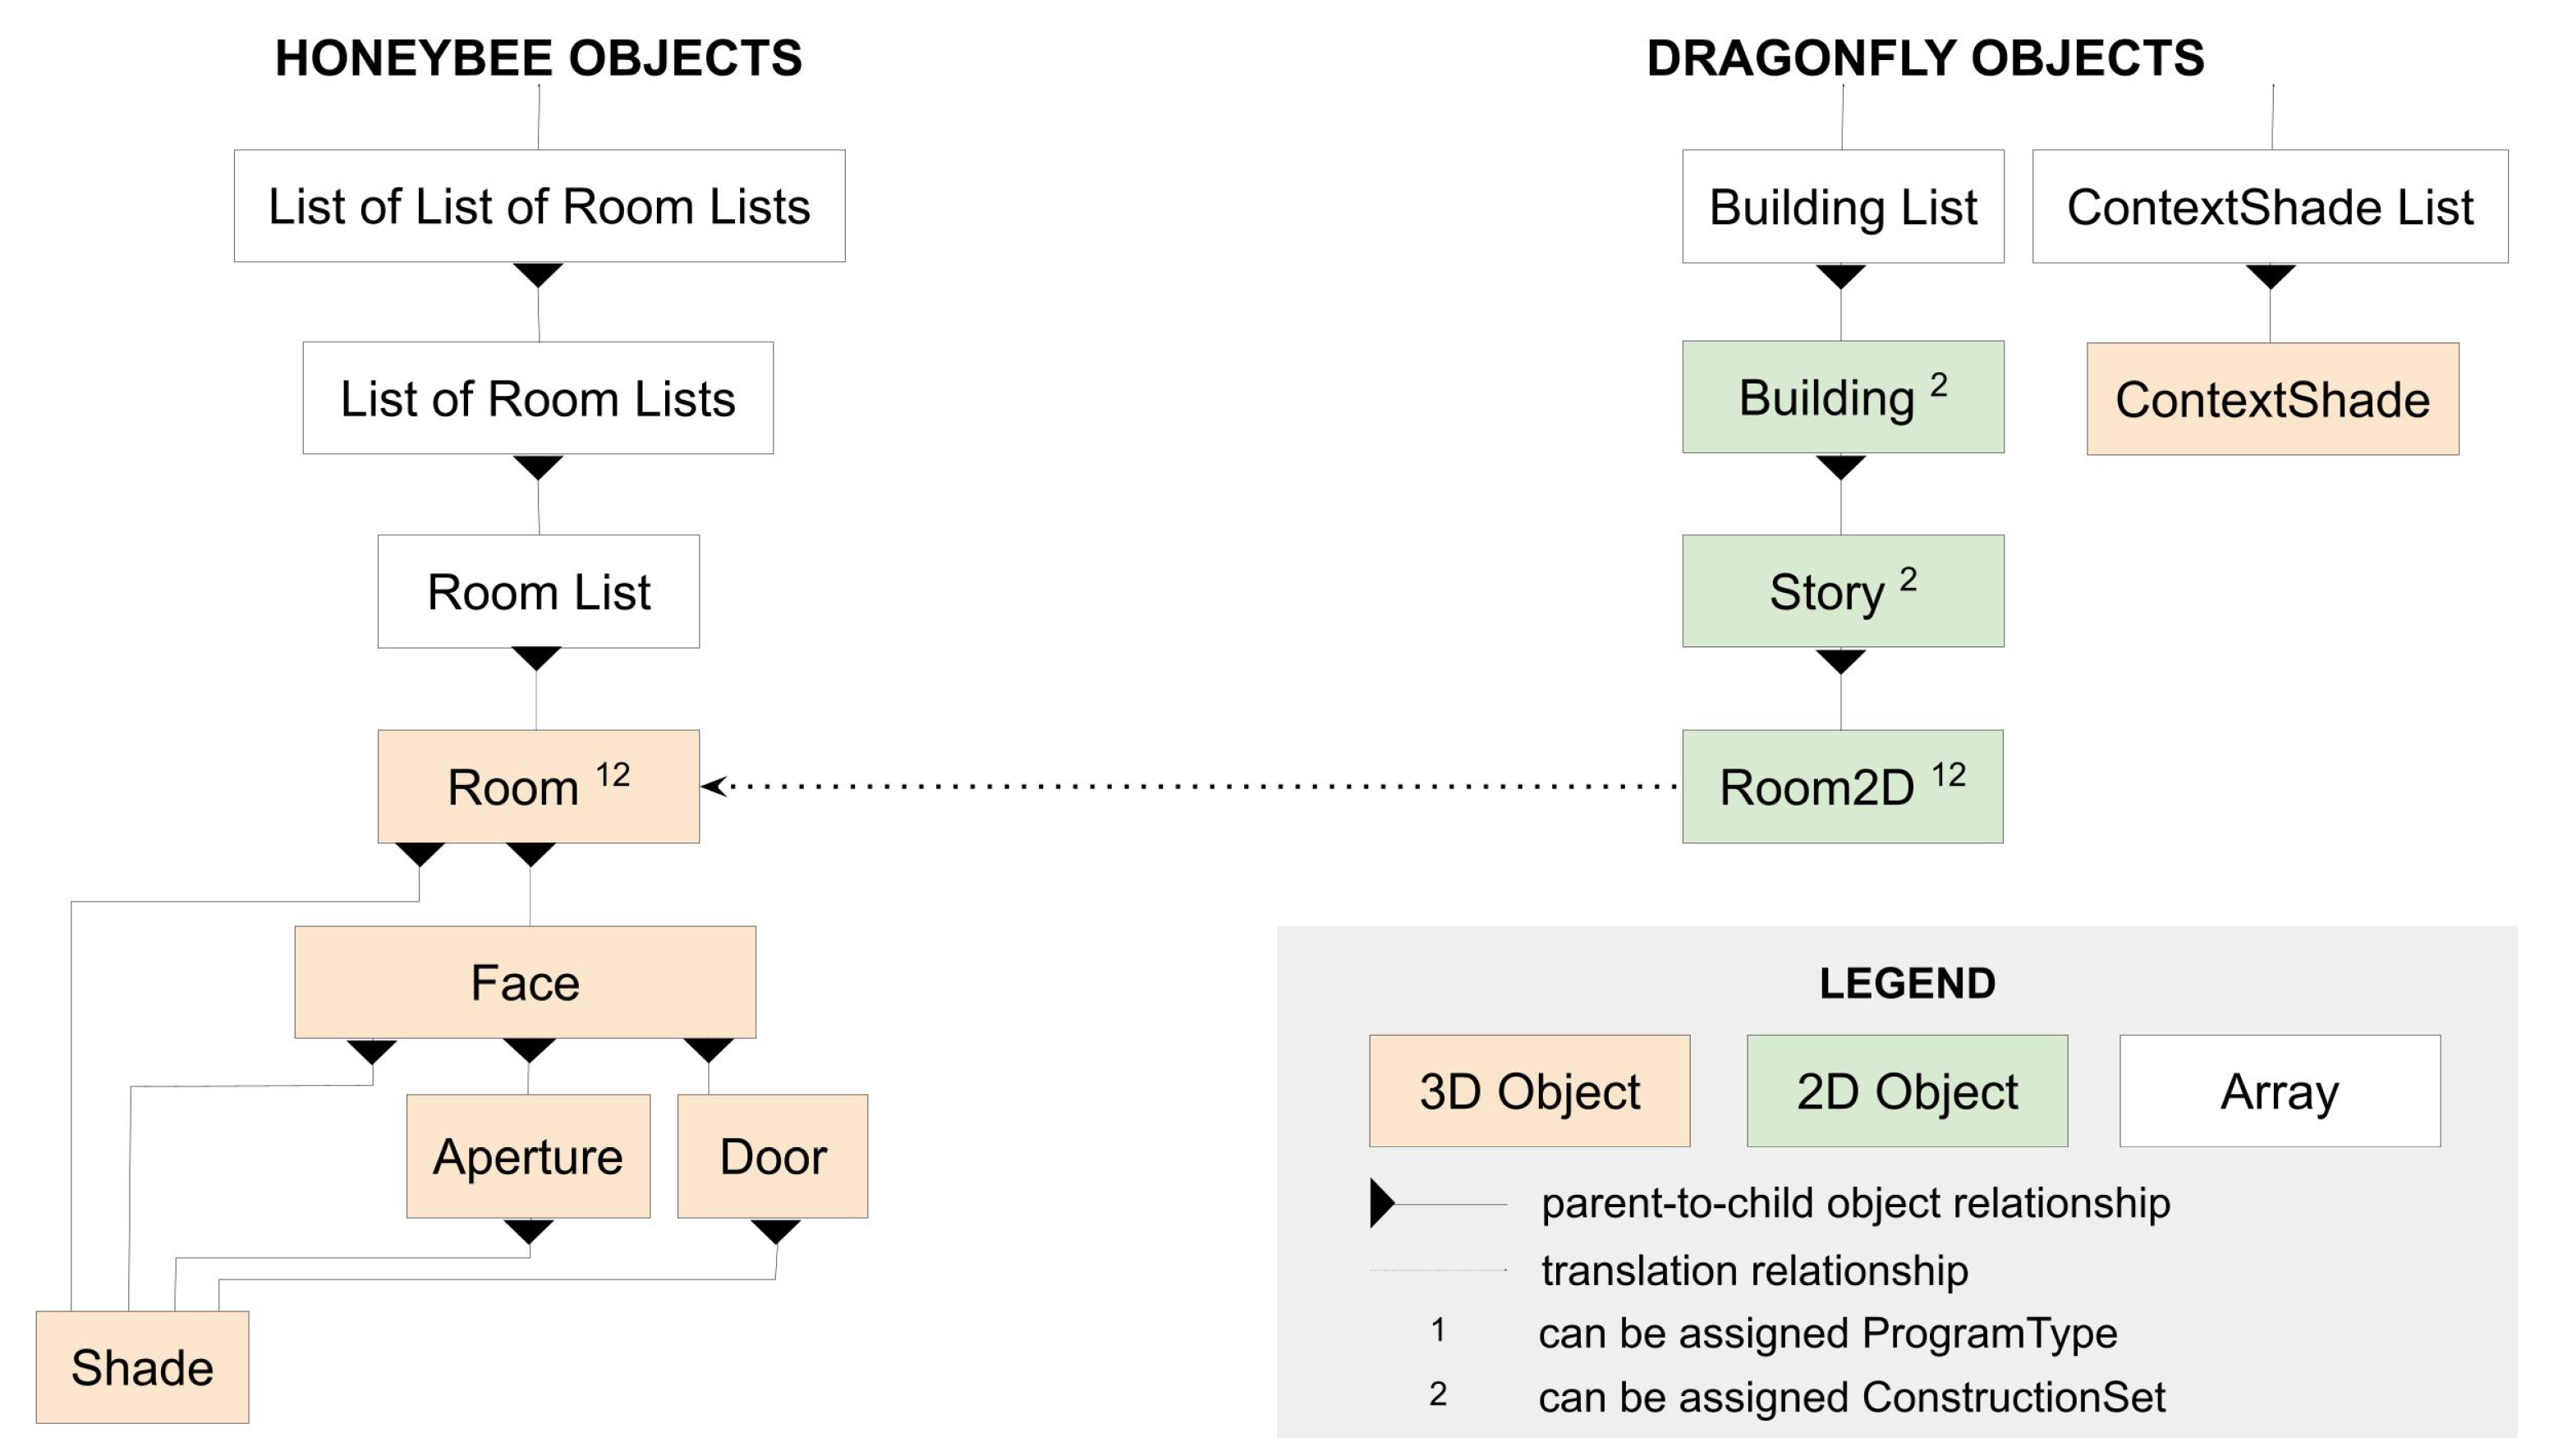
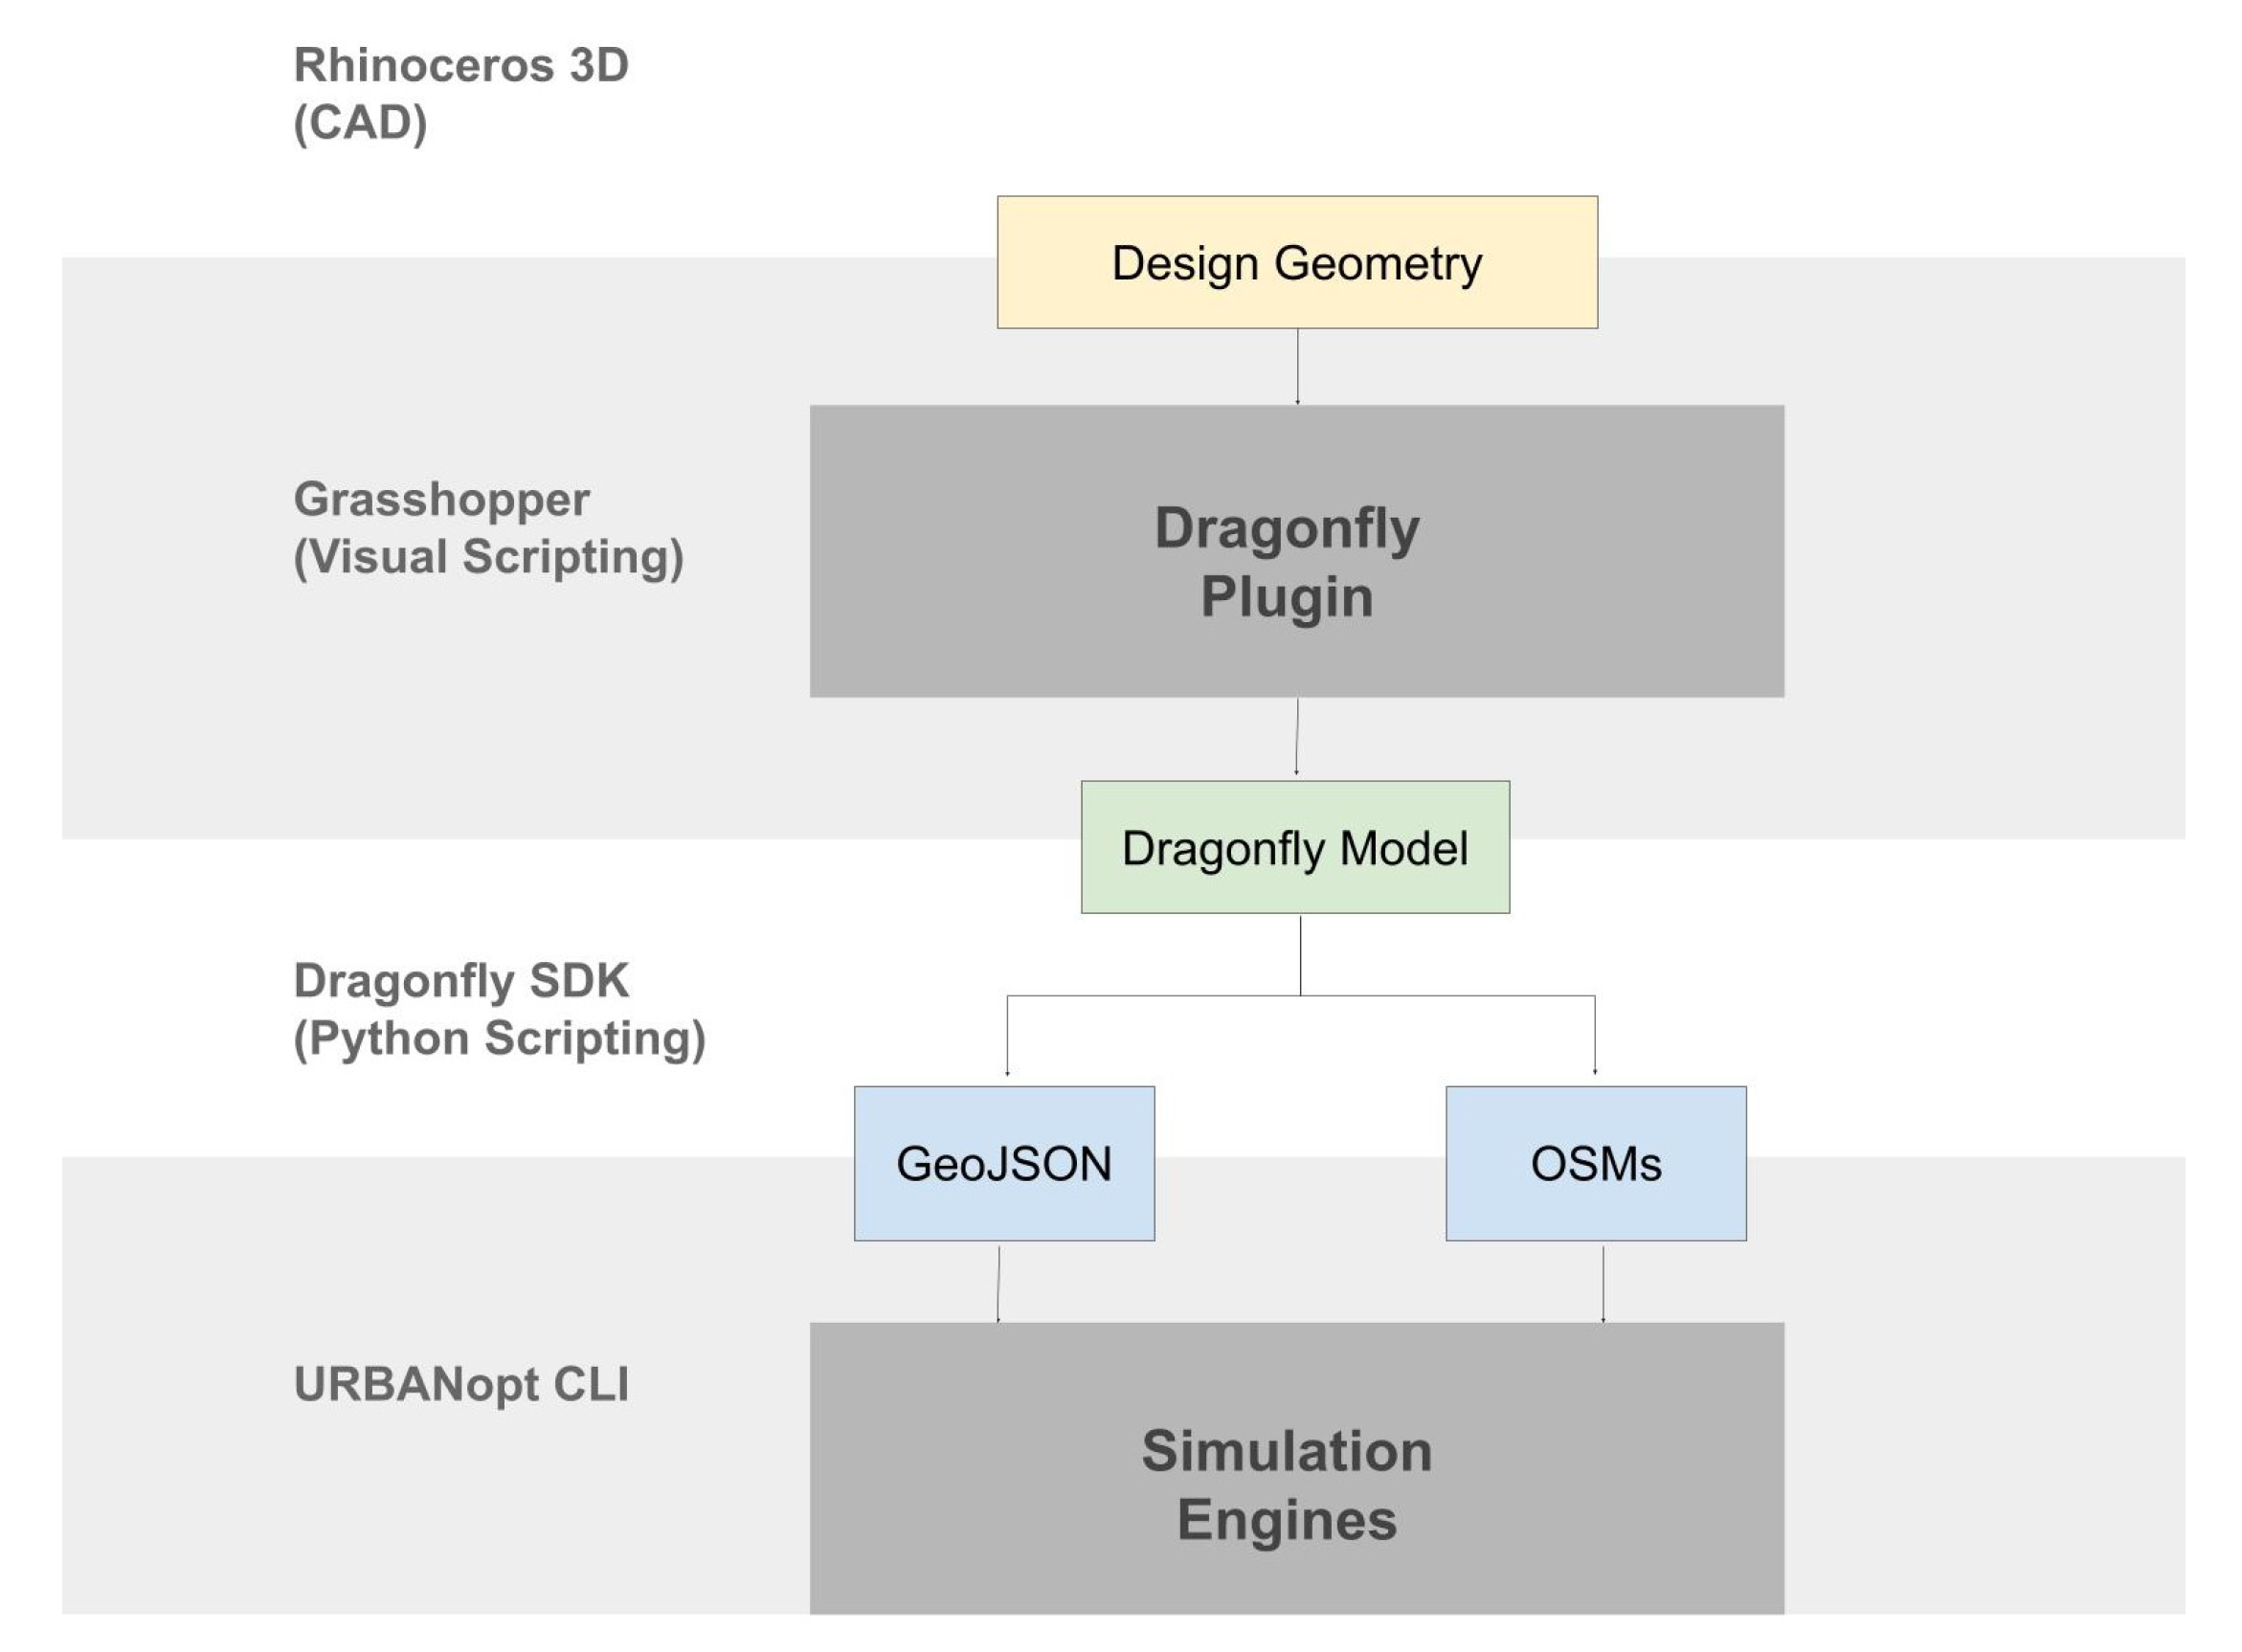
2.1.2. Dragonfly Plugin Overview

Dragonfly and Honeybee File Schemas: While the engine that URBANopt ultimately uses to assess building energy demand (EnergyPlus) requires a 3D representation of building geometry, creating, editing and saving large urban models in this format presents several challenges. Aside from the fact that such 3D representations can consume a lot of memory during the editing process, the geometry math of common model-building operations like automatically setting adjacent interior surfaces is much more complex and error-prone in 3D than in 2D. Accordingly, the Dragonfly Model schema was developed, which is an abstracted means of describing building geometry, where all rooms are assumed to be extrusions of 2D floor plates. Such 2D rooms represent the finest level of detail supported by the Dragonfly schema and all objects smaller than individual rooms like windows and shades are represented through simple sets of instructions for generating such objects (e.g., defining windows by their ratio and height). This makes it much easier to create simulation-ready models from various geometry sources (footprints, building massing, etc.). It also streamlines common urban-scale geometry operations, like generating core/perimeter zones from a single floor plate or specifying repeated stories over the height of a building. The Dragonfly Model schema (DFJSON) has a direct relationship with the 3D Honeybee Model schema (HBJSON) and each Dragonfly Model is translated into one or more Honeybee Models before it is consumed by the URBANopt CLI and, ultimately, EnergyPlus (Figure 4).
Ladybug Tools Core Libraries: The Ladybug Tools core Python libraries are used to translate Dragonfly models into the 2D GeoJSON format used by URBANopt, which is linked to a series of 3D HBJSON files for each Dragonfly Building. Then, when the URBANopt SDK is called to run the simulation, a Ruby measure within the Honeybee-OpenStudio Gem [49] is used to translate each HBJSON into the OpenStudio/EnergyPlus format that is ultimately used to estimate building energy use. Figure 5 illustrates how Dragonfly connects with the Rhino/Grasshopper 3D CAD platform and the URBANopt SDK.
Because each Dragonfly Building is exported to a separate EnergyPlus model for parallelized simulation, the Ladybug Tools core translation methods automatically account for surrounding buildings as context shade in each HBJSON and EnergyPlus model. The core libraries also include the option of exporting repeated floors over the building height as either fully detailed geometry or simply representing them through multipliers. The latter typically improves simulation speed a few times over when higher accuracy is not required and offers a means to perform quality assurance/quality control on results before performing production-level simulations.
Dragonfly Grasshopper Components: Grasshopper is a visual scripting interface for the Rhinoceros 3D CAD environment and typical Grasshopper workflows involve building custom scripts by connecting together the outputs and inputs of components that each contain executable code. The Dragonfly plugin for urban-scale modeling consists of more than 70 such components, each of which imports the Ladybug Tools core libraries and leverages them to convert raw geometry in the CAD environment into fully simulatable models with energy properties assigned to it. In addition to components that enable the three common model-building workflows in Figure 1, there are approximately 100 other components for creating custom energy simulation properties, which can be assigned to Dragonfly models using the 70 Dragonfly components.

2.1.3. Dragonfly Visualization and Analysis of URBANopt Results

Most of the data coming out of the URBANopt SDK and its associated engines is either spatial (typically relating to individual building geometries) or temporal (usually timeseries data in hourly, daily or monthly intervals). As a scripting interface that parses logic in a similar manner to traditional computing languages, Grasshopper is more flexible and customizable than several other common data processing interfaces (e.g., spreadsheets or menued user interfaces). Accordingly, the Dragonfly interface aims to augment these native Grasshopper capabilities by loading the various URBANopt result files into Grasshopper formats and offering generic spatial and temporal visualizations that could display any type of imported data. For spatial data, specialized components were added to color simulation geometry (Figure 6). In the case of spatial data that has a temporal dimension, the components allow for scrolling on a timestep basis or aggregating/averaging over a specific period.
For temporal data, visualizations were added to display data on hourly/subhourly charts or a monthly chart, both of which are widely used in energy modeling practice (Figure 7).
It is important to highlight that any of the hundreds of possible outputs from URBANopt’s simulation engines can be displayed with these reusable visualization components, along with any processed versions of this data created in the Grasshopper scripting interface. Furthermore, all visualization components come equipped with the ability to customize legends, including legend minimum, maximum, number of subdivisions, colors, text labels, and more. In this manner, users can customize visualizations to answer the specific research and design questions they are currently exploring and they are not constrained to running only a handful of study types.

2.2. Case Study Approach

2.2.1. Site Description

The pilot district is located in Chicago, Illinois and includes 8.2 million square feet of mixed use, high density development. As part of a large urban redevelopment initiative, the project has many interested stakeholders, which make the district a unique testbed for this investigation.
There are several high-level community design goals to be considered for this district. From a human performance perspective, these include emphasizing a connection to nature, providing plentiful outdoor and pedestrian accessible spaces with high levels of thermal comfort, and designing buildings to maintain excellent levels of indoor environmental quality including access to daylight and fresh air. In addition, one overarching goal and the focus of this study is to reduce the energy consumption of the entire district. This can be achieved by individually upgrading elements of each building’s architectural and system design and by prioritizing and specifying district-scale systems that can leverage different building use types to deliver additional energy savings.

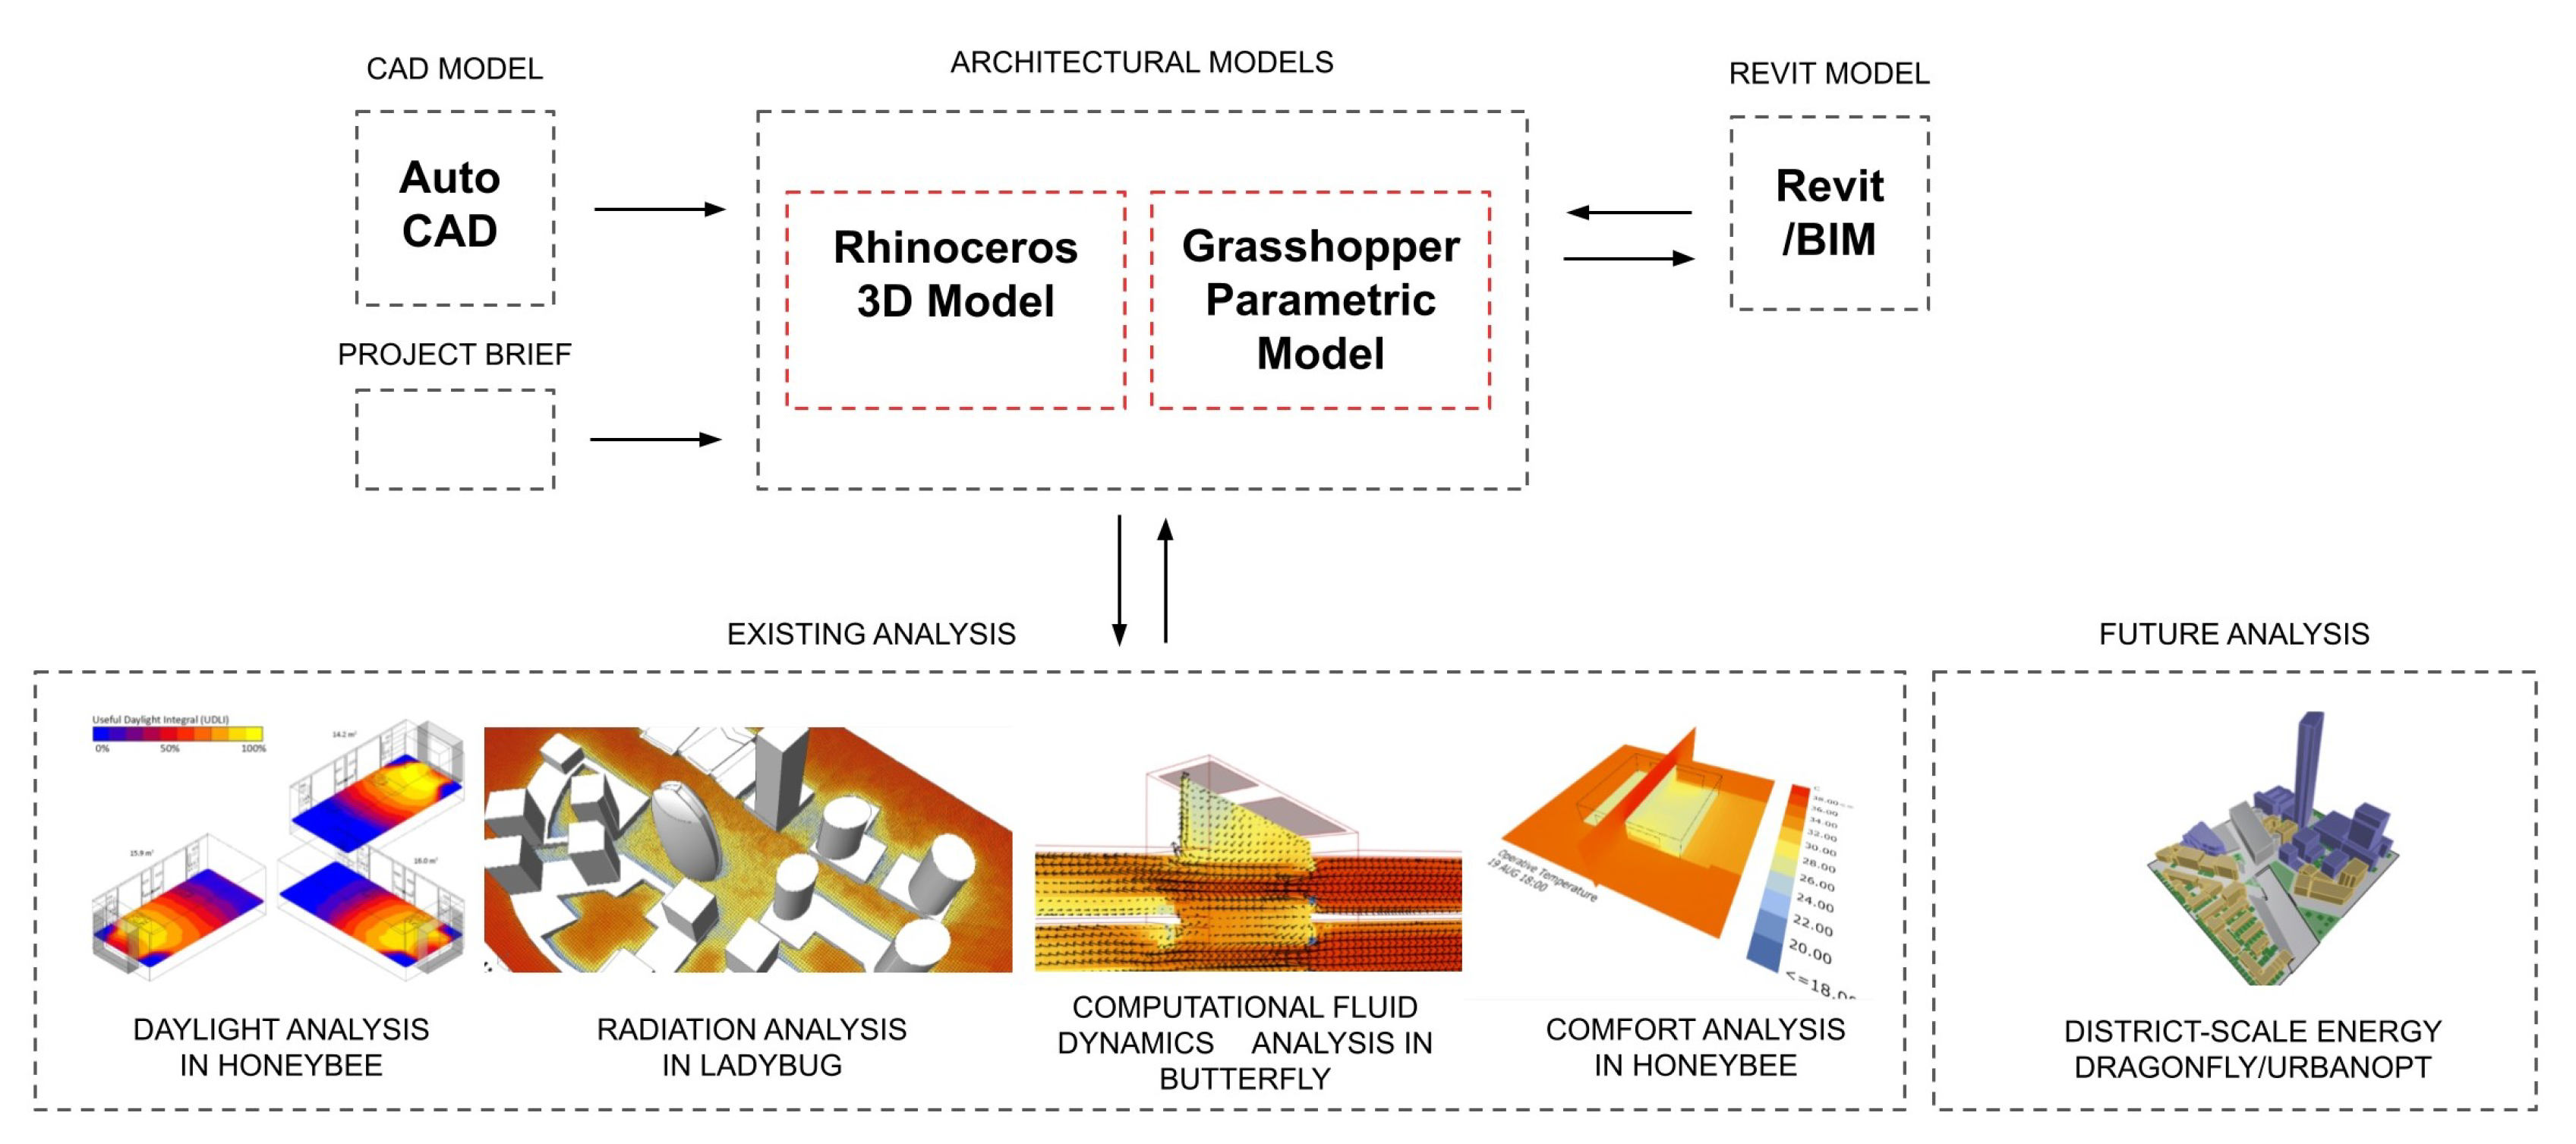
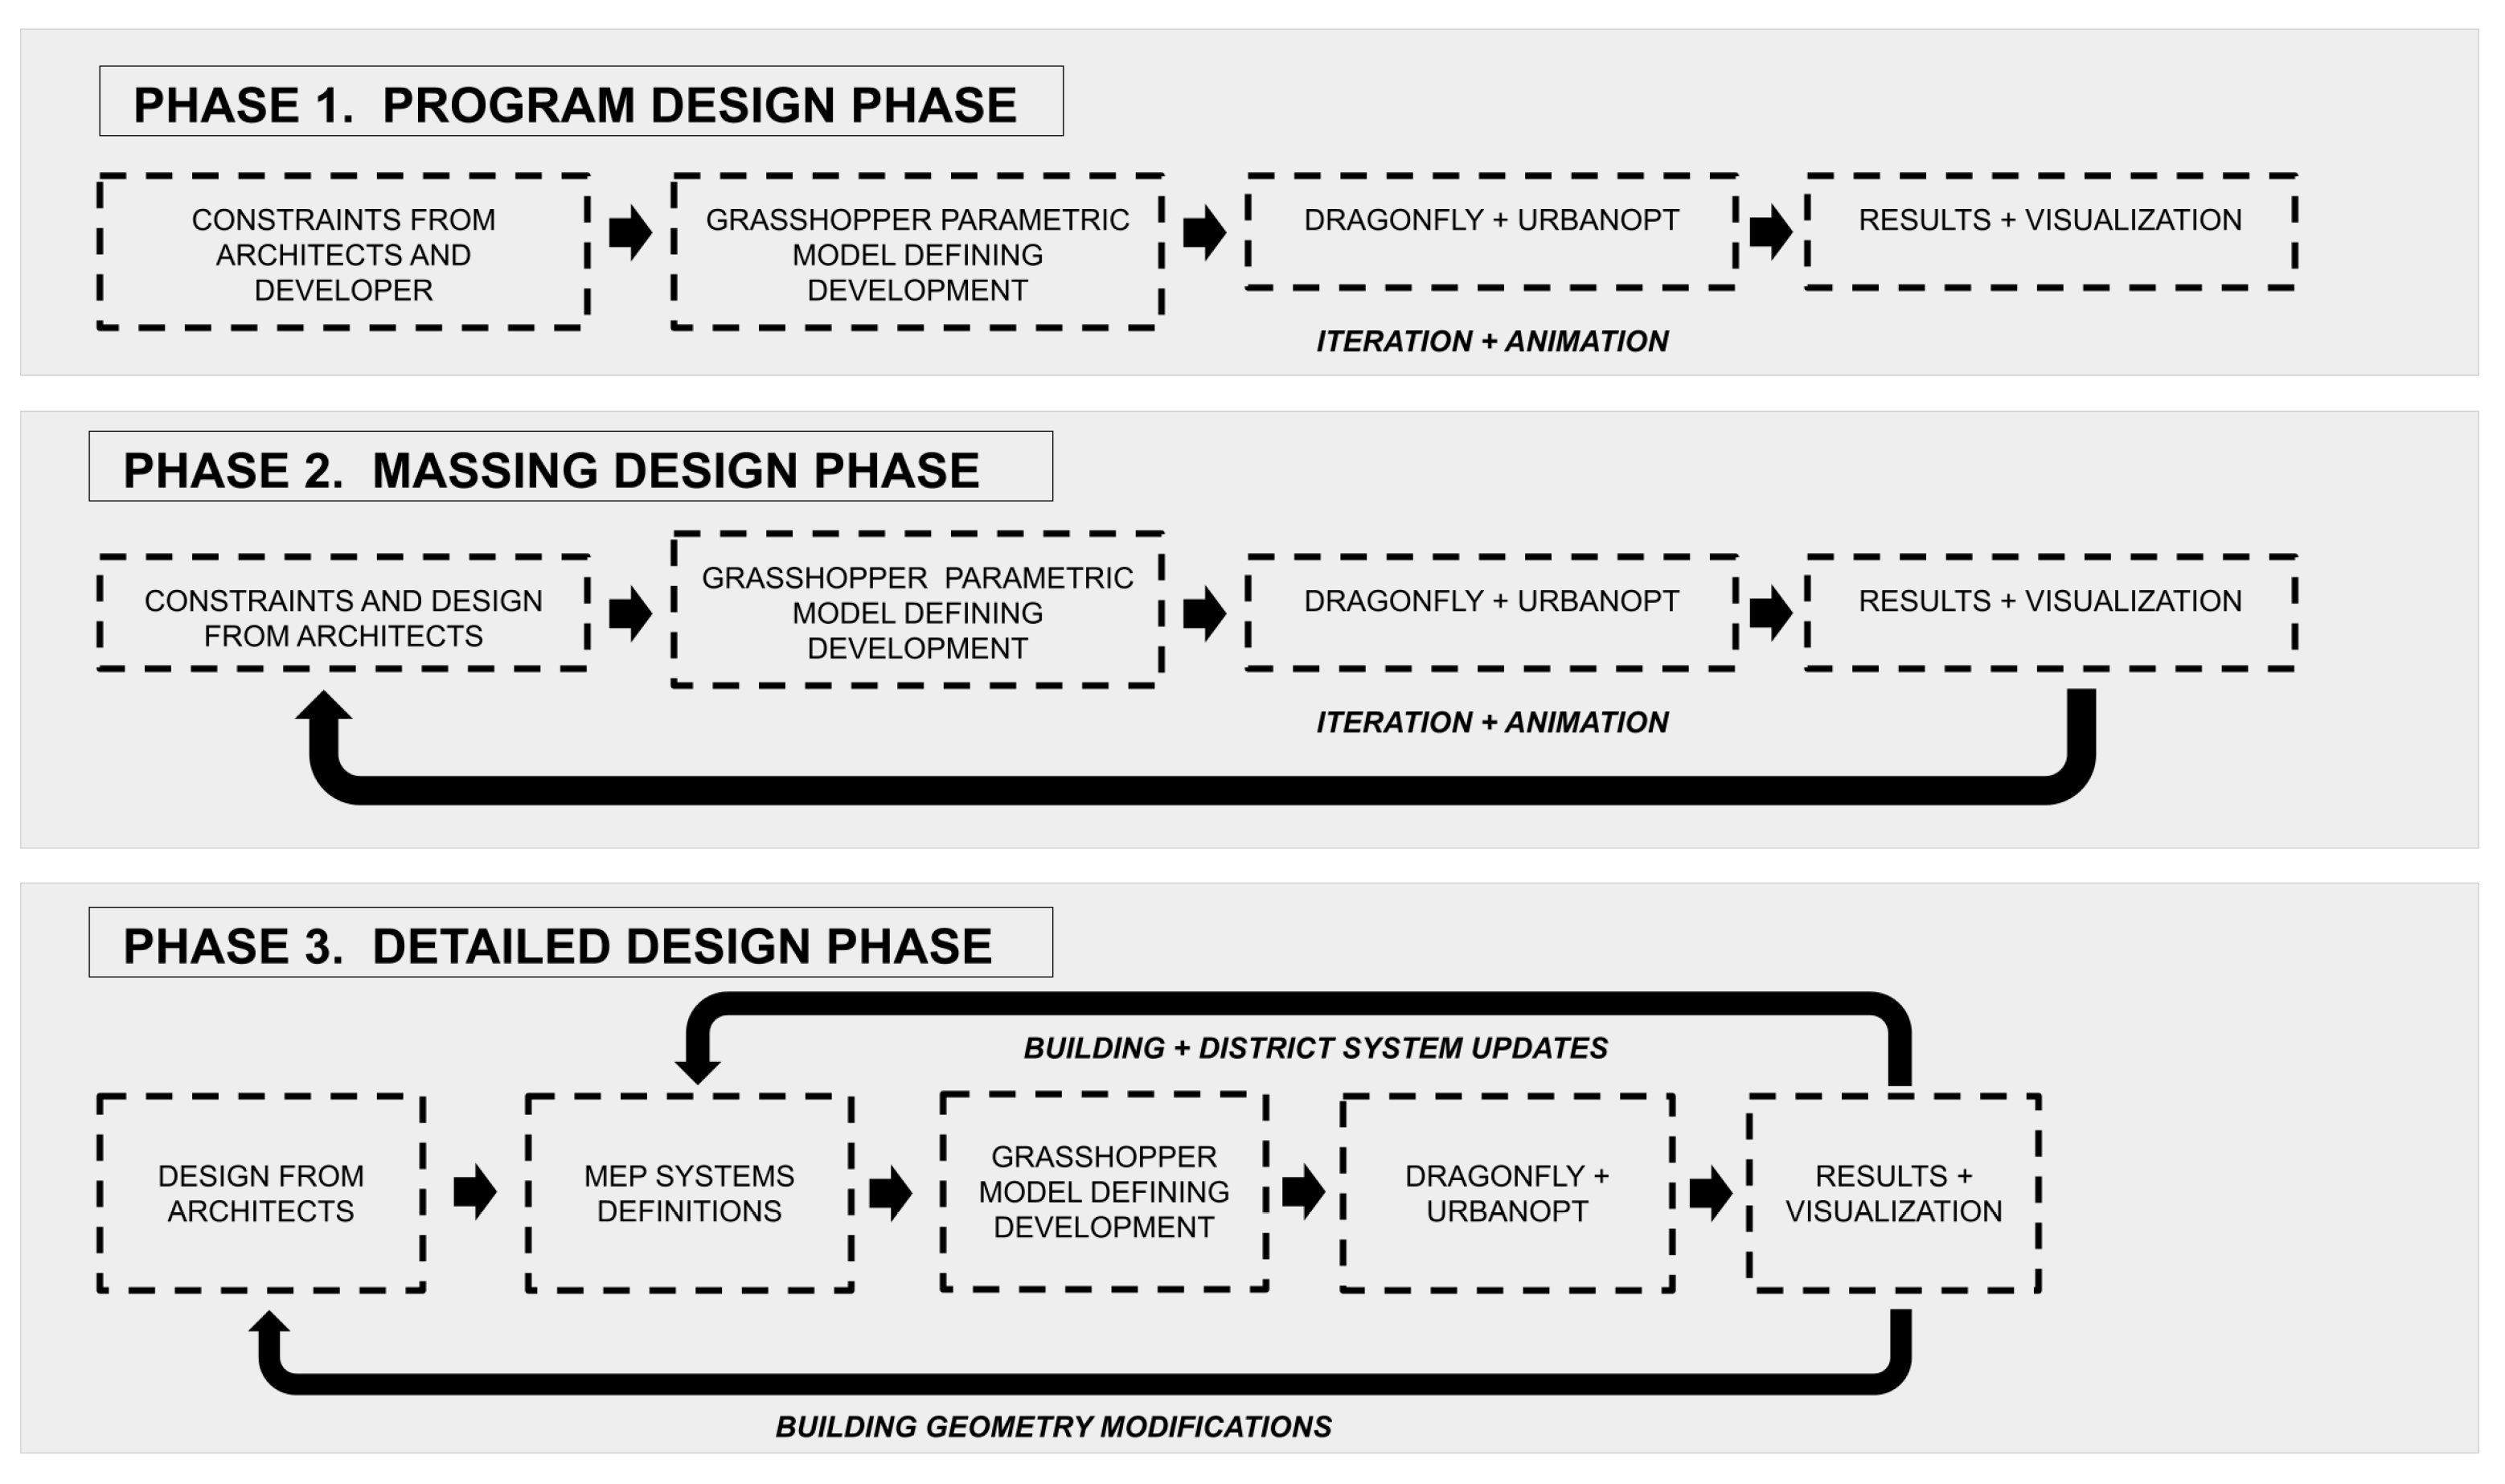
2.2.2. SOM Design Workflow

As a full service architecture and engineering firm, SOM is committed to collaborative and interdisciplinary design. From a performance standpoint, this means evaluating various performance metrics for rapidly changing geometry through various design phases. Typically, a CAD model and other details from a project brief are utilized to develop an architectural model in the Rhinoceros 3D environment. For some projects, geometry is pulled directly from Revit or another Building Information Modeling (BIM) tool. Typical existing SOM workflows For this paper, “existing” workflows and tools refer to those workflows used prior to or without the Dragonfly/URBANopt capabilities (the “proposed” or “new” workflows). are performed in the Rhino and Grasshopper environments which is particularly advantageous since the same architectural model can be used to begin the environmental analysis. This workflow is summarized in Figure 8.
With respect to district-scale analysis, existing SOM capabilities are summarized as follows:
  • Program and massing analysis;
  • HVAC system selection;
  • Energy conservation measures;
  • PV system sizing;
  • Outdoor thermal comfort.
The proposed workflow and analysis supported by the Dragonfly/URBANopt toolset are intended to address some of the limitations described in the Introduction of this paper. The workflow is completely within the Rhino and Grasshopper environments, meaning that architectural geometry can readily be used to set up district-scale analysis. In addition, the toolset is able to utilize and process complex curvilinear forms for multiple buildings simultaneously, meaning that less time has to be spent rebuilding geometry. Furthermore, a host of advanced analysis and exposed simulation inputs allow the user to develop detailed district-scale models that can help with system and plant sizing. The toolset also accepts varying degrees of input detail, so an early stage model with default inputs can still be readily generated with minimal inputs. The Dragonfly/URBANopt workflows have allowed SOM to add several new analysis capabilities to its catalog of services:
  • Building load flexibility;
  • Battery sizing and dispatching;
  • EV load analysis;
  • Electrical distribution system modeling;
  • District-scale geometry processing.
Dragonfly/URBANopt workflows support analysis at multiple design phases as outlined in Figure 9. In the program design phase, in which different program mixes are evaluated, a series of constraints from the designers and stakeholders can be used to generate a Grasshopper parametric model. By iterating through different options, program mixes that minimize energy consumption while meeting stakeholder objectives and constraints can be identified. In the massing design phase, in which building form and orientation are specified, results from a district-scale energy simulation can be used to inform and modify constraints such as minimum program areas, total building square footage and floor-to-area ratios. Based on the findings, the cycle is iterated through again. Finally, in the detailed design phase, where district-scale systems are specified, the analysis can both inform refinements to building form and help with system selection.

2.2.3. Baseline Scenario

In order to assess the effectiveness of the new modeling capabilities and workflows, a series of scenarios were evaluated. These scenarios mirror the typical SOM design workflow in which refinements and modeling capabilities are sequentially added onto baseline conditions in order to arrive at the final district design.
The evaluated baseline scenario spanned the program and massing design phases summarized in Figure 9. At this point in the design process, studies are performed to inform the massing, layout, and basic energy performance of the pilot district. Simple HVAC system selections are made, typically to align the building performance characteristics with an established standard, such as ASHRAE 90.1 Appendix G [50]. With existing SOM analysis methods, HVAC system selection is often constrained to Ideal Air Loads and most massing geometry has to be rebuilt. The Dragonfly/URBANopt workflows process more complex massing geometry and allow for the selection of detailed HVAC systems with both air and plant loops. At this stage, all modifications and inputs are applied to each individual building. These are then simulated together. No considerations for district-scale shared systems or operations are made in this scenario. In summary, key technical questions related to the baseline scenario include
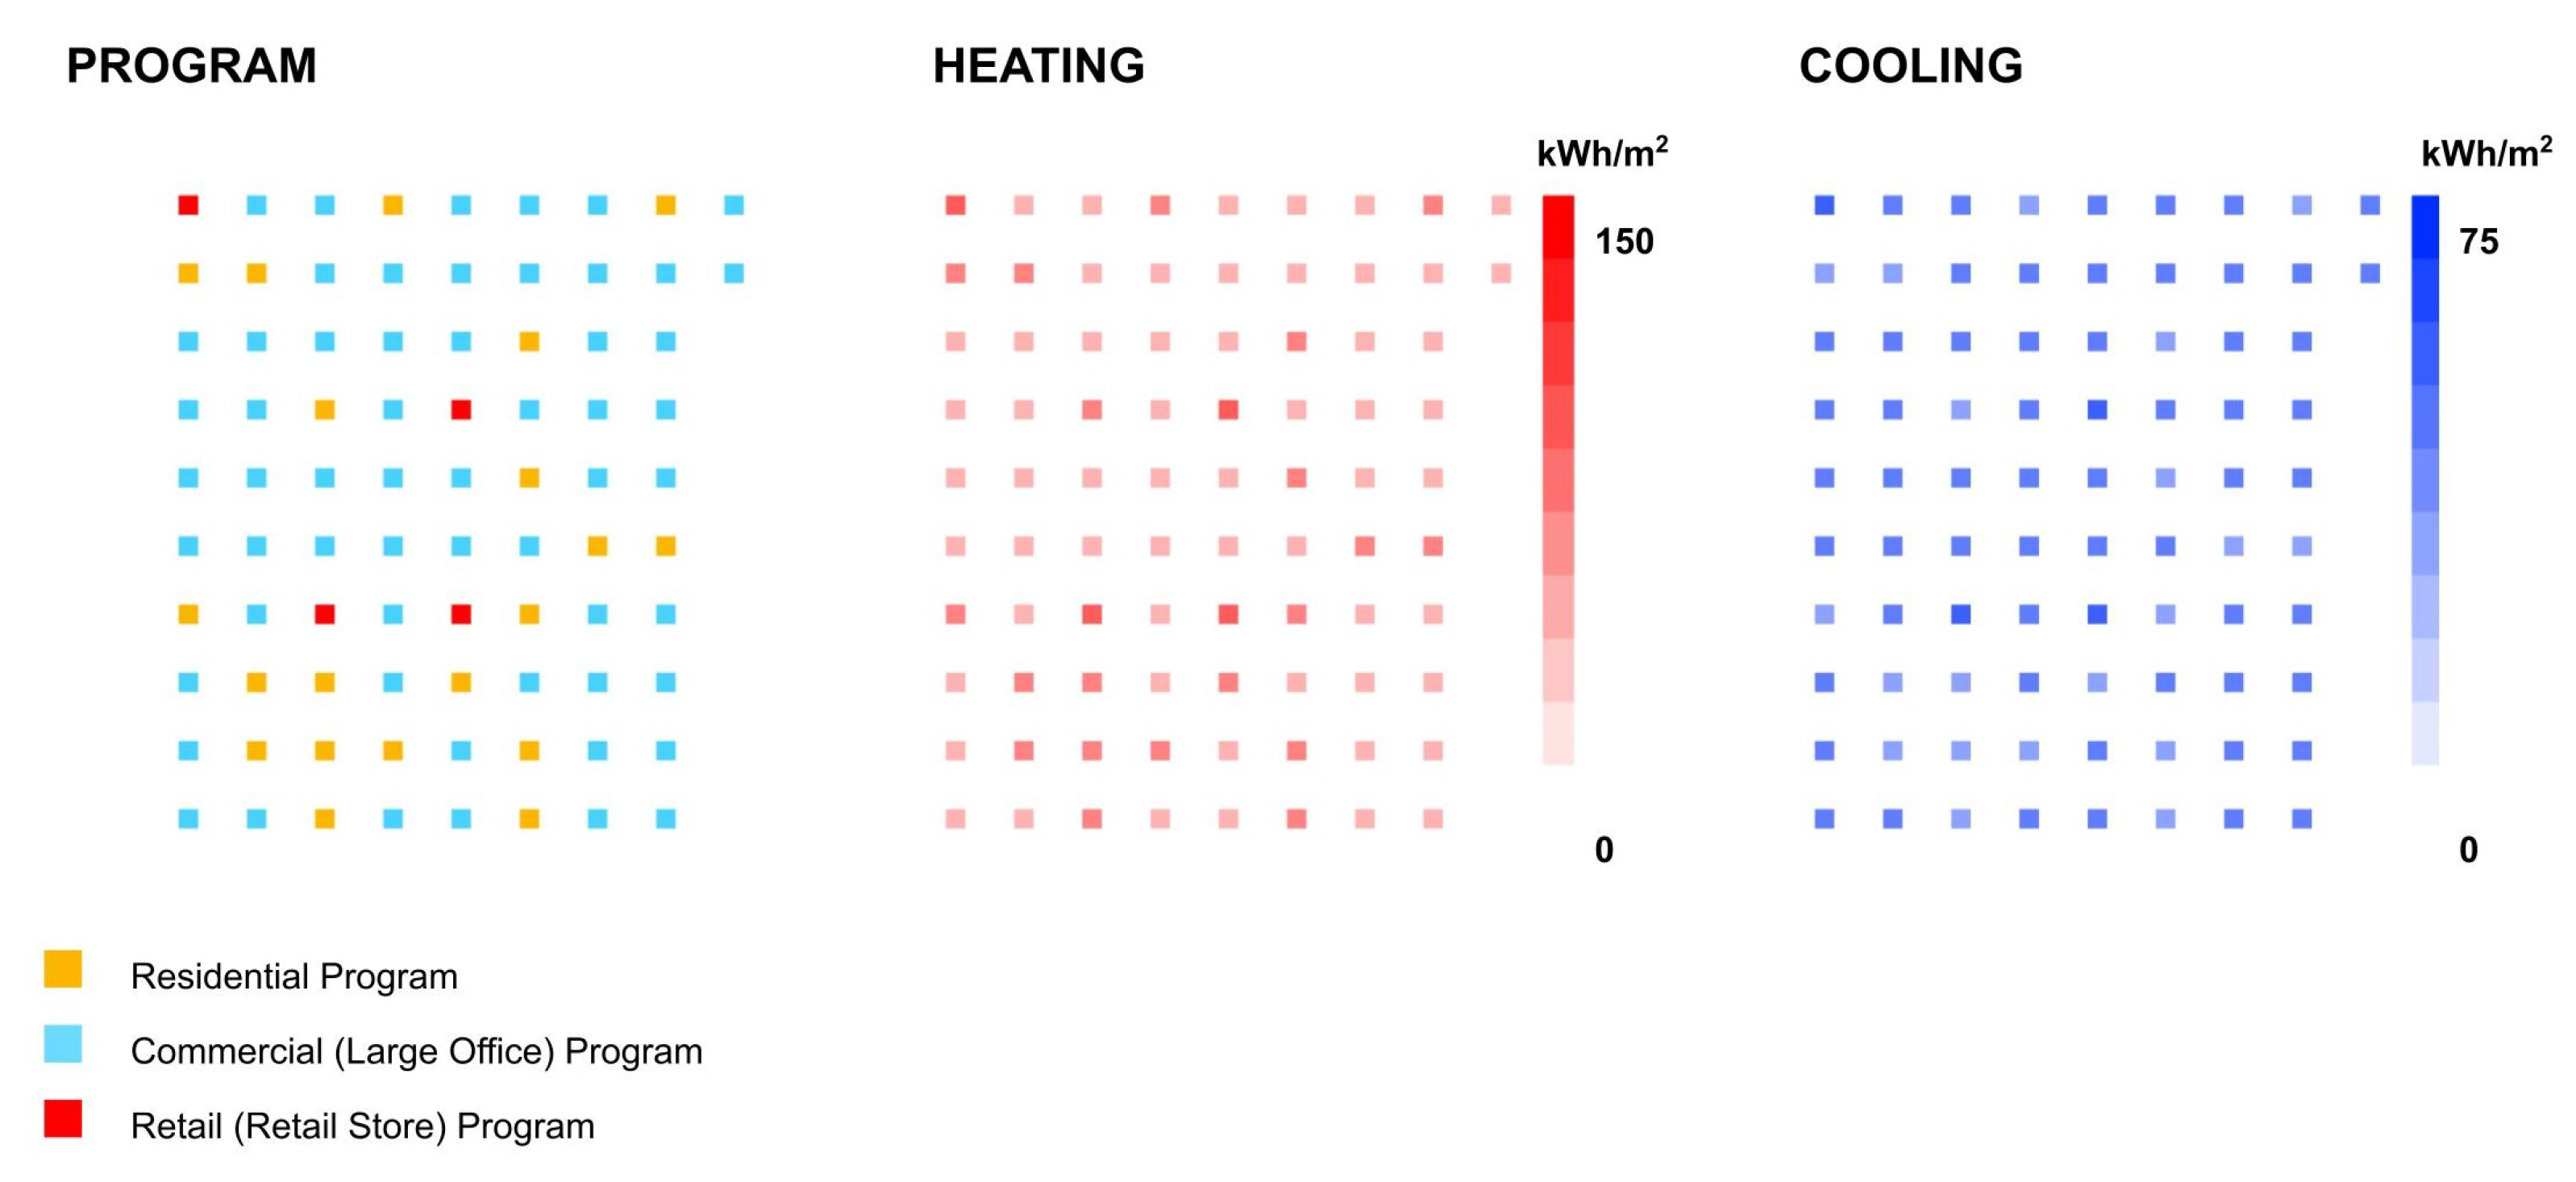
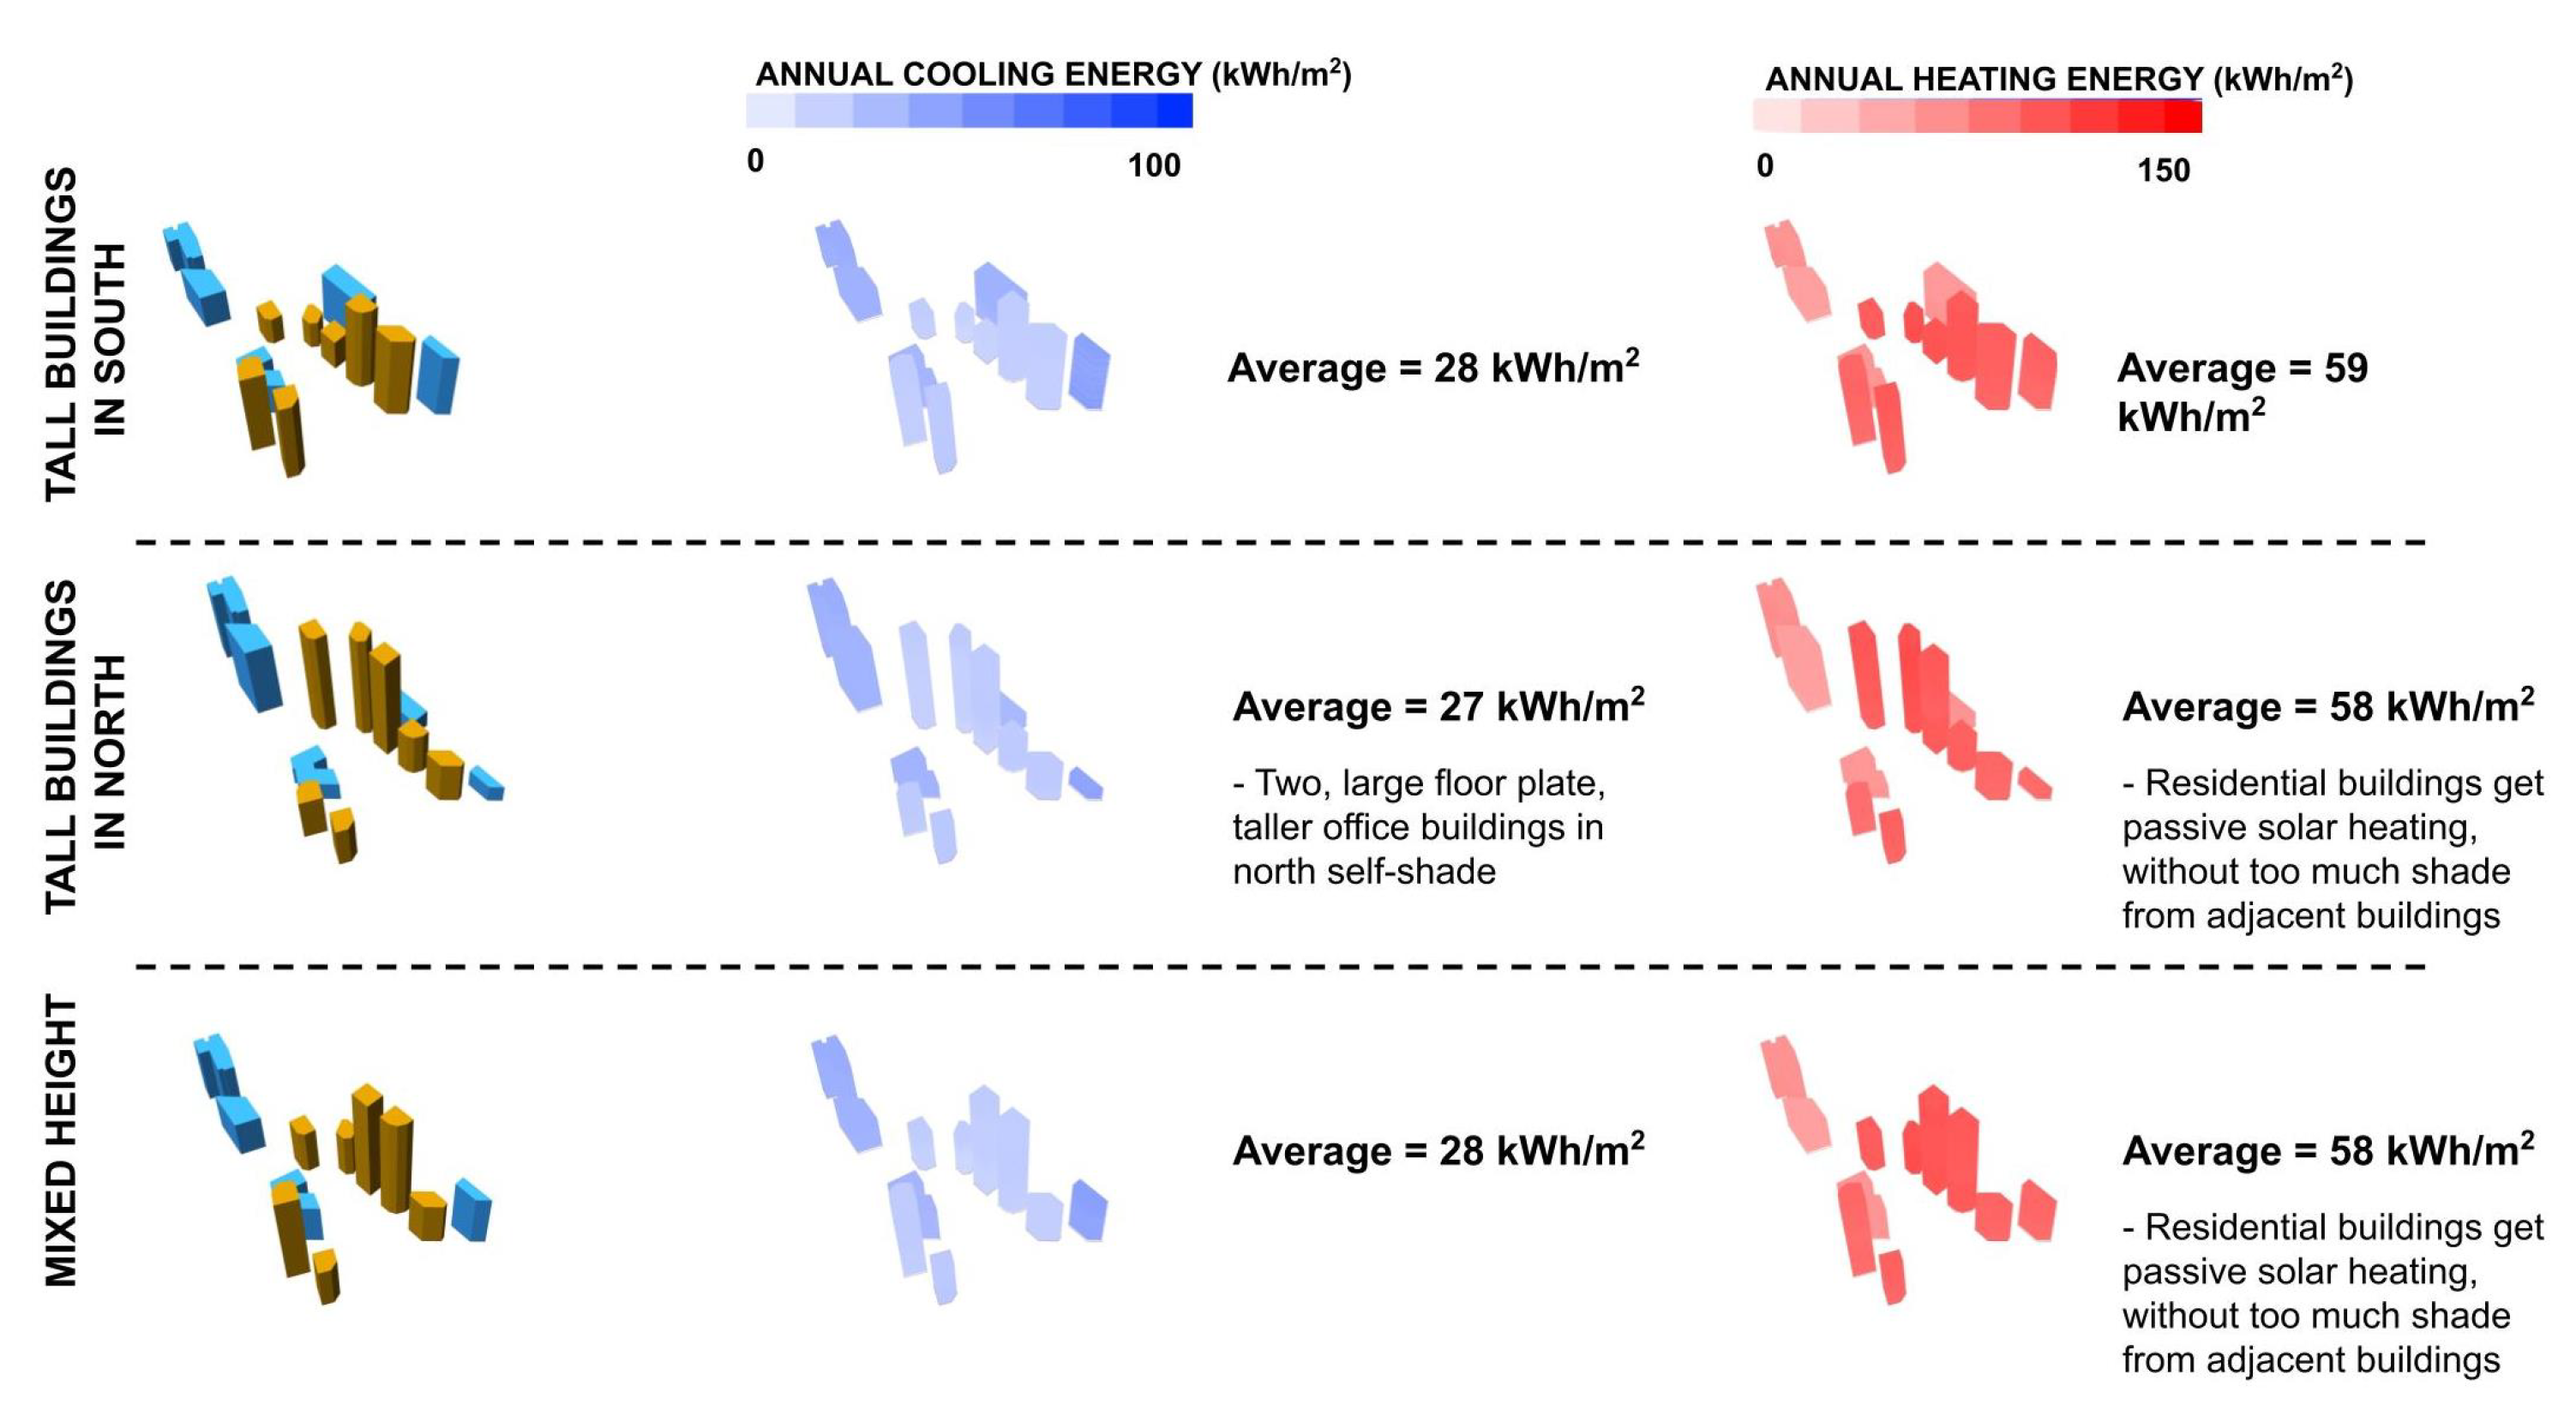
  • How does the overall district energy consumption change depending on the mix of programs as well as the location and orientation of the buildings?
  • What is the projected baseline or “business-as-usual” (BAU) energy performance of the buildings and district considering the default starting point for the program design—for example, aligning with minimum, code-specified energy performance?

2.2.4. High-Efficiency Scenario

In the high-efficiency scenario, further refinements are layered into the model. In Figure 9, this analysis would fit within the detailed design phase. At this stage, more energy efficient HVAC systems are specified. Daylight controls and natural ventilation are added into the analysis. Furthermore, more standard energy conservation measures (ECMs) such as heat recovery, reduced lighting power and improved insulation can be made. The Dragonfly/URBANopt workflows provide the flexibility to model the district with varying levels of granularity, as required, with the ability to model multi-zone and multi-floor models, but also provide the ability to use multipliers for repeated floors within a building to save computational space and time. This flexibility can help capture a high level of detail and realism related to energy usage by allowing for the simulation of context and zone-specific conditions. At this stage, modifications and inputs can be applied uniformly to all or a subset of district buildings. All buildings in the district-scale model are then simulated together. No considerations for district-scale shared systems or operations are made in this scenario. In summary, key technical questions related to the high-efficiency scenario include
  • How does energy performance change when individual ECMs and packages of ECMs are applied to the buildings in the district?
Key metrics could include
  • Annual energy costs, consumption and emissions;
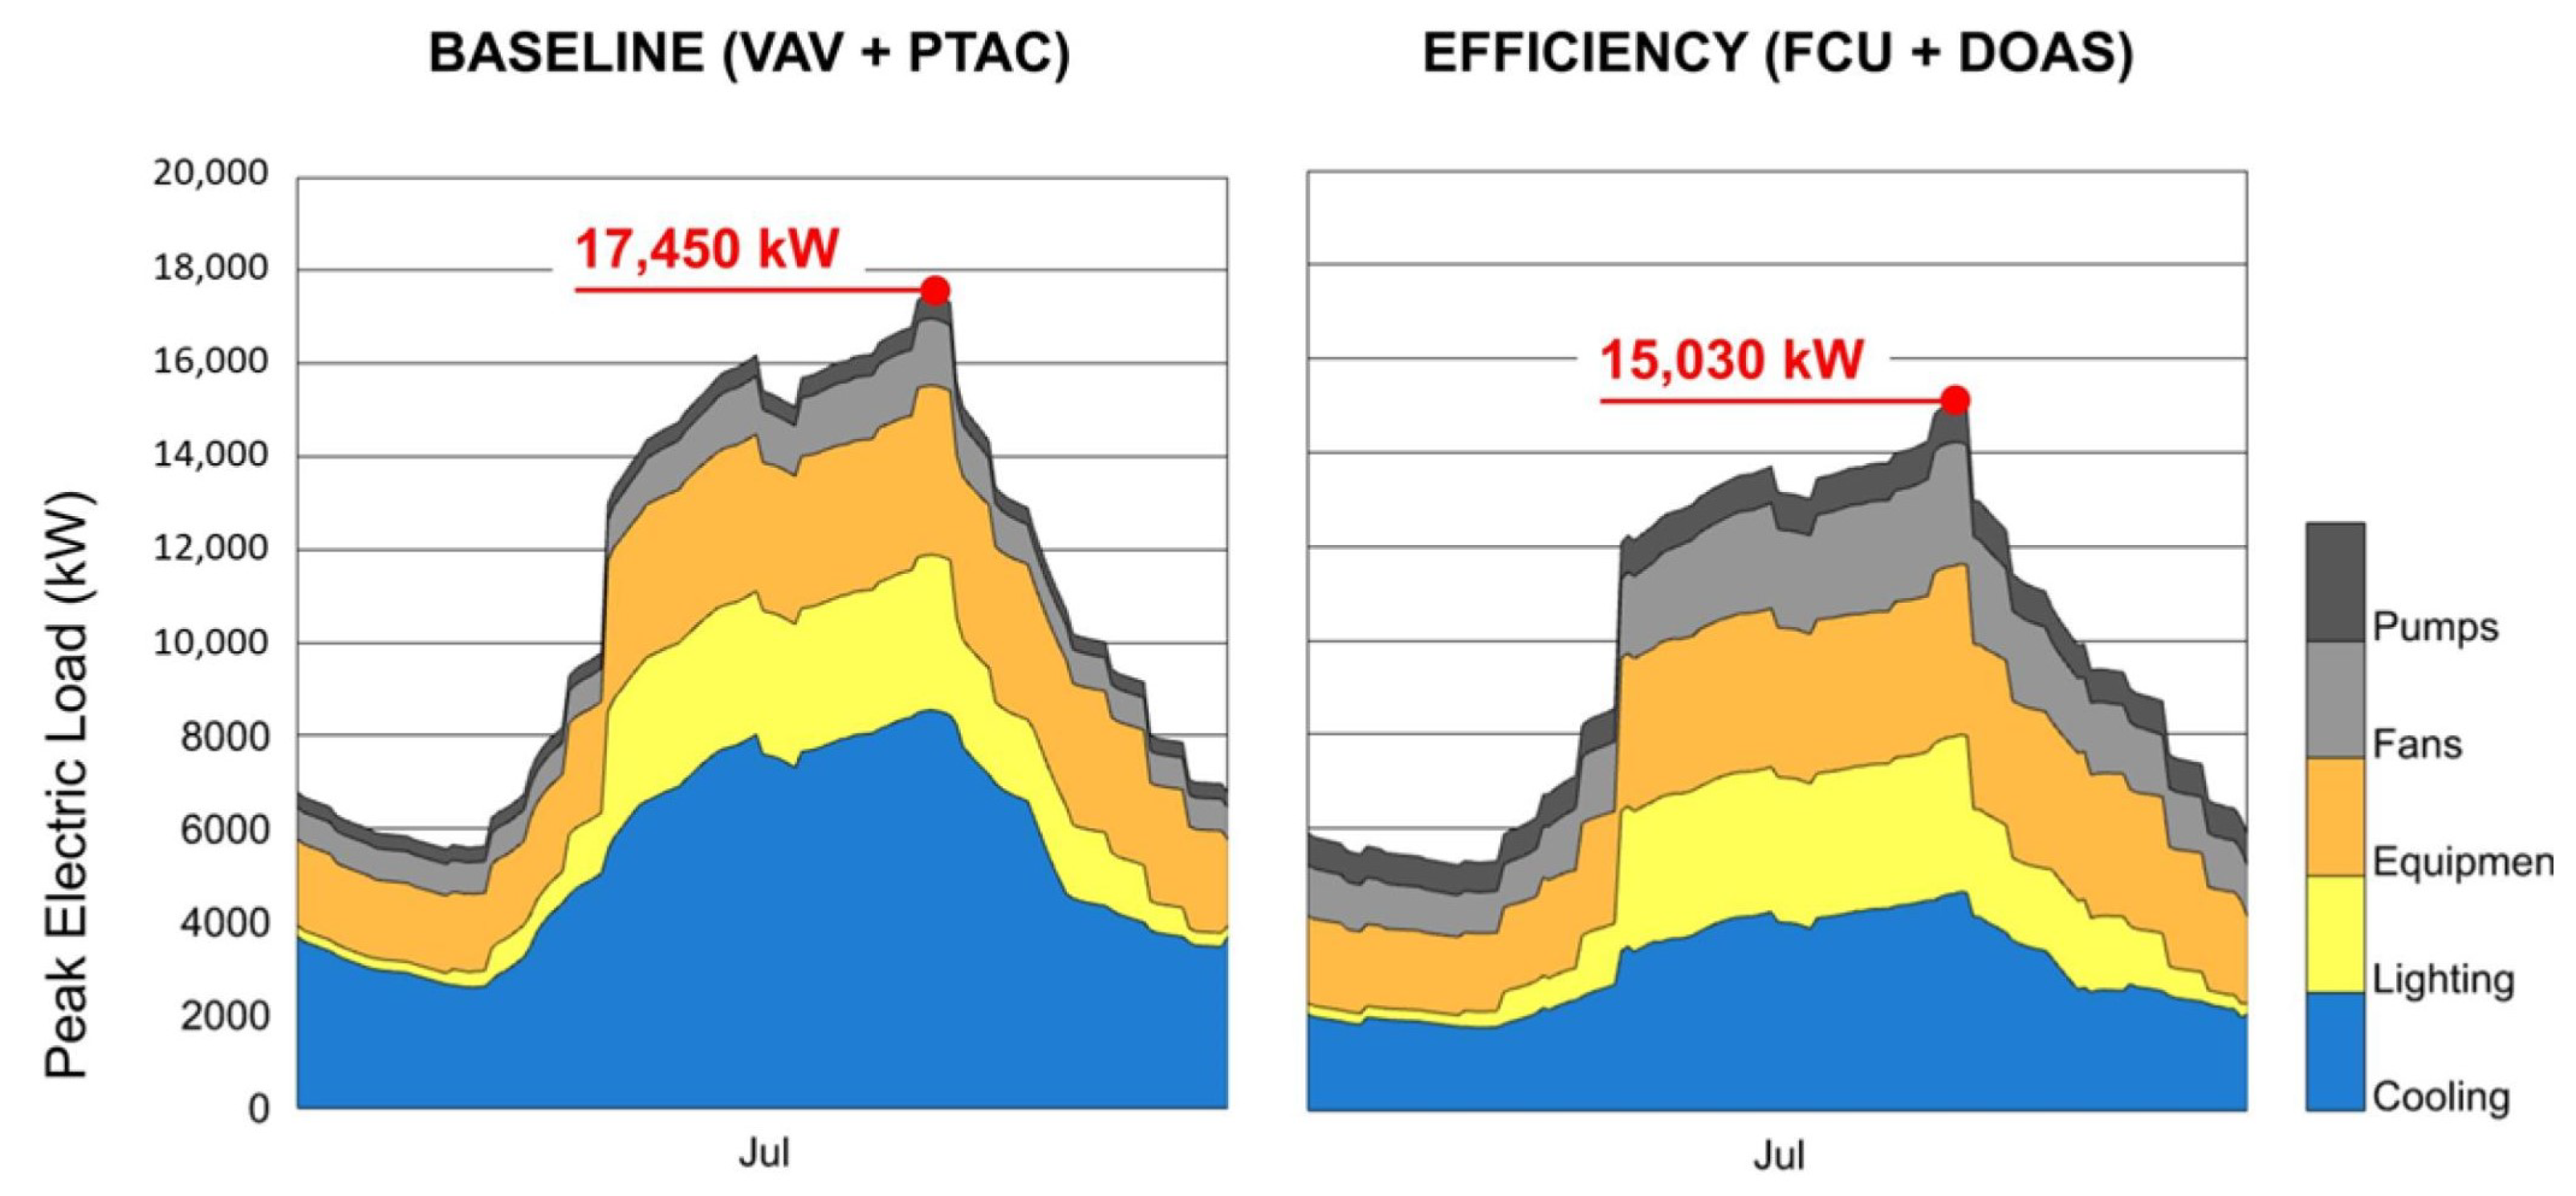
  • Peak energy consumption.

2.2.5. District-Scale Systems Scenario

In this scenario, the focus is on detailed component analysis and quantifying the benefits of a district-scale approach—in other words, a design approach that considers potential district-scale energy systems and related opportunities. This includes assessment of thermal loads, the timing of peak thermal loads, and the potential for energy sharing through district thermal systems. Furthermore, given the increasing focus on electrifying loads, increasing renewable generation and reducing emissions, it is of interest to understand how urban districts can best integrate DERs for renewable power generation and energy storage. In addition, with the growing demand for EVs, it is likewise of interest to consider the impact of these additional EV charging loads on district energy consumption and emissions, as well as the required district electric distribution infrastructure. A means of effectively modeling electric grid operation and interactivity at the district scale as a way to size pieces of electrical infrastructure such as transformers, electric lines and distribution networks is becoming increasingly necessary. The district model can explore nonwires alternatives to costly grid infrastructure upgrades. The bulk of this analysis typically occurs during the detailed design phase in Figure 9. However, the current SOM workflows omit much of this analysis, as these capabilities are limited in existing tools.
Potential for Shared District Thermal Systems: District-scale thermal strategies include understanding thermal load overlap (simultaneous heating and cooling) between buildings. Because the pilot district is mixed use, there are opportunities for energy sharing through a district thermal system, particularly when residential service hot water and ground floor retail cooling and heating load requirements are factored in.
Aggregate District Load Profiles, Peaks, and Diversity: Understanding district peak loads is necessary in the sizing of district energy systems and the Dragonfly/URBANopt workflows allow for peak loads and load profiles to be quickly generated for individual buildings and the entire district.
Impacts of Microclimate and Urban Heat Island Effect: In the district-scale system scenario, microclimatic conditions can be layered into the analysis. The Urban Weather Generator component, part of the Dragonfly/URBANopt workflows, can be used to morph rural and airport weather data to account for the urban heat island effect by modeling the urban air temperature within the street canyons of a district. This allows estimation of the energy and outdoor thermal comfort penalty (or benefit) associated with the urban heat island effect.
Optimal PV/Battery Sizing: Currently, the typical SOM workflows allow for modeling PV systems; however, there is not an automated way to size and cost these systems. The Dragonfly/URBANopt workflows leverage REopt Lite for PV and battery calculations, providing new analysis and sizing capabilities early on in the design process.
Impacts of EV Charging on Aggregate Loads and Peak Timing: In existing workflows, EV loads are currently post-processed and added onto district electricity requirements without a defined ability to account for load profiles and different charging behaviors. Dragonfly/URBANopt allows for the OpenStudio Add EV Charging measure to be applied and customized to the case study district and impacts on building and district electric load profiles to be examined.
Effects of Efficiency, Solar, Batteries, and EV Charging on Electric Distribution Infrastructure: For existing SOM workflows, there is a very limited ability to size elements of electric infrastructure at the concept or design development stages. Typically, electric infrastructure design is either handled by electrical engineers or specified by utility providers, with limited overlap with architectural design and planning teams. This disconnected approach makes it more difficult to consider the effects of efficiency, solar, batteries, and EV charging on electrical infrastructure design and sizing. Dragonfly/URBANopt capabilities applied to the case study district include simulating transformer line loading and voltage parameters as generated by integration of URBANopt with DiTTo and OpenDSS.
In summary, key technical questions related to the district-scale systems scenario include
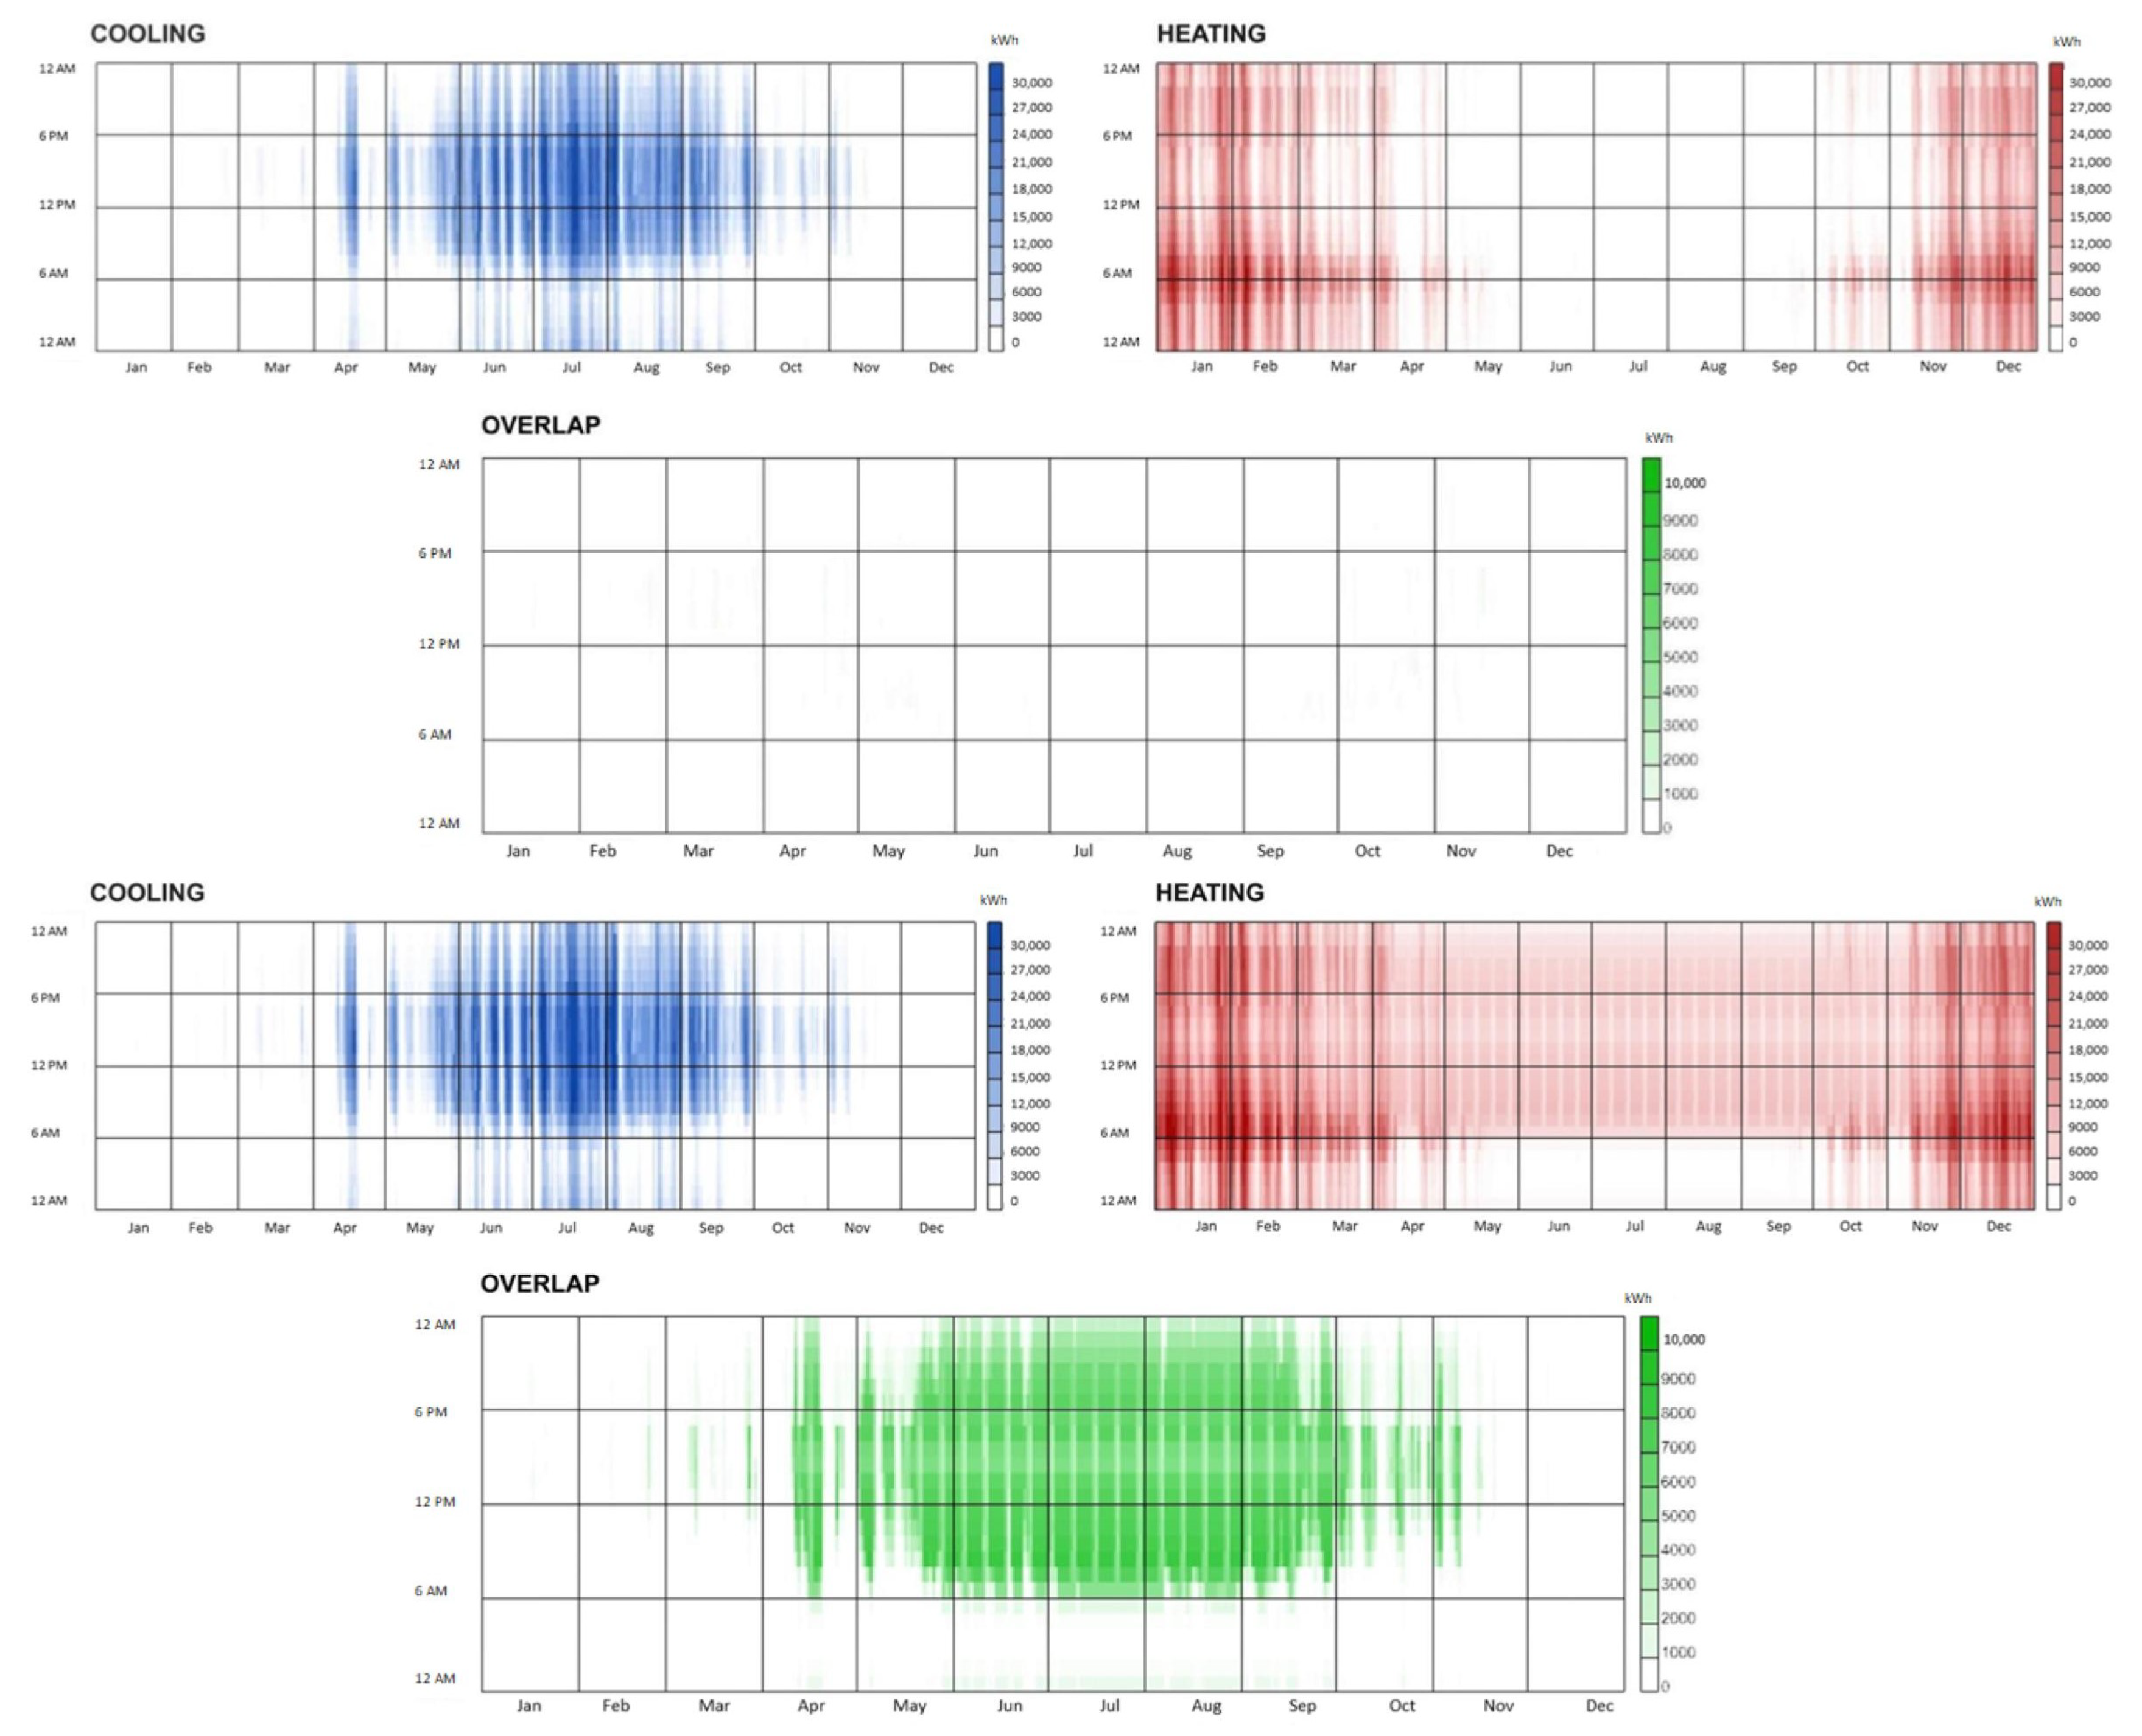
  • To what degree is there overlap in heating and cooling loads, and is there potential for a district thermal system that allows rejected heat from cooling in certain buildings to be used for space or water heating in other buildings?
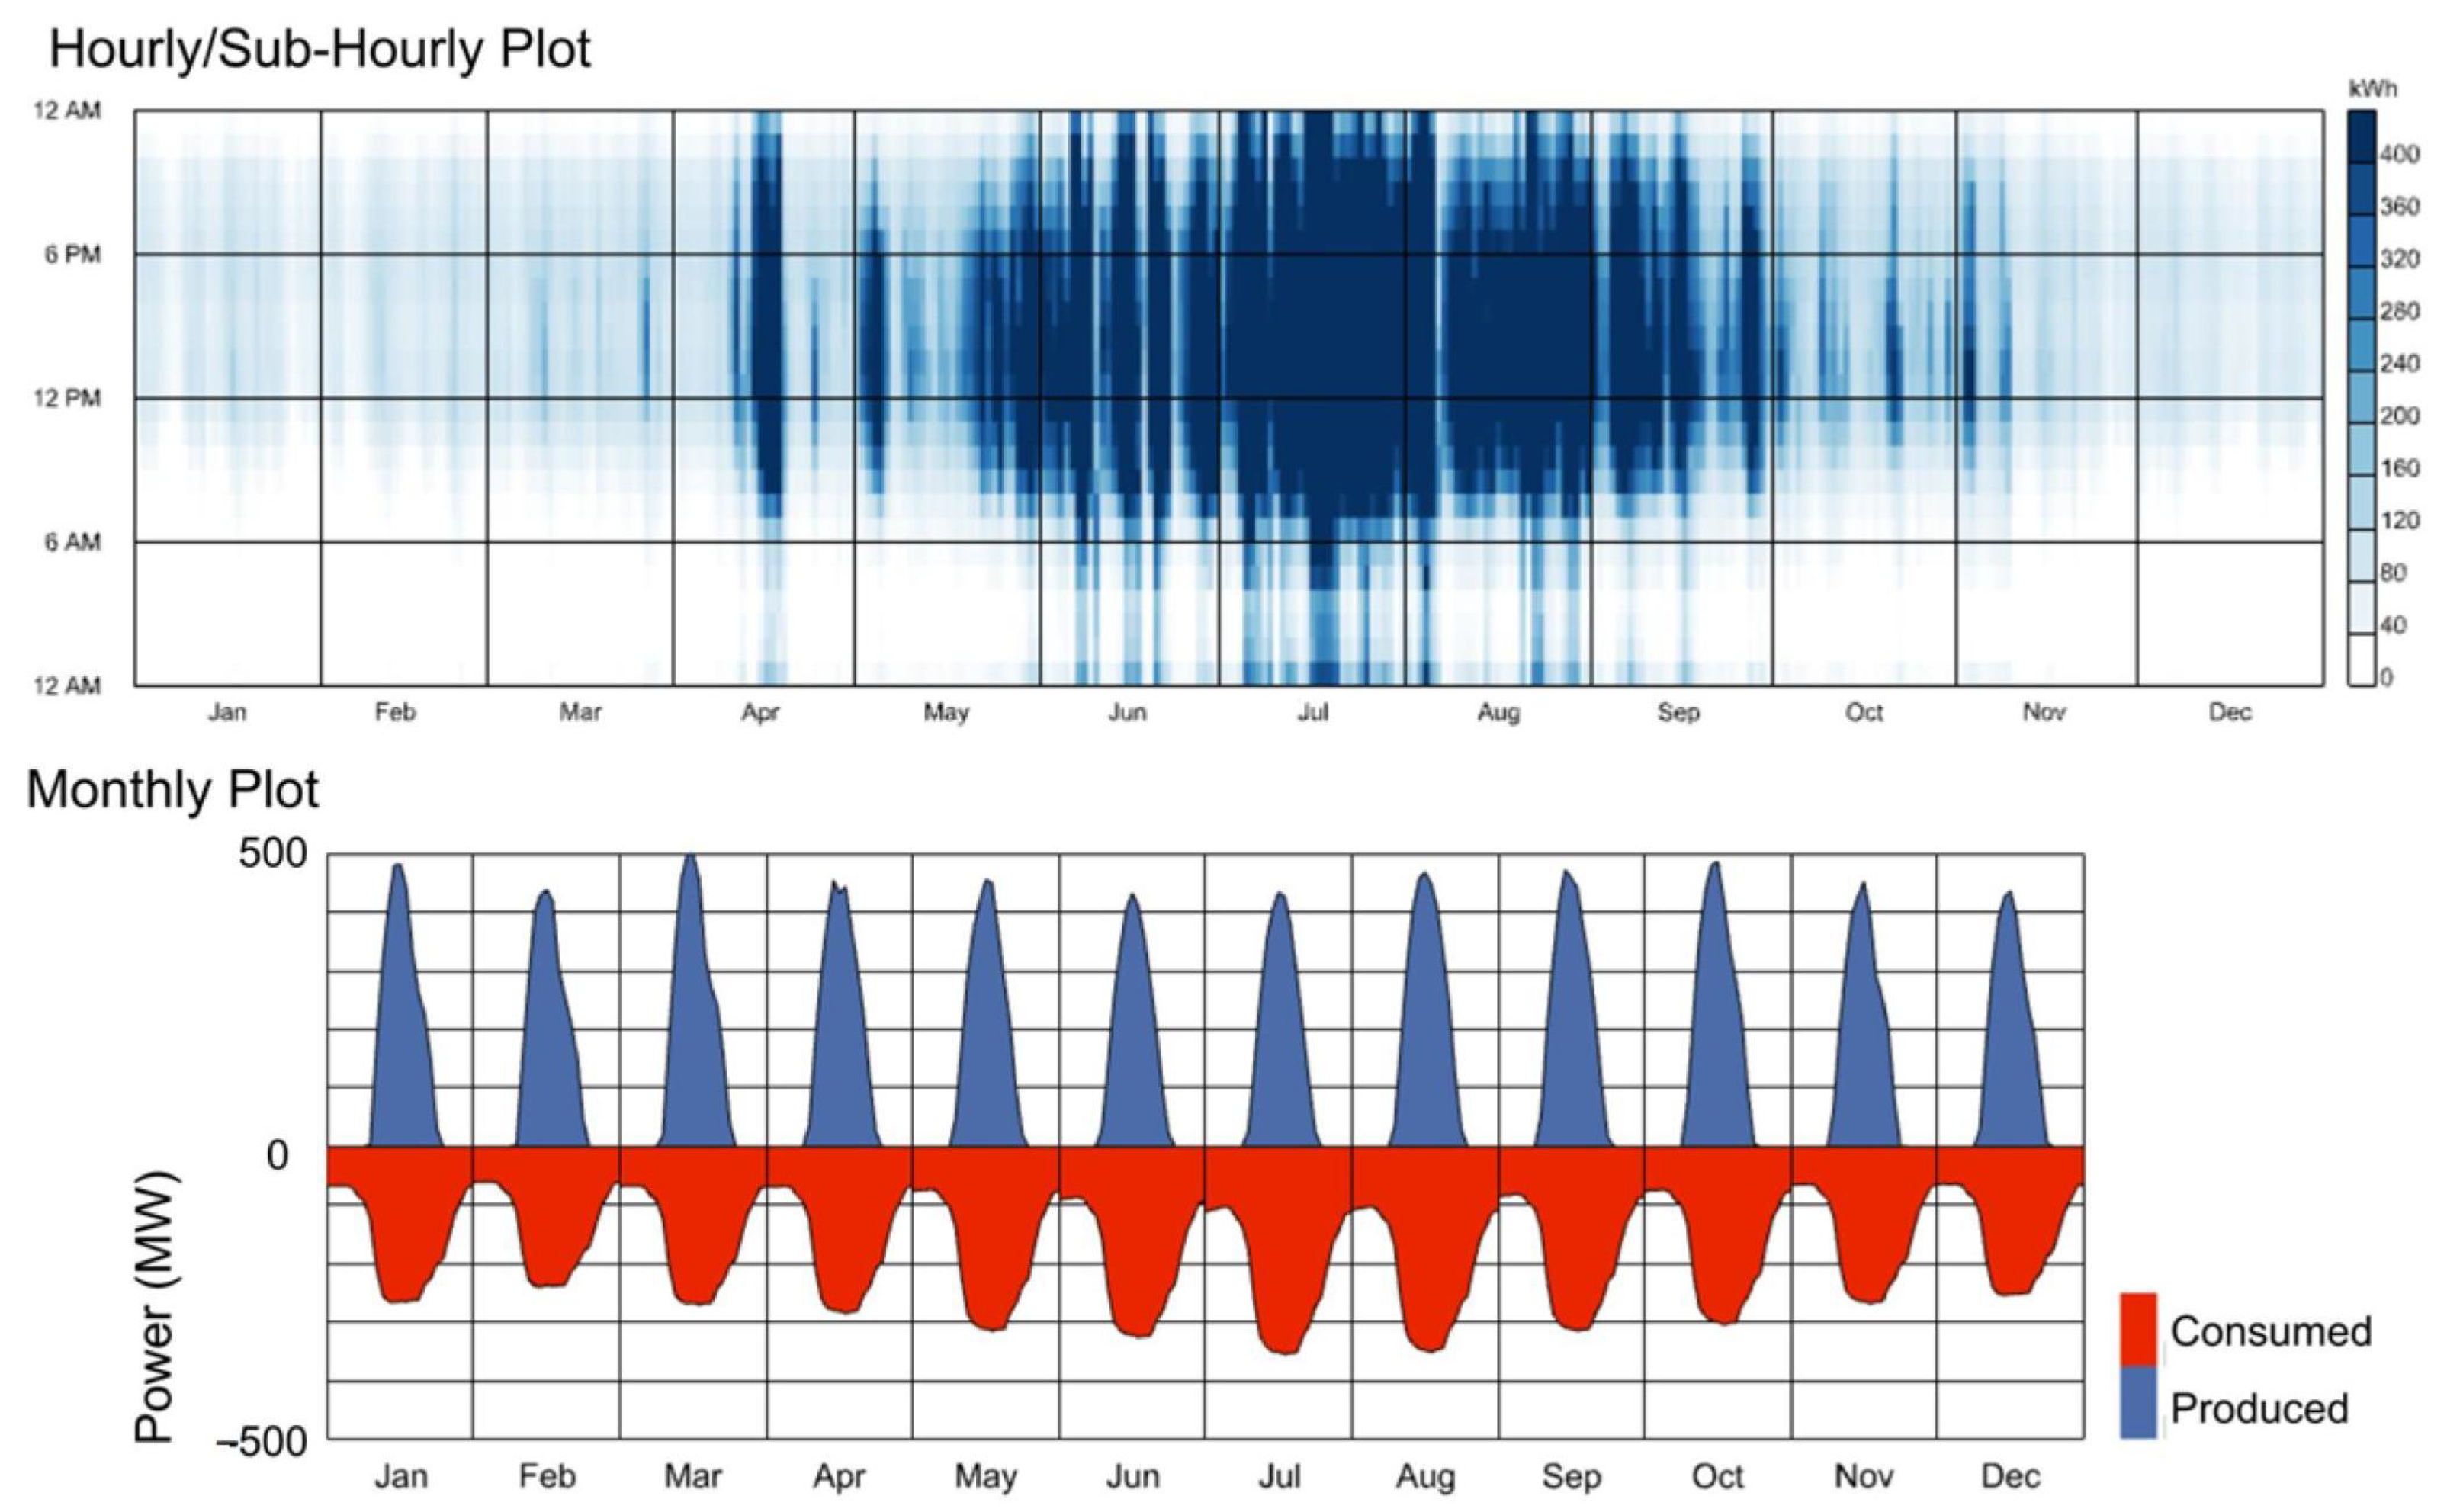
  • What are the aggregated electricity load profiles of the district? To what degree do different program types contribute to different peaks?
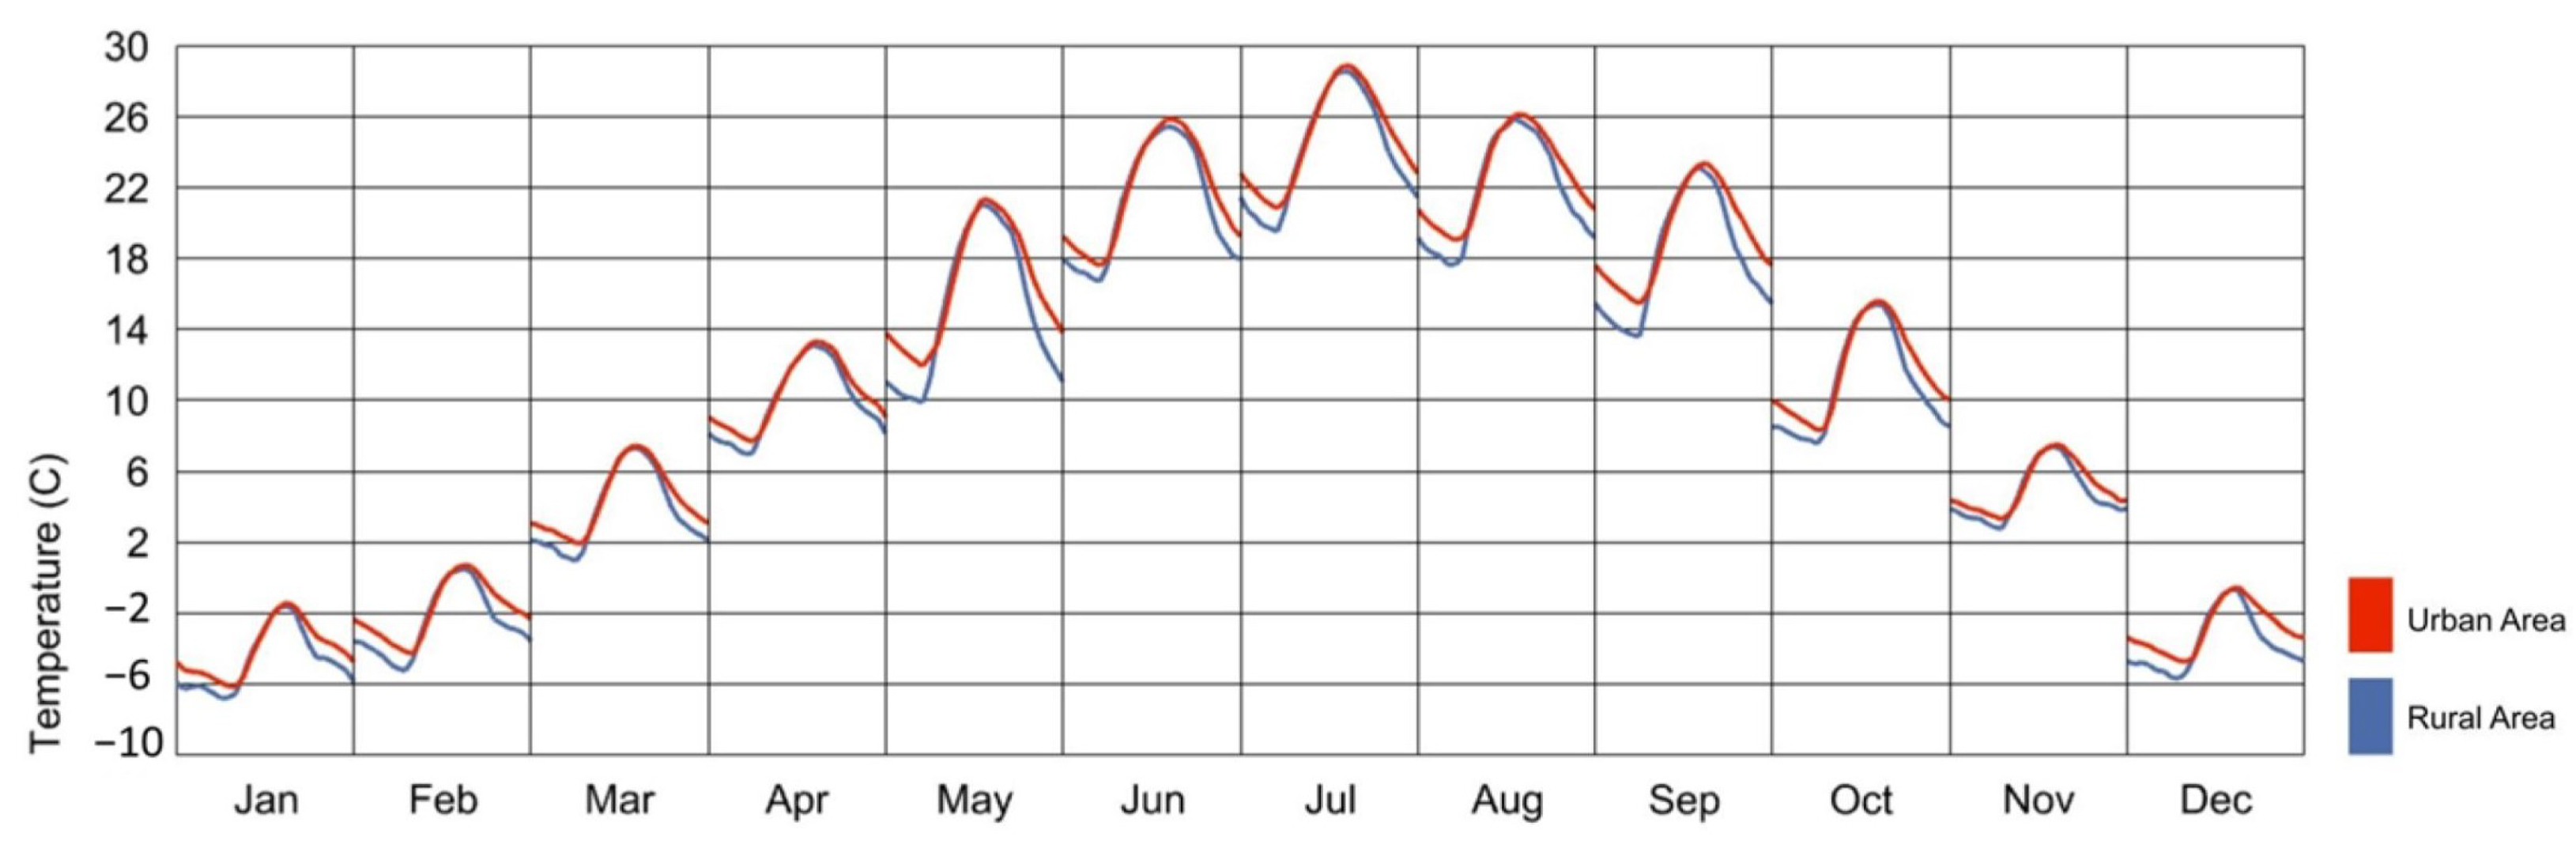
  • How do outdoor environmental conditions, and specifically the urban heat island effect, impact energy performance and comfort?
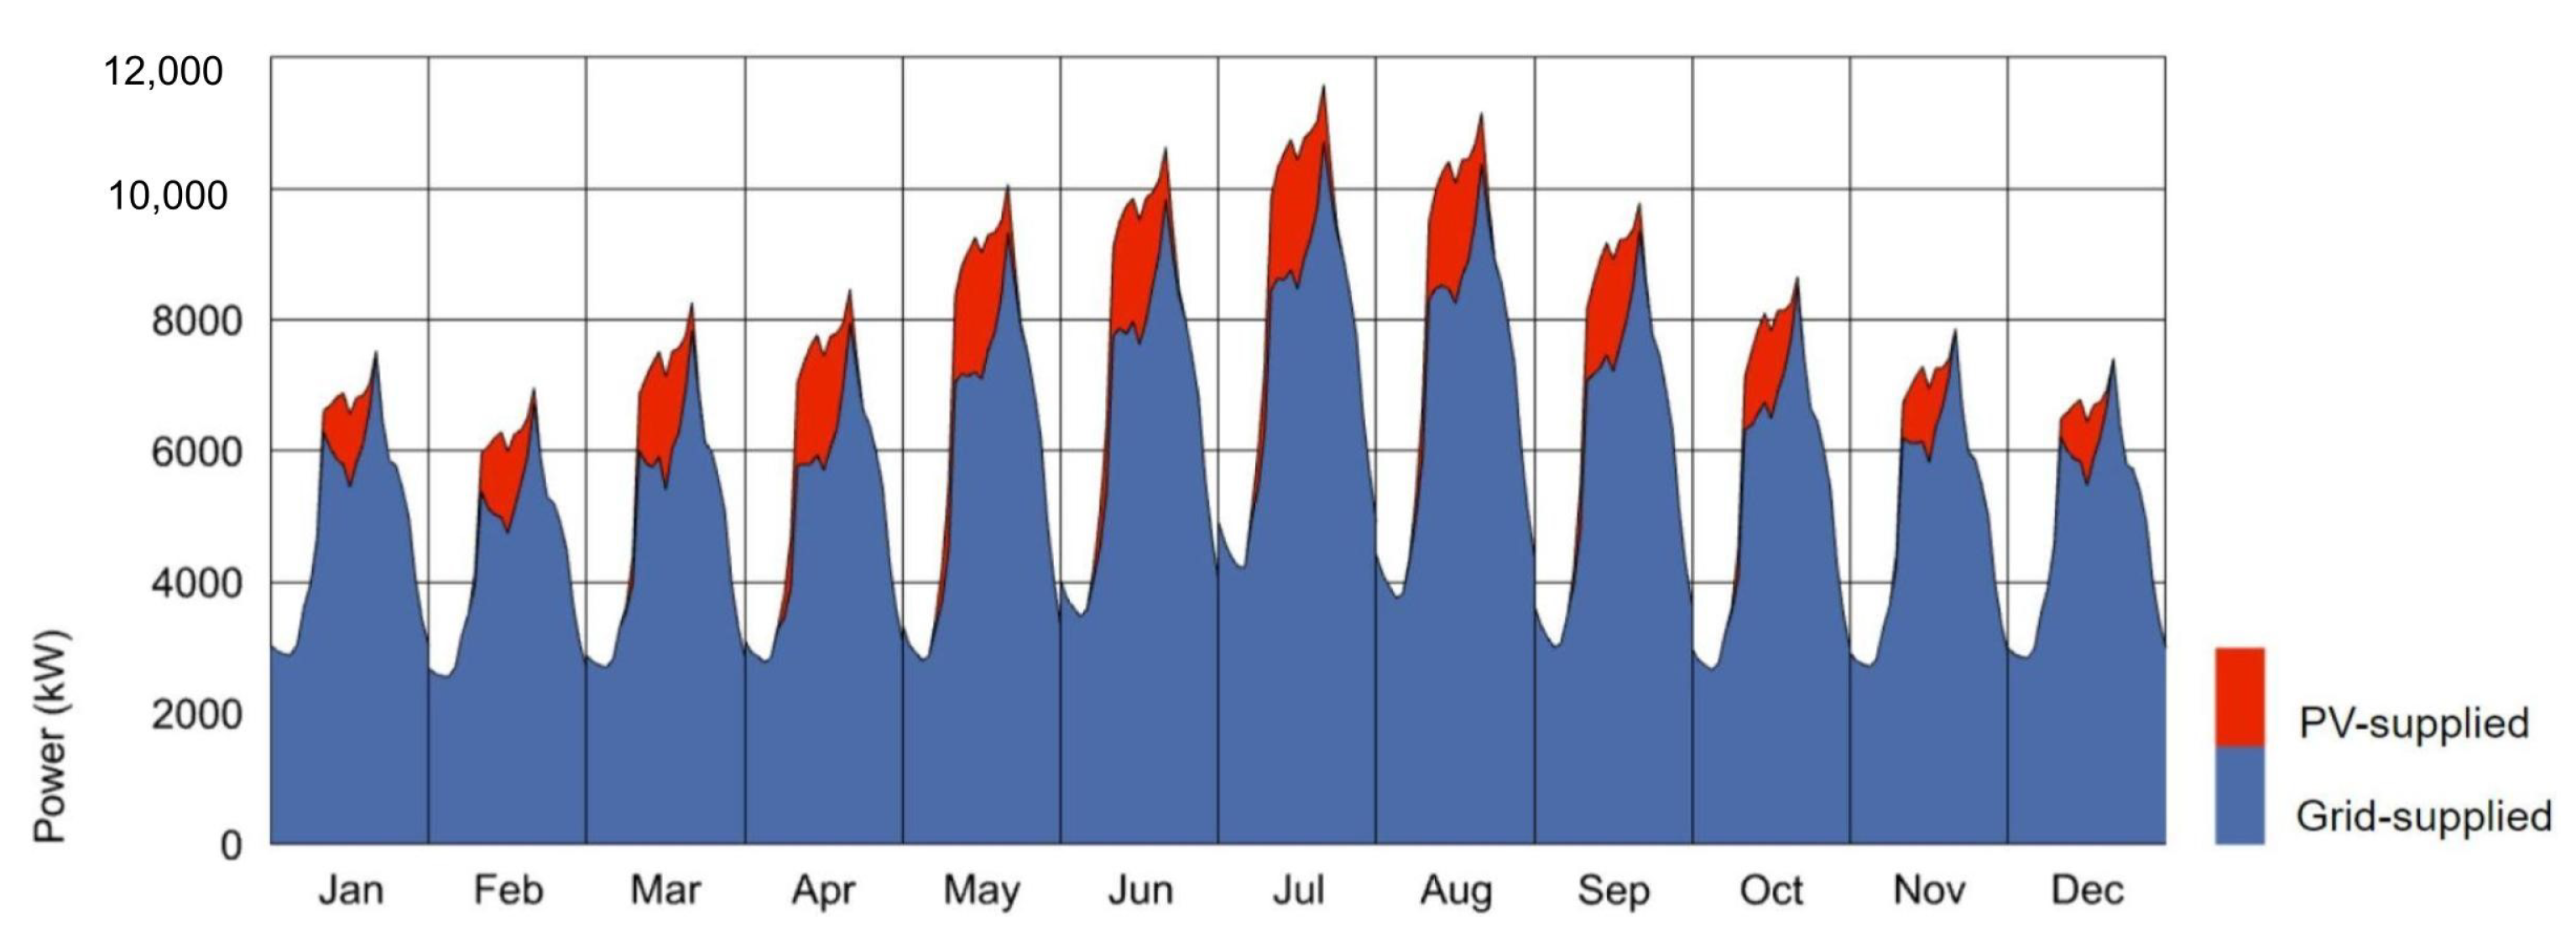
  • Given the load profiles, utility rates, and potential rooftop/canopy/ground mount areas available for solar PV, what are the life cycle cost-optimal solar system sizes and locations? What are the life cycle cost-optimal electric battery sizes and dispatching strategies?
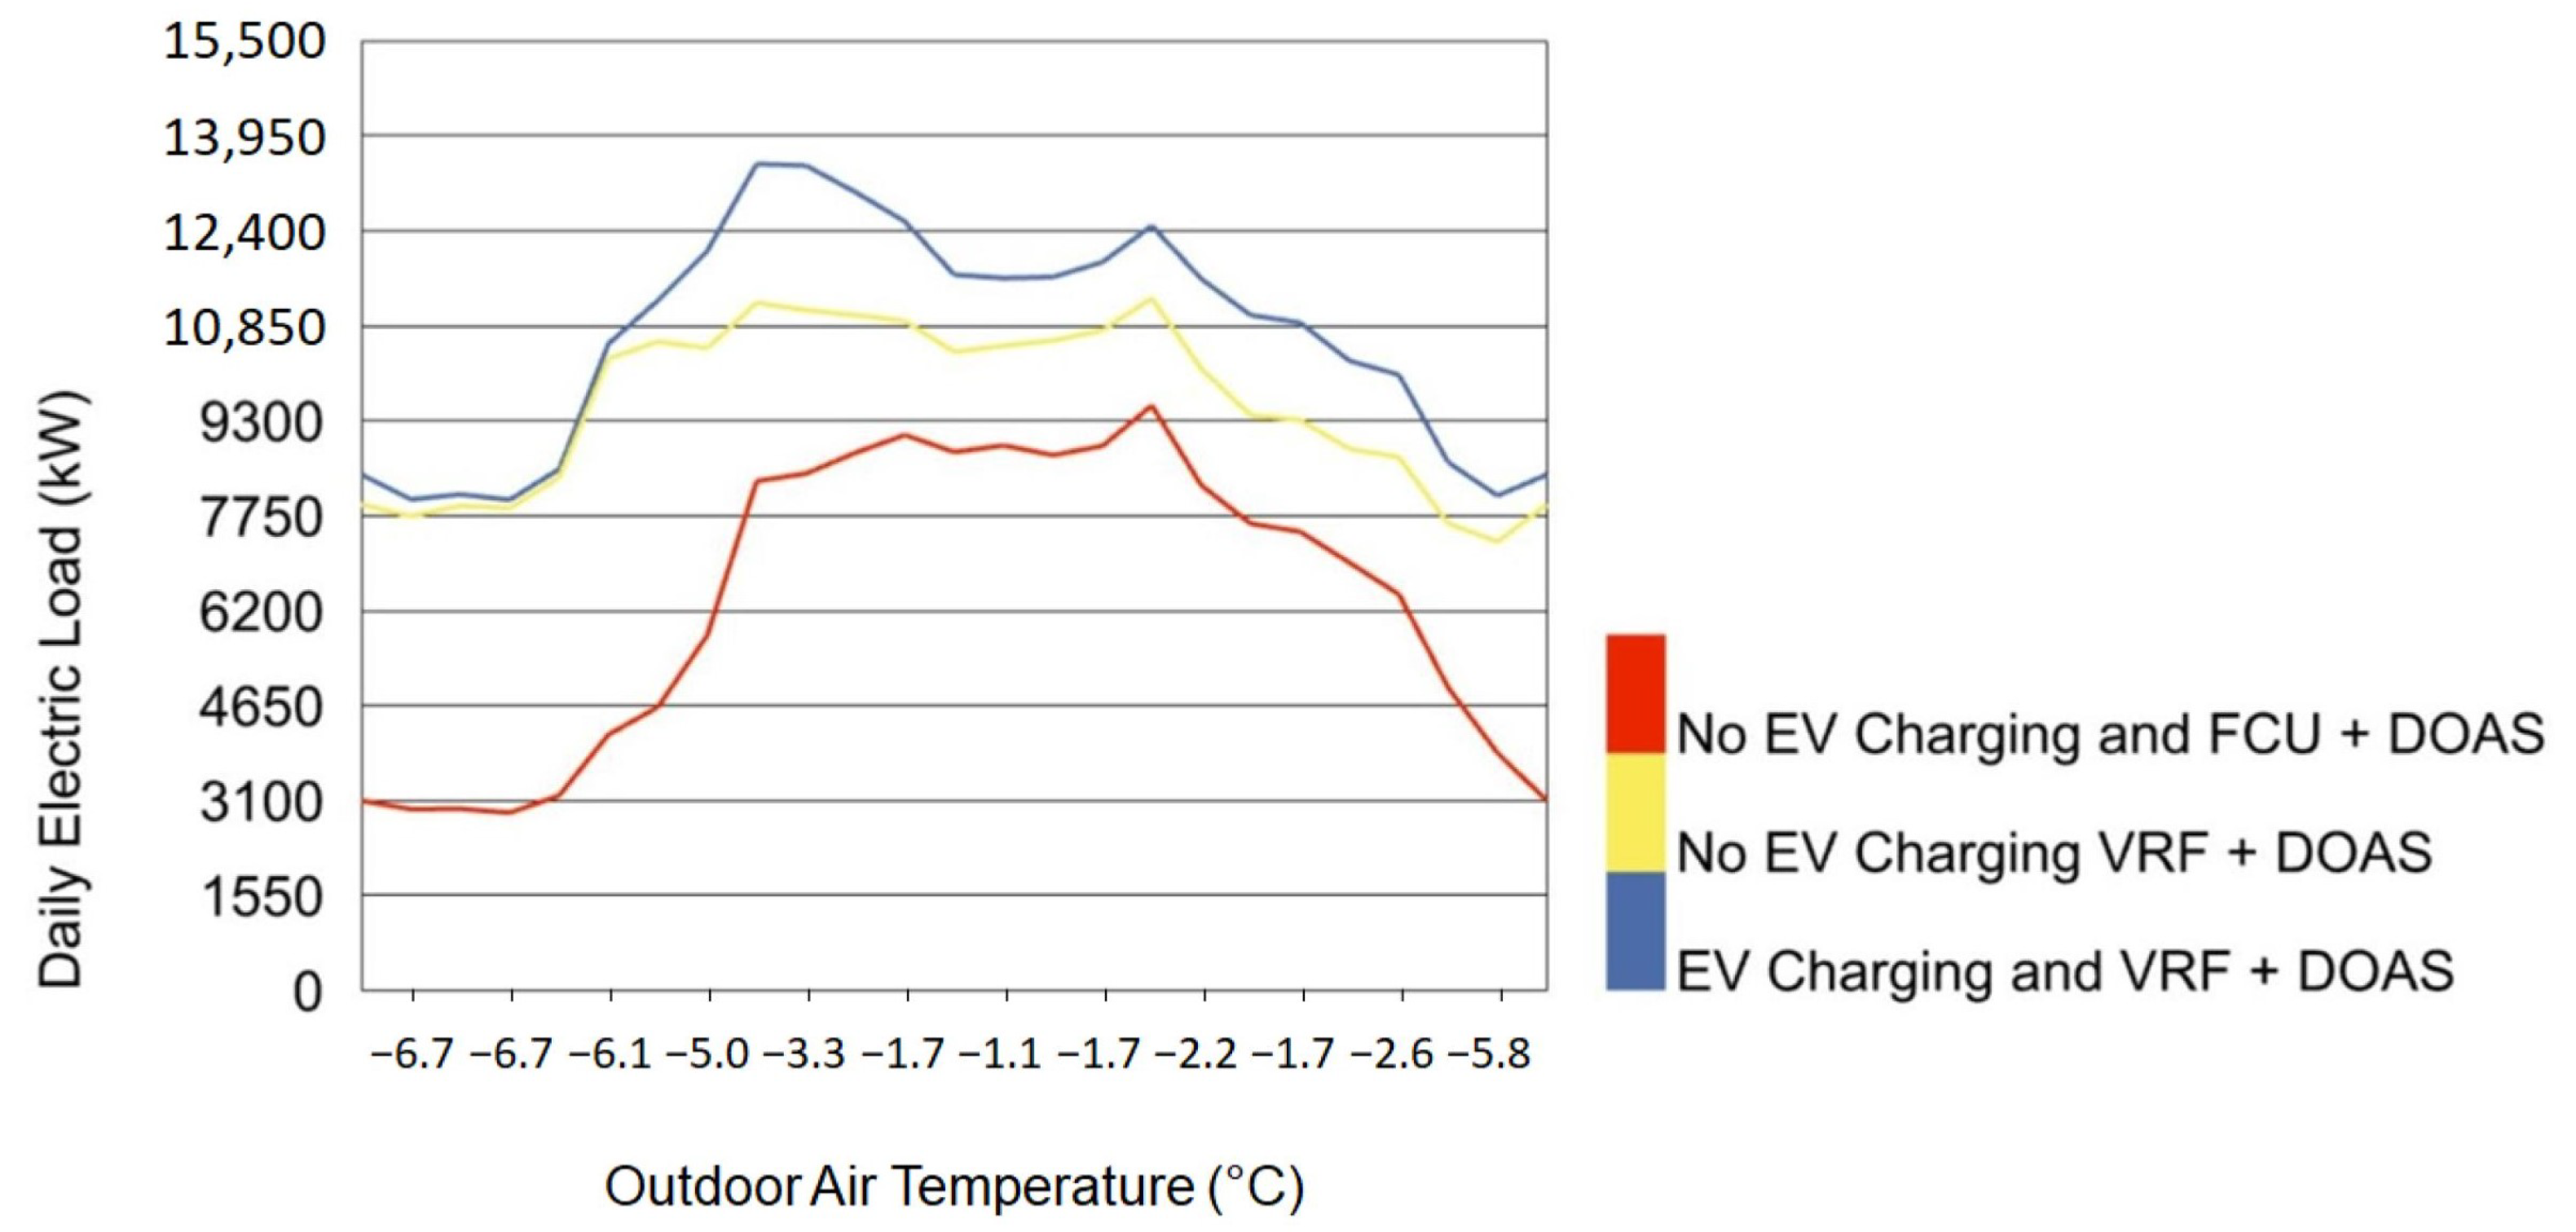
  • What is the impact on the electric energy consumption and aggregate load profile of the district for different degrees of EV adoption and associated charging? How do the district program types affect the type of charging that is anticipated (e.g., home, workplace, public) and the timing of peak electric loads for charging?
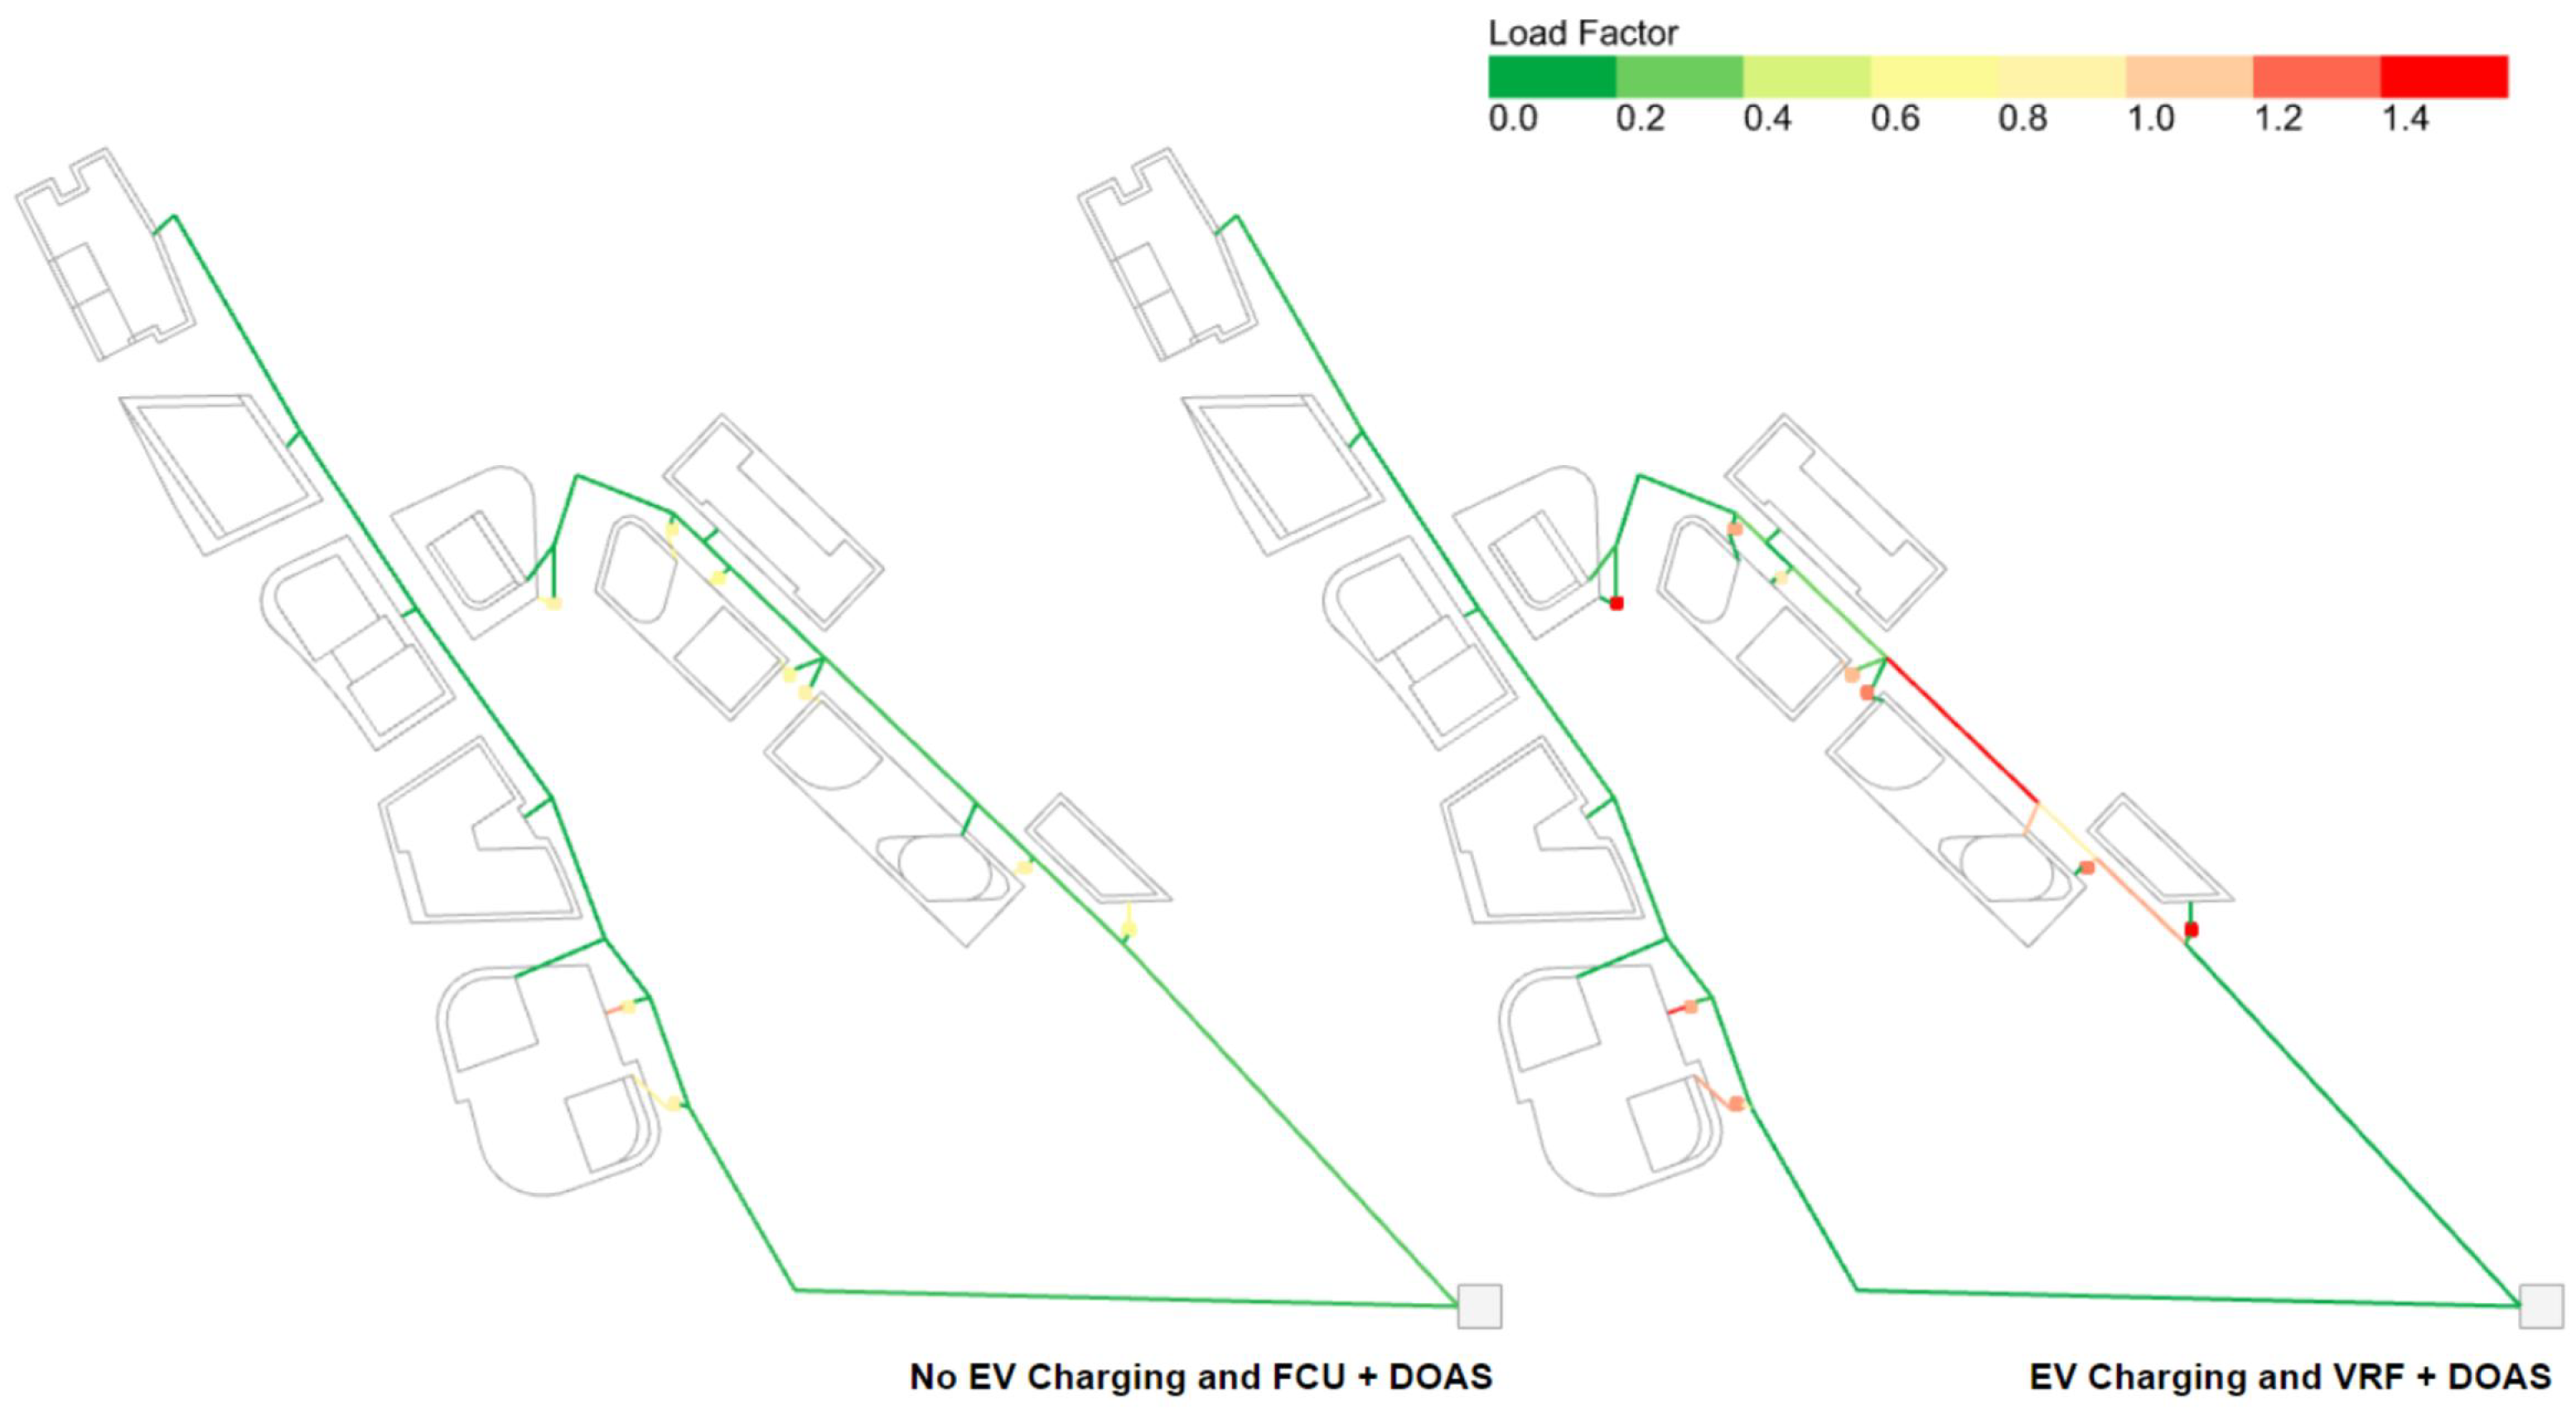
  • Given the building net electric load profiles (considering solar and batteries), is the planned design for the electric distribution system within the district (network topology, transformer/wire types, etc.) sufficient?

3. Results and Discussion

3.1. Scenario Analysis

Full simulations for the three different scenarios outlined in Section 2.2 were performed to investigate the technical questions for the Chicago district described in Section 2, as well as to evaluate the capabilities and potential improvements of the Dragonfly/URBANopt workflows. The technical findings are described for each analysis scenario in the following sections. In terms of toolset capabilities, findings indicate that the workflows allow for calculating performance metrics while iteratively changing the design. By connecting the Rhino 3D modeling tool and Grasshopper environment to simulation engines, the Dragonfly/URBANopt toolset can integrate with master planning workflows, which allows for this iterative design process.

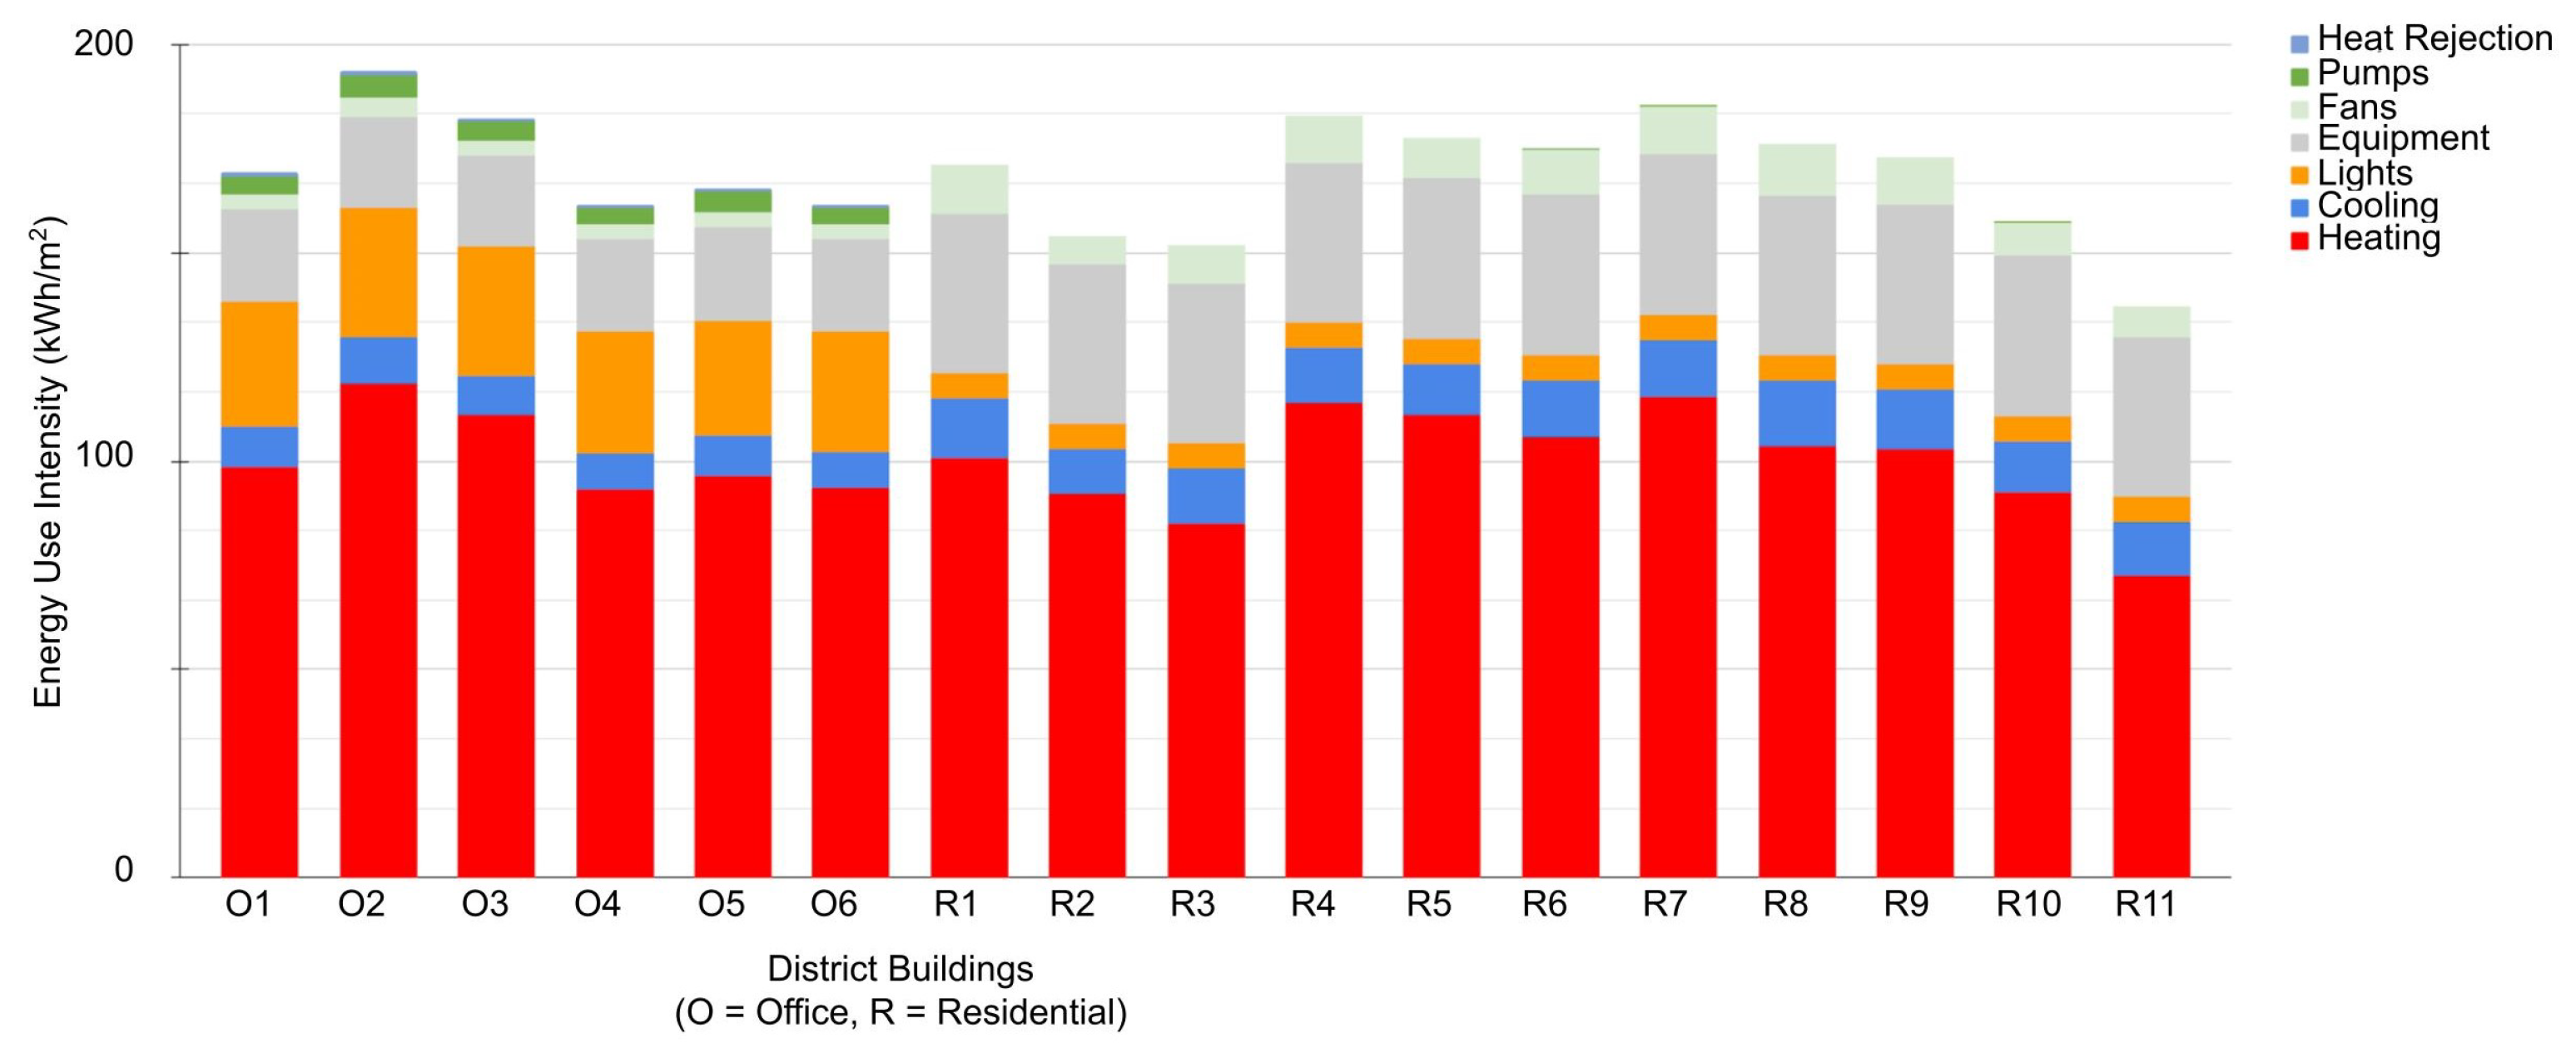
3.1.1. Baseline Scenario

The first set of simulated results included program and massing studies. The simulations, as indicated in Figure 10 and Figure 11, focused on first understanding how overall district energy consumption varies depending on the potential mix of programs given the project objectives and constraints, as well as the location and orientation of buildings. In the program massing studies, varying amounts of residential, retail and commercial office areas were simulated. Each square in the figure represents an individual building with a height of 45 m in order to maintain a uniform total gross floor area. For the pilot district in Chicago, a higher fraction of commercial buildings with higher internal heat gains tends to decrease overall energy consumption. Even though there is a cooling energy penalty associated with this program, given that Chicago is heating dominated, having a lower fraction of residential buildings, which have lower internal heat gains, tends to decrease district-wide site energy consumption. When considering building placement and orientation (Figure 11), it is beneficial to have taller buildings toward the north of the site to reduce self-shading in the district and take advantage of passive solar heating in the colder winter months. In these studies, the retail program constituted the first floor of the office buildings.
The results of these studies can be shared with the design team, the client and external stakeholders to help inform the earliest stages of the design process. Recommendations can be given on the ideal program mix as well as location of tall buildings in the site. The same studies can be combined with parametric design parameters within the Grasshopper environment as part of a large generative urban design framework providing flexibility and integration with existing urban planning design workflows.
The next set of results focuses on the simulation of district-wide energy usage considering detailed HVAC systems. For the baseline scenario, appropriate ASHRAE 90.1 Appendix G models were developed for each building based on their characteristics (e.g., residential vs. commercial). The commercial buildings were modeled with variable air volume (VAV) with hot water reheat and the residential buildings were modeled with packaged terminal air conditioners with baseboard heating. The logic for applying these detailed systems across the buildings of the model is provided by the OpenStudio Standards Gem, which automatically sets the HVAC equipment efficiencies and controls of the systems to align with requirements from standards (like ASHRAE 90.1); this is accomplished through an EnergyPlus sizing run of winter and summer design days to determine equipment capacity which informs the required efficiency. This not only reduces the time to build and swap out the HVAC system types in the models but also lowers the chances of making mistakes like setting up contradictory HVAC controls. The findings from this analysis are summarized in Figure 12, which shows the predicted annual energy consumption for 6 office buildings and 11 residential buildings. Overall, with the baseline systems, the pilot district has a predicted site energy use intensity of 168 kWh/m2.
The evaluation of a baseline scenario is important as it sets the minimum design performance against which building and district enhancement scenarios are compared. The baseline system definitions were readily applied to all district buildings with minimal changes to the input geometry. The workflow accepts curvilinear massing models provided by the design team and automatically generates thermally zoned energy models to be run without the need to simplify or planarize geometry. Visualizations were quickly generated using the workflow, meaning that the results can be readily shared with the design team and external stakeholders.

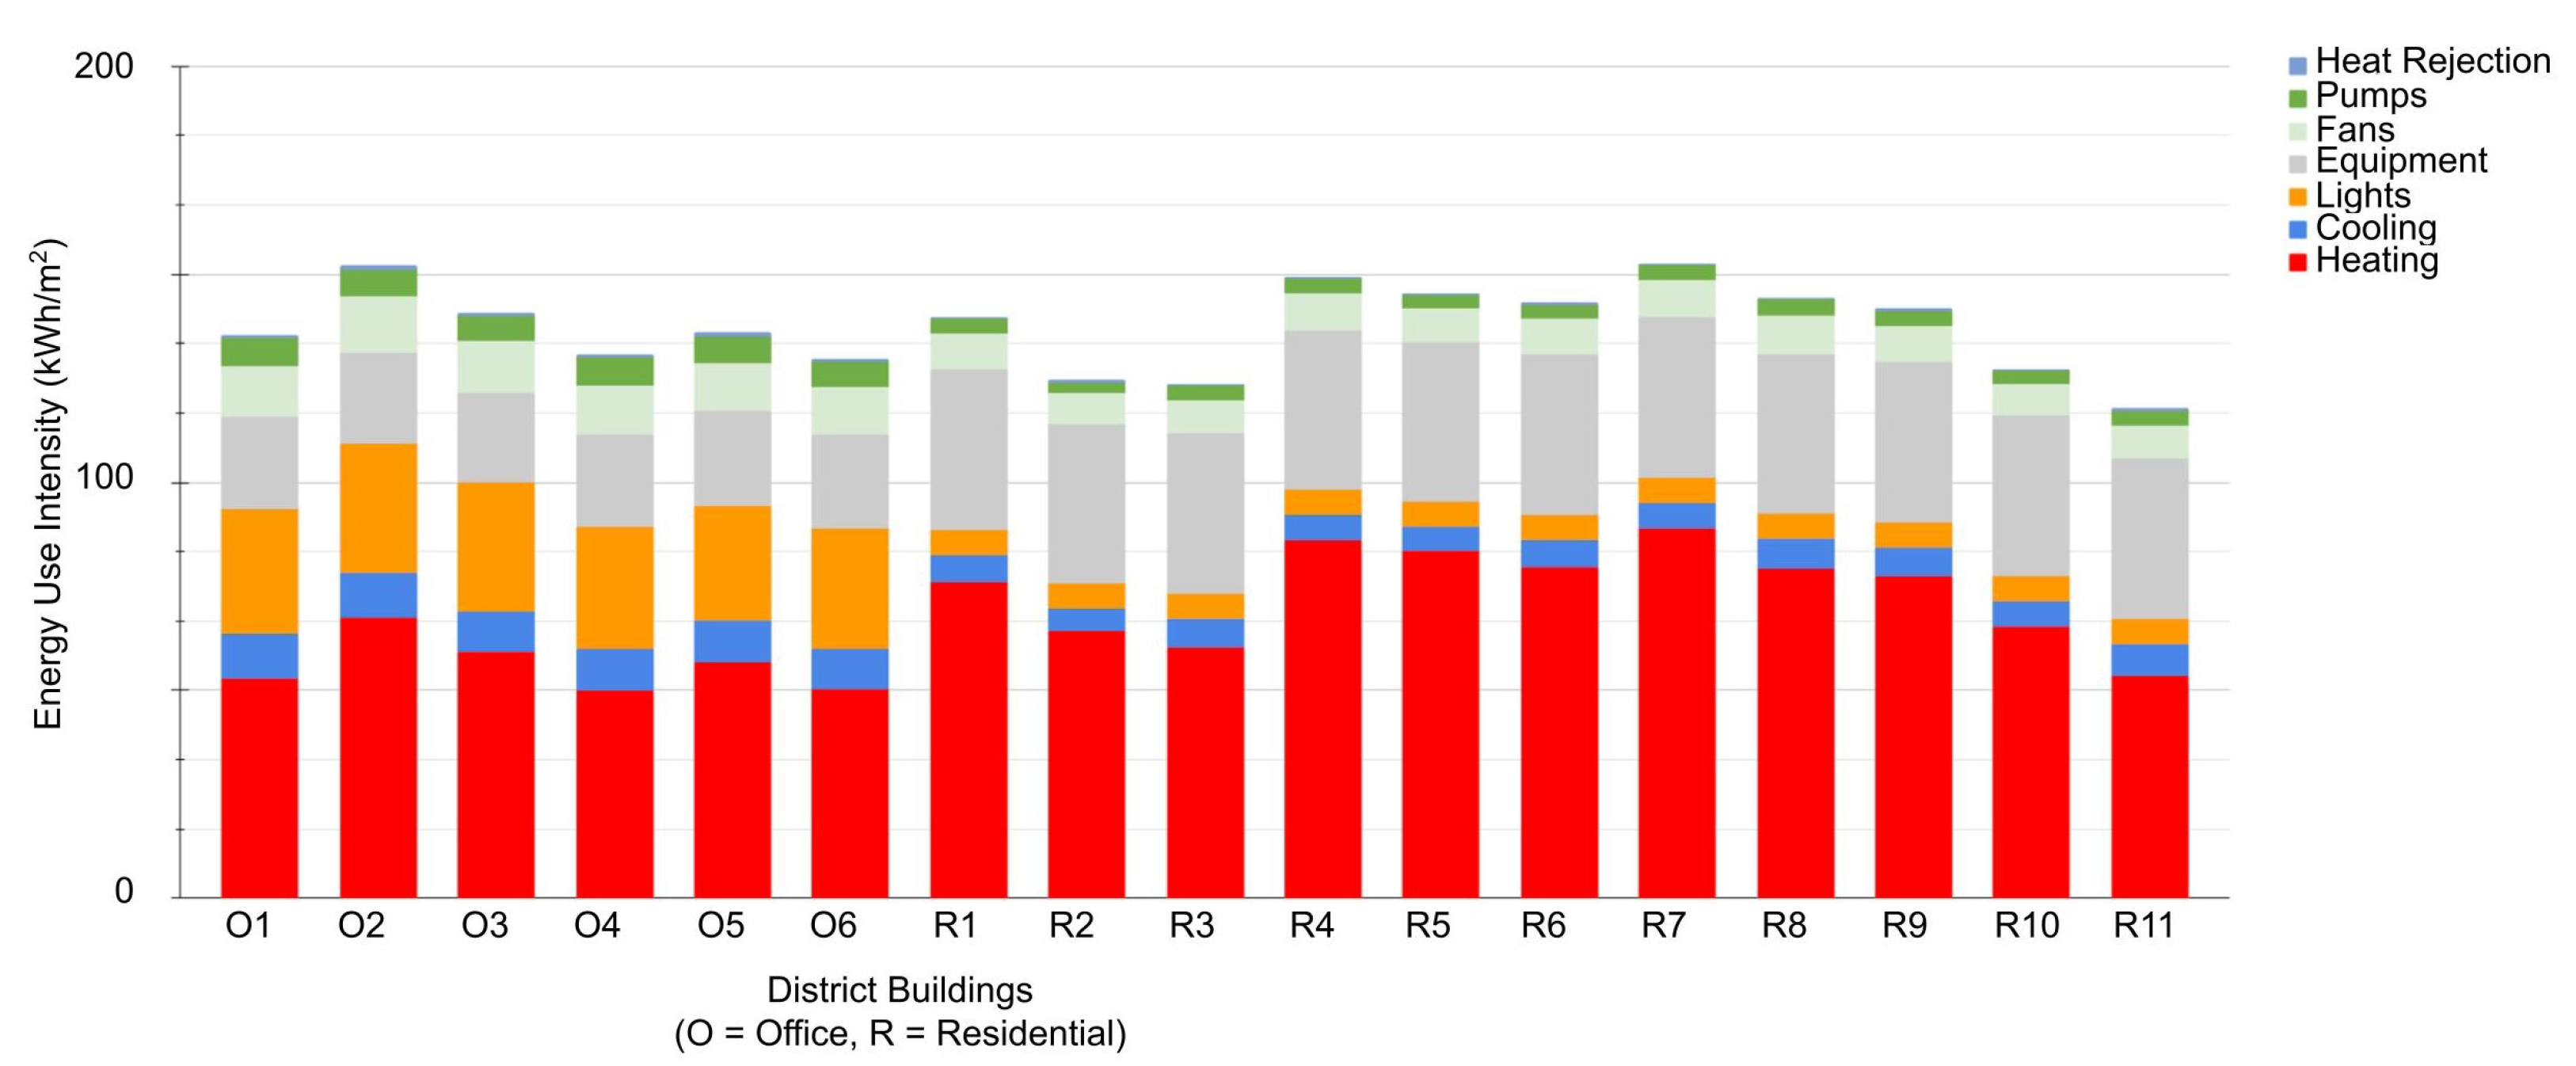
3.1.2. High-Efficiency Scenario

In the high-efficiency scenario, various ECMs were applied to the pilot district. These measures include daylight controls, upgraded HVAC systems, and natural ventilation operation. The implementation of these ECMs in the past was particularly difficult at the district scale in the typical SOM workflows and most results were post-processed. Previously used district energy simulation platforms could not simulate complex HVAC systems and they only had a limited ability to produce perimeter-core zoning, which decreased the accuracy of modeling ventilation and lighting upgrades. For example, with daylight controls applied, one daylight sensor is placed in each of the perimeter zones which receive ample daylight instead of one sensor in the middle of the entire floorplate, which may not receive adequate daylight levels.
The results of the upgraded HVAC systems, which involved switching the ASHRAE Appendix G systems to four-pipe fan coil units with heat recovery for all commercial and residential buildings, are shown in Figure 13.
Overall, by upgrading the HVAC system, an estimated 18% annual energy savings can be achieved over the entire district with an anticipated site energy use intensity of 137 kWh/m2 as shown in Table 1. By adding daylight controls, an estimated 4% additional savings can be achieved. By allowing for natural ventilation when ambient outdoor conditions are appropriate, an estimated 5% additional energy savings can be achieved.
In addition to reducing the annual energy consumption of the district, the upgrade to the higher-efficiency four-pipe fan coil units (FCU) with heat recovery and dedicated outdoor air system (DOAS) has a substantial impact on the predicted peak electric demand of the district on the cooling design day, as shown in Figure 14 as compared to the baseline VAV and packaged terminal air conditioner (PTAC) system. Thanks to the reduction in electricity needed to meet the cooling load, the overall peak electric consumption of the district drops from 17.45 to 15.03 MW. This estimated reduction of 14% could help avoid the need to build an additional 2.5 MW of electrical infrastructure for the district, or the power equivalent one or two typical-size wind turbines operating at maximum capacity [51].

3.1.3. District-Scale Systems Scenario

  • Potential for Shared District Thermal Systems
Given the mix of programs on site, as well as the differing operational schedules, one goal of simulation was to understand the degree of overlap (simultaneous heating and cooling) in district-wide heating and cooling loads. Such overlap indicates potential for a district thermal system that capitalizes on the rejected heat from cooling in certain buildings for the provision of space or water heating in other buildings. Figure 15 highlights the results of this thermal overlap analysis. By considering the service hot water requirements for the residential buildings as well as the high cooling demand for kitchens in ground-floor restaurants, the test district was found to have 14.62 GWh of annual thermal overlap, which is 26% of the total annual heating load that could potentially be met with waste heat from cooling. Most of this overlap occurs in the middle of the year when cooling requirements are high, but the residential buildings still require heating for hot water. This type of analysis provides initial screening that could be followed up by more detailed modeling of a specific heat pump-based district thermal system.
  • Impacts of Microclimate and Urban Heat Island Effect
Another key consideration for many districts is the potential impact of the urban heat island on thermal comfort/health and/or the annual energy consumption of the site. Characteristics of the urban area—most notably, the urban geometry, heat capacity of surface materials, and anthropogenic heat from street traffic—can affect local ambient air temperatures and thermal comfort conditions. This is particularly true for the dense pilot district considered in Chicago, so Dragonfly’s integration with the Urban Weather Generator (UWG) was used to assess this urban heat island impact. The UWG accomplishes this by performing an energy balance calculation of a street canyon that has geometric and thermal properties that are matched with that of a fully detailed district energy model. Based on the pilot district properties, the Chicago O’Hare airport weather [52] file is morphed to account for higher air temperatures of the urban environment. Figure 16 compares the average daily airport air temperature each month with that of the pilot district—obtained by passing the airport weather file through the UWG. Results indicate that the pilot district has nighttime air temperatures that are consistently higher than those at the airport location, with the most significant difference happening in May, where temperatures at midnight are an average of 2.8 °C warmer. The morphed weather file from the UWG was used in an energy simulation to understand the impact of the urban heat island on the energy use of the district. Accounting for the urban heat island effect in the pilot district results in an estimated 3.8% increase in cooling loads and 2.5% decrease in heating loads, together resulting in a net 1.0% annual decrease in energy consumption for the Chicago district.
  • Optimal PV/Battery Sizing
As the price of on-site renewables has fallen [53], the opportunity to profit from the installation of community scale PV systems has grown. It is often valuable to conduct preliminary screening analysis to quantify and optimize the life cycle cost of installing such systems. This is especially true for the Chicago pilot district, in which there is a strong desire from multiple stakeholders to incorporate renewable resources and to do so in a manner that maximizes the return on investment. Typical SOM workflows for evaluating PV are concerned with siting the panels in an optimal location and there is often no cost optimization to determine the initial size of the PV array or consideration for battery storage technologies.
The Dragonfly/URBANopt toolset leverages the REopt Lite API to optimize the size of both PV and battery storage systems for the lowest life cycle cost and the maximal return on investment. The 25 year cost-optimal system sizes were calculated for the higher-efficiency scenario of the Chicago pilot district, using local commercial electric utility rates from Commonwealth Edison Co [54], and a PV cost of $1288/kW, which is the projected cost of PV in 2026 [55] when it is anticipated the majority of district construction will occur. Based on this initial screening analysis, the cost-optimal system has a solar PV capacity of approximately 3500 kW, which effectively covers all roof area of the pilot district. This is not surprising for a highrise district where the ratio of roof area to total floor area is low. Across several scenarios of battery optimization, no cases were found where battery storage was profitable and this can be explained by the lack of significant demand charges in the local utility rate. Over 25 years, the installation of rooftop PV results in a net present value of $182,234 as shown in Table 2 (as compared to a BAU scenario with no on-site PV).
While the results in Table 2 clearly show that a profitable installation of PV is possible, it is worth highlighting that the current cost of PV is approximately $1600/kW and, at this price, the installation of PV in the district would not be profitable in comparison to the BAU scenario. However, through iterative runs of the REopt Lite API, it was found that a PV cost of $1360/kW would result in a “break even” life cycle cost, above which reasons other than financial gain may be needed to justify PV on the project. These REopt Lite calculations serve as a preliminary screening analysis and more detailed calculations based on specific PV system characteristics would need to be performed as a part of any future PV procurement process.
As shown in Figure 17, the deployment of PV across all rooftops of the district could offset a significant fraction of the district’s electrical consumption, especially during afternoon hours in summer.
  • Impacts of Electrification on Aggregate Loads and Peak Timing
Another consideration for a future district is the effect of EV charging on district electrical loads. As the prevalence and ubiquity of EVs increases, it is essential to account for the increased loads in the sizing of district electric infrastructure. This technical requirement is often posed as a question by stakeholders and is currently hard to estimate using standard methods. This is particularly so because charging load profiles are variable and depend on building use and the percentage of EV adoption. To address this, the Dragonfly/URBANopt workflows provide components that can model EV charging energy requirements based on building use or charging type (i.e., home, public, office) as well as the fraction of vehicles in the district that are electric. The charging type corresponds to the program mix in the district, in which some buildings are residential and EVs are generally charged during evening hours while others are commercial and EVs are generally charged during morning office hours. Figure 18 compares the electric load profile on an extreme cold winter day for three increasing district electrification scenarios: (1) a high-efficiency non-electric heating scenario with no EV charging, (2) a high-efficiency electric heating scenario with no EV charging, and (3) a high-efficiency electric heating scenario where 100% of the vehicles are considered to be electric. Note that the estimated magnitude of the peak load changes across all three scenarios and that the estimated timing of the peak load shifts from afternoon to morning when moving from Scenario 2 to 3 (adding 100% EV charging). The results of this analysis are layered into the overall district energy consumption as well as the electrical load profile, which can be used to estimate peak load equipment sizing and can be used by utility providers to inform the expected peak demand for the site.
  • Impacts of Electrification on Electric Infrastructure
The electrification of the district can also have significant impacts on the installed electrical infrastructure, including the loading of local electric lines and transformers. In order to understand whether the electrification of the district’s heating systems and higher adoption of EVs would necessitate the replacement of such electrical infrastructure (or the initial over-sizing of it), a simulation of the loading on the electrical infrastructure was run for both the non-electrified (fan coil unit [FCU] without EV) and the electrified (Variable Refrigerant Flow [VRF] with 50% EV) scenarios. The Dragonfly/URBANopt toolset includes a connection to the DiTTo/OpenDSS simulation engine, which is capable of modeling the loading of electric lines and transformers given the arrangement of these objects and their properties. Energy simulations were run for the full year for both the electrified and non-electrified scenarios and the peaks of the non-electrified scenario were used to size transformers and lines using standard sizing factors and typical methods that an electrical engineer might employ today [56].
The timeseries outputs of electric demand from the energy simulation were then passed to the OpenDSS model to determine the maximal loading on the various components of the system. For all electrical components, OpenDSS outputs a “load factor” with values under 1.0 indicating appropriate loading conditions, and values above 1.0 indicating overloading conditions. For the purposes of this study, it is assumed that equipment experiencing a peak load factor above 1.0 should be considered for upgrade/replacement, and equipment experiencing a peak load factor above 1.2 is in danger of failure and merits immediate replacement [57]. The peak loading of both scenarios is noted below with colors corresponding to cases where overloading might become a concern.
As shown in Figure 19, all of the infrastructure under the non-electrified scenario experienced a peak loading factor below 1.2, with the loading of all transformers being close to unity and the highest loading occurring on an electrical line with a load factor of 1.09. Under the electrified scenario, several of the transformers experience overloading, with the worst conditions occurring at a transformer with a load factor of 1.45. Furthermore, many of the lines that connect these transformers to the building experience overloading, with the worst conditions occurring on a line with a load factor of 1.49. Such high load factors indicate that overloaded infrastructure would have to be replaced in an electrification scenario like that modeled here. Alternatively, an engineer and broader project team might consider demand-limiting options such as flexible building loads, controlled EV charging, and electric battery storage. in addition to distribution infrastructure upgrades or initial oversizing. Such solutions can be further analyzed utilizing the URBANopt grid-interactivity modules. This preliminary analysis can help identify potential issues early in the planning process for different scenarios and can help guide the design and sizing of the infrastructure that will ultimately be determined by licensed professionals using their accepted calculation methods.

4. Conclusions

Many countries and cities across the world are setting climate goals and making commitments to emissions reductions. While climate commitments are being made at larger scales, it is at smaller scales where many specific projects, especially those that reduce emissions in the buildings sector, will occur. Districts and communities represent a critical scale of planning that offers several unique opportunities to achieve reductions in cost, energy and emissions, while also tailoring solutions to the specific needs of the residents that are sustainable, resilient, equitable and flexible.
To achieve these benefits, analytical capabilities are needed that integrate into common workflows and tools used by planners and architects. Such capabilities must not only be able to identify and optimize energy reduction opportunities in early design stages, but must also do so throughout the planning and design process. This paper introduced the combined Dragonfly/URBANopt toolset, which is composed of open-source software and is available to the broader UBEM community. It also demonstrated how SOM utilized this toolset to investigate key district-scale technical questions for a pilot district in Chicago. Lastly, it described how new capabilities can be integrated into typical architecture and master planning processes to ultimately make better-informed design decisions.
Examples of how the proposed workflows help advance UBEM capabilities include
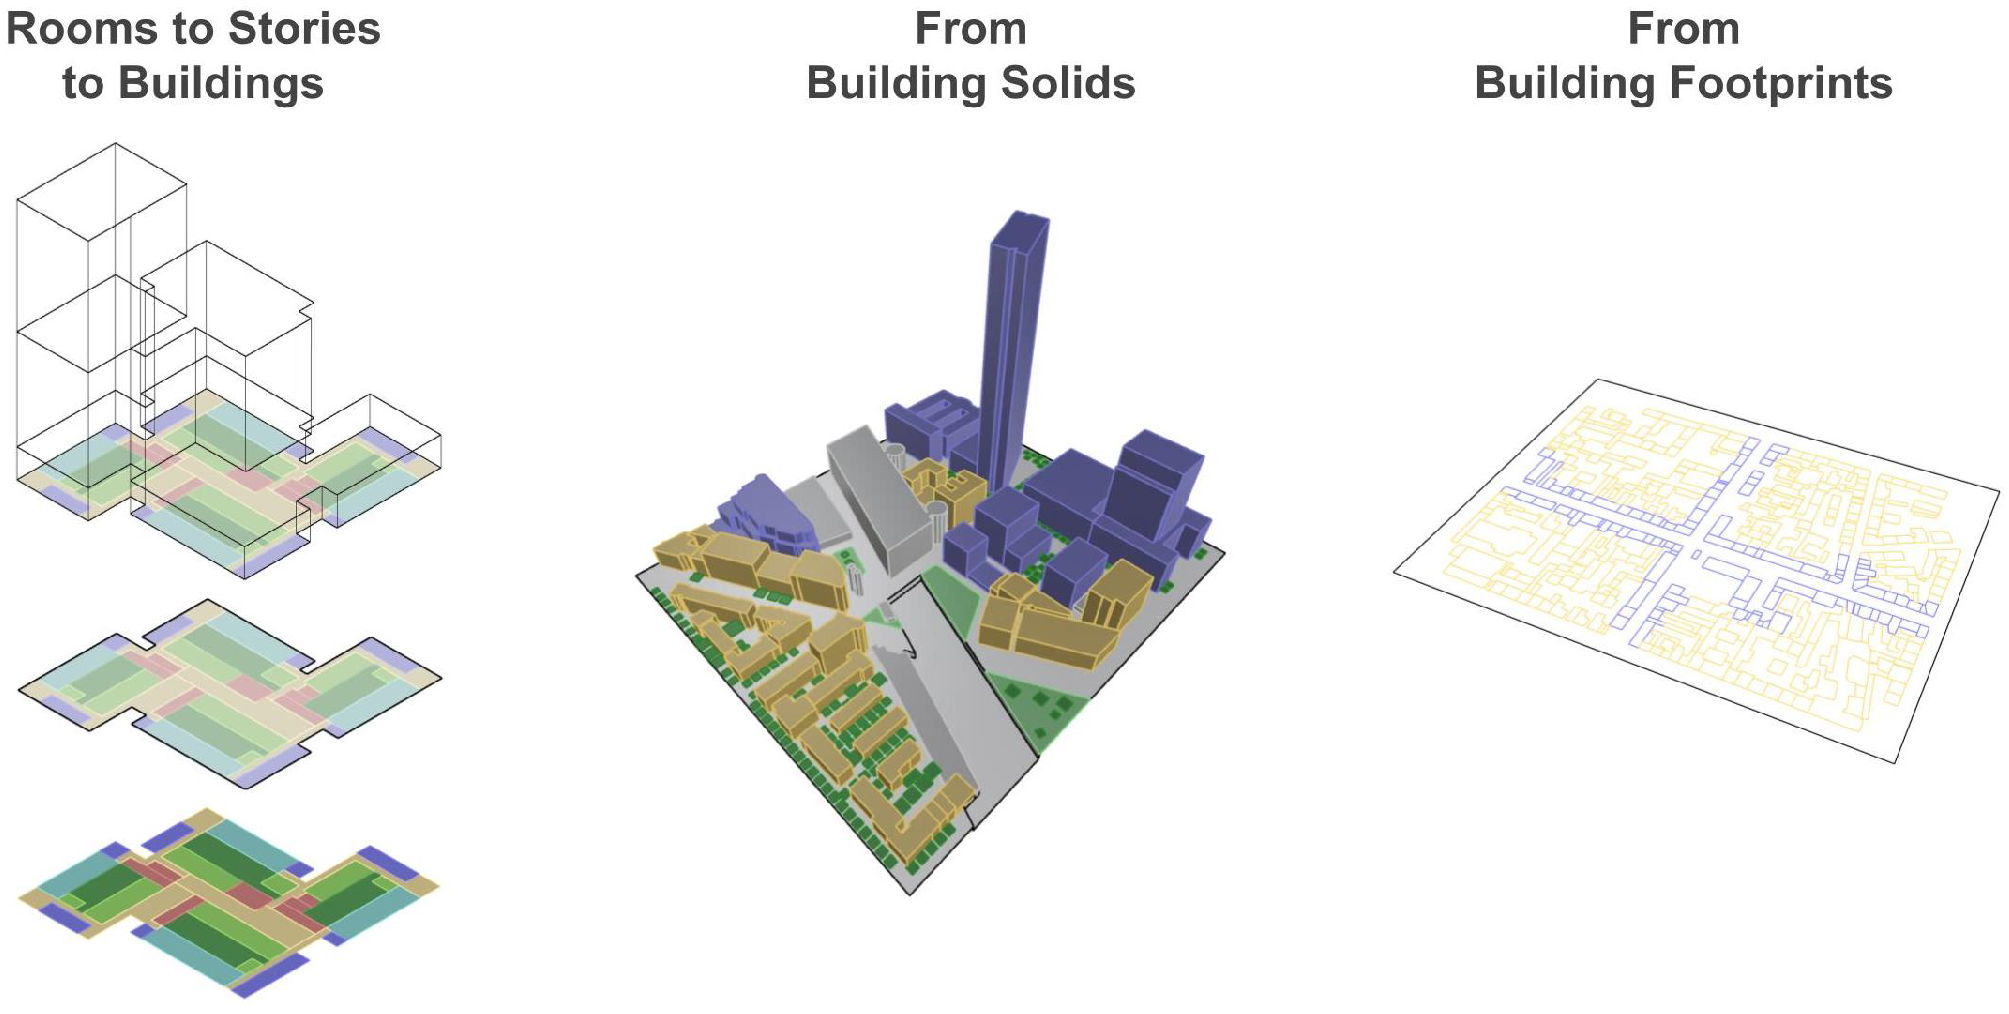
  • Supporting the creation of urban models from the wide range of geometry sources that designers typically use at different stages of the design and planning process (e.g., 2D building footprints, 3D building massing, 2D zoned floor plans, and detailed 3D room volumes).
  • Providing an integrated means of sending data between various simulation engines for community scale energy systems (e.g., PV, batteries, EVs, electric distribution systems), thereby unifying assumptions across these engines.
  • Making OpenStudio and EnergyPlus more accessible for UBEM, especially the libraries of standards and templates, which can help provide reasonable assumptions to fill information gaps in urban data sets.
SOM used Dragonfly/URBANopt to investigate several questions related to district-scale energy approaches for three scenarios: baseline, high-efficiency, and district-scale energy systems. The technical findings from the modeling of the Chicago district are presented and discussed in detail in Section 3. They indicate that, while energy savings can be achieved through typical architectural studies and enhancements to individual building efficiency, additional savings and insights can be achieved when considering district-scale energy systems. For example, studies revealed substantial simultaneous heating and cooling, particularly when accounting for service hot water demand, indicating that the district has potential to achieve waste heat recovery through a shared district thermal system. Furthermore, simulations indicated the potential to install rooftop PV systems with a negative life cycle cost if they are purchased at the anticipated time of buildout. Models also demonstrated the impact of future EV adoption and heating system electrification on the loading of electric distribution lines and transformers, suggesting that engineers and project teams might consider demand-limiting options such as flexible building loads, controlled EV charging, and electric battery storage in addition to distribution infrastructure upgrades or initial oversizing.
In terms of toolset capabilities, findings indicate that the workflows allow for calculating performance metrics while iteratively changing the design. By connecting the Rhino 3D modeling tool and Grasshopper environment to simulation engines, the Dragonfly/URBANopt toolset can integrate with master planning workflows. This enables an iterative design process that allows designers and planners to easily explore multiple design alternatives and optimize the design to meet multiple performance objectives.
Ongoing and planned future work is focused on expanding capabilities and addressing key limitations. Early-stage efforts are underway to develop a Blender [58] interface for Ladybug Tools, which would enable more end-to-end open-source workflows for practitioners. Further, the URBANopt SDK district energy system modules are under active development to support the modeling of different "generations" of district thermal energy systems, including modern central and distributed ambient loop heat pump-based systems. This work will enable potential integration of URBANopt district energy system capabilities with the Ladybug Tools platform and other end user-facing tools. The technical approach, which utilizes the Modelica Building Library [38] and Spawn of EnergyPlus [59], will also enable more detailed modeling of controls and operations at the district scale compared to the OpenStudio/EnergyPlus-based workflows described in this paper, which are primarily focused on earlier stages of planning and design.

Author Contributions

Conceptualization, T.C., C.M., A.I., B.P., S.R. and K.F.; methodology, T.C., C.M., A.I. and T.E.; software, T.C., C.M., A.I., B.P., S.R., K.F., R.E.K., N.M., T.E., D.C., M.S.R. and D.G.; formal analysis, T.C., C.M., A.I. and T.E.; resources, T.C., C.M., A.I., B.P., S.R. and M.S.R.; writing—original draft preparation, T.C., C.M., A.I. and B.P.; writing—review and editing, T.C., C.M., A.I., B.P., K.F., R.E.K., N.M., T.E., D.C. and D.G.; visualization, T.C., C.M., A.I., S.R. and M.S.R.; supervision, C.M., B.P., S.R. and K.F.; project administration, C.M., B.P., S.R. and K.F.; funding acquisition, C.M., B.P., S.R. and M.S.R. All authors have read and agreed to the published version of the manuscript.

Funding

This work was authored in part by the National Renewable Energy Laboratory, operated by Alliance for Sustainable Energy, LLC, for the U.S. Department of Energy (DOE) under Contract No. DE-AC36-08GO28308. Funding provided by U.S. Department of Energy Office of Energy Efficiency and Renewable Energy Building Technologies Office. The views expressed in the article do not necessarily represent the views of the DOE or the U.S. Government. The U.S. Government retains and the publisher, by accepting the article for publication, acknowledges that the U.S. Government retains a nonexclusive, paid-up, irrevocable, worldwide license to publish or reproduce the published form of this work, or allow others to do so, for U.S. Government purposes. APC was funded by the U.S. Department of Energy Office of Energy Efficiency and Renewable Energy Building Technologies Office.

Institutional Review Board Statement

Not applicable.

Informed Consent Statement

Not applicable.

Data Availability Statement

Not applicable.

Acknowledgments

The authors would like to thank Sarah Zaleski, Amir Roth, William Livingood, and Luke Leung for their guidance; Ted Kwasnik and Sakshi Mishra for their prior contributions to URBANopt-REopt; Michael Deru for his advice and feedback; Lauren Klun for project management support and Caitlin Dorsey, Christopher Schwing, and Marjorie Schott for communications and graphics support. Finally, the authors would like to recognize that URBANopt is a collaborative open-source project and that additional URBANopt capabilities and modules are being developed by a team that includes NREL, Lawrence Berkeley National Laboratory, the University of Colorado Boulder, and several other partners; these additional capabilities will be the focus of follow-on publications.

Conflicts of Interest

The authors declare no conflict of interest.

References

  1. United Nations. World Urbanization Prospects: The 2018 Revision; Technical Report; United Nations: New York, NY, USA, 2019. [Google Scholar]
  2. United Nations Human Settlements Programme. World Cities Report 2020: The Value of Sustainable Urbanization; Technical Report; United Nations: Nairobi, Kenya, 2020. [Google Scholar]
  3. International Institute for Sustainable Development. 77 Countries, 100+ Cities Commit to Net Zero Carbon Emissions by 2050 at Climate Summit. 2019. Available online: sdg.iisd.org/news/77-countries-100-cities-commit-to-net-zero-carbon-emissions-by-2050-at-climate-summit/ (accessed on 28 July 2021).
  4. Data-Driven EnviroLab & NewClimate Institute. Accelerating Net Zero: Exploring Cities, Regions, and Companies’ Pledges to Decarbonise; Technical Report; Data-Driven EnviroLab & NewClimate Institute: Chapel Hill, NC, USA, 2020. [Google Scholar]
  5. International Energy Agency. Tracking Buildings 2020. 2020. Available online: https://www.iea.org/reports/tracking-buildings-2020 (accessed on 28 July 2021).
  6. U.S. Energy Information Administration. International Energy Outlook 2019: With Projections to 2050. Technical Report; 2019. Available online: https://www.eia.gov/outlooks/ieo/pdf/ieo2019.pdf (accessed on 28 July 2021).
  7. U.S. Department of Energy. Better Buildings Challenge. Available online: https://betterbuildingssolutioncenter.energy.gov/challenge (accessed on 28 July 2021).
  8. U.S. Department of Energy. A National Roadmap for Grid-Interactive Efficient Buildings. Technical Report; 2021. Available online: https://gebroadmap.lbl.gov/A%20Nationał%20Roadmap%20for%20GEBs%20-%20Final.pdf (accessed on 28 July 2021).
  9. U.S. General Services Administration. GSA Commits to Renewable Energy, Pledging 100 Percent Renewable Electric Resources by 2025. 2021. Available online: https://www.gsa.gov/about-us/newsroom/news-releases/gsa-commits-to-renewable-energy-pledging-100-percent-renewable-electric-resources-by-2025-04222021 (accessed on 28 July 2021).
  10. Caputo, P.; Costa, G.; Manfren, M. Paradigm shift in urban energy systems through distributed generation. In Methods and Models; Paperback: London, UK, 2010. [Google Scholar]
  11. Ecodistricts. Why Cities Need Ecodistricts. 2021. Available online: https://ecodistricts.org/about/why-cities-need-ecodistricts/ (accessed on 28 July 2021).
  12. Zaleski, S.; Pless, S.; Polly, B. Communities of the Future: Accelerating Zero Energy District Master Planning; Technical Report; NREL: Golden, CO, USA, 2018.
  13. Olgyay, V.; Coan, S.; Webster, B.; Livingood, W. Connected Communities: A Multi-Building Energy Management Approach; NREL: Golden, CO, USA, 2020.
  14. Polly, B.; Pless, S.; Houssainy, S.; Torcellini, P.; Livingood, W.; Zaleski, S.; Jungclaus, M.; Hootman, T.; Craig, M. A Guide to Energy Master Planning of High-Performance Districts and Communities; Technical Report; NREL: Golden, CO, USA, 2020.
  15. Reinhart, C.F.; Davila, C.C. Urban building energy modeling–A review of a nascent field. Build. Environ. 2016, 97, 196–202. [Google Scholar] [CrossRef] [Green Version]
  16. Reyna, J.; Roth, A.; Burr, A.; Specian, M. How Can Cities Use Urban-Scale Building Energy Modeling? In Technical Report, 2018 ACEEE Summer Study on Energy Efficiency in Buildings; NREL: Golden, CO, USA, 2018. [Google Scholar]
  17. Tian, W.; Choudhary, R. A probabilistic energy model for non-domestic building sectors applied to analysis of school buildings in greater London. Energy Build. 2012, 54, 1–11. [Google Scholar] [CrossRef] [Green Version]
  18. Davila, C.C.; Reinhart, C.; Bemis, J. Modeling Boston: A workflow for the generation of complete urban building energy demand models from existing urban geospatial datasets. Energy 2016, 117, 237–250. [Google Scholar] [CrossRef]
  19. Moghadam, S.T.; Delmastro, C.; Corgnati, S.P.; Lombardi, P. Urban energy planning procedure for sustainable development in the built environment: A review of available spatial approaches. J. Clean. Prod. 2017, 165, 811–827. [Google Scholar] [CrossRef]
  20. Hong, T.; Chen, Y.; Luo, X.; Luo, N.; Lee, S.H. Ten questions on urban building energy modeling. Build. Environ. 2020, 168, 106508. [Google Scholar] [CrossRef] [Green Version]
  21. Ferrando, M.; Causone, F.; Hong, T.; Chen, Y. Urban building energy modeling (UBEM) tools: A state-of-the-art review of bottom-up physics-based approaches. Sustain. Cities Soc. 2020, 62, 102408. [Google Scholar] [CrossRef]
  22. Sola, A.; Corchero, C.; Salom, J.; Sanmarti, M. Multi-domain urban-scale energy modelling tools: A review. Sustain. Cities Soc. 2020, 54, 101872. [Google Scholar] [CrossRef]
  23. Li, W.; Zhou, Y.; Cetin, K.; Eom, J.; Wang, Y.; Chen, G.; Zhang, X. Modeling urban building energy use: A review of modeling approaches and procedures. Energy 2017, 141, 2445–2457. [Google Scholar] [CrossRef]
  24. Fonseca, J.A.; Nguyen, T.A.; Schlueter, A.; Marechal, F. City Energy Analyst (CEA): Integrated framework for analysis and optimization of building energy systems in neighborhoods and city districts. Energy Build. 2016, 113, 202–226. [Google Scholar] [CrossRef]
  25. City Energy Analyst. Grasshopper-CEA Part 1. 2021. Available online: https://cityenergyanalyst.com/blog/2019/5/2/gtc01 (accessed on 28 July 2021).
  26. Stuttgart University of Technology. SimCity2: Overview and Project Goals. 2021. Available online: https://simstadt.hft-stuttgart.de/de/index.jsp (accessed on 28 July 2021).
  27. Ferrando, M.; Causone, F. An overview of urban building energy modelling (UBEM) tools. Build. Simul. 2020, 16, 3452–3459. [Google Scholar]
  28. Reinhart, C.; Dogan, T.; Jakubiec, J.A.; Rakha, T.; Sang, A. Umi-an urban simulation environment for building energy use, daylighting and walkability. In Proceedings of the 13th Conference of International Building Performance Simulation Association, Chambery, France, 26–28 August 2013; Volume 1, pp. 476–483. [Google Scholar]
  29. Crawley, D.B.; Lawrie, L.K.; Pedersen, C.O.; Winkelmann, F.C. Energy plus: Energy simulation program. ASHRAE J. 2000, 42, 49–56. [Google Scholar]
  30. Ward, G.; Shakespeare, R. Rendering with Radiance: The Art and Science of Lighting Visualization; Morgan Kaufmann Publishers: San Francisco, CA, USA, 1998. [Google Scholar]
  31. Ellis, P. District Zero: A Decision-Making Tool for Net-Zero Communities. 2018. Available online: https://www.districtenergy.org/HigherLogic/System/DownloadDocumentFile.ashx?DocumentFileKey=dc41ad96-8d82-089c-5b08-4a0f88333468&forceDialog=0 (accessed on 28 July 2021).
  32. Allegrini, J.; Orehounig, K.; Mavromatidis, G.; Ruesch, F.; Dorer, V.; Evins, R. A review of modelling approaches and tools for the simulation of district-scale energy systems. Renew. Sustain. Energy Rev. 2015, 52, 1391–1404. [Google Scholar] [CrossRef]
  33. Sola, A.; Corchero, C.; Salom, J.; Sanmarti, M. Simulation tools to build urban-scale energy models: A review. Energies 2018, 11, 3269. [Google Scholar] [CrossRef] [Green Version]
  34. Keirstead, J.; Jennings, M.; Sivakumar, A. A review of urban energy system models: Approaches, challenges and opportunities. Renew. Sustain. Energy Rev. 2012, 16, 3847–3866. [Google Scholar] [CrossRef] [Green Version]
  35. Aghamolaei, R.; Shamsi, M.H.; Tahsildoost, M.; O’Donnell, J. Review of district-scale energy performance analysis: Outlooks towards holistic urban frameworks. Sustain. Cities Soc. 2018, 41, 252–264. [Google Scholar] [CrossRef]
  36. Polly, B.; El Kontar, R.; Charan, T.; Fleming, K.; Moore, N.; Goldwasser, D.; Long, N. URBANopt: An Open-Source Software Development Kit for Community and Urban District Energy Modeling; Technical Report; NREL: Golden, CO, USA, 2020.
  37. Guglielmetti, R.; Macumber, D.; Long, N. OpenStudio: An Open Source Integrated Analysis Platform; Technical Report; NREL: Golden, CO, USA, 2011.
  38. Wetter, M.; Zuo, W.; Nouidui, T.S.; Pang, X. Modelica buildings library. J. Build. Perform. Simul. 2014, 7, 253–270. [Google Scholar] [CrossRef]
  39. Ladybug Tools. Available online: https://www.ladybug.tools/ (accessed on 28 July 2021).
  40. URBANopt SDK Documentation. Available online: https://docs.urbanopt.net/ (accessed on 28 July 2021).
  41. OpenDSS. Available online: https://sourceforge.net/projects/electricdss/ (accessed on 28 July 2021).
  42. Mishra, S.; Pohl, J.; Laws, N.; Cutler, D.; Kwasnik, T.; Becker, W.; Zolan, A.; Anderson, K.; Olis, D.; Elgqvist, E. Computational framework for behind-the-meter DER techno-economic modeling and optimization: REopt Lite. Energy Syst. 2021, 1–29. [Google Scholar] [CrossRef]
  43. OpenStudio Measure Writer’s Reference Guide. Available online: https://nrel.github.io/OpenStudio-user-documentation/reference/measure_writing_guide/ (accessed on 28 July 2021).
  44. OpenStudio Standards. Available online: https://rubygems.org/gems/openstudio-standards (accessed on 28 July 2021).
  45. Building Component Library. Available online: https://bcl.nrel.gov/ (accessed on 28 July 2021).
  46. Elgindy, T.; Gensollen, N.; Krishnamurthy, D.; Rossol, M.; Hale, E.; Palmintier, B. DiTTo (Distribution Transformation Tool); Technical Report; NREL: Golden, CO, USA, 2018.
  47. Pless, S.; Allen, A.; Goldwasser, D.; Myers, L.; Polly, B.; Frank, S.; Meintz, A. Integrating Electric Vehicle Charging Infrastructure into Commercial Buildings and Mixed-Use Communities: Design, Modeling, and Control Optimization Opportunities; Technical Report; NREL: Golden, CO, USA, 2020.
  48. Wood, E.W.; Rames, C.L.; Bedir, A.; Crisostomo, N.; Allen, J. California Plug-In Electric Vehicle Infrastructure Projections: 2017-2025-Future Infrastructure Needs for Reaching the State’s Zero Emission-Vehicle Deployment Goals; Technical Report; NREL: Golden, CO, USA, 2018.
  49. Honeybee OpenStudio Gem. Available online: https://rubygems.org/gems/honeybee-openstudio (accessed on 28 July 2021).
  50. ANSI/ASHRAE/IES 90.1. Energy Standard for Buildings Except Low-Rise Residential Buildings. 2013. Available online: https://webstore.ansi.org/standards/ashrae/ansiashraeiesstandard902013 (accessed on 28 July 2021).
  51. How Much Wind Energy Does It Take to Power an Average Home? Available online: https://www.usgs.gov/faqs/how-much-wind-energy-does-it-take-power-average-home (accessed on 28 July 2021).
  52. Chicago Weather File. Available online: https://energyplus.net/weather-region/north_and_central_america_wmo _region_4/USA/IL/Chicago-OHare%20Intl%20AP%20725300%20%28TMY3%29 (accessed on 8 September 2021).
  53. Donohoo-Vallett, P. Revolution… Now the Future Arrives for Five Clean Energy Technologies–2016 Update; Technical Report; DOE, EERE: Washington, DC, USA, 2016.
  54. Open Energy Information. Available online: https://openei.org/apps/IURDB/rate/view/5cc755b05457a39273e327dc (accessed on 28 July 2021).
  55. NREL Annual Technology Baseline. Available online: https://atb.nrel.gov/ (accessed on 28 July 2021).
  56. Muratori, B. IEEE standard for calculating the current-temperature relationship of bare overhead conductors. IEEE Stand. 2013, 738–2012. [Google Scholar] [CrossRef]
  57. Powertech Labs. Impact of Emergency Operating Temperatures on the Integrity of XLPE Transmission Cable Systems. Technical Report. Available online: https://www.epri.com/research/products/1001859 (accessed on 28 July 2021).
  58. Blender. Available online: https://www.blender.org/ (accessed on 8 September 2021).
  59. Spawn of EnergyPlus. Available online: https://www.energy.gov/eere/buildings/downloads/spawn-energyplus-spawn (accessed on 8 September 2021).
Figure 1. Urban geometry workflows currently supported by the Dragonfly plugin.
Energies 14 05931 g001
Figure 2. URBANopt modules. Available online: https://docs.urbanopt.net/ (accessed on 28 July 2021).
Energies 14 05931 g002
Figure 3. URBANopt SDK Gem structure. Available online: https://docs.urbanopt.net/ (accessed on 28 July 2021).
Energies 14 05931 g003
Figure 4. URBANopt SDK Gem structure.
Energies 14 05931 g004
Figure 5. Dragonfly integration with Rhino/Grasshopper and URBANopt.
Energies 14 05931 g005
Figure 6. Example Dragonfly spatial visualizations where geometry is colored based on simulation output.
Energies 14 05931 g006
Figure 7. Example Dragonfly temporal visualizations.
Energies 14 05931 g007
Figure 8. Rhino and Grasshopper workflows.
Energies 14 05931 g008
Figure 9. Dragonfly/URBANopt integration in different design phases.
Energies 14 05931 g009
Figure 10. Simulation results from the program design phase.
Energies 14 05931 g010
Figure 11. Simulation results from the massing design phase.
Energies 14 05931 g011
Figure 12. ASHRAE 90.1 Appendix G systems energy simulation results.
Energies 14 05931 g012
Figure 13. Annual energy results for upgraded HVAC systems.
Energies 14 05931 g013
Figure 14. Peak electric profiles on the cooling design day for baseline and high-efficiency HVAC systems.
Energies 14 05931 g014
Figure 15. Thermal overlap considerations with and without service hot water and retail program.
Energies 14 05931 g015
Figure 16. Typical day temperature profiles for urban and rural areas.
Energies 14 05931 g016
Figure 17. Average daily electricity consumption/source profiles.
Energies 14 05931 g017
Figure 18. Hourly electric load profile for scenarios of increasing electrification during an extreme cold day.
Energies 14 05931 g018
Figure 19. Peak loading of electrical infrastructure between electrified and non-electrified scenarios.
Energies 14 05931 g019
Table 1. Energy savings by implementing energy conservation measures (ECMs).
ECMEnergy SavingsEUI (kWh/m2)
Upgrading HVAC system18%137
Adding daylight controls4%131
Adding natural ventilation5%124
Table 2. Life cycle cost analysis of rooftop PV utilizing URBANopt REopt Gem.
Cost-Optimal Rooftop Solar PV Capacity3503 kW
25 Year Operational Electricity Cost (BAU)$41,092,275
25 Year Operational Electricity Cost with PV$37,852,778
25 Year PV + Electricity Life Cycle Cost$40,912,481
Publisher’s Note: MDPI stays neutral with regard to jurisdictional claims in published maps and institutional affiliations.

