
Review of Zero Energy Building Concept-Definition and Developments in Latin America: A Framework Definition for Application in Panama


1
Research Group in Energy and Comfort in Bioclimatic Buildings, Faculty of Mechanical Engineering, Universidad Tecnológica de Panamá, Avenida Domingo Díaz, Ciudad de Panamá 0819, Panama
2
Centro de Estudios Multidisciplinarios en Ciencias, Ingeniería y Tecnología (CEMCIT-AIP), Ciudad de Panamá 0819, Panama
3
Groupe Recherche Environnement, Confort, Conception Architecturale et Urbaine (GRECCAU), EA 7482, ENSAP Bordeaux, F-33400 Talence, France
*
Author to whom correspondence should be addressed.
Energies 2021, 14(18), 5647; https://doi.org/10.3390/en14185647
Submission received: 17 July 2021
/
Revised: 1 September 2021
/
Accepted: 5 September 2021
/
Published: 8 September 2021
(This article belongs to the Special Issue Challenges and Research Trends of Building Energy Performance)
Abstract
:In recent decades, European countries have developed concepts, definitions, and construction technologies for Zero Energy Building (ZEB) that are effective and correspond to their specific climates. Latin American countries are still trying to find adequate solutions which respond to the local climatic, cultural, social, technical, and economic context. As such, this paper aims to establish the basis of the minimum energy efficiency and the renewable threshold for the definition of ZEB in order to better understand the application in Panama, based on assessing the energy regulations implemented in Panama. To achieve this aim, a review concentrated on the concept-definition and implementation adopted by Latin American countries is presented first before the paper converges into defining a framework for application in Panama. Finally, a case-study-based theoretical framework proposing a ZEB definition for Panama is discussed. The results of this study showed a net primary energy balance, of which the range falls into a plus energy building definition, indicating that all of the cases studied could supply their electricity needs using Photovoltaic generation. All dwellings studied have the potential to become a plus energy building, depending on the available roof surface area. Finally, a strengths, weaknesses, opportunities and threats analysis is presented in order to assess and support the introduction of such a ZEB definition and framework.
1. Introduction
Climate change is a problem that has received substantial interest. To mitigate greenhouse gas (GHG) emissions, the cooperation of different sectors is important; alliances, such as Paris Agreement and the Marrakesh Agreement, and the 17 sustainable development goals have established goals for decreasing GHG emissions. This is because greenhouse gas emissions impact the economy, society, and the environment [1].
In recent years, the effects of climate change have been causing disasters in different countries. The effects of global temperature and greenhouse gas emissions have increased drastically. In the European Union (EU), the building sector is responsible for approximately 40% of the total energy consumption and the EU is forecasting additional expansion [2]. As such, techniques in the construction of residential, hospitals, offices, and commercial buildings can help to mitigate the impacts in the building sector. The European Community began implementing the concept of Net-Zero Energy Buildings (NZEB) and new policies for the construction of new buildings. European policies are focused on reducing energy consumption in buildings in order to achieve the EU 2020 goals [3], and by 2050, all major business sectors must operate in a state of zero carbon emissions [1]. According to the member states of the EU, the implementation of NZEBs represents one of the biggest opportunities for increasing energy savings and reducing greenhouse gas emissions.
The EU legislative framework has been significantly strengthened in recent years through changes to the Energy Performance of Buildings (EPBD, 2010/31/EU) and the Renewable Energy Directive (RED, 2009/28/EC). Both directives outline the conditions needed to achieve nearly Zero Energy Buildings (nZEB) by 2020, and all member states must integrate these requirements into national legislation, as well as setting appropriate market instruments and financial frameworks to allow for the wide implementation of these ambitious targets [4]. A minimum energy efficiency threshold has been implemented in European countries, using proposed indicators [5] to effectively move towards nZEB in a more robust framework.
The progress and implementation of NZEBs around the world have different indicator values depending on their climate, the concepts that have been developed, construction techniques. As such, there is still a gap concerning national NZEB definition.
Each country must develop its own NZEB concept. In this way, new designs can be developed to reduce the amount of energy used in new buildings. Different studies present definitions for NZEB [4,6,7,8], and these differ according to the regulations and climatic conditions of the country in question.
Some countries in Europe have not yet settled on a regulation or clearly defined concept of NZEB. Romania and Portugal both presented problems, such as the absence of professional knowledge in the design and construction of NZEBs, an absence of local construction materials to scope a high standard, and the absence of local HVAC equipment to allow for high energy performance [9].
In Greece, the contribution of a new Building Energy Performance Regulation (REPB) was analyzed in a case study focusing on two residential buildings: a single residence and building with multiple residences (15 apartments) [10]. Here, the requirements set before by the regulation of thermal insulation and after the application of the REPB for the four climates zones of Greece were examined. The assessment was based on a numerical analysis using the national calculation tool for building energy performance, “TEE KENAK”, and the Technical Guidelines of the Technical Chamber of Greece. The results show that the implementation of the REPB significantly reduced the required heating loads for space heating in all climate zones by 37% to 48% for both building types. This was mainly attributed to the reduction of heat transfer coefficient (U-value) of the building envelope. In addition, active strategies, such as the improvement of electromechanical systems performance by the installing of flat plate solar collectors for domestic hot water heating, produced significant energy savings, in the range of 51–58%.
In Portugal and Spain, the requirements for building renovation through the transforming of the existing buildings into nearly zero energy buildings (nZEB), were analyzed in relation to a three-story residential building through the use of numerical simulation [11]. In both countries, it was necessary to change the active systems in order to achieve nZEB requirements and to retrofit the envelope, achieving more restrictive U-values, for major renovations as good practice towards the decarbonization of the residential sector. The results showed that applying the nZEB standards to the renovation of the multi-family buildings in both countries significantly contributed to the decarbonization of the building stock for this type of building typology, with reductions of 80–96% of CO2 emissions in Portugal and 71–94% in Spain.
Moreover, the authors in [12] analyzed the evolution of the Energy Saving of the Technical Building Code (CTE-DB-HE) for residential and non-residential sectors in Spain, taking into account aspects and changes during the last 15 years. They compiled the requirements necessary to achieve nZEB, such as reducing the limit value of energy efficiency by zone and the total installed power per lighted area, establishing a series of conditions for controlling heating and cooling demands, highlighting the global heat transfer coefficient and limitations to the building thermal envelope.
On the other hand, a case study based in Cyprus discussed the impact of the implementation of the Energy Performance of the European Union Buildings Directive (EPBD) on the Energy Performance of the Cyprus Land Development Corporation Buildings [13].
In [14], a review of net-zero energy buildings in hot and humid climates was studied in order to summarize NZEB key design strategies, technology choices, and energy performance. A summary of current policies of zero-energy buildings worldwide was discussed, but none from Latin America were included. Few humid tropical countries have related policies. It is essential to implement policies and incentives, and to follow up on this type of proposal, to ensure a stronger adoption of NZEBs in hot and humid climate regions.
Implementing NZEB policies is only one part of the process, and social and financial aspects must also be considered for effective execution. A study conducted in Singapore [15] adopts the Triple Bottom Line (TBL) principles: social, environmental, and financial. The results provided a framework and modeled cases for design insights and parametric designs. In addition, differences are found between the case study results based in a tropical climate and results from those studies based in non-tropical climates. This aspect indicates the need for case studies conducted in regions with a humid tropical climate. An approach to calculate the net present value (net difference between the profits and costs of the system in present or annual values) and discounted payback period (the minimum time it takes to recoup investment costs) of BIPV to achieve nZEB was presented in [16], in relation to four case studies located in Milan, Brazil, Shanghai and Awali. Simulation showed that the NPV value of environmental and societal advantages for the studied countries could vary from 1403 USD per watt peak to even 2710 USD per watt peak, depending on the values of the examined factors for each case study.
Using dynamic and parametric simulation models, Li et al. [17] analyzed two aspects in order to maximize on-site renewable energy supply as pathways to reach the net-zero energy target by the sector of net-zero energy buildings. The results and findings focused on the design and deployment of the residential net-zero energy buildings integrated with solar energy in hot and humid climates.
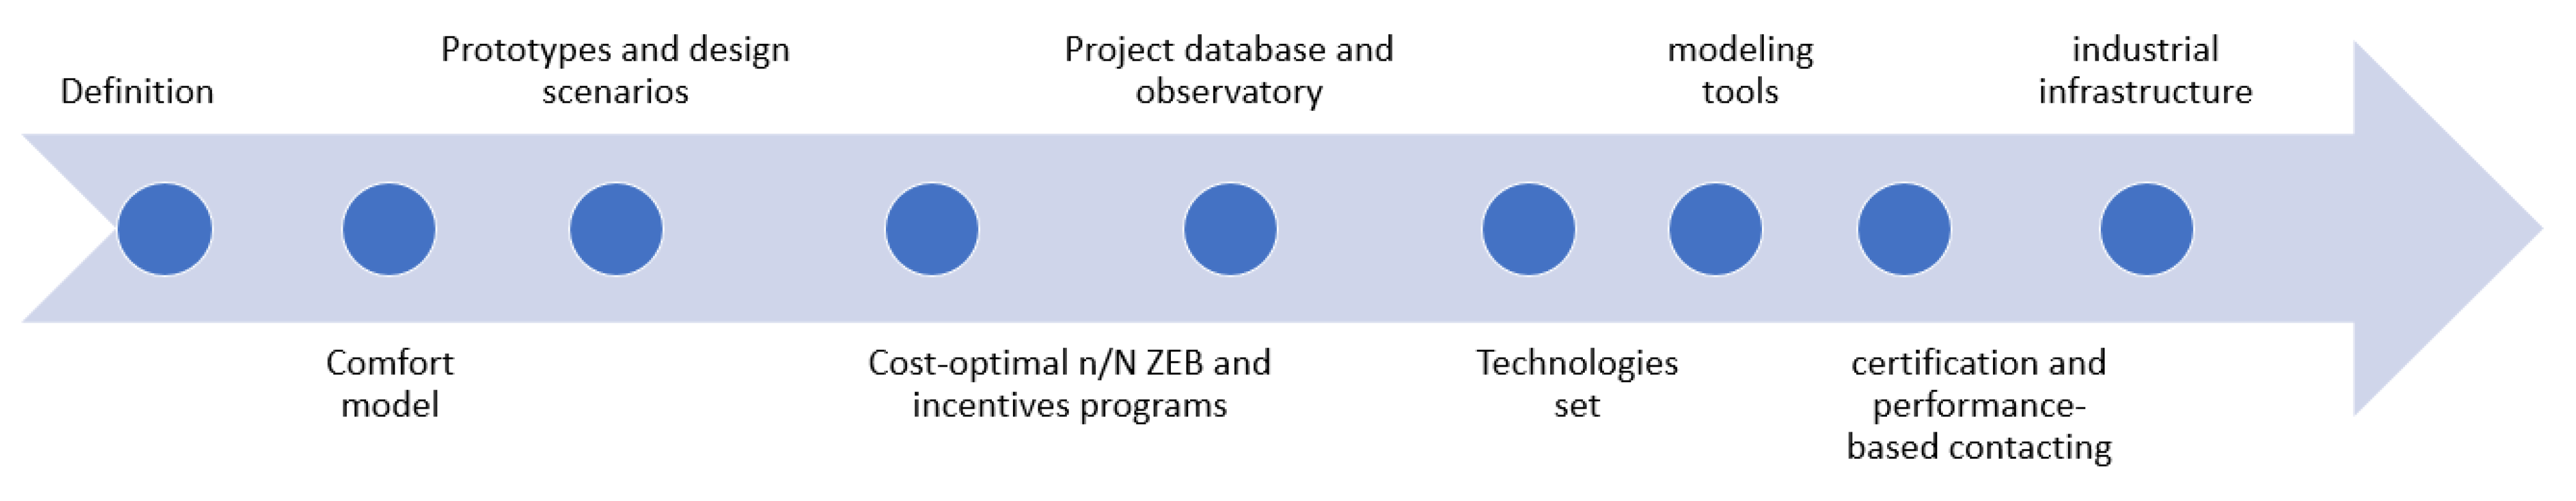
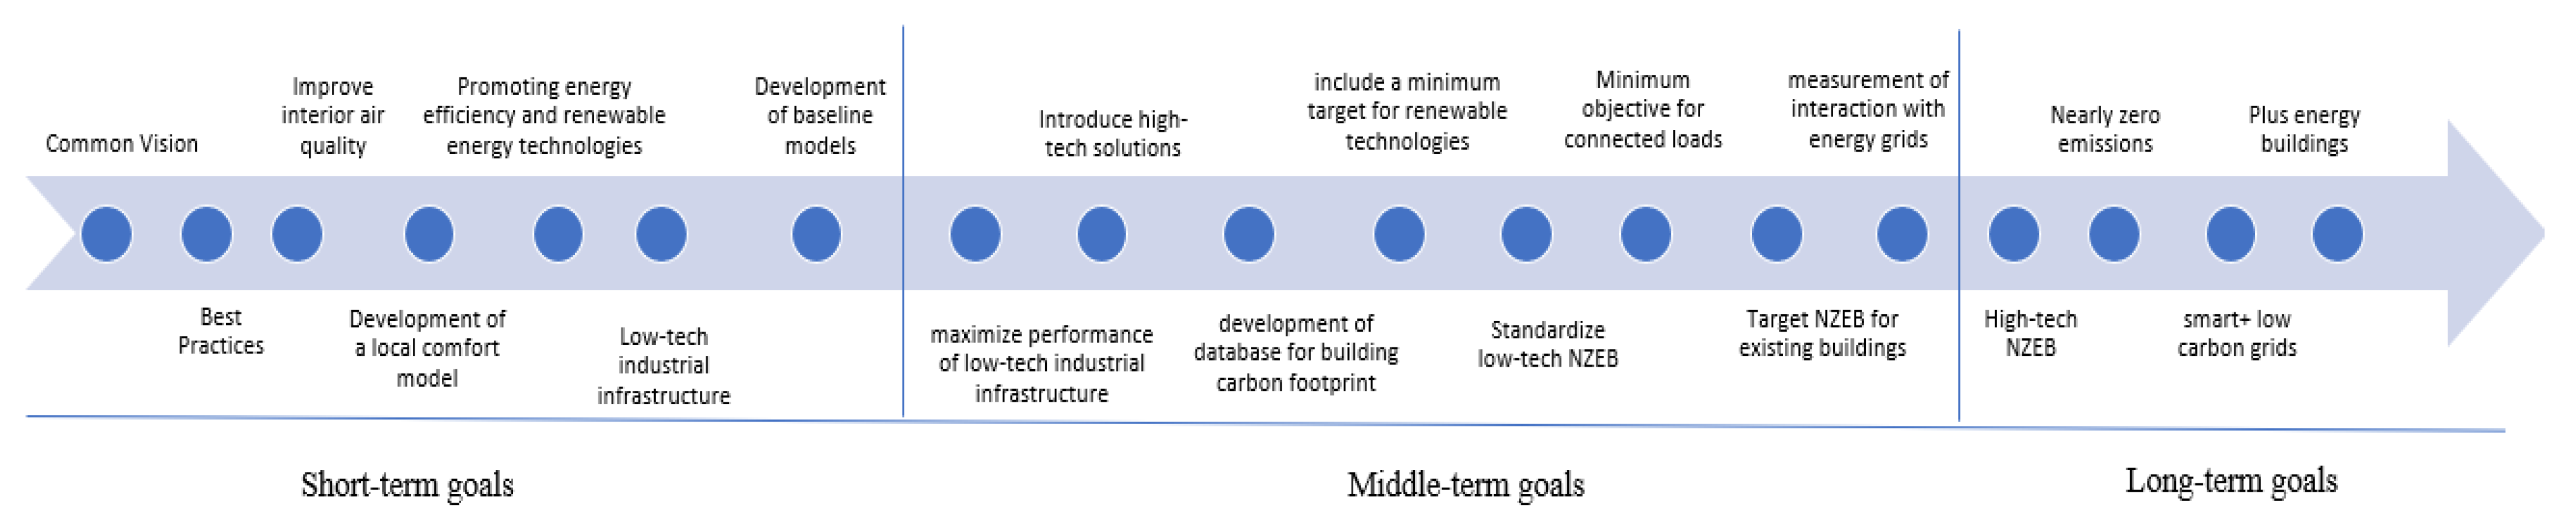
A good way to provide strategic, organizational, and tactical aspects of NZEB is a roadmap. A roadmap works to help nations or regions with detailed guidance, planning, and design. Two NZEB roadmap strategies for industrial countries and non-industrial countries are presented in [1]. A roadmap for industrial countries to achieve NZEB that many nations should follow is presented in Figure 1. The strategic approach presented facilitates the NZEB design. The contrary is encountered in relation to non-industrial countries, where there are opportunities to develop new concepts and definitions for NZEB according to socioeconomic status. The roadmap towards NZEB in non-industrial countries can only be achieved in the long term, as presented in Figure 2. A vision that unifies the industry, government, professionals, community, and health institutions, should be established in the short and middle terms.
The energy demand of a building is influenced by many climatic parameters, such as temperature, solar radiation, wind direction, and moisture, where buildings act as a climatic modifier. Depending on the building’s location and the climate zone and type (cold, hot, hot summer, cold winter, mild), energy consumption can vary. According to [18], the most frequently addressed factors influencing the energy consumption of buildings are: the climate, building-related characteristics, building systems and/services related characteristics, occupant-related characteristics, socio-economic and legal-related characteristics. In nZeb, one of the main aspects that impacts electrical energy consumption is efficient appliances and lights [19].
- (a)
- Net zero energy building
In general, a net zero energy building (NZEB) is a residential or commercial building with greatly reduced energy needs that is designed in such a way that it can be supplied with onsite renewable energy generation [20], with no requirements for energy from the grid; thus, the net energy balance is zero.
However, the concept of NZEB has different definitions according to the goal. Four developed definitions have been presented in [21]: net zero site energy, net zero source energy, net zero energy costs, and net zero energy emissions. Each definition, conforming to a different energy use accounting method, uses the grid for net use accounting and has different applicable renewable energy sources. An annual balance of 0 kWh m−2 y−1 of primary energy use typically leads to a situation where a significant amount of onsite energy generation will be exchanged with the grid [22].
The ZEB concept can be represented graphically, as in Figure 3. This figure shows an XY graph where the horizontal axis represents the annualized embodied energy (AEE) and the vertical axis represents the annual energy use (AEU). The life cycle zero energy building (LC-ZEB) is represented by a 45° straight line. Buildings along the horizontal axis represent zero energy buildings (with zero annual energy use), appearing closer or further from being LC-ZEB.
Other classifications of ZEB can be found. For instance, NZEB classifications from NZEB:A to NZEB:D are proposed, based on the renewable energy type and location with respect to a building [20]. This classification system recognizes many possible renewable energy supply options, depending on the site constraints and locally available renewable options.
The definition of NZEB often used in the United States is a building designated as using zero site energy, a calculation which is based strictly on annual energy consumption. The amount of energy provided by on-site renewable energy sources is equal to the amount of energy used in the building [24]. The objective for NZEB is to produce as much energy as they consume. One of the challenges with NZEB is the renewable sources that it must contain, such as solar panels, heat pumps, wind turbines, fuel cells, equipment for the recycling of rainwater and gray water, etc., that require substantial capital in order to be procured [25].
- (b) Nearly zero energy building
Alternatively to NZEB, a nearly zero energy building (nZEB) is defined as “a building with very high energy performance, as determined in accordance with Annex I” [2]. The nearly zero or low amount of energy needed must be covered with mostly renewable energy sources that are produced on-site or nearby. However, the net energy balance is not zero and depends on different aspects. The Energy Performance of Buildings Directive (EPBD) states that the member states shall detail nZEB definitions, reflecting regional, national, or local conditions, and a primary energy numerical indicator that should be expressed in kWh m−2 per year. The primary energy factors used to determine the primary energy use may be based on national or regional yearly average values, taking into account relevant European standards [3,26].
Moreover, different zero energy building definitions were presented and discussed regarding the main authors [27]. One of the most commonly-used definitions, provided by Satori et al. is: “a nZEB is a building with greatly reduced energy demand that can be balanced by an equivalent on-site generation of electricity, or other energy carriers, from renewable sources”.
1.1. Motivation and Objective
European countries developed ZEB concepts, definitions, and construction technologies that effectively correspond to their respective climates. Latin American countries are still trying to find adequate solutions that respond to the local climatic, cultural, social, technical, and economic context. As such, this work aims first to comprehensively review former ZEB studies in Latin America in terms of the local climate and technical aspects only. Secondly, the energy regulations implemented in Panama are assessed in order to establish the basis of the minimum energy efficiency and a renewable threshold for nZEB definition and thus better understand the application of the ZEB concept in Panama.
1.2. Scope and Structure
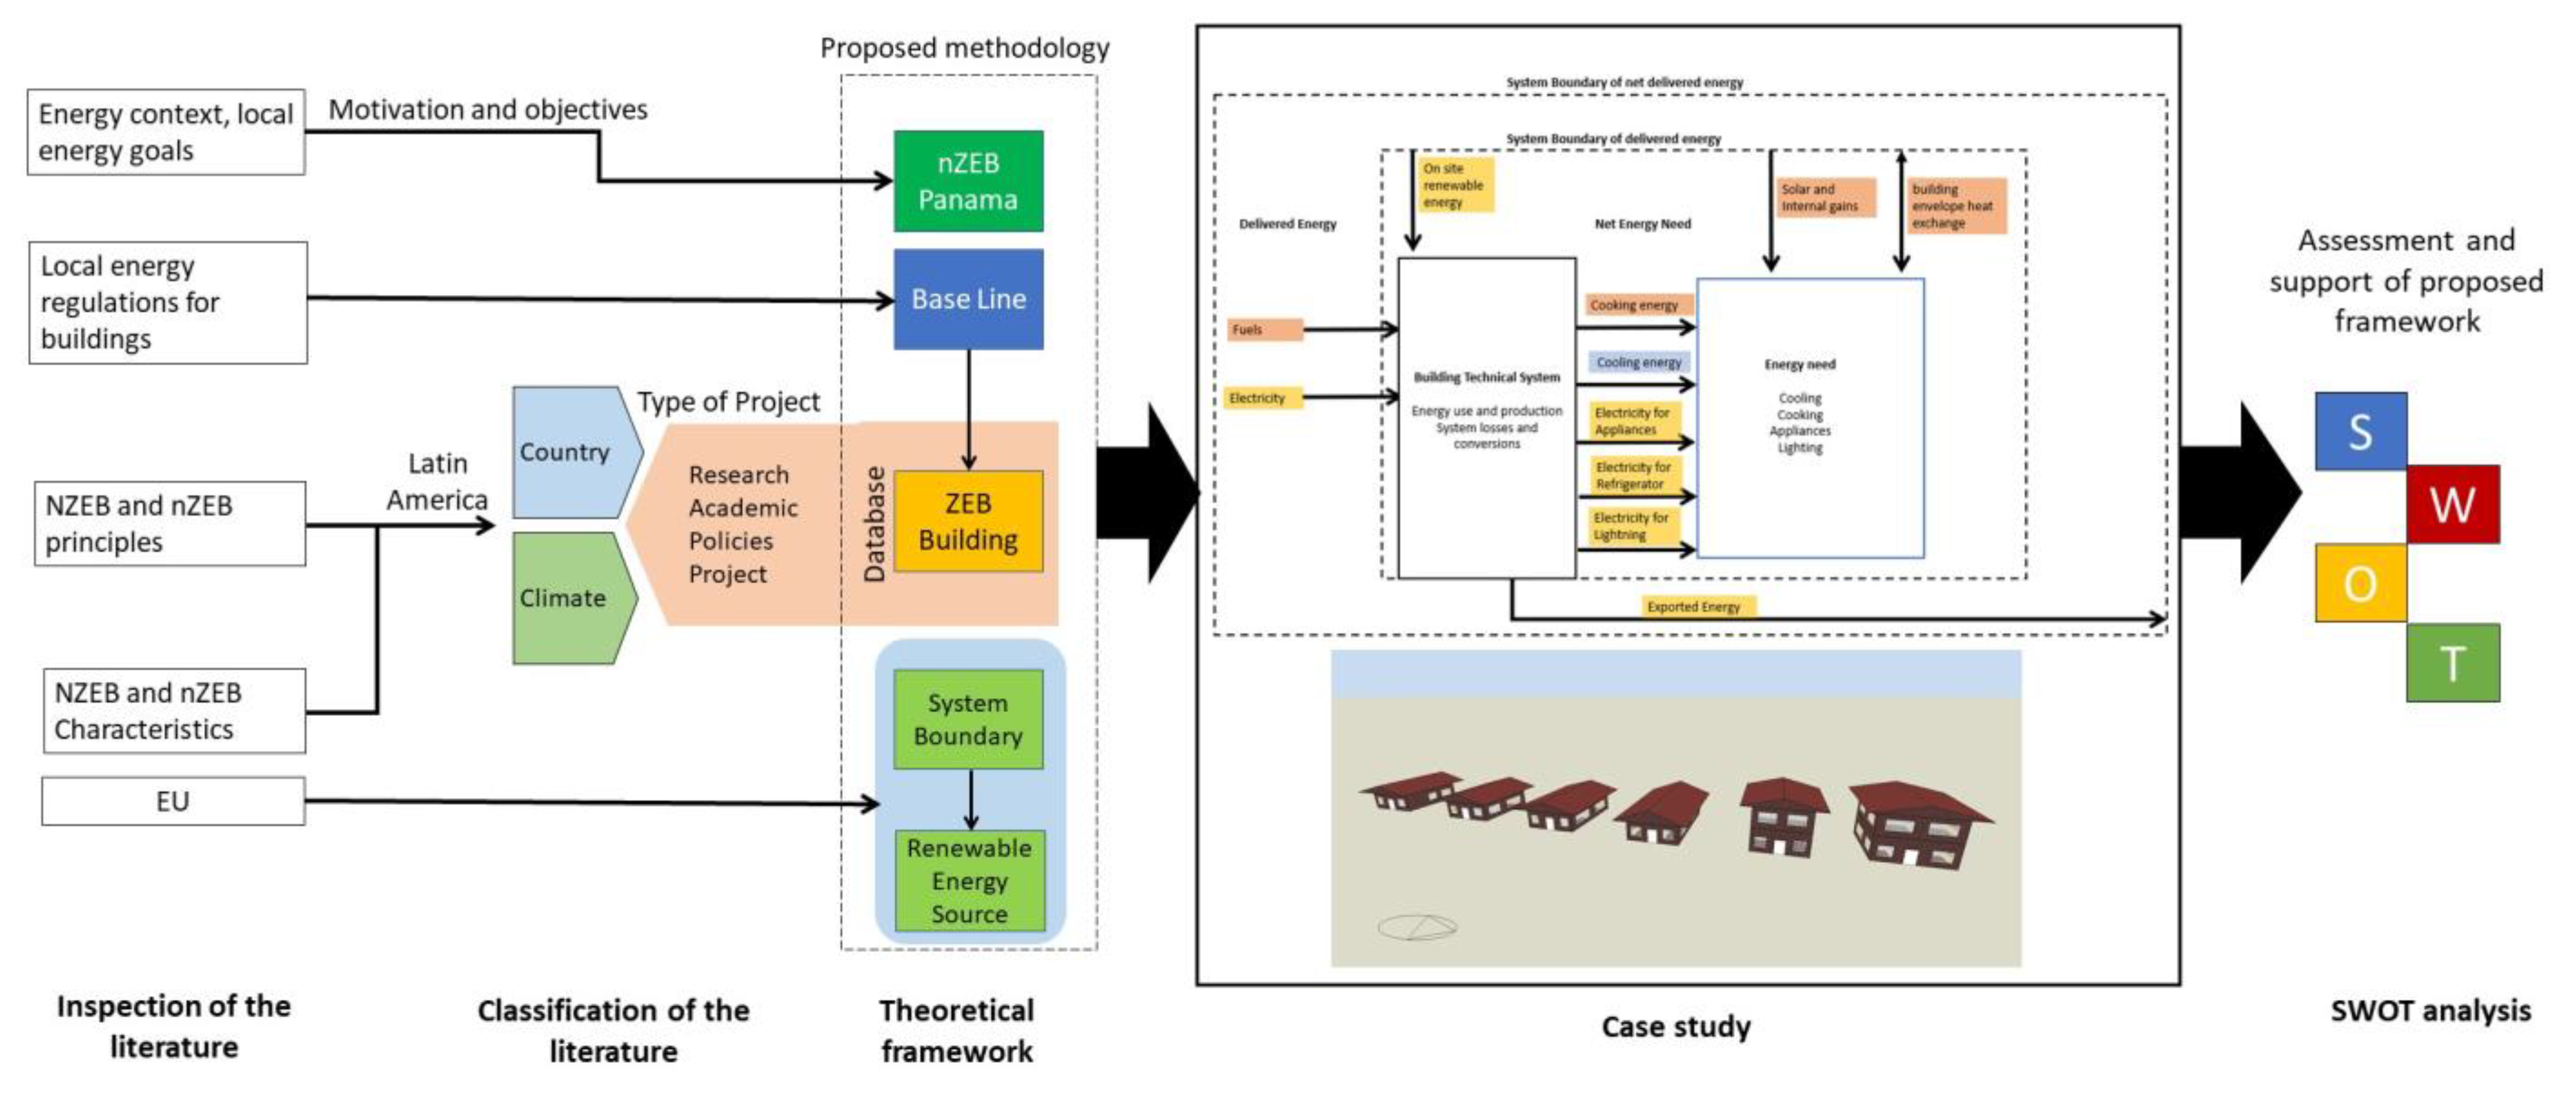
The study presented here reaches out to the fundamentals of nZEB and NZEB concepts defined by developing countries. However, it is concentrated on reviewing the concept-definition and implementations adopted by Latin American countries and converges into defining a framework for application in Panama (Figure 4). This study summarizes both Latin American and local statistics of energy consumption in buildings (Section 2), followed by the experience of NZEBs in Latin America and descriptions of each country (Section 3).
A previous comprehensive review, which allowed the conception of a theoretical framework to propose a nZEB definition for Panama, is addressed in Section 4. Afterward, a discussion is presented in Section 5 about the energy range values and considerations for nZEB in Panama, based on the standard dimensions for residential buildings.
Finally, new limit values for considering ZEB in Panama are reported, along with a nZEB definition for Panama. A SWOT analysis is presented in order to assess and support the introduction of such a definition and framework.
2. Implementation of nZEB and NZEB in Latin America
In order to identify the different applications based on nZEB or NZEB concepts, an inspection of the literature has been carried out with the search strategy described below.
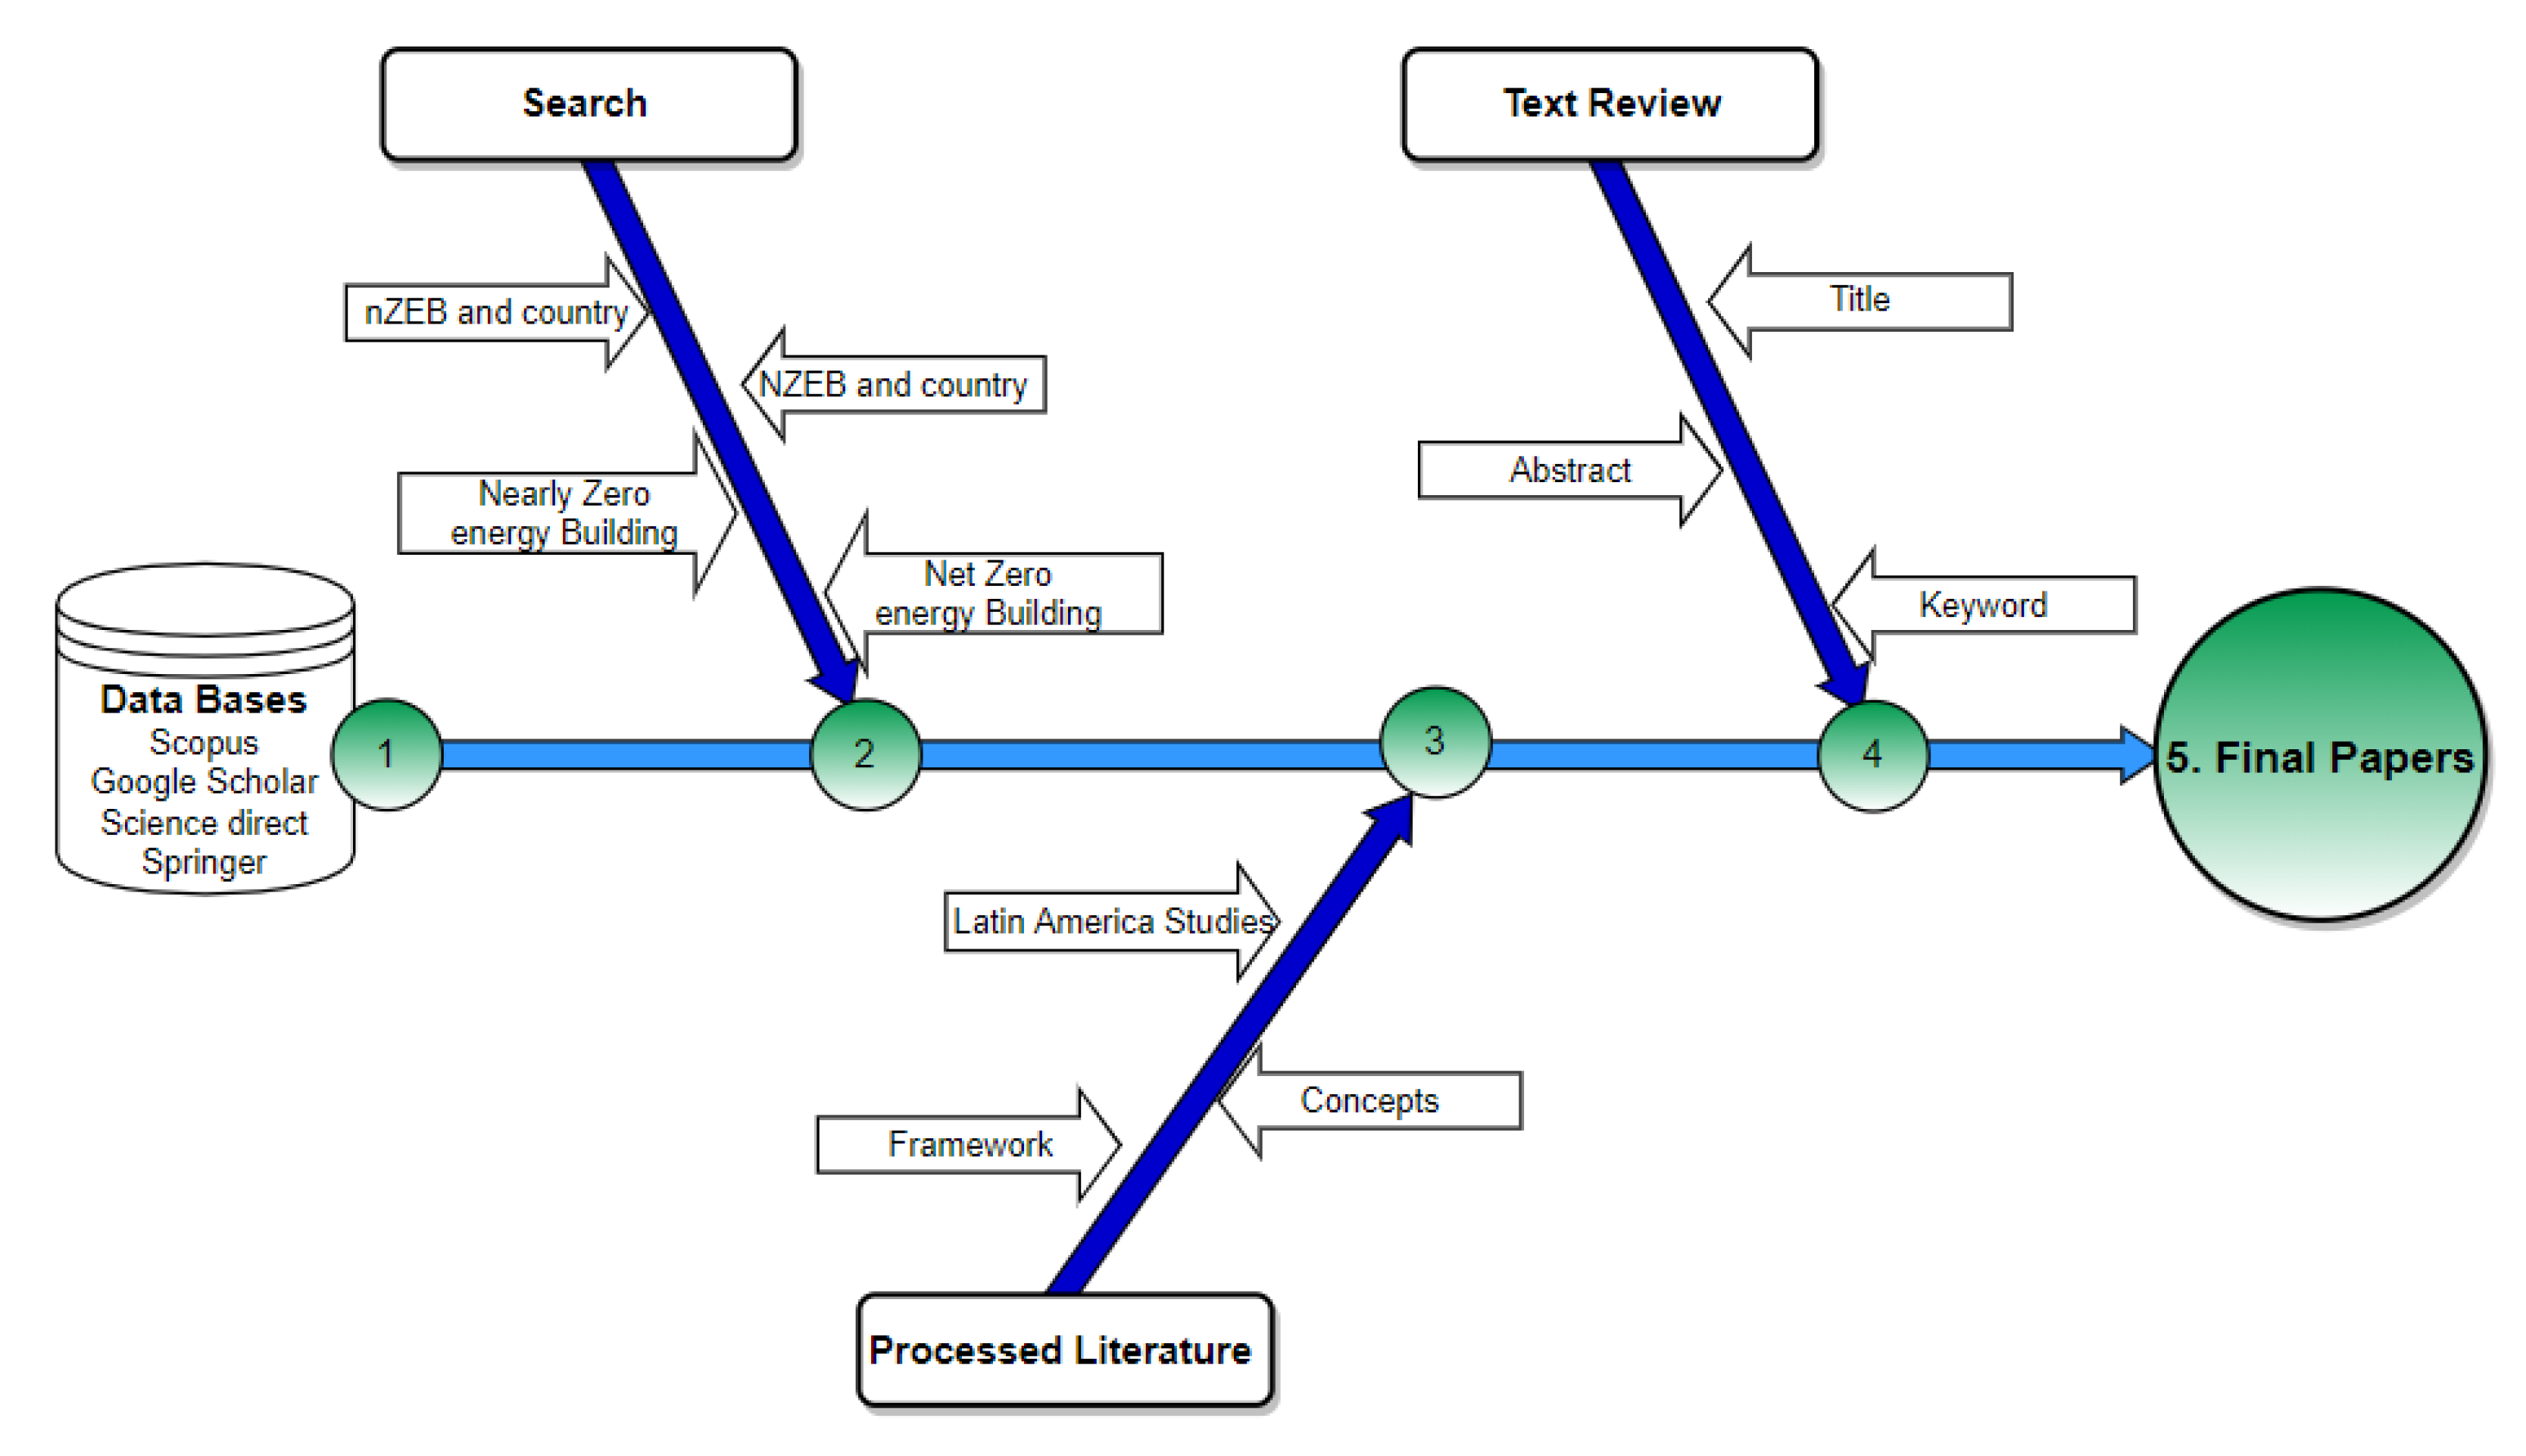
The procedure to select the final papers on this research includes five steps (Figure 5):
- To gather as many studies as possible, the use of scientific databases such as Scopus, Google Scholar, Science Direct, and Springer were selected.
- The search was performed in each of the scientific databases, applying the Boolean operators. The main co-word combinations were “nearly zero energy building,” “net zero energy building,” “nZEB,” AND “country” OR “NZEB”, in which the country represents each of the Latin American countries, with a total of 21.
- A complete review of the preselected articles in order to select those sources that provide information related to the ZEB framework, concepts, and Latin American studies.
- A full review of the title, abstract, keywords, and most relevant papers.
The criteria employed in the literature selection were: (i) Latin American studies regarding energy in building, (ii) zero energy building, and (iii) any experience in zero energy building for Latin America, with no limitation on the year of publication for the studies. The final step corresponds to the resulting list of documents. The final list of documents was analyzed by: (i) building energy efficiency regulations, and (ii) ZEB experience, with information collected on the country, climate type (city), type of ZEB, energy consumption, type of project (status), type of building, or building sector, energy-saving strategies, building area, U-values and energy generation.
Policies and regulatory measures regarding energy usage have been implemented over the last decade in Latin America. Their implementation generated a trend, which is shown in Figure 6. Oil and natural gas have been the principal resource supplying energy to buildings in Latin America. The residential energy consumption has increased through the years, with a 14,461 ktoe of oil, 12,349 ktoe of natural gas, and 67 ktoe of coal being consumed annually by 2017 [22,28].
One measure for decreasing energy consumption in buildings is the implementation of nearly zero energy buildings (nZEB) as the new building target [8]. Latin American countries, such as Costa Rica, Argentina, Brazil, Chile, Colombia, Ecuador, Paraguay, Peru, and Uruguay, have building energy efficiency regulations [24,30], and few local studies have focused on NZEB or nZEB. Sustainable building codes worldwide are on the rise, mainly because they are effective instruments to improve the efficiency of residential and non-residential buildings. The most demanding building energy codes in the world require buildings to be net-zero energy. In addition, renewable energy systems integration is being considered in these building energy codes [25,31]. Table 1 gathers the countries in Latin America that have applied the nZEB or NZEB concept as either a preliminary study, academic study or finished project. The missing countries (Bolivia, Costa Rica, Guatemala, Honduras, Nicaragua, Paraguay, Republican Dominican, and Puerto Rico) do not appear in the literature using the nZEB or NZEB concept. In Venezuela [32] different factors were applied to compare to other cities, but the nZEB concept was not implemented in the final results.
2.1. ZEB Type and Energy Saving Strategies According to Climate
First, a classification of the type of climate has been implemented according to the Köppen climate classification. Each country presented a different climate type according to their cities. Even though there can be a variety of climate types in each country, the climate types presented here are only those that appear in the literature as having an experience with zero energy building in Latin America. Climate classification is a reference to compare with other countries and their experience, some construction materials, and regulations. In this sense, Panama can be compared to Brazil, Colombia, Cuba, Haiti, and El Salvador. The same applies to other countries with comparable climates. Panama also has another three types of climates (Cwb, Cfb, and Am), a fact which will allow for developing projects and comparing with other countries which share the same climate.
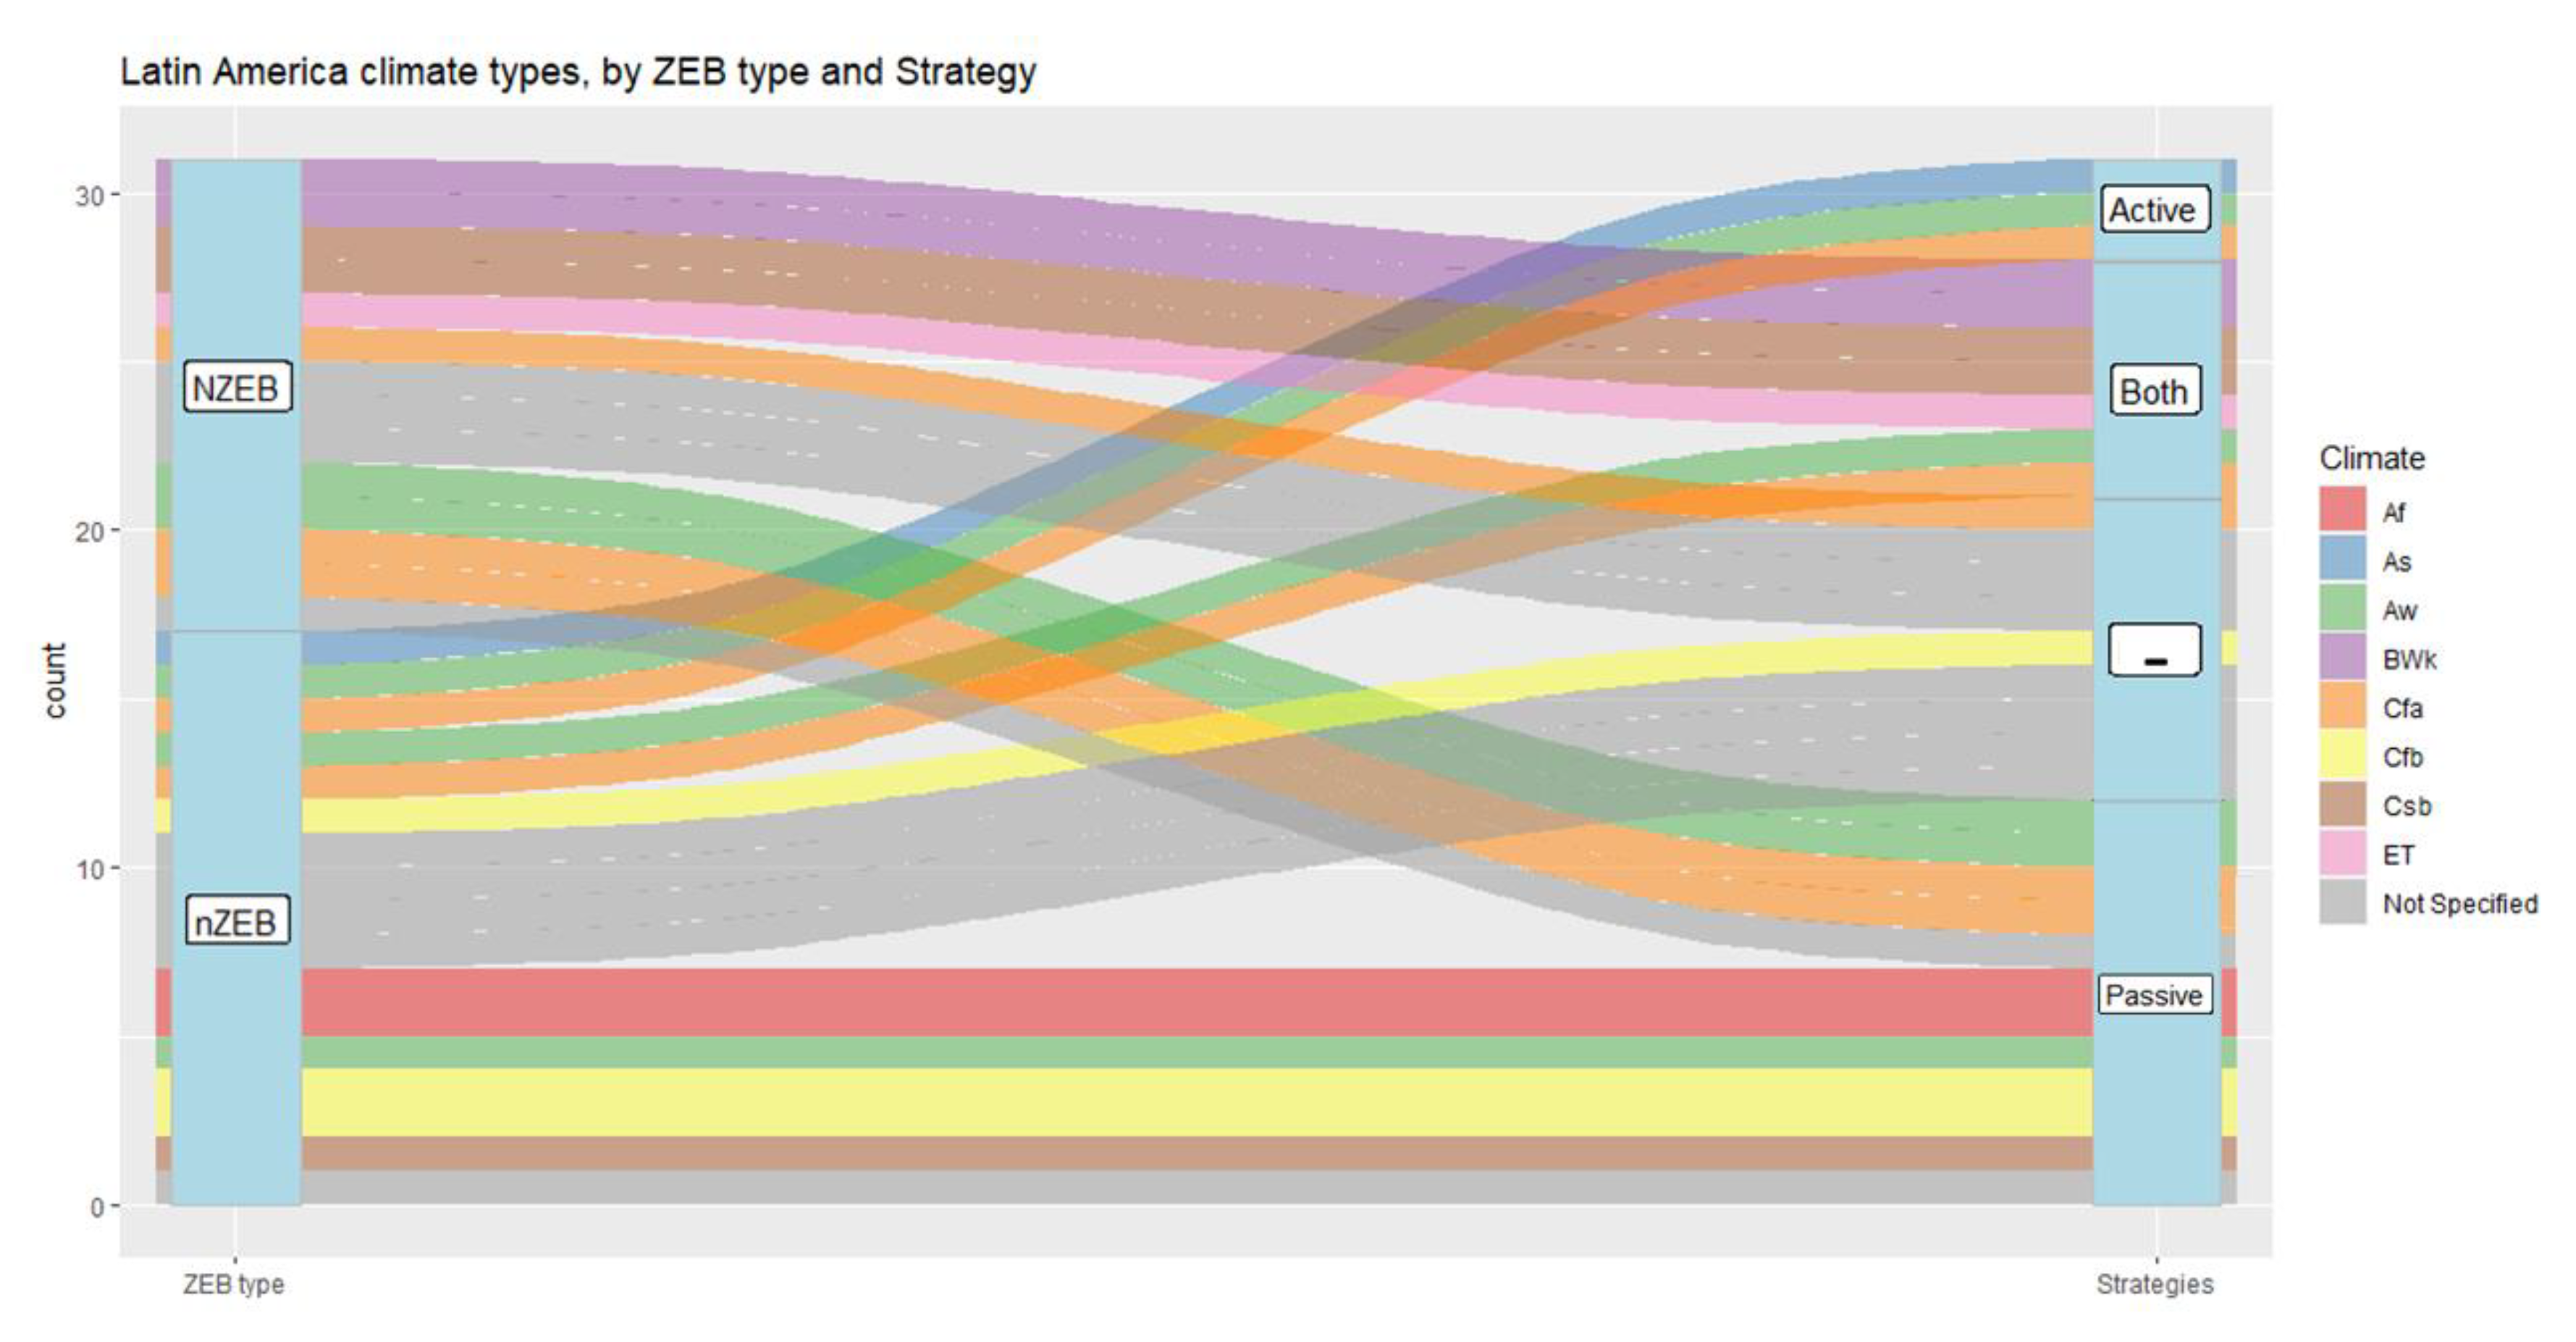
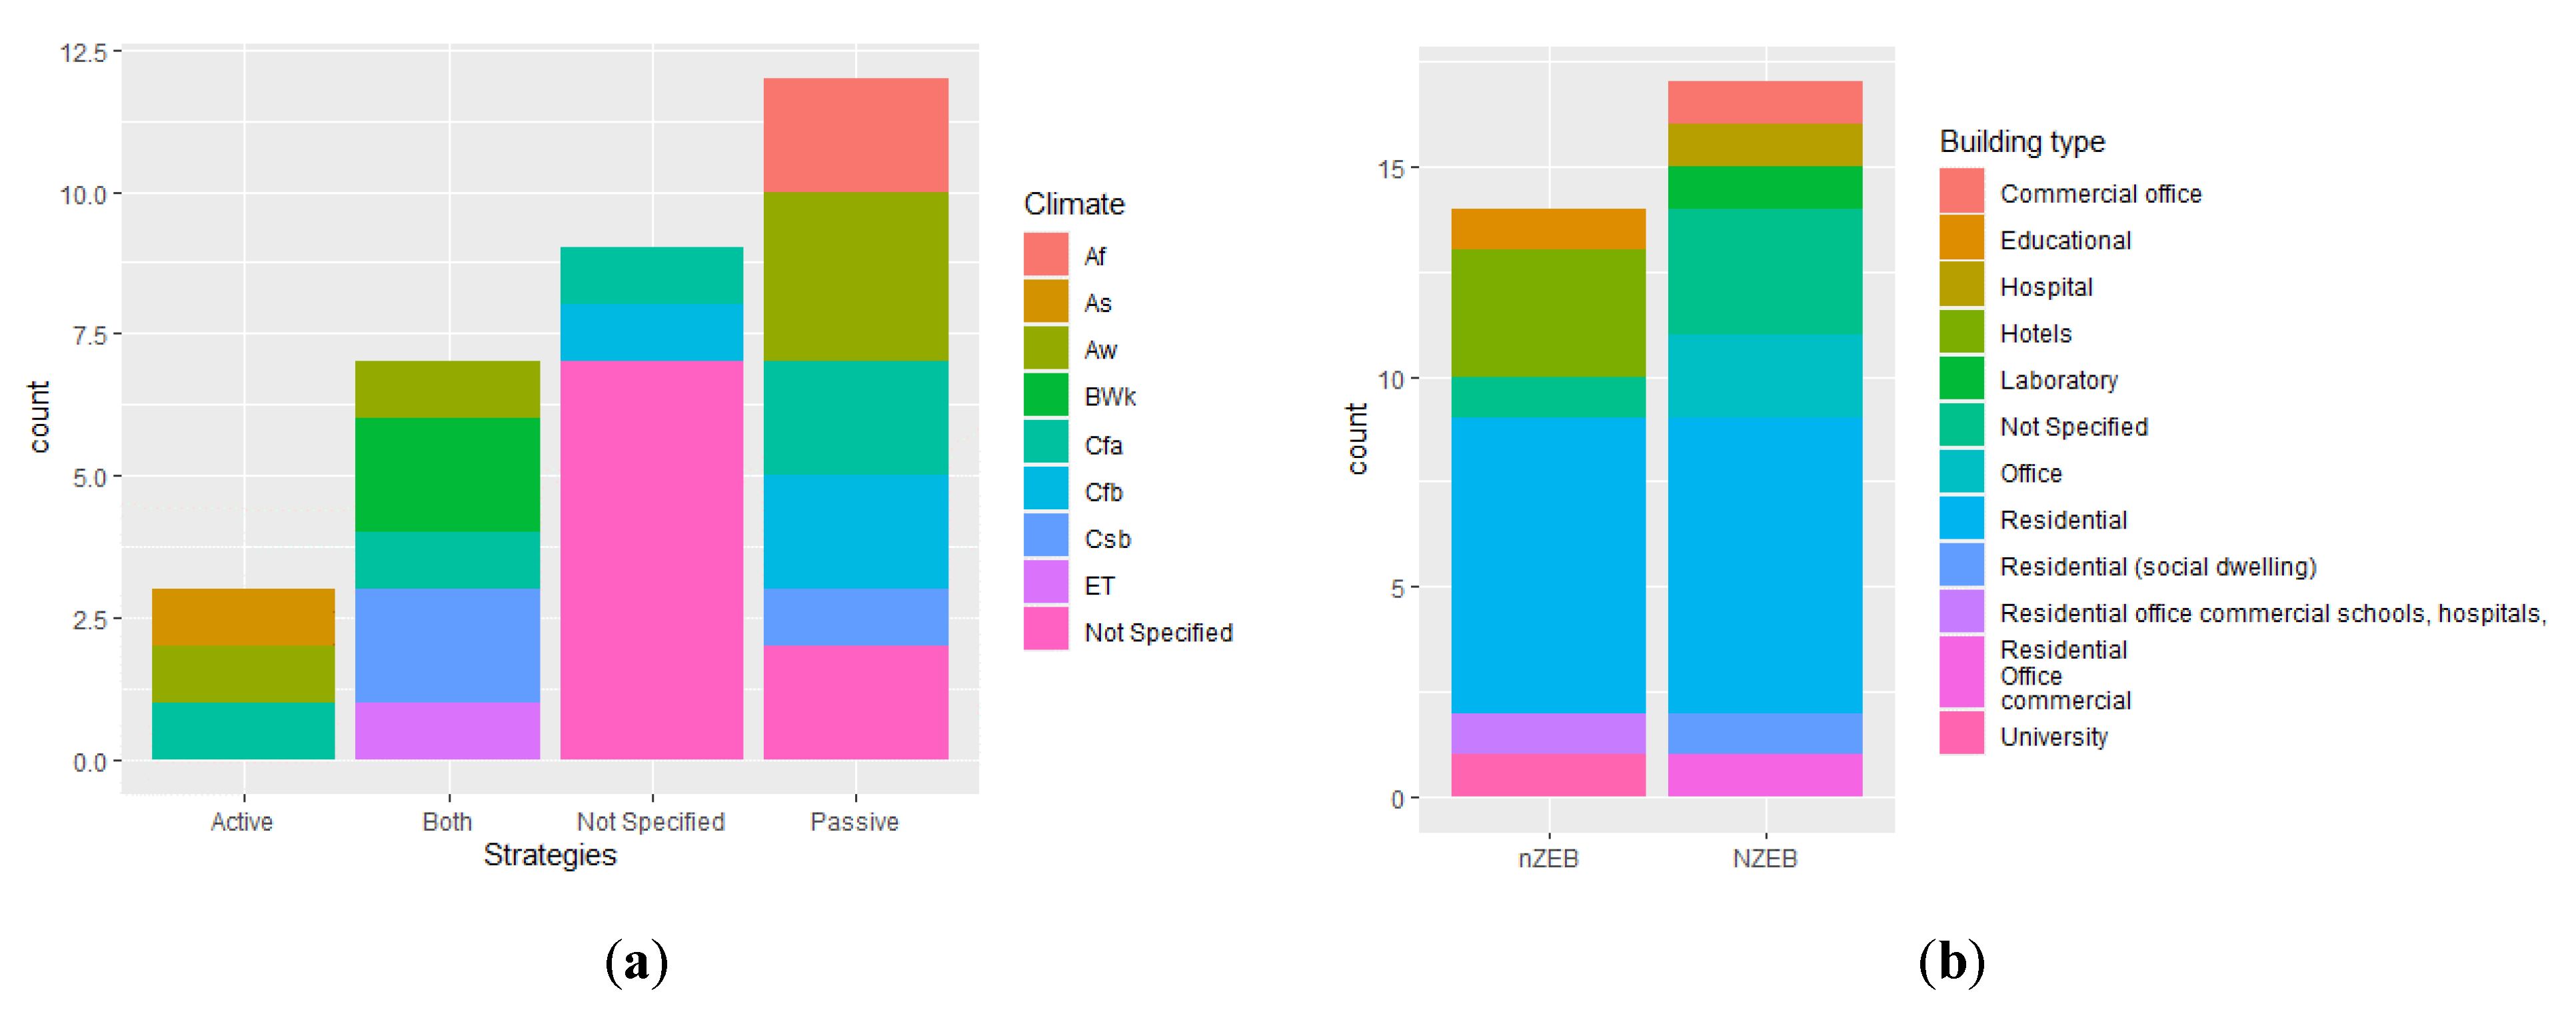
Table 1 shows ZEB’s experience in Latin America in relation to the climate type, energy-saving strategies, and type of ZEB. Table 2 and Table 3 show, in more detail, the passive and active strategies implemented to achieve nZEB/NZEB. A tendency to apply passive strategies seems to be adopted regardless of the type of climate. This tendency follows the ZEB philosophy, as shown in Figure 7. In fact, it can be observed that NZEB can be reached by applying only passive solutions, regardless of the type of climate (Figure 8a) [35,39,40,42,45,46,47,51,54,55].
However, the application of active solutions only also helps to reach NZEB, but this technique appears to be less common [36,50] (Figure 8a). Other studies have applied both passive and active solutions, but their results show that the NZEB was not as successful as when only one type of strategy was applied [34,36,41,43].
The results also show that researchers have favored studying the applicability of the ZEB concept (Figure 8b) in residential buildings, and residential buildings successfully reach the net-zero energy balance far more than any other building type. This is observed for different types of climates, which can be translated into the different amounts of energy generated even with the same technology. Depending on the climate, residential buildings tend to present lower energy demand, in general, which may make it easier to achieve a net-zero energy balance than in other complex types of building. However, other studies have showed that a successful net-zero energy balance can be reached for other building types.
In the following section, comparisons according to climate, U-values, and energy-saving strategies are introduced in order to understand more of each country.
2.2. Envelope Transmittance Values According to Climate
Although, most studies did not present transmittance values for the envelope (U-values), all seemed to converge, when modified, into an “improved” performance (improved case) with a lower U-value (Table 3). However, the U-values appeared to diverge with the type of climate.
For instance, both office buildings in [38] started with equal U-values for the roof, walls, and window, in two different types of climates (Cfa and As). Here, the improved case showed a difference only in the external walls’ U-value, resulting in significantly a lower U-value for the As climate type.
Similarly, in Brazil, in two residential buildings in different types of climates [39] (Af and Cfb), the improved case turned out to have the same roof U-values but different wall U-values, with the building located in Af being significantly lower. Moreover, residential buildings studied in Chile [41] in three climate types (BWk, Csb, and ET) started with different U-values. In the BWk climate, the original U-values for the roof, walls, doors, and windows were higher than the improved values. In the ET climate, the U-value for the roof and windows remained the same for both original and improved cases; for the walls and door, a lower value was reported for the improved case. On the contrary, different U-values were encountered for the Csb climate. In this case, the original U-values did not differ significantly with any envelope element; in fact, both windows and floor U-values were the same. The improved cases resulted in less difference, indicating that the same might help to reach same performance under the same type of climate for the same type of building (residential) [41]. In these three types of climates—even within the same building type (residential), where the higher U-values are from the BWk climate, followed by Csb, and the lower for the ET climate—all of the cases reached were classified as nZEB.
Moreover, in Argentina, under the same Cfa climate, the same original U-value was encountered for reaching nZEB [35] for different building types, but to achieve NZEB the improved case presented U-values lower than the original [28] (Table 3). On the other hand, to achieve NZEB, the improved U-values differed significantly in studies based in countries with an Af climate, such as Brazil [39] and Panama [54] (Table 3), despite the same type of building being analyzed (Table 1). An agreement is encountered under the same type of climate, Aw [43,55], for the improved U-values in walls and windows, despite different building types, to achieve nZEB/NZEB (Table 3). No further analysis can be performed due to a lack of information.
Finally, as the U-values depend on the materials that are implemented, the discrepancies encountered between different climates and countries, or even within the same climate type for the same country, highlight the lack of a strong building performance energy regulation. However, the ZEB philosophy has been explored with encouraging figures. Although it is yet to become an accepted philosophy and achieve a consensus in Latin. America, such as has happened in the EU, most studies are in the preliminary research project stage.
3. Methodology for nZEB Definition in Panama
The methodology adopted in this study begins with the inspection of the nZEB definition origins and energy limits established in energy regulations in developed countries and the inspection of other studies performed in Latin American countries (Table 1). Such inspection helped to classify the nZEB studies undertaken in Latin America, regarding climate, building type, and energy consumption limits (as presented in Section 2). The nZEB description adopted by developed countries as part of their energy regulations has been further understood and has provided motivation to apply the same problem definition to the Panama context.
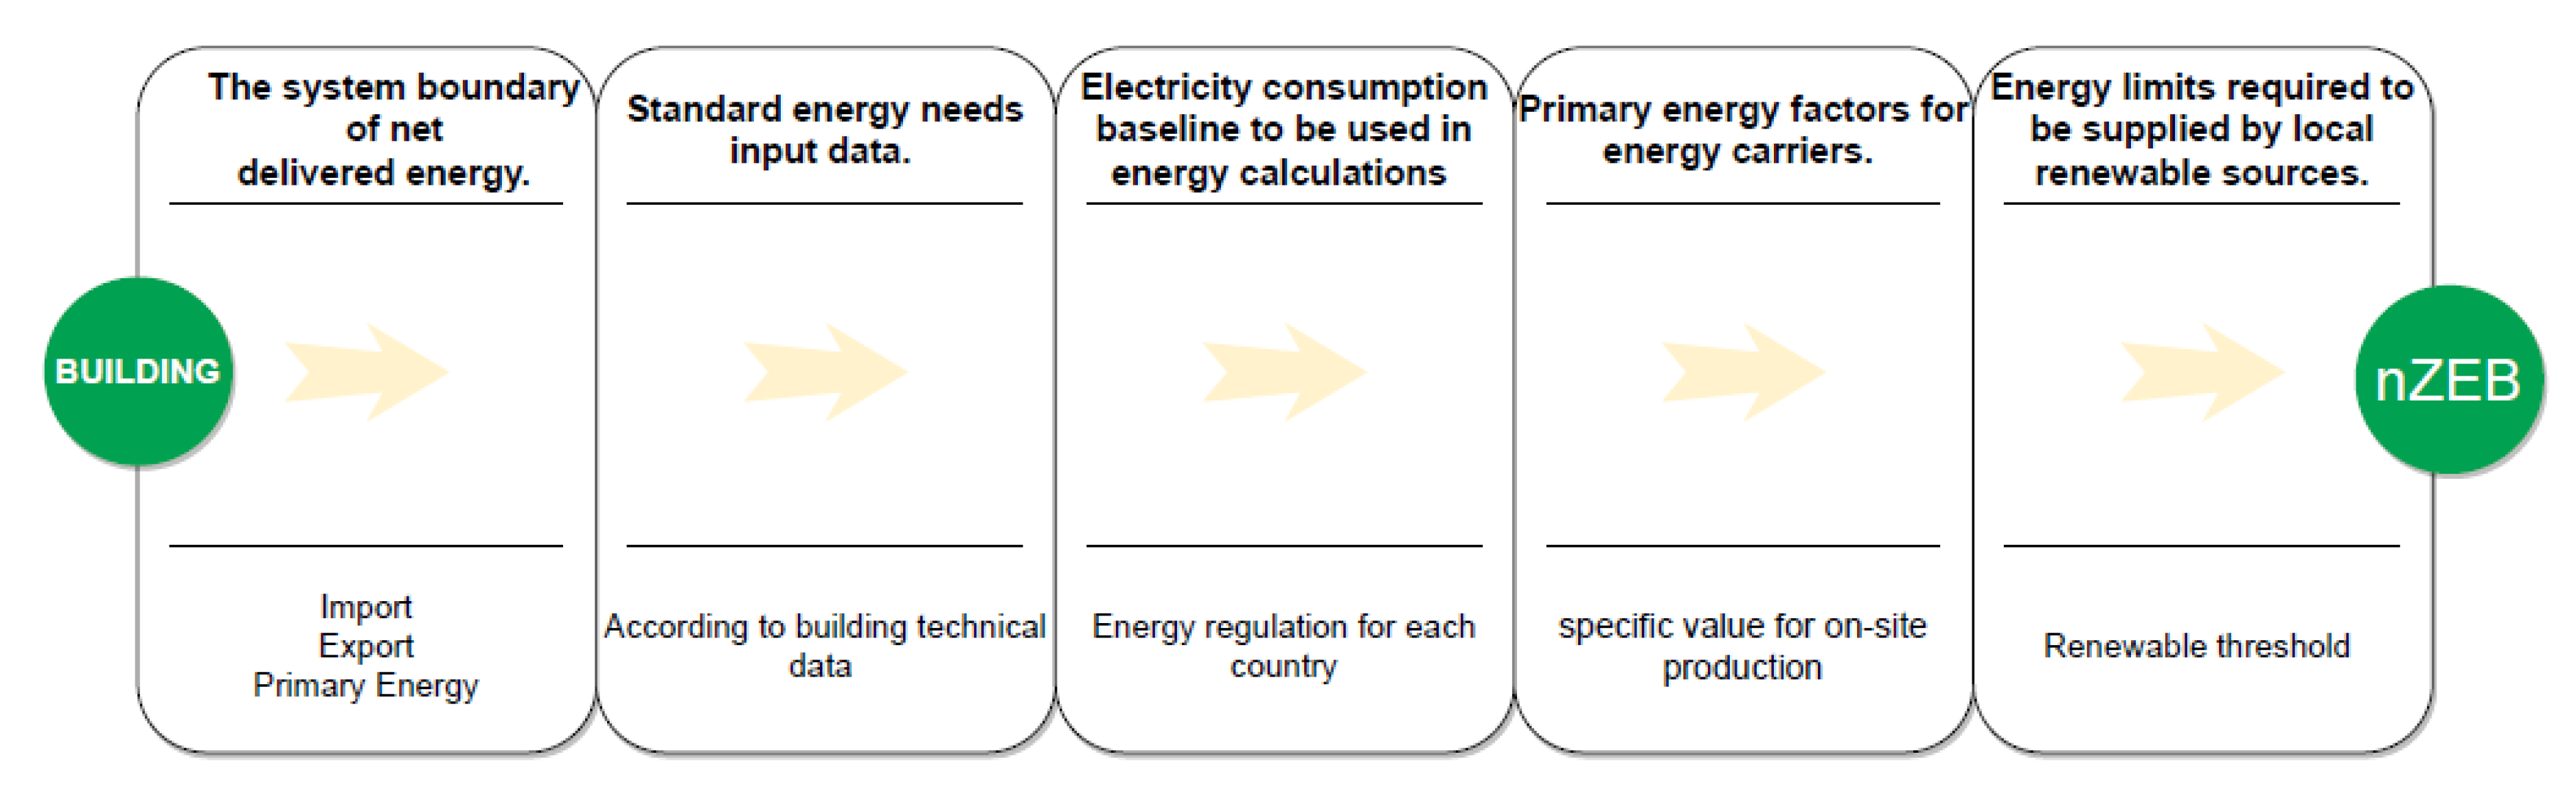
The procedure proposed here, intended to define the energy limits for nZEB in Panama, is based on [1,22,26], and requires definition of the following aspects (Figure 9):
- The system boundary of net delivered energy;
- Standard energy needs input data;
- Electricity consumption baseline to be used in energy calculations;
- Primary energy factors for energy carriers;
- Energy limits required to be supplied by local renewable sources.
After defining each of the previous aspects, a theoretical framework is then defined to apply such a procedure to different case studies (sorted by the building surface area) based on the baselines established by the local energy regulations in Panama. The development of this framework led to the proposal for a complete nZEB definition to be applied in Panama. The proposed nZEB definition for Panama is then discussed and further assessed through a SWOT analysis to support introducing such a proposed definition in new local energy regulations.
3.1. The System Boundary of Net Delivered Energy
In Figure 10, a system boundary for new buildings in Panama is presented. The energy used by the building systems comes from either delivered energy or onsite renewable energy. Delivered energy to the building corresponds to electricity from the grid, fuels (LPG), and non-renewable sources. On-site renewable energy without fuels corresponds to energy produced from either solar or wind power.
On-site renewable energy production systems may supply specific building systems, and, thus, reduce the need for energy to be delivered to the building or maybe directly exported to energy networks. This is considered as the net delivered energy balance. The net delivered energy corresponds to the difference between delivered energy and exported energy; both of which are expressed per energy carrier. The primary energy use (E) is calculated from net delivered energy, per energy carrier, using Equation (1), taken from [22]:
where is the delivered energy for energy carrier i; is the exported energy for energy carrier i; is the primary energy factor for the delivered energy carrier i; and is the primary energy factor for the exported energy carrier i, which may or may not be equal to the factor of the delivered energy, depending on national definition.
3.2. Standard Energy Needs Input Data
The technical systems of buildings supply the net energy needed for cooling, cooking, and electrical energy. Building’s technical systems use energy and, typically, incur some system losses and energy conversion in some systems in the process of supplying these net energy needs, i.e., air conditioners. The energy need represents the energy required for cooking, cooling, lighting, and appliances. Finally, the net energy need corresponds to the difference between energy needs and heat gains.
3.3. Electricity Consumption Baseline to Be Used in Energy Calculations
In the case of Panama, a mandatory regulation to reduce energy consumption in new buildings established a range of values according to the type of building. These values can be seen in Section 4.1.
3.4. Primary Energy Factors for Energy Carriers
For the primary energy indicators in imported and exported energy, defined in the boundary system, the primary energy factors should be used. The primary energy factor or conversion factor is based on a national or regional annual weighted average or a specific value for on-site production. Each value depends on the energy form as imported electricity, exported renewable electricity, natural gas, fuel oil, propane, liquid propane, steam, hot water, chilled water, coal, or others.
3.5. Estimated Energy Supplied by Local Renewable Sources
Different methods can be used to evaluate the generated energy by photovoltaic modules in buildings. In this case, the installed power method (IPM) was applied. According to the available area of the roof building, the modules were distributed.
To calculate the PV system’s nominal power, the quantity of the module was multiple by the photovoltaics’ power, using Equation (2), and the generated energy was calculated using Equation (3), taken from [38]:
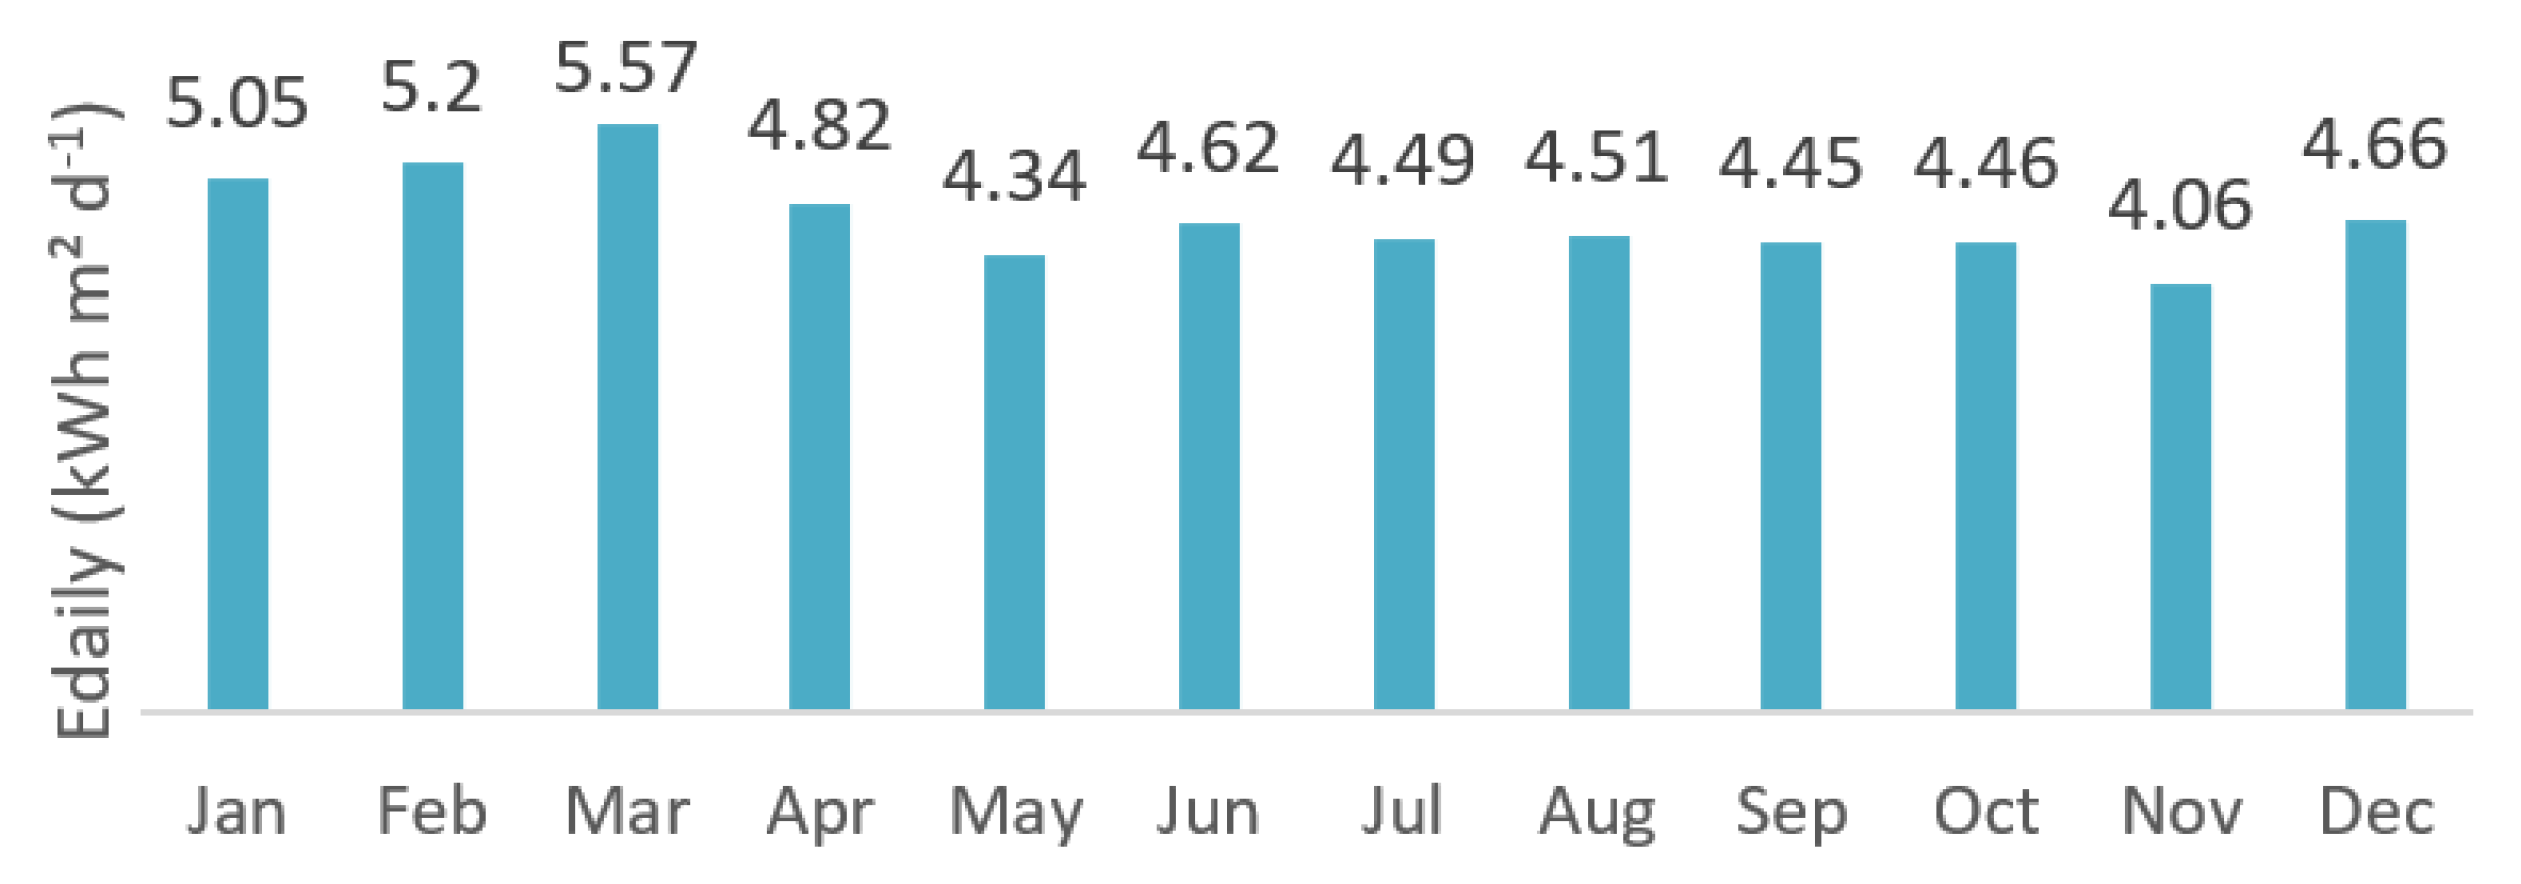
where is the installed power in kW, N is the number of modules, and is the nominal power of the module in kW. is the generated electricity in kWh d−1, is the daily solar irradiation on the module in kWh m−2 d−1, is the solar irradiation for standard test conditions (1 kW m−2), and is the system performance correction factor 0.85, recommended by [58].
4. Case Study: A Theoretical Framework to Propose a nZEB Definition for Panama
Based on the Tocumen Airport WMO 787920 weather station information, Panama City has a hot climate with an annual average of 78% humidity and an average monthly temperature of around 27 °C. The average annual temperature during the day is 29 °C, with a monthly average maximum temperature around 36 °C and with a minimum annual average temperature around 17 °C [59]. In Panama, the buildings are responsible for 60% of national electricity consumption through the residential, commercial, public, and private office sectors. According to statistics from the national energy secretary [60] and the national energy plan [61], passive measures had been contemplated in the construction sector that would help to reduce the new building energy consumption.
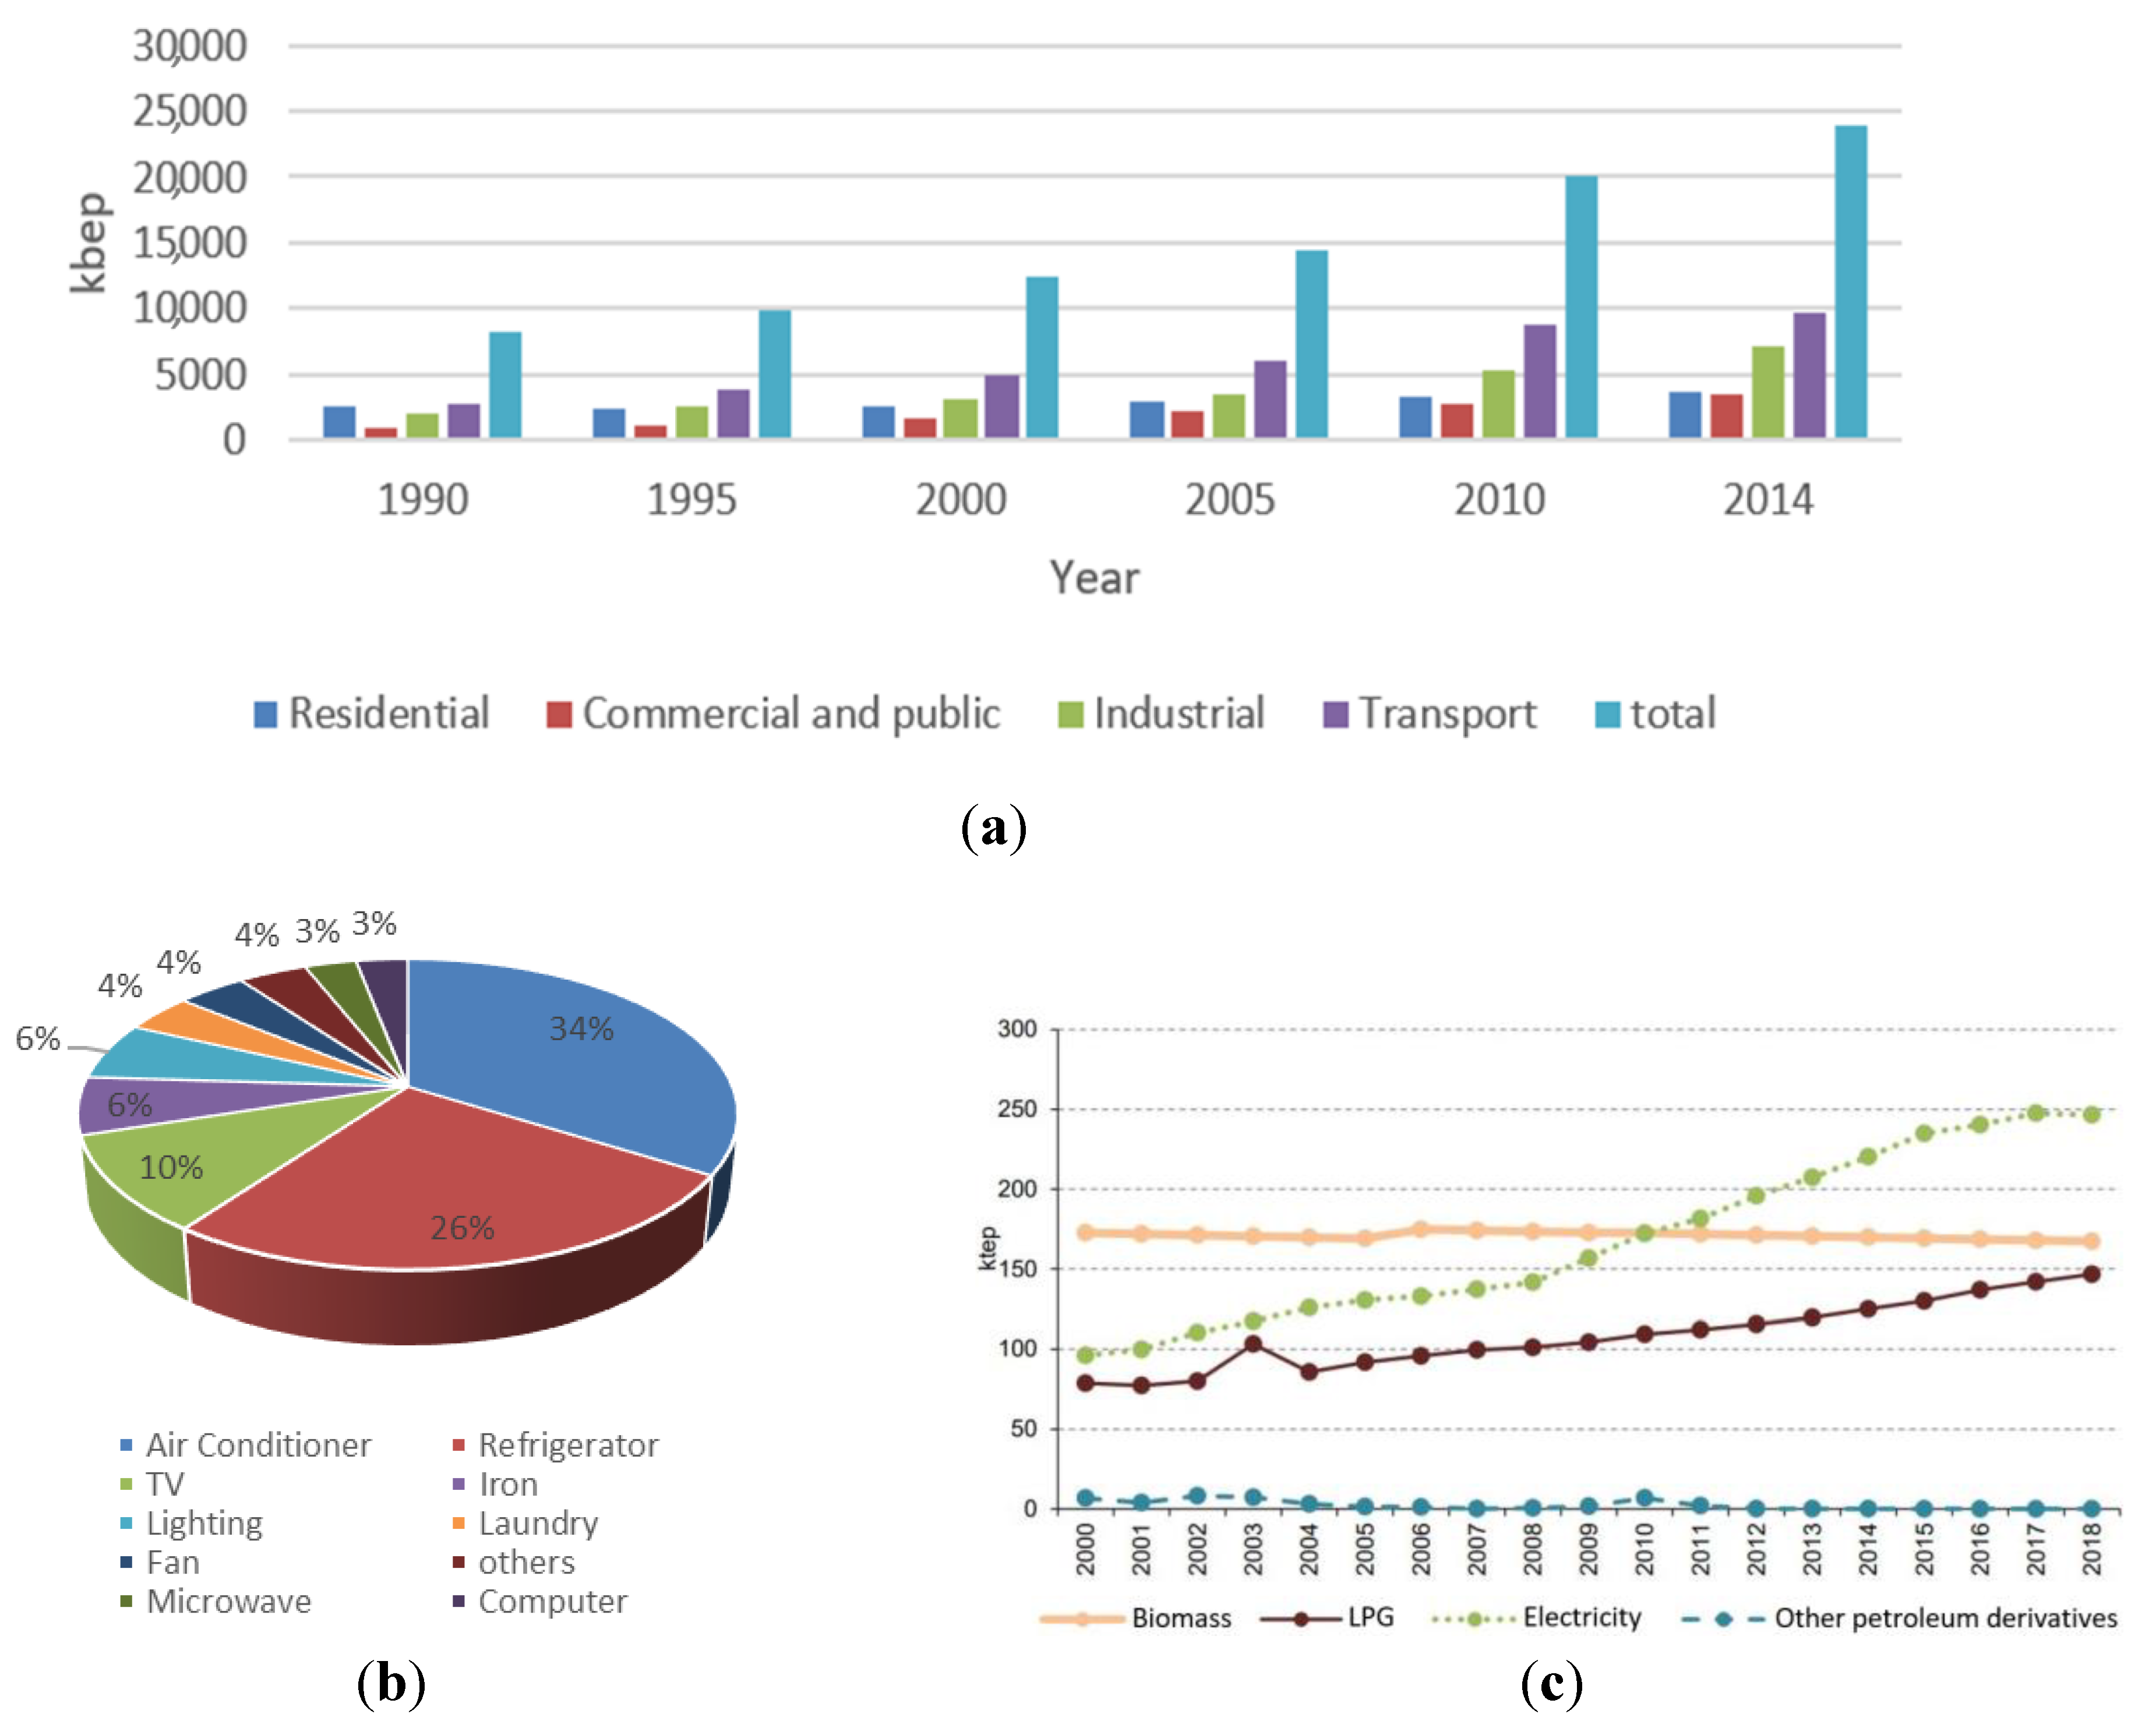
The energy consumption per sector in Panama is presented in Figure 11a, the final energy use in the residential building is represented in Figure 11b and the energy use of the public sector is represented in Figure 11c. One of the major energy end-use consumptions in the public and residential sector is the air conditioner. In dwellings in Panama (Figure 11b), 34% of energy usage goes towards air conditioners, and 26% in the refrigerator.
These aspects are related to the building energy codes that define mandatory energy efficiency standards for new residential, commercial, and public buildings. Panama already has regulations supporting and marking the path towards zero energy buildings [62].
4.1. Energy Base Line Values for Panama
In early 2013, the Panamanian government, through the National Energy Secretary (or SNE in Spanish), requested assistance from the International Finance Corporation (IFC) to develop a sustainable construction guide for energy saving in the building sector in order to mitigate the environmental impacts. As a result of this process, the sustainable construction guide [59,63,65] (or RES in Spanish) for energy savings, was established as a mandatory regulation framework intended to reduce energy consumption in new buildings.
Part of the methodology of the sustainable construction guide started with the identification of climatic conditions and addressed the definition of average energy consumption, according to the type of building (the baseline).
From the baseline energy consumption indices, Table 4 presents the new required energy consumption rates (baseline rates–15% savings) for each type of buildings in Panama. According to the type of building, the transmittance values (U-value) presented in Table 5 are recommended (for more details, refer to [65]).
To define the system boundary in more detail, the methodology for a 60 m2 dwelling is presented. For other sizes of dwellings, the results only are shown in Section 4.2, with the same methodology being used.
The dwelling uses Liquid Petroleum Gas (LPG) for cooking, equivalent to 36 kWh m−2 y−1 with an efficiency of 0.47, resulting in net energy for cooking 17 kWh m−2 y−1. Electricity use for cooling needs is calculated with an energy efficiency coefficient (COP) of 3.00, resulting in 27 kWh m−2 y−1. Electricity use for lighting, refrigerator and appliances is 53 kWh m−2 y−1. The total electricity use is 80 kWh m−2 y−1 and solar electricity amounting to 316 kWh m−2 y−1 is produced on-site (by using equation (3)).
From LPG and electricity delivered energy flows, the primary energy is calculated using a conversion factor of 1.05 and 3.15 [66] for LPG and electricity, respectively, resulting in a total of 290 kWh m−2 y−1.
A grid limit has been established according to refrigerator consumption. In Panama, the refrigerator consumes 26% of the electricity used in the house, and the grid will supply a boundary for the refrigerator with a total of 21 kWh m−2 y−1. The solar installation will supply other electricity needs, and the rest will be exported energy. By applying Equation (1), the primary energy for the system can be estimated, resulting in a net energy balance with a total of 705 kWh m−2 y−1.
By considering a dwelling in Panama City with a net floor area of 60 m2, the following annual net energy needs are required (Figure 12):
- For cooling: 4920 kWh (82 kWh m−2 y−1);
- For lighting: 300 kWh (5 kWh m−2 y−1);
- For the refrigerator: 1260 kWh (21 kWh m−2 y−1);
- For appliances: 1620 kWh (27 kWh m−2 y−1), excluding the refrigerator;
- For cooking: 1020 kWh (17 kWh m−2 y−1).
4.2. Standard Dimension for Dwellings in Panama
There are four ranges of typical dimensions for dwelling in Panama: 60 to 80 m2, 80 to 100 m2, 100 to 120 m2, and 120 to 150 m2. For this study, six different dwelling dimensions have been implemented: 60, 80, 100, 120, 150, and 200 m2.
For this study, all suitable roof area was used for PV application according to the dwelling area. Table 6 presents the results for the dwellings studied. In each case, the net primary energy has a plus total, which indicates that the building produces more energy than it consumes.
A photovoltaic technology was chosen for the building roof area. The selected crystalline (m-Si) solar cell has the highest efficiency available on the market today [67]. A SunPower panel, model SPR-A450-COM [68], with a power of 450 W, an efficiency of 22.2%, and a module area of 2.03 m2, was selected for this study. Here, solar radiation data was obtained from the NREL (National Renewable Energy Laboratory) program [69]. The total cost for the PV module has not been contemplated in this case, only the technical opportunity to produce energy according to the available roof area. As mentioned before, the grid gives 21 kWh m−2 y−1 to maintain the refrigerator in use in permanence; and the other technical needs are supplied by the PV modules, with the final values given in Table 6.
Ten columns (A1–A10) are presented in Table 6. The dwelling area (A1) is the typical building area in Panama, ranging from 60 to 200 m2. The grid (A2) is designed to supply the electricity to the refrigerator, and this is considered as a constant consumption. The energy consumption values (A3) of the cooking and electricity baseline are taken from the National Energy Plan [61] and the Sustainable Construction Guide (Table 4) [59,63,64]. The monthly average cooking for homes is determined by considering a LPG calorific power of 45.67 GJ/kg with a conversion factor of 3.6 GJ/MWh, resulting in 181.62 kWh/month (equivalent to 1.26 LPG cylinder). Thus, the corresponding values in (A3) for annual cooking needs depend on the dwelling floor area, i.e., 181.62 × 12/60 = 36 kWh m−2 y−1 for the 60 m2 dwelling. Note here that one LPG cylinder of 11.34 kg corresponds to 143.86 kWh/cylinder [61], and, thus, 1.26 × 143.86 = 181.62 kWh/month. The electricity consumption in (A3) corresponds to the baseline for dwellings in Table 4, established in [64]. The energy consumption total (A4) is the sum of cooking and electricity in (A3).
The primary energy (A5) corresponds to the energy consumption (A3) considering the energy carriers, e.g., 80 × 3.15 + 36 × 1.05 = 290 kWh m−2 y−1.
The generated energy (A6) is the yearly energy generated with renewable energy, considering the building floor area and using equations (2) and (3). Firstly, the installed power () is calculated by using the SPR-A450-COM power ( W) and the total number of panels for each dwelling, considering that the full roof area is used (e.g., N = 60 m2/2.02 m2 = 29 panels). Hence, kW. The generated electricity per day () is then estimated by using equation (2) and the values are shown in Figure 13 (e.g., = 56.02 kWh d−1 for the 60 m2 dwelling). Finally, in order to calculate the yearly electricity generated, is multiplied by the number of days per month, then, by summing up each monthly electricity generation per floor area, the resulting generated energy (A3) is found.
The primary energy generated (A7) is the generated energy (A6) considering the energy carrier for renewable energy.
For the net primary energy (A8), equation (1) is applied, where the delivered energy corresponds to the cooking plus the grid (A2) and minus the exported energy (A9), each multiplied by the energy carrier. The exported electricity (A9) is the exceeded energy that the building does not require for electricity consumption, e.g., 316 − (80 − 21) = 257 kWh m−2 y −1 corresponding to subtraction of (A6), (A3, Electricity), and (A2). The exported energy primary (A10) is the exported energy (A9) presented in the primary energy value.
4.3. A ZEB Definition for Panama
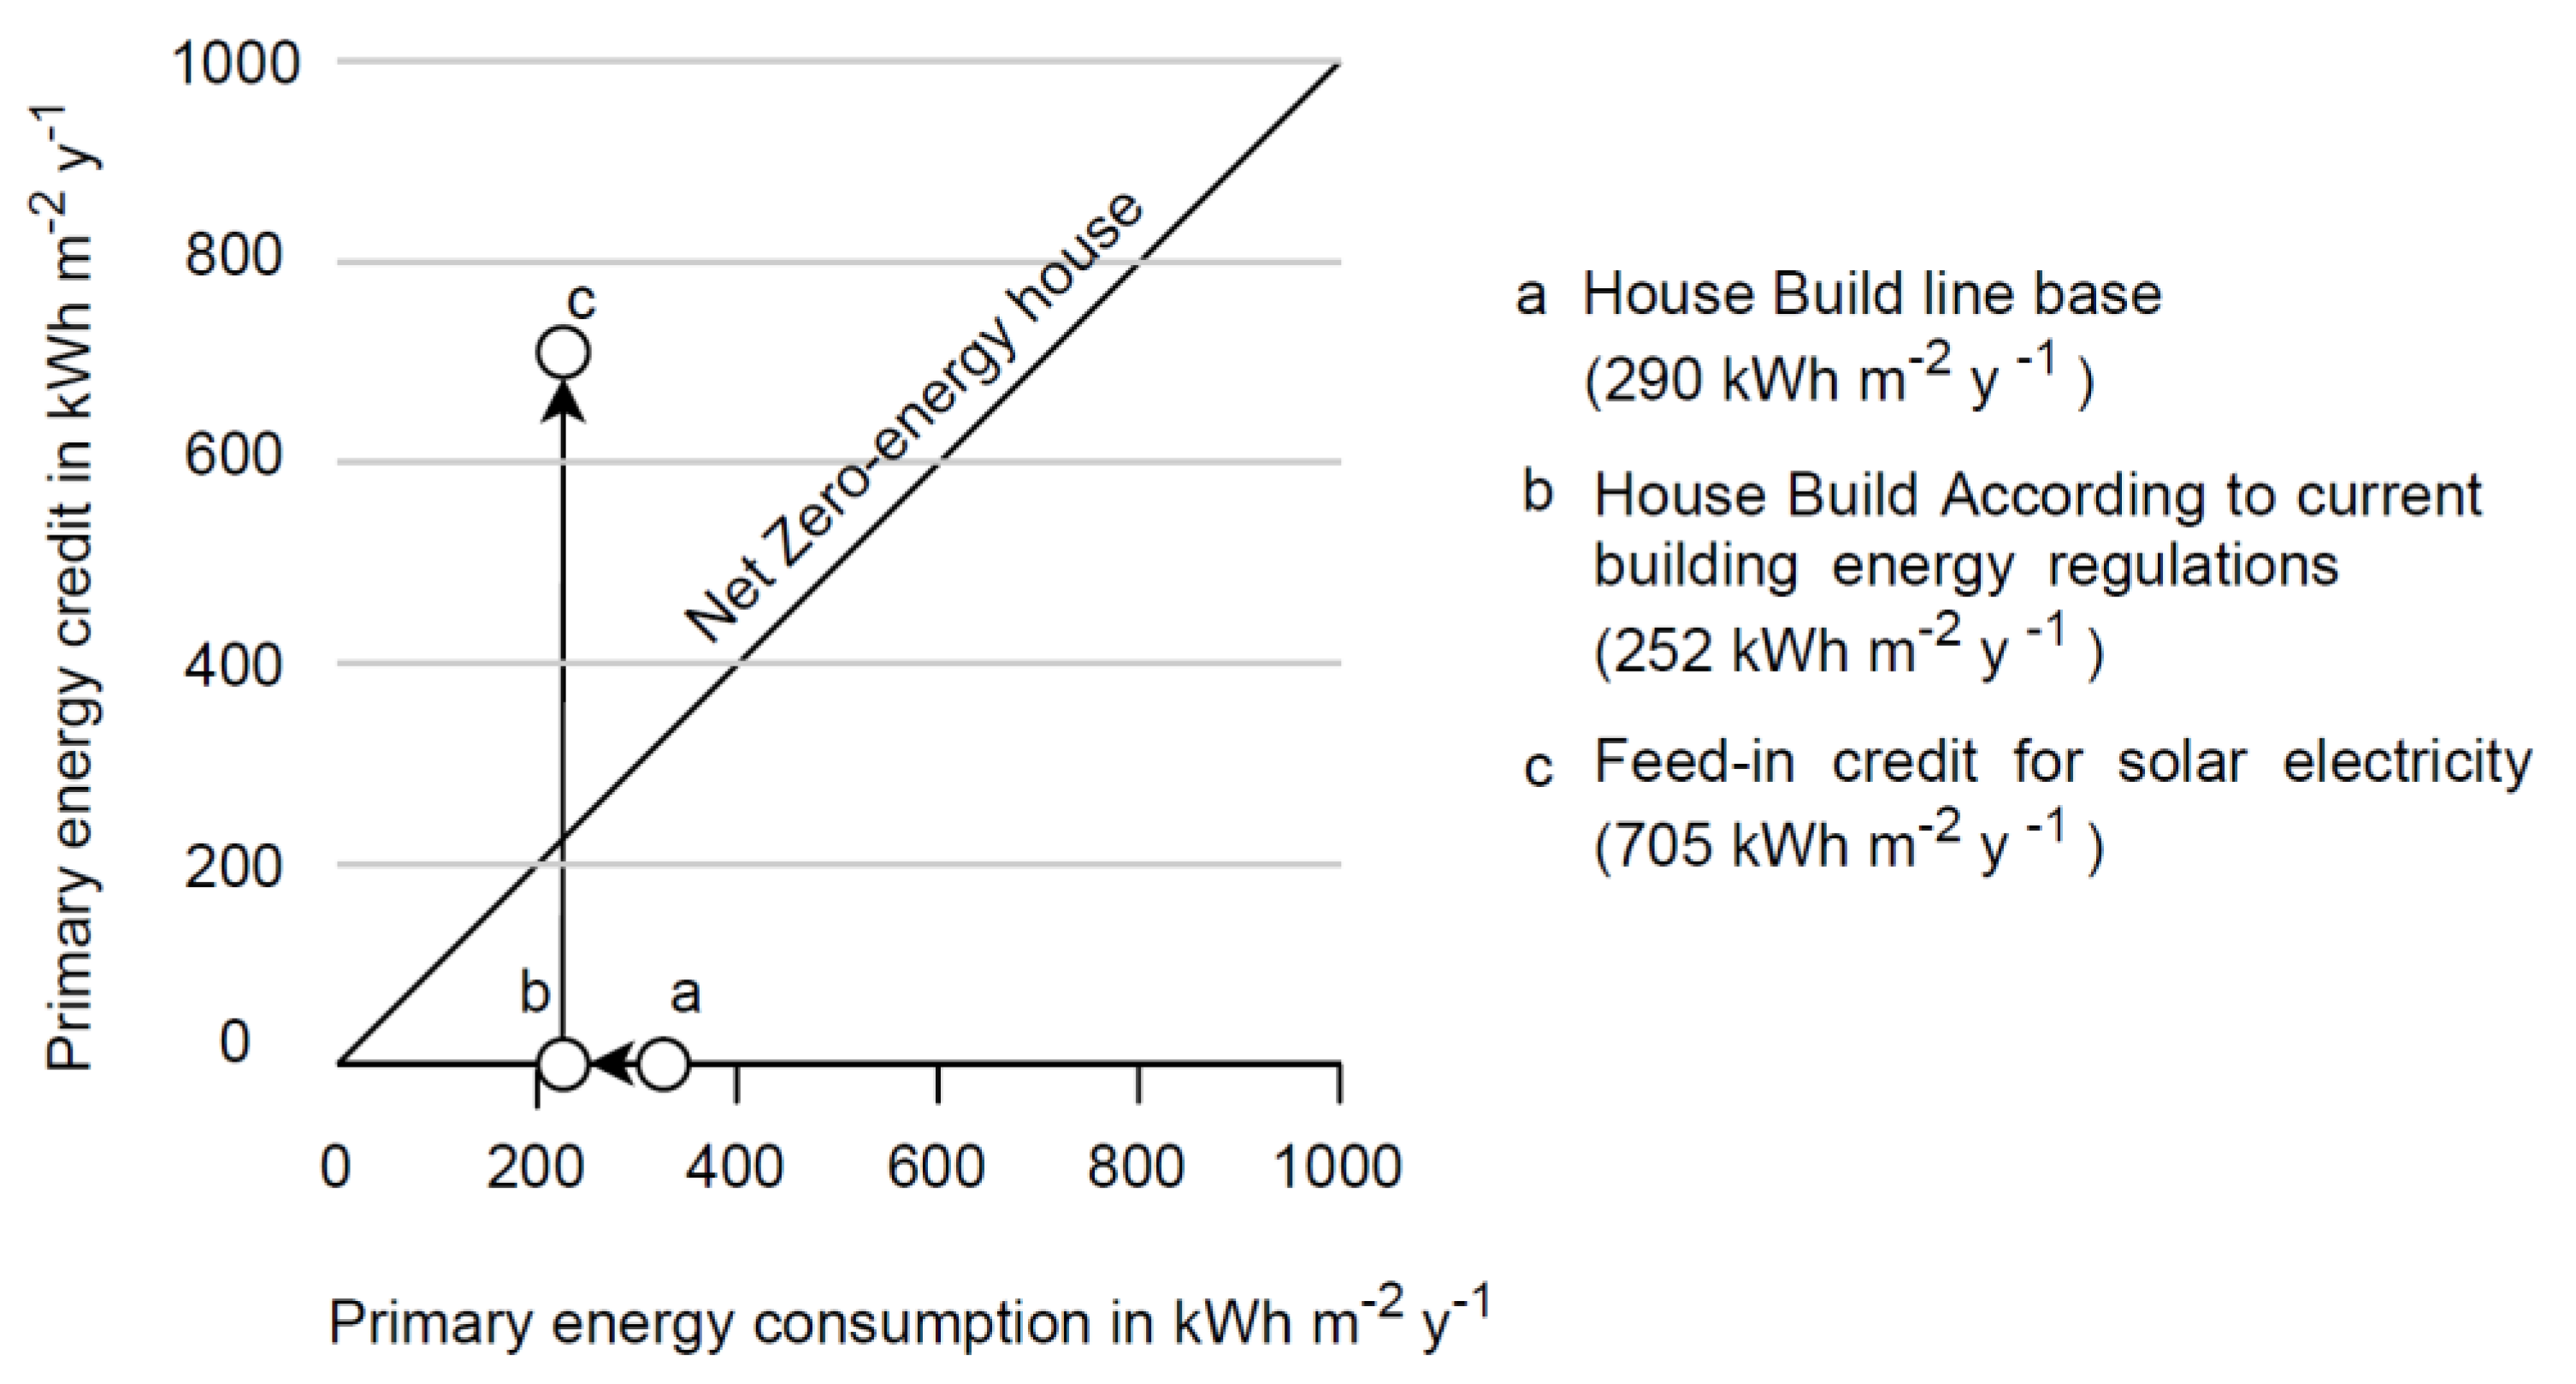
According to the results from the proposed methodology and cases of study, by establishing a baseline electricity need of 252 kWh m−2 y−1 (e.g., 80 kWh m−2 y−1 times the conversion factor 3.15), after applying the current local regulation [65], the new baseline electricity need is reduced to 214 kWh m−2 y−1 (e.g., 68 kWh m−2 y−1 times the conversion factor 3.15). This earlier scenario is represented in Figure 13, including the cooking consumption, by circle “a” and “b,” respectively, for a 60 m2 dwelling. Considering the cooking, the baseline increases to 252 kWh m−2 y−1 (i.e., 68 × 3.15–36 × 1.05, circle “b”).
As proposed in the local regulation, the 214 kWh m−2 y−1 is achieved mainly through passive strategies, such as the envelope enhancement shown in Table 5, but also, in considering highly efficient air conditioner units (COP > 3.00) [65].
The renewable energy generation of PV modules depends on the available roof surface area of the dwelling. In the cases studied, this generation varied from 996 to 1009 kWh m−2 y−1 (316 to 320 kWh m−2 y−1 in primary energy terms). This resulted in a net primary energy balance ranging from 705 to 746 kWh m−2 y−1 (Figure 14 by circle “c”, refer to Table 6, A8), of which the range falls into the definition of a plus energy building, indicating that all cases studied could supply their electricity needs by PV generation.
Note here that all of the dwellings studied have the potential to become NZEB, since the PV electricity generation exceeds the energy consumption. In addition, these dwellings have a strong potential to become plus energy buildings (PEB), depending on the available roof surface area, as shown in Table 6 (A8). Finally, the cases studied showed the resulting primary energy exported to the grid to be between 809 and 823 kWh m−2 y−1.
Although this study shows strong potential to achieve both NZEB and PEB by means of PV generation alone, the value 214 kWh m−2 y−1 could be further reduced if other passive and active strategies, such as those presented in Table 2, are considered. In Panama, other strategies could be implemented to reduce cooling needs, such as a roof heat exchanger [71], bio-inspired reflective-coatings arrangements [72], ventilation systems assisted by solar radiation [73], bioclimatic-based strategies [74], and large-scale solar-assisted absorption air conditioning systems [75]. However, currently, most studies remain in the preliminary research project stage, with strong bases in numerical studies but a lack of more research-based experimental studies. This presents a limitation in estimating a confident reduction percentage in energy consumption if such passive and active strategies may be implemented. Moreover, specifically in Panama, a proposed bio-inspired framework considering a multidisciplinary approach was addressed in [76] for alternative strategies.
5. Discussion
After performing this comprehensive review of past experiences regarding NZEB and nZEB in Latin America and the concept definition, the newest energy regulations implemented in Panama for the minimum energy efficiency requirements for new buildings were evaluated in order to establish the threshold for a local nZEB definition in the residential sector to conceive a theoretical framework for consideration in Panama. Former local regulations regarding appliance, equipment, and lighting energy standards and labeling were also considered, as they marked the way towards improving the energy efficiency of buildings.
The basis for such a threshold for a local nZEB definition in Panama (with a primary energy consumption range) was expected to be similar to the European countries presented in [77] (for instance: 40–65 kWh m−2 y−1 in France, for residential buildings). On the contrary, after calculations, the results presented in Table 6 indicate that the primary energy generated always exceeds the primary energy consumption, where the net primary energy balance lay in a range of 705–746 kWh m−2 y−1 for the cases studied.
This primary energy balance range that was obtained demonstrates that the potential of available renewable energy technology can help to accomplish net zero energy buildings, and indicates that achieving plus energy buildings is possible.
According to the type of climate (Af) and type of building (residential), Panama and Brazil are comparable. In relation to the U-value presented in Panama regarding the regulations for residential building in walls (0.8–4 W m−2 K−1, Table 5), Brazil shows values in the range, whereas the study in Panama shows values below the range (Table 3). In the case of the U-value of the roof (0.50–4.80 W m−2 K−1), Brazil remains in the range and Panama below it. This comparison shows that the range value in Panama regulations can aim towards NZEB. In the study presented for Panama, the U-value was too low, being out of the range according to Panama regulations. Aside from this value, the building was classified as NZEB, but it may not be necessary to use too low U-value in order to achieve a NZEB, as demonstrated in Brazil.
Aw weather is a type of climate in Colombia and Panama. Conventional U-values were shown for Colombia in relation to residential buildings, indicating that they are in the range of the Panama regulations. Colombia improved the U-values in comparison to Panama, as they were below the range. Comparing the tendency as before (Brazil in comparison to Panama) may lead to the conclusion that to be classified as a nZEB, it may not be necessary to use too low a U-value.
For the Cfb type of climate in Brazil and Panama, the U-value of the roof and walls in residential buildings are in the range of Panama regulations, giving a NZEB for the country using passive saving strategies.
Moreover, comparing the baseline of primary energy consumption, as presented in Table 4, for different sectors in Panama and the available primary energy generated (Table 6) shows that PEB can also be achievable in other sectors.
This finding can open a wide range of new possibilities in the local market, increasing the potential for new energy policies, and providing the basis for undertaking a significant step towards transforming smart cities. In this regard, European energy and research programs have shown strong interest in collaborating with Latin American countries to help reach global energy goals [78].
To evaluate the potential of largely introducing the nZEB concept and the proposed framework in Panama, a SWOT analysis is presented in Table 7. Although the economic aspects involved in ZEB are not covered here, a large market and economic analysis, such as the one performed in [16], will be of great interest in supporting and providing a feasibility study with tangible figures.
As presented in Table 7, opportunities and weaknesses appear to reinforce the applicability of the ZEB framework in Panama. As for most Latin American countries, W1, W6, and T2 attain an actual situation, as in Panama, and might be limiting the potential to go further in the application of ZEB beyond remaining in a preliminary research stage. The analysis in Section 2 has shown that Brazil is the strongest country in terms of ZEB applications in Latin America, sharing similar idiosyncrasies and reality as Panama. As such, Brazil could serve as a good example to remove the limitations to achieving ZEB on a wider scale. Recent significant studies continue to improve the ZEB definition in Brazil, highlighting that the first step towards implementing both nZEB and NZEB concepts is the application of passive strategies to reduce the energy need with thermal comfort [84], complying with S1, S2, and S4 (Table 7).
Specifically in Panama City, the residential sector and all sectors new buildings show higher potential than existing high-rise buildings in the commercial and public sector. This is mainly due to a great glazing surface area with no available openings in high-rise buildings near the coast, which demand a non-stop air conditioning activated system to assure both indoor thermal comfort and air quality in permanence; this is evidenced in T2 and T4, and laying in accordance with W5 (Table 7); clearly against all beforehand studies about bioclimatic architecture in tropical climates. Such existing full-glazing high-rise buildings might need to undergo strong retrofit processes. In this matter, a reference retrofit framework to achieve NZEB has been recently proposed by [85], where an office building was used as a case study. Here, beginning again with passive strategies where the surface-to-volume ratio (A/V), building envelope area, height, window shading, window–wall ratio (WWR), glass solar heating gain coefficient (SHGC), light transmissivity, and natural ventilation were the most-discussed variables regarding energy efficiency. Office equipment, air-conditioning systems, and lighting efficiency were optimized subsequently. The results showed an energy consumption decrease of 46% from 115 to 63 kWh m−2 y−1 from the original model to the optimized one. By taking such energy consumption as references and comparing them with the resulting ZEB definition of 252 kWh m−2 y−1, and after considering the newest building regulations in Panama, more aggressive energy policies need to be implemented.
6. Conclusions
The building efficiency codes are important regulatory tools that establish the minimum and maximum levels of energy efficiency for different building types, where the most demanding building energy codes in the world require buildings to be net-zero energy. Latin American countries are still trying to find adequate solutions that align with the local climatic, cultural, social, technical, and economic context. Thus, a comprehensive review on the available research from past experiences regarding NZEB and nZEB in Latin America has been presented here to help provide the basis for ZEB framework in Panama. This can be taken as a reference in terms of experiences, regulations, and efforts. Hence, the following main aspects can be highlighted from the literature review:
- The ZEB concept has been applied in residential buildings far more often than for any other building type, successfully reaching the net-zero energy balance, even for different climates, which results in different amounts of energy being generated even with the same technology.
- Passive strategies have been mainly favored, outlying other strategies, where envelope characteristic’s enhancements are most often implemented, indicating that the ZEB concept has been concretely respected. In such cases, the envelope U-values tend to decrease, often reaching isolation-like levels.
- The U-values depend on the materials implemented, the discrepancies encountered between different climates and countries, or even the same climate type for the same country, contributing to the realization that a strong building performance energy regulation is lacking. However, the ZEB philosophy has been explored in LA with encouraging figures.
- For most Latin American countries, the applicability of the ZEB concept definition remains in a research project status, leading from slight to no considerations to energy policies establishments.
- Regarding the analyzed cases studied, the following highlights can be listed:
- The newest energy regulations implemented in Panama for minimum energy efficiency requirements for new buildings were evaluated by defining a system boundary to describe the net delivered energy for the residential sector.
- The installed power method was employed to estimate the generated energy by photovoltaic modules covering all the available roof surface areas.
- To establish the basis of the renewable threshold for a local nZEB definition in the residential sector, a theoretical framework for application in Panama was proposed and applied to the different cases studied.
- The results showed that the primary energy generated exceeded the primary energy consumption where the net primary energy balance lay in a range of 705 to 746 kWh m−2 y−1 for the cases studied. This demonstrates that the potential of available renewable energy technology can help to accomplish net zero energy buildings and that grasping plus energy buildings is possible.
- A SWOT analysis is presented to evaluate the potential of mainly introducing the nZEB concept and the proposed framework in Panama.
These findings can open a wide range of new possibilities in the local market, increasing the potential for other energy policies and providing the basis for undertaking a significant step towards transforming smart cities. In addition, the distributed/on-site renewable resource generation and resource storage are topics to be further developed.
Since the newest national regulation in Panama considers passive solutions regarding the envelope construction and conventional equipment efficiency for cooling needs, further work should address implementing low-consumption solutions, such as automation for energy consumption management regarding occupancy behavior, green roofs, PCM-based active systems, and others. Implementing such low-consumption solutions can help to lower the 15% energy saving assured by the currently proposed solutions in the national regulations.
Author Contributions
Original concept and supervision by M.C.A. and D.M. Editing, conceptualization by M.C.A. and formal analysis by K.C.-C.; introduction, figures, and writing of most of the manuscript by M.C.A. All authors have read and agreed to the published version of the manuscript.
Funding
This research was funded by the Panamanian Institution Secretaría Nacional de Ciencia, Tecnología e Innovación SENACYT (https://www.senacyt.gob.pa/, accessed on 6 September 2021), under the project code FID18-056, as well as supported by the Sistema Nacional de Investigación (SNI).
Institutional Review Board Statement
Not applicable.
Informed Consent Statement
Not applicable.
Data Availability Statement
Not applicable.
Acknowledgments
The authors would like to thank the Faculty of Mechanical Engineering within the Universidad Tecnológica de Panamá for their collaboration, together with the Research Group ECEB (https://eceb.utp.ac.pa/, accessed on 6 September 2021).
Conflicts of Interest
The funders where not involved in any part of this study.
Nomenclature
| AEE | Annualized embodied energy |
| BIPV | Building integrated photovoltaics |
| COP | Coefficient of performance |
| GHG | Greenhouse gas |
| LA | Latin American |
| LC-ZEB | Life cycle zero energy building |
| nZEB | Nearly zero energy building |
| NZEB | Neat zero energy building |
| PEB | Plus energy building |
| PCM | Phase change materials |
| PV | Photovoltaic |
| SWOT | Strengths, Weaknesses, Opportunities and Threats |
| U-value | Transmittance values |
| ZEB | Zero energy building |
References
- Attia, S. Net Zero Energy Buildings (NZEB): Concepts, Frameworks and Roadmap for Project Analysis and Implementation; Elsevier: Amsterdam, The Netherlands, 2018; ISBN 978-0-12-812461-1. [Google Scholar]
- Directive 2010/31/EU of the European Parliament and of the Council of 19 May 2010 on the Energy Performance of Buildings. Available online: https://eur-lex.europa.eu/legal-content/en/TXT/?uri=CELEX%3A32010L0031 (accessed on 10 May 2020).
- D’Agostino, D.; Zangheri, P. Development of the NZEBs Concept in Member States, p. 47. Available online: https://ec.europa.eu/jrc (accessed on 10 May 2020).
- Ecofys Germany GmbH; Danish Building Research Institute (SBi). Principles for Nearly Zero-Energy Buildings. Paving the Way for Effective Implementation of Policy Requirements. November 2011. Available online: https://www.bpie.eu/publication/principles-for-nearly-zero-energy-buildings/ (accessed on 10 May 2020).
- Ecofys: Andreas Hermelink, Sven Schimschar, Thomas Boermans Politecnico di Milano/eERG: Lorenzo Pagliano, Paolo Zangheri, Roberto Armani University of Wuppertal: Karsten Voss, Eike Musall. Towards Nearly Zero Energy Buildings Definition of Common Principles under the EPBD. 14 February 2013. Available online: https://ec.europa.eu/energy/sites/ener/files/documents/nzeb_full_report.pdf (accessed on 4 June 2020).
- Voss, K.; Sartori, I.; Napolitano, A.; Geier, S.; Gonçalves, H.; Hall, M.; Heiselberg, P.; Widén, J.; Candanedo, J.A.; Musall, E.; et al. Load Matching and Grid Interaction of Net Zero Energy Buildings. In Proceedings of the EuroSun 2010 Conference, Graz, Austria, 28 September–1 October 2010; pp. 1–8. [Google Scholar] [CrossRef] [Green Version]
- Sartori, I.; Napolitano, A.; Marszal, A.; Pless, S.; Torcellini, P.; Voss, K. Criteria for Definition of Net Zero Energy Buildings. In Proceedings of the EuroSun 2010 Conference, Graz, Austria, 28 September–1 October 2010; pp. 1–8. [Google Scholar] [CrossRef] [Green Version]
- Marszal, A.J.; Heiselberg, P.; Bourrelle, J.S.; Musall, E.; Voss, K.; Sartori, I.; Napolitano, A. Zero Energy Building—A review of definitions and calculation methodologies. Energy Build. 2011, 43, 971–979. [Google Scholar] [CrossRef]
- Attia, S.; Eleftheriou, P.; Xeni, F.; Morlot, R.; Ménézo, C.; Kostopoulos, V.; Betsi, M.; Kalaitzoglou, I.; Pagliano, L.; Cellura, M.; et al. Overview and future challenges of nearly zero energy buildings (nZEB) design in Southern Europe. Energy Build. 2017, 155, 439–458. [Google Scholar] [CrossRef]
- Gaglia, A.G.; Tsikaloudaki, A.G.; Laskos, C.M.; Dialynas, E.N.; Argiriou, A.A. The impact of the energy performance regulations’ updated on the construction technology, economics and energy aspects of new residential buildings: The case of Greece. Energy Build. 2017, 155, 225–237. [Google Scholar] [CrossRef]
- Monzón-Chavarrías, M.; López-Mesa, B.; Resende, J.; Corvacho, H. The nZEB concept and its requirements for residential buildings renovation in Southern Europe: The case of multi-family buildings from 1961 to 1980 in Portugal and Spain. J. Build. Eng. 2021, 34, 101918. [Google Scholar] [CrossRef]
- López-Ochoa, L.M.; Las-Heras-Casas, J.; Olasolo-Alonso, P.; López-González, L.M. Towards nearly zero-energy buildings in Mediterranean countries: Fifteen years of implementing the Energy Performance of Buildings Directive in Spain (2006–2020). J. Build. Eng. 2021, 44, 102962. [Google Scholar] [CrossRef]
- Fokaides, P.A.; Polycarpou, K.; Kalogirou, S. The impact of the implementation of the European Energy Performance of Buildings Directive on the European building stock: The case of the Cyprus Land Development Corporation. Energy Policy 2017, 111, 1–8. [Google Scholar] [CrossRef]
- Feng, W.; Zhang, Q.; Ji, H.; Wang, R.; Zhou, N.; Ye, Q.; Hao, B.; Li, Y.; Luo, D.; Lau, S.S.Y. A review of net zero energy buildings in hot and humid climates: Experience learned from 34 case study buildings. Renew. Sustain. Energy Rev. 2019, 114, 109303. [Google Scholar] [CrossRef]
- Lan, L.; Wood, K.L.; Yuen, C. A holistic design approach for residential net-zero energy buildings: A case study in Singapore. Sustain. Cities Soc. 2019, 50, 101672. [Google Scholar] [CrossRef]
- Gholami, H.; Røstvik, H.N.; Müller-Eie, D. Holistic economic analysis of building integrated photovoltaics (BIPV) system: Case studies evaluation. Energy Build. 2019, 203, 109461. [Google Scholar] [CrossRef]
- Li, X.; Lin, A.; Young, C.-H.; Dai, Y.; Wang, C.-H. Energetic and economic evaluation of hybrid solar energy systems in a residential net-zero energy building. Appl. Energy 2019, 254, 113709. [Google Scholar] [CrossRef]
- De Silva, M.N.K.; Sandanayake, Y.G. Building Energy Consumption Factors: A Literature Review and Future Research Agenda. 2012. Available online: https://www.irbnet.de/daten/iconda/CIB_DC25108.pdf (accessed on 6 September 2020).
- Carpino, C.; Mora, D.; Arcuri, N.; De Simone, M. Behavioral variables and occupancy patterns in the design and modeling of Nearly Zero Energy Buildings. Build. Simul. 2017, 22, 875–888. [Google Scholar] [CrossRef]
- Pless, S.; Torcellini, P. Net-Zero Energy Buildings: A Classification System Based on Renewable Energy Supply Options; NREL/TP-550-44586; National Renewable Energy Lab. (NREL): Golden, CO, USA, 2010; p. 983417. [CrossRef] [Green Version]
- Torcellini, P.; Pless, S.; Deru, M. Zero Energy Buildings: A Critical Look at the Definition; Preprint. Available online: https://www.eceee.org/library/conference_proceedings/ACEEE_buildings/2006/Panel_3/p3_24/ (accessed on 10 July 2020).
- Kurnitski, J. How to Define Nearly Net Zero Energy Buildings nZEB. Available online: https://www.rehva.eu/fileadmin/hvac-dictio/03-2011/How_to_define_nearly_net_zero_energy_buildings_nZEB.pdf (accessed on 10 July 2020).
- Hernandez, P.; Kenny, P. From net energy to zero energy buildings: Defining life cycle zero energy buildings (LC-ZEB). Energy Build. 2010, 42, 815–821. [Google Scholar] [CrossRef]
- Hoque, S. Net Zero Energy Homes: An Evaluation of Two Homes in the Northeastern United States. J. Green Build. 2010, 5, 79–90. [Google Scholar] [CrossRef]
- Asadi, S.; Nazari-Heris, M.; Nasab, S.R.; Torabi, H.; Sharifironizi, M. An updated review on net-zero energy and water buildings: Design and operation. In Food-Energy-Water Nexus Resilience and Sustainable Development; Springer: Berlin/Heidelberg, Germany, 2020; pp. 267–290. [Google Scholar] [CrossRef]
- D’Agostino, D.; Mazzarella, L. What is a Nearly zero energy building? Overview, implementation and comparison of definitions. J. Build. Eng. 2019, 21, 200–212. [Google Scholar] [CrossRef]
- Williams, J.; Mitchell, R.; Raicic, V.; Vellei, M.; Mustard, G.; Wismayer, A.; Yin, X.; Davey, S.; Shakil, M.; Yang, Y.; et al. Less is more: A review of low energy standards and the urgent need for an international universal zero energy standard. J. Build. Eng. 2016, 6, 65–74. [Google Scholar] [CrossRef] [Green Version]
- WORLDBAL_Documentation.pdf All Rights Reserved. Available online: https://iea.blob.core.windows.net/assets/fffa1b7d-b0c5-4e64-86aa-5c9421832d73/WORLDBAL_Documentation.pdf (accessed on 8 May 2020).
- Energy Use (kg of Oil Equivalent per Capita)–Latin America & Caribbean, Argentina, Bolivia, Brazil, Chile, Colombia|Data. Available online: https://data.worldbank.org/indicator/EG.USE.PCAP.KG.OE?end=2014&locations=ZJ-AR-BO-BR-CL-CO&start=2014&view=bar (accessed on 8 May 2020).
- Reus-Netto, G.; Mercader-Moyano, P.; Czajkowski, J.D. Methodological Approach for the Development of a Simplified Residential Building Energy Estimation in Temperate Climate. Sustainability 2019, 11, 4040. [Google Scholar] [CrossRef] [Green Version]
- Layke, J.; Mackres, E.; Liu, S.; Aden, N.; Becqué, R. Accelerating Building Efficiency: Eight Actions for Urban Leaders. 2016. Available online: https://www.wri.org/research/accelerating-building-efficiency (accessed on 24 May 2021).
- Harkouss, F. Optimal Design of Net Zero Energy Buildings under Different Climates. 2018. Available online: https://tel.archives-ouvertes.fr/tel-01891916 (accessed on 11 July 2020).
- Transparency, C. The G20 Transition Towards a Net-Zero Emissions Economy. Argentina. 2019. Available online: https://www.climate-transparency.org/wp-content/uploads/2019/11/B2G_2019_Argentina.pdf (accessed on 15 June 2020).
- Daniel, J.; Fernanda, A. Edificio de Oficinas de Baja Energía en Llavallol, Buenos Aires. Una Experiencia Universidad—Empresa. 2015. Available online: https://idus.us.es/bitstream/handle/11441/48621/56.pdf?sequence=1 (accessed on 15 June 2020).
- Camporeale, P.E.; Mercader-Moyano, P. Towards nearly Zero Energy Buildings: Shape optimization of typical housing typologies in Ibero-American temperate climate cities from a holistic perspective. Sol. Energy 2019, 193, 738–765. [Google Scholar] [CrossRef]
- Arballo, B.; Kuchen, E.; Frank, A.; Alamino, Y. Estrategias de Ocupación, Operación y Gestión de Energía Casi Nula para el Edificio de Rectorado UNSJ, San Juan, Argentina. Construible, 2016. Available online: https://www.construible.es/comunicaciones/estrategias-ocupacion-operacion-gestion-energia-casi-nula-edificio-rectorado-unsj-san-juan-argentina (accessed on 15 April 2020).
- Transparency, C. The G20 Transition Towards a Net-Zero Emissions Economy. Brazil. 2019. Available online: https://www.climate-transparency.org/wp-content/uploads/2019/11/B2G_2019_Brazil.pdf (accessed on 15 June 2020).
- Didone, E.L. Parametric Study for Net Zero Energy Building Strategies in Brazil Considering Semi-Transparent PV Windows. Ph.D. Thesis, Department of Architecture-Karlsruhe Institute of Technology, Karlsruhe, Germany, 2014. [Google Scholar] [CrossRef]
- Domingos, R.M.A.; Gabriel, E.; Guarda, E.L.A.; Pereira, F.O.R. Assessment of technical-financial analysis of a zero energy building for Brazilian hot and temperate tropical climate. IOP Conf. Ser. Mater. Sci. Eng. 2019, 609, 072013. [Google Scholar] [CrossRef] [Green Version]
- Piderit, M.B.; Vivanco, F.; Van Moeseke, G.; Attia, S. Net Zero Buildings—A Framework for an Integrated Policy in Chile. Sustainability 2019, 11, 1494. [Google Scholar] [CrossRef] [Green Version]
- Besser, D.; Vogdt, F.U. First steps towards low energy buildings: How far are Chilean dwellings from nearly zero-energy performances? Energy Procedia 2017, 132, 81–86. [Google Scholar] [CrossRef]
- Pinto, G.A.O.; Nova, D.A.S.; Calderón, N.C.B.; OrdonezPlata, G. Energy considerations of social dwellings in Colombia accotding to NZEB concept. DYNA 2015, 82, 120–130. [Google Scholar] [CrossRef]
- Tewari, R. Net-Zero Energy Housing Virtual Article 6 Pilot. 2020. Available online: https://newclimate.org/2020/01/29/net-zero-energy-housing-virtual-article-6-pilot-net-zero-energy-buildings-in-cartagena-colombia/ (accessed on 11 July 2020).
- Collado, N.; Himpe, E.; González, D.; Rueda, L. Retos para una Definición de ‘Edificios de Consumo Energético casi Nulo’. Challenges for a Definition of Nearly Zero Energy Buildings. Rev. Ing. Constr. 2019, 34, 321–329. [Google Scholar] [CrossRef] [Green Version]
- Baldoquin, N.C.; Guzman, L.A.R.; Couret, D.G.; Janssens, A. Teaching about Nearly Zero Energy Buildings in the Architecture Curriculum in Havana, Cuba. 2018. Available online: https://biblio.ugent.be/publication/8589635 (accessed on 11 July 2020).
- Baldoquin, N.C.; Guzmán, L.A.R.; Couret, D.G. Hoteles de Consumo Energético Casi Nulo. Potencialidades y Restricciones para Cuba. 2018. Available online: https://www.researchgate.net/publication/330542847_HOTELES_DE_CONSUMO_ENERGETICO_CASI_NULO_POTENCIALIDADES_Y_RESTRICCIONES_PARA_CUBA (accessed on 12 July 2020).
- Ordoñez, E.; Mora, E.; Gaudry, K. Roadmap Toward NZEBs in Quito. IOP Conf. Ser. Mater. Sci. Eng. 2019, 609, 072040. [Google Scholar] [CrossRef]
- Montalvo, M.E.B. Estudio de Factibilidad Económico y Financiera Utilizando Tecnología Net Zero Energy para un Proyecto de Vivienda Familiar de Clase Media Urbana en la Ciudad de Quito. 2016. Available online: http://bibdigital.epn.edu.ec/handle/15000/15285 (accessed on 12 July 2020).
- Pérez Pérez, M.; Márquez Pérez, L.A. Ecoinvolúcrate, la Estrategia de Ecuador para la Construcción de Edificios de Energía Casi Nula. Construible, 2016. Available online: https://www.construible.es/comunicaciones/ecoinvolucrate-estrategia-ecuador-construccion-edificios-energia-casi-nula (accessed on 14 April 2020).
- NZEB-El Salvador: El Edificio de Cero Energía Neta de US$400.000. Revista Construir, 5 March 2020. Available online: https://revistaconstruir.com/nzeb-el-salvador-el-edificio-de-cero-energia-neta-de-us400-000/ (accessed on 16 April 2020).
- Guenther, R.; Vittori, G. Sustainable Healthcare Architecture; John Wiley & Sons: Hoboken, NJ, USA, 2013; ISBN 978-1-118-08682-7. [Google Scholar]
- Transparency, C. The G20 Transition Towards a Net-Zero Emissions Economy. Mexico. 2019. Available online: https://www.climate-transparency.org/wp-content/uploads/2019/11/B2G_2019_Mexico.pdf (accessed on 15 June 2020).
- México, E. Edificios Certificados con Energía Cero. 2018. Available online: https://www.revistaequipar.com/mexico/contenido-editorial/edificios-certificados-con-energia-cero (accessed on 21 April 2020).
- Hoque, S.; Iqbal, N. Building to Net Zero in the Developing World. Buildings 2015, 5, 56–68. [Google Scholar] [CrossRef] [Green Version]
- Mora, D.; Araúz, J.; Austin, M.C. Towards Nearly Zero Energy Buildings in Panama through Low-Consumption Techniques: A Numerical Study. In Proceedings of the 74th ATI National Congress Italie-AIP Conference Proceddings, Modena, Italy, 11–13 September 2019; p. 020114. [Google Scholar] [CrossRef]
- Proposals—APEC Nearly (Net) Zero Energy Building Roadmap. 2016. Available online: https://aimp2.apec.org/sites/PDB/Lists/Proposals/DispForm.aspx?ID=1942 (accessed on 21 April 2020).
- BSUsolar. Proyecto Destacado—Residencia Nzeb en Uruguay. 2019. Available online: https://5b00fd61-12f8-440c-80b9-098f6e1bc274.filesusr.com/ugd/a1167a_d3e9d85fdcc048c0a9a95fc08f1cced9.pdf (accessed on 16 June 2020).
- Rüther, R.; Urbanetz, J.; Zomer, C. On the Compromises between Form and Function in Grid-Connected Building-Integrated Photovoltaics (BIPV) at Low-Latitude Sites. International Solar Energy Society, 2011. Available online: http://proceedings.ises.org/citation?doi=swc.2011.17.32 (accessed on 17 June 2020).
- Gaceta Oficial, Resolución N°3142, 17 November 2016. 2016. Available online: https://www.gacetaoficial.gob.pa/pdfTemp/28165/GacetaNo_28165_20161124.pdf (accessed on 20 July 2020).
- SNE, P. Secretaría Nacional de Energía de Panama. 2020. Available online: http://www.naturgy.com.pa/pa/conocenos/la+compania/1297100717349/regulacion+del+mercado+energetico+en+panama.html (accessed on 6 September 2021).
- Plan Energético Nacional de Panama. 2016, p. 343. Available online: https://www.senacyt.gob.pa/wp-content/uploads/2018/12/3.-Plan-Energetico-Nacional-2015-2050-1.pdf (accessed on 6 September 2021).
- Gaceta Oficial No. 28434-A, por la Cual se Aprueba el Reglamento Tecnico DGNTI-COPANIT. Ministerio de Comercio e Industrias, 2017. Available online: https://www.gacetaoficial.gob.pa/pdfTemp/28434_A/GacetaNo_28434a_20171228.pdf (accessed on 24 May 2021).
- Comisión Económica para América Latina y el Caribe (CEPAL). Informe Nacional de Monitoreo de la Eficiencia Energética de Panamá, 2020. Available online: https://www.cepal.org/es/publicaciones/46536-informe-nacional-monitoreo-la-eficiencia-energetica-panama-2020 (accessed on 6 September 2020).
- Gaceta Oficial, Resolución N°3980, 8 Octubre 2018. 2018. Available online: http://www.energia.gob.pa/?mdocs-file=2028 (accessed on 22 August 2021).
- Gaceta Oficial, Resolución de la JTIA N°035, 26 de Junio 2019. 2019. Available online: https://www.gacetaoficial.gob.pa/pdfTemp/28820/GacetaNo_28820_20190718.pdf (accessed on 20 June 2020).
- A Common Definition for Zero Energy Buildings. Available online: https://www.energy.gov/sites/prod/files/2015/09/f26/A%20Common%20Definition%20for%20Zero%20Energy%20Buildings_0.pdf (accessed on 13 July 2020).
- Best Solar Panels in 2020 [Complete List]|EnergySage. Solar News, 13 September 2016. Available online: https://news.energysage.com/best-solar-panels-complete-ranking/ (accessed on 8 September 2020).
- SunPower. A-Series Solar Panels. SunPower—United States. 27 February 2019. Available online: https://us.sunpower.com/solar-panels-technology/a-series-solar-panels (accessed on 22 August 2021).
- PVWatts Calculator. Available online: https://pvwatts.nrel.gov/pvwatts.php (accessed on 8 September 2020).
- Heinze, M.; Voss, K. Goal: Zero Energy Building Exemplary Experience Based on the Solar Estate Solarsiedlung Freiburg am Schlierberg, Germany. J. Green Build. 2009, 4, 93–100. [Google Scholar] [CrossRef] [Green Version]
- Labastid, D.; Bolobosky, M.; Mogollón, L.; James, A. Implementación de un Intercambiador de Calor en Techos de Zinc. KnE Eng. 2018, 3, 747–757. [Google Scholar] [CrossRef] [Green Version]
- Araque, K.; Palacios, P.; Mora, D.; Austin, M.C. Biomimicry-Based Strategies for Urban Heat Island Mitigation: A Numerical Case Study under Tropical Climate. Biomimetics 2021, 6, 48. [Google Scholar] [CrossRef] [PubMed]
- Díaz, J.A.; Caballero, A.; Chambers, H. Evaluación de sistemas de ventilación utilizando la radiación solar. I+D Tecnol. 2015, 11, pp. 35–40. Available online: https://revistas.utp.ac.pa/index.php/id-tecnologico/article/view/17 (accessed on 14 April 2020).
- Austin, M.C.; Castillo, M.; Silva, Á.D.M.D.; Mora, D. Numerical Assessment of Bioclimatic Architecture Strategies for Buildings Design in Tropical Climates: A Case of Study in Panama. E3S Web Conf. 2020, 197, 02006. [Google Scholar] [CrossRef]
- Quintana, E.; Díaz, R. Simulación de un Sistema de Acondicionamiento de Aire por Absorción Con Asistencia Solar en Panamá Utilizando TRNSYS. I+D Tecnol. 2013, 9, 2. Available online: https://revistas.utp.ac.pa/index.php/id-tecnologico/article/view/83 (accessed on 27 August 2021).
- Austin, M.C.; Garzola, D.; Delgado, N.; Jiménez, J.U.; Mora, D. Inspection of Biomimicry Approaches as an Alternative to Address Climate-Related Energy Building Challenges: A Framework for Application in Panama. Biomimetics 2020, 5, 40. [Google Scholar] [CrossRef]
- D’Agostino, D.; Zangheri, P.; Castellazzi, L. Towards Nearly Zero Energy Buildings in Europe: A Focus on Retrofit in Non-Residential Buildings. Energies 2017, 10, 117. [Google Scholar] [CrossRef]
- Austin, M.C.; Boya, C.; Mora, D.Y. Improving building energy performance by addressing today’s demand-side challenges: A review of contributions from Latin America. Novasinergia 2020, 3, 2. [Google Scholar] [CrossRef]
- Energy Efficiency in Chilean School Buildings: A Nzeb Aproach. Available online: http://civil.uminho.pt/urbenere/wp-content/uploads/2018/05/E9.pdf (accessed on 14 July 2020).
- Attia, S.; Piderit, B.; Van Moeseke, G. Resilience & Net-Zero Energy Buildings in Chile. 2018. Available online: https://www.researchgate.net/publication/327437686_Resilience_and_Net-Zero_Energy_Buildings_in_Chile (accessed on 20 June 2020).
- Zhang, L.; Guo, S.; Wu, Z.; Alsaedi, A.; Hayat, T. SWOT Analysis for the Promotion of Energy Efficiency in Rural Buildings: A Case Study of China. Energies 2018, 11, 851. [Google Scholar] [CrossRef] [Green Version]
- Markovska, N.; Taseska, V.; Pop-Jordanov, J. SWOT analyses of the national energy sector for sustainable energy development. Energy 2009, 34, 752–756. [Google Scholar] [CrossRef]
- Liu, G.; Zheng, S.; Xu, P.; Zhuang, T. An ANP-SWOT approach for ESCOs industry strategies in Chinese building sectors. Renew. Sustain. Energy Rev. 2018, 93, 90–99. [Google Scholar] [CrossRef]
- Resende, J.; Monzón-Chavarrías, M.; Corvacho, H. The applicability of nearly/net zero energy residential buildings in Brazil—A study of a low standard dwelling in three different Brazilian climate zones. Indoor Built Environ. 2020, 1–21. [Google Scholar] [CrossRef]
- Costa, J.F.W.; Amorim, C.N.D.; Silva, J.C.R. Retrofit guidelines towards the achievement of net zero energy buildings for office buildings in Brasilia. J. Build. Eng. 2020, 32, 101680. [Google Scholar] [CrossRef]
Figure 1.
Industrial countries roadmap [1].
Figure 1.
Industrial countries roadmap [1].

Figure 2.
Non-industrial countries roadmap [1].
Figure 2.
Non-industrial countries roadmap [1].

Figure 3.
A graphical representation of the zero-energy building concept [23].
Figure 3.
A graphical representation of the zero-energy building concept [23].

Figure 4.
Research strategy flow followed in this study.

Figure 5.
Search procedure for the inspection of the literature.

Figure 6.
Energy use per year in Latin America [29].
Figure 6.
Energy use per year in Latin America [29].

Figure 7.
ZEB types arranged by climate type and strategy.

Figure 8.
(a) Energy strategy according to climate type, and (b) building and ZEB type.

Figure 9.
The procedure to define the energy limits for nZEB in Panama.

Figure 10.
System Boundary (adapted from [22]).
Figure 10.
System Boundary (adapted from [22]).

Figure 11.
Building energy consumption in Panama: (a) per sector, (b) average energy needs in the residential sector, and (c) fuel breakdown in the residential sector [63,64].

Figure 12.
Case study: boundary system example for the case study with the 60 m2 dwelling.

Figure 13.
The daily solar irradiation on the module in kWh m−2 d−1, obtained from [69].
Figure 13.
The daily solar irradiation on the module in kWh m−2 d−1, obtained from [69].

Figure 14.
ZEB definition for Panama, for a 60 m2 dwelling: (a) House build Line Base [59] (Table 6, A5), (b) Current building regulation [65], and (c) Feed-in proposed in this case from Table 6, A8. Adopted from [70].


Table 1.
Countries in Latin America with experience in nZEB or NZEB.
| Country | Climate Type (City) | ZEB Type | Energy Consumption Limits (U Conventional) | Energy Consumption Limits (U Improved) | Type of Project (Status) | Type of Building or Building Sector | Energy Saving Strategies | Building Area (PV Area) m2 | Ref | |
|---|---|---|---|---|---|---|---|---|---|---|
| 1 | Argentina | Not Specified | NZEB | Not Specified | Not Specified | policies | Not Specified | Not Specified | Not Specified | [33] |
| Cfa (Llavallol) | 321.4 heating kWh m−2 y−1 | 72.7 heating kWh m−2 y−1 | Research (Preliminary study) | Commercial Office | Passive Active | 750–900 | [34] | |||
| Cfa (Resistencia) | nZEB | Depending on the case | Not Specified | Residential | Passive | 12,000 | [35] | |||
| Cfa (Buenos Aires) | ||||||||||
| BwK (San Juan) | 438,856 kWh y−1 | 87,771 kWh y−1 | Educational | Passive Active | (387) | [36] | ||||
| 2 | Brazil | Not Specified | NZEB | Not Specified | - | Policies | Not Specified | Not Specified | - | [37] |
| Cfa (Florianopolis) | Depending on the case | Depending on the case | Research (Preliminary study) | Office | Active | 360–25,500 | [38] | |||
| As (Fortalelza) | ||||||||||
| Af (Curitiba) | Not Specified | 23% less | Residential | Passive | 60 (17) | [39] | ||||
| Cfb (El Salvador) | 42% less | 60 (17) | ||||||||
| 3 | Chile | Csb (Santiago) | Not Specified | 15–45 kWh m−2 y−1 | Research (Preliminary Study/ finished) | Residential | Passive | Not Specified | [40] | |
| BWk (Antofagasta) | nZEB | Depending on the case | Depending on the case | Research (Preliminary Study) | Residential | Passive Active | 50 106 1614 | [41] | ||
| Csb (Santiago) | ||||||||||
| Csb (Concepción) | ||||||||||
| ET (Punta Arenas) | ||||||||||
| 4 | Colombia | Not Specified | NZEB | Depending on the case | Not Specified | Research (Preliminary Study) | Residential (social dwelling) | Passive | Not Specified | [42] |
| Aw (Cartagena) | 3393 | 1901 | Residential | Passive Active | 3334 | [43] | ||||
| 5 | Cuba | Not Specified | nZEB | Not Specified | Not Specified | Research (Preliminary Study/finished/ Preliminary Study) | Hotels | Not Specified | Not Specified | [44] |
| Not Specified | 30–40% LESS | Hotels | Passive | Not Specified | [45] | |||||
| Aw (La Habana) | 230 kWh m−2 y−1 | Not Specified | Hotels | Passive | Not Specified | [46] | ||||
| 6 | Ecuador | Cfb (Quito | NZEB | 7126–178,545 kWh y−1 | 3377–176,825 kWh y−1 | Research (Preliminary Study) | Residential | Passive | 49.77–6300 | [47] |
| Cfb (Quito) | 28,625 kWh y−1 | Not Specified | Academic (Preliminary Study) | Residential | Not Specified | 600 (284.52) | [48] | |||
| Not Specified | nZEB | Not Specified | Not Specified | Research (In progress) | Not Specified | Not Specified | Not Specified | [49] | ||
| 7 | El Salvador | Aw (San Salvador) | NZEB | Not Specified | Not Specified | Project (finished) | Laboratory | Active | Not Specified | [50] |
| 8 | Haiti | Aw (Mirebalais) | Not Specified | Not Specified | Research (finished) | Hospital | Passive | 17,187 | [51] | |
| 9 | México | Not Specified | Not Specified | Not Specified | Policies (finished) | Not Specified | Not Specified | Not Specified | [52] | |
| Gathered Consortium project (finished) | Residential Office commercial | Not Specified | 20,000 | [53] | ||||||
| 10 | Panama | Af (Los Santos) | Not Specified | 0.72 kWh m−2 y−1 | Research (finished/ Preliminary study) | Residential | Passive | 213 | [54] | |
| Aw (Ciudad de Panama) | nZEB | 516.64 | Depending on the case | University | Passive | 218 | [55] | |||
| 11 | Peru | Not Specified | Not Specified | Not Specified | Project (finished) | Residential office Commercial schools, hospitals, | Not Specified | Not Specified | [56] | |
| 12 | Uruguay | Cfa | Not Specified | 17–19 kWh m−2 y−1 | Project (finished) | Residential | Not Specified | 280 | [57] | |
Table 2.
Countries in Latin America Energy generation.
| Country | Climate Type (City) | ZEB Type | Energy Generation | Passive Design Features | Other Active Design Features | Ref | |
|---|---|---|---|---|---|---|---|
| 1 | Cuba | Not Specified | nZEB | Not specified | Natural ventilation | Lightning | [44] |
| Solar thermal, photovoltaic systems. Small wind turbines | [45] | ||||||
| Aw (La Habana) | Save 40% (92 kWh m−2 y−1)PV | [46] | |||||
| 2 | Ecuador | Cfb (Quito) | NZEB | 11,427–138,053 kWh y−1 | Passive solar, thermal insulation according to the climate, and high compactness | Reduced needs for heating and cooling | [47] |
| Cfb (Quito) | PV | - | - | [48] | |||
| Not Specified | nZEB | Not specified | - | - | [49] | ||
| 3 | El Salvador | Aw (San Salvador) | NZEB | PV | - | Lightning control | [50] |
| 4 | Haiti | Aw (Mirebalais) | PV | Light colored walls promote natural ventilation, and reflect solar radiation | Operable windows | [51] | |
| 5 | México | Not Specified | Not specified | - | - | [52] | |
| - | - | [53] | |||||
| 6 | Peru | Not Specified | Not specified | - | - | [54] | |
| 7 | Uruguay | Cfa | PV | - | - | [57] | |
Table 3.
Countries in Latin America U-values and energy generation.
| Country | Climate Type (City) | ZEB Type | U (W m−2 K−1) Conventional or Original | U (W m−2 K−1) Improved | Energy Generation | Passive Design Features | Other Active Design Features | Ref | |||||||||
|---|---|---|---|---|---|---|---|---|---|---|---|---|---|---|---|---|---|
| Ceiling | Walls | Doors | Window | Floor | Ceiling | Walls | Doors | Window | Floor | ||||||||
| 1 | Argentina | Cfa (Llavallol) | NZEB | 1–7 | 1–3 | 1–7 | 3–6 | 2–3 | 0.12 | 0.12 | 1.86 | 0.8 | 0.5 | PV and Thermal | Advance envelope | Rainfall water recovery | [34] |
| Cfa (Resistencia) | nZEB | 0.45–0.83 | 1–1.10 | - | <4 | - | - | - | - | - | - | 182 kWh m−2 y−1 | Optimized shape, natural ventilation | [35] | |||
| Cfa (Buenos Aires) | 0.45–0.83 | 1–1.10 | - | <4 | - | - | - | - | - | - | 173 kWh m−2 y−1 | ||||||
| BwK (San Juan) | - | - | - | - | - | - | - | - | - | - | PV 91,400 kWh y−1 | Solar shading, advance envelope, natural ventilation, occupant behavior | Advanced lighting controls, load management, | [36] | |||
| 2 | Brazil | Cfa (Florianopolis) | NZEB | 2.42 | 2.47 | - | 5.82 | - | 0.25 | 3.1 | - | 1.67–1.68 | - | PV | - | Window systems | [38] |
| As (Fortalelza) | 2.42 | 2.47 | - | 5.82 | - | 0.25 | 0.39 | - | 1.67–1.68 | - | |||||||
| Af (Curitiba) | - | - | - | - | - | 3.74 | 0.96 | - | - | - | BIPV | Advance envelope, optimized shape, and orientation | - | [39] | |||
| Cfb (El Salvador) | - | - | - | - | - | 3.74 | 3.19 | - | - | - | - | ||||||
| 3 | Chile | Csb (Santiago) | - | - | - | - | - | - | - | - | - | - | No specified | - | - | [40] | |
| BWk (Antofagasta) | nZEB | 0.84 | 4 | 3.35 | 5.8 | - | 0.84 | 2.1 | 3.35 | 5.8–0.75 | - | Depending on the case | Envelope modifications | Mechanical Ventilation for air quality | [41] | ||
| Csb (Santiago) | 0.47 | 1.99 | 3.35 | 2.8 | - | 0.38 | 0.6 | 1.20 | 2.8–0.67 | - | |||||||
| Csb (Concepción) | 0.38 | 1.7 | 3.35 | 2.8 | 0.33 | 0.5 | 1 | 2.8 | - | ||||||||
| ET (Punta Arenas) | 0.25 | 0.6 | 3.35 | 1.8 | 0.25 | 0.35 | 0.80 | 1.8 | - | ||||||||
| 4 | Colombia | Not Specified | NZEB | - | - | - | - | - | - | - | - | - | - | Wind and PV | Strategic orientation, natural ventilation | Energy efficient of systems | [42] |
| Aw (Cartagena) | 3.868 | 4.576 | - | 5.85–5.91 | - | - | 0.22 | - | 1.94 | - | PV | Building orientation, wall insulation, air tightness, window efficiency, and ventilation | Shading system, Humidity control, lightning, and air conditioner | [43] | |||
| 5 | Panama | Af (Los Santos) | - | - | - | - | - | 0.25 | 0.15 | - | 1.4 | 0.3 | PV | Passive cooling, ventilation | Daylighting control | [44] | |
| Aw (Ciudad de Panama) | nZEB | 0.25 | 3.86 | - | 0.49 | 0.25 | 0.25/ 0.25 | 0.15/ 0.36 | - | 1.40/ 0.49 | 0.25/ 0.23 | Not specified | Passive cooling, envelope modifications, occupant behavior, and building orientation | [55] | |||
Table 4.
Energy consumption rate for buildings in Panama [65].
Table 4.
Energy consumption rate for buildings in Panama [65].
| Building Type | Base Line (kWh m−2 y−1) | 15% Saving (kWh m−2 y−1) |
|---|---|---|
| Dwelling | 80 | 68 |
| Office | 202 | 172 |
| Hotel | 172 | 146 |
| Commercial | 290 | 246 |
| Health | 376 | 320 |
| Education | 100 | 85 |
Table 5.
Summary of envelope ranges for different type of buildings in Panama [65].
Table 5.
Summary of envelope ranges for different type of buildings in Panama [65].
| Residential | Office | Health-Education | Commercial (>50,000 m2) | |
|---|---|---|---|---|
| U-Wall (W m−2 K−1) | 0.8–4 | 1–3 | 2–4 | 1–2 |
| U-window (W m−2 K−1) | 5.25–5.8 | 5.25–5.75 | 5.25–5.8 | 5–5.8 |
| g Window (-) | 0.35–0.87 | 0.35–0.5 | 0.35–0.6 | 0.48–0.87 |
| WWR (%) | 30–40 | 75–100 | 30–50 | 20–100 |
| U-Roof (W m−2 K−1) | 0.50–4.80 | 1.04–4.80 | 1.50–4.80 | 1–2.70 |
| Air conditioner COP (-) | 3–3.10 | 3–3.20 | 2.90–3.30 | 3.40–3.70 |
Table 6.
Energy consumption and balance in typical residential building.
| A1 | A2 | A3 | A4 | A5 | A6 | A7 | A8 | A9 | A10 | |
|---|---|---|---|---|---|---|---|---|---|---|
| Dwelling Area (m2) | Grid * | Energy Consumption * | Energy Consumption Total * | Primary Energy * | Generated Energy * | Primary Energy Generated * | Net Primary Energy * | Exported Energy Electricity * | Exported Primary Energy * | |
| Cooking | Electricity | |||||||||
| 60 | 21 | 36 | 80 | 116 | 290 | 316 | 996 | −705 | 257 | 809 |
| 80 | 21 | 27 | 80 | 107 | 281 | 319 | 1004 | −723 | 260 | 818 |
| 100 | 21 | 22 | 80 | 102 | 275 | 320 | 1009 | −734 | 261 | 823 |
| 120 | 21 | 18 | 80 | 98 | 271 | 321 | 1013 | −742 | 262 | 826 |
| 150 | 21 | 15 | 80 | 95 | 267 | 323 | 1016 | −749 | 263 | 830 |
| 200 (100 m2/storey) | 21 | 11 | 80 | 91 | 263 | 320 | 1009 | −746 | 261 | 823 |
* All energies are expressed in terms of kWh m−2 y−1.
Table 7.
SWOT Analysis for apply nZEB in Panama, based on and adapted from experiences reported in [79,80,81,82,83].
| Strengths | Opportunities |
|---|---|
| O1: Accelerate, to achieve national goals to increase the renewal integration in the building sector. O2: Develop adaptive comfort model for residential buildings in Panama. O3: Transforming the built environment, by demonstrating NZEB as a pilot project or show cases for energy neutral buildings. O4: Research innovations due to lack technological and industrial infrastructure, and knowledge competency. O5: Policy support. O6: Energy and climate change linkage. O7: Enhancement of human capability. |
| Weakness | Threats |
| T1: Not embracing facility management to maintain the quality and operation of NZEB. T2: Failing to build consensus among educator, children, families, government, and local authorities. T3: Lack of policies and standards. T4: Unreasonable energy structure. T5: Shortage of energy at regional level could cause high electricity costs to maintain income balance in energy sector. |
Publisher’s Note: MDPI stays neutral with regard to jurisdictional claims in published maps and institutional affiliations. |
© 2021 by the authors. Licensee MDPI, Basel, Switzerland. This article is an open access article distributed under the terms and conditions of the Creative Commons Attribution (CC BY) license (https://creativecommons.org/licenses/by/4.0/).
Share and Cite
MDPI and ACS Style
Chen Austin, M.; Chung-Camargo, K.; Mora, D. Review of Zero Energy Building Concept-Definition and Developments in Latin America: A Framework Definition for Application in Panama. Energies 2021, 14, 5647. https://doi.org/10.3390/en14185647
AMA Style
Chen Austin M, Chung-Camargo K, Mora D. Review of Zero Energy Building Concept-Definition and Developments in Latin America: A Framework Definition for Application in Panama. Energies. 2021; 14(18):5647. https://doi.org/10.3390/en14185647
Chicago/Turabian StyleChen Austin, Miguel, Katherine Chung-Camargo, and Dafni Mora. 2021. "Review of Zero Energy Building Concept-Definition and Developments in Latin America: A Framework Definition for Application in Panama" Energies 14, no. 18: 5647. https://doi.org/10.3390/en14185647
Note that from the first issue of 2016, this journal uses article numbers instead of page numbers. See further details here.