
Smart Grid in China, EU, and the US: State of Implementation
by
 , , and
Paolo Sospiro
1,2,3,* ,
,
Lohith Amarnath
4, 
Vincenzo Di Nardo
5,6 ,
,
Giacomo Talluri
1 and
and
Foad H. Gandoman
7 1
Department of Industrial Engineering, University of Florence, 50121 Florence, Italy
2
Department of Information, Polytechnic University of Marche, 60121 Ancona, Italy
3
EUAbout, 1000 Brussels, Belgium
4
Department of Mechanical Engineering, University of Rome “La Sapienza”, 00185 Rome, Italy
5
Department of Industrial Engineering, University of Naples “Federico II”, 80138 Naples, Italy
6
Newtak Engineering, 80122 Naples, Italy
7
Research Group MOBI—Mobility, Logistics and Automotive Technology Research Centre, Vrije Universiteit Brussel, 1050 Brussel, Belgium
*
Author to whom correspondence should be addressed.
Energies 2021, 14(18), 5637; https://doi.org/10.3390/en14185637
Submission received: 4 July 2021
/
Revised: 12 August 2021
/
Accepted: 24 August 2021
/
Published: 8 September 2021
Abstract
:Depletion of fossil fuel deposits is the main current issue related to the world’s power generation. Renewable energy sources integrated with energy efficiency represent an effective solution. The electrification of end-use coupled with renewable power generation integration is considered as an important tool to achieve these tasks. However, the current electric power system does not currently have the suitable features to allow this change. Therefore, in the future, it has to allow two-way direction power flows, communication, and automated controls to fully manage the system and customers. The resulting system is defined as the smart grid. This article analyses the smart grid state of play within China, the US, and the EU, assessing the completion state of each smart grid technology and integrated asset. The analysis related to these countries presented here shows that the smart grid overall state of play in China, the US, and the EU are equal to 18%, 15%, and 13%, respectively, unveiling the need related to further efforts and investments in these countries for the full smart grid development.
Keywords:
automated metering infrastructure (AMI); Canadian Electricity Association (CEA); combined heat and power (CHP); cost–benefit analysis (CBA); customer technology (CT); distributed generation (DG); distribution automation (DA); distribution management systems (DMS); electric vehicle (EV); electric vehicle supply equipment (EVSE); energy storage systems (ESS); greenhouse gas (GHG); high voltage (HV); information and communication technology (ICT); International Renewable Energy Agency (IRENA); low voltage (LV); medium voltage (MV); operation and maintenance (O&M); phasor measurement unit (PMU); photovoltaic (PV); smart appliances (SA); smart electricity market (SEM); smart grid computational tool (SGCT); smart homes (SH); State Grid Corporation of China (SGCC); transmission and distribution (T&D); volt-ampere reactive (VAR); wide area monitoring systems (WAMS)1. Introduction
During the centuries, energy sources have always represented a fundamental tool used by humankind to satisfy their need. Many examples unveil the close relationship between energy utilization and human behaviour, such as the discovery of the fire related to the wood ignition for cooking meals and heating for humans, metals processing, and the application of animal power for agriculture. The first industrial revolution in the 18th century moved man from the animal and biomass energy source towards coal, and then, in the 19th century, with the Age of Oil, petroleum became the main source for many fuels and technologies. Since then, fossil sources have played a dominant role in satisfying human life energy needs, replacing manual works or other sources, which have represented the only solution until then. Therefore, fossil source has become the main energy source for many fundamental energy consumption sectors, such as transport, power generation, buildings, industry, and so on. The lack of mainstream environmental awareness and, thus, policy limits about fossil fuels environmental impact, economic and industrial competitiveness as well as the accessible price of fossil sources has resulted in the high dependence of human life on alternative and renewable energy sources. Over the years, some of the fundamental movements that support alternative and renewable energy sources, such as the 1997 Kyoto and 2015 Paris climate agreements, represent milestones for the birth of the energy–earth relationship, called sustainability. Today, technological innovations and developments have been developed and invested in for each energy consumption sector, such as power generation, transport, industry, and buildings, offering many solutions that represent both new challenges and opportunities towards the higher employment of environment-friendly sources, either totally or partially replacing the fossil sources if properly and fully implemented [1].
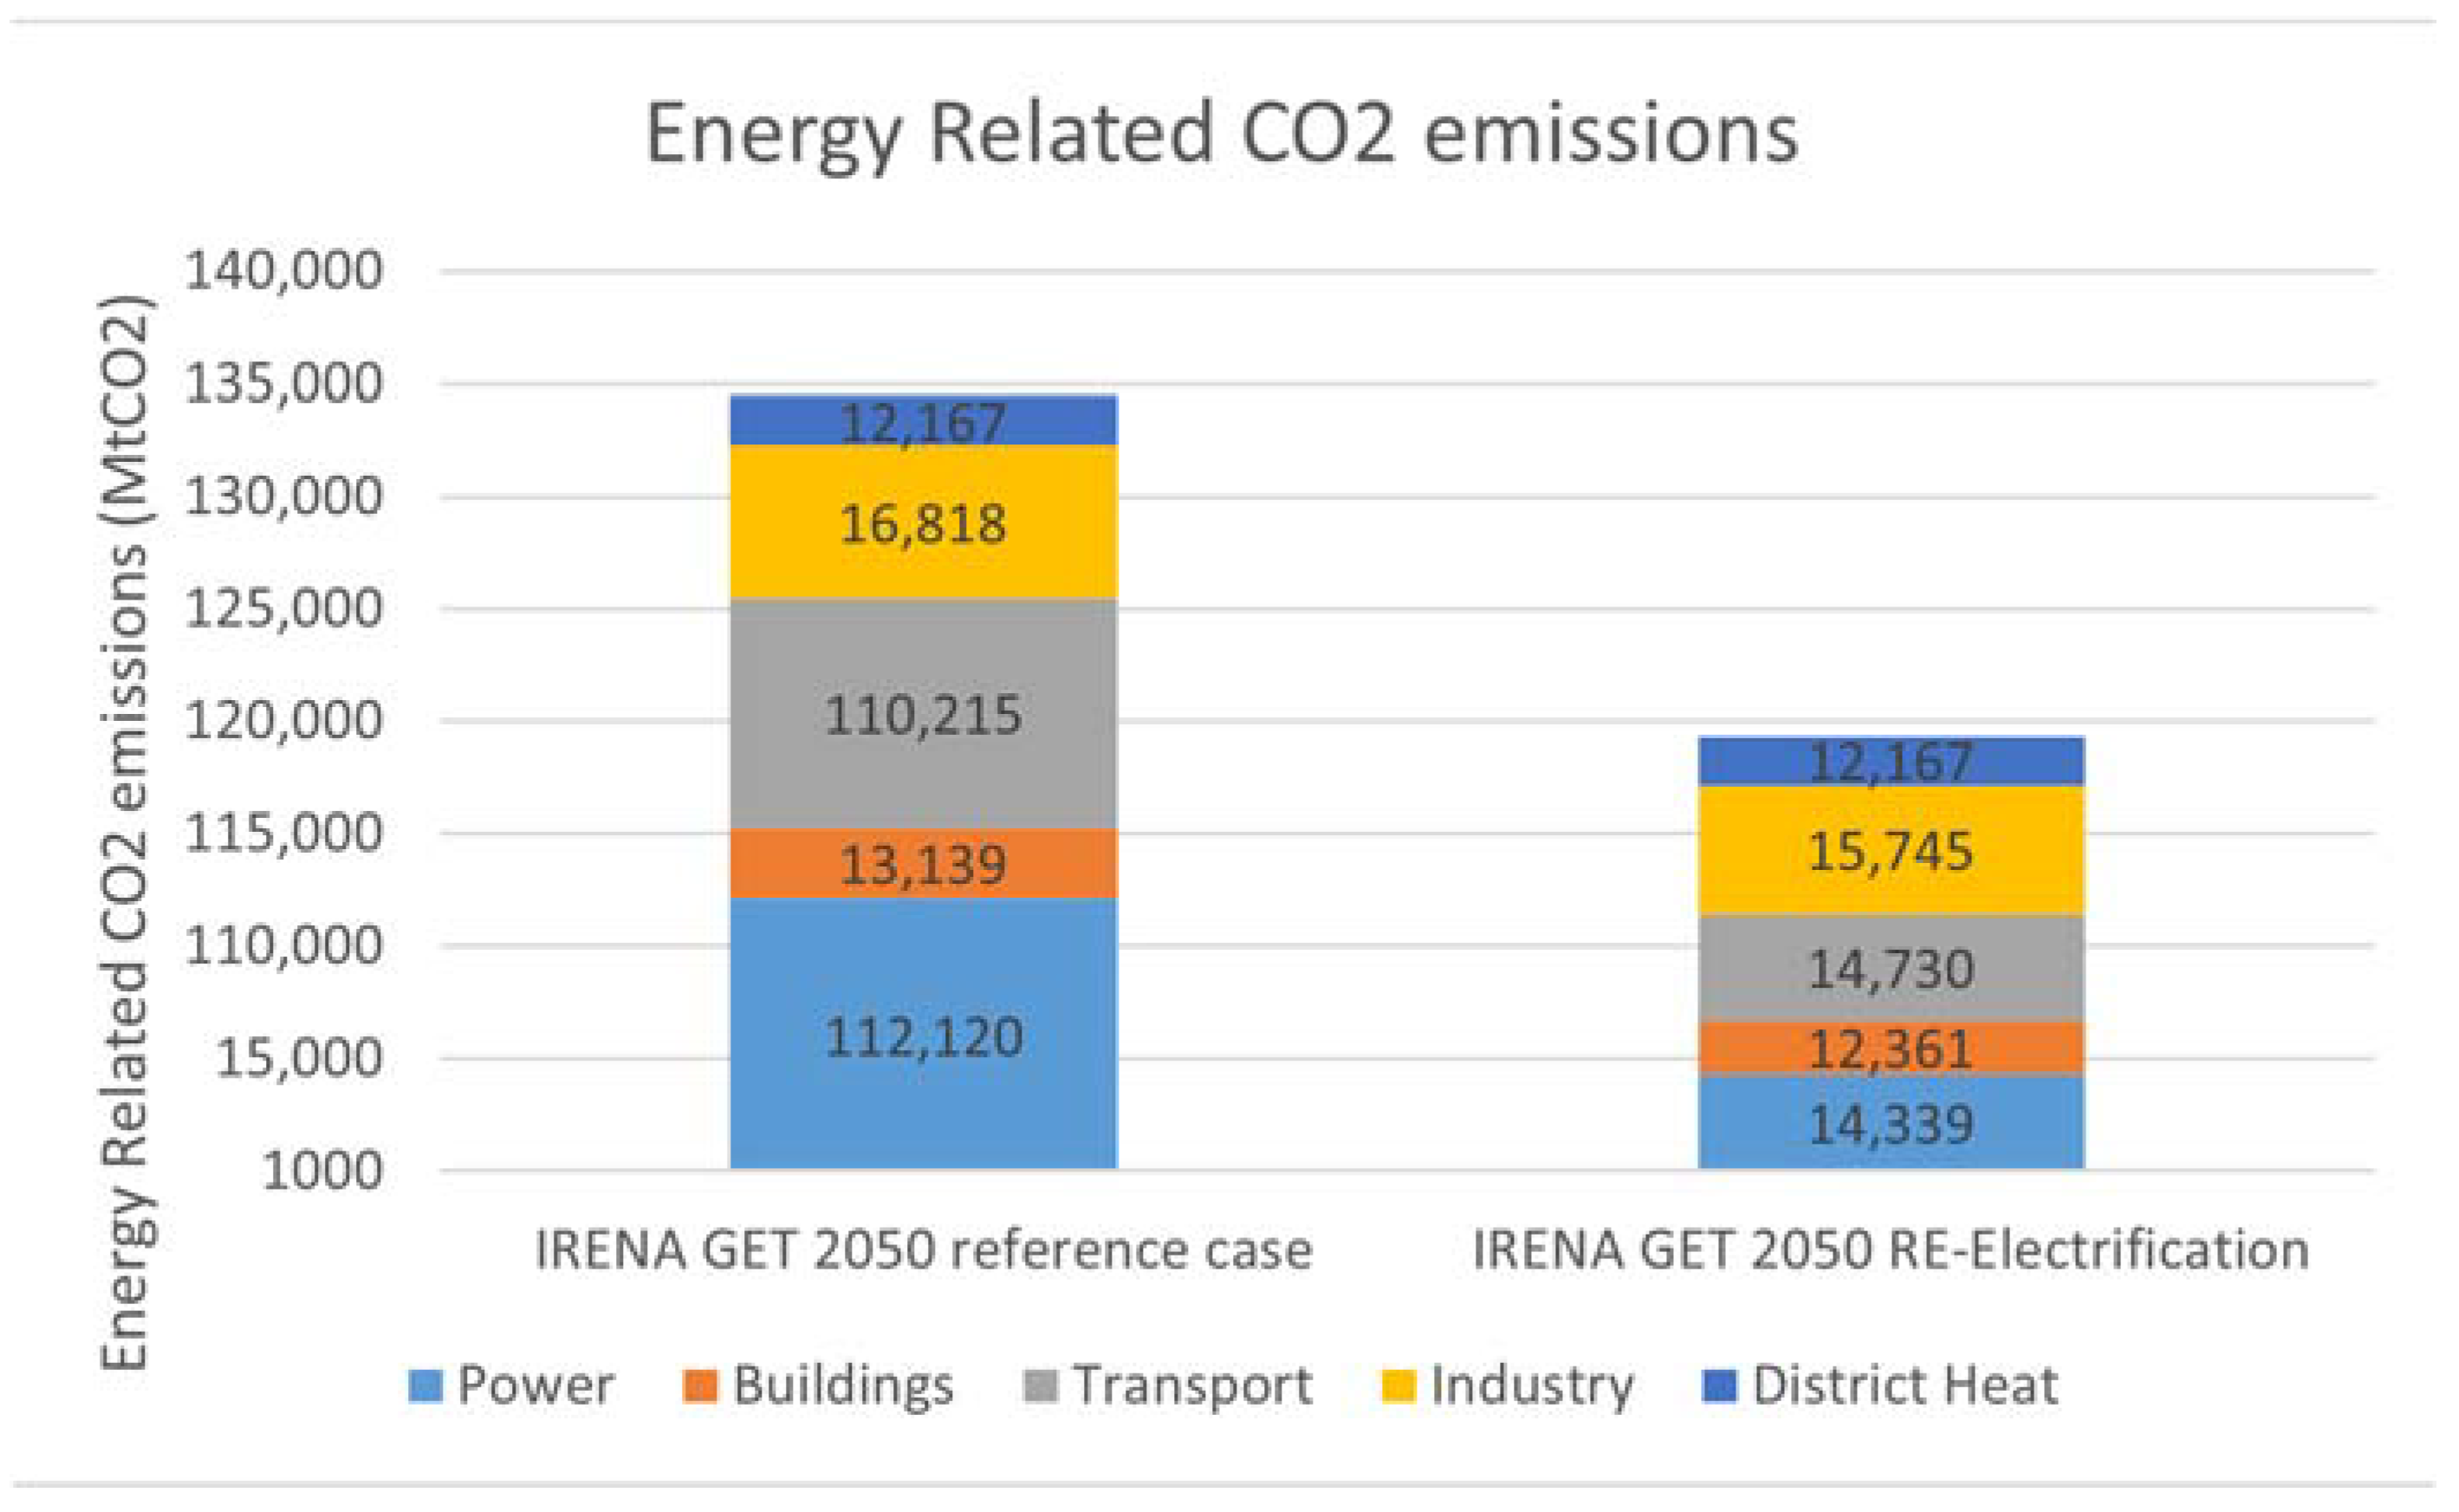
IRENA’s GET2050 analysis forecasts that renewable energy electrification (RE Electrification), which consists of the electrification of the end-use sectors coupled with renewable integration in the power generation sector, could provide a 44% reduction in CO2eq (GHG emissions) related to total energy consumption compared to the reference case as shown in Figure 1. Figure 1 shows a 64% GHG emissions reduction in the power generation sector, a 25% reduction related to buildings’ energy needs, a 54% reduction in transport energy needs, and a 16% reduction in end-use energy needs.
Electricity needs reliable and strong infrastructures for its generation, transmission, distribution, utilization, and storage. All these functions are provided by the fundamental tool of the electric power system. In this work, many current power system inefficiencies and limits, which are related to renewable energy sources integration as well, will be highlighted. Moreover, the electrification process will deeply impact the current power system, further stressing its limits. Therefore, innovation and improvement of the current power system are mandatory to cope with the renewable electrification process, and the solution to most of the system inefficiencies will be represented by an advanced and innovated electric power system called a smart grid [4].
Given the very articulated nature of smart grids and of the related assets, most of the existing works focus on specific situations, technologies, and countries. Indeed, this is a necessary approach in order to understand the possible benefits that each technology and asset could provide to the grid, as well as to understand if the cost–benefit ratio proves more or less favourable.
This work, instead, tries to provide a high-level assessment of the state of play for the existing smart grids of China, the US, and the EU, through the evaluation of the deployment share in each of the considered regions of a set of technologies and integrated assets. More specifically, the smart grid technologies considered in this work are wide area management system (WAMS), distribution automation (DA), advanced metering infrastructure (AMI), customer technology (CT), and information and communication technology (ICT); the considered smart grid integrated assets are distributed generation (DG), energy storage system (ESS), electric vehicle (EV), charging infrastructure, and smart electricity markets (SEM). Data and information have been gathered through a sectorial literature review. Some issues have been encountered during the data-gathering phase, as will be reported in Section 4. This reflects the ongoing deployment of the smart grid, where some sectors are more developed than others.
Section 2 reports several highlights from the literature review, regarding the current status of smart grid deployment at the global level. Section 3 describes the methodology developed to define the technologies and assets to be considered, taking into account their beneficial effect on the grid. Section 4 reports the results of the state of play analysis in terms of deployment rates, and finally, Section 5 summarizes the conclusions stemming from the findings.
2. Literature Review
The European energy system is completely moving towards a more sustainable energy system. The development of sustainable energy systems is relatively slow in some developing countries in the EU but compared to the class of nuclear energy systems, development is in a gradual phase in the EU [5]. The most important part of that is the smart energy system in households, which includes smart meters, controls, appliances, and house network integration. The study [3] is a framework of the SET plan to support the smart energy solution. It includes the type of technologies being used in the EU Member States to monitor smart energy use. It is not intended that this study will comprehensively assess the actual deployment of smart energy solutions.
Several studies have been conducted on the capability of loads, industrial, residential, and commercial, to follow power generation in order to maximally exploit the generation from renewable energy sources (RES). This activity is defined as demand-side management (DSM) or demand response (DR) and is already pursued, at least at the pilot or demonstration scale, in several regions, across the EU [6].
At the EU transmission system level, transmission system operators (TSO) are represented by ENTSO-E, the European Network of Transmission System Operators for Electricity. ENTSO-E develops roadmaps and network development plans, the latest of which is the “Research, Development & Innovation Roadmap 2020–2030” [7] and the Ten-Year Network Development Plan 2020 (TYNDP 2020) [8]. There, transmission, battery, and power-to-gas storage, as well as DR projects are presented within a multi-scenario framework, depicting the foreseen development of the EU transmission network.
The network capabilities and information technologies are being integrated with the traditional electricity delivery capabilities for the electric transmission and distribution systems. This study shows different companies, customers, and other electricity sector stakeholders discussing their problems and types of queries about smart grid technologies.
The Nigerian electricity grid is trying to integrate smart grid technologies with renewable energy sources [9]. The jeopardized condition of the power sector shows inefficient power plants, poor transmission and distribution facilities, and an outdated metering system, used by the electricity consumers. In such a situation, the synergy between the smart grid and renewable energy production is seen as a beacon of hope. This plays a vital role in state of art technologies and processes in the smart grid being developed and implemented in EU Member States. The US has impacted developing countries such as Nigeria to have access to an efficient electricity system.
A study sponsored by the Canadian Electricity Association (CEA) [10] highlights the advantages and disadvantages of implementing some of the smart grid technologies, products, and services. Distribution automation (DA), smart consumption infrastructure elements such as distribution management systems (DMS), automated metering infrastructure (AMI), smart homes (SH), and smart appliances (SA) are some of the technologies that are being implemented in some developing countries such as China, India, and in some parts of the US, which specifies the diversity of the policies by the CEA. The study [10] analyses many technologies that are being used to implement smart grids, as well as future trends, such as combining renewable energy technologies with combined heat and power (CHP) systems, the energy management and control of electric vehicle (EV) charging stations, voltage-frequency control of a voltage source inverters, smart generation scheduling for wind-thermal-pumped storage systems, and finally, optimized power system restoration.
3. Methodology
These smart grid projects must be justified on an economic basis, as the main objective for the decision makers is to evaluate the smart grid with a well-defined and consistent methodology. While on one hand, many countries such as the US, China, and the EU present a clear opportunity for smart grids, on the other hand, many poorly developed technological nations would benefit from such technologies, which would allow the possibility of enhancing access to electricity. Quantifying a project’s total benefit across its lifespan is measured using various metrics and by applying calculations that help in monetizing the grid impacts [11]. Baseline data and project data of each benefit are analysed to obtain the cost–benefit analysis of the smart grid. Baseline data also reflect the state of the grid when the equipment or project started and the respective forecasts using the past data reference, which also calculates the absolute benefit of the smart grid technology. Project data reflect the state of the grid when the smart grid asset is implemented with proper verification and auditing. The benefit assessment is calculated as the difference between the baseline and project data across the project lifetime. The final aspect of the benefit calculation is to calculate the optimal sensitivity analysis, which is calculated using the input parameters. Controlling the sensitivity range for each input allows for the creation of customised scenarios that explore uncertainties related to environmental regulation, market conditions, and electric load growth. The state of play of methodology plays a vital role in the evolution of smart grid technologies in China, the US, and the EU. The state-of-play methodologies have different steps that are reported in the following.
Step 1: Review the overall purpose and goals [12].
Many technologies are brought into action using some of the relatively simple examples of various mapping and measurement tools that can be employed to characterize the process objective. The first step is aimed at primarily comparing costs, performances, and benefits. Some of the major technologies that are being implemented are demand response at the customer level and direct load control at the utility scale. The major smart grid technologies that have been implemented comprise the following:
- An advanced metering infrastructure (AMI) is installed to estimate the complete usage of load variations at each point of contact by the customers and to provide feedback. The deployment of AMI will also enable another benefit related to power quality (PQ) levels enhancement [13], which will also be calculated.
- Wide area monitoring systems (WAMS) are essentially based on the new data acquisition technology of phasor measurement and allow monitoring transmission system conditions over large areas in view of detecting and further counteracting grid instabilities.
- Distribution automation (DA) technologies provide advanced capabilities for operators to detect, locate, and diagnose faults. Remote fault indicators, relays, and re-closers provide access to real-time data on key feeders.
- Customer technology (CT) and information and communication technology (ICT) deal with the customer’s communication and mapping of the customer requirements.
- Distributed generation (DG) of electricity from renewable energy sources such as rooftop photovoltaic (PV) generation systems, small-scale hydro, and wind generation plants.
- Energy storage systems (ESS) is a new category enabling engineers to optimize the power system optimally. The application of ESS systems is used mainly for reducing or eliminating the uncertainties of renewable distributed generation.
The main objective of the assets and smart grid technologies is to implement the smart grid application. The decision to implement the type of assets and smart grid technology also hosts the utilities, customers, and equipment vendors, and each will be interested in specific aspects of the results. The customers will be interested in deciding if the electricity bill justifies the type of serviced technology they are implementing and if it is cost efficient. The utilities will be interested in how well the equipment is working. The vendors will be interested in whether their solution will lead to a profitable new business opportunity, reducing costs and/or increasing revenues.
Step 2: Identify the functions.
As the objective is to implement a smart grid, it will be necessary to determine which smart grid functions need to be activated according to the assets and the technology being used by the respective countries and regions. The chosen assets that could activate the functions are validated using the cost–benefit analysis.
These are some of the main functions to be chosen for the implementation of the smart grid:
These functions enable the integration of other energy resources, which includes distributed generation (DG), energy storage systems (ESS), and electric vehicles (EV). In the next steps, the article describes the linkage between smart grid assets and smart grid functions.
Step 3: Assessment of the main characteristics of a smart grid project.
The deployment of smart-grid-enabling technologies and systems within a project could activate one or more of the seven main characteristics of a smart grid. These characteristics have been broadly adopted across the industry:
- Enabling informed participation by customers.
- Accommodating the storage and generation of renewable electricity.
- Enabling new and improved products, services, and markets.
- Providing power quality for the needs of the 21st century economy.
- Optimizing operation efficiency and asset utilization.
- Addressing and reducing disturbances through automated prevention, containment, and restoration.
- Operating resiliently against all hazards.
Step 4: Mapping each function onto a standardized set of benefits.
After finding the main functions of the hypothetical project, the next step is to map these functions to the related assets to be deployed and to the benefits they provide. These information are provided by [12] and are summarized in Table 1 below that directly report the link between deployed assets and expected benefits. Table 1 represents the load measurement and management load shifts, which in turn, reduce the cost of the generation, which lowers electricity bills to customers. The assets and functions are also considered based on the smart grid location. The respective assets based on the hypothetical project will help to modernize the delivery and use of electricity by enabling the functions.
Not all the functions are required to be enabled in each project; every technology requires its own set of functions with respect to the credibility of each technology and asset, but some functions are required for processing the application of the smart grid. The main types of benefits are based on mainly economic, reliability, environmental, and security with utilities, customers, and externalities as some of the perspectives.
- Economic benefits are classified based on improved asset utilization, transmission and distribution (T&D) capital savings and operation and maintenance (O&M) savings, theft reduction, energy efficiency, and electricity cost-saving benefit.
- Reliability benefits are classified based on yearly data on occurring power interruptions and power quality levels.
- Air emission-based benefit is an environmental type.
- Energy security is based on security benefits.
Step 5: Establishing the baselines for the project.
This step is an important and difficult step to complete. The baseline condition represents the condition when the project would not have taken place. The baseline is defined as different for different benefit metrics. The type of benefit is described in the first column, while the second column contains the beneficiary, and another corresponding baseline is noted in the third column.
Step 6: Identifying and compiling the data.
As the name suggests, this step identifies the type of data needed to calculate the corresponding baseline information needed to calculate those benefits. For applicable benefits identified in the previous step, the current step compiles the needed data. Those data that are being collected before and after compiling will help in the installation of smart grid components to the project.
Step 7: Quantify the benefit.
A quantitative assessment of the value of the benefits for a specific project is carried out as the difference in project outcomes between the project scenario and the baseline scenario, thus, without the project in place.
Step 8: Monetize the benefit.
An economic unitary value is defined for each of the previously quantified benefits, in order to allow for comparison and summation, under common economic terms.
Step 9: Estimating the relevant costs.
As the name suggests, the relevant cost of the entire project and all the other costs include:
- Infrastructure capital cost.
- Equipment cost and devices cost.
- Fuel cost.
- Cost of labour for operations, maintenance, repair, etc.
- The installation cost for smart grid infrastructure and services.
4. Analysis
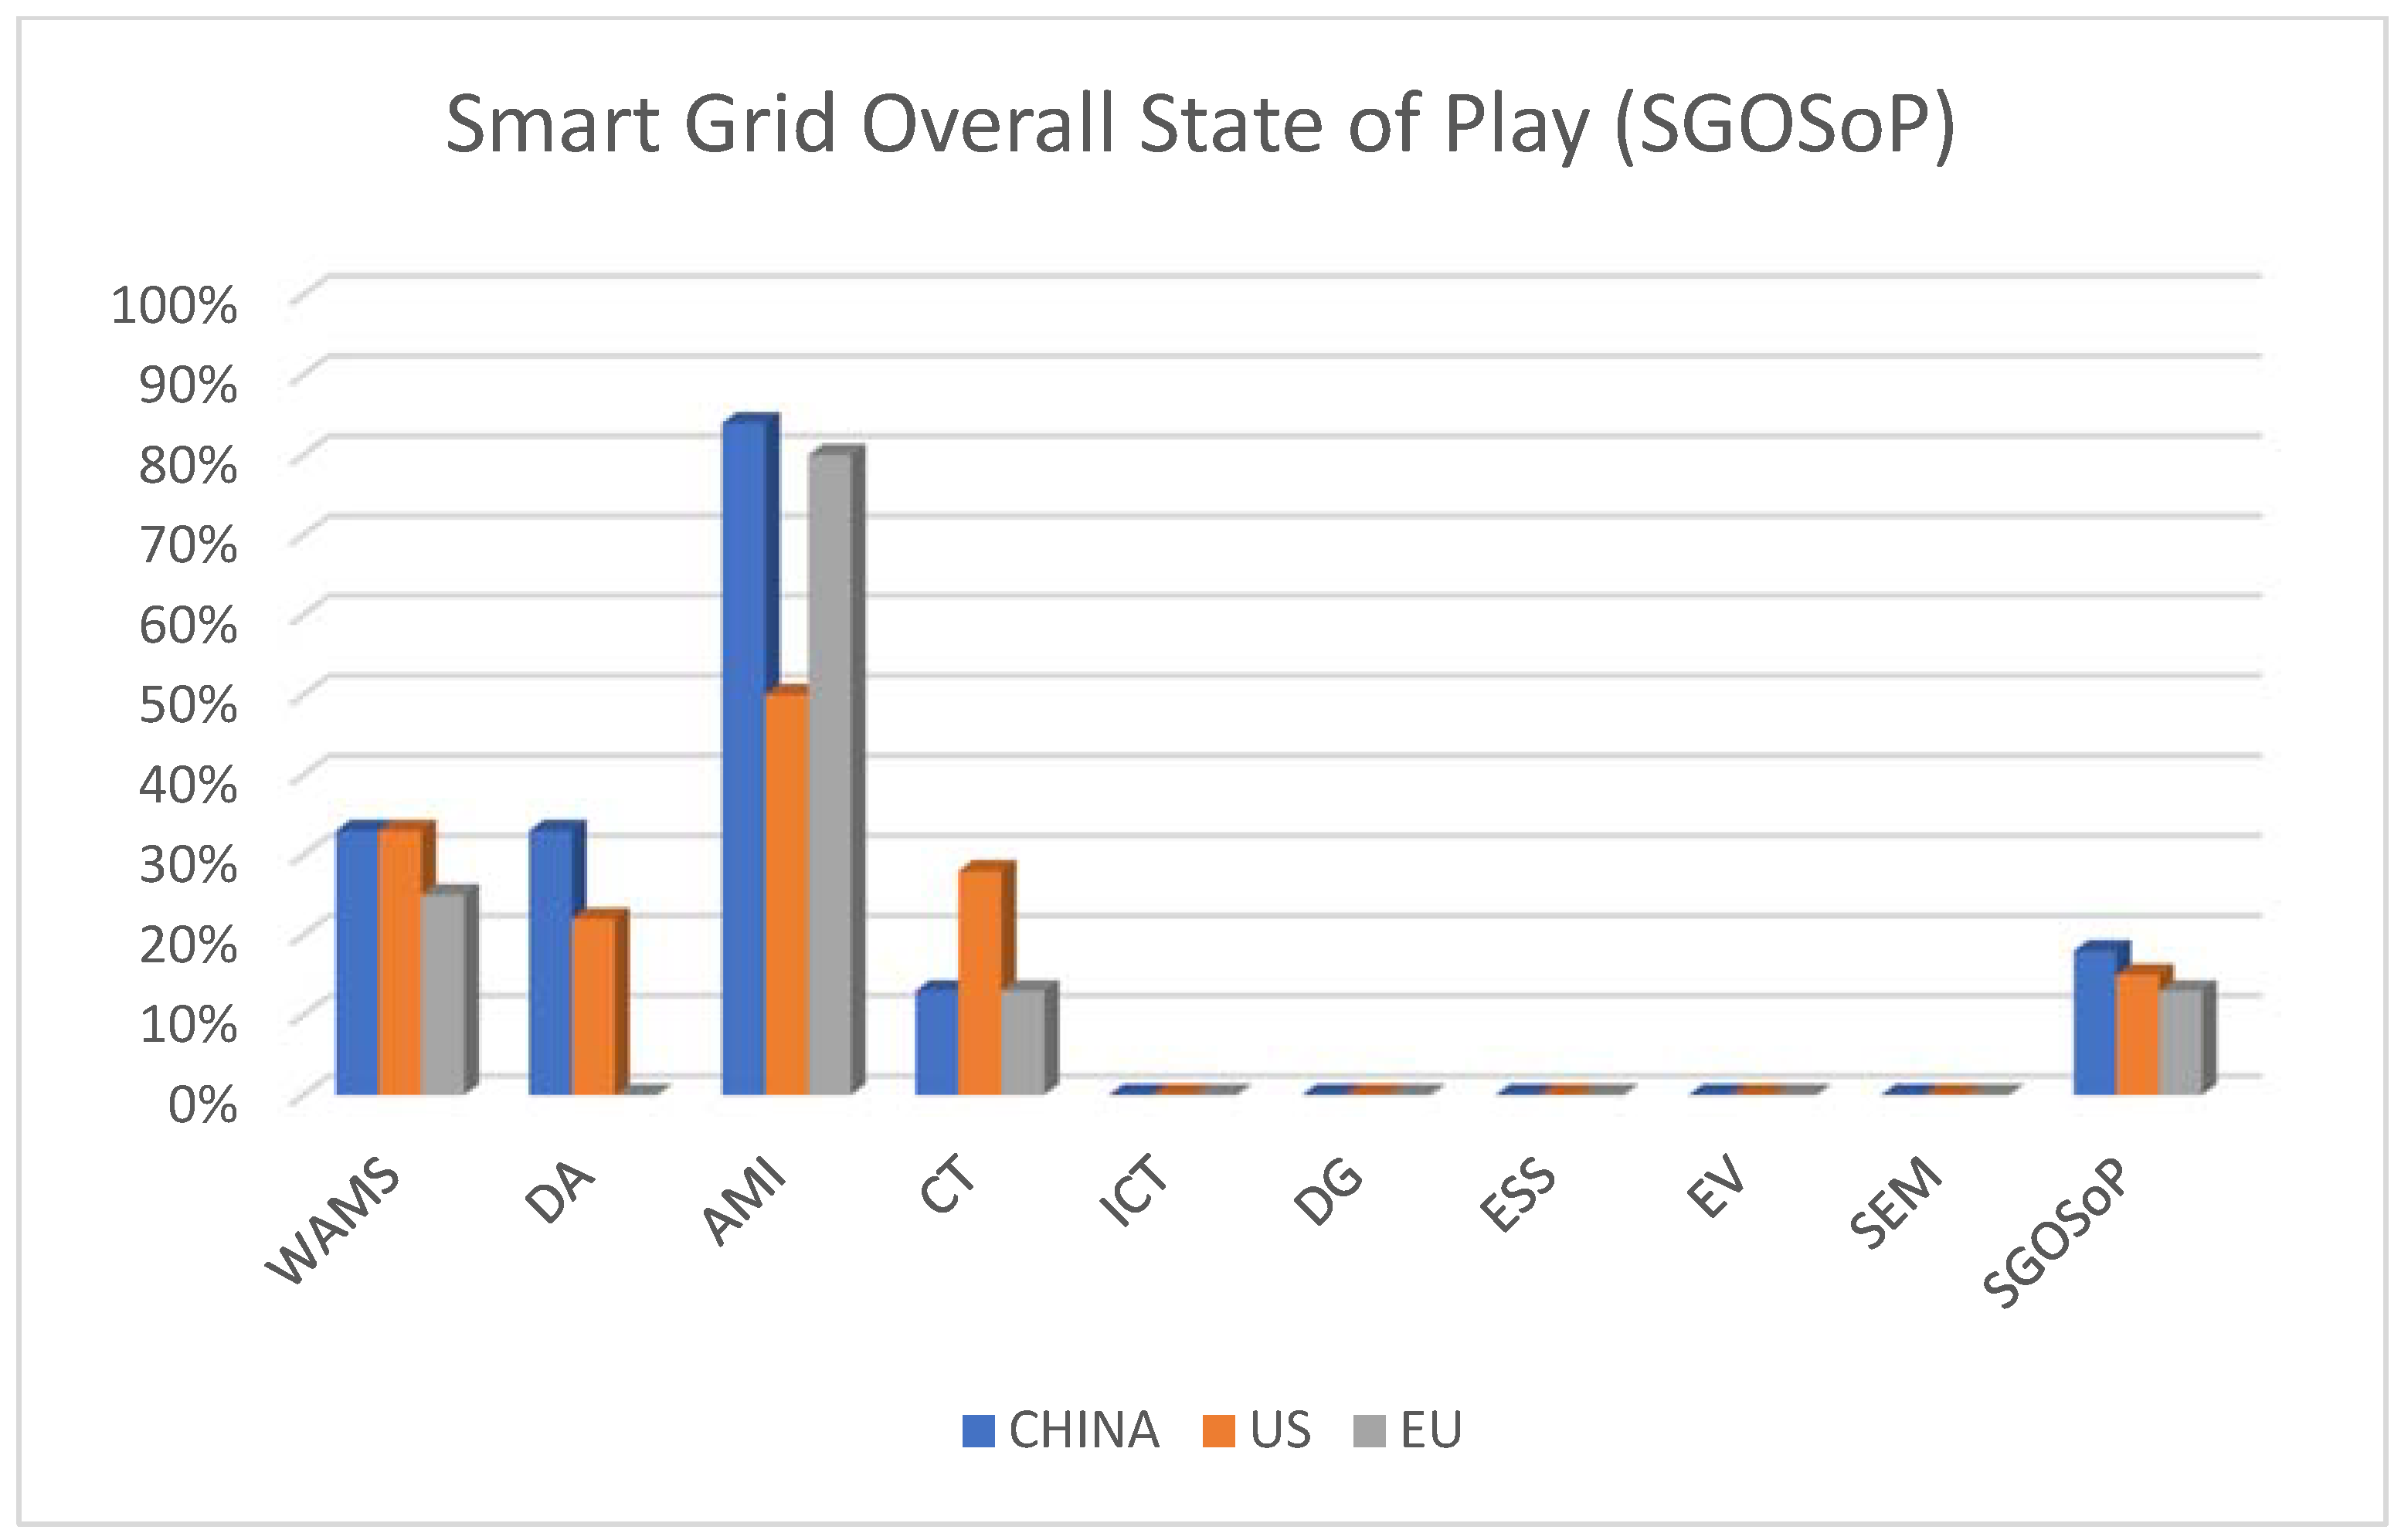
As described in the methodology paragraph, the assessment of the smart grid state of play within China, the US, and the EU are given by the evaluation of the share of deployment of its every technology and integrated asset.
4.1. WAMS
One of the most important enabling devices for the WAMS technology is the phasor measurement unit (PMU). Therefore, PMU installation is considered a useful parameter to assess the state of play of smart grid WAMS technology [33]. In China, PMU installation share in 2018 was high at large-scale generation and HV substations, reaching 3000 installed units [13]. Therefore, it is assumed that . In the US, PMUs reached 1000 installed units in 2015, and their installation was fully completed at the transmission system in 2017 [34]. Therefore, it is assumed that . In the EU, PMUs reached high installation share in 2018 in seven countries of 28 Member States [35]; therefore, it is assumed that . However, no PMUs data are available for MV and LV substations in China, the US, and the EU; therefore, it is assumed that . Giving HV, MV, and LV equal weight as installation places for PMU, the WAMS overall state of play in each country is given by the arithmetic mean between : . Therefore, results equal to 33%, 33%, and 25%, respectively, for China, the US, and the EU.
4.2. DA
DA is formed mainly by smart substations and their components such as fault detection, insulation and restoration devices, and voltage optimization devices. Therefore, it is considered as a useful parameter to assess the state of play of the smart grid DA technology. In China, 65 smart substations of 110 kV to 750 kV were built in 2011 [36], and their development up to 2020 involved mainly an HV system [36]. Therefore, it is assumed that . However, no DA data are available for MV and LV substations; therefore, it is assumed that . The DA overall state of play in China ( is given by arithmetic mean between :. Therefore, . In the US, distribution circuits in 2016 equipped by voltage optimization devices amounted to 22% of total ones, amounting to nearly 45 thousand circuits [35]. Therefore, it is assumed that . In the EU, the distribution automation project was launched in 2012 [37]. Moreover, no smart substations were completed up to 2019 [38]; therefore, it is assumed that .
4.3. AMI
The main component of AMI is the smart meter. Therefore, its deployment is considered as a useful parameter to assess the state of play of the smart grid AMI technology. In China, in 2017, the State Grid Corporation of China (SGCC) completed the deployment of smart meters to all served customers, which belong to 26 provinces of China, reaching 400 million installed units [39]. Therefore, it is assumed that . However, no data about the deployment of smart meters in the other provinces served by China Southern Power (CSP) are available [40], which are equal to five . Therefore, it is assumed that . Hence, the AMI overall state of play in China is assumed to be equal to the weighted mean on provinces: In the US, smart meters achieved 50% for all US customers in 2017; therefore, it is assumed that . Moreover, current and future investments are expected to increase this share up to 93% in 2030 [35]. In the EU, the deployment of smart meters is expected to achieve 80% for all EU customers by 2020 [41]. Therefore, it is assumed that .
4.4. CT
Smart appliances are fundamental customer technologies. Regarding residential customers equipped by these technologies, their home is called a smart home. Therefore, the state of play of this smart grid technology is evaluated considering the smart home development, due to a lack of data about business and industrial sectors. In China, smart homes reached 12.6% in 2020 [42]; therefore, it is assumed that . In the US, smart homes are expected to reach 28% by 2021 [43]; therefore, it is assumed that . In the EU, smart homes reached 12.5% in 2020 [42]; therefore, it is assumed that .
4.5. EV Infrastructure
EV smart charging stations represent a fundamental component of the EV infrastructure; therefore, these ones are used as a parameter for the evaluation of the state of play of this smart grid integrated asset. In China, the EV smart charge pilot project started in 2020 [44]; therefore, it is assumed that . In the US, commercial operations for the deployment of smart charging stations started in 2019 [45]; therefore, it is assumed that . In the EU, a smart charging stations commercial trial started in 2019 [46]; therefore, it is assumed that .
4.6. SEM
Electricity markets are a needed economic tool to implement all smart grid operations. They have to be characterized by two features: integrated electricity market (IEM) throughout electric power system and dynamic electricity prices, called time of use (ToU) prices. Hence, the smart electricity market state of play is assessed as the arithmetic mean between the state of play of these two features, such as IEM and ToU prices. Although China is a single state, no IEMs through China’s regions exist currently, due to an economic limit represented by interregional electricity trades characterized by yearly and not flexible contracts [43] and a technical limit represented by a fragmented electricity network into six regional grids, which are also characterized by a limited interconnections capacity that limits the power flows exchange among them [47]. Therefore, it is assumed that . Unlike China, in the US, no limited interconnection capacity among states has been found out in this research work. However, the economic limit for IEM is represented by many regional wholesale markets existing currently [46]. Therefore, it is assumed that . Unlike China and the US, where the national government has always issued energy policies throughout provinces or states, in the EU, energy policies had been managed individually by Member States until 2007. Indeed, national electricity networks were designed to mainly ensure the national energy self-sufficiency [48], and the international energy exchange between cross-border states had been considered as a solution for system contingencies or limited international electricity markets enablers [49]. Interconnection capacity of Member States was set at 10% of their installed power generation capacity in 2002 [50], so power flows limited exchange was allowed between Member States. In 2007, the Lisbon Treaty conferred higher importance to European energy policies to issue international energy policies to apply in each Member State building an integrated European electricity network [51]. Since, 700 MW interconnections between the Netherlands and Norway were built in 2008 [47]. However, limited interconnections capacity still existed up to 2014 between Member States [47], still representing a technical limit for IEM. Moreover, in 2011, the Agency for the Cooperation of Energy Regulators was stated to improve cross-border energy markets across the EU and achieve an integrated European energy market [47]. However, currently in the EU, cross-border trades are yearly and monthly, where national day-ahead overcapacity is allocated for intraday trading and for balancing markets [40], representing an economic limit for the IEM. Due to both current technical and economic limits for the IEM, it is assumed that . In China and the EU, a mainly static ToU pricing mechanism is still adopted currently [52,53]; therefore, it is assumed that . In the US, a pilot project about a dynamic ToU price mechanism was implemented from 2007 to 2016 in Illinois [53]. However, minimal penetration of ToU is recorded throughout the US currently [54,55]. Therefore, it is assumed that . Finally, the arithmetic means between and results in for China, the US, and the EU.
4.7. ICT, DG, and ESS
Regarding smart grid ICT technology, due to a lack of data about its deployment within China, the US, and the EU, it has been assumed that . Regarding DG and ESS, due to a lack of information about the amount of these integrated assets in a fully developed smart grid system, the state of play of these has been assumed null in the analysed countries; therefore, and .
4.8. Smart Grid Overall State of Play
The smart grid overall state of play within China, the US, and the EU is assessed as the arithmetic mean of each smart grid technology and integrated asset, considered in this work:
results equal to 18%, 15%, and 13%, respectively, for China, the US, and the EU. These results unveil that in these countries, a smart grid has not already been completed. Therefore, more technical and political efforts, as well as investments, are needed to achieve full smart grid implementation.
Finally, smart grid components and their per cent state of play within the mentioned countries are summarized in Table 2 below.
Moreover, the smart grid overall state of play within China, the US, and the EU is summarized in Figure 2 below:
5. Conclusions
In this work, the smart grid state of play within China, the US, and the EU has been assessed. Benefits related to electric energy employment, with remarkable attention to renewable sources integration, as well as current electric grid innovation and improvement, were introduced as the driving forces for smart grid implementation. Its technologies and integrated assets and state of play assessment methodology were described in the literature review and methodology paragraphs. Finally, the smart grid state of play within the mentioned countries unveiled that more efforts and investments are needed to complete each part of the smart grid and enable the full achievement of smart grid environment benefits. However, a lack of data about the state of play of a few smart grid technologies does not allow for the knowledge about further efforts in the related smart grid sector. Regarding customer technology, further analysis is required in order to involve business and industrial sides as well. The ICT current state of implementation was not found in the research work, and it was assumed null for each analysed country. DG and ESS per cent completion state were assumed null due to a lack of information about their amount in a fully developed smart grid. However, some data, as reported in Table 1, such as WAMS, DA, and SEM, were described by qualitative features rather than quantitative ones due to a lack of information found about them. Therefore, further analysis is required for these smart grid components to achieve a better result regarding the smart grid state of play in each country.
Author Contributions
Conceptualization, P.S., L.A., V.D.N., F.H.G., and G.T.; methodology, P.S., L.A., V.D.N., F.H.G., and G.T.; validation, P.S., L.A., F.H.G., V.D.N., and G.T.; formal analysis, P.S., L.A., V.D.N., F.H.G., and G.T.; investigation, P.S., L.A., V.D.N., F.H.G., and G.T.; resources, P.S., L.A., V.D.N., F.H.G., and G.T.; data curation, P.S., L.A., V.D.N., F.H.G., and G.T.; writing—original draft preparation, P.S., L.A., V.D.N., F.H.G., and G.T.; writing—review and editing, P.S., L.A., F.H.G., V.D.N., and G.T.; visualization, P.S., L.A., F.H.G., V.D.N., and G.T.; supervision, P.S.; project administration, P.S.; funding acquisition, P.S. All authors have read and agreed to the published version of the manuscript.
Funding
This research was funded by 7PF-MARIE SKLODOWSKA CURIE, grant number PIRSES-GA-2012-318908.
Institutional Review Board Statement
Not applicable.
Informed Consent Statement
Not applicable.
Data Availability Statement
The data presented in this study are available on request.
Acknowledgments
The authors would like to acknowledge Marco Liscio, Alvaro Tabares, Sergio Quintero, Chiara Giros, Praneeth Vudicala, Alberto Fedele, and Weibin Lin Director of the Center for the Energy and Industry Economic Research at Beijing Normal University (Beijing, China).
Conflicts of Interest
The authors declare no conflict of interest.
References
- Savinar, M.J.D. The Age of Oil Is Over; Matt Savinar Publishing: Santa Rosa, CA, USA, 2004. [Google Scholar]
- International Renewable Energy Agency. Electrification with Renewables, Driving the Transformation of Energy Services; International Renewable Energy Agency: Abu Dhabi, United Arab Emirates, 2019. [Google Scholar]
- Paul, D.; Cole, W.; Frazier, A.W.; Podkaminer, K.; Blair, N. The Four Phases of Storage Deployment: A Framework for the Expanding Role of Storage in the U.S. Power System; NREL/TP-6A20-77480; National Renewable Energy Laboratory: Golden, CO, USA, 2021. [Google Scholar]
- Shivakumar, A.; Pye, S.; Anjo, J.; Miller, M.; Rouelle, P.B.; Densing, M.; Kober, T. Smart energy solutions in the EU: State of play and measuring progress. Energy Strategy Rev. 2018, 20, 133–149. [Google Scholar] [CrossRef]
- Das, C.K.; Bass, O.; Kothapalli, G.; Mahmoud, T.S.; Habibi, D. Overview of energy storage systems in distribution networks: Placement, sizing, operation, and power quality. Renew. Sustain. Energy Rev. 2018, 91, 1205–1230. [Google Scholar] [CrossRef]
- Nuclear Power in the European Union. Available online: https://www.world-nuclear.org/information-library/country-profiles/others/european-union.aspx (accessed on 26 January 2021).
- COWI; ECOFYS; THEMA; VITO; Energy Ville. Impact Assessment Study on Downstream Flexibility, Price Flexibility, Demand Response & Smart Metering—Final Report; Issue ENER/B3/2015-641; European Commission, Directorate-General for Energy: Brussels, Belgium, 2016. [Google Scholar]
- ENTSO-E. Research, Development & Innovation Roadmap 2020–2030. Available online: https://eepublicdownloads.entsoe.eu/clean-documents//RDC%20publications/entso-e-rdi_roadmap-2020-2030.pdf (accessed on 14 January 2021).
- ENTSO-E. Ten-Year Network Development Plan 2020—Main Report. Available online: https://eepublicdownloads.blob.core.windows.net/public-cdn-container/tyndp-documents/TYNDP2020/Foropinion/TYNDP2020_Main_Report.pdf (accessed on 4 February 2021).
- Vincent, E.N.; Yusuf, S.D. Integrating Renewable Energy and Smart Grid Technology into the Nigerian Electricity Grid System. Smart Grid Renew. Energy 2014, 5, 220–238. [Google Scholar] [CrossRef] [Green Version]
- El-Hawary, M.E. The Smart Grid—State-of-the-art and Future Trends. Electr. Power Components Syst. 2014, 42, 239–250. [Google Scholar] [CrossRef]
- Internation Renewable Energy Agency. Smart Grids and Renewables a Cost-Benefit Analysis Guide for Developing Countries; International Renewable Energy Agency: Abu Dhabi, United Arab Emirates, 2015. [Google Scholar]
- United States Department of Energy. User Guide for the U.S. Department of Energy Smart Grid Computational Tool (SGCT); Navigant Consulting, Inc.: Burlington, MA, USA, 2011.
- Garcia, C.I.; Grasso, F.; Luchetta, A.; Piccirilli, M.C.; Paolucci, L.; Talluri, G. A Comparison of Power Quality Disturbance Detection and Classification Methods Using CNN, LSTM and CNN-LSTM. Appl. Sci. 2020, 10, 6755. [Google Scholar] [CrossRef]
- Talluri, G.; Grasso, F.; Chiaramonti, D. Is Deployment of Charging Station the Barrier to Electric Vehicle Fleet Development in EU Urban Areas? An Analytical Assessment Model for Large-Scale Municipality-Level EV Charging Infrastructures. Appl. Sci. 2019, 9, 4704. [Google Scholar] [CrossRef] [Green Version]
- De Gennaro, M.; Paffumi, E.; Martini, G. Customer-driven design of the recharge infrastructure and Vehicle-to-Grid in urban areas: A large-scale application for electric vehicles deployment. Energy 2015, 82, 294–311. [Google Scholar] [CrossRef]
- De Gennaro, M.; Paffumi, E.; Martini, G. Big Data for Supporting Low-Carbon Road Transport Policies in Europe: Applications, Challenges and Opportunities. Big Data Res. 2016, 6, 11–25. [Google Scholar] [CrossRef]
- Cao, J.; Zhao, Y.; Wang, T.; Yu, H.; Zhang, N. A new type of fault current limiter. In Proceedings of the 2017 IEEE 2nd Advanced Information Technology, Electronic and Automation Control Conference (IAEAC), Chongqing, China, 25–26 March 2017; pp. 2300–2304. [Google Scholar] [CrossRef]
- Patil, S.; Thorat, A. Development of fault current limiters: A review. In Proceedings of the 2017 International Conference on Data Management, Analytics and Innovation (ICDMAI), Pune, India, 24–26 February 2017; pp. 122–126. [Google Scholar] [CrossRef]
- Cai, J.Y.; Huang, Z.; Hauer, J.; Martin, K. Current status and experience of WAMS implementation in North America. In Proceedings of the IEEE/PES Transmission & Distribution Conference & Exposition: Asia and Pacific, Dalian, China, 18 August 2005; pp. 1–7. [Google Scholar] [CrossRef]
- Zolin, D.S.; Ryzhkova, E.N. Wide Area Monitoring System (WAMS) application in smart grids. In Proceedings of the 2021 3rd International Youth Conference on Radio Electronics, Electrical and Power Engineering (REEPE), Moscow, Russia, 11–13 March 2021. [Google Scholar] [CrossRef]
- Jadhav, S.; Lavand, S.; Gajjar, G. Wide area measurement system based frequency data mining for event detection in power system. In Proceedings of the 2019 8th International Conference on Power Systems (ICPS), Jaipur, India, 20–22 December 2019; pp. 1–6. [Google Scholar] [CrossRef]
- Madadi, S.; Mohammadi-Ivatloo, B.; Tohidi, S. Probabilistic Available Transfer Capability Evaluation Considering Dynamic Line Rating Based on a Sequential Game-Theoretic Approach. IEEE Syst. J. 2021, 286. [Google Scholar] [CrossRef]
- Erdinç, F.G.; Erdinç, O.; Yumurtacı, R.; Catalão, J.P.S. A Comprehensive Overview of Dynamic Line Rating Combined with Other Flexibility Options from an Operational Point of View. Energies 2020, 13, 6563. [Google Scholar] [CrossRef]
- Maksić, M.; Kosec, G.; Djurica, V.; Souvent, A.; Trobec, R. Dynamic thermal rating of power lines in raining conditions—Model and measurements. In Proceedings of the 2016 IEEE Power and Energy Society General Meeting (PESGM), Boston, MA, USA, 17–21 July 2016; pp. 1–4. [Google Scholar] [CrossRef]
- Ilamparithi, T.; Abourdia, S.; Kirk, T. On the use of real lime simulators for the lest and validation of protection and control systems of micro grids and smart grids. In Proceedings of the 2016 Saudi Arabia Smart Grid (SASG), Jeddah, Saudi Arabia, 6–8 December 2016; pp. 1–5. [Google Scholar] [CrossRef]
- Zhang, H.; Li, S. Design of adaptive line protection under smart grid. In Proceedings of the International Conference on Advanced Power System Automation and Protection, Beijing, China, 16–20 October 2011; pp. 599–603. [Google Scholar] [CrossRef]
- Gupta, P.; Bhatia, R.S.; Jain, D.K. Adaptive protection schemes for the microgrid in a Smart Grid scenario: Technical challenges. In Proceedings of the 2013 IEEE Innovative Smart Grid Technologies-Asia (ISGT Asia), Bangalore, India, 10–13 November 2013; pp. 1–5. [Google Scholar] [CrossRef]
- Konakalla, S.A.R.; Valibeygi, A.; De Callafon, R.A. Microgrid dynamic modeling and islanding control with synchrophasor data. IEEE Trans. Smart Grid 2019, 11, 905–915. [Google Scholar] [CrossRef]
- Daliparthi, M.; Jakub-Wood, M.; Bose, A.; Srivastava, A. Analysis of the Volt/VAr control scheme for smart distribution feeders. In Proceedings of the 2012 North American Power Symposium (NAPS), Champaign, IL, USA, 9–11 September 2012; pp. 1–6. [Google Scholar] [CrossRef]
- Taranto, G.N. Automatic Reconnection from Intentional Islanding Based on Remote Sensing of Voltage and Frequency Signals. IEEE Trans. Smart Grid 2012, 3, 1877–1884. [Google Scholar] [CrossRef]
- Bindi, M.; Aizenberg, I.; Belardi, R.; Grasso, F.; Luchetta, A.; Manetti, S.; Piccirilli, M.C. Neural Network-Based Fault Diagnosis of Joints in High Voltage Electrical Lines. Adv. Sci. Technol. Eng. Syst. J. 2020, 5, 488–498. [Google Scholar] [CrossRef]
- Grasso, F.; Talluri, G.; Giorgi, A.; Luchetta, L.; Paolucci, L. Peer-to-Peer Energy Exchanges Model to optimize the Integration of Renewable Energy Sources: The E-Cube Project. Energ. Elettr. Suppl. J. 2020, 96. [Google Scholar] [CrossRef]
- Pinte, B.; Quinlan, M.; Reinhard, K. Low voltage micro-phasor measurement unit (μPMU). In Proceedings of the 2015 IEEE Power and Energy Conference at Illinois, PECI 2015, Champaign, IL, USA, 20–21 February 2015. [Google Scholar] [CrossRef]
- United States Department of Energy. Smart Grid System Report, 2018 Report to Congress; United States Department of Energy: Washington, DC, USA, 2018.
- Phadke, A.G.; Bi, T. Phasor measurement units, WAMS, and their applications in protection and control of power systems. J. Mod. Power Syst. Clean Energy 2018, 6, 619–629. [Google Scholar] [CrossRef] [Green Version]
- Vanfretti, L.; Van Hertem, D.; Nordström, L.; Gjerde, J.O. A smart transmission grid for Europe: Research challenges in developing grid enabling technologies. In Proceedings of the IEEE Power and Energy Society General Meeting, Detroit, MI, USA, 24–28 July 2011. [Google Scholar] [CrossRef] [Green Version]
- Giordano, V.; Gangale, F.; Fulli, G.; Sanchez Jimenez, M.; Papaioannou, I.; Colta, A.; Onyeij, K.I.; Mengolini, A.; Ojala, T.; Maschio, I.; et al. Smart grid projects in Europe—Lessons learned and current developments. In JRC Reference Reports; Publications Office of the European Union: Luxembourg, 2011. [Google Scholar]
- European Commission. Projects of Common Interest (PCI). Available online: https://ec.europa.eu/energy/infrastructure/transparency_platform/map-viewer/main.html#&ui-state=dialog (accessed on 19 February 2021).
- State Grid Corporation of China. Available online: http://www.sgcc.com.cn/html/sgcc_main_en/col2017112614/column_2017112614_1.shtml (accessed on 19 January 2021).
- WSP. Smart Grid Market Analysis: China; WSP: Montreal, QC, Canada, 2019. [Google Scholar]
- International Energy Agency. World Energy Investment 2020; International Energy Agency: Paris, France, 2020; Available online: https://www.iea.org/reports/world-energy-investment-2020 (accessed on 29 January 2021).
- Smart Home. Available online: https://www.statista.com/outlook/279/102/smart-home/europe (accessed on 14 February 2021).
- Francis, M.W.; Alexis, Z.; Gyee, L.; Pieter, H.; Shannon, L.; Colin, M.; Wonder, M. US Connected Home Market. Available online: https://askwonder.com/research/us-connected-home-market-4qifpd55k#:~:text=u.s (accessed on 26 January 2021).
- Finamore, B. NRDC, How EV Charging Can Clean Up China’s Electricity Grid. Available online: https://www.nrdc.org/experts/barbara-finamore/how-ev-charging-can-clean-chinas-electricity-grid (accessed on 19 January 2021).
- International Renewable Energy Agency. Innovation Landscape Brief: Electric-Vehicle Smart Charging; International Renewable Energy Agency: Abu Dhabi, United Arab Emirates, 2019. [Google Scholar]
- United States Environmental Protection Agency. U.S. Electricity Grid & Markets. June 2020. Available online: https://www.epa.gov/greenpower/us-electricity-grid-markets (accessed on 22 January 2021).
- Brunekreeft, G.; Luhmann, T.; Menz, T.; Müller, S.-U.; Recknagel, P. Regulatory Pathways for Smart Grid Development in China; Springer: Wiesbaden, Germany, 2015. [Google Scholar] [CrossRef] [Green Version]
- Jacottet, A. Cross-Border Electricity Interconnections for a Well-Functioning EU Internal Electricity Market; OIES Paper; Oxford Institute for Energy Studies: Oxford, UK, 2012. [Google Scholar]
- Supponen, M.; Qing, X. Electricity Markets and Systems in the EU and China Towards better Integration of Clean Energy Sources. June 2020. Available online: https://ec.europa.eu/energy/sites/default/files/electricity_markets_report_en.pdf (accessed on 24 August 2021).
- Towards a Sustainable and Integrated Europe; Report of the Commission Expert Group on Electricity Interconnection Targets; The European Commission, Energy: Brussels, Belgium, November 2017; Available online: https://ec.europa.eu/energy/sites/ener/files/documents/report_of_the_commission_expert_group_on_electricity_interconnection_targets.pdf (accessed on 24 August 2021).
- Treaty of Lisbon Amending the Treaty on European Union and the Treaty Establishing the European Community, Signed at Lisbon, 13 December 2007; European Parliament: Strasbourg, France, 2007.
- Wan, S.; Tong, S. Climate Scorecard; Time-of-Use Electricity Price Plan. Available online: https://www.climatescorecard.org/2019/02/time-of-use-electricity-price-plan/#:~:text=Since (accessed on 19 February 2021).
- International Renewable Energy Agency. Innovation Landscape Brief: Time-of-Use Tariffs; International Renewable Energy Agency: Abu Dhabi, United Arab Emirates, 2019. [Google Scholar]
- Hove, A.; Sandalow, D. Electric Vehicle Charging in China and the United States; Columbia SIPA Centre on Global Energy Policy: New York, NY, USA, 2019; Available online: https://energypolicy.columbia.edu/sites/default/files/file-uploads/EV_ChargingChina-CGEP_Report_Final.pdf (accessed on 25 February 2021).

Figure 2.
Smart grid overall state of play (SGOSoP) within China, the US, and the EU.


Table 1.
Smart grid assets and functions.
| Advanced Interrupting Switch | AMI/Smart Meters | Controllable/regulating Inverter | Customer EMS/Display/Portal | Distribution Automation | Distribution Management System | Enhanced Fault Detection Technology | Equipment Health Sensor | FACTS Device | Fault Current Limiter | Loading Monitor | Microgrid Controller | Phase Angle Regulating Transformer | ||||
|---|---|---|---|---|---|---|---|---|---|---|---|---|---|---|---|---|
| BENEFITS | Economic | Improved Asset Utilization | Optimized Generator Operation | × | ||||||||||||
| Deferred Generation Capacity Investments | × | × | × | |||||||||||||
| Reduced Ancillary Service Cost | × | × | ||||||||||||||
| Reduced Congestion Cost | × | |||||||||||||||
| T&D Capital Savings | Deferred Transmission Capacity Investments | × | × | × | × | × | ||||||||||
| Deferred Distribution Capacity Investments | × | × | × | × | × | × | × | |||||||||
| Reduced Equipment Failures | × | |||||||||||||||
| T&D O&M Savings | Reduced Distribution Equipment Maintenance Cost | × | × | |||||||||||||
| Reduced Distribution Operations Cost | × | |||||||||||||||
| Reduced Meter Reading Cost | × | |||||||||||||||
| Theft Reduction | Reduced Electricity Theft | × | × | × | ||||||||||||
| Energy Efficiency | Reduced Electricity Losses | × | ||||||||||||||
| Electricity Cost Savings | Reduced Electricity Cost | × | ||||||||||||||
| Reliability | Power Interruptions | Reduced Sustained Outages | × | |||||||||||||
| Reduced Major Outages | × | |||||||||||||||
| Reduced Restoration Cost | × | × | ||||||||||||||
| Power Quality | Reduced Momentary Outages | × | × | × | × | × | × | × | ||||||||
| Reduced Sags and Swells | ||||||||||||||||
| Environ- mental | Air Emissions | Reduced CO2 Emissions | × | |||||||||||||
| Reduced SOx, NOx, and PM-1O Emissions | ||||||||||||||||
| Security | Energy Security | Reduced Oil Usage | ||||||||||||||
| Reduced Wide-scale Blackouts |
Table 2.
Smart grid technologies and integrated assets with their per cent state of play.
| Smart Grid Technology | Percent State of Implementation | ||
|---|---|---|---|
| China | US | EU | |
| Wide Area Management System (WAMS) | 33% | 33% | 25% |
| Distribution Automation (DA) | 33% | 22% | 0% |
| Advanced Metering Infrastructure (AMI) | 84% | 50% | 80% |
| Customer Technology (CT) | 13% | 28% | 13% |
| Information and Communication Technology (ICT) | 0% | 0% | 0% |
| Distributed Generation (DG) | 0% | 0% | 0% |
| Energy Storage System (ESS) | 0% | 0% | 0% |
| Electric Vehicle (EV) Infrastructure | 0% | 0% | 0% |
| Smart Electricity Market (SEM) | 0% | 0% | 0% |
| Smart Grid Overall State of Play | 18% | 15% | 13% |
Publisher’s Note: MDPI stays neutral with regard to jurisdictional claims in published maps and institutional affiliations. |
© 2021 by the authors. Licensee MDPI, Basel, Switzerland. This article is an open access article distributed under the terms and conditions of the Creative Commons Attribution (CC BY) license (https://creativecommons.org/licenses/by/4.0/).
Share and Cite
MDPI and ACS Style
Sospiro, P.; Amarnath, L.; Di Nardo, V.; Talluri, G.; Gandoman, F.H. Smart Grid in China, EU, and the US: State of Implementation. Energies 2021, 14, 5637. https://doi.org/10.3390/en14185637
AMA Style
Sospiro P, Amarnath L, Di Nardo V, Talluri G, Gandoman FH. Smart Grid in China, EU, and the US: State of Implementation. Energies. 2021; 14(18):5637. https://doi.org/10.3390/en14185637
Chicago/Turabian StyleSospiro, Paolo, Lohith Amarnath, Vincenzo Di Nardo, Giacomo Talluri, and Foad H. Gandoman. 2021. "Smart Grid in China, EU, and the US: State of Implementation" Energies 14, no. 18: 5637. https://doi.org/10.3390/en14185637
Note that from the first issue of 2016, this journal uses article numbers instead of page numbers. See further details here.