
Design and Energy Performance Analysis of a Hotel Building in a Hot and Dry Climate: A Case Study


1
Department of Civil and Environmental Engineering, Nazarbayev University, 53 Kabanbay Batyr Ave., Nur-Sultan 010000, Kazakhstan
2
School of Architecture, Design and the Built Environment, Nottingham Trent University, 50 Shakespeare Street, Nottingham Trent University, Nottingham NG1 4FQ, UK
3
Department of Engineering and Architectural Studies, Ara Institute of Canterbury, 130 Madras Street, Christchurch 8011, New Zealand
*
Authors to whom correspondence should be addressed.
Energies 2021, 14(17), 5502; https://doi.org/10.3390/en14175502
Submission received: 12 August 2021
/
Revised: 28 August 2021
/
Accepted: 1 September 2021
/
Published: 3 September 2021
(This article belongs to the Special Issue Volume II: Thermal Behaviour, Energy Efficiency in Buildings and Sustainable Construction)
Abstract
:In times of unprecedented climate change and energy scarcity, the design and delivery of energy-efficient and sustainable buildings are of utmost importance. This study aimed to design a hotel building for hot and dry climate conditions and perform its energy performance analysis using energy simulation tools. The model of the hotel building was constructed by a graphical tool OpenStudio and EnergyPlus following the ASHRAE Standard 90.1. To reduce the energy demand of the hotel, parametric analysis was conducted and building envelope parameters such as the thickness of insulation layer in the exterior wall and the roof, thermal conductivity of insulation layer, rate of infiltration, U-factor of windows, and thermal resistance of air gap in the interior walls (R-value), window-to-wall ratio, and orientation of the building were tested and the impact on the energy use of the building was analyzed. It was found that most of the design assumptions based on the ASHRAE standard were already optimal for the considered locality, however, were still optimized further to reach the highest efficiency level. Apart from this, three sustainable technologies—thermochromic windows, phase change materials, and solar panels—were incorporated into the building and their energy consumption reduction potential was estimated by energy simulations. Cumulatively, these sustainable technologies were able to reduce the total energy use from 2417 GJ to 1593 GJ (i.e., by 824 GJ or 34%). Calculation of payback period and return on investments showed that thermochromic windows and solar panels have relatively short payback periods and high return on investments, whereas PCM was found to be economically nonviable. The findings of this study are deemed to be useful for designing a sustainable and energy-efficient hotel building in a sub-tropical climate. However, the overall design and energy performance analysis algorithm could be used for various buildings with varying climate conditions.
1. Introduction
Globally, buildings account for about one-third of the final energy use, and the major part of that energy is consumed, among others, by heating, ventilation, and air conditioning systems [1,2]. Thus, buildings offer a significant potential to reduce the energy consumed by the building sector and thus mitigate the effects of climate change and the ongoing energy crisis [3]. Therefore, it is imperative for all the new buildings to satisfy the highest standards of energy efficiency and to operate at the lowest possible energy consumption (EC) levels. The up-to-date research findings refer to a combination of measures that could increase the energy efficiency of the buildings such as, for example, design optimization and integration of sustainable energy technologies and sustainable materials [4]. Generally, solutions for achieving net-zero energy buildings (NZEB) can be broadly categorized into three groups—passive efficiency strategies, integration of renewables, and active energy technologies [5,6].
Design optimization includes addressing such measures as the window-to-wall ratio (WWR), building orientation, shadings, cool roofs, modifications to buildings’ envelope and thermal mass, etc. There is a wide consensus among the scientific community that early actions taken with optimizing the above-mentioned parameters yield substantial improvements in the efficiency of buildings, which will eventually impact the sizing of HVAC equipment and help to achieve a higher-performing building [7,8,9]. In this study, the following design parameters were considered: building envelope optimization (thickness and conductivity of insulation layers, infiltration rate, U-factor of windows, and thermal resistance of interior walls), WWR, and building orientation.
Several studies have been conducted by researchers to determine the most energy-efficient options for optimization of building design at a preliminary stage. Tuhus-Dubrow and Krarti [10] used a genetic algorithm to determine optimum building shapes, orientation, wall and roof construction, window type, window area, foundation, infiltration rate, insulation thickness, and shading of residential buildings. Ascione et al. [11] optimize the annual energy consumption of buildings in the Mediterranean climate zone by using optical properties of external plastering, wall insulations properties, and composition of outer walls as design parameters. Wang and Wei [12], on the other hand, focused on the composition of walls, number, type, dimensions, and material of windows to optimize energy consumption and cost of office buildings using a quantum genetic algorithm. Similarly, Carlucci et al. [13] used multi-objective optimization by the non-dominated sorting genetic algorithm to enhance the thermal comfort of a building with U-values of walls, roofs, and floors as well as U-value and visible transmittance of windows as design variables.
Apart from design optimization, the overall energy efficiency and general sustainability levels of buildings were found to be improved by integrating various sustainable energy technologies and materials. Since the hotel buildings tend to have a great number of windows due to the nature of the room allocation as well as the potential impact on solar gain and overheating, the study paid significant attention to the selection of window types. The study also considered integrating phase change materials (PCMs) and solar energy technologies.
There is a wide consensus among the scientific community and industry practitioners that windows and skylights are building elements with the lowest energy efficiency [14,15,16]. Owing to their relatively smaller thickness compared to exterior walls and roofs, windows have a much higher rate of thermal heat transfer [16]. As there are already a number of heat generators inside the building, such as equipment and people, extra heat gain through windows is often unwanted, especially in moderate climates.
Thermochromic windows are one of the promising technologies intended to address this issue that has drawn particular attention among researchers in recent years [17]. These are a type of smart windows with a special glazing that can passively modulate infrared transmittance from sunlight and alter its optical and thermal properties depending on the intensity of solar heat gain [16]. By reflecting infrared and near-infrared lights while still transmitting visible light, thermochromic windows can reduce cooling energy demand by up to 81.7% and maintain healthy indoor conditions with visual and thermal comfort [16].
Thermochromic windows can be manufactured from various materials, including mercury (II) iodide, chromium (III) oxide, and lead (II) oxide, but so far, the most researched material with thermochromic properties is vanadium dioxide (VO2) [14,16,18]. Traditionally, pure VO2-based coatings were used for manufacturing thermochromic windows as this material provides adequate luminous transmittance and solar modulation properties. However, it has a number of shortcomings, such as relatively low stability of properties, cost inefficiency, and color alterations [16]. To resolve these issues, VO2 is usually doped with additional chemical elements or various organic and inorganic nanomaterials.
Phase change materials (PCMs) are a group of materials that could be considered as sustainable materials that help with energy savings in buildings. PCMs have a high latent heat that can passively store and release thermal energy by undergoing a solid-liquid phase transition. By doing so, PCMs can decrease heating and cooling energy consumption of buildings, reduce indoor temperature fluctuation, shift peak times of energy demand and thus reduce grid load and assist intermittent renewable energy sources, and maintain comfortable indoor temperature conditions [19]. The model of PCM in EnergyPlus was analytically validated by Tabares-Velasco et al. [20], who states that for the accuracy of the model, (1) Conduction Finite Difference algorithm should be used, (2) the number of timesteps per hour should be higher than 20, and (3) space discretization value should be set to at least 3.
Usually, due to partial charging and discharging, PCMs are not exploited to their full potential. Moreover, PCMs cause an additional problem by discharging heat into indoor spaces during cooler times of the day [21]. Therefore, various means of assisting discharge of PCMs, such as natural ventilation, night ventilation, mechanical ventilation, were actively investigated in recent years. One of them is temperature-controlled natural ventilation demonstrated by Prabhakar et al. [21] and Pisello et al. [22], which is reported to significantly improve the energy efficiency of PCMs.
Solar panels or photovoltaic PV panels are devices made of semiconductors that convert energy from photons into electricity by displacing electrons from the semiconductor material’s atoms. It has such advantages as carbon neutrality, low maintenance cost, and relatively low environmental footprint among others. However, it is intermittent and significantly dependent on ambient weather conditions, set aside such challenges as large space requirements and the necessity of energy storage systems. Nevertheless, solar energy technologies are generously subsidized in many parts of the world, which, together with technological advancements, help lower their capital costs and foster their widespread installation [23]. For instance, in the United States, prices of solar panels have dropped by half since 2008, while the capacity of installed panels increased by 35 times [24].
As it can be seen from the literature review, various studies address the impacts of design parameters on the energy use of buildings in general [10,11,12,13]. Some studies separately study the impacts of the integration of renewable energy technologies [5]. However, it was also noted that most articles are concerned about residential buildings and tend to consider only impacts of either design parameters or integration of sustainable energy technologies as standalone solutions. This study, however, is aimed to adopt a systems-based approach and to provide a combined energy performance analysis of both aspects at the same time.
For the purposes of this research, a hotel building was selected. Hotel buildings are quite common around the world and a significant number of them are located near holiday destinations which are known by their tropical and sub-tropical climate conditions [25]. They usually have high comfort levels and, thus, heavily rely on HVAC systems. This motivated the authors of the research to investigate the hotel buildings as their energy optimization and energy efficiency could potentially make a significant contribution to the overall sustainability of the built environment. Thus, this study conducted an energy performance analysis of a hotel building. The primary objectives of this study are:
- (1)
- To optimize thermodynamic properties of a hotel’s building envelope and compare the resultant performance with the baseline model configured as per ASHRAE 90.1.
- (2)
- To investigate the extent to which PV panels, PCMs, and thermochromic windows can improve the energy efficiency of a hotel and subsequently check their economic feasibility.
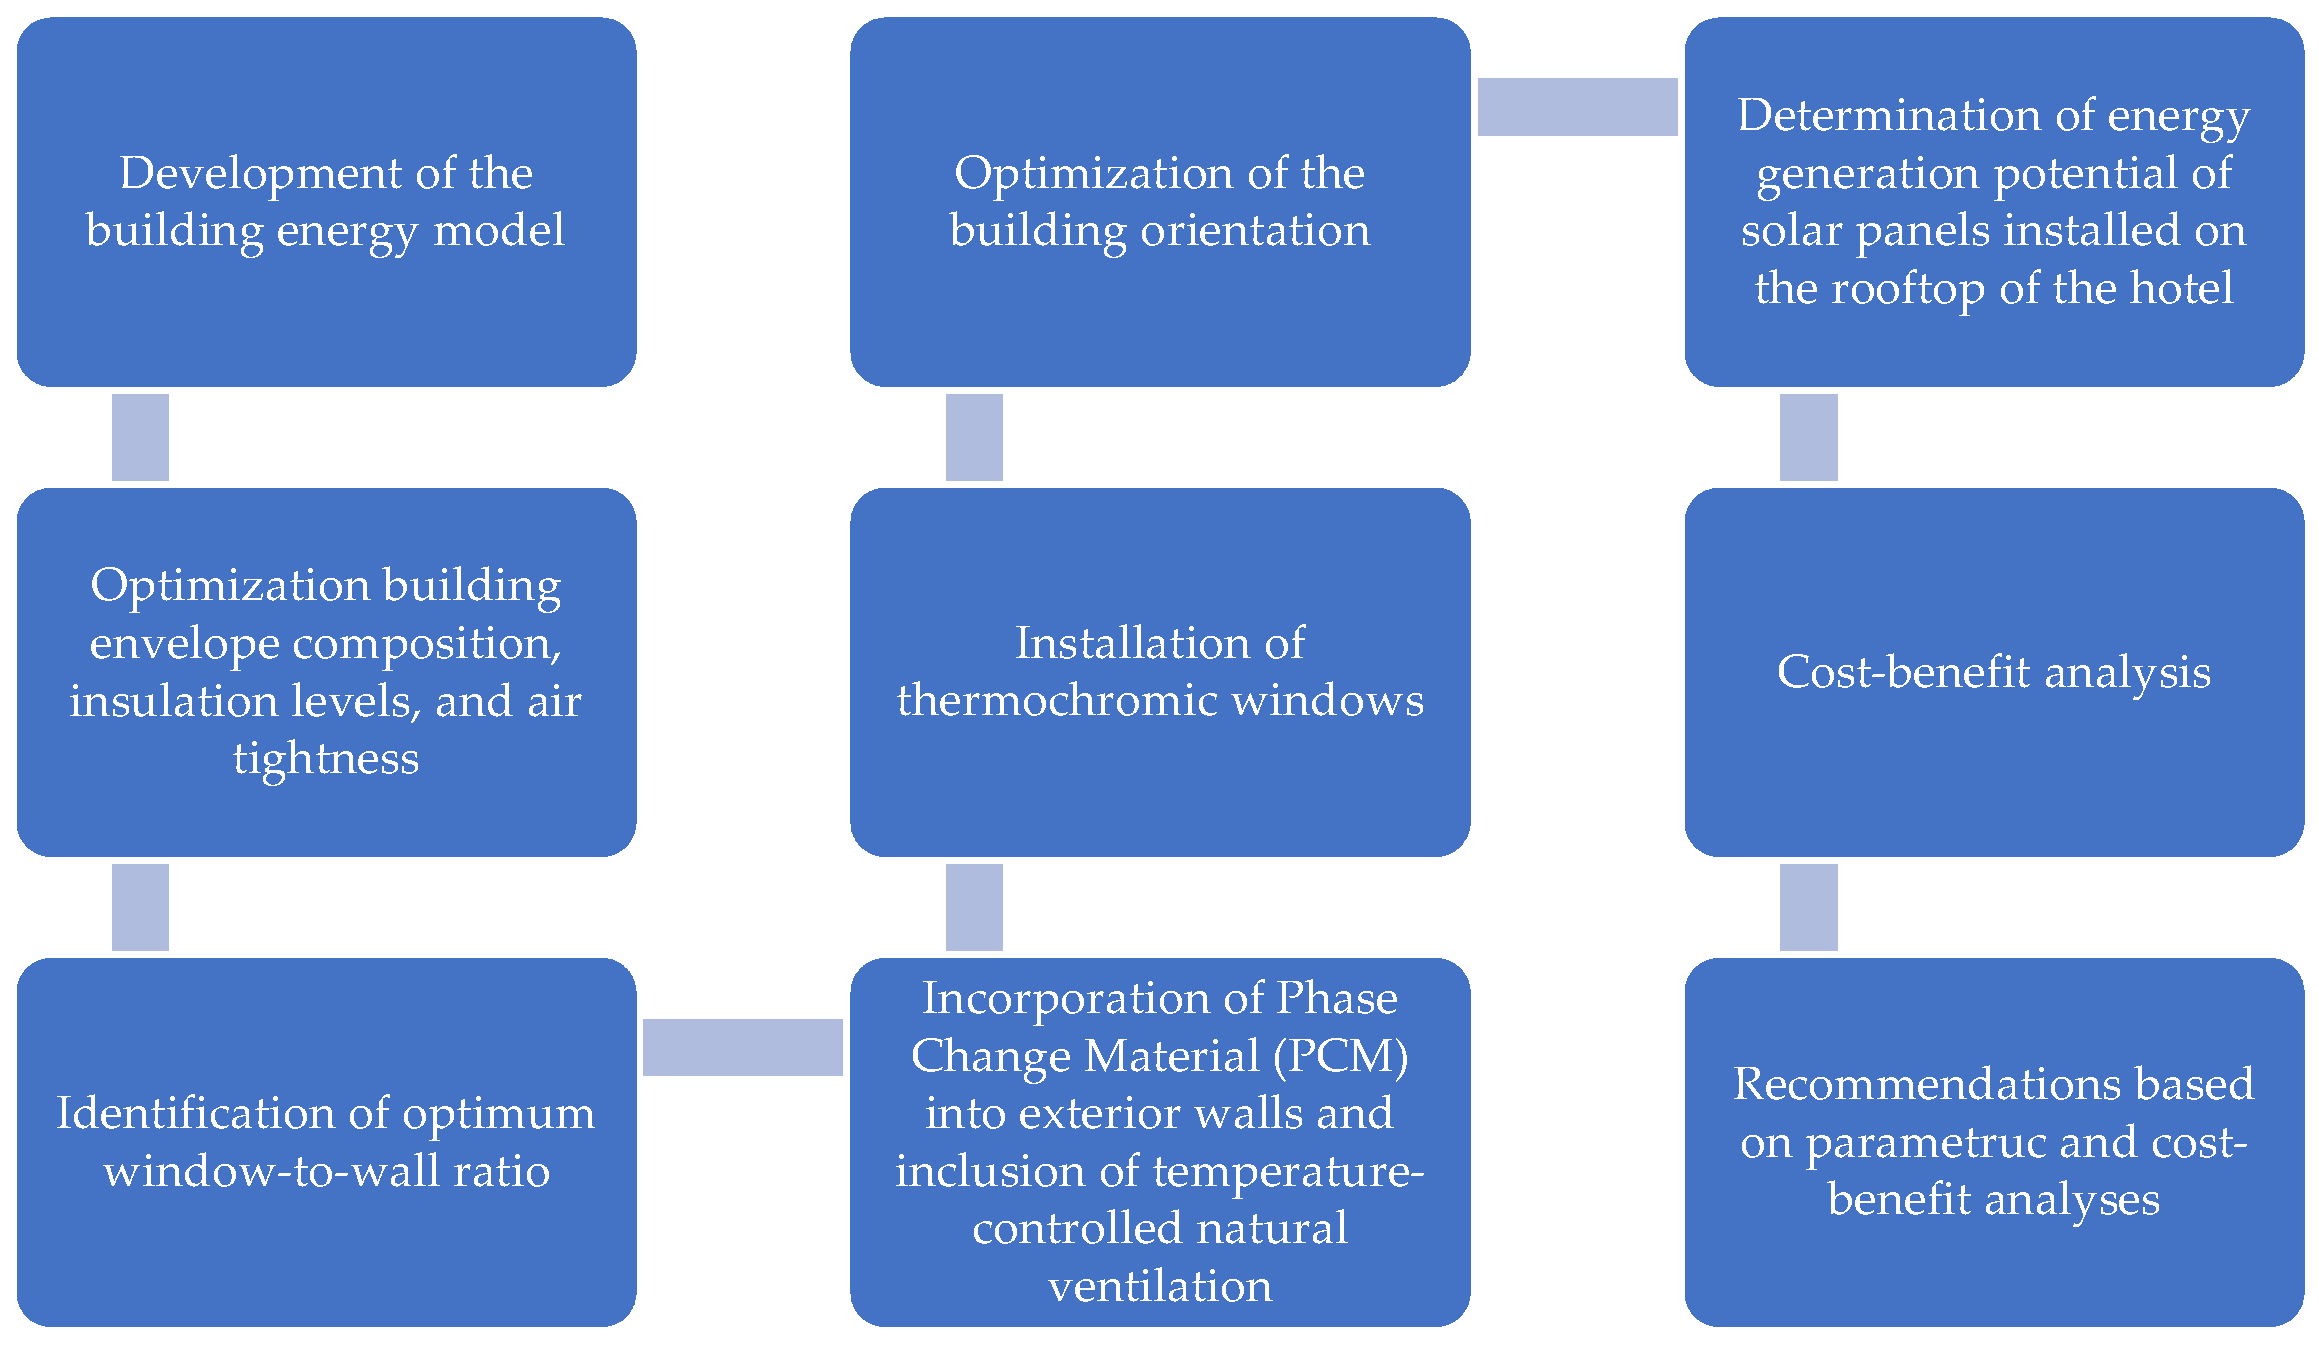
The results of the study would contribute to the existing body of knowledge at least in two important ways. First of all, it will provide practical insights into the effect of envelope optimization and the performance of the above-mentioned sustainable technologies on the energy efficiency of a hotel building in the subtropical climate zone, which, to the best of the authors’ knowledge, has not been well studied yet. Moreover, the following paper would suggest a methodology for optimization of building envelopes and green technologies at the preliminary stages of building design. Although a case study was shown for a high-rise hotel building only, the application of the methodological flow can readily be extended to other building types as well. A simulation model of a theoretical hotel building was created using graphical and energy simulation tools, and then six potential energy performance improvement measures were considered. Subsequently, a basic cost-benefit analysis was performed to evaluate the economic viability and financial attractiveness of the building optimization options. The findings of the study were collated to a set of recommendations for designing and building an energy-efficient hotel building in a sub-tropical hot and dry climate. The steps undertaken in this study are presented in Figure 1.
2. Methodology
The adopted methodology in this study is based on energy performance simulation using a combination of graphical and energy simulation tools which were built based on the relevant standards and codes used in the United States. Building energy efficiency levels have to comply with International Energy Conservation Code. All the analysis presented in this section will be in accordance with ASHRAE [26]. To optimize building envelope characteristics, window-to-wall ratio, building orientation, and characteristics of three sustainable technologies considered in the following study, a simple parametric analysis will be performed and the optimization will be carried out sequentially considering each variable separately. The advantage of adopting this method is that it is simple and quick to perform, which may come at the cost of possibly overlooked interactions between some parameters, such as properties of the building envelope, building orientation, and PCM melting temperature. To account for this kind of interdependencies between various parameters, one may want to use more mathematically rigorous optimization methods, such as the genetic algorithm or stochastic gradient descent.
Development of the Building Energy Model
The energy model of the building was created using the OpenStudio plugin in SketchUp and improved in OpenStudio. The energy simulation of the model was then performed separately in EnergyPlus v9.3. For the validity of the PCM model, the number of timesteps per hour was set to 20 and the Conduction Finite Difference (CondFD) algorithm was used following the recommendations of Tabares-Velasco et al. [20].
Each floor was divided into separate spaces (for guest rooms, bathrooms, lobby, corridors, kitchens, etc.) and each room was set to be a distinct thermal zone. The material composition of walls, slabs, roof, and windows in the initial baseline model was assigned by using templates provided by ASHRAE Standard 90.1 [26] taking into account that the hotel is to be located in climate zone 3B according to the IECC Climate Zone Map [27]. The material composition of exterior walls and roof are shown below in Table 1.
Moreover, space types and schedules for occupancy loads, lighting, and electric equipment were also assigned referring to ASHRAE Standard 90.1. For heating, cooling, and air conditioning of spaces in the hotel Packaged Terminal Air Conditioning (PTAC) system with direct expansion cooling and electric heating was selected due to the following reasons:
- Individual control and a separate air conditioning unit are needed for each hotel room
- The hotel comprises many small rooms and is located in a relatively moderate climate
- The surface area of the building is relatively large and thus different sides of the building may experience different air conditioning needs.
Thermostat set points of different space types have some variations, but for guest rooms, setpoints were selected to be 21 °C and 24 °C of mean air temperature for heating and cooling, respectfully, all days of the week and round-the-clock.
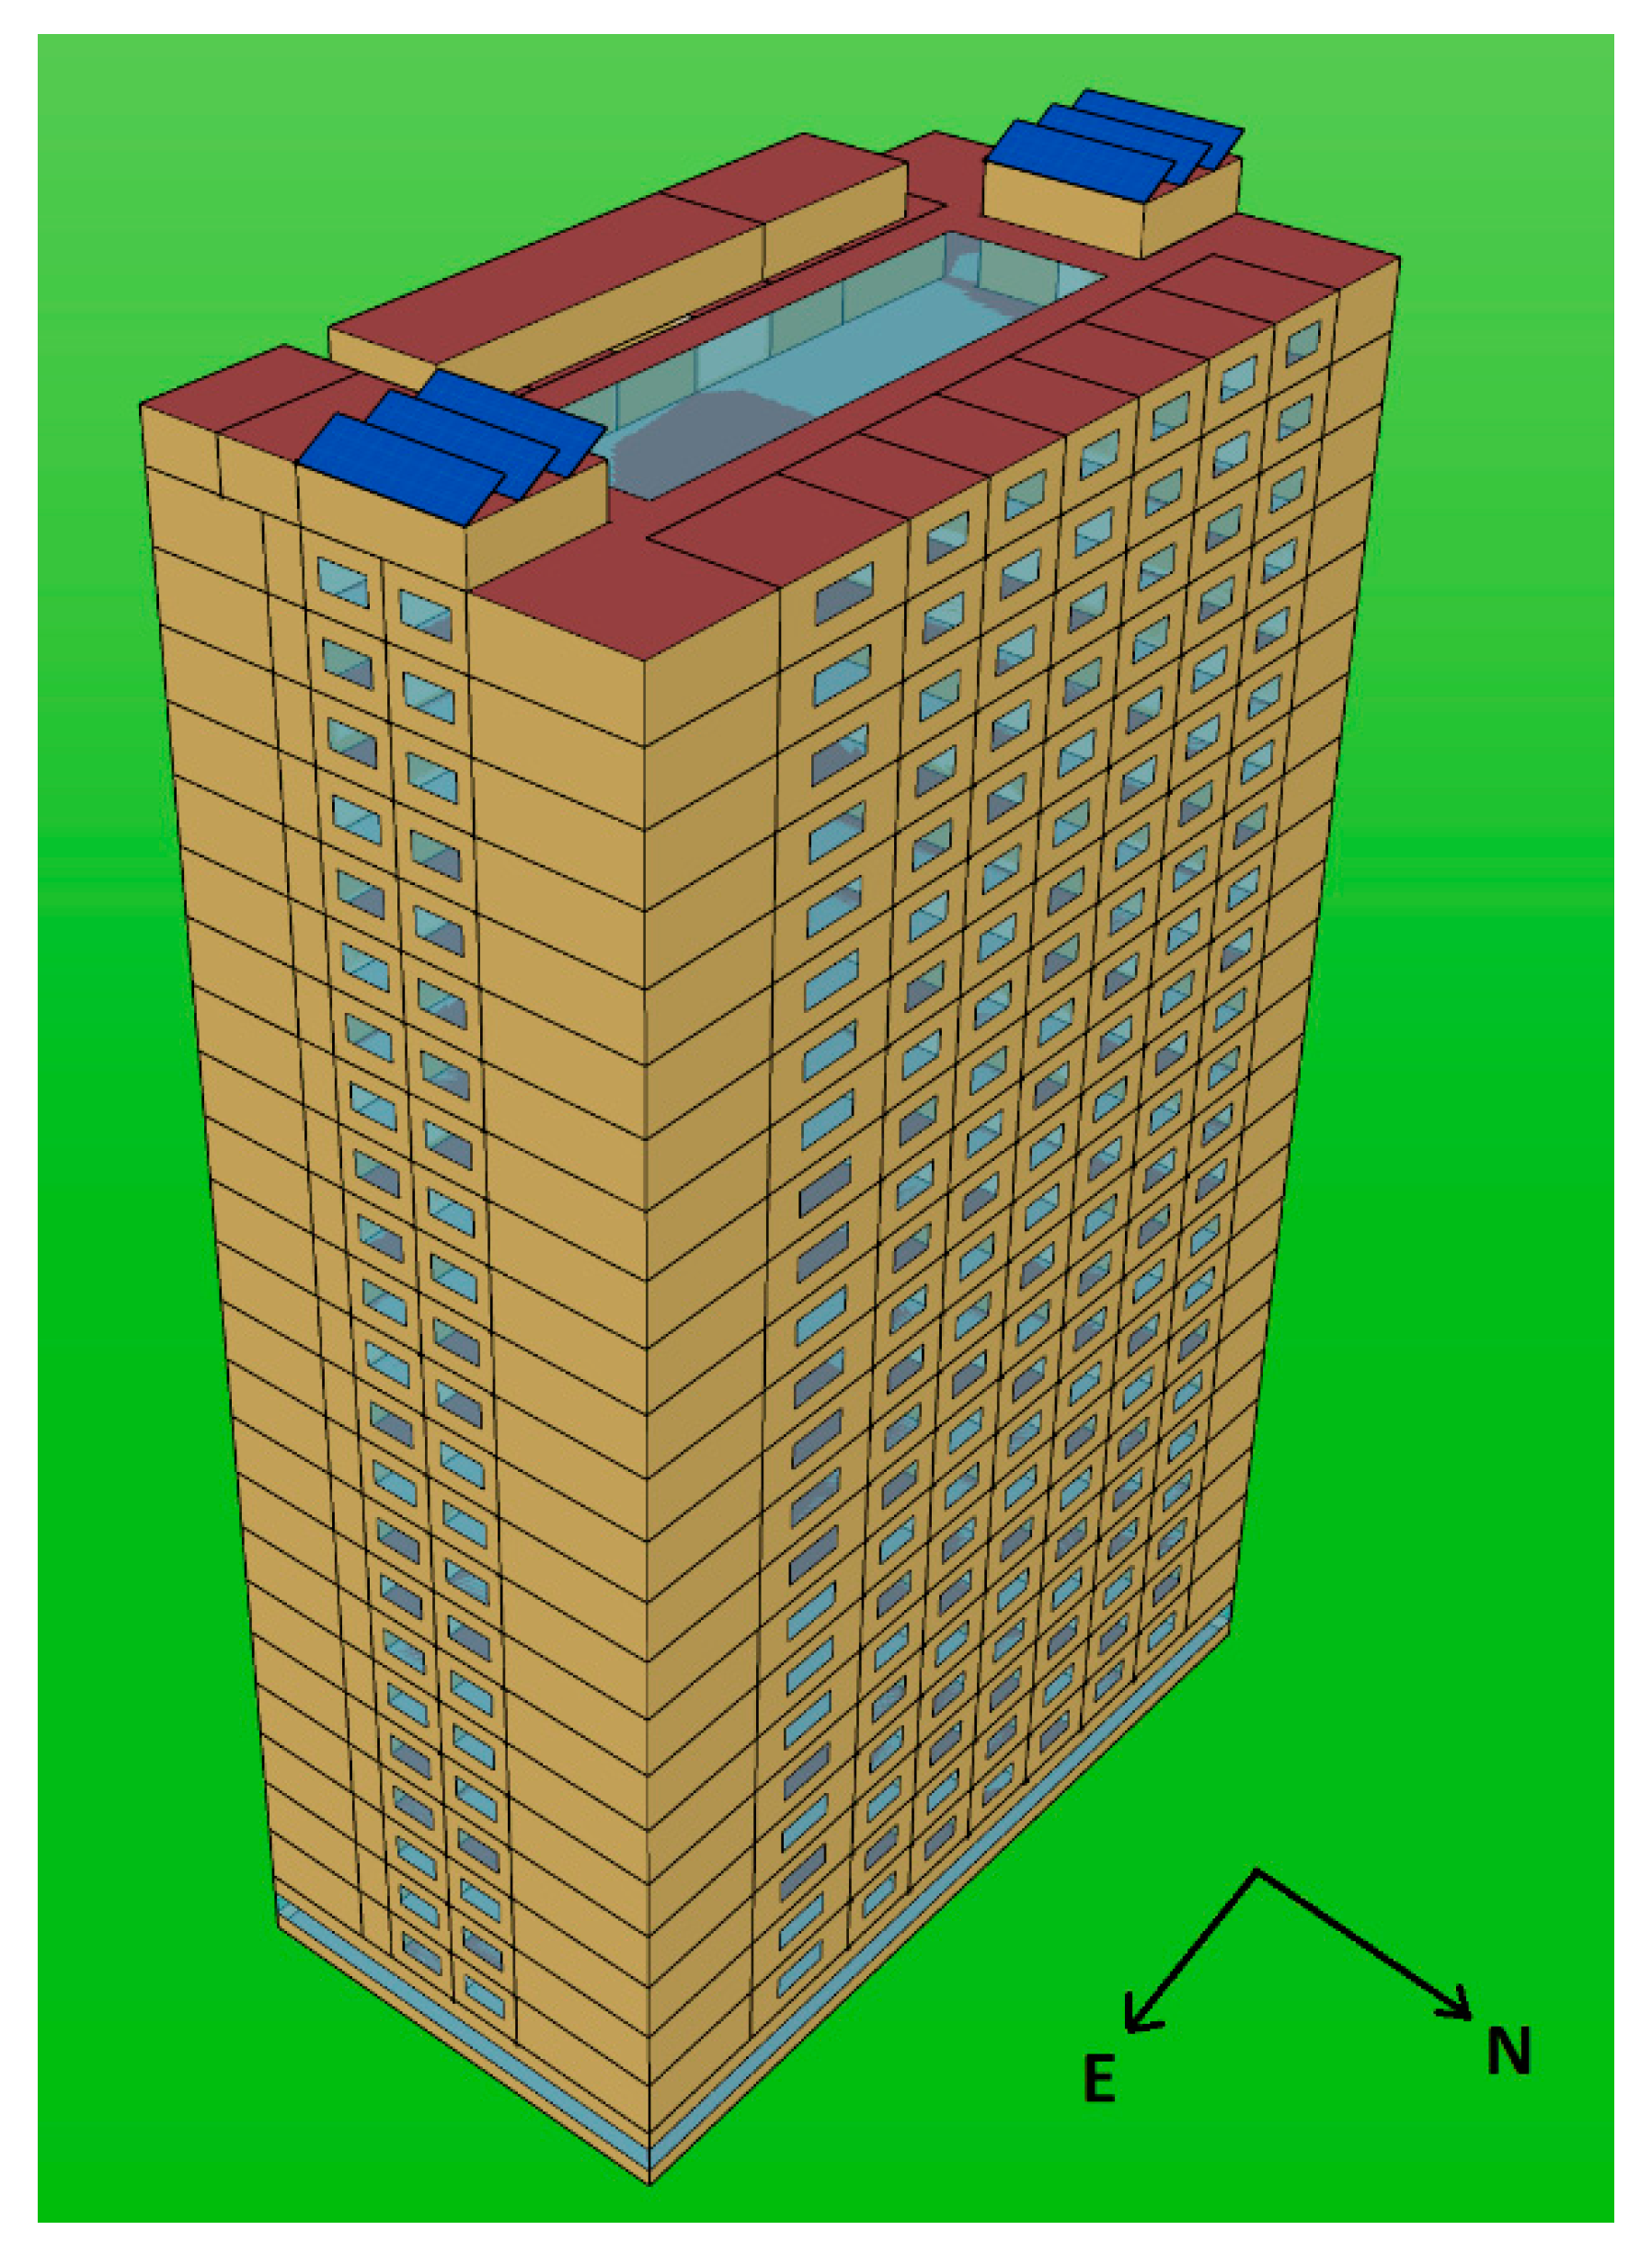
The model was initially built having all 24 floors (see Figure 2), but later, to reduce the simulation time, the number of residential floors was reduced and a zone multiplier of 19 was set for the eleventh floor. Floor and roof surfaces exposed because of this were set to be adiabatic. For simulation, the Conduction Transfer Function algorithm with 6 timesteps per hour was used for all retrofits except for PCMs.
In general, there is no exact scientific reason for choosing this particular type of building other than an attempt to make it representative of common hotel buildings. The hotel is rectangular with an aspect ratio of 2 with rooms arranged along its perimeter and an atrium at the center, which is a common practice for accommodating hotel floors with as many rooms as possible, while also ensuring that indoor areas are well lit.
3. Results and Discussions
3.1. Building Envelope
As was mentioned earlier, the baseline composition of exterior walls and roof were assigned based on the type of building and the climate zone. With this initial configuration, the building consumes an annual heating and cooling energy of 2557.82 GJ. To reduce this value, a parametric analysis was conducted to optimize some key parameters of the building envelope, namely thickness of insulation layer in the exterior wall and the roof (Di, wall and Di, and roof, respectively), the thermal conductivity of the insulation layer (ki), rate of infiltration (I), U-factor of windows, and thermal resistance of air gap in the interior walls (R-value). All six variables control the rate of heat transfer through the envelope of a building and significantly influence its energy demand. Table 2 summarizes the range and increments of these parameters used in the parametric analyses:
To reduce the number of simulations required while still accounting for interdependencies between these parameters, two cycles of “multi-objective” optimizations were conducted first involving only parameters of insulation layers, followed by the inclusion of infiltration, U-values of windows, and thermal resistance of air gap.
From Figure 3, it can be noticed that the original building envelope has already been quite energy-efficient and that in most cases, further alterations of building envelope properties tend to cause negative energy savings. The parametric analysis also reveals that for all six properties, higher values are preferable and the bottom line for all the analyses performed in this section is—the building should be well insulated yet adequately ventilated. The magnitude of energy consumption is the most sensitive to the U-factor of windows and thermal resistance (R-value). Ultimately, the building envelope was optimized as follows, Table 3.
Here, energy savings (ES) and the percentage-based savings (%savings) refer to energy savings relative to the baseline model expressed respectively in terms of absolute magnitude and percentage.
3.2. Window-to-Wall Ratio
Windows and skylights are usually components of building envelopes that have the least thermal resistance, therefore the window-to-wall ratio (WWR) plays a crucial role in improving buildings’ energy efficiency. In the original design, the WWR of different sides of the building are non-uniform, but for the sake of simplicity, optimization will be carried out assuming that WWR will be the same for all sides of the hotel. Table 4 shows the original window-to-wall ratios:
WWR was varied from 5% to 70% with an increment of 5%. Figure 4 below shows how the energy consumption of the building is affected by these changes (Note: percent savings indicated on the graph are relative to the baseline model):
As it is shown in Figure 4, the higher WWR, the higher the energy demand of the building. However, having very small windows would be impractical for hotel buildings both from the point of view of aesthetics and the impact of insufficient daylighting on the physical and mental well-being of tenants. Therefore, considering these factors, it was decided to keep the WWR close to the original value, i.e., 15%.
3.3. Building Orientation
Since the building has an aspect ratio of 2, the orientation of the building has a significant influence on the energy consumption of the building mostly owing to the amount of solar irradiation (refer to Figure 2, to see how the building is originally orientated). In fact, from the annual sun path diagram in Figure 5, it is evidently clear that throughout the year, the northern face of the building is exposed to the direct solar irradiation less compared to other sides of the building:
To find how the energy demand required for heating and cooling of the hotel is affected by the orientation, the orientation of the hotel relative to the north direction was varied from 0° to 355° with an increment of 5°. The result of these simulations is provided in Figure 6:
As can be seen in Figure 6, the energy demand of the hotel is the lowest when its longer side is oriented perpendicular to the North direction. In terms of energy required for air conditioning, there is not much difference between orienting it at 0° or 180° relative to the north. Therefore, architectural considerations would prevail in this case: since an open-air restaurant is to be located on the top floor, it is preferable to have it oriented towards the southern direction—where several landmark buildings are located—to offer guests a better view. Thus, the building will be oriented at 180° relative to the North direction.
3.4. Thermochromic Windows
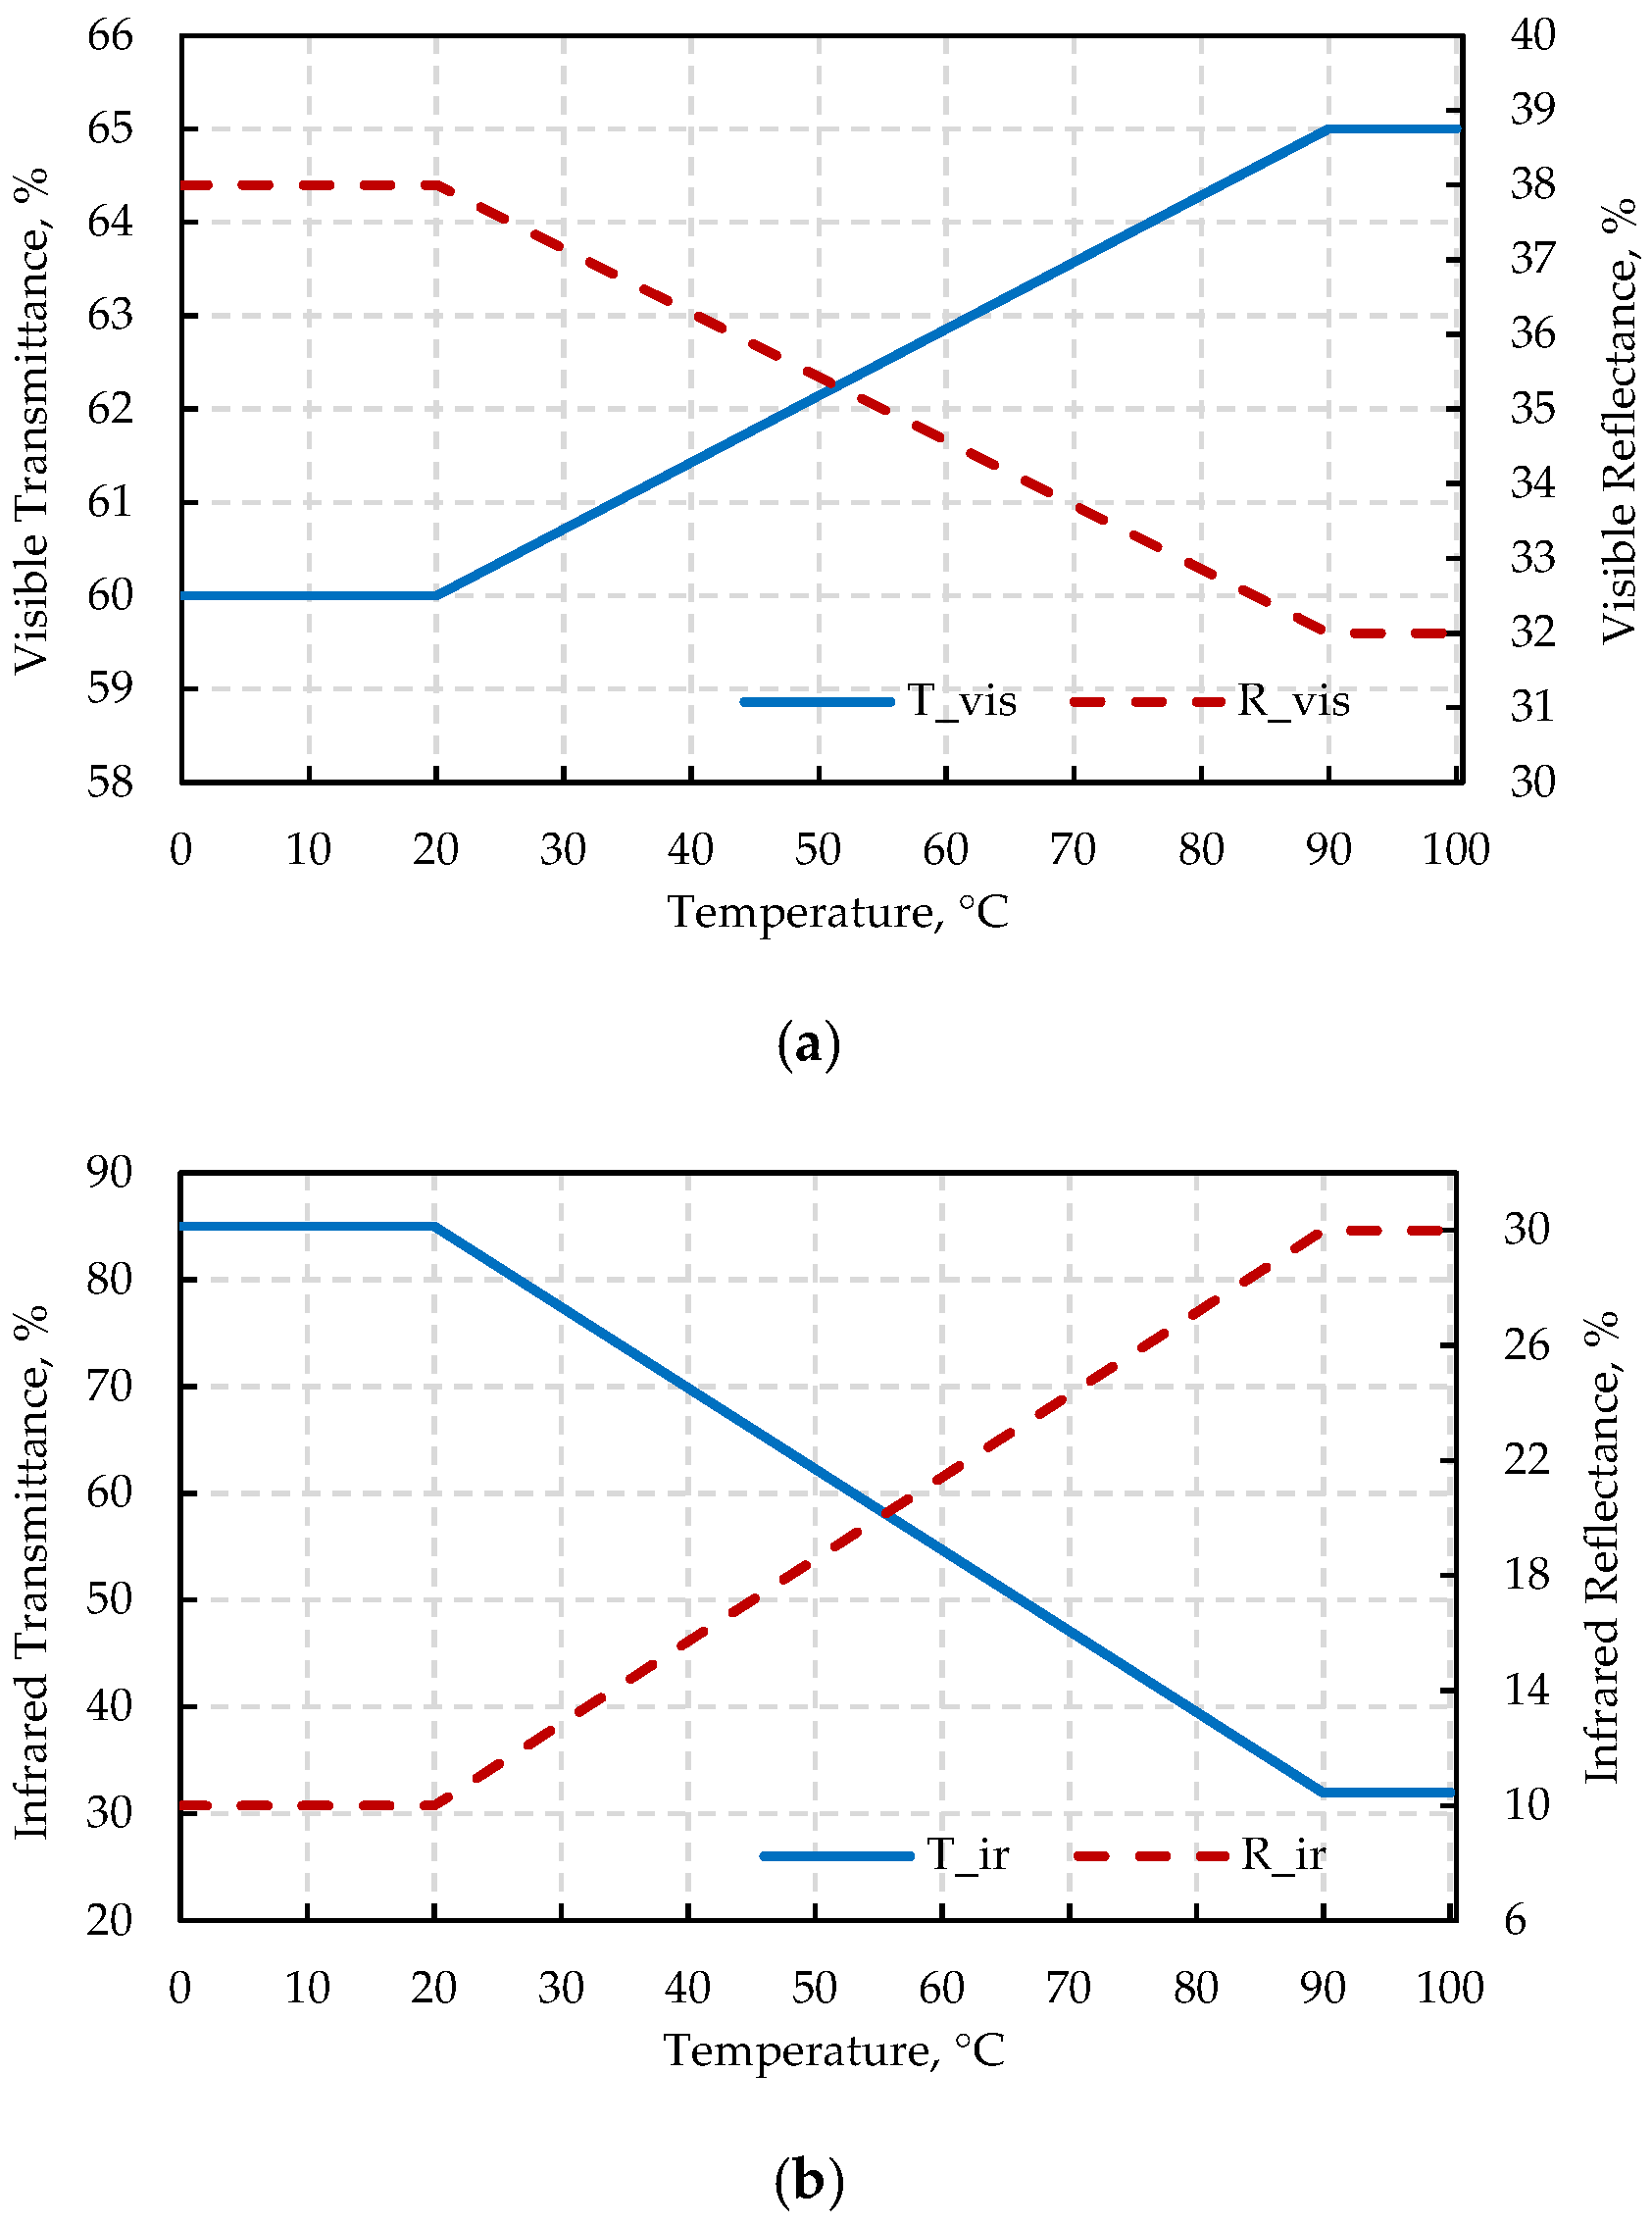
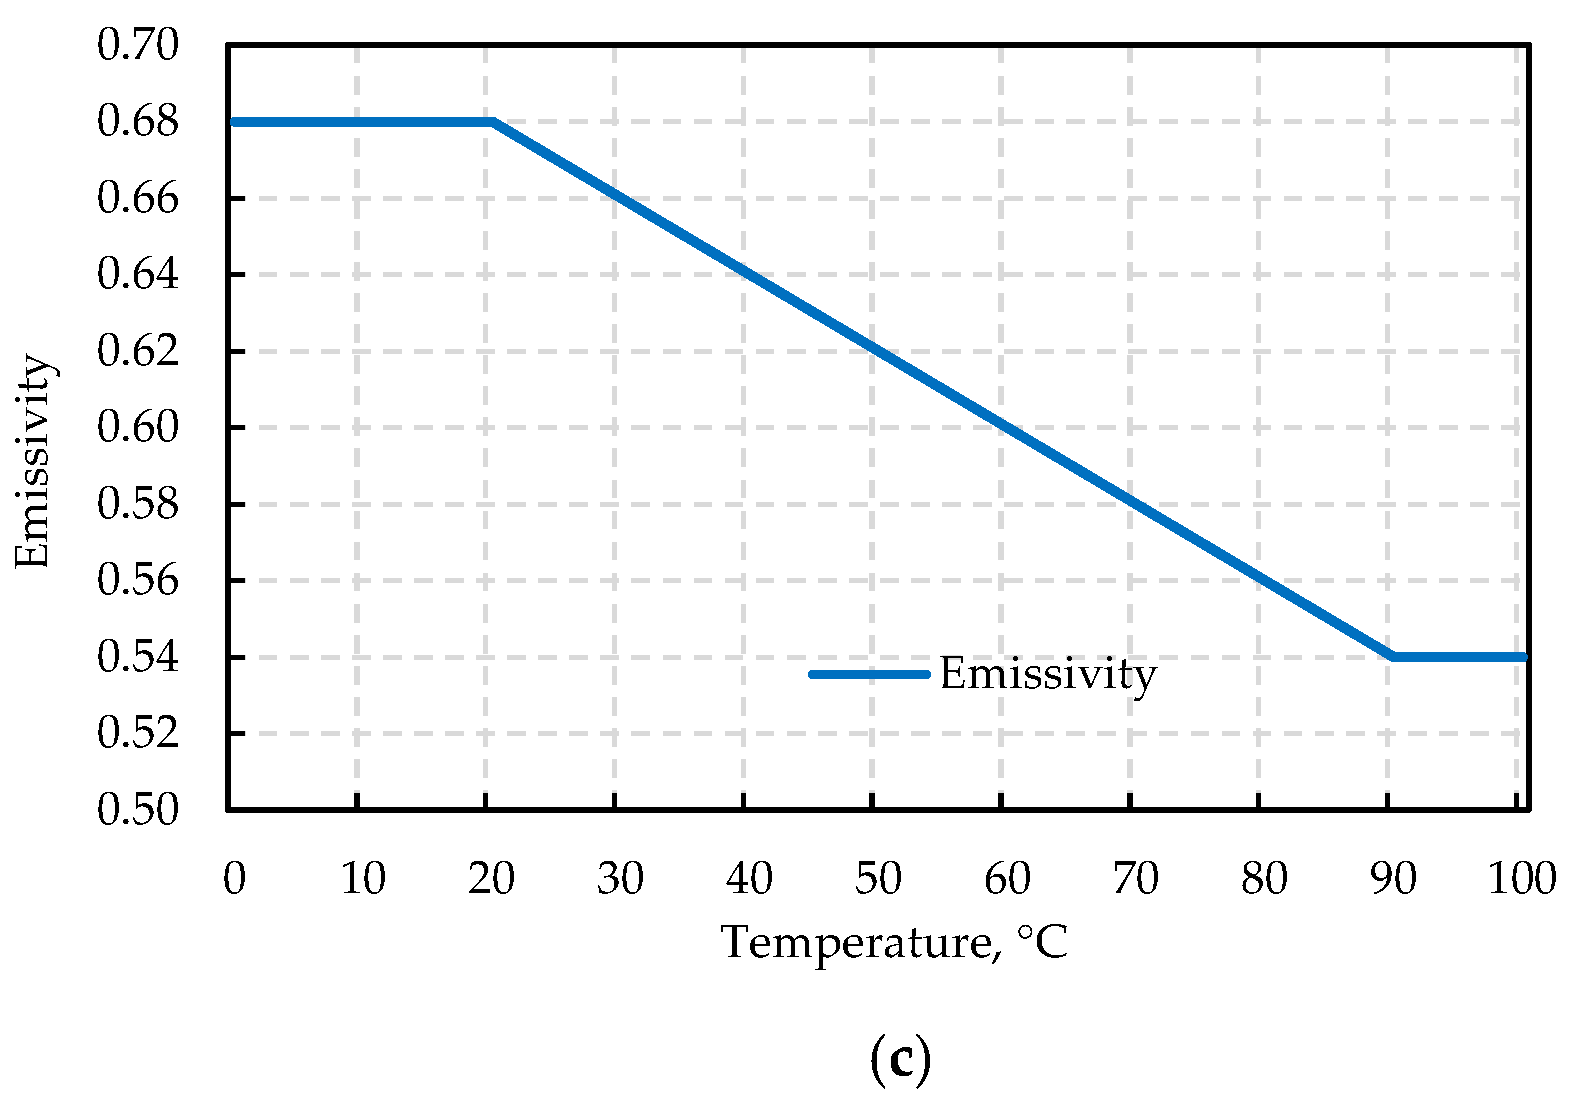
For the purposes of the hotel project, properties of double-layer VO2 glazing covered by aluminum-doped zinc oxide (ZnO:Al) described by Kang et al. [17] were used for modeling of thermochromic windows. Kang et al. [17] and Kamalisarvestani et al. [14] reported properties of this material at 20 °C and 90 °C, therefore, referring to Giovannini et al. [18], it was assumed that optical and thermal properties vary linearly between these two temperatures (Figure 7).
Figure 8 shows changes in energy consumed by cooling, heating, and fan of the original building and energy consumption before and after installation of thermochromic windows. As can be seen from this figure, heating energy demand decreased by 160 GJ (11.9%), and cooling energy demand increased by 33 GJ (22.4%) due to the installation of thermochromic windows. The fan energy changes proportionally to the total cooling and heating energy consumption, therefore its share in total energy consumed by the HVAC system remains practically unchanged.
3.5. PCM with Temperature-Controlled Natural Ventilation
The energy model of the hotel building and heat balance algorithms were configured following recommendations in the literature described in the introduction section [19,20]. A homogenous PCM layer with a 0.020 m thickness was installed into the exterior wall between the insulation layer and gypsum board (refer to Table 5). Density (ρ), conductivity (k), latent heat (Hf), and specific heat (Cp) of organic PCM A28 manufactured by PlusICE® [29] will be taken as a basis for thermophysical properties:
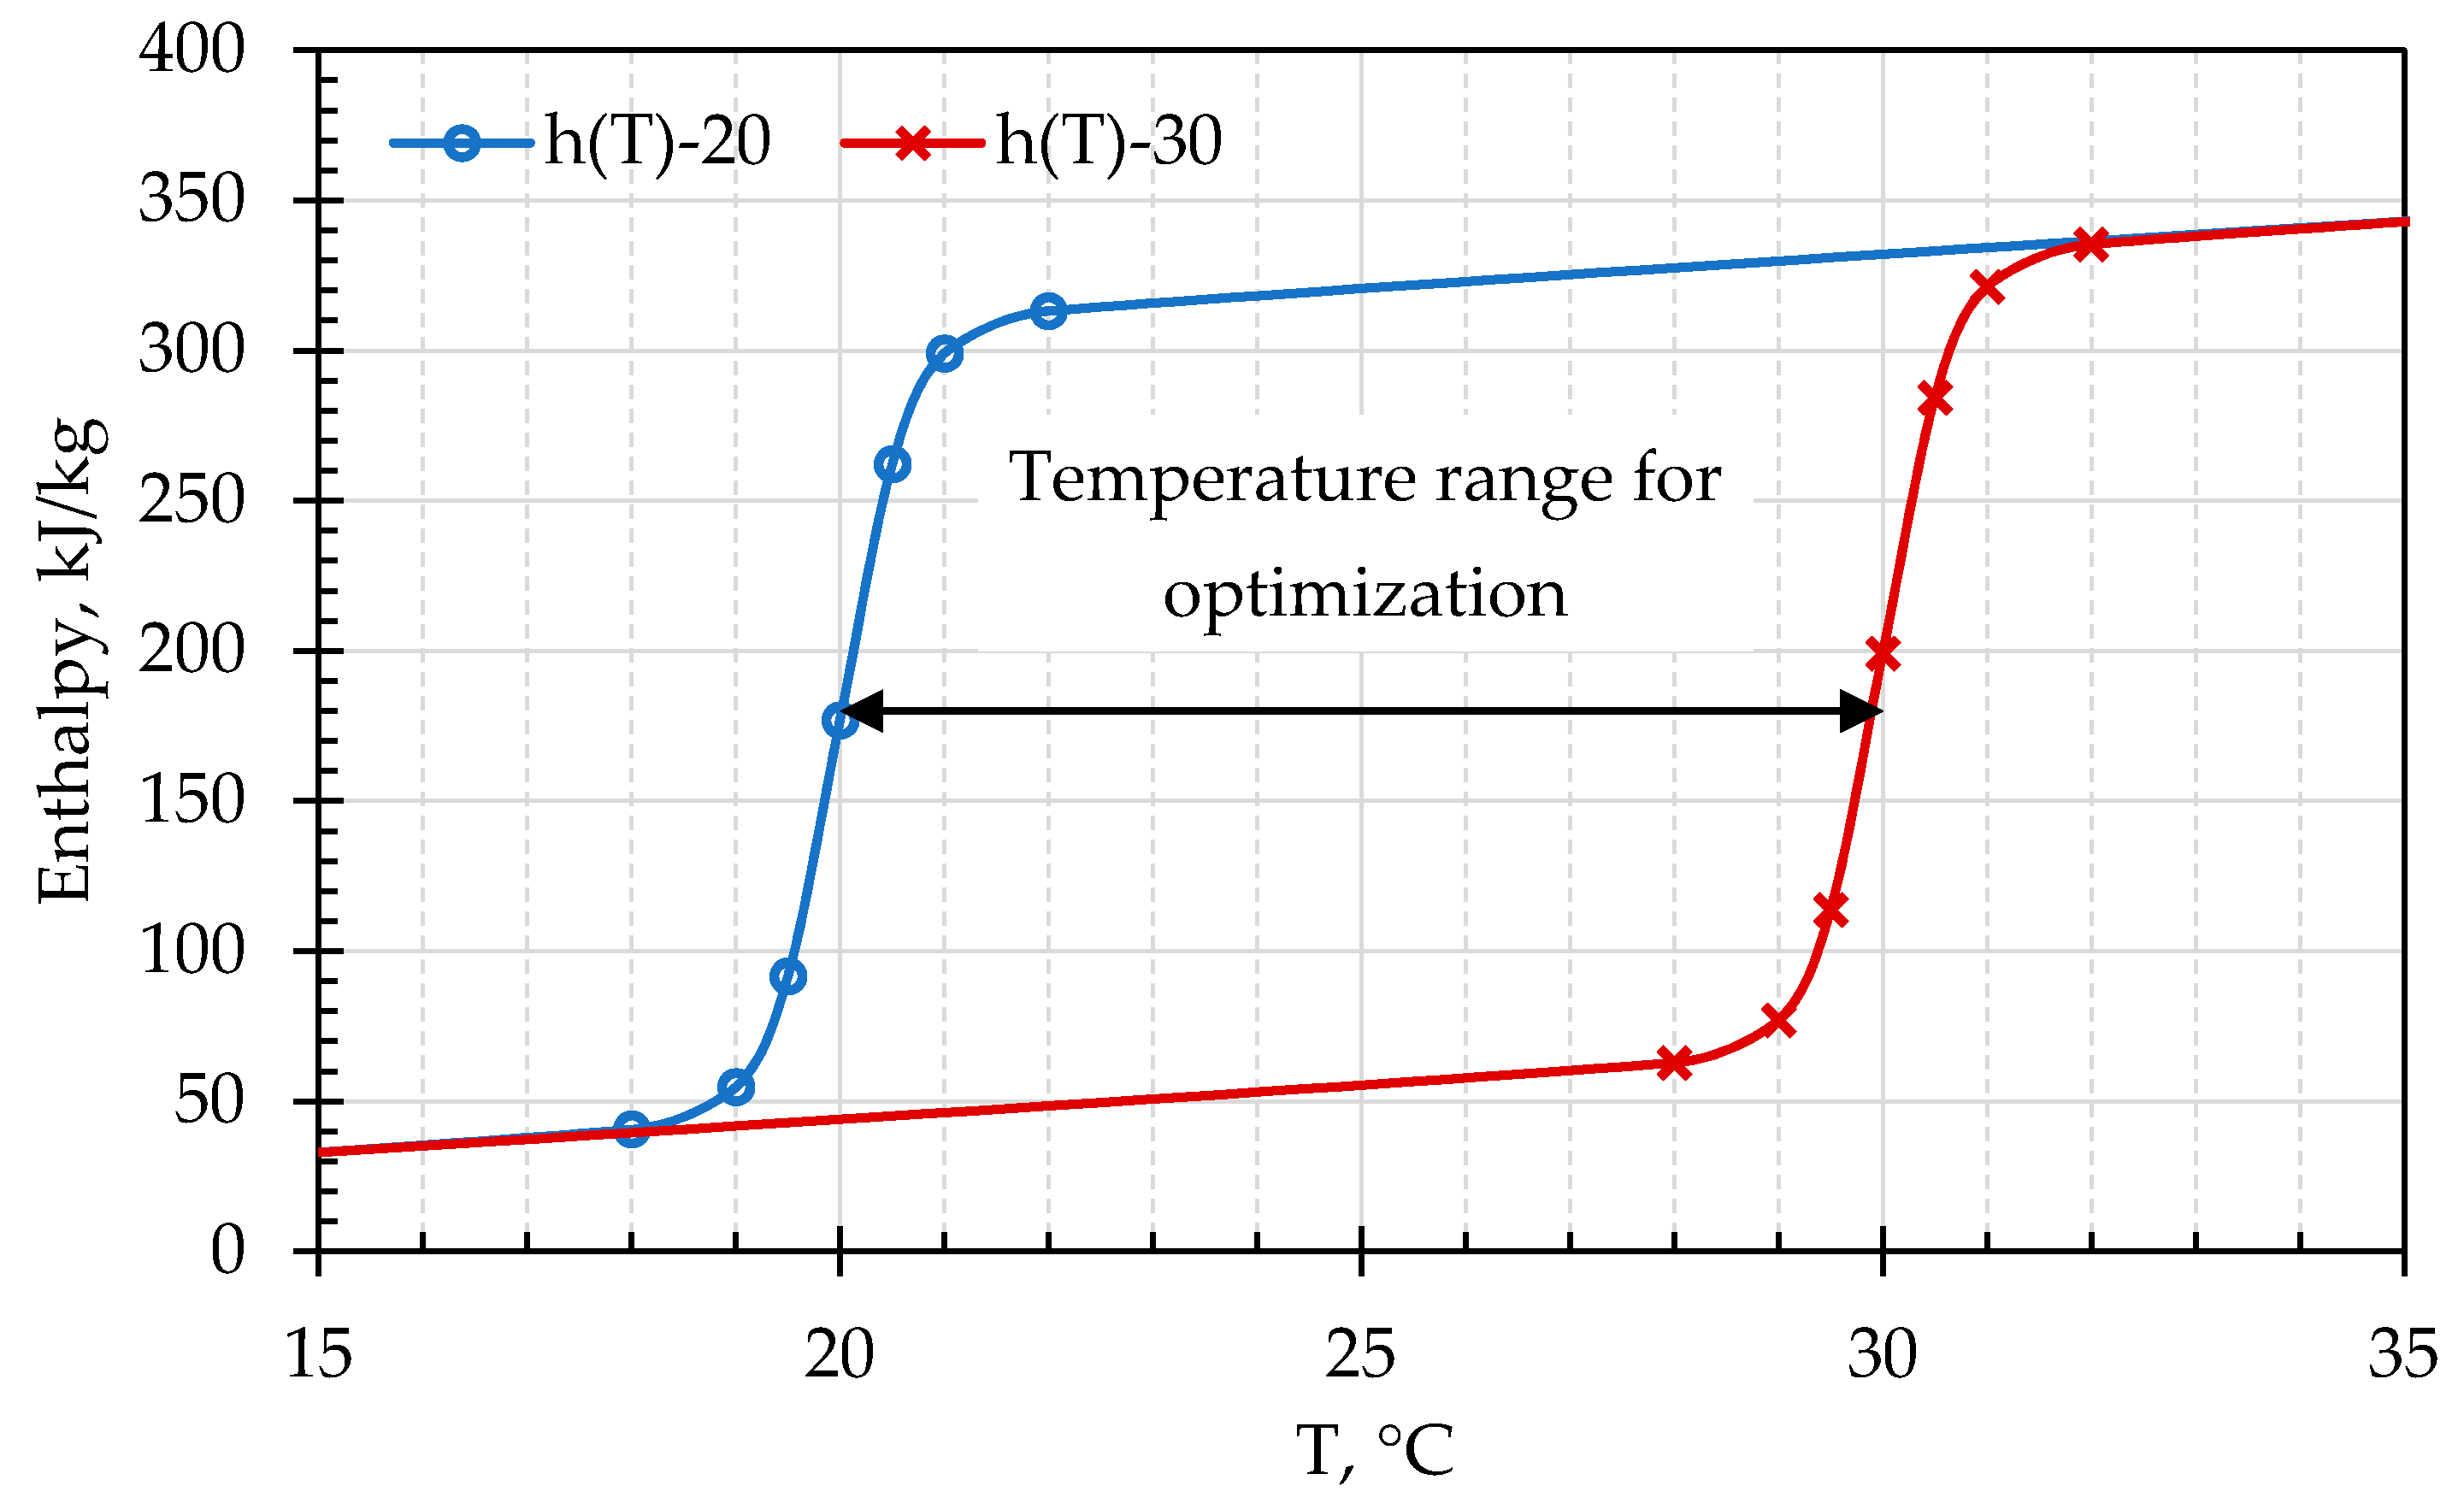
To find the optimum PCM, melting temperature (Tm) will be varied from 20 °C to 30 °C and enthalpy curves will be generated using Feustel’s model [30]:
where T is the temperature (°C), β is the inclination of enthalpy curve (–), τ is the width of the phase transition zone (°C). Figure 9 shows enthalpy curves of PCMs for the entire search domain used in optimization, which were generated using Feustel’s model:
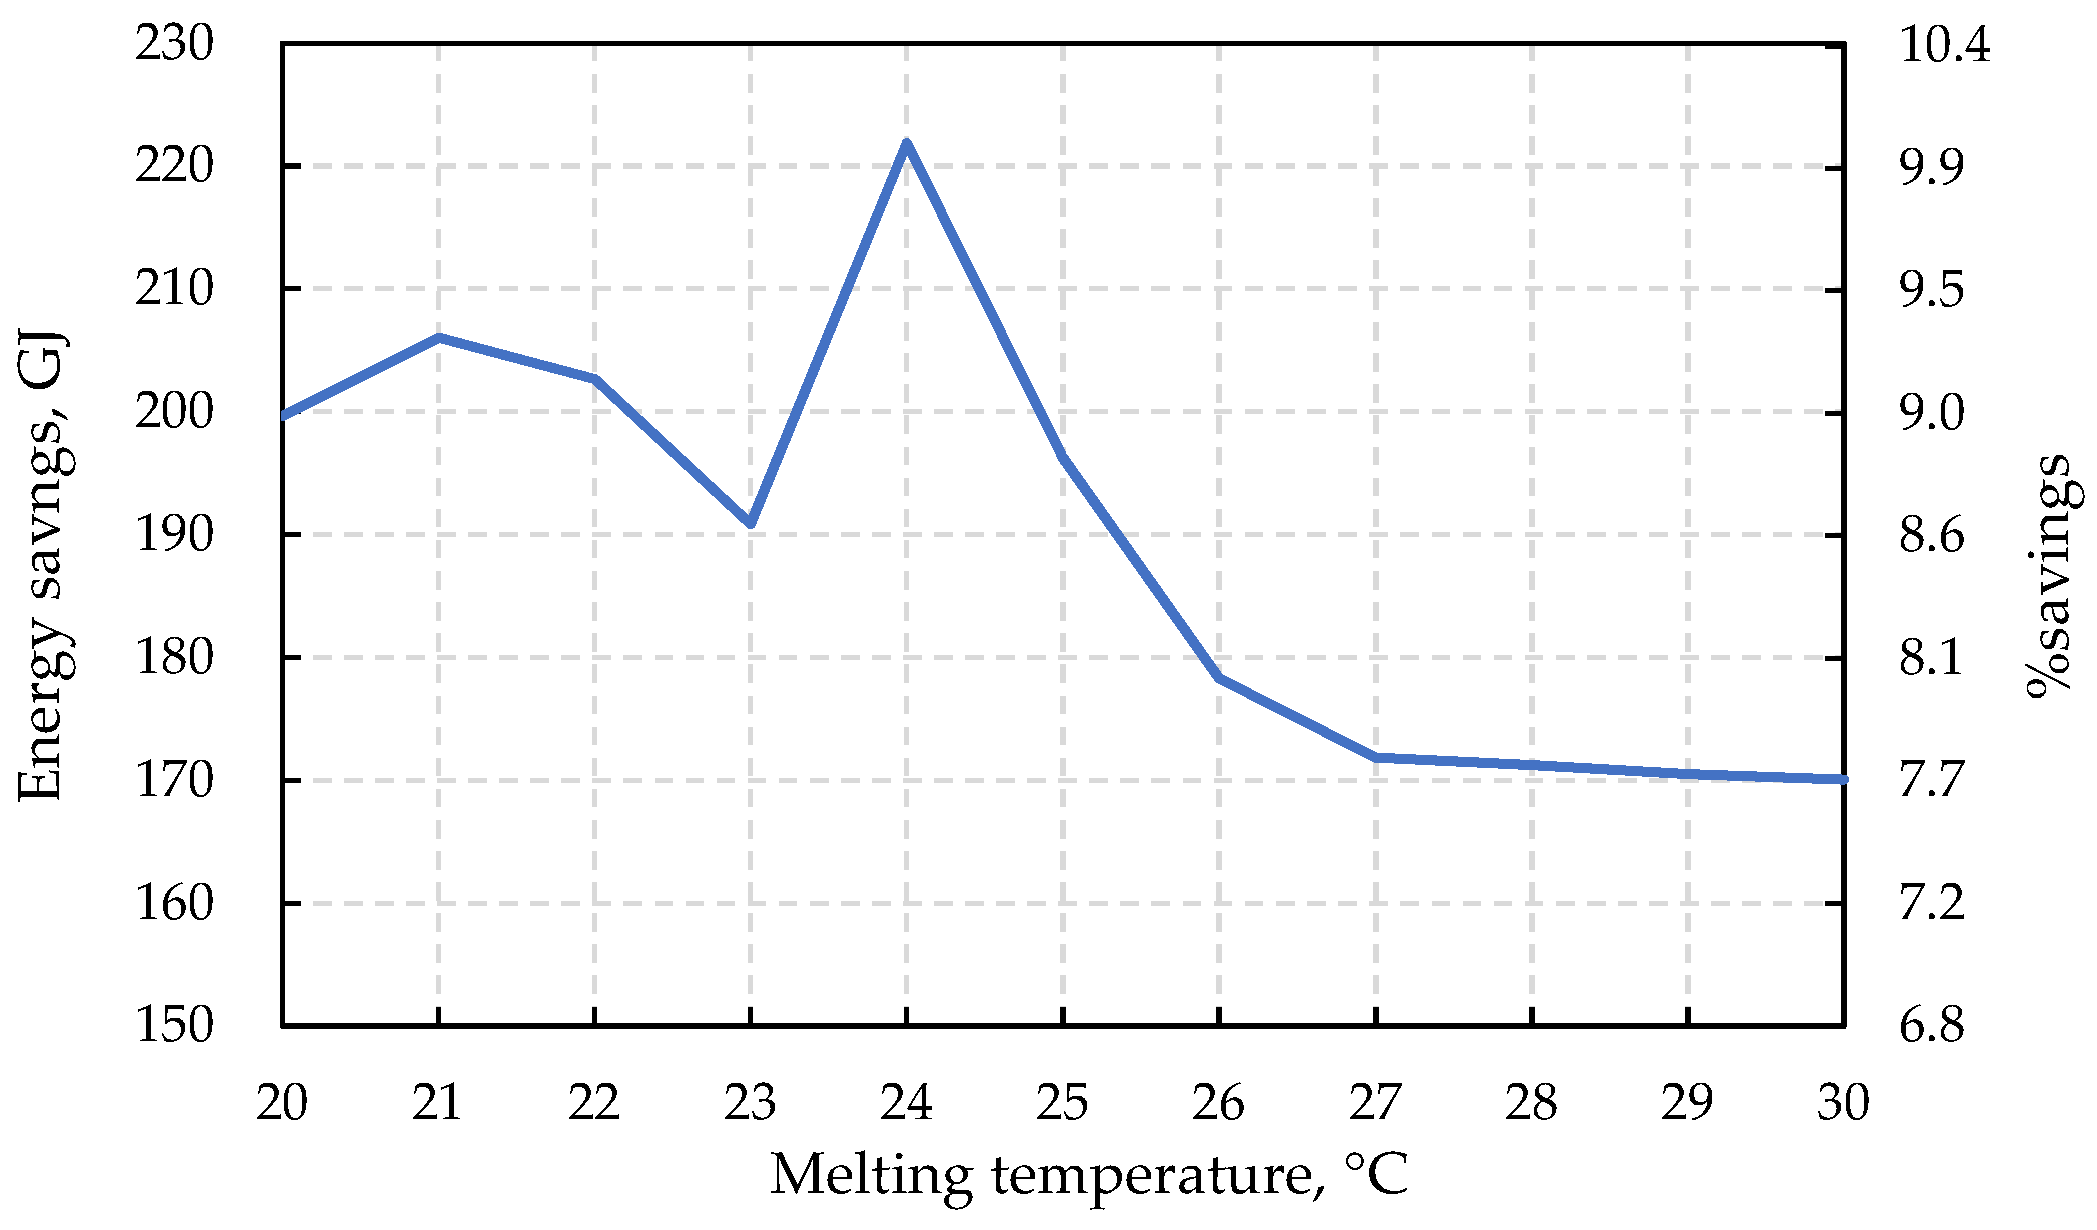
For the building energy analysis of the hotel, the temperature-controlled natural ventilation described by Prabhakar et al. [21] and Jacobson and Jadhav [31] was adopted with some minor modifications. To model this type of natural ventilation, the airflow network model (AFN) in EnergyPlus was used. In this model, algorithms can take into account wind, buoyancy, and pressure differences created by natural and forced movement of air for calculations of airflow [32]. In case of temperature-controlled natural ventilation, windows were opened by 50% at any time during the day and nighttime, if (1) outdoor temperature will be above HVAC heating setpoints and (2) temperature difference between indoor and outdoor temperatures were more than 1.5 °C (originally, in the above two papers, 3 °C temperature difference was used). Airflow network control was set to multizone without distribution and wind pressure coefficients were calculated by surface averages. Figure 10 below demonstrates the results of simulations:
As can be seen in this graph, the highest savings are achieved by PCM with a melting temperature of 24 °C, which yields 222 GJ (10.03%) of energy consumption reductions.
3.6. Photovoltaic Panels
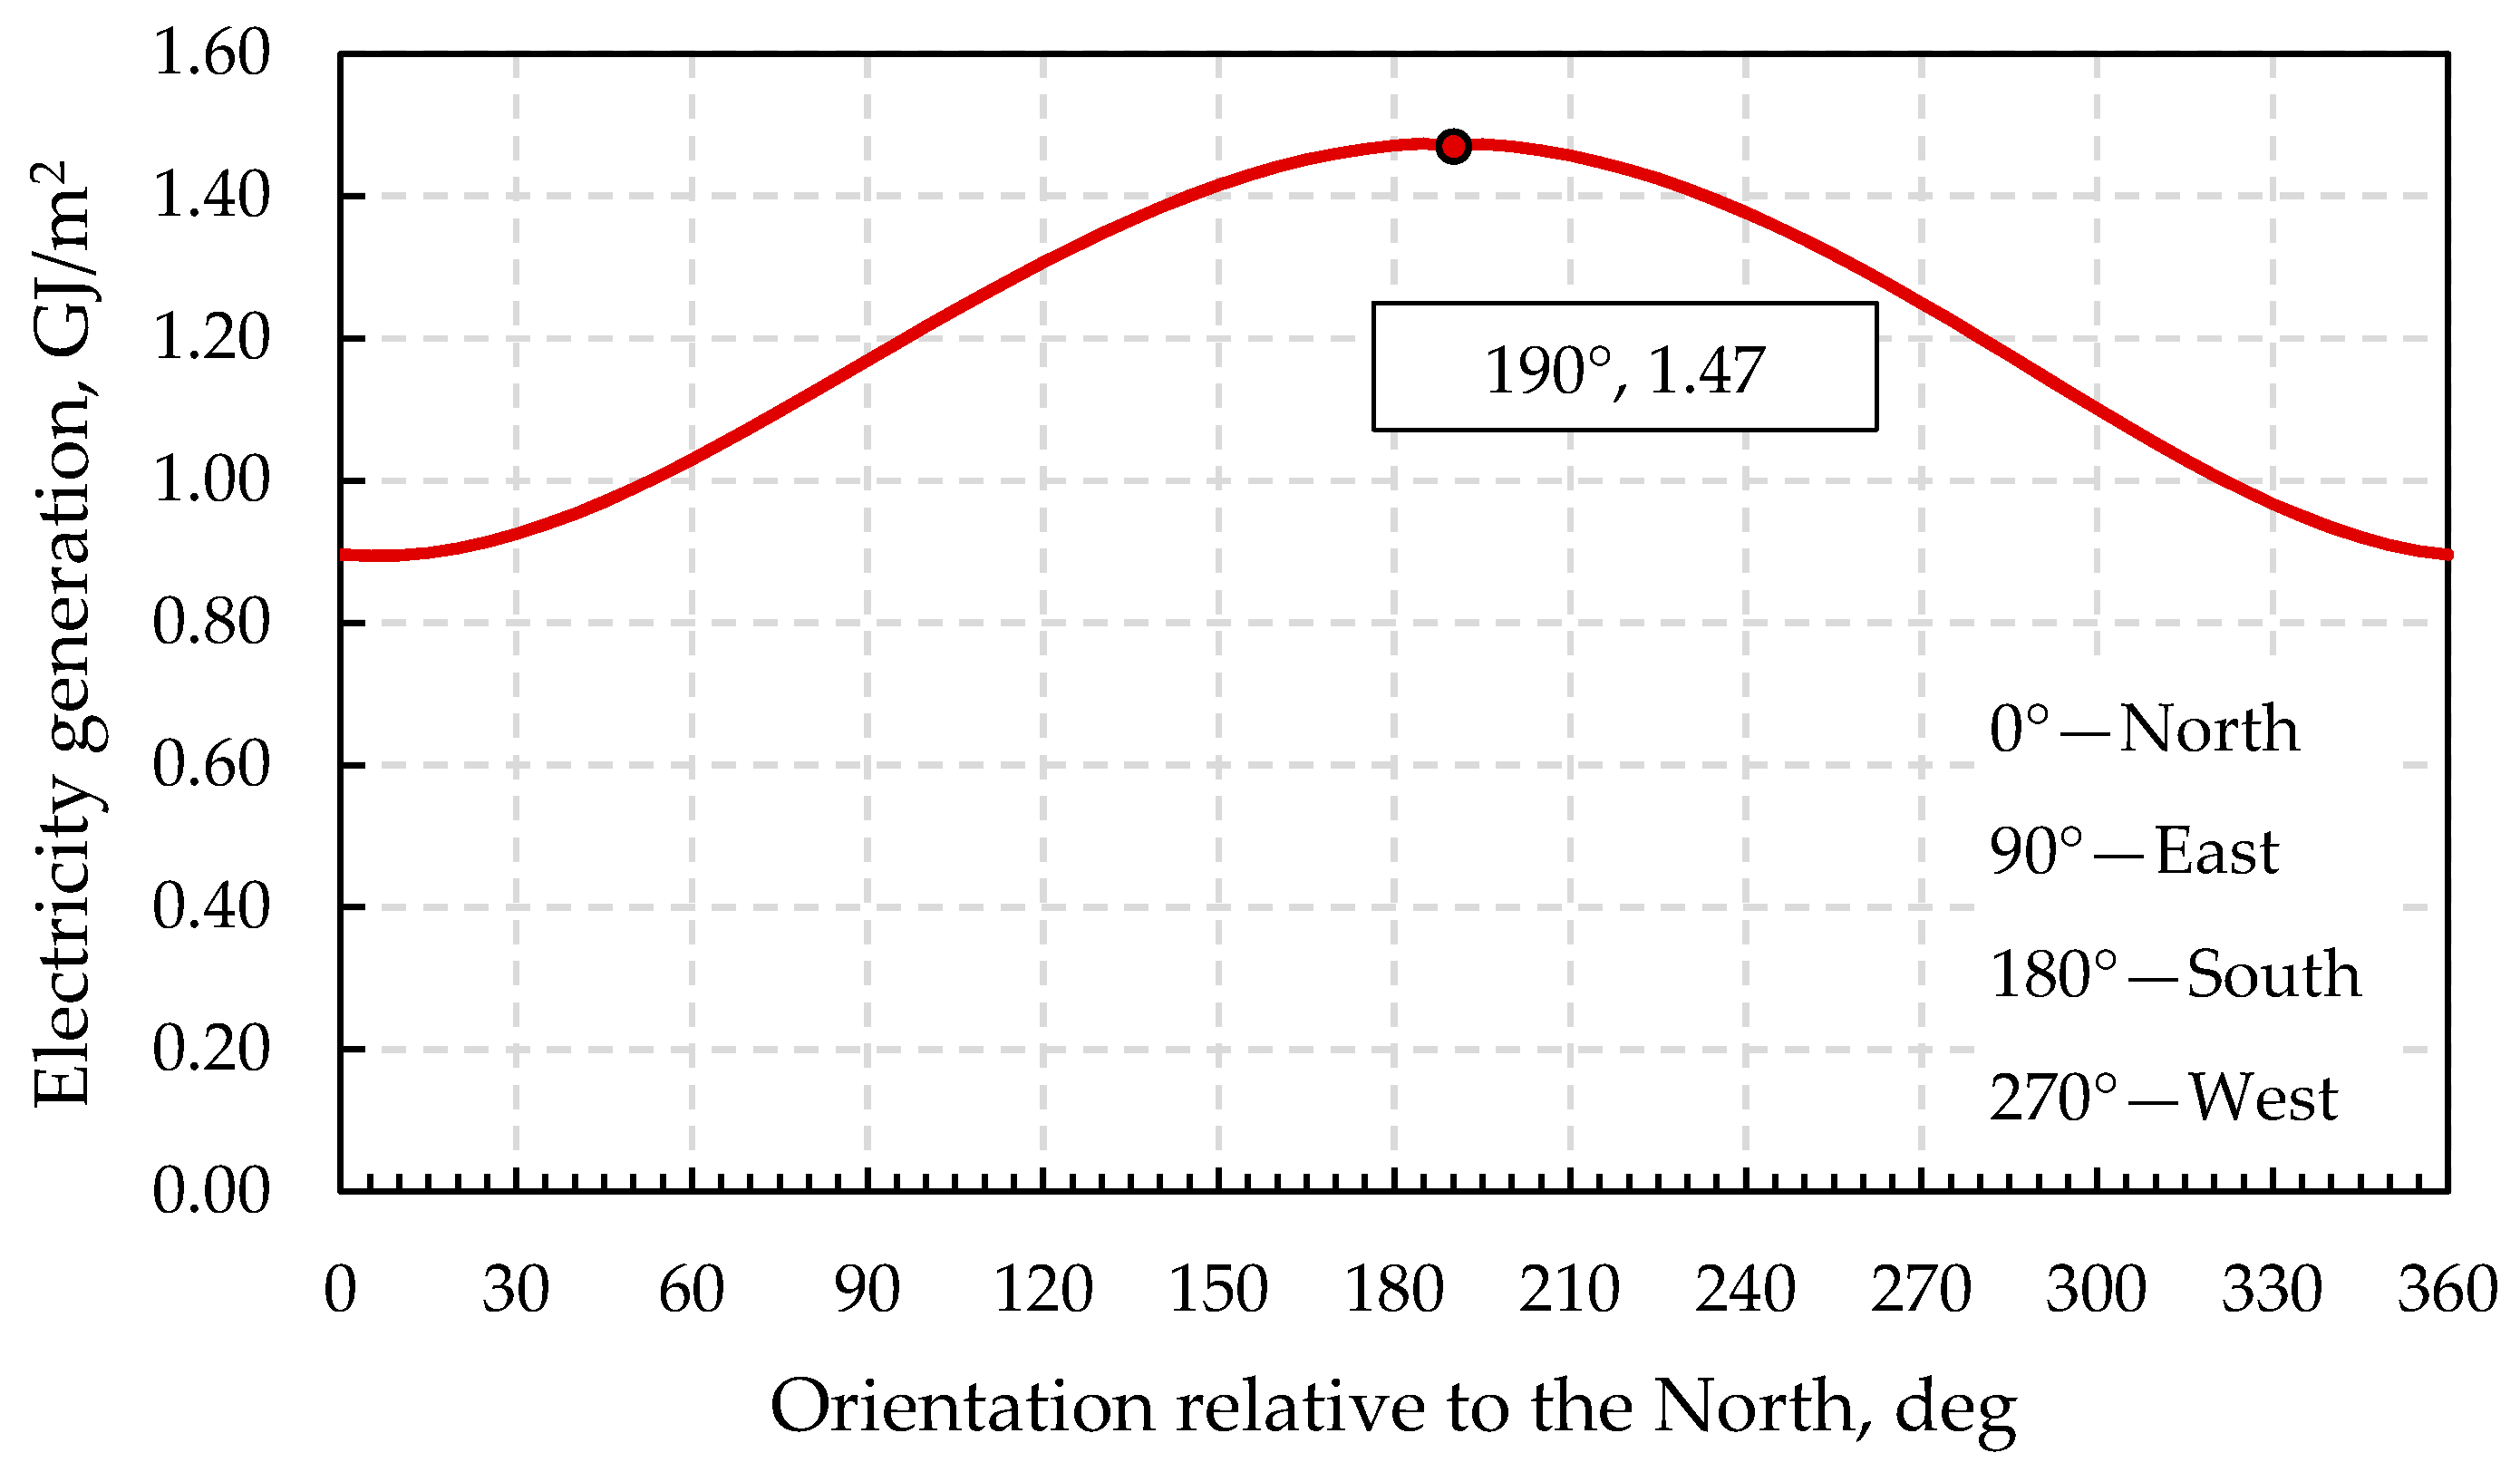
Several photovoltaic (PV) panels shall be installed on the rooftop of two kitchens and bathrooms on the 24th floor. According to Jacobson and Jadhav [31], in Bakersfield (Kern County, CA, USA), a city located 112 km from Los Angeles, the optimal tilt angle of solar panels is 29°. Using this tilt angle and taking one solar panel with the unit area, the effect of panels’ orientation relative to the North was checked. The results of these simulations are presented in Figure 11:
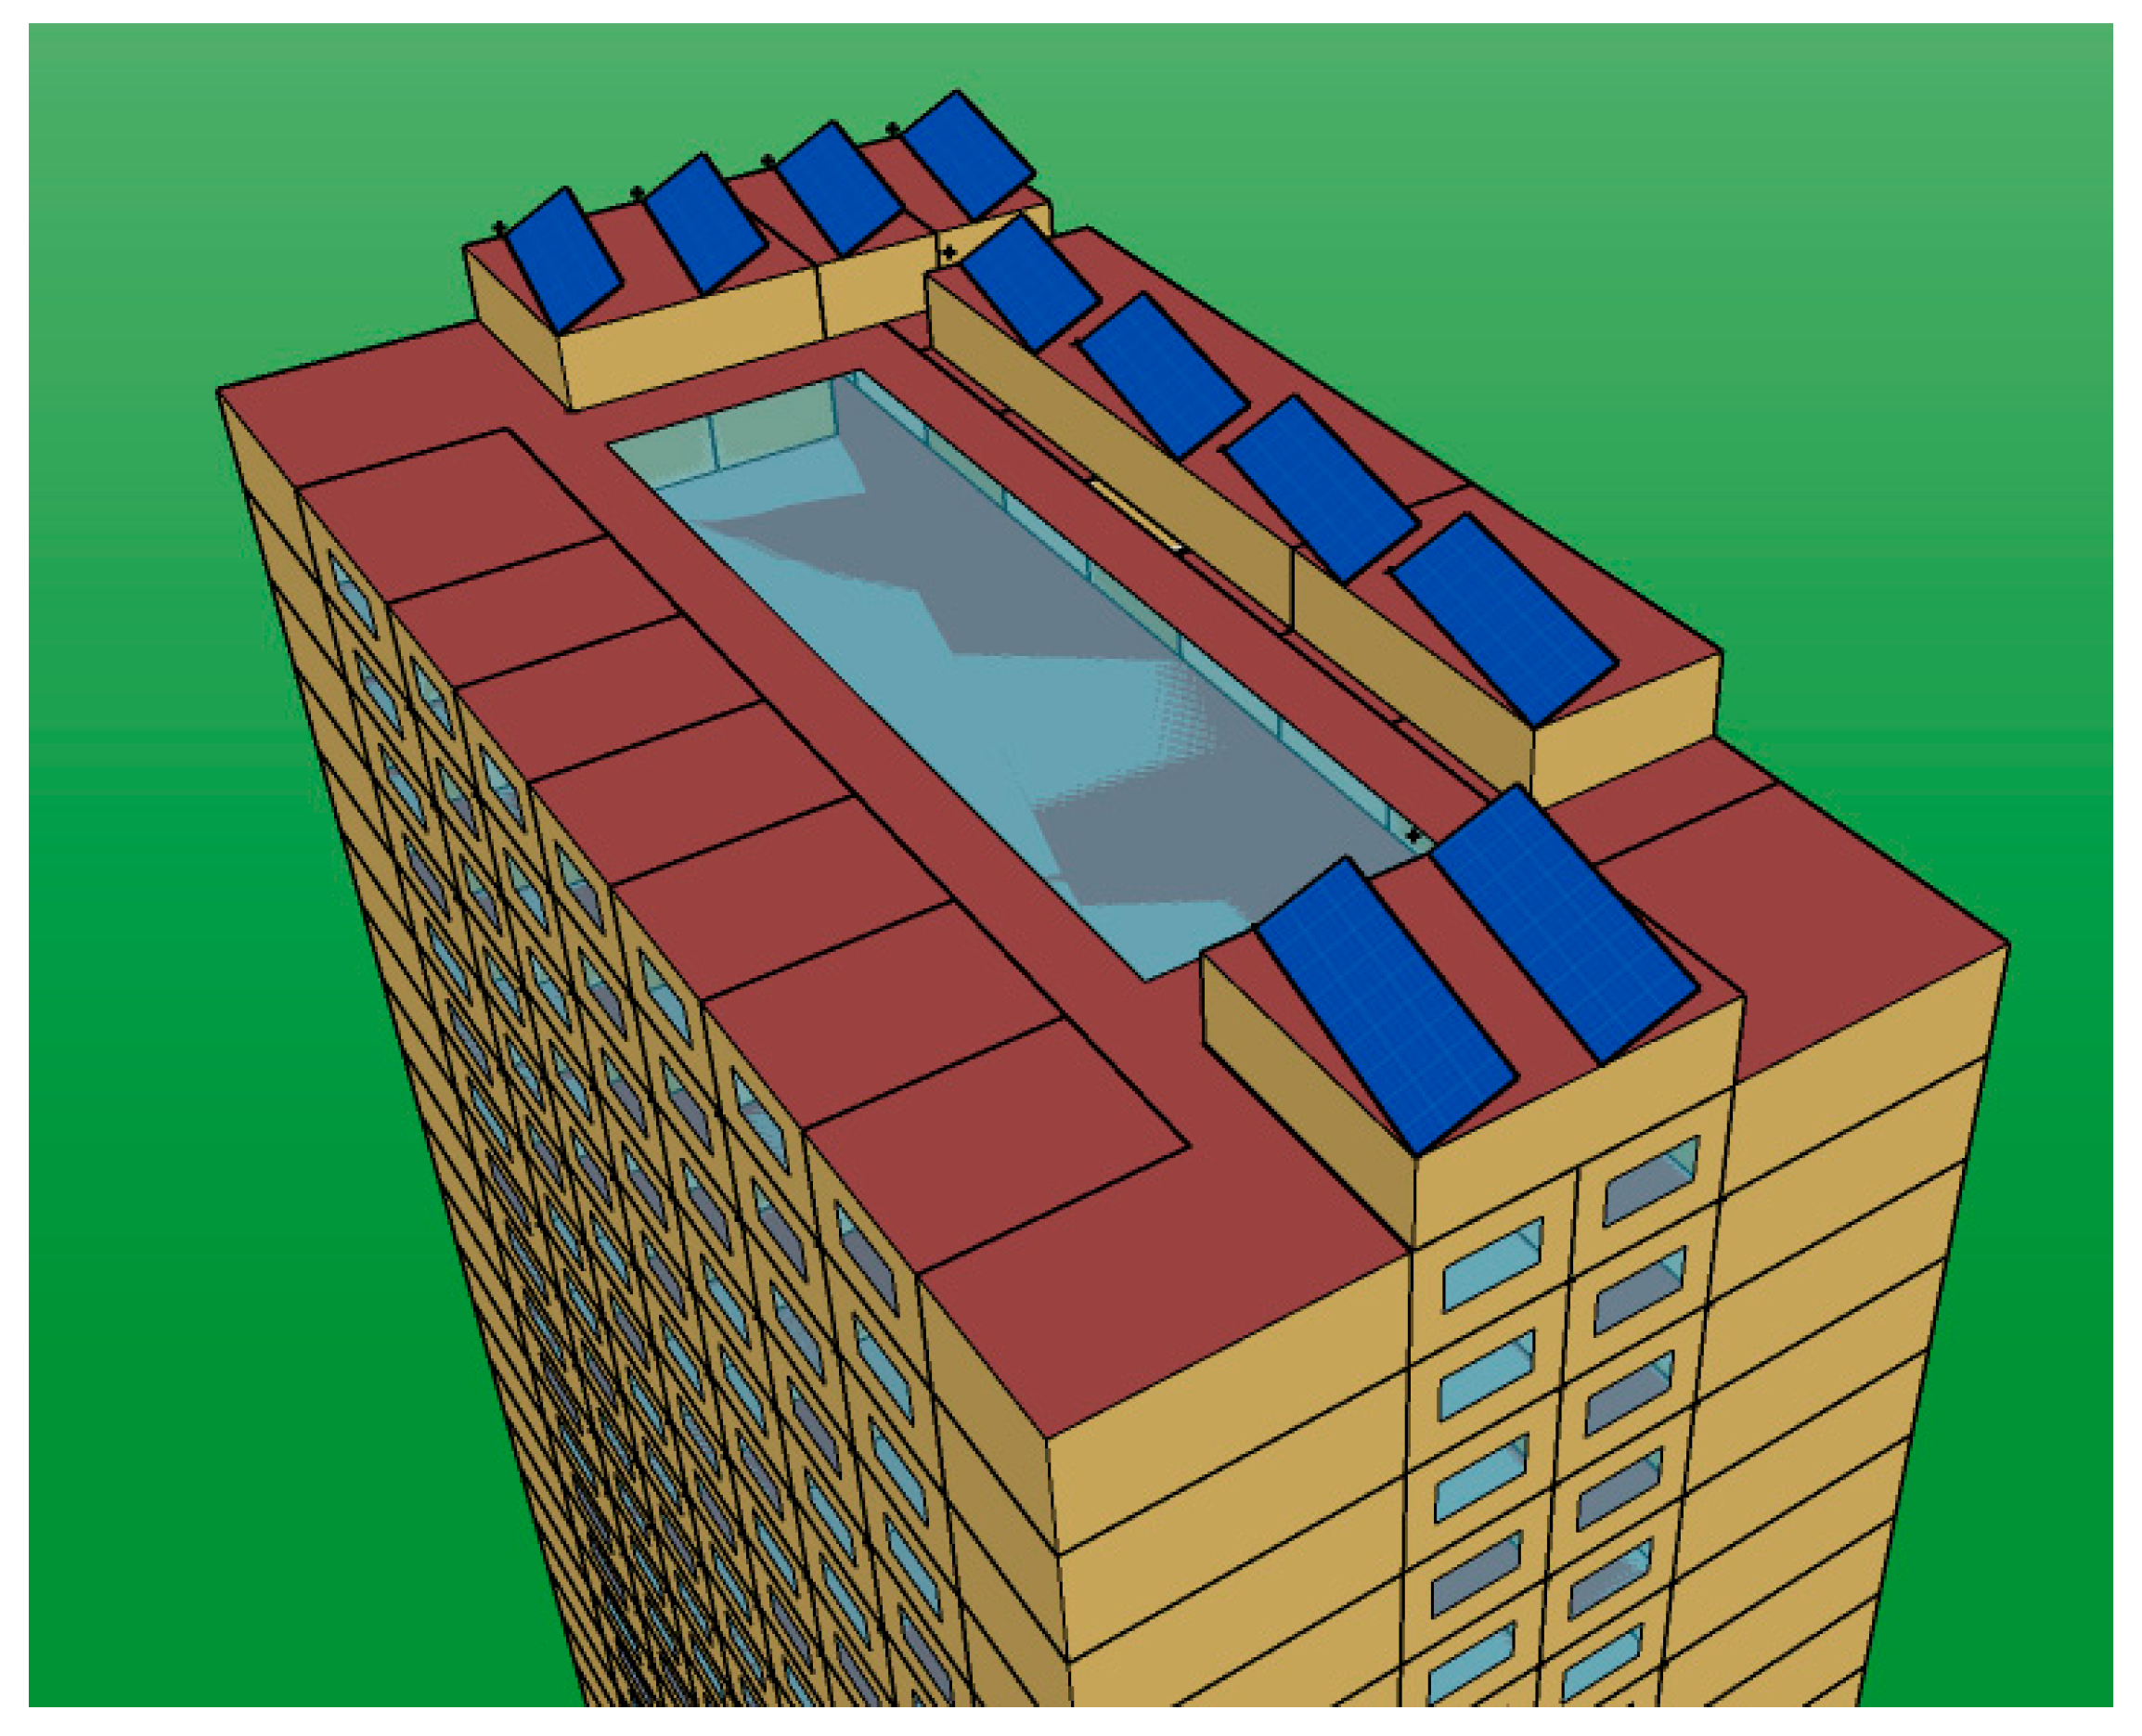
As can be seen from this figure, the energy generation potential of photovoltaic panels is maximum if they are oriented at 190° relative to the north direction, i.e., when the panel is facing towards the southern direction. Therefore, a total of ten PV panels were fit onto the rooftop with dimensions and interspacing as shown in Figure 12 and Figure 13 (the total area of all solar panels is 273.0 m2). Their annual electrical energy generation capacity was estimated via energy simulation to be 397.86 GJ.
4. Cost-Benefit Analysis
To summarize the results of previous sections, due to the installation of thermochromic windows and PCMs, energy savings of 204 GJ and 222 GJ were obtained. Additionally, 398 GJ of electricity is to be generated by solar panels installed on the rooftop. Collectively, these three technologies are estimated to reduce the total energy consumption from 2417 GJ to 1593 GJ (i.e., by 824 GJ or 34%). In this section, a dynamic payback period, net present value (NPV), and a rough estimate of return on investments (ROI) due to the installation of these three sustainable energy technologies are provided. Optimization of building envelope properties, window-to-wall ratio, and building orientation were not considered during economic analysis since all these energy analyses are being considered at the preliminary stages of building's design, and as such investments required for their implementation are virtually nonexistent. However, it is still important to consider these parameters to improve the energy efficiency of the design and to reduce the operational costs required for heating and cooling the building during its lifetime.
Unit prices of thermochromic windows, PCMs, and solar panels are obtained from manufacturers. They are shown in Table 6 together with material costs, their design life, and energy-saving potential over their lifetime. For simplicity, transportation and installation costs were ignored at this stage.
According to the U.S. Bureau of Labor Statistics [35], the average electricity price in Los Angeles from January to September in 2020 was 54.44 USD/GJ. Assuming that the electricity prices in Los Angeles will follow the national average over the last 20 years, which, according to statista.com [36], is 2.30% per year, and taking MARR to be 6%, dynamic payback period, NPV, ROI, and revenue per available room (RevPAR) can be calculated for each of these three technologies, Table 7:
Here, dynamic payback period, NPV, ROI, and RevPAR were calculated using the following formulas:
As the above results show, to finance TC windows and PCMs, 4.9 USD and 254.9 USD have to be allocated annually from each room.
As can be seen from Table 7, TC windows and solar panels have relatively short payback periods and high returns on investments, whereas PCM seems to be not economically viable at all. Overall, among the considered technologies, only PV panels have positive NPV, meaning that only this technology yields profits by the end of its lifetime. Nevertheless, it should be taken into account that these calculations did not take into account various other overhead costs and the fact that these technologies may significantly deteriorate over their lifetime and thus have an annual energy saving potential that is cardinally different from what was estimated in this section. In addition, 25 years is a long enough period for significant climate change events to occur, therefore energy performance analysis of PCMs and solar panels under future weather conditions is advised for higher accuracy.
5. Conclusions
The study aimed to identify ways of improvement of the building energy efficiency of a newly designed hotel building developed in accordance with ASHRAE Standard 90.1. To minimize heating and cooling energy demand of the model building, building envelope properties (thickness and thermal conductivity of insulation layers, U-factor of windows, thermal resistance of air gaps, and infiltration rate), window-to-wall ratio, and building orientation were optimized. Moreover, the energy-saving potential of thermochromic windows, phase change materials, and photovoltaic panels were estimated along with the economic feasibility of their installation. Based on the performed parametric analysis, the study found that while some of the assumptions made in the design model were already optimal, other design considerations could be improved. Specifically, the parametric analysis indicated that all 6 properties were optimal in terms of energy efficiency which indicates that the ASHRAE Standard 90.1-2019 is quite strict and allows achieving good results in terms of the building envelope. The parametric analysis also indicated that the energy consumption is the most sensitive to the U-factor of windows and thermal resistance (R-value) of building envelope components. Therefore, the optimal set of values for designing hotel buildings for the climate conditions of the considered locality was provided. In addition, the energy performance analysis also showed that the window-to-wall ratio and orientation of the hotel building had an impact on the energy use levels. It was found that the higher the WWR is, the higher the energy demand of the building was. Keeping WWR close to the original value, i.e., as 15% was also the most optimal solution. In terms of orientation, the energy demand of the hotel was found to be the lowest when its longer side was oriented perpendicular to the North direction.
The integration of thermochromic windows, phase change materials, and photovoltaic panels allowed to increase the energy efficiency of the building. After installing the thermographic windows heating energy demand decreased by 160 GJ (11.9%) and cooling energy demand increased by 33 GJ (22.4%) due to the installation of thermochromic windows. The energy-saving is significant. It was also the case with the PCMs as the highest savings were achieved with a melting temperature of 24 °C, which yielded 222 GJ (10.03%) of energy consumption reductions. Finally, the solar panels were able to generate 398 GJ of electricity. Cumulatively, these three technologies were able to reduce the total energy use from 2417 GJ to 1593 GJ (i.e., by 824 GJ or 34%). These findings indicate that the initial design considerations were optimal after minor adjustments but adding extra sustainable energy solutions brought notable energy use reductions. Since design parameters stayed close to the original values, the cost-benefit analysis of these three technologies only was carried out. It was found that windows and solar panels have relatively short payback periods and high returns on investments, whereas PCM was found to be economically nonviable in the given climate zone. Therefore, the designers and relevant stakeholders should weigh the benefits and costs of the sustainable measures and adopt only feasible ones.
These analyses may be extended further to include HVAC with model predictive control and analyses of the future energy demand of the building.
Author Contributions
Conceptualization, S.K.; methodology, S.K.; software, S.K.; formal analysis, S.K. and S.T.; resources, S.K., S.T. and S.D.; data curation, S.K.; writing—original draft preparation, S.K.; writing—review and editing, S.K., S.T. and S.D.; supervision, S.K., S.T. and S.D. All authors have read and agreed to the published version of the manuscript.
Funding
Research received no external funding.
Institutional Review Board Statement
Not applicable.
Informed Consent Statement
Not applicable.
Data Availability Statement
The data presented in this study are available on request from the corresponding author.
Conflicts of Interest
The authors declare no conflict of interest.
Abbreviation
| AFN | Airflow network model |
| ASHRAE | American Society of Heating, Refrigerating and Air-Conditioning Engineers |
| CondFD | Conduction Finite Difference |
| EC | Energy consumption |
| ES | Energy savings |
| HVAC | Heating, Ventilation, and Air Conditioning |
| IECC | International Energy Conservation Code |
| MARR | Minimum Acceptable Rate of Return |
| NPV | Net present value |
| NZEB | Net-zero energy buildings |
| PCM | Phase change materials |
| PTAC | Packaged Terminal Air Conditioning |
| RevPAR | Revenue Per Available Room |
| ROI | Return on investments |
| TC | Thermochromic (windows) |
| WWR | Window-to-wall ratio |
References
- European Environment Agency. IPCC Fifth Assessment Report: Climate Change 2014 (AR5); European Environment Agency: København, Denmark, 2014. [Google Scholar]
- Tokbolat, S.; Karaca, F.; Durdyev, S.; Calay, R.K. Construction professionals’ perspectives on drivers and barriers of sustainable construction. Environ. Dev. Sustain. 2019, 22, 4361–4378. [Google Scholar] [CrossRef] [Green Version]
- Durdyev, S.; Ismail, S.; Ihtiyar, A.; Abu Bakar, N.F.S.; Darko, A. A partial least squares structural equation modeling (PLS-SEM) of barriers to sustainable construction in Malaysia. J. Clean. Prod. 2018, 204, 564–572. [Google Scholar] [CrossRef]
- Durdyev, S.; Zavadskas, E.K.; Thurnell, D.; Banaitis, A.; Ihtiyar, A. Sustainable Construction Industry in Cambodia: Awareness, Drivers and Barriers. Sustainability 2018, 10, 392. [Google Scholar] [CrossRef] [Green Version]
- Harkouss, F.; Fardoun, F.; Biwole, P.H. Optimal design of renewable energy solution sets for net zero energy buildings. Energy 2019, 179, 1155–1175. [Google Scholar] [CrossRef]
- Rodriguez-Ubinas, E.; Montero, C.; Porteros, M.; Vega, S.; Navarro, I.; Castillo-Cagigal, M.; Matallanas, E.; Gutiérrez, A. Passive design strategies and performance of Net Energy Plus Houses. Energy Build. 2014, 83, 10–22. [Google Scholar] [CrossRef] [Green Version]
- Saikia, P.; Pancholi, M.; Sood, D.; Rakshit, D. Dynamic optimization of multi-retrofit building envelope for enhanced energy performance with a case study in hot Indian climate. Energy 2020, 197, 117263. [Google Scholar] [CrossRef]
- Kheiri, F. A review on optimization methods applied in energy-efficient building geometry and envelope design. Renew. Sustain. Energy Rev. 2018, 92, 897–920. [Google Scholar] [CrossRef]
- Echenagucia, T.M.; Capozzoli, A.; Cascone, Y.; Sassone, M. The early design stage of a building envelope: Multi-objective search through heating, cooling and lighting energy performance analysis. Appl. Energy 2015, 154, 577–591. [Google Scholar] [CrossRef]
- Tuhus-Dubrow, D.; Krarti, M. Genetic-algorithm based approach to optimize building envelope design for residential buildings. Build. Environ. 2010, 45, 1574–1581. [Google Scholar] [CrossRef]
- Ascione, F.; Bianco, N.; De Masi, R.F.; Mauro, G.M.; Vanoli, G.P. Design of the Building Envelope: A Novel Multi-Objective Approach for the Optimization of Energy Performance and Thermal Comfort. Sustainability 2015, 7, 10809–10836. [Google Scholar] [CrossRef] [Green Version]
- Wang, Y.; Wei, C. Design optimization of office building envelope based on quantum genetic algorithm for energy conservation. J. Build. Eng. 2021, 35, 102048. [Google Scholar] [CrossRef]
- Carlucci, S.; Cattarin, G.; Causone, F.; Pagliano, L. Multi-objective optimization of a nearly zero-energy building based on thermal and visual discomfort minimization using a non-dominated sorting genetic algorithm (NSGA-II). Energy Build. 2015, 104, 378–394. [Google Scholar] [CrossRef] [Green Version]
- Kamalisarvestani, M.; Saidur, R.; Mekhilef, S.; Javadi, F. Performance, materials and coating technologies of thermochromic thin films on smart windows. Renew. Sustain. Energy Rev. 2013, 26, 353–364. [Google Scholar] [CrossRef]
- Baetens, R.; Jelle, B.P.; Gustavsen, A. Properties, requirements and possibilities of smart windows for dynamic daylight and solar energy control in buildings: A state-of-the-art review. Sol. Energy Mater. Sol. Cells 2010, 94, 87–105. [Google Scholar] [CrossRef] [Green Version]
- Aburas, M.; Soebarto, V.; Williamson, T.; Liang, R.; Ebendorff-Heidepriem, H.; Wu, Y. Thermochromic smart window technologies for building application: A review. Appl. Energy 2019, 255, 113522. [Google Scholar] [CrossRef]
- Kang, L.; Gao, Y.; Luo, H.; Wang, J.; Zhu, B.; Zhang, Z.; Du, J.; Kanehira, M.; Zhang, Y. Thermochromic properties and low emissivity of ZnO: Al/VO2 double-layered films with a lowered phase transition temperature. Sol. Energy Mater. Sol. Cells 2011, 95, 3189–3194. [Google Scholar] [CrossRef]
- Giovannini, L.; Favoino, F.; Pellegrino, A.; Verso, V.R.M.L.; Serra, V.; Zinzi, M. Thermochromic glazing performance: From component experimental characterisation to whole building performance evaluation. Appl. Energy 2019, 251, 113335. [Google Scholar] [CrossRef]
- Kalnæs, S.E.; Jelle, B.P. Phase change materials and products for building applications: A state-of-the-art review and future research opportunities. Energy Build. 2015, 94, 150–176. [Google Scholar] [CrossRef] [Green Version]
- Tabares-Velasco, P.C.; Christensen, C.; Bianchi, M. Verification and validation of EnergyPlus phase change material model for opaque wall assemblies. Build. Environ. 2012, 54, 186–196. [Google Scholar] [CrossRef]
- Prabhakar, M.; Saffari, M.; de Gracia, A.; Cabeza, L.F. Improving the energy efficiency of passive PCM system using controlled natural ventilation. Energy Build. 2020, 228, 110483. [Google Scholar] [CrossRef]
- Pisello, A.L.; Castaldo, V.L.; Rosso, F.; Piselli, C.; Ferrero, M.; Cotana, F. Traditional and Innovative Materials for Energy Efficiency in Buildings. Key Eng. Mater. 2016, 678, 14–34. [Google Scholar] [CrossRef]
- Burnett, J.W.; Hefner, F. Solar energy adoption: A case study of South Carolina. Electr. J. 2021, 34, 106958. [Google Scholar] [CrossRef]
- U.S. Energy Information Administration. Levelized Costs of New Generation Resources in the Annual Energy Outlook 2021; U.S. Energy Information Administration: Washington, DC, USA, 2021. [Google Scholar]
- Dibene-Arriola, L.M.; Carrillo-González, F.M.; Quijas, S.; Rodríguez-Uribe, M.C. Energy Efficiency Indicators for Hotel Buildings. Sustainability 2021, 13, 1754. [Google Scholar] [CrossRef]
- ASHRAE. ANSI/ASHRAE/IES Standard 90.1-2019-Energy Standard for Buildings except Low-Rise Residential Buildings; ASHRAE: Atlanta, GA USA, 2019. [Google Scholar]
- Baechler, M.C.; Williamson, J.L.; Cole, P.C.; Hefty, M.G.; Love, P.M.; Gilbride, T.L. Guide to Determining Climate Regions by County. In Building America Best Practices Series; Pacific Northwest National Lab.(PNNL): Richland, WA, USA, 2010; Volume 7.1. [Google Scholar]
- SunEarthTools. Sun Path Diagram for the City of Los Angeles. 2021. Available online: https://www.sunearthtools.com/dp/tools/pos_sun.php (accessed on 18 July 2021).
- PlusICE. PlusICE Organic (A) Range; PlusICE: Lynge, Denmark, 2021. [Google Scholar]
- Feustel, H. Simplified Numerical Description of Latent Storage Characteristics for Phase Change Wallboard; Indoor Environment Program, Energy and Environment Division: Berkeley, CA, USA, 1995. [Google Scholar]
- Jacobson, M.Z.; Jadhav, V. World estimates of PV optimal tilt angles and ratios of sunlight incident upon tilted and tracked PV panels relative to horizontal panels. Sol. Energy 2018, 169, 55–66. [Google Scholar] [CrossRef]
- U.S. Department of Energy. EnergyPlus™, Version 9.3.0; Documentation: Engineering Reference; U.S. Department of Energy: Washington, DC, USA, 2020. [Google Scholar]
- Arutjunjan, R.E.; Markova, T.S.; Halopenen, I.Y.; Maksimov, I.K.; Tutunnikov, A.I.; Yanush, O.V. Thermochromic Glazing for “Zero Net Energy” House. In Proceedings of the Glass Processing Days Conference Proceedings, Tampere, Finland, 15–18 June 2003. [Google Scholar]
- Energysage. Solar Panels in Los Angeles County, CA. 2021. Available online: https://www.energysage.com/local-data/solar-panel-cost/ca/los-angeles-county/ (accessed on 15 June 2021).
- U.S. Bureau of Labor Statistics. Average Energy Prices, Los Angeles-Long Beach-Anaheim–September 2020. 2020. Available online: https://www.bls.gov/regions/west/news-release/2020/averageenergyprices_losangeles_20201015.htm (accessed on 14 June 2021).
- Annual Year-On-Year Growth in Residential Electricity Prices in the United States from 2000 to 2020, with a Forecast Until 2022. 2020. Available online: Statista.com (accessed on 14 June 2021).
Figure 1.
The flow of the research work.

Figure 2.
Energy simulation model of a hotel building.

Figure 3.
Parametric analysis of building envelope properties.

Figure 4.
Effect of window-to-wall ratio on building energy consumption.

Figure 5.
Sun path diagram for the city of Los Angeles, USA [28].
Figure 5.
Sun path diagram for the city of Los Angeles, USA [28].

Figure 6.
Effect of building orientation on heating and cooling energy demand.

Figure 7.
Optical properties of the thermochromic windows [17].
Figure 7.
Optical properties of the thermochromic windows [17].


Figure 8.
Energy consumption of the hotel in its original design and before and after installation of thermochromic windows.
Figure 8.
Energy consumption of the hotel in its original design and before and after installation of thermochromic windows.

Figure 9.
Enthalpy-temperature curves of PCMs for search domain used in optimization.

Figure 10.
Optimization of PCM melting temperature.

Figure 11.
Effect of orientation of PV on electricity generation potential.

Figure 12.
Dimensions and tilt angle of photovoltaic panels.

Figure 13.
General overview of solar panels.


Table 1.
Material composition of exterior walls and roof.
| Thickness [m] | Conductivity [W/m·K] | Density [kg/m3] | Specific Heat [J/kg·K] | |
|---|---|---|---|---|
| Exterior wall | ||||
| Stucco | 0.0253 | 0.692 | 1858 | 837.0 |
| Concrete | 0.2032 | 1.311 | 2240 | 836.8 |
| Wall Insulation | 0.0623 | 0.049 | 265 | 836.8 |
| Gypsum | 0.0127 | 0.160 | 785 | 830.0 |
| Roof | ||||
| Roof Membrane | 0.0095 | 0.160 | 1121 | 1460.0 |
| Roof Insulation | 0.1701 | 0.049 | 265 | 836.8 |
Table 2.
Parametric analyses for optimization of the building envelope.
| Parameters | Values Used in the Parametric Analyses |
|---|---|
| Di, wall, m | [0.005:0.005:0.075] |
| Di, roof, m | [0.05:0.05:0.40] |
| ki, W/m-K | [0.010:0.005:0.060] |
| I, m3/s-m2 | [0.00005]^[0.0001: 0.0001: 0.0005] |
| U-factor, W/m2-K | [0.3:0.5:5.8] |
| R-value, m2-K/W | [0.1:0.05:0.4]^[0.4:0.1:0.8]^[1:1:4] |
Table 3.
Resultant building envelope parameters.
| Di,wall, m | Di,roof, m | ki, W/m-K | I, m3/s-m2 | U-Factor, W/m2-K | R-Value, m2-K/W | ECtotal, GJ | ES, GJ | %Savings |
|---|---|---|---|---|---|---|---|---|
| 0.045 | 0.400 | 0.030 | 0.0005 | 5.8 | 4.0 | 2438.3 | 119.5 | 4.67% |
Table 4.
Original window-to-wall ratios of the building.
| Total | North (315°–45°) | East (45°–135°) | South (135°–225°) | West (225°–315°) | |
|---|---|---|---|---|---|
| Gross Wall Area, m2 | 17,197.80 | 5712.45 | 2886.45 | 5712.45 | 2886.45 |
| Window Area, m2 | 2400.80 | 882.40 | 265.20 | 988.00 | 265.20 |
| Gross WWR, % | 13.96 | 15.45 | 9.19 | 17.30 | 9.19 |
Table 5.
Properties of PCM A28 (PlusICE®) [29].
Table 5.
Properties of PCM A28 (PlusICE®) [29].
| Properties | Values |
|---|---|
| ρ [kg/m3] | 789 |
| k [W/(m·K)] | 0.21 |
| Hf [kJ/kg] | 265 |
| Cp [J/(kg·K)] | 2220 |
| Tm [°C] | 20–30 |
Table 6.
Material quantities, costs, and energy savings by thermochromic windows, PCMs, and solar panels.
Table 6.
Material quantities, costs, and energy savings by thermochromic windows, PCMs, and solar panels.
| Construction | Quantity | Unit Cost | Total Material Cost, USD | Design Life, Years | Energy Savings | |
|---|---|---|---|---|---|---|
| per Year | over Lifetime | |||||
| TC window a | 2497.5 m2 | 50 USD/m2 | 124,875 | >12 | 204 GJ | 2448 GJ |
| PCM b | 344.0 m3 | 4572 USD/m3 | 1,572,768 | >27 | 222 GJ | 5994 GJ |
| Solar panels c | 37.5 kW | 2710 USD/kW | 101,625 | ~25 | 398 GJ | 9950 GJ |
Table 7.
Payback period and return on investments for TC window, PCM, and solar panels.
| Construction | Dynamic Payback Period, Years | Net Present Value, USD | Return on Investments, % | RevPAR, USD/Year |
|---|---|---|---|---|
| TC window | 14.8 | −16,264 | −13.0 | 4.9 |
| PCM | — | −1,346,990 | −85.6 | 254.9 |
| Solar panels | 5.6 | 177,866 | 175.0 | N/A |
Publisher’s Note: MDPI stays neutral with regard to jurisdictional claims in published maps and institutional affiliations. |
© 2021 by the authors. Licensee MDPI, Basel, Switzerland. This article is an open access article distributed under the terms and conditions of the Creative Commons Attribution (CC BY) license (https://creativecommons.org/licenses/by/4.0/).
Share and Cite
MDPI and ACS Style
Kobeyev, S.; Tokbolat, S.; Durdyev, S. Design and Energy Performance Analysis of a Hotel Building in a Hot and Dry Climate: A Case Study. Energies 2021, 14, 5502. https://doi.org/10.3390/en14175502
AMA Style
Kobeyev S, Tokbolat S, Durdyev S. Design and Energy Performance Analysis of a Hotel Building in a Hot and Dry Climate: A Case Study. Energies. 2021; 14(17):5502. https://doi.org/10.3390/en14175502
Chicago/Turabian StyleKobeyev, Sultan, Serik Tokbolat, and Serdar Durdyev. 2021. "Design and Energy Performance Analysis of a Hotel Building in a Hot and Dry Climate: A Case Study" Energies 14, no. 17: 5502. https://doi.org/10.3390/en14175502
Note that from the first issue of 2016, this journal uses article numbers instead of page numbers. See further details here.