
Applying Solar PV to Heat Pump and Storage Technologies in Australian Houses


1
School of Property, Construction and Project Management, RMIT University, Melbourne, VIC 3000, Australia
2
School of Architecture and Built Environment, Deakin University, Geelong, VIC 3220, Australia
3
Faculty of Science, Engineering and Built Environment, Deakin University, Geelong, VIC 3220, Australia
*
Author to whom correspondence should be addressed.
Energies 2021, 14(17), 5480; https://doi.org/10.3390/en14175480
Submission received: 22 July 2021
/
Revised: 23 August 2021
/
Accepted: 24 August 2021
/
Published: 2 September 2021
(This article belongs to the Special Issue Environmental Technology Applications in the Retrofitting of Residential Buildings)
Abstract
:Innovative mechanical services coupled with renewable energy systems are crucial for achieving a net zero energy goal for houses. Conventional systems tend to be vastly oversized because they lack the means to buffer energy flows and are based on peak loads. This paper presents an approach to achieve a net zero energy goal for houses by using a solar PV system, heat pumps, and thermal and electrical storage batteries, all off-the-shelf. Constraining one part of the system and then showing how to manage energy storage and flow is a paradigm shift in sizing. The design is for a modest-sized house built in Melbourne, Australia. The output of a solar photovoltaic array drives a small-scale heat pump to heat water, buffering its energy in a thermal battery to energise a radiant space heating system. Space cooling is provided by a separate heat pump. Through energy storage in electrical and thermal batteries, it is possible to meet the electricity, heating and cooling needs of the house for the Melbourne climate with a heat pump that draws less than 1 kW. The design methodology is detailed in an appendix and can be applied to similar projects. This paper contributes to similar work worldwide that aims to reinforce innovative renewable energy driven service design.
1. Introduction
Over the last decade, research on the self-consumption of photovoltaic electricity within residential buildings has become a significant topic [1,2,3,4,5]. While Stauffer et al. do not go into great detail about their service system design, they provide a detailed theoretical explanation of a calculation for a self-consumption ratio [1]. Sánchez et al. show a more detailed service system without a battery, but they select a 1 kW input heat pump to provide for increased PV self-consumption [2]. Beck et al., in their papers on the topic, do not explain the mechanical services but rather deal with battery sizing and theoretical algorithms to predict the optimization of self-consumption [3,4]. Luthander et al. provide a review on self-consumption which deals more with PV and battery sizing. The idea of running a heat pump from the renewable generated energy and putting this into thermal storage has already proven successful [6,7,8]. While the types of heat pumps applied to these purposes require further understanding and investigation, they do increase self-consumption through thermal storage.
The complete decarbonization of energy will depend on using heat pumps in the residential sector. This has been acknowledged by the Association of Heat Pumps in the UK [9], as well as a report on reaching 10 million heat pumps for residential buildings by 2030 [10]. Another article presents a solar thermal assisted heat pump system in support of global emission reduction [11].
Several of the papers noted above emphasised the importance of optimized control algorithms to minimise cost, but most of the published algorithms are concerned with variable feed-in tariffs and changing the coefficient of performance (COP) of the heat pump during different stages in its operation cycle. However, in Australia, since solar energy capacity is growing to exceed present demand, the actual harvest of energy will be limited by the demand, making optimization of cost unnecessary.
Building operation is responsible for a significant portion of energy consumption and CO2 emissions. In Australia, space conditioning and water heating account for 40% and 23%, respectively, of total household energy use [12]. However, these loads could be serviced using air-to-water heat pumps [1,2,9,10,11]. Such heat pumps could run on renewable solar energy PV systems to move towards net zero energy building. Feed-in tariffs are becoming a problem in Australia because the electricity grid, which is designed to deliver energy rather than receive it, is becoming overloaded. Power companies are beginning to restrict feed-ins by reducing feed-in tariffs or disallowing feed-in altogether. Consequently, some new installations, while hooked up to the grid, are not connected to supply it.
Kolkotsa et al. [13] described the net zero energy building/positive energy building (NZEB/PEB) design as a “progression from passive sustainable design”. In this regard, some approaches were considered capable of improving the energy efficiency of buildings through: the improvement of the building fabric (insulation, thermal mass, phase change materials); the use of renewable energies and intelligent energy management; and the incorporation of high efficiency heating, ventilation, and air conditioning (HVAC) equipment. Building service systems that provide HVAC and domestic hot water (DHW) are central to the design of NZEBs. Fabrizio et al. [14] reviewed the technology, performance and parameters of the latest multi-energy systems for residential NZEBs. They proposed two integrated systems: one for space heating and DHW; and another for space heating, cooling, and DHW.
The objective of the present paper is to show an integrated energy efficient building services system supporting a NZEB using available off-the-shelf technologies. The proposed system provides space heating and cooling as well as DHW via a solar-powered heat pump drawing less than 1 kW, while utilizing both electrical and thermal batteries. The key parameters and concepts are identified to size the system for the case study: a single-storey three-bedroom home in Melbourne, Australia, built in 1993. The poorly insulated construction is typical for houses built in that era: single-glazing, brick veneer walls and a tile roof above an unsealed ceiling space. The walls and roof space are insulated with just a single layer of fiberglass insulation, with an estimated R-factor of 3.5 m2·°C/W. Utility and solar PV generation data are available for this home, as it is owned by one of the authors.
The climate of the case study location can be described as mild temperate. During the warmest month of January, the mean maximum and minimum temperatures are 26 and 13 °C, respectively, with the temperature sometimes reaching as high as 45 °C. During the coldest month of July, the mean maximum and minimum temperatures are 13 and 6 °C, respectively, with the overnight low sometimes dropping to 3 °C.
This study is essentially a thermodynamic feasibility study that lays the groundwork for later and more comprehensive transient analyses.
Usually, building mechanical services are sized according to the design (peak) heating and cooling loads. However, this is not always the best way to constrain the capacities and costs of the systems, and it does not encourage changes in behavior and expectations to reduce energy use and greenhouse gas emissions. Typically, this approach leads to unnecessarily large systems requiring more energy. Therefore, new approaches are required such as the one proposed here.
In summary, of the literature reviewed, many papers deal with the self-consumption of solar PV energy. Most of these seek to optimise the periods of self-consumption with appliances and services in a house. However, several issues remain opaque to the reader of these articles. First, the design of the system and selection of appliances and/or size according to existing loads is often not considered. Second, the algorithms and/or actual optimization control of the system itself are often very complex, unobtainable, and therefore not repeatable. Third, for the size and design of a particular service system, the actual variation and seasonal generation of power is generally not discussed, explained or accounted for.
The present paper aims to put together a practical method whereby off-the-shelf products can be used to demonstrate a design retrofit to raise self-consumption of solar energy. It is based on working within the constraints of a heat pump running on less than 1 kW of power and a 6.5 kW solar PV system. More sophisticated methods could involve studying daily energy usage or even half hourly interval data from Smart Meters and solar PV systems. The purpose here is to explore a possible design through a first principle-based solution involving a renewable energy system to establish the extent to which self-consumption can be increased. In the Australian context, this is of vital importance, as many electricity service providers are seeking to limit, control or exclude export of electrical energy to the grid.
This study presents a paradigm shift in how to size a mechanical services system for a home: staying within constraints rather than designing for peak loads. It begins with the question: what can be accomplished by limiting the size of one part of the system? In this case, the project is built around a heat pump operating on about 1 kW of input power. The reasoning for this small size is that, through present DC inverter technology, a compressor can operate directly from solar PV easily and more frequently. This constraint defines all other considerations: how much energy must be generated, stored and used. These considerations are methodically analysed in this study to meet the heating and cooling needs for the case study home.
2. Description of the Mechanical System
2.1. System Components
This section outlines the whole system and introduces the individual components, noting the science, thermodynamics and specifications that will be relied on in the next section to properly size and cost the integrated package.
The reference solar PV system for this study is modelled by that at the Melbourne home of one of the authors. This 6.5 kW microinverter system consists of 20 panels rated at 325 W each. Eight of these panels face northeast and twelve face northwest. The average energy productions for the coldest and warmest months (July and January [15]) are 13 kWh and 31 kWh, respectively. Typical daily productions on completely overcast days in July and January are 7 kWh and 10 kWh, respectively. This system cost AUD 7700, after government rebates.
A vapor compression refrigeration cycle moves energy between thermal reservoirs. It is implemented as a heat pump (HP) consisting of an evaporator, compressor (pump), condenser and expansion valve. A HP provides the mechanism to transfer outdoor heat from the air, also known as the ‘source’, into a ‘sink’, which in this case for this study is conditioned hot water that is ultimately used to heat a building. When the objective is to cool a space, transferring heat from a building to the outdoors, this is called a refrigeration cycle. If the heating or cooling is not required immediately, it can be stored in or extracted from a thermal battery (TB).
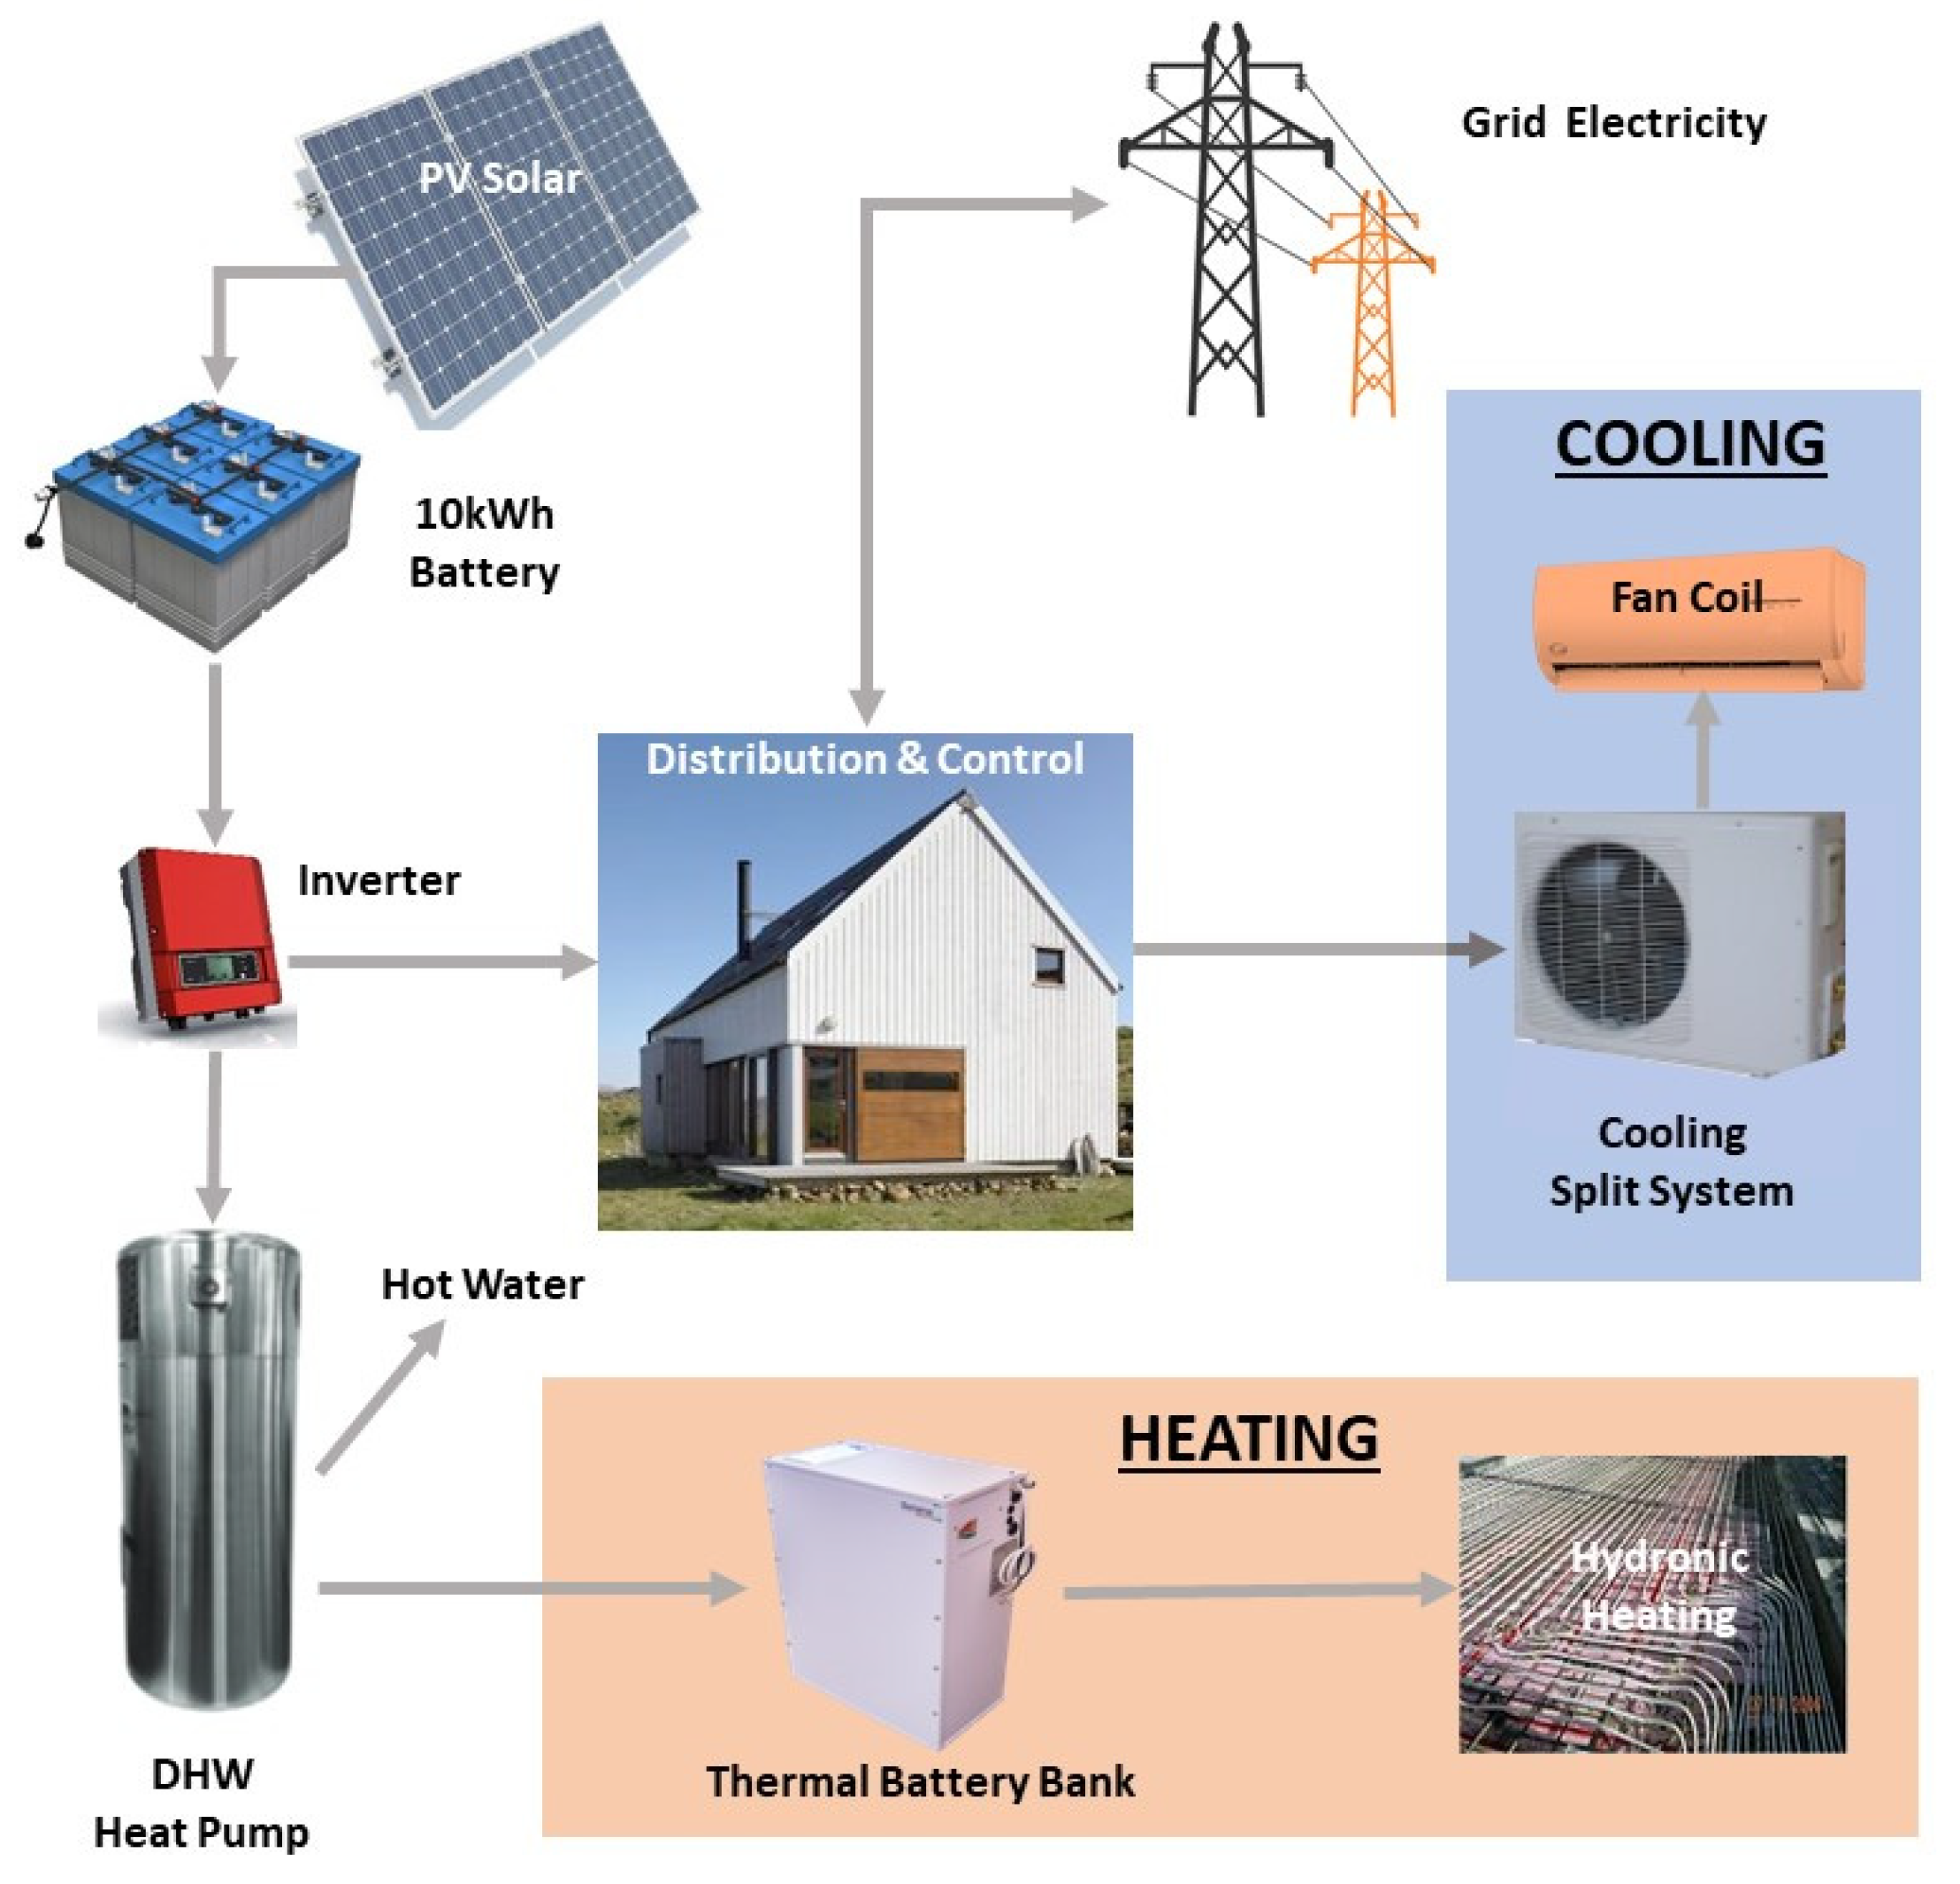
For the proposed heating system shown in Figure 1, an air-to-water HP transfers heat from the outdoor air to water in its buffer tank. This water is then circulated to a bank of TBs to store enough thermal energy to support space heating in winter (e.g., by hydronic heating and radiant panels). This energy is extracted as required by another water loop.
For the cooling system, heat flows in the opposite direction: from the building space to the outdoor air. This could be accomplished by using the same HP system to extract heat from a different TB (storage tank), providing a cold reservoir with which to cool the building via a hydronic loop connected to chilled beams, for example. However, as will be explained later, there is no need for TBs in the case of cooling studied here. It is more straightforward to cool the space directly via the evaporator of an air-to-air HP split system, as shown in Figure 1.
It is acknowledged that, ideally, the cooling side system could not only cool the room air but also heat the DHW with the room heat rejected by the HP. Such systems are not commonly available in Australia for low-capacity applications, such as the case considered in this paper. Furthermore, the company that manufactures the high COP HP selected for the cooling (noted below) does not offer this option of also providing DHW. The authors thought it preferable to rely on such a highly performing HP even if it could not also provide DHW. Instead, the heating side HP is used to meet the DHW needs during the cooling season as well as the heating season. Regardless, Melbourne is a heating-dominated environment, and the cooling system is really only used intensely for two months of the year. Therefore, the missed opportunity to use the cooling side HP for DHW is not significant. This arrangement is in the interest of simplicity and to ensure the use of available high-performance off-the-shelf components. For the much warmer Brisbane, Australia, a cooling system that also provides DHW would be the preferred choice because Brisbane is in a cooling dominated climate.
The heating and cooling systems operate on solar PV energy passing through a bank of electrical batteries (EBs). Domestic demand can draw more solar energy for loads (e.g., appliances) or it can be exported to the grid, if so configured. Otherwise, no additional energy is collected.
The thermal performance of an HP system is given by the coefficient of performance (COP). When operating in the forward or heating mode:
where:
COPheating = Q’delivered/W’compressor,
Q’delivered = the rate of heat delivered to the high temperature reservoir (W);
W’compressor = the power input to the compressor (W).
When operating in the reverse or cooling mode:
where:
COPcooling = Q’removed/W’compressor,
Q’removed = the rate of heat removal from the low temperature reservoir (W);
W’compressor = the power input to the compressor (W).
The coefficients of performance for heating and cooling are usually greater than 1. The higher the coefficient, the more effective the HP.
The thermal battery (TB) considered in this study consists of a core of phase change material (PCM) surrounded by water. Table 1 presents the properties of TBs from Sunamp Ltd. (Tranent, UK) suitable for the heating and cooling processes modelled here, although, as will be explained later in this paper, cooling TBs will not be needed [16,17,18]. The cost per heating TB is approximately AUD 4600 [19]. A similar cost is assumed for the cooling TB (as of July 2021, 1 AUD~0.76 USD).
In order to provide space heating at a later time, hot water from a HP flows into a TB, heating it from the minimum temperature of 45 °C until it reaches the melting temperature of 58 °C. Subsequent heat addition just melts the PCM at this constant temperature. Once fully melted, the temperature of the PCM rises. Most of the energy stored in the PCM is from the phase change. This leads to a denser energy storage than, for example, heating a tank of water that remains liquid. When space heating is required later, cool water from the house is passed over the PCM to extract the stored energy, eventually returning the PCM to a solid.
If TBs are used for space cooling, cold water from an HP flows over liquid PCM, cooling it until it reaches the freezing temperature of 11 °C, at which point it begins to solidify. Further heat extraction leads to more solidification without a decrease in temperature but with a significant storage of energy. Once the PCM is fully solidified, the temperature continues to drop. When space cooling is required, warm water from the house is circulated over the PCM to cool the water, eventually melting the PCM.
The TB for heating requires a minimum water supply temperature of 65 °C [17]. This is beyond the range of most conventional HPs using standard refrigerants. An HP with carbon dioxide (CO2) as the refrigerant allows for higher temperature ranges to be achieved and, conveniently, higher COPs.
A commercial HP was selected to provide realistic specifications. The Sanden Eco® plus system, which uses carbon dioxide as the refrigerant, can supply water for a DHW system at a maximum temperature of 65 °C, with a COPHP of 5.6 while operating at 0.9 kW [20]. For the heating system studied, heated water is passed to the TB and into a DHW tank.
Ideally, the heating and cooling systems should share a reversible HP. However, a commercial reversible CO2 heat pump with air-to-water heating and a high COP could not be found. The most practical solution is to use a proven conventional HP for the entire cooling process.
The HP selected for the cooling process is the 5.1 kW-rated cooling-only (air-to-air) split system from the Pioneer (Aust.) line of air conditioners [21]. This system has a maximum capacity of 6 kW and uses M20 hydrocarbon refrigerant. The COPcooling for this system is 6.1, with an average power consumption of 0.83 kW.
Table 2 presents the published COPs for the HPs of the heating and cooling systems.
It is known from the ideal Carnot HP and refrigerator cycles that COPs vary with the temperatures of the hot and cold reservoirs (TH and TC) [22]. For this study, the reservoir temperatures approximately correspond to the indoor set points and outdoor conditions. (There is a small difference across each heat exchanger). Since these temperatures differ from those at which the COPs given in Table 2 were determined, the COPs should be adjusted according to the actual temperatures.
Table 3 presents TH and TC for the test conditions used to measure the COPs of Table 2, with the test parameters set to the standard conditions to evaluate the performance of HPs [23]. The operating temperatures for this study that were used to calculate the COPs are also tabulated in the last column of Table 2
In Table 3, the operational outdoor temperatures for the heating and cooling processes (6 °C and 32 °C) are the annual heating and cooling design temperatures for Melbourne [24], each based on a 1% frequency of occurrence. This means that, for 1% of the hours over the year, the air temperature is equal to or less than the heating design temperature—or it is equal to or greater than the cooling design temperature. Relying on the design temperatures helps with sizing the proposed system appropriately. As for the other operating temperatures in Table 3: the TH for the heating process is the aforementioned maximum water temperature; and the TC for the cooling process of 25 °C is within the usual range for the indoor temperature under cooling (though TBs, which would require a colder temperature, will not be used in the proposed system).
For the heating system, the COP is adjusted based on the temperature dependence of the COP for a Sanden CO2 HP system [25], and the conditions presented in Table 3. This reduces the COPheating by 13% from 5.6 to 4.9. The adjusted coefficient is presented in Table 2. A similar adjustment of the quoted COPcooling [21] based on the test and operating temperatures in Table 3 changed this coefficient from 6.1 to 6.0, as also noted in Table 2.
The TB energy storage capacities presented in Table 1 are based on heating and cooling to the maximum and minimum temperatures of the PCM, respectively (85 °C and 6 °C). While the lower temperature can be met with the chosen HP system (if cooling TBs are used), the water supply temperature to the heating TB is limited to 65 °C. Due to the thermal resistances between the supply water and PCM, it is assumed the PCM will only be heated to 63 °C. A recalculation of the energy storage yields an effective capacity of 8.1 kWh for the heating TB under the operating conditions for this study.
The manufacturer of the TB, Sunamp Ltd., is working with Trina Solar to integrate an HP with its TB system [26]. Presumably, this could involve a refrigerant-to-water heat exchanger on the condenser side of the HP, with the water circulated directly to the TB.
However, for the heating system proposed here, it is necessary to place a buffer water tank between the HP and TB. The HP heats the water in the buffer tank, which is then circulated to the TB. Sanden, which makes the HP considered here, markets its product with accompanying hot water tanks [19]. The 160 L size was chosen to serve as the buffer tank for this study. The combined HP and buffer tank system costs about AUD 3000 (the retail price of AUD 4200 less the estimated federal government rebate of AUD 1200).
Another water tank is required for the DHW system, otherwise the heat in the buffer tank could be quickly and completely consumed, for example, by several hot showers. The DHW tank was simulated by another Sanden 160 L water tank, for which the estimated cost is AUD 400.
Electrical batteries are required so that the heating TB can be thermally charged overnight, to run the HP in the early morning and late evening hours and to provide backup electricity on overcast days. The EB unit chosen for this study is the Enphase lithium-ion battery, which can store 1.2 kWh of energy and costs AUD 2000. The battery losses are 4% [27], i.e., the efficiency of the electrical batteries is 96%. Several of these battery units are combined into an EB bank to meet the electrical needs identified by the analysis in Section 3.
2.2. Performance and Equations
For the heating season (winter), the total electrical energy (Etotal) required to meet all of the heating needs of the house is given by:
where:
Etotal,winter = [(DHL + TBlosses + QDHW + DHWlosses + BTlosses + Epumps)/COPheating + Epumps]/εEB
DHL = design heating load (the maximum load the system must meet);
TBlosses = heat loss from TBs (kWh);
QDHW = heat required for DHW (kWh)
DHWlosses = heat loss from DHW tank (kWh);
BTlosses = heat loss from buffer tank (kWh);
COPheating = coefficient of performance for the heat pump that delivers thermal energy to system;
Epumps = energy required to run pumps (kWh);
εEB = EB efficiency.
The heat required for the DHW is given by:
where:
QDHW = mwater Cp (TDHW − Tmains)
mwater = mass of water in the DHW tank (kg);
Cp = specific heat capacity of water (4.18 kJ/kg·°C for average of temperature range);
TDHW = water temperature maintained in DHW tank (°C);
Tmains = water temperature at mains pipe going to DHW tank (°C).
For the cooling season(summer), the electrical energy required to provide the cooling, Ecooling, is given by: the design cooling load, DCL, in kWh over the COP of the HP for the cooling system (COPcooling), while taking into account the efficiency of the EBs:
Ecooling = (DCL/COPcooling)/εEB
The overall energy required in the cooling season is given by:
Etotal,summer = [(DCL/COPcooling) + (QDHW + LossDHW)/COPheating]/εEB
3. Results and Analysis
The detailed calculations for the sizing results given in this section are presented in Appendix A.
3.1. Sizing of Heating System
During the colder months in Melbourne, typically only a few rooms of a house are heated—and usually just during the morning and evening. Sufficient heating for the actual case study, (a modest-sized house in Melbourne) is provided by a 6 kW-rated split-system heat pump servicing a closed off kitchen, lounge and dining area during the day, and the bedrooms in the late evening. On the coldest days in winter, an average of 5 kW of heating is supplied between 6 and 8 am and between 6 and 10 p.m.—a total of six hours, leading to a requirement of 30 kWh of heating. This is the design heating load (DHL) for the system.
Two questions at this point are: can this DHL be met within the constraints of a heat pump operating with less than 1 kW of power (and here a 0.9 kW Sanden HP has been selected) and a 6.5 kW solar PV system; and, if so, what other components of the system are required?
Based on the effective capacity of 8.1 kWh per TB, the DHL of 30 kWh could be met with four TBs (a capacity of 32 kWh). These would be stacked in parallel so that, in warmer weather (spring and autumn), some TBs could be isolated.
Sunamp [17] quotes a heat loss per TB of 0.74 kWh/day (though without specified temperatures), so this battery bank would have a total daily loss of about 3 kWh. Two kilowatt-hours of this can be accommodated by the extra capacity in the battery bank (beyond the required 30 kWh), but an additional 1 kWh must be supplied. Therefore, 33 kWh must be supplied to the TB bank.
The HP would also supply heat for the DHW system. The DHW system consists of a 160 L tank (approximately 160 kg of water), which is assumed to be fully changed out once a day and maintained at 60 °C. The water is heated from the average temperature in June for mains water in Melbourne: 13 °C [28]. The required energy by Equation (4) is 31 MJ or 8.7 kWh. The daily energy loss from the tank is estimated to be 5% (0.4 kWh).
For the buffer tank between the HP and TB, the daily energy loss is also estimated to be 5% (0.4 kWh).
The sum of the heat storage and losses in the TB, DHW and buffer tanks is 43 kWh. This is the thermal energy that must be provided by the HP. For an HP with a COP of 4.9, this would require an electrical input of 8.8 kWh.
Electricity is also required to run circulation pumps in the following water loops: between the buffer tank and TB (assumed to be for 18 h); the hydronic heating loop (for 6 h); and the loop between the HP and the two water tanks. The total daily electrical energy requirement for these pumps, Epumps, is estimated to be 1.1 kWh.
The sum of the above energy requirements is 9.9 kWh. This is what must be supplied by the EBs. However, since these batteries have an efficiency of εEB = 96%, a total electrical energy of Etotal = 10.3 kWh must be supplied by the solar PV system to charge the EBs.
The benchmark 6.5 kW solar PV system will more than satisfy this requirement (average production of 13 kWh/day in the worst-performing month of July). Therefore, this system could be scaled down to meet the 10.3 kWh/day required by the proposed heating system: a 5.2 kW system with 16 panels would suffice. However, since extra solar capacity is required for domestic electricity consumption, the reference solar PV system of 6.5 kW on the case study house will be used here. It is known from the case study that this extra capacity would be insufficient to meet the addition of domestic consumption on most days in July. Deficits could be met from the grid (in which case this will not be a stand-alone system) or by adding more solar panels to the solar PV system.
It was decided to limit the capacity of the EB bank to 10 kWh to reduce the cost of the system. Therefore, the electrical storage consists of 8 EBs providing an electrical storage capacity of 9.6 kWh. Conveniently, this will store just under a day’s worth of required electricity for an average day in July.
With the reference solar PV system delivering 7 kWh on a fully overcast day in July (just over half of the daily average for the month), the heating system would be able to meet just over half of the design load. Starting with full TBs, the half-load scenario would occur on the second consecutive fully overcast day. This could be addressed in two ways: the occupants could tolerate colder indoor temperatures; or the shortage could be made up for with power from the grid, in which case this will not be a stand-alone off-grid system.
A summary of the requirements for the heating system is presented in Table 4 below, which also includes the needs of the cooling system, which will now be addressed.
3.2. Sizing of Cooling System
The cooling system is sized in a similar manner. In Melbourne, typically only a few rooms of a house are cooled. During the day, an area consisting of the kitchen, lounge and dining area is closed off and cooled. In the late evening, just the bedrooms are cooled. For the case study house, it is known that a split-system HP providing an average of 6 kW of cooling over noon to 11 p.m. suffices for the hottest day. This corresponds to a design cooling load (DCL) of 66 kWh (6 kW times 11 h). This is the scenario used in the present study.
Again, the questions are: can the design load be satisfied within the constraints of a heat pump operating with less than 1 kW of power (the Pioneer 0.83 kW HP in this case) and a 6.5 kW; and, if so, what supporting components will be needed?
The analysis below is based on the same solar PV and EB system required for the heating system, because it is the heating load that determines the capacities for the electrical side which, as will be shown, in this case leaves more than enough capacity to meet the required cooling load.
The storage requirement for cooling differs from that for heating. Most of the cooling load—and indeed the peak cooling—occurs when the sun is in the sky, leading to daytime solar gains through the building envelope. In contrast, the heating load usually occurs when the sun is below the horizon or low in the sky: overnight, morning or evening. Therefore, much of the cooling load can be provided directly by the solar-powered HP during the day (i.e., storage is not needed). However, storage might be required in the evening hours or under cloudy conditions. But, as will be shown, only electrical and not thermal storage is needed for the scenario considered in this paper.
By late January, after 7 p.m., the benchmark solar PV system generates insufficient power to run the HP. Therefore, from 7 to 11 p.m., the cooling system must run mostly on stored electricity; although the sun does not set until about 8:45 p.m., there is a much lower output from the PV system in the two hours leading up to sunset. Therefore, there are two periods to consider: noon to 7 p.m. (requiring 42 kWh of cooling), and 7 to 11 p.m. (requiring 24 kWh of cooling). Whether TBs are required depends on whether the solar PV system and EBs can deliver enough energy to meet not only the daytime needs, but the evening ones as well.
In January, the benchmark solar PV system produces an average of 31 kWh/day. Based on the cooling system COP of 6 and the battery loss of 4% (EB efficiency of 96%), the daytime load of 42 kWh would require only 7 kWh of the 31 kWh of generated solar power. The evening load of 24 kWh would require 4 kWh of the day’s solar power—less than the 9.6 kWh capacity of the EBs. This leaves a surplus of 20 kWh of solar power left over (almost two thirds of the daily production) for domestic consumption, export to the grid, extending the cooling overnight if needed, or even running additional cooling systems to cool more of the house. The situation is even better because, with the sun setting at 8:42 p.m. in mid-January, the PV system will still be delivering some electricity to the cooling system over the first half of the evening, without the need to rely exclusively on the electrical batteries, while leaving more energy available for domestic consumption.
Therefore, thermal storage for cooling is not required. Having sized the solar PV system to handle the heating load, when one turns to look at the cooling load, the much larger solar power generation in the summer months ensures there is more than enough electrical power to meet this load.
The situation of a fully overcast day does not present a problem. The benchmark PV solar system typically produces 10 kWh on an overcast day in January. Leveraged through the HP and considering the battery efficiency, this corresponds to 58 kWh of cooling—almost 90% of the design cooling load. Furthermore, under cloudy conditions, the outdoor temperature is usually lower and there will be much less solar gain through the building envelope, ensuring that the actual load that day will be much less.
If there was a compelling reason to rely on thermal batteries for some of the cooling, cooling TBs of Table 1 could be incorporated into the system. Determining the exact number of TBs would require transient modelling over the summer months. However, if it is assumed that for the hottest days a fifth of the design cooling load required TB storage, four TBs would be needed at a cost of AUD 8400.
The summertime DHW requirement is 7.2 kWh, which is slightly less than that for the winter because of the higher mains water in Melbourne of 21 °C [28]. It is recalled from Section 2.1 that, for the sake of simplicity and equipment availability, the heat for the DHW is provided by the heating side HP, even though ideally it could be the heat rejected from the cooling system.
3.3. Economics
The costs for the heating and cooling systems are itemised in Table 5. The systems share the solar PV and EB components. The solar system price is after federal and state government solar PV rebates, and the electricity price is after the maximum state battery rebate of AUD 4200. The total cost is AUD 30,100 (USD 22,900).
An exact calculation of the annual cost savings with this solar-powered system would require a transient analysis based on the weather and solar radiation throughout a typical year. However, an estimate can be made on the basis of the energy requirements for the actual house served by the reference solar PV system for this paper. The house is poorly insulated (single glazed windows) and poorly sealed (drafts around doors). This construction is typical for homes in Melbourne of this vintage (about 30 years) or older.
The actual annual energy consumption for this house is 5700 kWh of electricity and 28 GJ of gas. Space heating and cooling for about a quarter of the house (usually closed off from the rest of the house for this) are provided by a split-system reversible heat pump. Occasionally, whole-house heating is supplied by a gas-ducted system, and whole-house cooling by an evaporative cooler. Gas is used to heat DHW, and for the stove.
Some parameters and assumptions were required to interpret the monthly utility bills of the actual house in order to estimate the electricity that must be supplied by the PV system to run the building services system proposed in this paper. Space heating was only required over April to September, and space cooling for October to March. The COP rating for the current cooling system of the house is 3.3, and that for the heating system is 3.7. All of the gas consumption is for space heating, DHW and cooking. Based on the summertime gas consumption (no gas-fired heating), the monthly base load for gas was determined to be 100 kWh equivalent of energy, of which 90% is assumed to be for DHW and the rest for cooking. Based on the electricity demand in the winter (during which most of the heating is by gas), the monthly base load electricity consumption was determined to be 370 kWh. All of the rest of the electricity goes to space cooling, most of which is accomplished through a HP system. It is estimated that a tenth of the space cooling is via the electrically driven evaporative cooling system but, since the efficiency of that system is unknown and the electricity consumption for that is small in any case, it is assumed that all of the space conditioning is through the HP system.
These assumptions were applied to the actual monthly utility bills to determine the equivalent electrical energy (in kWh) that must be generated by the solar PV system to meet the energy needs of the proposed system to provide the required space heating (via the Sanden HP with a COP of 4.9), space cooling (via the Pioneer HP of 6), DHW, cooking (now by electricity) and other domestic electricity consumption. The actual monthly electricity production by the solar PV system was also known.
The proposed system is designed only to condition the closed off spaces noted above, rather than the whole house, and it is assumed this is acceptable to the occupants (though there is sufficient solar power for expanded cooling). Current utility prices for the actual house are: AUD 0.042/MJ of gas; and, for electricity, AUD 0.42/kWh to purchase, and AUD 0.20/kWh to export to the grid (the feed-in tariff).
Based on monthly averages for the solar PV generation and the equivalent electricity needs based on the actual monthly utility bills, the proposed system would require some grid power over May to September. However, over the course of a year, there would be a net electricity surplus of 1500 kWh exported to the grid (2600 kWh exported and 1100 kWh imported). Due to the difference between the purchase and feed-in tariff prices, the net annual electricity bill would be a credit of AUD 58—rounded off here to AUD 100. Given that the annual bill without the proposed system is AUD 2700, the annual savings would be AUD 2800.
Therefore, the proposed system is cost-neutral (and actually slightly profitable). It is also grid-neutral in that there is a net export of electricity over the year. However, it is not grid-independent due to the need to import some electricity during part of the heating season (i.e., the winter).
There are two approaches to calculating the payback period, N. The simplest approach is:
where:
N = C/S
C = Initial Capital Cost (AUD);
S = Annual Savings (AUD/a).
It is usually more realistic to factor in percentage increases or decreases that affect the savings. In the present case, this is the annual increase in the price of electricity (i). The project will “pay off” when the initial capital cost is equal to the sum of the ever-increasing annual savings:
The payback period should properly only consider the cost that is in addition to what a homeowner would usually spend on a conventional system, i.e., the difference between the services proposed in this paper and a conventional system. A conventional system would typically consist of a DHW heater and tank (AUD 2000) and a split system or ducted gas heating (AUD 2000). Additionally, rooftop solar PV (AUD 4500 for this analysis) is so common now in Australia that it is arguably becoming a “standard” new-house feature. Thus, a conventional system costs about AUD 8500. The extra cost, i.e., the initial capital cost for this example, of the proposed system is the total cost in Table 5 (AUD 30,100) less this cost of a conventional system (AUD 8500), or AUD 21,600.
The simple payback period (Equation (7)) based on this cost of AUD 21,600 and the annual savings on the utility bill of AUD 2800 is 7.7 years for no annual change in the electricity price. If one assumes a 3% annual increase in the electricity prices (i = 0.03) (Equation (8)), this payback drops to 7.0 years.
In order to ensure there is no need to import any electricity from the grid over the course of a year (grid independence), the solar PV system size would have to be increased by 90% to 12.5 kW, leading to annual savings of AUD 4700. In this case, the simple payback period for the whole system (including the cost of the expanded solar PV system) would be 5.5 years. With a 3% annual increase in the electricity prices, the payback period is 5.1 years. However, there might not be enough suitably oriented and unshaded roof space for a 12.5 kW system (there is not on the case study home). Furthermore, some utility companies in Melbourne limit the size of grid-exporting rooftop solar systems to 10 kW.
There should be no significant additional maintenance costs compared to a conventional system given that most Australian homes have a heat pump for space conditioning, and a quarter of homes have solar PV—which does not require maintenance beyond occasionally hosing off accumulated dirt. The sealed TBs do not require maintenance over their lifetime. The only extra elements not found in a standard space conditioning system would be the low-power water circulation pumps, for which the maintenance cost (if any) would be expected to be small.
4. Discussion
It is acknowledged that these payback periods are sensitive to the values selected for the electricity and feed-in tariff rates as well as the assumed annual increase in the price of electricity. However, other choices within reasonable limits will not change the fact that the payback period for the system described in this paper will be of the same order of magnitude as the accepted periods for residential rooftop solar PV in Australia.
The typical payback periods for just a 5 kW solar PV system in Australia is 2 to 6 years, depending on: the location, fraction of generated power exported to the grid, feed-in tariffs and government subsidies [29]. Homeowners have already shown this range to be acceptable, given that rooftop solar has been installed on about a quarter of residences in Australia.
In order to achieve a comparable payback for the integrated system presented in this paper, government subsidies or rebates would be required. Since rebates for the solar PV and electrical batteries have already been included in the prices of Table 5, what is needed is either a subsidy for the system as a whole or, more realistically, one for the thermal batteries, which account for a quarter of the total system cost.
Following the success of government subsidies in promoting the installation of residential solar PV systems, some Australian states have in recent years introduced rebates for home electrical battery systems [30,31]. However, there is no known subsidy in Australia for thermal batteries. The justifications for subsidizing EBs are that they help reduce the reliance on the grid and non-renewable power, and they also protect the grid from feed-in overload by facilitating on-site storage at homes.
This paper shows that, as an integral part of a NZEB to facilitate the heating of a home, TBs provide the same benefits. They are just another way of storing energy from the solar PV array—but in a perhaps less well-understood or promoted fashion: via heat transfer rather than electrical charging. The authors believe that government rebates that apply to EBs should be extended to TBs.
It is a fair question to ask why one should invest in the relatively more expensive thermal batteries (based on the costs in Table 5) rather than just adding more electrical batteries to the proposed system. It is important to consider the cost per kWh of energy storage. Based on the effective capacity of 8.1 kWh for each thermal battery used in this case study, the cost is AUD 260/kWh. Assuming that energy stored in an electrical battery would be leveraged through an HP with a COP of 4, the cost of an electrical battery used to support a heating or cooling system is AUD 420/kWh (not including subsidies). Therefore, thermal batteries have an economic advantage (by about 40%) over electrical batteries.
Thermal batteries also have a longer lifespan. Sunamp claims its thermal batteries will experience no noticeable degradation to 10,000 cycles, which is equivalent to about 13 years of daily use of two full cycles per day [17]. The system proposed in this paper relies on one full cycle per day, meaning the TBs would be expected to last about 26 years. In contrast, lithium-ion electrical batteries are commonly reported to have a ten-year lifespan. Specifically, the capacity of such EBs is expected to degrade to 80% after 10 years or 3650 cycles [27].
Although this study proposed that cooling be delivered directly via a conventional HP split-system (a practical and easy option), a case could be made for thermal storage for cooling, with another water loop circulated partly through the piping used for the hydronic heating system. Although more complex, this would facilitate widespread and well-targeted distribution of cooling throughout the house. It could be enhanced with ideally located chilled beams.
5. Limitations
The main limitation of this study is that it is based on peak heating and cooling loads for the house. While this is useful for sizing the system, which is the main focus of this paper, it does not provide detailed information about the annual energy use and potential savings over the course of the year. That would require a dynamic hour-by-hour analysis over the course of a year. In this work, this was estimated with the assistance of utility bills for the case study house.
The house selected for the reference case is another limitation. The construction is typical for Australian houses built in the 1990s and over four decades before then, and the poorly insulated building envelope leads to significant thermal losses and gains over the course of the year. This makes the proposed building services system viable in terms of the payback period. With better built new stock housing, the payback periods would be expected to be longer. Regardless of when the reference house was built, this study is tied to a set of parameters for wall insulation, window types and window-to-wall ratios. It would be worthwhile exploring how the outcomes vary with these parameters.
This study is also limited by location: only Melbourne is considered. Of the eight capital cities in Australia, Melbourne is the only one in climate zone 6 (mild temperate) of the 9 climate zones defined by the Australian Building Codes Board [32]. Different outcomes for the design and payback period could be expected for the other cities. For example, in sunny Darwin, which lies only 12° below the equator, typically there is not a heating load requirement for houses, so the heating part of the host system would not be needed. Also, there would be much more sunshine available for electricity generation through the solar PV system.
The economic justification for this system, i.e., the payback period is strongly dependent on the prices to purchase electricity from the grid and the price to sell it to the grid (the latter being the feed-in tariff), is another potential limitation. The sensitivity of the payback to these variables is worthy of further investigation, set in the context of current and expected trends in electricity prices. This is particularly important given that, as noted earlier in this paper, some utility companies are reducing the feed-in tariffs or eliminating them altogether, effectively no longer allowing rooftop solar to be connected to the grid.
6. Conclusions
An integrated building services system has been investigated as a pathway to designing a residential NZEB. Several aspects are provided in this paper that demonstrate the merits of a unique service system design and its sizing:
- A low input energy (less than 1.0 kW) service system design that can run off a solar PV, batteries and thermal storage.
- A design from readily available off-the-shelf components and appliances.
- A simplified method which takes into account the utility bills of peak daily consumption for winter and summer periods.
- A design constrained by the solar PV system size and the heat pump input power as distinct from designing for peak hourly loads to obtain a system size.
- An investigation of a real case medium sized average insulated house in Melbourne Australia demonstrates that it is possible for the service system to meet the target of above-mentioned constraints.
The system provides space conditioning (heating and cooling) and DHW via heat pumps powered by a solar PV system. Electrical batteries are used to store the solar energy so that it can be delivered to the HPs in the early morning and in the evening hours. Thermal batteries consisting of PCMs are employed to store heat which is delivered to the building via a hydronic heating system. No such thermal storage is required for space cooling, because there should be more than enough solar energy or stored electricity to meet the cooling requirements. The system was sized for the case study of an actual single-storey detached home of modest size in Melbourne, Australia, for which the energy requirements were determined from utility bills.
As for the sizing of the proposed system, the design heating and cooling loads and DHW were met by the following:
- Heating and DHW provided by a highly efficient HP that operates on 0.9 kW of power and uses CO2 a as the refrigerant;
- Cooling provided by a conventional split-system HP that operates on 0.8 kW and delivers 6 kW of cooling;
- A 6.5 kW solar PV system;
- Four thermal batteries (each of 10.5 kWh rated capacity); and
- Eight electrical batteries (each of 1.2 kWh capacity).
The total cost is AUD 21,600 more than a conventional system, with an approximate payback of 7.0 years based on the annual utility bill savings and the expected annual increase in the electricity price. Although the system would be revenue-neutral (and in fact slightly profitable), it would require importing electricity from the grid during part of the heating season (but exports to the grid would exceed the imports). Grid independence would be achieved by expanding to a 12.5 kW solar PV system.
This paper has proven the thermodynamic feasibility of relying on renewable energy to provide mechanical services to a home of modest size and construction in Melbourne, Australia. The key design parameters have been identified. The next step is to perform a transient analysis (e.g., hour-by-hour) on the same case study and to consider more typical modern homes, e.g., current designs that meet the minimum energy rating of 6 stars (the national requirement) set in Melbourne and elsewhere in Australia. The transient analysis will consider the hourly impact of weather, as well as the effect of changing temperatures on the COP of the heat pump and the efficiency of the TBs. The goal of this further study will be to determine more exactly the energy savings and greenhouse gas emission reductions that could be attained by making such an integrated system part of the National Construction Code for all new builds, and by encouraging retrofits of existing houses with such a system.
Author Contributions
Conceptualization, M.B.L.; methodology, T.S. and M.B.L.; writing—original draft preparation, T.S.; validation, T.S. and M.B.L.; formal analysis, T.S., M.B.L., H.X.L. and P.H.; investigation, T.S., M.B.L., H.X.L. and P.H.; supervision, M.B.L.; writing—review and editing, T.S., M.B.L., H.X.L. and P.H. All authors have read and agreed to the published version of the manuscript.
Funding
This research received no external funding.
Data Availability Statement
The data presented in this study are available in this paper, with the exception of the supporting utility bills and PV generation reports for the case study house. Those bills and reports are not published here for reasons of privacy, but they are available on request from the corresponding author.
Conflicts of Interest
The authors declare no conflict of interest.
Nomenclature
| AUD | Australian dollars |
| BT | buffer tank |
| C | capital cost |
| CO2 | carbon dioxide |
| COP | coefficient of performance |
| Cp | specific heat capacity |
| DCL | design cooling load |
| DHL | design heating load |
| DHW | domestic hot water |
| E | Energy |
| ε | Efficiency |
| EB | electrical battery |
| HP | heat pump |
| HVAC | heating ventilating and air conditioning |
| i | price inflation |
| kWh | kilowatt-hour |
| m | Mass |
| N | payback period |
| NZEB | net zero energy building |
| PCM | phase change material |
| PEB | positive energy building |
| PV | Photovoltaic |
| Q | thermal energy |
| Q’ | rate of heat transfer |
| S | Savings |
| T | Temperature |
| TB | thermal battery |
| USD | United States dollars |
| W’ | Power |
Appendix A. Calculation Method
- Solar System Size SettingsRated output: 6.5 kWAverage output in July: 13 kWh/dayAverage output in January: 31 kWh/dayBattery storage: 10 kWh
- Heating Analysis (Winter)
- Estimation of design heating loadAverage hourly heat loss, Q’loss = 5 kWHours per day space heating operated, theat = 6 hDHL = (Q’loss)(theat) = 30 kWh/day
- Heat pump settingsCOP of heat pump operating in heating mode (heat house), COPheat = 4.9COP of heat pump operating in cooling mode (cool house), COPcool = 6.0Maximum hot water temperature, THW,max = 65 °C
- Effective Thermal capacity of TBs for heating
- PCM componentMaximum temperature, Tmax,PCM = THW,max − 2 °C = 63 °C (accounts for thermal resistances)Minimum temperature, Tmin,PCM = 45 °CVolume, VPCM = 78 LHeat capacity of solid phase, Cp,s = 4 kJ/L·KLatent heat of fusion, hsl = 289 kJ/LHeat capacity of liquid phase, Cp,l = 4.5 kJ/L·KMelting temperature, Tmelt = 58 °CCapacity of PCM = (VPCM) [(Cp,s)(Tmelt − Tmin,PCM) + (hsl) + (Cp,l)(Tmax,PCM − Tmelt)]
- Water componentMaximum temperature, Tmax,water = THW,max = 65 °CMinimum temperature, Tmin,water = Tmin,PCM + 2 °C = 47 °C (accounts for thermal resistances)Volume, Vwater = 0.01 m3Density at mean temperature, pwater = 986 kg/m3Specific heat at mean temperature, Cp,water = 4.18 kJ/kg·KCapacity of Water = pwater (Vwater)Cp,water (Tmax,water -Tmin,water)Capacity of battery (in kWh), QTB = (Capacity of PCM + Capacity of water)/3600 = 8.1 kWhNumber of TBs required, NTB = DHLt/QTB = 4 TBs (rounded up)Extra capacity in TB bank, TBextra capacity = QTBNTB − Qheat = 2 kWh
The need to round up for the number of batteries builds in an overcapacity of 2 kWh. This will offset thermal losses from the TBs in the total thermal requirement calculation below. - DHW TankVolume of water in tank, VDHW = 0.16 m3Changes per day, B = 1Maximum temperature, Tmax,DHW = 60 °CMains water temperature in June, Tmains = 13 °CDensity at mean temperature, pDHW = 991 kg/m3Specific heat at mean temperature, Cp,DHW = 4.18 kJ/kg·KHeat required for DHW (in kWh), QDHW = pDHW(VDHW)Cp,waterB(Tmax,DHW − Tmains)/3600 = 8.7 kWh
- Losses and EfficiencyTB loss, LossTB = 0.7 kWh/day per TBDHW tank loss, LossDHW = 5% or 0.4 kWh/dayBuffer tank loss, Lossbuffer = 5% or 0.4 kWh/dayBattery Efficiency, εbatteries = 96%
- PumpsTB Supply Loop Pump (between DHW & TB) 0.012 kW for 18 h/day consumes Psupply= 0.216 kWh/dayDHW Loop Pump (between TB & DHW) 0.012 kW for 18 h/day consumes PDHW= 0.216 kWh/dayHydronic Heating Loop Pump (between TB & space) 0.12 kW for 6 h/day consumes Phydronic = 0.72 kWh/day
- Total heat requiredQtotal,winter = (QTB NTB) + (LossTB NTB − TBextra capacity) + QDHW + LossDHW + Lossbuffer = 43 kWh/day
- Total electricity required (winter peak)Etotal,winter = (Qtotal,winter/COPheat + Psupply + PDHW + Phydronic)(εbatteries × 0.01) = 10.3 kWh/daySolar PV system sufficient to meet this need as average output in June is 13 kWh/day10 kWh electrical battery sufficient as that 13 kWh/day from the solar PV is cycled through it
- Cooling Analysis (Summer)
- Estimation of design cooling loadAverage rate of heat gain, Q’gain = 6 kWHours per day space cooling operated, tcool = 11 hDCL = (Q’gain)(tcool) = 66 kWh/day
- DHW TankSame procedure as above for heating but:Mains water temperature in January, Tmains = 21 °CDensity at mean temperature, pDHW = 992 kg/m3Heat required for DHW (in kWh), QDHW = pDHW(VDHW)Cp,waterB(Tmax,DHW − Tmains)/3600 = 7.2 kWhDHW tank loss, LossDHW = 5% or 0.4 kWh/dayIn the summer: TBs not used so no losses from there; and fluid circuit pumps not operated.
- Total electricity required (peak summer)Etotal,summer = [(DCL/COPcool) + (QDHW + LossDHW)/COPheat](εbatteries) = 13 kWh/daySolar PV system sufficient to meet this need as average output in January is 31 kWh/day10 kWh electrical battery sufficient to meet needs in evening.
References
- Stauffer, Y.; Koch, N.; Hutter, A.; Pflugradt, N.D. Quantifying the Potential of Smart Heat-Pump Control to Increase the Self-Consumption of Photovoltaic Electricity in Buildings. 2018. Available online: http://proceedings.ises.org/paper/eurosun2018/eurosun2018-0158-Stauffer.pdf (accessed on 27 August 2021).
- Sánchez, C.; Bloch, L.; Holweger, J.; Ballif, C.; Wyrsch, N. Optimised Heat Pump Management for Increasing Photovoltaic Penetration into the Electricity Grid. Energies 2019, 12, 1571. [Google Scholar] [CrossRef] [Green Version]
- Beck, T.; Kondziella, H.; Huard, G.; Bruckner, T. Assessing the influence of the temporal resolution of electrical load and PV generation profiles on self-consumption and sizing of PV-battery systems. Appl. Energy 2016, 173, 331–342. [Google Scholar] [CrossRef]
- Beck, T.; Kondziella, H.; Huard, G.; Bruckner, T. Optimal operation, configuration and sizing of generation and storage technologies for residential heat pump systems in the spotlight of self-consumption of photovoltaic electricity. Appl. Energy 2017, 188, 604–619. [Google Scholar] [CrossRef]
- Luthander, R.; Widén, J.; Nilsson, D.; Palm, J. Photovoltaic self-consumption in buildings: A review. Appl. Energy 2015, 142, 80–94. [Google Scholar] [CrossRef] [Green Version]
- Torregrosa-Jaime, B.; Gonzalez, B.; Martínez, P.J.; Payá-Ballester, G. Analysis of the Operation of an Aerothermal Heat Pump in a Residential Building Using Building Information Modelling. Energies 2018, 11, 1642. [Google Scholar] [CrossRef] [Green Version]
- Xiao, B.; He, L.; Zhang, S.; Kong, T.; Hu, B.; Wang, R. Comparison and analysis on air-to-air and air-to-water heat pump heating systems. Renew. Energy 2020, 146, 1888–1896. [Google Scholar] [CrossRef]
- Maleki, A.; Rosen, M.A.; Pourfayaz, F. Optimal Operation of a Grid-Connected Hybrid Renewable Energy System for Residential Applications. Sustainability 2017, 9, 1314. [Google Scholar] [CrossRef] [Green Version]
- Heat Pump Association, UK, 2019 Delivering Net Zero: A Roadmap for The Role of Heat Pumps. Available online: https://www.heatpumps.org.uk/resources/ (accessed on 25 June 2021).
- Guertler, P. Getting on Track to Net Zero Ten Million Heat Pumps for Homes by 2030; E3G: London, UK, 2020. [Google Scholar]
- Vaishak, S.; Bhale, P.V. Photovoltaic/thermal-solar assisted heat pump system: Current status and future prospects. Sol. Energy 2019, 189, 268–284. [Google Scholar] [CrossRef]
- Energy Rating—Space Heating and Cooling. Available online: http://www.energyrating.gov.au/products/space-heating-and-cooling (accessed on 2 December 2020).
- Kolokotsa, D.; Rovas, D.; Kosmatopoulos, E.; Kalaitzakis, K. A roadmap towards intelligent net zero- and positive-energy buildings. Sol. Energy 2011, 85, 3067–3084. [Google Scholar] [CrossRef]
- Fabrizio, E.; Seguro, F.; Filippi, M. Integrated HVAC and DHW production systems for Zero Energy Buildings. Renew. Sustain. Energy Rev. 2014, 40, 515–541. [Google Scholar] [CrossRef]
- Bureau of Meteorology Climate Statistics for Australian Locations. Available online: http://www.bom.gov.au/climate/averages/tables/cw_086071.shtml (accessed on 2 December 2020).
- Sunamp—UNIQ Heat Batteries Reference Manual V2.3. Available online: http://www.sunamp.com/wp-content/uploads/2019/01/UniQ-Heat-batteries-reference-manual-ver_20180719_v2.3.pdf (accessed on 2 December 2020).
- Sunamp—Specialists in Thermal Energy Storage. Available online: https://www.sunamp.com/wp-content/uploads/2021/06/Sunamp-Brochure-May-2021-Artwork-LO-RES.pdf (accessed on 28 August 2021).
- Phase Change Products Pty Ltd.; West Perth, Australia. Personal communication with M.B. Luther, 2019.
- Bubleshop Sunamp UniQ E—Dual (Heating & Hot Water Storage). Available online: http://www.bublshop.co.uk/sunamp-uniq-e-dual-heating-hot-water-storage/p2040 (accessed on 3 June 2019).
- Sanden—Sanden Leading Hot Water Technology. Available online: http://www.newgensolar.com.au/heat-pump-hot-water/sanden-eco-heat-pump-hot-water-system.html (accessed on 2 December 2020).
- Pioneer_Aircon.pdf; Pioneer International Pty Ltd.: Minto, Australia, 2021.
- Moran, M.J.; Howard, N.; Shapiro, D.D.; Boettner, M.B.B. Fundamentals of Engineering Thermodynamics, 9th ed.; Wiley: Hoboken, NJ, USA, 2018. [Google Scholar]
- Standards Australia. AS/NZS 3823.2:2013 Performance of Electrical Appliances—Air Conditioners and Heat Pumps, Part 2 Energy Labelling and Minimum Energy Performance Standards (MEPS); Standards Australia: Sydney, Australia, 2013. [Google Scholar]
- Design Conditions for Melbourne, Australia. Available online: http://cms.ashrae.biz/weatherdata/STATIONS/948680_s.pdf (accessed on 2 December 2020).
- Sanden—Sanden SANCO2 Heat Pump Water Heater Technical Information. Available online: https://www.sandenwaterheater.com/sanden/assets/File/Sanden_sanc02_technical-info_10-2017_4.pdf (accessed on 3 June 2019).
- Sunamp—Sunamp and Trina Solar Sign MoU to Collaborate on Energy Saving Solution for Global Market. Available online: https://www.sunamp.com/sunamp-and-trina-solar-sign-mou/ (accessed on 2 December 2020).
- Enphase—Enphase AC Battery. Available online: https://www4.enphase.com/sites/default/files/downloads/support/ACBattery-DS-EN-UK.pdf (accessed on 28 August 2021).
- Bors, J.; Kenway, S. Water Temperature in Melbourne and Implications for Household Energy Use. Available online: https://www.waterportal.com.au/swf/images/swf-files/9tr1--001-water-energy-carbon-links_bors_2014_water_temperature_and_implications_for_household_energy_use.pdf (accessed on 29 August 2021).
- Solar Panel Payback Times. Available online: https://www.choice.com.au/home-improvement/energy-saving/solar/articles/solar-panel-payback-times (accessed on 2 December 2020).
- Solar Victoria—Solar Battery Rebate. Available online: https://www.solar.vic.gov.au/solar-battery-rebate (accessed on 2 December 2020).
- South Australia Government—Solar Photovoltaic Systems and Battery Storage. Available online: https://www.sa.gov.au/topics/energy-and-environment/energy-efficient-home-design/solar-photovoltaic-systems (accessed on 2 December 2020).
- Australian Building Codes Board—Climate Zone Map Australia. Available online: https://www.abcb.gov.au/resource/map/climate-zone-map-australia (accessed on 18 August 2021).
Figure 1.
Energy flows in the electrical, heating and cooling systems.

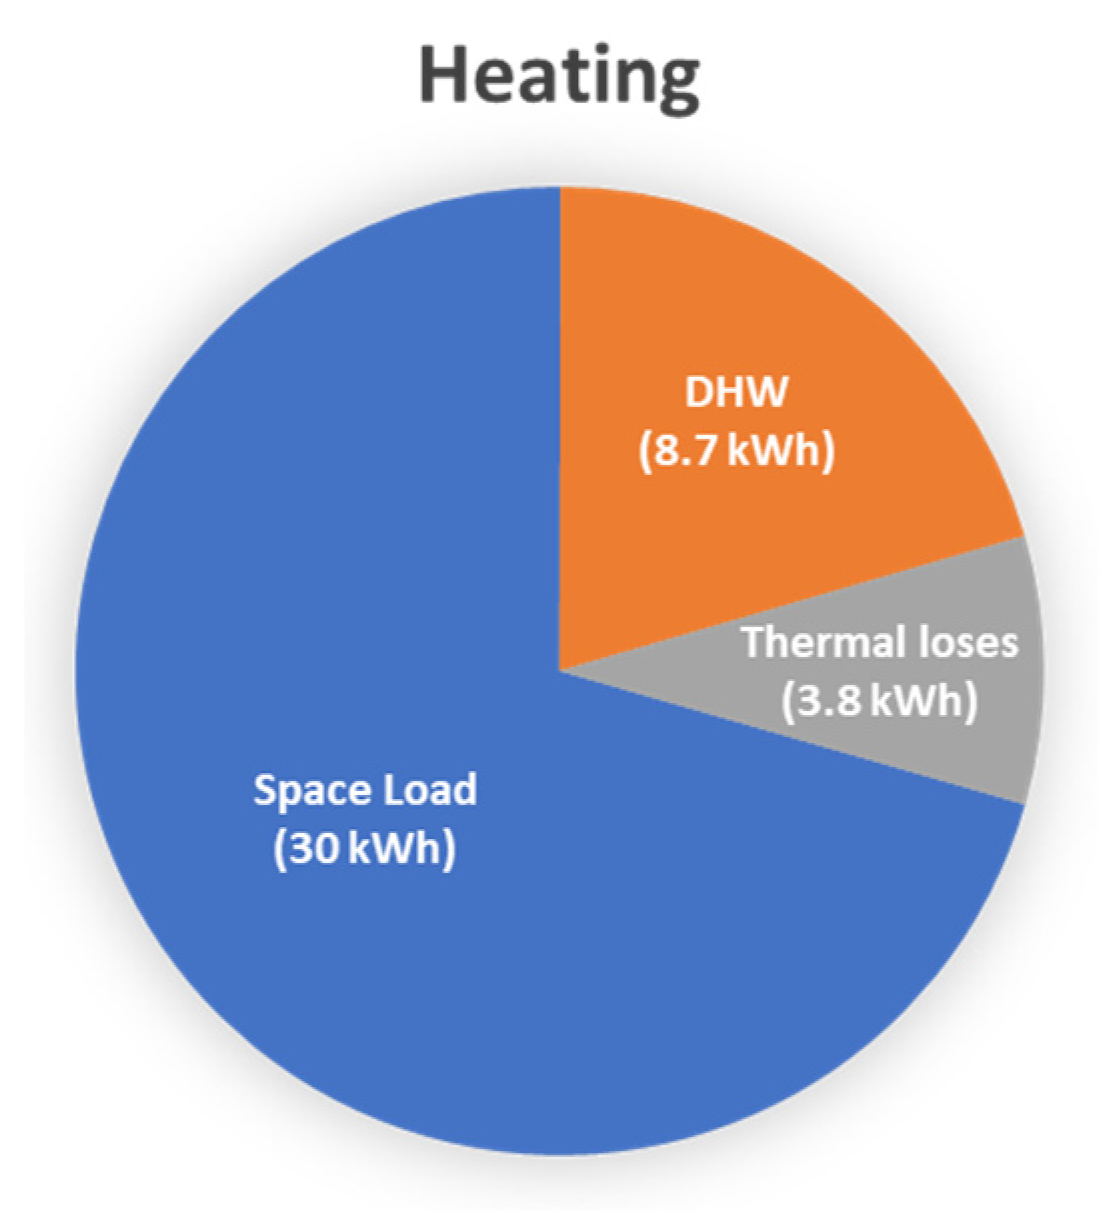
Figure 2.
The daily thermal energy demands for the building services system in the heating season.

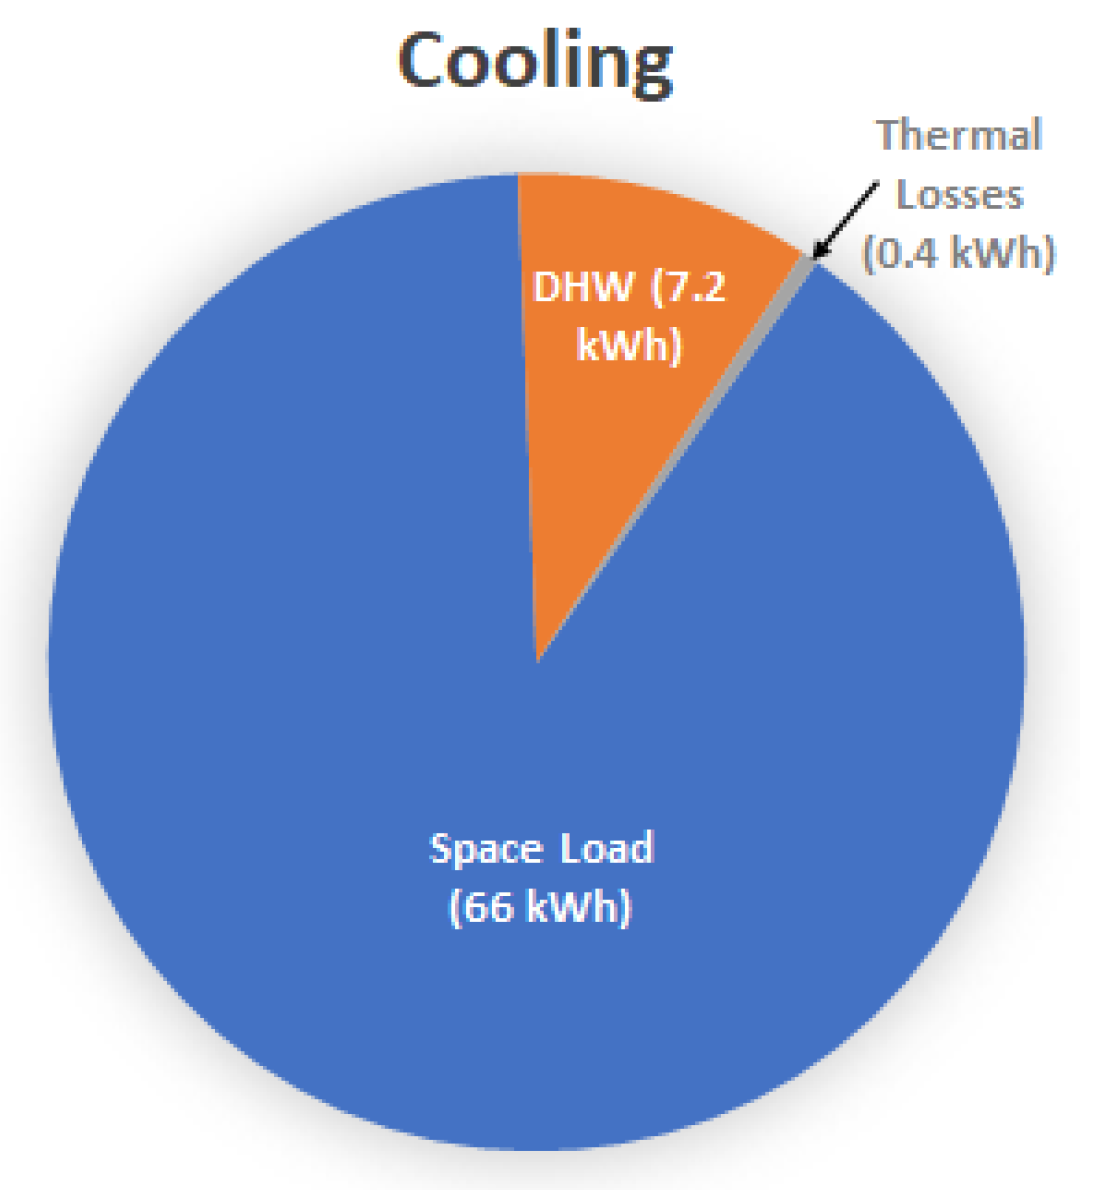
Figure 3.
The daily thermal energy demands for the building services system in the cooling season.


| Item | Heating Process | Cooling Process |
|---|---|---|
| Name | SU58-UniQ9 | SU11-UniQ9 |
| Volume of PCM (L) | 78 | 78 (assumed) |
| Tminimum (°C) | 45 | 6 |
| Tmelting (°C) | 58 | 11 |
| Tmaximum (°C) | 85 | 16 |
| Energy stored (kW·h) | 10.5 | 3.8 (calculated) |
| System | COP | At Test Temperatures | Adjusted for Design Operating Temperatures |
|---|---|---|---|
| Sanden Eco® plus | COPheating | 5.6 | 4.9 |
| Pioneer WB-18 5.1 kW | COPcooling | 6.1 | 6 |
| System | Test Temperatures | Operating Temperatures | ||
|---|---|---|---|---|
| TH | TC | TH | Tc | |
| Heating: Sanden Eco® plus | 65 | 24 | 65 | 6 |
| Cooling: Pioneer WB-18 | 35 | 27 | 32 | 25 |
Table 4.
System requirements for design heating and cooling loads. Energies are per day.
| Item | Heating | Cooling |
|---|---|---|
| Space thermal energy load (kWh/day) | 30 | 66 |
| DHW energy required (kWh/day) | 8.7 | 7.2 |
| Thermal losses (kWh/day) | 3.8 | 0.4 |
| Thermal energy required (kWh/day) | 43 | 74 |
| Electrical energy required (kWh/day) | 10 | 13 |
| TB quantity | 4 | None |
| EB quantity | 8 | 8 |
| Solar PV system size (kW) | 6.5 | 6.5 |
| Sanden Eco® plus heating system | Yes | No |
| Pioneer cooling system (6 kW) | No | Yes |
Table 5.
System costs.
| Item | Cost (AUD) |
|---|---|
| CO2 Heat pump & buffer tank (160 L) | 3000 |
| Thermal batteries for heating (4) | 8400 |
| Electrical batteries (8) | 11,800 |
| Domestic hot water tank (160 L) | 400 |
| Solar PV system (6.5 kW) | 4500 |
| Split system for cooling (5 kW) | 2000 |
| Total | 30,100 |
Publisher’s Note: MDPI stays neutral with regard to jurisdictional claims in published maps and institutional affiliations. |
© 2021 by the authors. Licensee MDPI, Basel, Switzerland. This article is an open access article distributed under the terms and conditions of the Creative Commons Attribution (CC BY) license (https://creativecommons.org/licenses/by/4.0/).
Share and Cite
MDPI and ACS Style
Simko, T.; Luther, M.B.; Li, H.X.; Horan, P. Applying Solar PV to Heat Pump and Storage Technologies in Australian Houses. Energies 2021, 14, 5480. https://doi.org/10.3390/en14175480
AMA Style
Simko T, Luther MB, Li HX, Horan P. Applying Solar PV to Heat Pump and Storage Technologies in Australian Houses. Energies. 2021; 14(17):5480. https://doi.org/10.3390/en14175480
Chicago/Turabian StyleSimko, Tom, Mark B. Luther, Hong Xian Li, and Peter Horan. 2021. "Applying Solar PV to Heat Pump and Storage Technologies in Australian Houses" Energies 14, no. 17: 5480. https://doi.org/10.3390/en14175480
Note that from the first issue of 2016, this journal uses article numbers instead of page numbers. See further details here.