1. Introduction
This article presents the results of industrial-scale measurements to explain the differences between gas and coal powered grain dryer energetic efficiency and the cost of operation. Grain drying is a process that has been developed around the world, and the search for primary energy savings was a key argument to perform research on the similar devices using different fuel at an industrial scale.
Grain drying is the process of removing moisture by evaporating the water contained in the material. It is a complex thermodynamic process involving heat and mass transfer. Heat reaches the grain to reduce its moisture content, and the mass, in the form of water vapor, is transferred from the material to the surrounding drying air. It guarantees stability and achieves an appropriate material shelf life, facilitating further processing like storage or commercial use [
1,
2,
3].
To prepare grain storage, it must be dried to the appropriate moisture content. Usually, air with low relative humidity is used for drying [
4]. The drying process can take place using adsorption beds, cooling processes, or hot air. The choice of the appropriate method depends on the material and drying temperature [
5]. Due to different temperature levels, the process is divided into two methods: low-temperature drying, which consists of the passing air at a temperature comparable to the actual ambient temperature through a fixed bed of grain, and high-temperature drying.
High-temperature drying is the most energy-consuming process in the production process of obtaining cereal grains for sale or processing. It requires the right temperature, which mainly depends on the moisture content of the seeds–the higher the moisture content, the lower the drying temperature. It is necessary to provide hot air to conduct the process. For this purpose, among others, gas or oil burners or biomass or coal furnaces can be used. The bed is exposed to a high air temperature and is heated, and heat and mass transfer then takes place. After the bed passes through the drying column, the previously used, moist air is discharged through the chimney located in the upper part of the dryer [
6].
Currently, the most common type of high-performance dryer in the agricultural sector is a continuous flow dryer. These constructions are intended for the drying of all types of cereal grains, including maize as well as legumes and oilseeds (rape, sunflower). Thanks to its high capacity, they are used on large farms and in companies dealing in the purchase, storage, and trade of grain. Continuous flow dryers are adapted for uninterrupted work throughout the entire drying campaign. Thanks to the applied automation, the dryer maintains the given drying parameters at a constant level, and the technical and technological solutions that are used are able to achieve low fuel consumption rates.
Continuous flow dryer constructions are usually made in the form of three rectangular chambers. A gaseous drying agent is introduced into the interior through one of them. The second column removes moist, used air outside the dryer. Between the columns, there is the third column—the drying section. This column, from top to bottom, alternates with cascades (roofs), ensuring good contact between the material and the drying agent. The canopies are arranged in rows, and grain or seeds move between them. Drying air is supplied to every second row of canopies. After passing through the grain layer, the used air is discharged through the next row of roofs, and the second column is removed. The drying air only passes through the grain layer between the two rows of canopies. The grain layer does not exceed 20 cm. Due to its cascade construction, the dryer works in a mixed grain flow system. It can be said that these mixed-flow facilities operate in a quasi-stationary operating mode. In this case, the grain remains stationary during almost the entire drying process. The period between two unloadings usually lasts several minutes, while the unloading time—the period for which the unloading device is open—is only a few seconds. In these dryers, air and dried grain are simultaneously moved through the dryer column in co-current, counter-current, and transverse flow modes [
7]. According to many authors [
8,
9], this mixed flow method is the most typical for canopy dryers.
The principle of operation for the simplest roof drier is as follows: moist grain is supplied to the hopper buffer located at the top of the middle column, and dry grain is collected by a selection element (it is most often a redler conveyor) located at the bottom of the same column. To heat the drying air (some versions use an oven with a heat exchanger), cold outside air is blown into the hot air duct, where it mixes with the exhaust gas created by gas combustion. To homogenize the gas temperature, at least two blades (baffles) are placed in the channel above the burner, which disturbs the free flow and contributes to the mixing of cool air streams with hot ones. The mixed gases are directed to the grain heating zone, which is located in the central column of the dryer. The air passing through a layer of wet grain heats it and collects the moisture. This is possible because the column with the grain has many channels (inlet and outlet canopies), the task of which is to supply hot air and to drain moisture from the grain. The moist air is then directed to the exhaust outlet duct, where the exhaust fan removes it from the dryer. In specific portions dried grain, is moved by gravity down the column towards the bottom, where there is a conveyor that receives the grain in cycles. The grain at the bottom is dry (12–14%) but hot, which is why before leaving the dryer, it is cooled in the cooling zone with cold outside air. Because the outlet duct has negative pressure, cold outside air is sucked into the cooling zone, and after passing through a layer of hot grain, it is drawn into the outlet duct.
For the past fifty years, manufacturers of drying equipment have been paying more and more attention to the energy consumption of their products, both for environmental causes and concerning reasons regarding the high cost of energy. It is estimated that about 40% of the grain in Polish climate conditions requires drying after harvest [
10], and this operation is very energy-consuming. In corn production, about 60% of the total energy of the harvesting process is used for drying [
11,
12].
This topic is very important given the depletion of fossil fuels. Industry estimates of economically viable fossil fuels indicate that the existing worldwide reserves of hard coal, natural gas, and oil will be sufficient for 132 years, 50 years, and 50 years, respectively [
13]. It is therefore necessary to rationally use the energy produced from these sources.
The energy intensity that is analyzed in the article is the inverse of energy efficiency (when energy efficiency increases, energy intensity decreases), which is defined in the so-called EED Directive as amended. Energy efficiency is also defined in the Energy Efficiency Act of May 2016 [
14], in which it is stated that “energy efficiency is the ratio of the obtained effect value of a given object, technical device or installation, under typical conditions of use or operation, up to the amount of energy consumed by the object, technical device or installation, or as a result of the service necessary to achieve this effect.” In the case of the research subject, energy consumption was defined as the inverse of energy efficiency, which is the ratio of evaporated water per ton of grain (utility effect) to the total amount of final energy (including fuels and electricity).
The energy consumption of cereal grain dryers is high. For example, when operating a small industrial dryer with a capacity of 1 MW, to reduce grain moisture by 10% in 1 h, 60–70 m
3 of natural gas (high-methane gas) needs to be burned, according to our own measurements made for several 1 MW dryers. In addition to the types of fuels used to heat the drying medium, there are also dryers fired with coal or wood. The most rational fuel seems to be the use of gas, due to the fact that it has the lowest pollution impact on the environment with regard to exhaust gases (which will be subject to discussion in the Conclusion section) and the ease of automating the process of device operation. In the case of coal-fired dryers, the main argument for choosing this fuel is its low cost and further prospects of its use. After meeting the requirements of PN-EN 303–5: 2012 and the Regulation of the Minister of Development and Finance from 1 August 2017 ordering that only boilers meeting the 5th emission class be placed on the market as well as the EU Eco-design Directive introduced in 2020, there will soon be no contraindications for the use of dryers coal as fuel [
15,
16,
17].
Years ago, in determining the energy consumption of the grain dryer, scientists did not take electricity consumption into account, so their results were not entirely reliable for the recipient. As an example, Jokiniemi et al. [
18] did not include it in their paper about the energy efficiency of the grain drying process. They only took the heat consumption of the device into consideration. Over time, scientists began to consider including electricity consumption in the energy balance of an agricultural dryer. Thus, in their paper, Delgado-Plaza et al. [
19] estimated the energy consumption (including fuel and electricity) of the rice and corn drying process in the equatorial zone. They assessed 49 rice dryers and 14 yellow corn dryers powered by LPG and biomass. The researchers presented the effect of oversizing the fan/extractor on high energy consumption. Moreover, in the manuscript, they determined the drying productivity index. It was very low in dryers using LPG (0.14 dollar∙quintal
−1 for rice and 0.27 dollar∙quintal
−1 for corn), while when using biomass fuel, the index reached a value of 1.4 dollar∙quintal
−1.
The structure of this paper is as follows:
Section 1 includes information on the drying process and dryers used in industry.
Section 2 presents standard and additional research (like flue gas analyses) that are part of a comprehensive approach elaborated on for a research project.
Section 3 contains the test results for both dryers that are calculated in accordance with the proposed tool.
Section 4 is a discussion summarizing the research outcomes.
2. Materials and Methods
In the drying processes used in agriculture, energy consumption is expressed in the unit: MJ·(Mg·%)−1, which is not optimal from a scientific point of view because this numerical value will change from 20% to 18% and from 18% to 16% during the grain drying process. According to approach proposed in this paper, grain was selected to ensure the same moisture content in both devices.
This study aims to determine the amount of energy required for the drying process in an industrial dryer based on a comprehensive approach. Moreover, this manuscript includes a comparative analysis of gas emissions (O2, CO, CO2, NOX,) from agricultural grain dryers.
A low calorific value of the hard coal used during the measurements was 24.2 MJ·kg−1. According to information given by one of the grate boiler producers, it is the upper value for energetic coal that is dedicated for grate furnaces. The content of volatile matter was 38.0 ± 0.6%. In a gas-powered grain dryer prophane with low calorific value, 43.0 MJ·kg−1 was used.
2.1. Description of Research Objects
Continuous flow dryers are intended for drying grain of all types of cereal grains, rapeseeds, and legume seeds. They are used both in the farms involved in the production of grain and seeds as well as in companies that deal with the purchase, marketing, and processing of grain.
The tests that were conducted concerned two industrial drying facilities. Both commercially manufactured drying installations had identical construction. The difference was in different systems of heating the drying medium using different fuels. In the first facility, LPG gas was used as fuel (dryer type S428 CS), and a hard coal was used in the other (dryer type DT 2532).
The gas was burnt in a linear burner, and the flue gas was mixed directly with the drying air, while coal was burnt in a grate furnace, and the flue gas heated the drying medium through a heat exchanger.
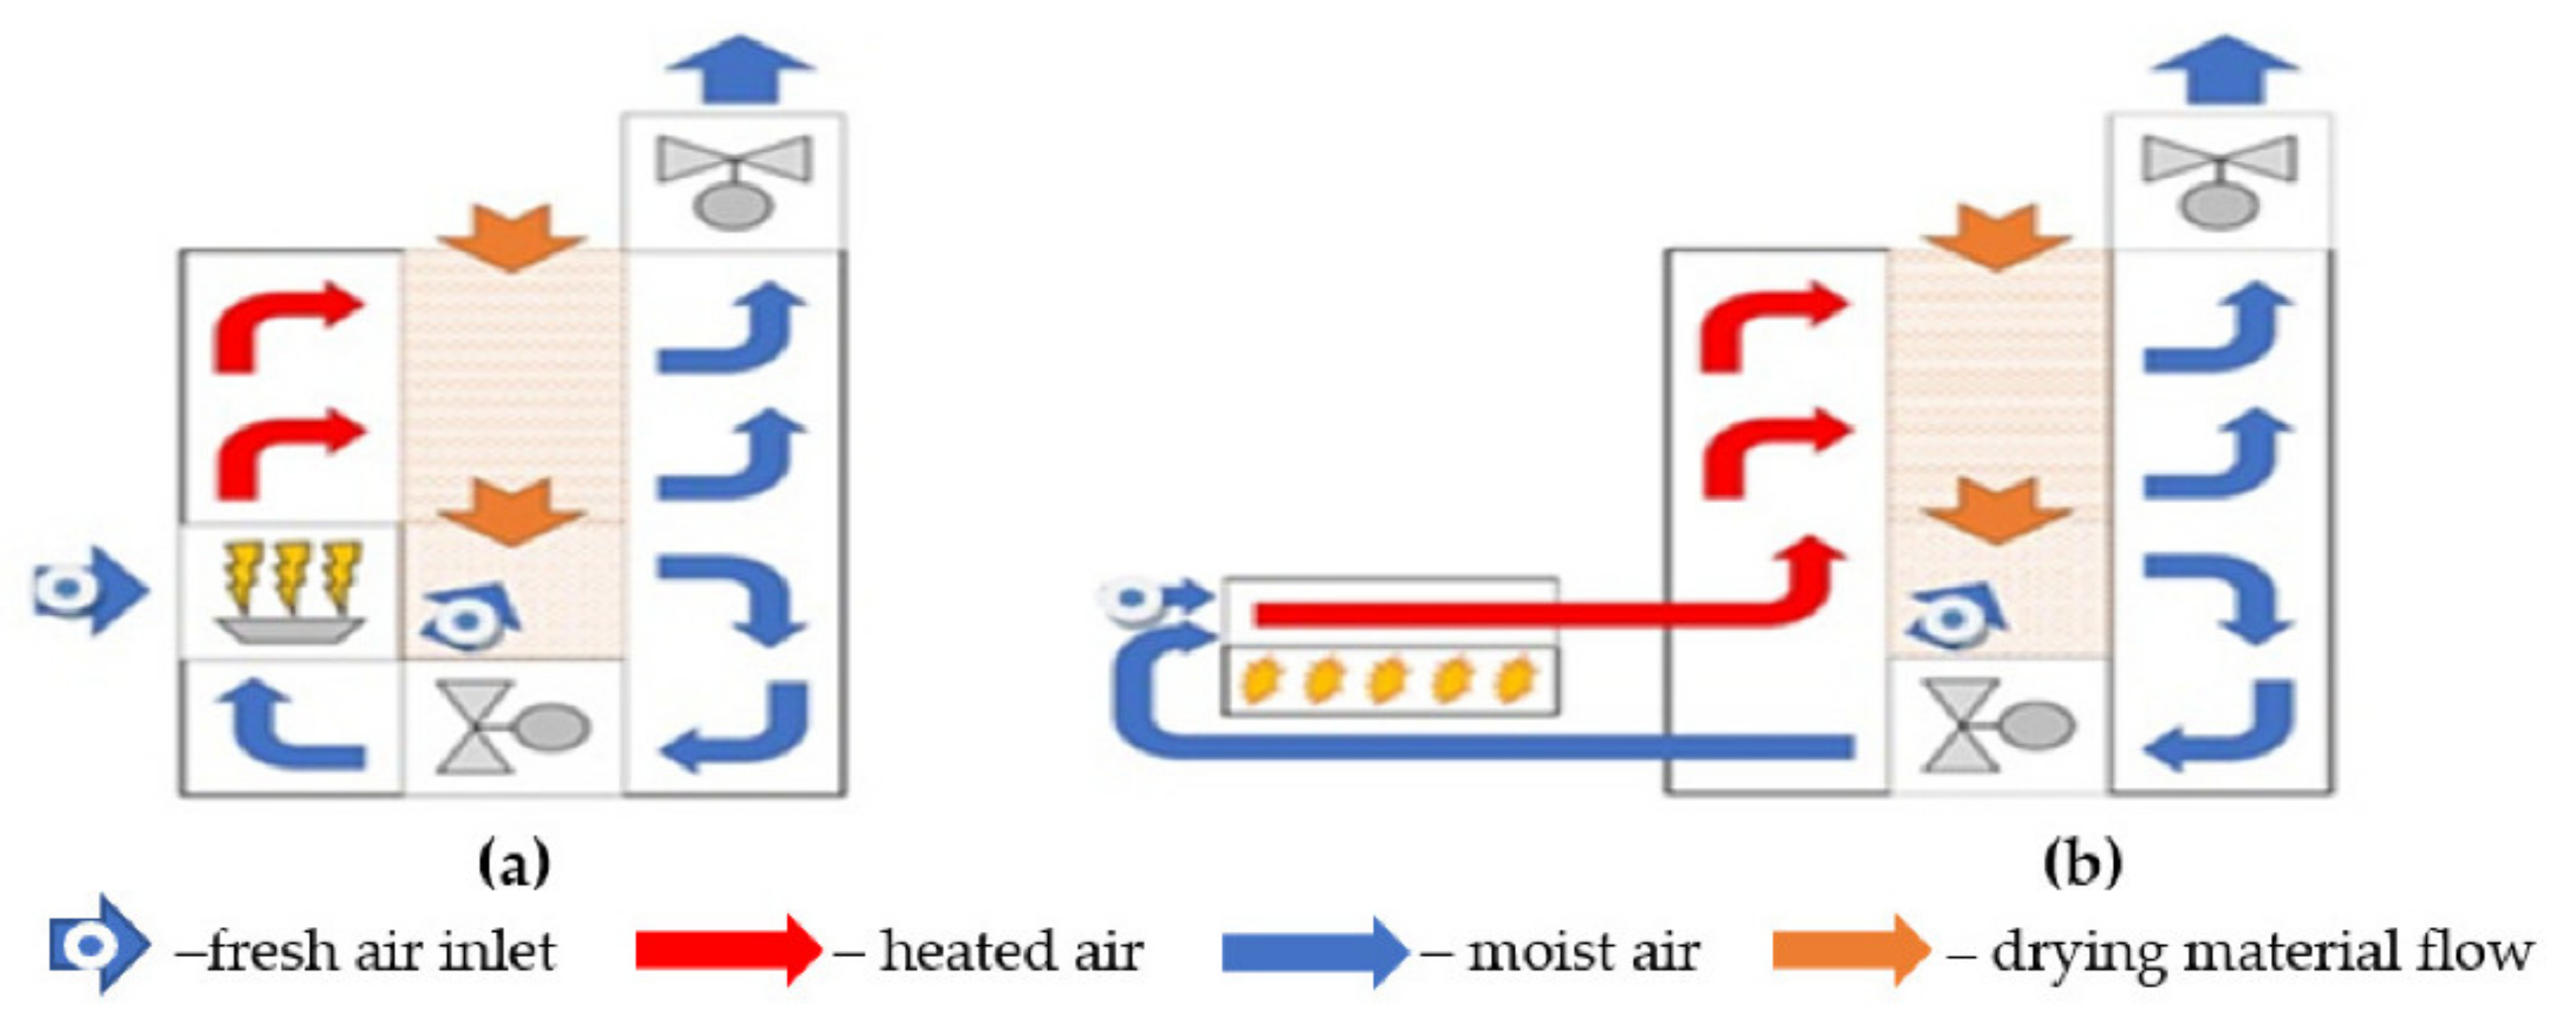
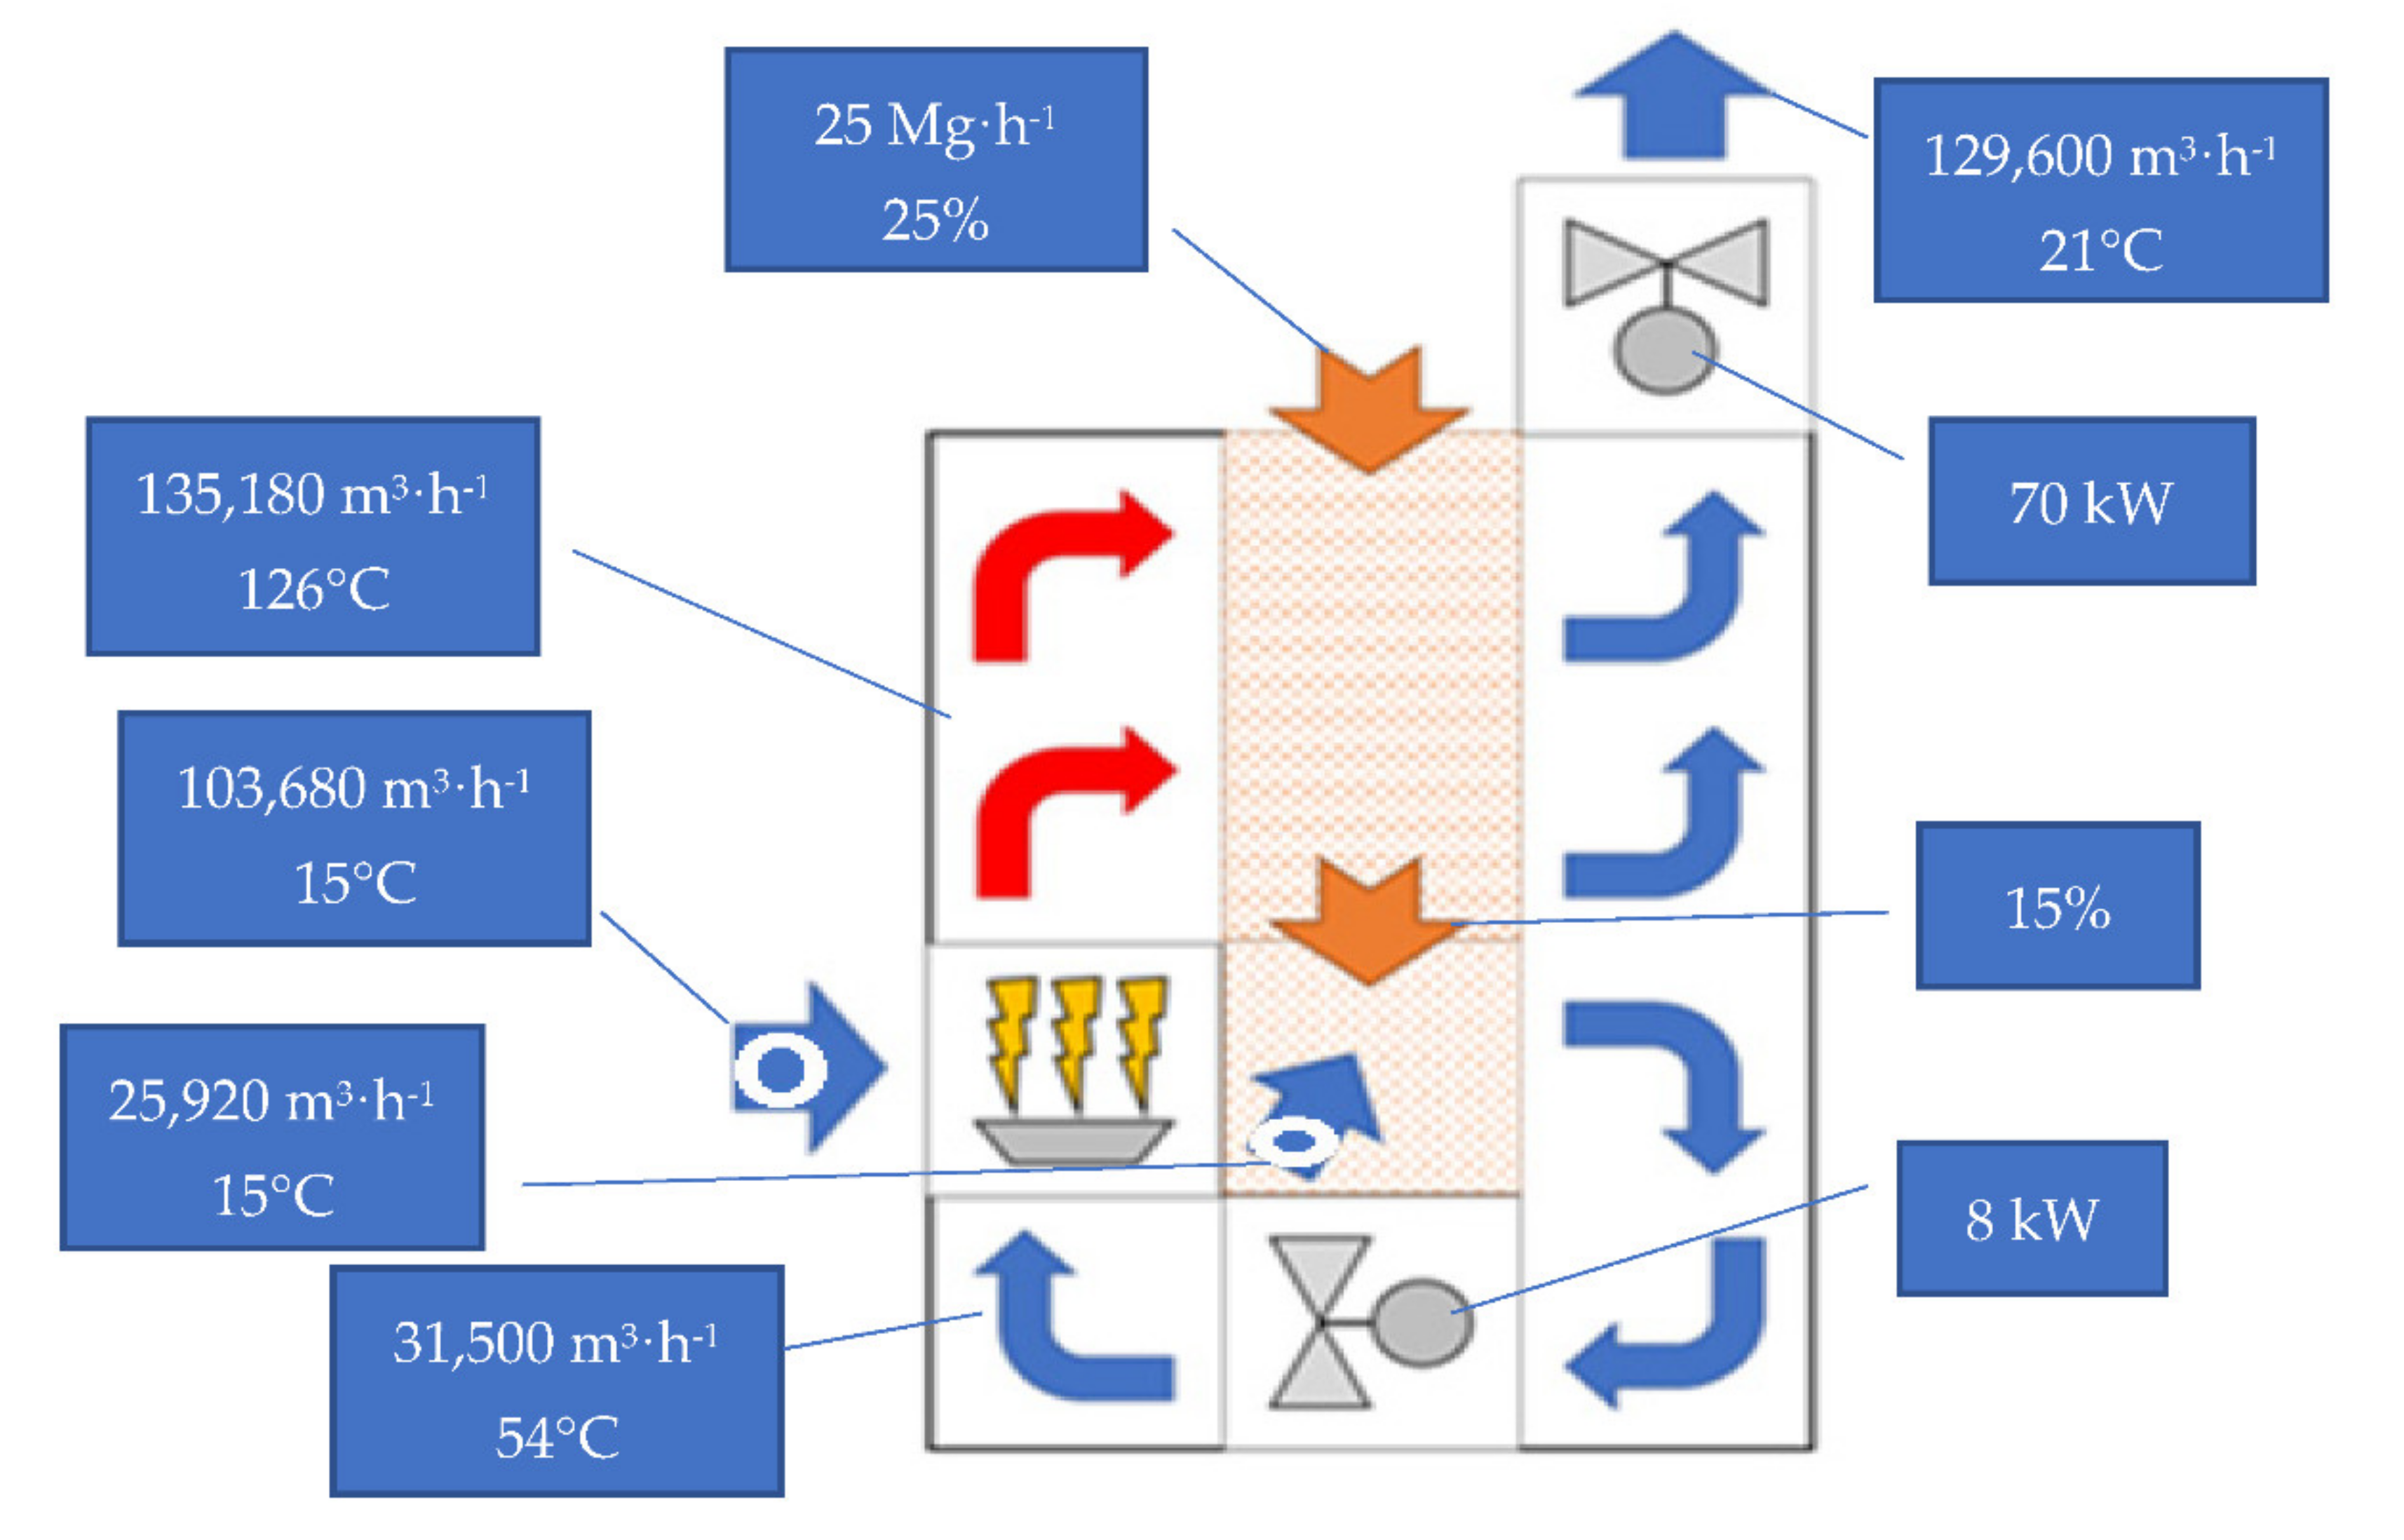
A diagram of the tested dryers is shown in
Figure 1. Orange arrows represent the drying material flow. The red and blue arrows present the drying gas flow. The red arrows are for the hot drying medium being heated by the heat source, while the blue arrows are for cold air (<40 °C).
Moist drying material (orange arrows) is fed from the top of the device, and the dried material is collected from the bottom. During normal operation, the entire drying column is covered with raw material. The drying process involves the forced flow of drying gases through the drying column. The structure of the drying column in which the roofs are the main element is designed in such a way that the drying medium flows evenly through the entirety of the dried material.
Air is supplied to the dryer from two places. The first stream of the drying medium is used for drying. In a gas dryer, it is also an oxidant during the combustion process, while in a coal dryer, it goes to the flue gases–air heat exchanger. The second stream of ambient air is used to lower the temperature of the dried material in the lower zone of the drying segment. Cooling the grain enables its safe transport and the storage of dried material.
After passing through the dried material, the drying medium is separated into two streams. Air containing moist, used air coming from the upper part of the dryer is ejected by the discharge fans to the areas outside of the dryer. Some air, which mainly comes from the cooling process, is recycled at the beginning of the process and mixed with the air fed to the combustion, or the air–flue gases exchanger. The recirculated air is characterized by low humidity but that also has a temperature that is higher than the outside air fed to the burner or the furnace combustion chamber because it comes from cooling the dried material. This additionally carried portion of energy reduces the energy consumption of the entire drying process.
The dryer was equipped with 5 fans forcing gas flow through the column. Three fans were used to throw moist air outside, while the other two served as a recirculation system for some drying gases to improve the energy efficiency of the process. An additional fan was used for the coal stove, which supplied heat for drying. This fan was used to supply air to the furnace combustion chamber. All fans were working during the tests.
Basic information about the tested dryers is summarized in
Table 1.
According to data shown in the
Table 1, the conclusion that both types of dryers are comparable can be made. The unit powered with coal had a slightly higher efficiency than maize and lower than wheat. This can be explained by the fact that coal has a higher theoretical combustion temperature, which is useful for corn, and the dryer has a different construction (mainly number of ventilators). The energy consumption was higher for the coal powered unit because additional devices for coal transportation were required.
2.2. Flue Gas Measurements
Measurements of O
2, CO, CO
2, NO
X, and gas temperature were carried out using the Madur Photon automatic portable exhaust gas analyzer equipped with an NDIR sensor (nondispersive infrared sensor), a paramagnetic sensor for oxygen, and a chemiluminescence NO
x measurement attachment. The analyzer measuring parameters are summarized in
Table 2.
Based on the results, the excess air coefficient λ was calculated according to the relationship [
20]:
where
—excess air coefficient, (−);
—oxygen content in the flue gases, (%).
The measurement results were converted to a standard oxygen content of 3% when burning gaseous fuels following the relationships [
20]:
where
—share of component A calculated on 3% oxygen, (ppm);
—measured share of component A, (ppm);
—measured oxygen content, (%).
When combusting solid fuels, calculations were made according to analogous formulas for a standard oxygen content of 6%.
To make the comparison of the measured emissions with the requirements of the applicable regulations possible, the content of individual pollutants have been converted from ppm to mg·m
−3 n (for normal cubic meter at 1 atm, 0 °C) according to the relationships
where
—share of component A, (mg·Nm
−3);
—share of component A, (ppm).
2.3. Electricity Measurement
Electricity consumption and its parameters are an essential share in the energy balance performed for individual dryers. According to the adopted approach, the basis for developing the results are:
The regulations of the Minister of Economy from 4 May 2007 on the detailed conditions for the operation of the power system [
21];
The standards of PN-EN 50160: 2010 “Parameters of supply voltage in public power networks” [
22].
The measurements were made using network performance analyzers. Sonel’s PQM-700 analyzers were used for the project BioStrateg3/344490/13/NCBR/2018 “Developing of innovative air purification methods for grain and seed drying, along with pollutant emissions reduction—ECO-Dryer”. The parameters registered by this device at a specified time interval are presented in
Table 3.
2.4. Flow Measurement
The measurement of the gas stream (volumetric q
v, m
3·h
−1, and mass q
m, kg·h
−1) using PN-ISO 5221:1994 “Air distribution and air diffusion–rules to methods of measuring air flow rate in an air handling duct” [
23] was performed using Prandtl probes at points determined by the log-Chebyshev method for circular and rectangular cross-section conductors. For both dryers, the composition of the flue gases was measured taking the object specifications into account. In the case of a gas-powered dryer, the measurement was made directly above the gas burner. The composition of the flue gas in the coal dryer was conducted just behind the exchanger and in front of the stack. The coal furnace was a sealed device, therefore there was no need to take measurements from directly behind the furnace because the air intake was minimal. In the case of a gas burner, the measurement had to be conducted directly behind the burner. This is because the rest of the flue gas devices mix with air to form a drying gas. Conducting measurements after the gases mixed would distort the result.
2.5. Determining the Energy Balance
The direct method means taking the final energy consumption into account, which is expressed in kWh or kJ, and comparing it with:
The power of individual carriers expressed in kW. The carriers here will be mainly LPG gas () and electricity ();
The moisture removed from the grain, , expressed in kWh·kg−1H2O.
To convert gas consumption into power, the measured gas stream (m3·h−1) and its calorific value (MJ·m−3) will be used for the balance sheet.
To determine power, the amount of electricity in a given unit of time (e.g., 1 h), and gas flow (kg·s
−1) are measured. The power of electric drives is expressed by the formula
where
—electric energy usage, (kWh);
—drying time or measurement time, (h).
The energy in fuel:
where
—fuel stream, (kg·s
−1);
—lower calorific value, (kJ·kg
−1).
Grain drying energy will be the final parameter used to compare the energy efficiency of individual dryers:
where
—evaporated water stream, (kgH
2O·s
−1).
3. Results
This chapter describes the test results for both dryers. The results are divided into two subsections, one for each dryer. Both dryers were measured in October on the same day, when the relative air humidity was 26% and the ambient temperature was 12 °C. The results of each dryer give information regarding the emissions that were measured for the dryer’s heat source and concern more extensive research related to the calculation of the energy balance of the object. The desired effect of the calculations is to determine the energy demand needed to reduce the moisture content of the dried material by 1% for each ton of dried product. This value was determined as the energy intensity index. The result of the calculations is the energy consumption index, which, thanks to the introduced standardization, allows the energy demand for different fuels to be compared. The proposed indicator also allows the comparison of dryers that are characterized by different designs. To make the research comparable, processed grain was selected (to ensure the same moisture content), and the emissions were standardized, which is a new perspective proposed in the article.
After the results related to the energy balance are reported, the outcomes of the flue gases composition measurements, which in both cases are a source of heat for the dryer, are presented.
3.1. Dryer DT2532
The working conditions of the DT2532 dryer during testing are presented in
Table 4.
Table 5 summarizes the electrical parameters of the individual elements of the coal-fired dryer.
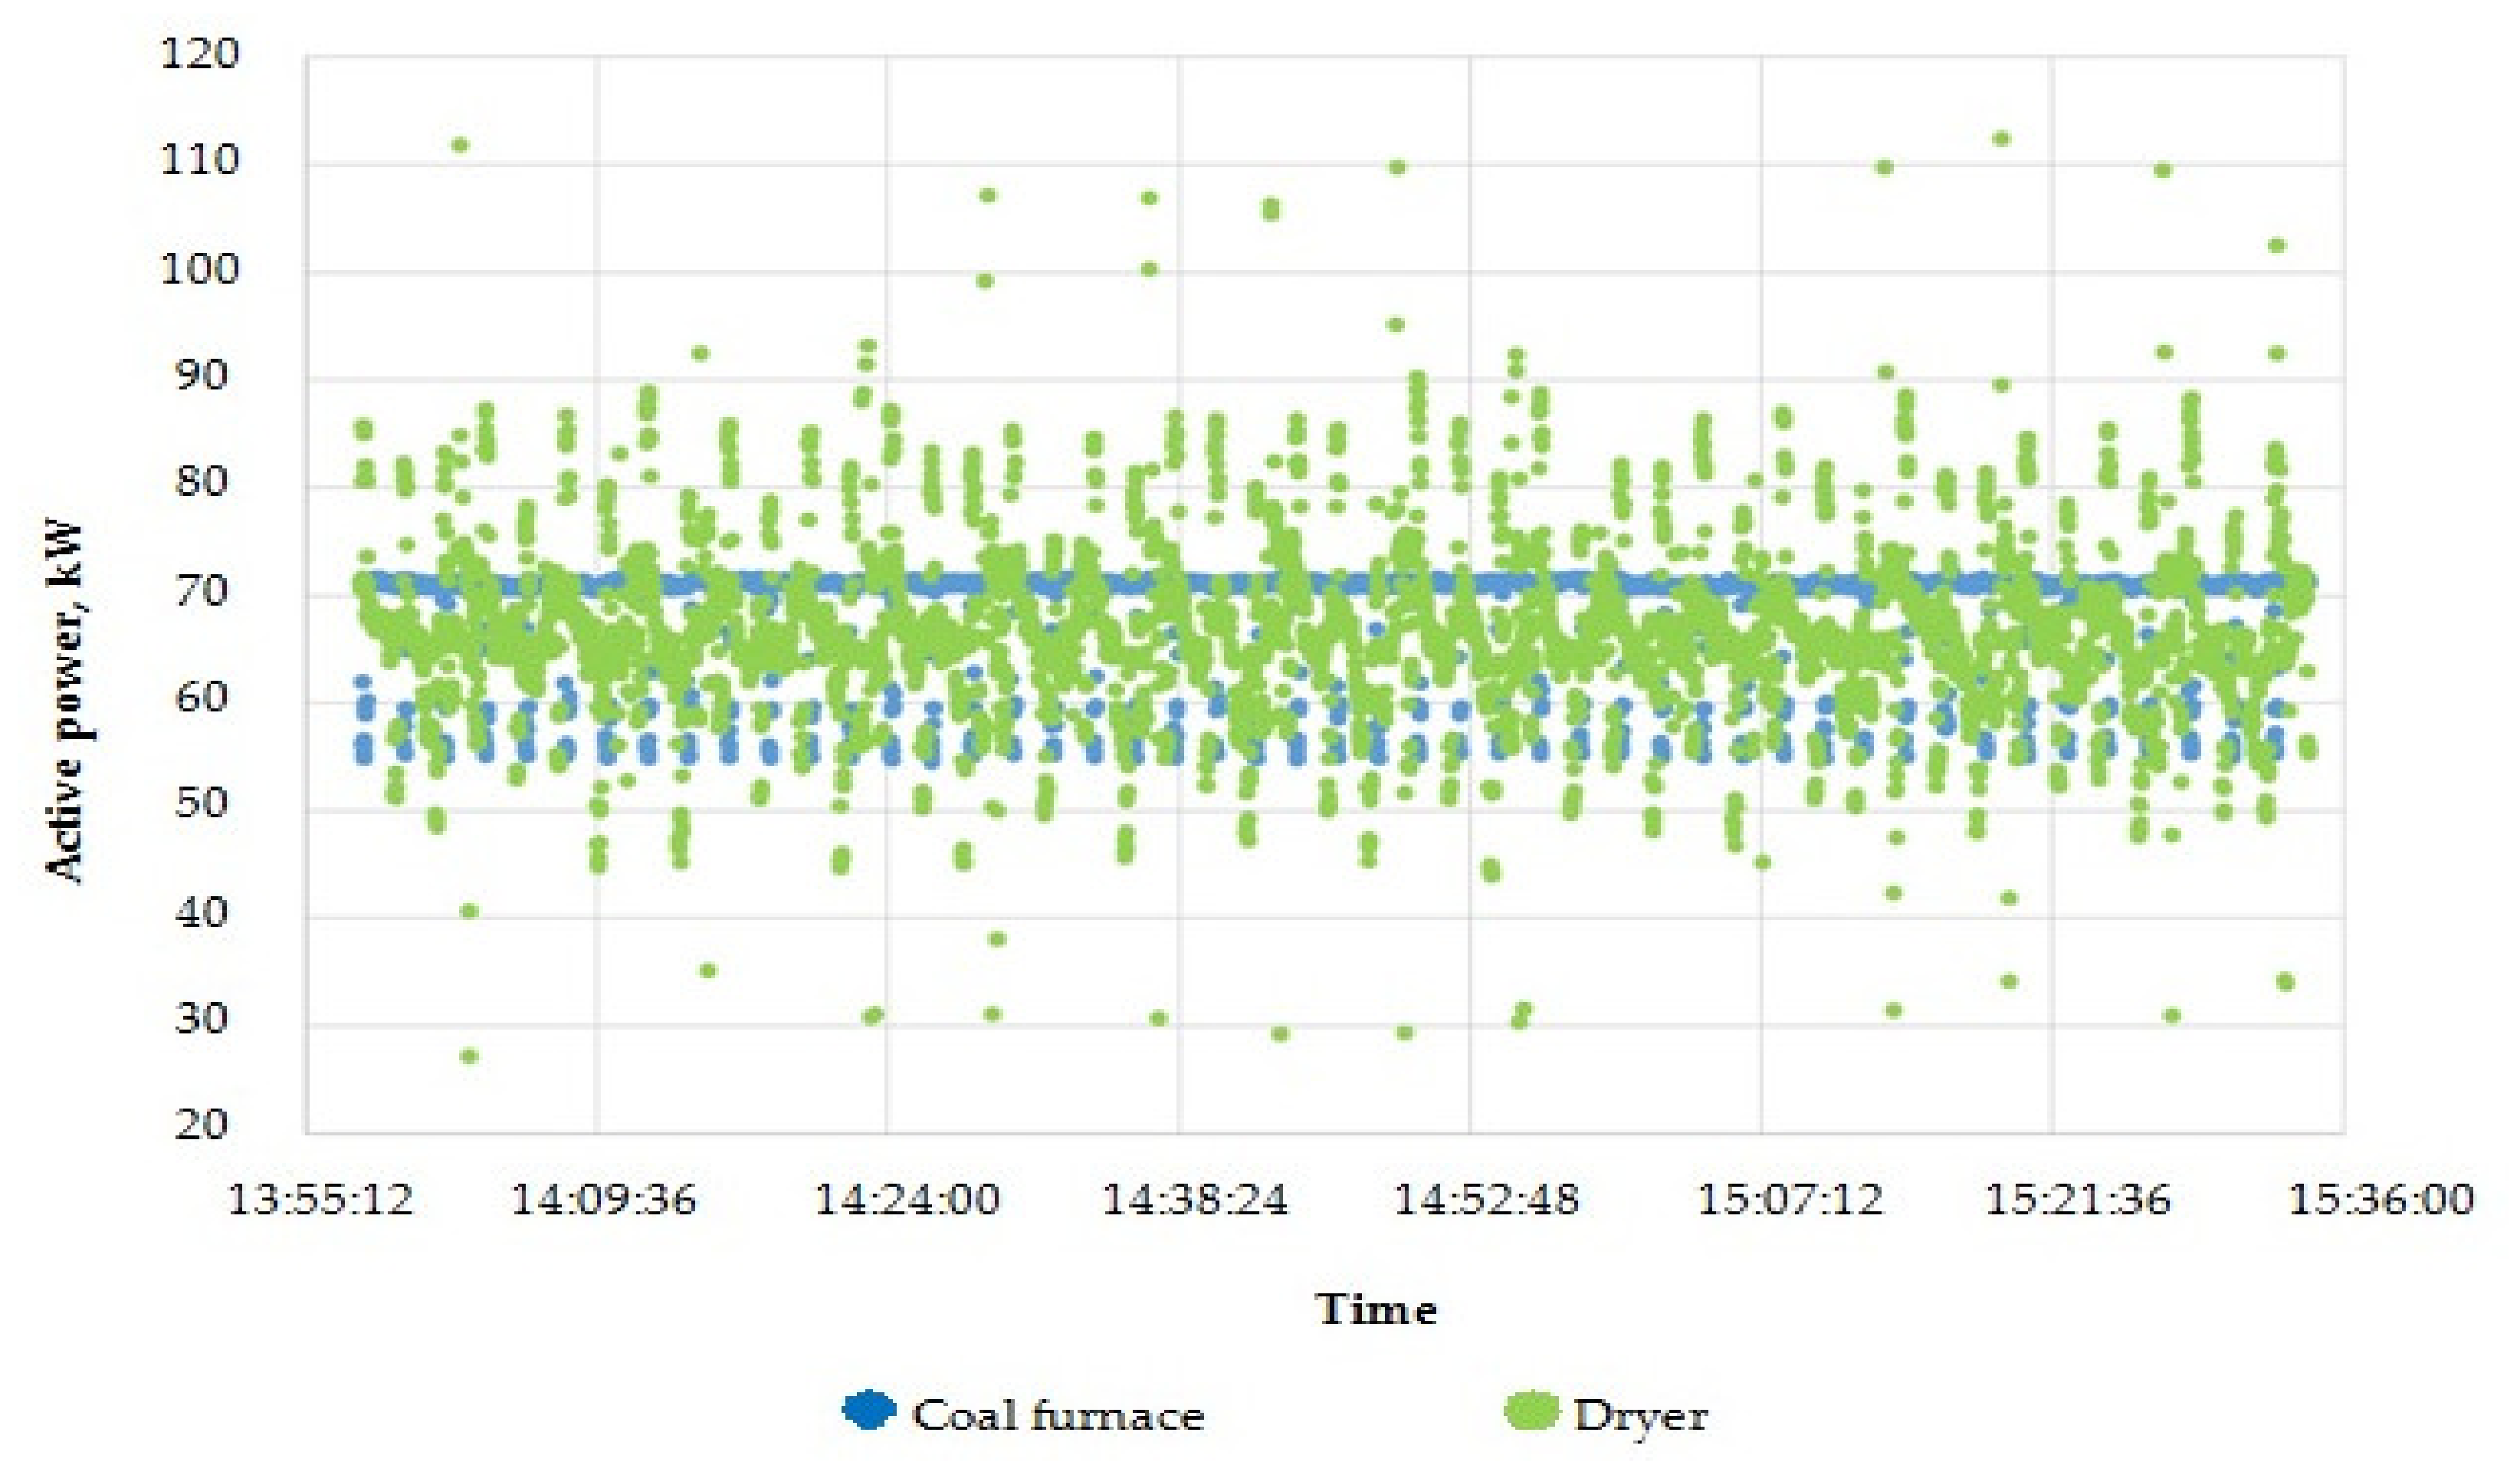
Figure 2 presents the active power curves of dryer fans.
Figure 3 shows the active power curve for the entire dryer and coal furnace. These waveforms will also take the power consumed by individual fans into account.
At the time of the tests, a full cycle of the device’s work was recorded. The electric power of the drying segment (all except for the heating furnace) during operation ranged from 20–102 kW. The average dryer capacity was 66 kW. To this value, the power consumed by devices supporting the combustion process in a coal furnace should be added. Their power demand was more stable than in the case of the drying segment and fluctuated between 55 and 72 kW. The average value of the consumed power was about 69 kW.
The unit energy consumption (electricity) of the drying segment and furnace was 490 MJ·h−1.The energy demand for the furnace and the drying segment was almost 50%. In the case of the furnace, it was 251 MJ·h−1, and the drying segment was 239 MJ·h−1.
During the operation of individual fans, periodic power fluctuations were recorded. These changes, which were in the form of peaks, were observed during grain discharge, which is a cyclical process that allows the grain to be moved down the drying column. The shutters on the exhaust fans then closed and, as a consequence, the drying gas flow was cut off, which contributed to the increase in power consumption of the exhaust fans because they pumped the gases into the closed channel. In turn, the power consumption of recirculation fans was reduced because it did not have to overcome the resistance generated by the discharge fans. The change in power consumed by the recirculation and exhaust fans was small. For the DT 2532 dryer, the ejection blocking system was economically and environmentally justified. The small increase in the power demand (0.7 kW) of the discharge fans during the closing of the exhaust louvers was practically compensated for by the lower power demand of the recirculation fans (1.1 kW). This system allowed for a significant reduction in the dust generated during the period of time when the grains slid into the drying column.
Table 6 summarizes the temperatures and individual gas streams flowing through the dryer.
Based on the conducted measurements, the energy demand was calculated per hour of dryer operation. Considering the hourly efficiency, it was possible to determine the unit energy consumption of the drying process. The results are shown in
Table 7.
Based on the measurements and calculations, the unit electricity demand for the dryer was determined and amounted to 490 MJ·h
−1. The unit heat demand obtained after coal combustion was 20,687 MJ·h
−1. Total unit energy that was indispensable for the functioning of the dryer was therefore 21,177 MJ·h
−1. After taking the dryer capacity of 25 Mg·h
−1 into account, the calculated unit energy consumption of the corn drying process for the assumed parameters was 65.161 MJ·(Mg·%)
−1.
Figure 4 presents the results of the measurements in a graphical way, referring them to individual drying nodes.
In the tested dryer, the flue gas composition was measured at the outlet from the combustion chamber of the coal furnace. The results are presented in
Table 8.
The high content of unburned CO in the exhaust gas while time the value of the excess air coefficient is too high (λ = 1.3 ÷ 1.4 is recommended for coal grate furnaces) at the same [
24] testifies to the poor organization of the combustion in the examined furnace, resulting in a reduction of the process energy efficiency and increasing its negative impact on the environment. Emissions of nitrogen oxides are approaching the limit of emission standards of 400 mg∙m
−3n for medium flammable sources of power (1 ÷ 50 MW) [
25].
In order to be able to compare both driers, the emissions from the dryer powered by hard coal were converted to oxygen content of 3% in the flue gas (
Table 9).
3.2. Dryer S428.CS
The parameters of the dried grain, which was maize, as well as the drying efficiency were identical to those in the DT 2532 dryer (
Table 10).
The dryer was equipped with a fan forcing gas flow through the column. The dryer used a heat recuperation system that also had a fan.
Table 11 summarizes the electrical parameters of individual dryer components.
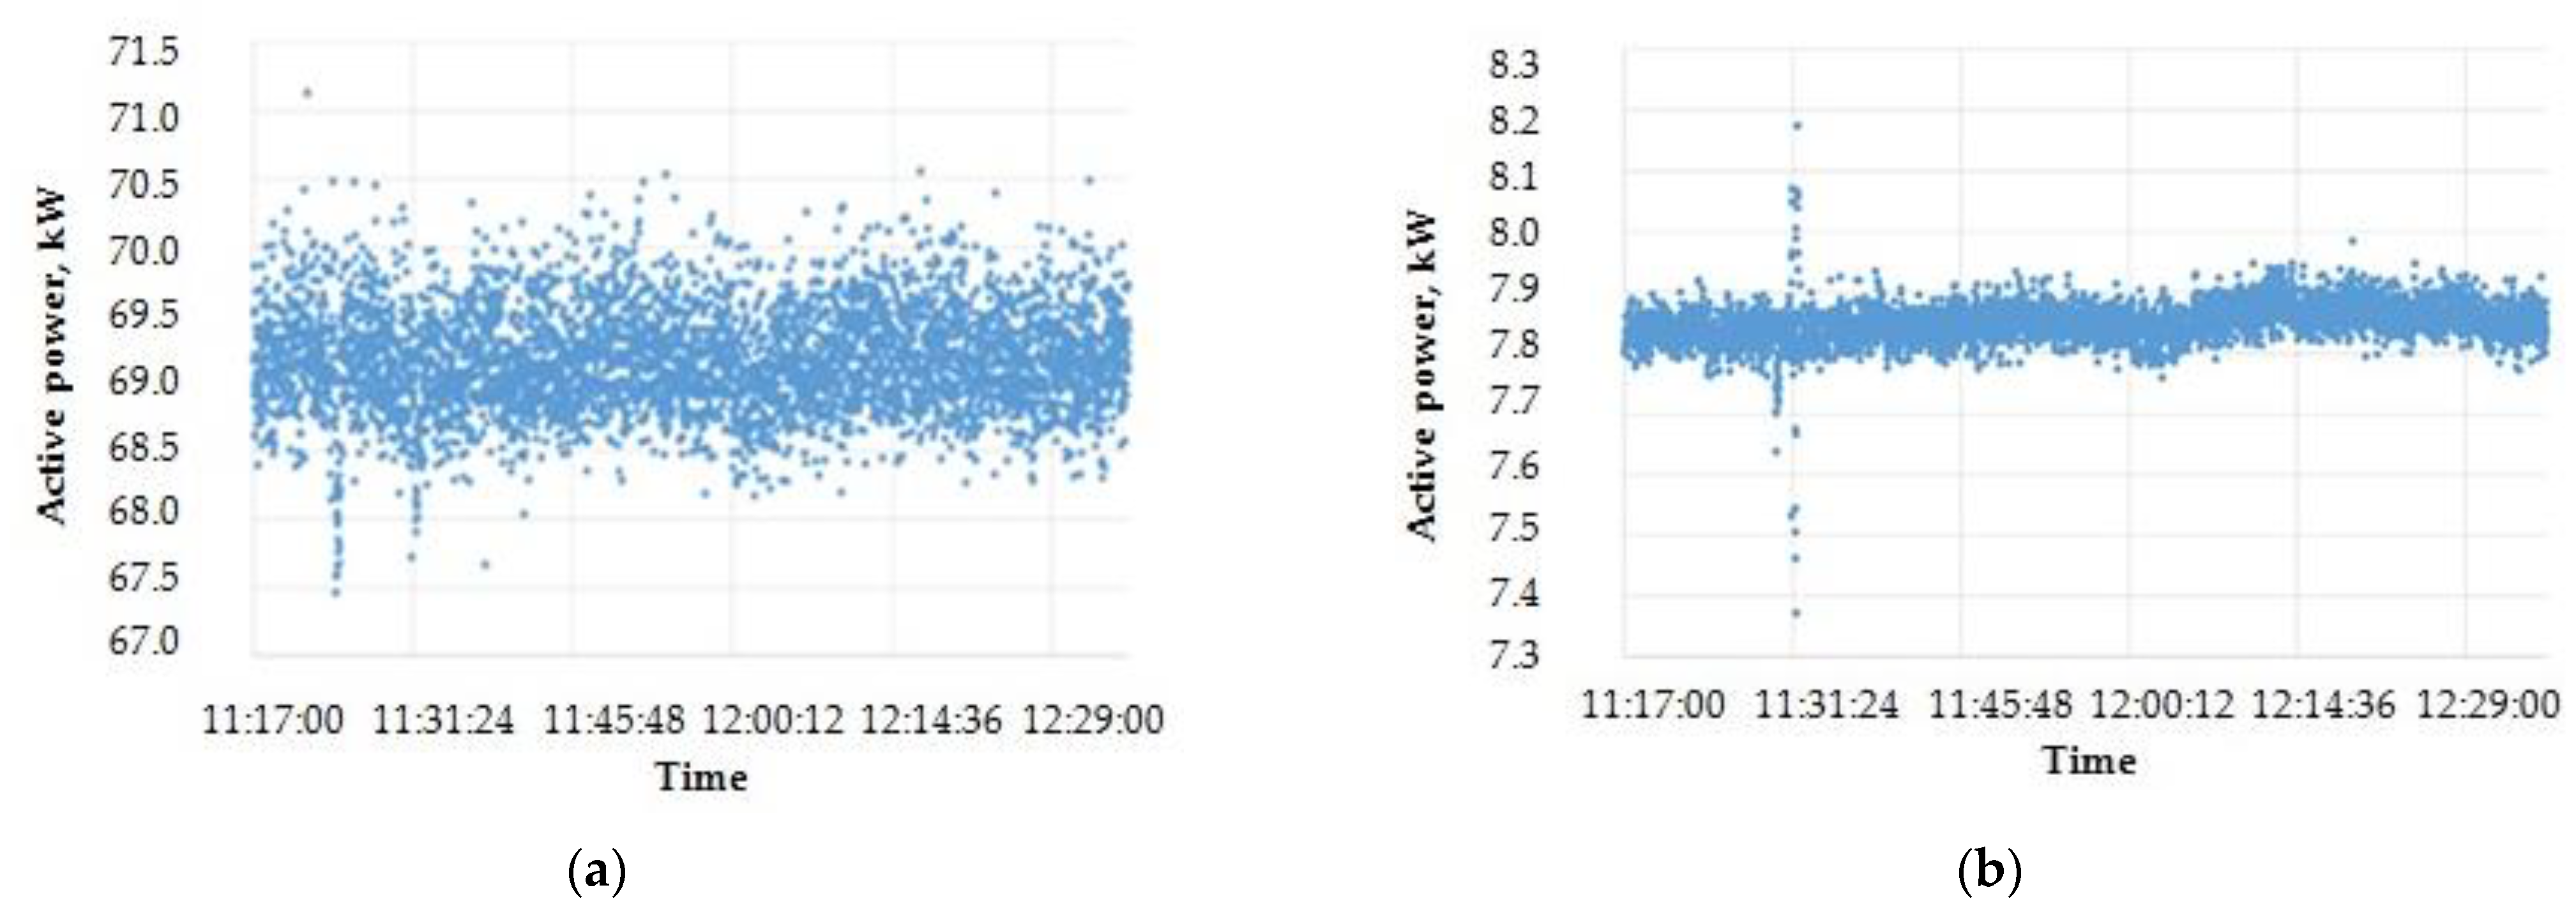
Figure 5 shows sections of the power waveforms of individual devices lasting several minutes.
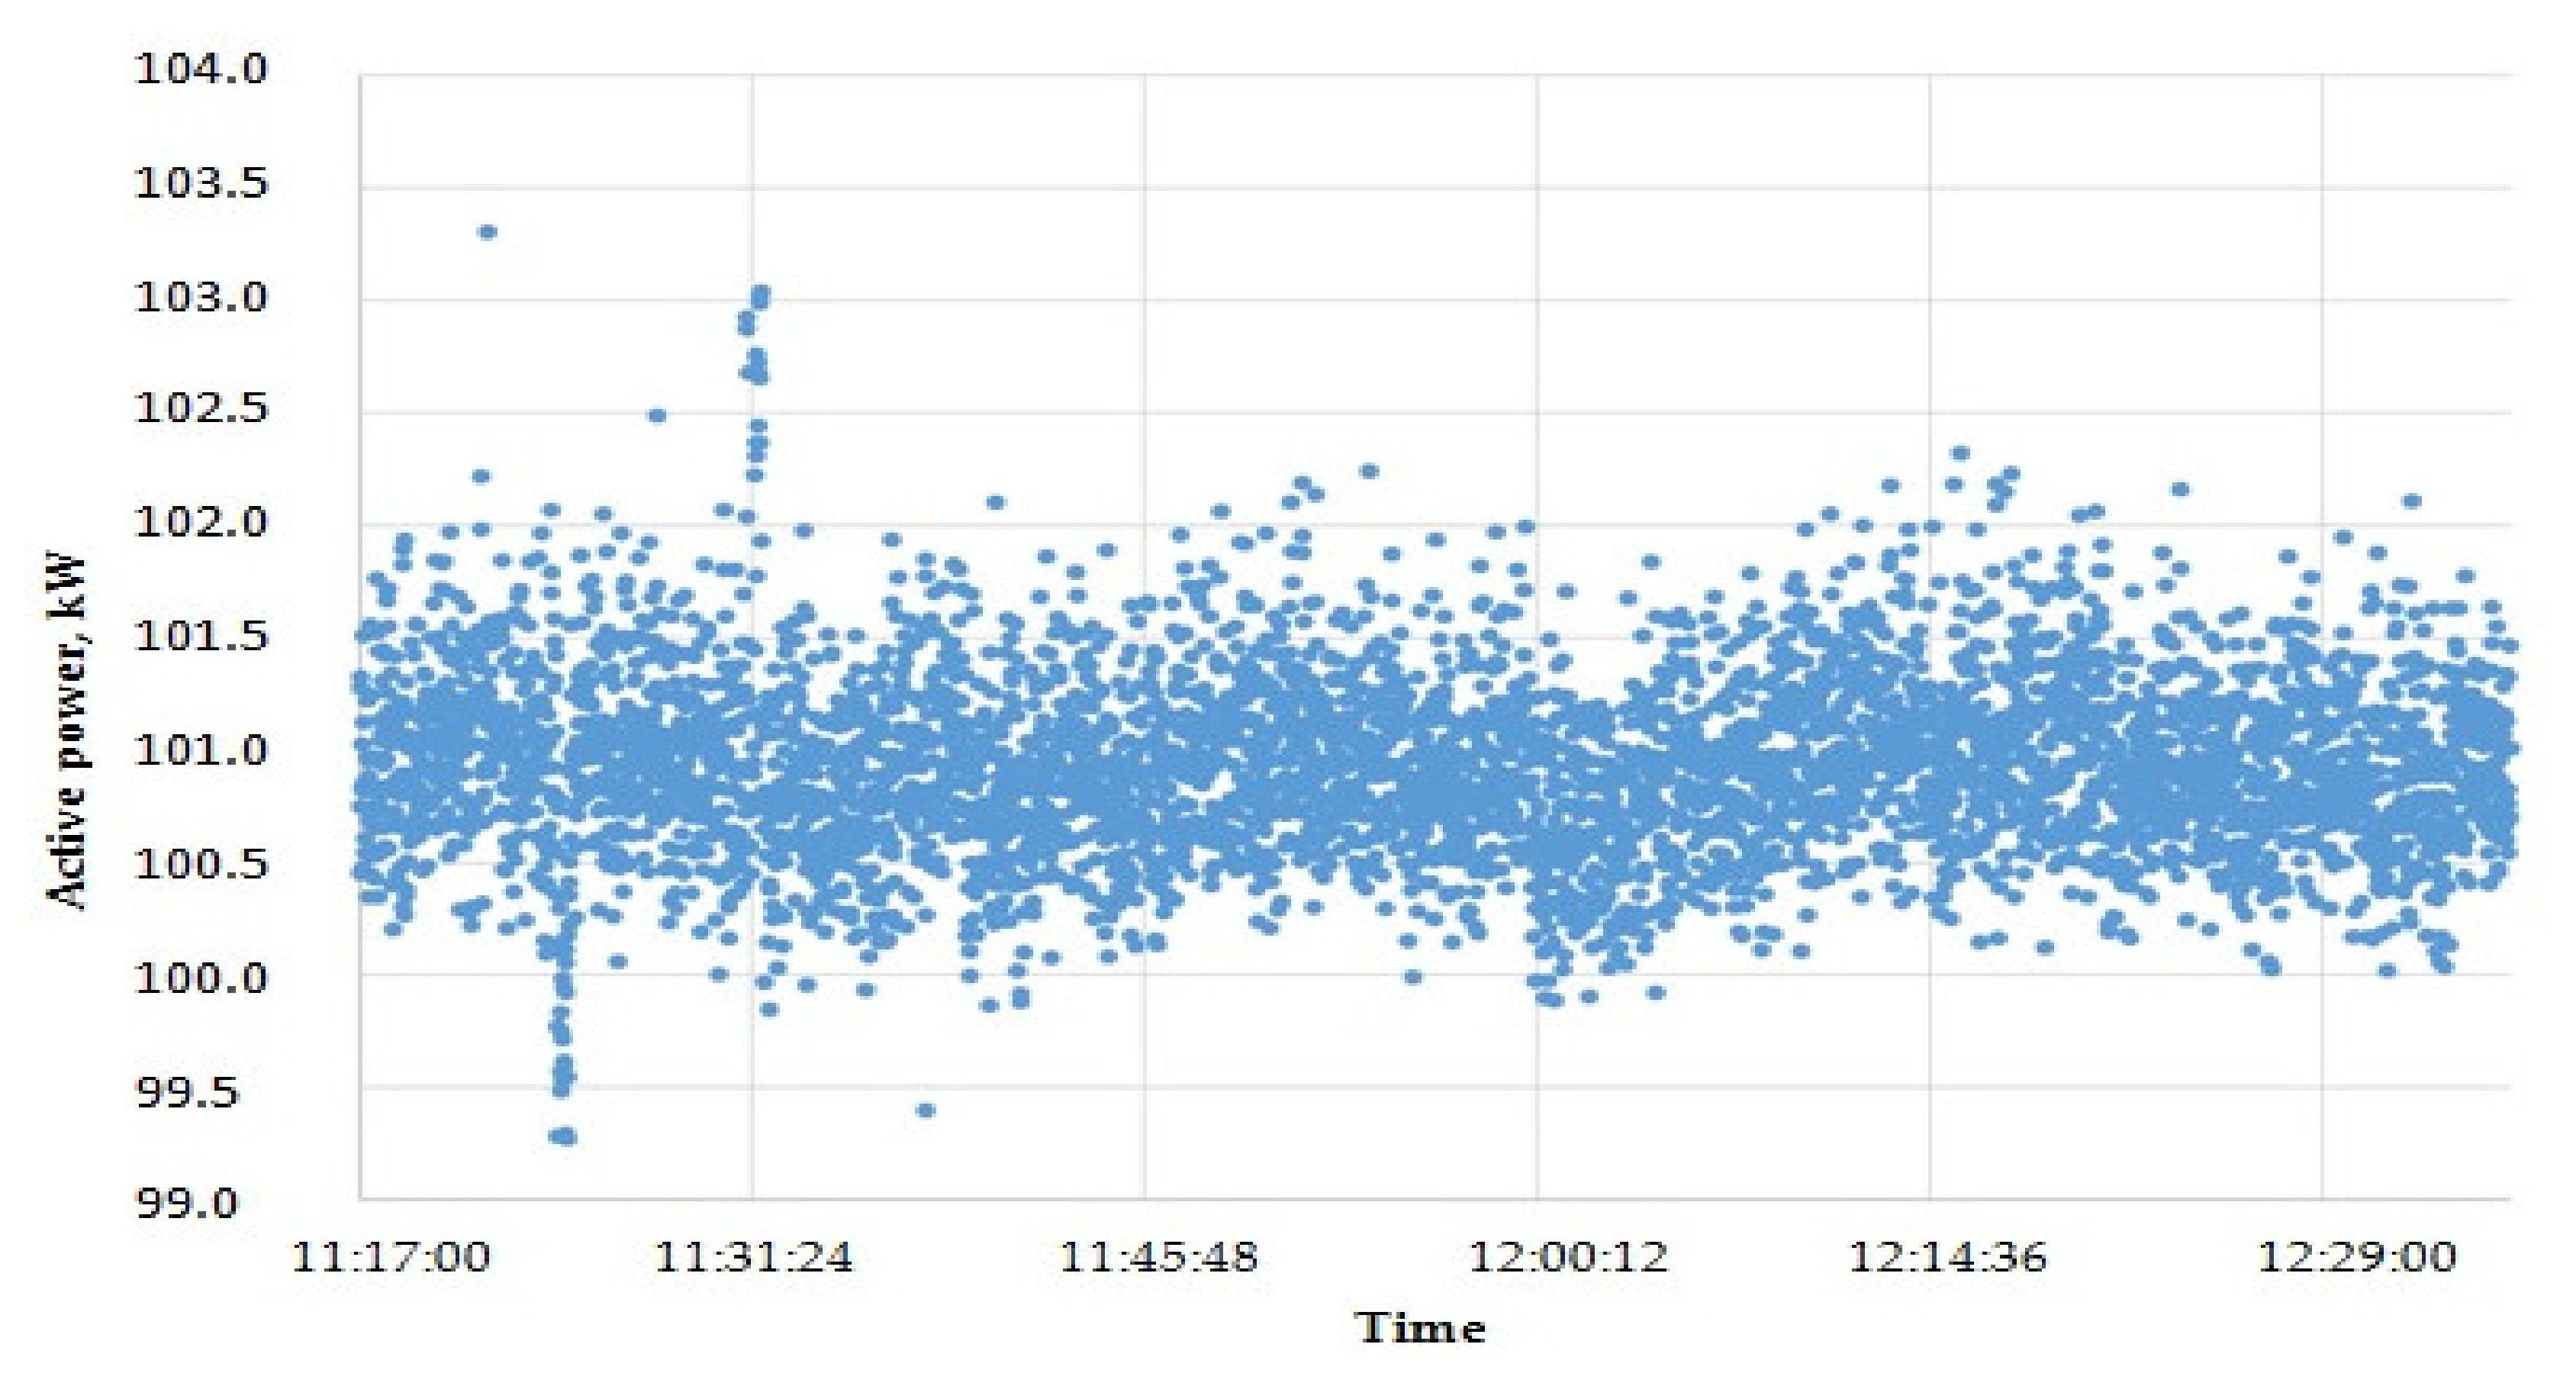
Figure 6 shows the active power curve for the entire dryer. This course also takes into account the power consumed by individual fans.
During the tests, a full cycle of the device’s work was recorded. The power during operation ranged between 99 and 103 kW. The average dryer consumption was 101 kW. The unit electricity demand recorded for this type of dryer was 363 MJ·h−1. The main electricity receiver at the site was a centre separator fan that consumed nearly 70% of its total energy. The power demand was stable and showed small fluctuations.
There were no cyclical power fluctuations that occurred in dryers without a dust collection system. Centre separator dryers do not have a shutter system that closes when the grain is dropped, and thus there is no increase in the discharge resistance for the fans. The dedusting system allowed for a significant reduction in the dust generated by the dryer during the drying process.
Table 12 summarizes the measured temperatures and values of individual gas streams flowing through the dryer. The difference between the inlet and outlet of the dryer represents the sum of removed moisture and flue gas from combustion. The drying agent flux is higher than the outlet, because of recirculation, which gives an additional 5% to the flux rotating in the dryer.
Based on the conducted measurements, the energy demand was calculated per hour of dryer operation. Taking the hourly efficiency into account, it was possible to determine the energy consumption of the drying process. The results are summarized in
Table 13.
Based on measurements and calculations, the unit demand for electricity necessary for the functioning of the dryer was determined, and it amounted to 363 MJ·h
−1. The unit heat demand, supplied as LPG gas, was 14,928 MJ·h
−1. The total unit energy demand during dryer operation with the assumed operating parameters was 15,291 MJ·h
−1. After considering the efficiency, which was 25 Mg·h
−1, the calculated unit energy consumption was 61.16 MJ·(Mg·%)
−1.
Figure 7 graphically presents the results of the measurements concerning individual drying plant nodes.
In this type of dryer, the flue gases from the gas burner were mixed with drying air; therefore, the composition of the flue gases (drying air after contact with the grain) was measured at the outlet from the dryer in the centre separator (the results are presented in
Table 14). Moreover, the composition of the drying air before contact with the grain was determined for this dryer at a height of 1 m above the gas burner (the results are presented in
Table 15).
Due to the high dilution of flue gases with the air in the drying medium stream (O2 = 20.21% → λ = 28.3), the measured impurity content was very low. However, when converted to standard oxygen content (3%), these values became significant.
The dryer met the current requirements regarding NO
X emission standards, the limit value of which is 200 mg∙m
−3n for medium power devices (1 ÷ 50 MW) supplied with gas [
25].
4. Discussion
Industrial research on grain dryers performed in Poland does not take electrical energy into consideration although legal acts mentioned in this paper are defining energy efficiency as the ratio of evaporated water per ton of grain (utility effect) to the total amount of final energy (including fuels and electricity). In the article, a comprehensive approach was described that took electricity, moisture content, and the standardization of the results into consideration. The method that has been proposed in the article did not change the final unit MJ·(Mg·%)−1 of calculated energy consumption, but it did change the method of calculation and the results as well. The construction of a continuous grain cereal dryer and measurement methodology was described. The results of the measurements were presented in the form of tables and graphs to assess the stability of both devices. During the operation of individual fans, periodic power fluctuations were recorded. These changes, which were depicted in the form of peaks, were observed during grain discharge, which is a cyclical process that allows the grain to be moved down the drying column. The shutters on the exhaust fans then closed and, as a consequence, the drying gas flow was cut off, which contributed to the increase in the power consumption of the exhaust fans because they pumped the gases into the closed channel. In turn, the power consumption of the recirculation fans was reduced because it did not have to overcome the resistance that was generated by the discharge fans.
Measurements and analysis of the energy consumption for two dryers fired with coal and gas expressed as the total consumption of electricity and heat (obtained from LPG gas or hard coal) to reduce the moisture content of one ton of corn by one percent resulted in more favorable indicators for the gas-fired dryer. However, this difference is small. The gas-fired dryer generated energy consumption of 61.161 MJ·(Mg·%)
−1, while the dryer using heat from coal combustion worked with an energy consumption of 65.161 MJ·(Mg·%)
−1. The conclusion is that the construction powered by LPG gas S428.CS has an energy consumption that is 6.14% lower than the DT2532 dryer construction, which uses coal. Another advantage of the LPG gas dryer is the lower emission of pollutants into the atmosphere, which do not only result from its lower energy consumption. The LPG gas dryer generates the same amount of heat and emits less CO
2 and other gases that harmful to people and the environment, such as NO
x or CO (on the basis of analysis of the values from
Table 9,
Table 14 and
Table 15, it was found that the emission of these gases is multiple times lower in comparison with its hard coal powered counterpart). It results from differences in the chemical composition of the fuel used in the tested dryers. A discussion of energy costs for industrial dryers needs to be continued because only one article with financial expenditures has been published so far [
18]. The cost in the Polish context was calculated by taking the calorific value of coal 24,243 kJ·kg
−1 and the price of 51.87 EUR·Mg
− into account. The heat cost of 2.14 EUR·GJ
−1 was calculated according to European standards [
26]. LPG gas with a calorific value of 43,030 kJ·kg
−1 and a price of 0.89 EUR·kg
−1 allows the generation of heat at 20.72 EUR·GJ
−1 [
27]. The fuel cost was recalculated into a common unit: EUR·Mg
−1 of dried corn, and a comparison was made. The highest cost was for liquefied petroleum gas at 8 EUR·Mg
−1, the middle cost found in the literature [
18] for biomass of 2.5 EUR·Mg
−1 was still higher than coal as a fuel, 0.78 EUR·Mg
−1, which seems to be the cheapest fuel so far, but it does not mean that coal fired boilers are the best choice from economical point of view. New Eco-design regulations [
17] will lower the emission limits for small scale boilers, and the new law will force high expenditures into flue gas cleaning installations for coal fired boilers.
The main conclusion is a slight difference in energy consumption in the compared dryers and a significant difference in the price of the heat generated from individual energy carriers. It explains an enthusiasm of Eastern European countries (like Poland) for coal fired dryers. This tendency is changing since the social and environmental analyses have shown the negative influence of coal on air pollution and the wellness of local society.


 ,
, 


