Article

Study on Boil-off Gas (BOG) Minimization and Recovery Strategies from Actual Baseload LNG Export Terminal: Towards Sustainable LNG Chains

1
Department of Chemical Engineering, Qatar University, Doha P.O. Box 2713, Qatar
2
Department of Chemical and Biomolecular Engineering, National University of Singapore, 21 Lower Kent Ridge Rd., Singapore 119077, Singapore
*
Author to whom correspondence should be addressed.
Energies 2021, 14(12), 3478; https://doi.org/10.3390/en14123478
Submission received: 22 May 2021 / Revised: 1 June 2021 / Accepted: 8 June 2021 / Published: 11 June 2021
(This article belongs to the Special Issue Energy Efficiency in LNG Production and Use)

Abstract

:
Boil-off Gas (BOG) generated at the liquefied natural gas (LNG) export terminal causes negative economic and environmental impacts. Thus, the objective of this study is to develop and evaluate various handling schemes to minimize and/or recover the generated BOG from an actual baseload LNG export terminal with a capacity of 554 million standard cubic feet per day (MMSCFD) of natural gas feed. The following three main scenarios were assessed: JBOG re-liquefaction, LNG sub-cooling, and lean fuel gas (LFG) reflux. For the LNG subcooling, two sub-cases were considered; standalone subcooling before LNG storage and subcooling in the prevailing liquefaction cycle. Steady-state models for these scenarios were simulated using Aspen Plus® based on a shortcut approach to quickly evaluate the proposed scenarios and determine the promising options that should be considered for further rigorous analysis. Results indicated that the flow of attainable excess LNG is 0.07, 0.03, and 0.022 million metric tons per annum (MTA) for the standalone LNG sub-cooling, LNG sub-cooling in the main cryogenic heat exchanger (MCHE), and both LFG-refluxing and jetty boil-off gas (JBOG) liquefaction, respectively. This in turn results in a profit of 24.58, 12.24, 8.14, and 7.63 million $/year for the LNG price of 7$ per Metric Million British Thermal Unit (MMBtu) of LNG.

Graphical Abstract

1. Introduction

With the current continuous population growth and economic development, the global energy demand is projected to grow persistently by nearly 1.3% per annum over the next decade [1]. While a wide variety of energy sources are available to support the different industrial sectors (oil, coal, biomass, nuclear, renewables, and natural gas), NG is gaining a privileged position among other fuels, as it is recognized as an environmentally friendly fuel [2,3,4,5]. For instance, reports showed that NG emits 50% to 60% less carbon dioxide (CO2) than other fossil fuels when burned in a modern natural gas power plant [6]. Similarly, the tailpipe emissions of natural gas emit 15% to 20% less heat-trapping gases than gasoline in vehicles [7,8]. The growth in the global energy demand that is driven by the economic growth and population increase has increased the NG market opportunities. Different Technologies were developed and employed to enable the transportation of NG, such as liquefied natural gas (LNG), gas to hydrates conversion (GTH), compressed natural gas (CNG), natural gas liquid (NGL), and gas-to-liquid (GTL) [9].
Supported by the growing NG demand, LNG trade is continuously increasing as it provides an economic means of the commercial transportation of NG over long distances owing to the fact that the volume of NG shrinks down 600 times when liquefied [10]. According to ExxonMobil [11], liquefied NG trade supplies approximately one-third of NG demand from 2016 to 2040. About 32% of the global NG, corresponding to 346.6 billion cubic meters of NG (bcm), is moved as LNG, while the remainder is transported via pipelines in its gaseous state [12]. According to the future scenarios presented by the British Petroleum Company, LNG trade will account for approximately 15% of the globally traded NG in 2035, with a 3.9% increase in the annual LNG trade [13].
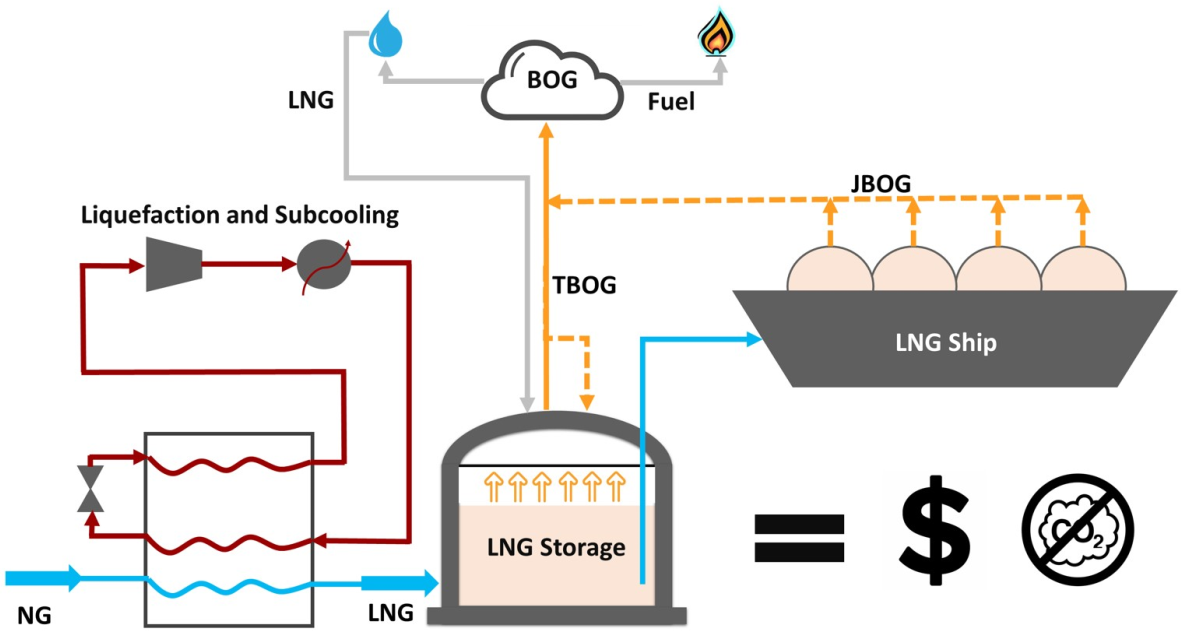
One of the key challenges facing the LNG industry is the formation of Boil-off-Gas during LNG storage and LNG loading that is known as Tankage Boil-off Gas (TBOG) and Jetty Boil-off Gas (JBOG). BOG sourced from LNG is generated due to LNG depressurization, heat leaking through the tank (i.e., storage and cargo) and pipes, and heat added to LNG due to different operational processes such as LNG pumps. Loading large quantities of LNG into tanks in a short time displaces an equivalent amount of vapor, generating vapor displacement (VD) BOG [14,15].
Conversely, filling the cargo tank by pumping large volumes of LNG causes a rapid pressure change in the storage tank. To control the tank’s pressure, the needed amount of the generated BOG is returned to the storage tank to fill the void space that is vapor replacement (VR). Therefore, the total BOG flow is a combination of the entire vapor generated from the LNG process.
During LNG holding mode, only TBOG is generated, and it is utilized as fuel to drive gas turbines (GTs). On the other hand, during LNG loading mode, both TBOG and JBOG are generated. While a portion of the total generated BOG is used as fuel to drive gas turbines (GTs), the remaining BOG is flared into the atmosphere. With this practice, a huge amount of energy resources that could be recovered and used to enhance the process efficiency and economic feasibility is wasted. In addition, this practice is detrimental to the environment, as it increases the emission of greenhouse gas (GHG) [15]. Additionally, exergy analysis of an actual LNG plant processing 522 MMSCFD of NG was performed [16], and results revealed that the total exergy loss during the loading process with and without utility is 52.5 and 24.5 MW. Given that, it is essential to identify the appropriate strategies that will contribute to recovering and minimizing the excessive BOG generation to save energy and lower GHG emissions.
Based on our previous research results [17], an actual LNG plant with a capacity of 3.65 million metric tons per annum (MMTA) can generate up to 8.1 MMSCFD   BOG MMTA   LNG and 18   MMSCFD   BOG MMTA   LNG of TBOG and JBOG, respectively. The aforementioned amounts account for approximately 6% and 13% of LNG products, respectively. Figure 1a shows that a process with a production capacity of 29.5 million standard cubic feet per day (MMSCFD) generates TBOG distributed as 78% due to flash tankage boil-off gas (FLTBOG), 15% due to heat leak tankage boil-off gas (HLTBOG), and the remaining 7% due to vapor displacement tankage boil-off gas (VDTBOG). The largest portion of TBOG occurs because of LNG depressurization from 6.9 to 1.1 bar upon storage. In addition, Figure 1b illustrates that 60.9 MMSCFD of the BOG are generated during the LNG loading process (i.e., JBOG) out of this, 42% represents the FLJBOG, 40% belongs to VDJBOG, and the remaining 17% is due to HLJBOG. The contribution of each factor in generating BOG (Figure 1) is extremely important, as it highlights the main contributors to BOG generation, which in turn aid in determining the process conditions that may affect each BOG source to provide an appropriate management strategy.
Based on the literature review, numerous researchers have investigated the different aspects of BOG recovery and management. Liu et al. [18] explored the use of a thermodynamic-analysis-based design and operation for BOG recovery at LNG-receiving terminals, aiming to minimize the total energy waste by providing a cost-effective flare minimization strategy. The results of this study indicated that the four-stage LNG regasification is the most appropriate BOG recovery process. Similarly, Huang et al. [19] proposed BOG recovery and management strategies from long JBOG at exporting terminals during LNG ship-loading. The study included in-situ power generation, in-situ reliquefaction, and high/low pressure transferring of BOG into the LNG plant for the final recovery. On the other hand, Chen et al. [20] analyzed and optimized the BOG condensation system in China’s first receiving terminal and provided a flexible and cost-effective optimization method to facilitate designing and improving other BOG recondensation processes. The research indicated that for 6.69 tons/h BOG with an LNG output between 49 and 562 tons/h, the optimization results were successful at decreasing the process energy by 91.2 kW, while 1.28 tons/h would be recovered. Moreover, Wicaksono et al. [21,22] proposed a strategy to utilize the JBOG as fuel via integration with the existing fuel network to reduce the consumption of fuel from the feed. The researchers reported that the fuel from the feed consumption could be reduced by 15% through the use of the JBOG, which increases the efficiency of the plant. Jang et al. [23] designed an algorithm for the optimal operation of BOG compressors. The authors investigated an optimal pressure between the steady-state and desired tank pressure based on the simulation of the dynamic behavior of the LNG tank. Their proposed algorithm exemplified a superior performance in comparison to previous research and routine process algorithms. Shin et al. [24] proposed an empirical model to estimate the boil-off gas recovery rate (BOGR) from an LNG storage tank in a gasification plant. The optimal operation algorithm was proposed using the BOGR model and a simplified dynamic tank model that minimizes the energy consumption in the BOG compressor while maintaining safety. Additionally, Zakaria et al. [25] introduced a new method to handle tank BOG during storage using the cryogenic temperature of the BOG as insulation to minimize BOG generation inside the cryogenic tank and to prevent the BOG from being flared into the atmosphere. Similarly, Romero et al. [26] analyzed the onboard reliquefaction process of the BOG in an LNG vessel under the reverse Bryton cycle. The researchers used thermodynamic study conditions, parameters, and energy consumption to analyze and evaluate the reliquefaction process. Romero et al. [27] also examined an LNG BOG re-liquefaction system with cascade vapor compression cycles onboard LNG carriers. The study proposed a new design to minimize energy consumption and improve exergy efficiency. More recently, Kurle et al. [28] performed dynamic simulations of an LNG vessel’s loading process to obtain the JBOG generation profile. The researchers also studied the effect of the holding mode heat leak, initial ship-tank temperature, tank cooling rate, and JBOG compressor capacity. The work also examined several JBOG utilization strategies. In other work, Kurle et al. [29] suggested various BOG recovery strategies at LNG export terminals using steady-state simulations. Bao et al. [15] proposed BOG recondensation integrated with an LNG cold energy power generation system. In this work, the BOG recondensation, through the organic Rankin cycle, electricity is sourced from the cold energy released from LNG regasification, thereby reducing the energy consumption. Cho et al. [30] presented the design features and concepts of the BOG recondensation system in the Pyeong-Taek LNG terminal and developed a methodology to optimize the gas reliquefaction system based on economics and reliability.
Most available works consider BOG generation and recovery at the receiving terminals, within the regasification process, and during the LNG voyage (i.e., onboard). However, the recovery of BOG at the export terminal has not been sufficiently addressed. The gap in the literature is the study of the detailed design of technologies that can be implemented within the actual LNG supply chain to recover and/or reduce BOG formation at the export terminal. As such, this study proposes and evaluates for the first time different handling and minimization strategies of the TBOG and JBOG from an actual LNG process. To the best of our knowledge, this will be the first study that presents a complete BOG recovery process in an actual plant for a profitable and sustainable LNG process considering the actual LNG production train components, conditions, and constraints. The new strategies can be connected to storage and LNG export terminals worldwide to recover the valuable source of energy and protect the environment. In contrast to previous studies that have suggested analogous handling options, the present study offers well-designed composite strategies for BOG minimization and recovery at a different location at minimal energy requirements. Moreover, this study focuses on identifying a BOG recovery configuration using the systematic and reliable shortcut approach that can later be used for a rigorous evaluation. The use of BOG as a fuel as well as make-up gas was considered alongside other strategies such as JBOG liquefaction, LNG sub-cooling, and lean flash gas refluxing. Modeling and simulation of different units were performed using a steady-state simulation tool in Aspen Plus®, and the input data and operating conditions of the actual LNG plant were adapted from the previous work of our team [17].

2. LNG Chain Description

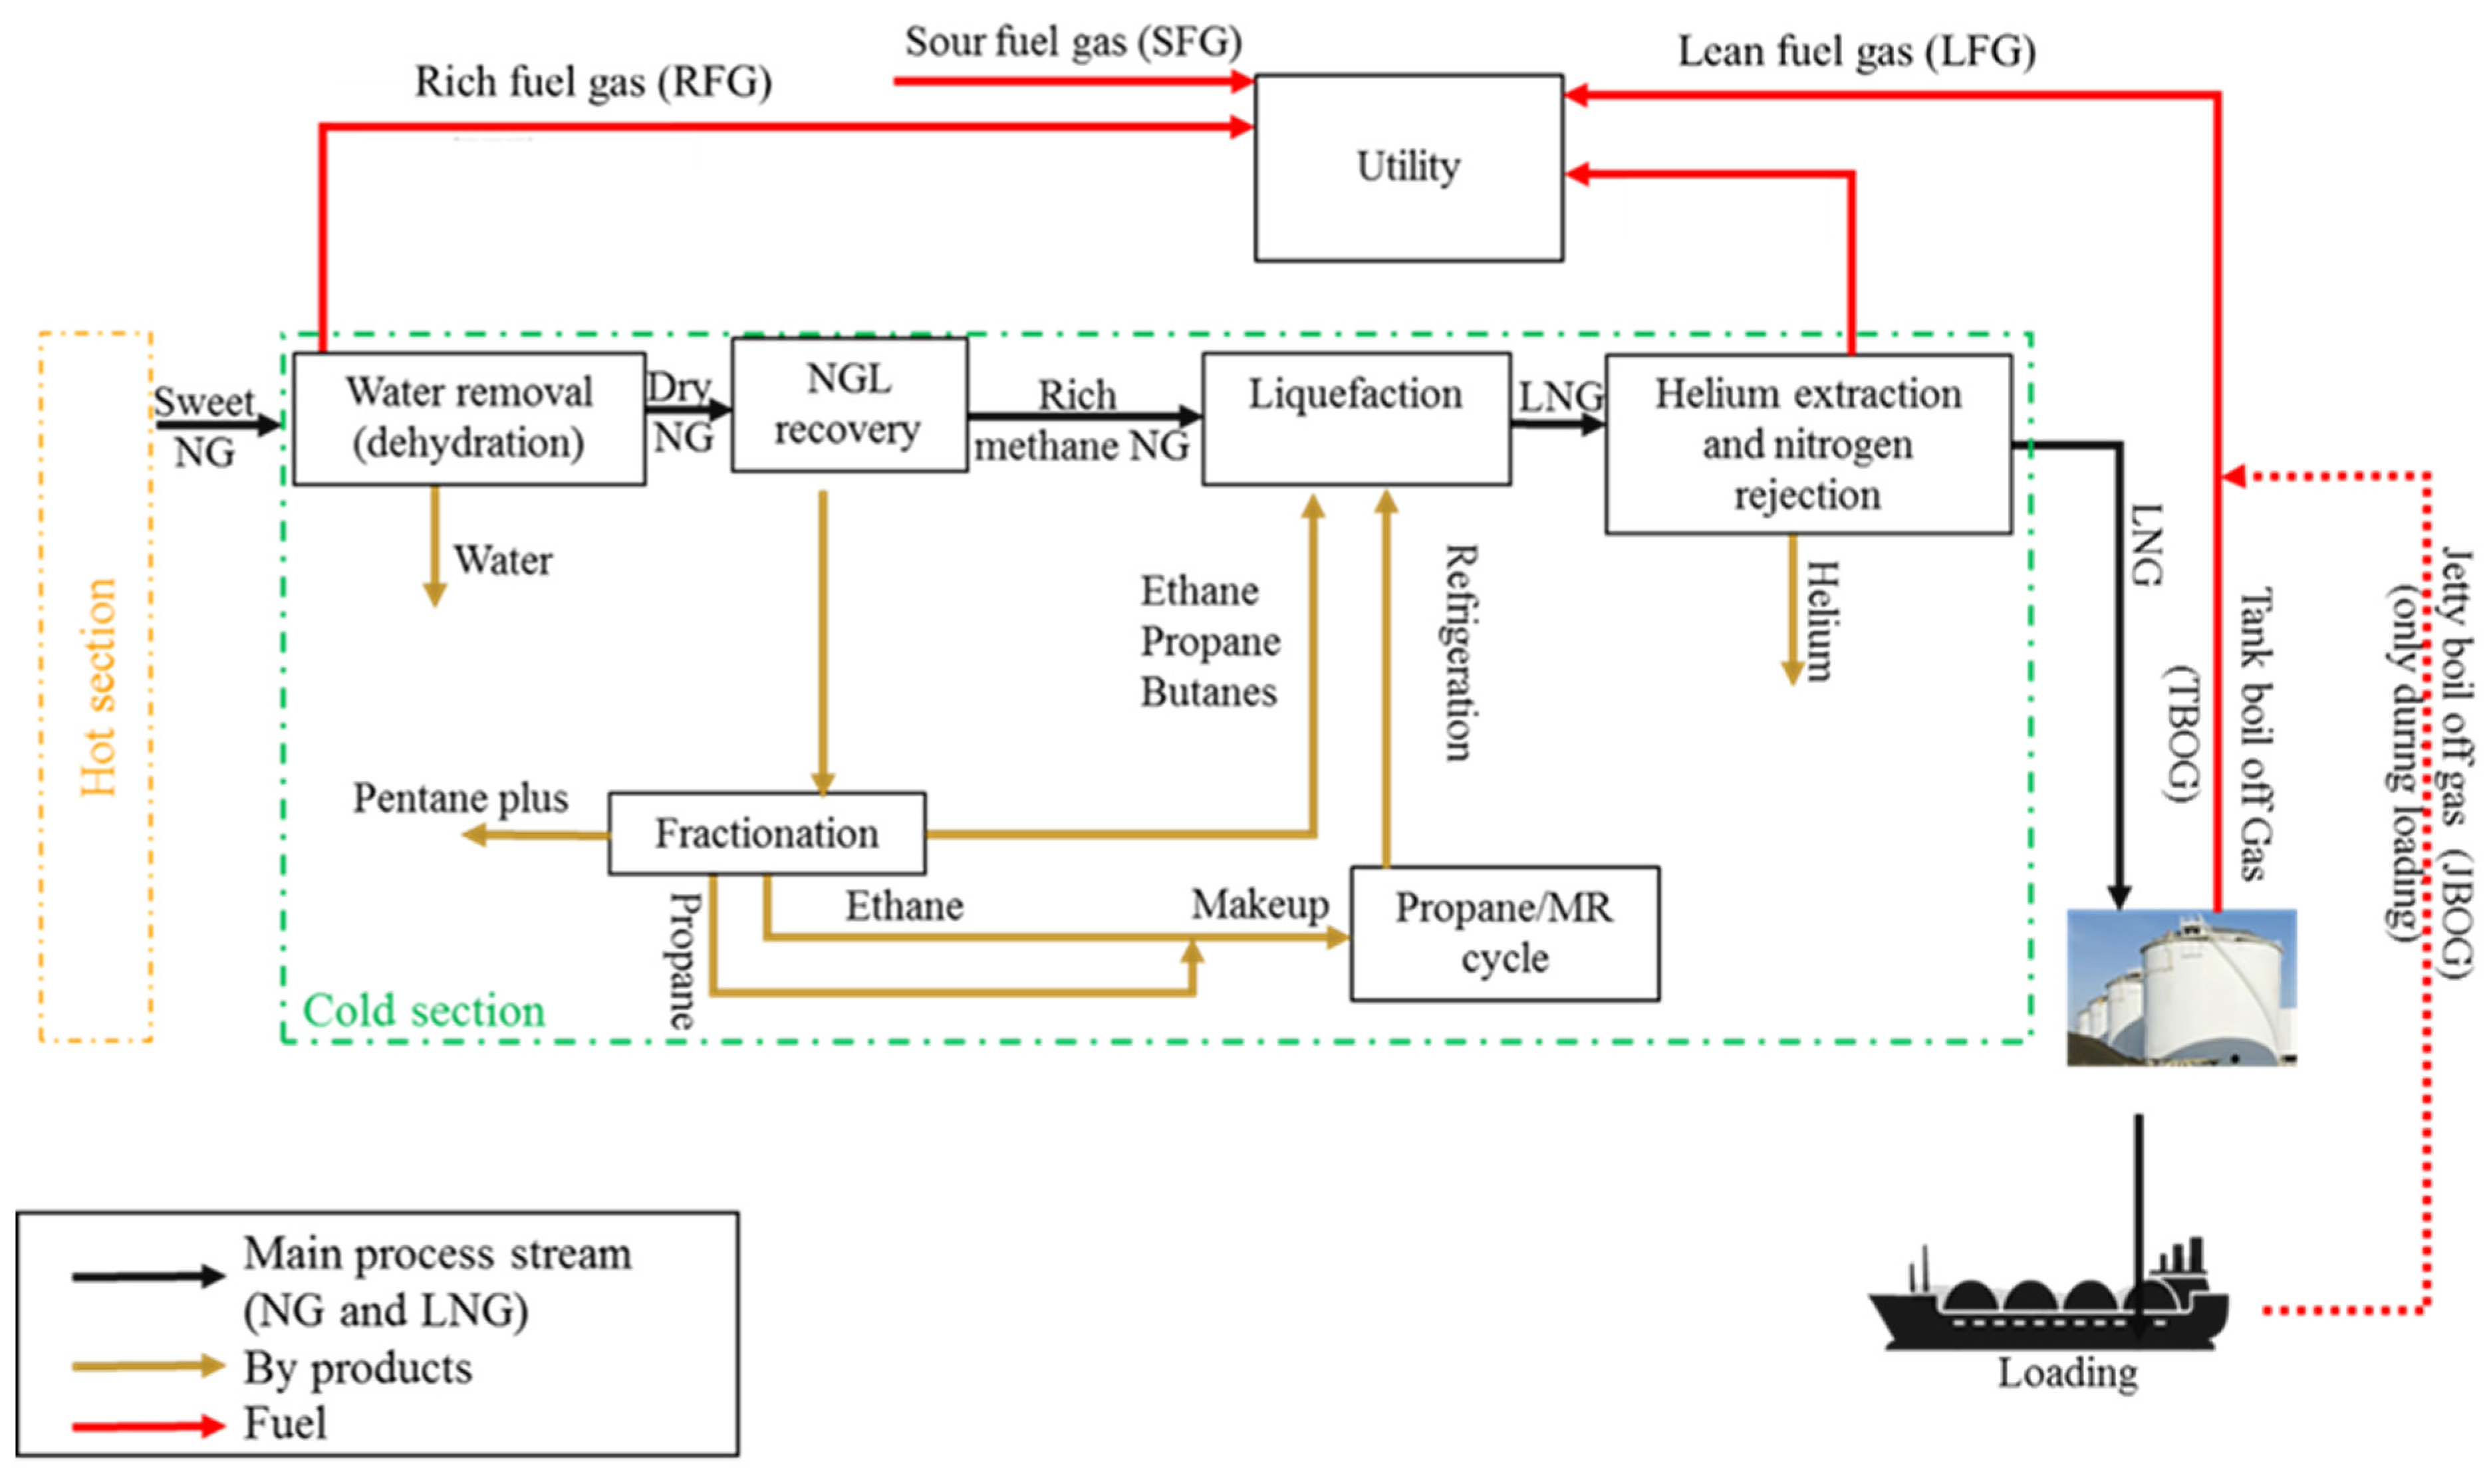
The LNG plant considered in this study is comprised of the following interdependent segments (see Figure 2): the LNG main process and exporting terminal (the LNG storage and loading). However, the shipping and receiving terminals (unloading and regasification) parts of the LNG chain are beyond the scope of this study. The main LNG process can be further divided into two sub-sections based on the energy demand of the processes; the hot section, which requires energy in the form of heat to remove impurities from the NG, and the cold section, which requires energy in form of work to drive the refrigeration compressors.
The raw NG composition and conditions are presented in Table 1. NG first passes through the pre-separation unit, wherein gas, water, and hydrocarbons (condensate) are separated. The NG exiting the pre-separation unit, referred to as sour gas, contains a large number of undesired impurities such as carbon dioxide, hydrogen sulfide, mercaptans, benzene–toluene–xylene (BTX), mercury, and water. The NG undergoes several sweetening and purification steps to prevent violating the liquefaction facilities and to meet the LNG specifications (H2S < 5 ppm with a heating value > 920 Btu/scf) [31].
Once the NG is dried and purified to the desired extent, the NG is liquefied in the liquefaction process, using a propane pre-cooled mixed refrigerant (C3MR) integrated with the NG liquid (NGL) recovery process. In the NGL recovery unit, heavier hydrocarbons including ethane, propane, and butanes are separated through fractionation and yield a source of revenue as valuable products [32].
The NG stream is delivered to a liquefaction facility at an elevated pressure where it is exposed to a series of cooling stages through indirect heat exchange with a refrigerant until it is completely liquefied. Both of the aforementioned units are cryogenic processes that require refrigeration systems. Thus, integrating both systems enables the refrigeration system to be shared and reduces the amount of process equipment, which results in an economic advantage [33]. The LNG is sent to the nitrogen rejection unit, which is integrated with the helium extraction unit (NRU–HeXU) to eliminate the nitrogen from the product stream. This produces an LNG stream with an improved heating value and a minimal nitrogen content. However, the helium extraction unit is required to meet product specifications and to improve the economics of the gas plant, as crude helium is sold separately. Thereafter, the LNG is sent to a storage facility to be temporarily stored before loading onto the ship.
Within the storage tanks, due to LNG flashing to atmospheric pressure, the heat leak through the pipelines and tank walls, and the head added by equipment, a portion of the LNG evaporates to form TBOG. Similarly, the BOG formed during the loading of LNG onto the ship, which is JBOG.
The LNG main process units require a substantial amount of shaft work, electrical power, cooling utility, and a heating medium (i.e., stream), all of which are generated and supplied through the utility section of the plant, which in turn consumes fuel generated in different sections of the plant. In the plant under consideration, there are four main sources of fuel: (1) rich fuel has (RFG) from a dehydration unit, (2) lean fuel gas (LFG) from the helium extraction and nitrogen rejection unit, (3) sour fuel gas (SFG) from NG sweetening, and (4) boil-off gas (BOG) from storage and loading areas. More process details, simulation approaches, basic parameters, constraints, and simulation results are available in a publication by our research team [17]. In this work, we considered the cold section, LNG storage (holding), and LNG loading, as the other sections are not affected or controlled by the BOG handling strategies considered herein.

3. Process Simulation and Calculation Methods

In this study, the NG liquefaction, NRU–HeXU, LNG storage (holding), and loading facilities were simulated using an Aspen Plus® simulator to develop and evaluate different strategies to minimize or recover BOG at an LNG export terminal. The Peng Robinson cubic equation of the state was used for process simulation. The process parameters, which included simulation inputs and configurations, were obtained from previous work conducted by our research team [17]. Therein, an entire LNG chain from wellhead to end-user was rigorously simulated and validated using actual data. The following subsections outline the approach and simulated model description.

3.1. Base-Case Simulation

Figure 3a exemplifies the base case simulation configuration. The scrub column overhead from the NGL recovery unit (79) at −37.3 °C and 54.8 bar with a flow rate of 4.65 MMTA was taken as the starting point for the simulation. To simply the simulation, the cooling steps in the MCHE are represented by a series of simple heat exchangers (E-30/a, b, c, d) to mimic the C3MR cycle. This allows for a change of conditions and configuration to obtain the study objective. The model was designed to maintain the LNG and other side-product specifications to match the rigorous simulation results. Herein, the NG first cooled to −54 °C before entrance into the flash drum (V-7). The bottom streams were used as an NGL column reflux by Katebah, 2020 [17]. However, while the gas stream re-enters into the MCHE, it mixes with the LNG when it exits the fractionation unit and becomes cooled to a final temperature of −144 °C before it is introduced to the NRU–HeXU treatment process to meet the LNG specifications.
The high-pressure steam (HP) LNG that leaves the main cryogenic heat exchanger (Stream 82) at −144 °C and 16.32 bar undergoes flashing to extract and remove helium for more than 50 mol% purity. Conversely, nitrogen is removed using the stripping column process. The HP LNG (stream 82) is first throttled near 5.96 bar and sent to vessel V-15 to generate 4.04 MMSCFC methane-rich flash gas, which exits as stream 93 with 516.82 MMSCFD methane-rich LNG (Stream 94). Thereafter, the LNG stream is fed into the reboiler of the C-24 column, while the flash gas stream is routed to a heat exchanger E-45 to be cooled to −181 °C, which then partially condensed. The partially cooled flash gas is then fed into a phase separator (V-16) to generate a helium-rich gas in stream 106 as well as a methane-rich liquid in stream 105. The idea behind the employed helium extraction process is auto-refrigeration. The cooling duty in the heat exchanger E-45 is supplied by both the helium-rich gas stream 106 and the depressurized (1.8 bar) methane-rich liquid from V-16 (stream 108). Moreover, the evaporated methane-rich liquid exiting E-45 (stream 109) at −150 °C mixes with the gas stream (96) sourced from the stripping column C-24 (available near −162 °C), which provides 2% of the main cryogenic heat exchange refrigeration need. After the refrigeration recovery, the lean fuel gas at 1.05 bar and −35 °C is pressurized to 28 bar in a three-stage compressor. Then, the LFG is routed to the utility plant for use as GT fuel. In contrast, the methane-rich LNG stream leaving V-15 (stream 94) is used to provide the stripping column (C-24) boil up, which also sub-cools the stream from −144 to approximately −155 °C. After leaving the reboiler at −155 °C, it depressurizes from 5.4 to 1.6 bar to release most of the dissolved nitrogen. The generated boil-up by the reboiler (at a temperature of −158 °C) strips the remaining nitrogen from the LNG as it flows down the column. The operating pressure of the stripping column, as well as the LNG sub-cooling temperature, was selected to minimize and limit the temperature differences in the column reboiler to 1–3 °C while simultaneously rejecting 88% of the nitrogen. Rejecting this amount of nitrogen helps to produce LNG with a nitrogen content of <1.24 mol% and a higher heating value (HHV) within the range of 1000 to 1200 BTU/SCF. Moreover, the overhead of the stripping column leaves C-20 at approximately −162 °C, which is used as fuel. In contrast, the final LNG product leaving the bottom at −156 °C and 3.65 MTA is sent to the storage area.
The produced LNG from the nitrogen rejection process (stream 98) was pumped to approximately 6.9 bar to transfer the LNG to the storage tank. The LNG is stored at nearly atmospheric pressure (1.1 bar) and −161 °C. The LNG (stream 99) travels to the storage tank with consecutive separation columns (T1, T2, and T3). The TBOG occurs because of the LNG flashing, which is identified using flash calculations across the valve that is placed on the storage tank (Aspen Plus® calculation). The TBOG formation is due to the convection conduction and radiation heat leak across the storage tank. Further, the piping was calculated using the approach presented in [29] and discussed in our previous work [17]. In contrast, the displaced vapor is determined using the Aspen Plus® calculation. As such, it was assumed that the LNG net volumetric flow rate into the storage tank was equal to the volume after flashing. The generated TBOG is pressured to an approximate 28 bar K-5 compressor and transported to the utility plant for power and steam generation. Similarly, the JBOG generated during the LNG loading was represented by the separator columns (T4, T5, and T6) [17]. The conducted simulation indicated that loading 216,200 m3 (equivalent to 98% of the tank filling capacity) requires 21 h, a pumping flow rate of 10,000 m3/h, and a pressure of 11 bar.
Moreover, the LNG carrier loading rate (i.e., the rate of LNG from the storage tank to the cargo tank) is 11 times greater than the tank feed rate (i.e., the rate of LNG flowing from the plant to the storage tank), which increases the tank vapor space during the 21 h loading period. In the simulation, the pressure of the vapor space is assumed to be maintained at 1.1 bar by the flash gas and heat leak TBOG, whereas the leftover TBOG is directed into the utility section of the plant. However, the JBOG generated during the carrier loading phase is nearly two times higher than the holding mode TBOG. Likewise, the JBOG is supplied for the utility plant at 28 bar via compressed K-5.

3.2. Fuel Distribution Strategy

Substantial amounts of energy are needed to run the units of the LNG plant. Large amounts of tail gases (e.g., TBOG, JBOG, RFG, LFG, and SFG) rich in methane are also generated at various locations throughout the LNG plant. However, these gases are considered losses, as they are not a product nor recyclable. Hence, to avoid wasting the methane-rich gases, they can be used as fuel sources wherever possible to support the operation of gas turbines, boilers, and incinerators.
The total fuel consumption during the holding and loading modes of the LNG plant under consideration was 805.7 and 1183 MW, respectively [17]. For optimization purposes, the total fuel consumption and fuel generation for all of the units were fixed, except for the segments that were changed to fit with the BOG recovery scenarios. As such, the fuel consumption has been divided into two values: (1) a fixed amount for all of the units, and (2) the amount required by the cold section based on the proposed scenario. The second value is essentially the fuel amount calculated from the simulation using the Aspen Plus® calculator. Because the refrigeration cycle is not being rigorously simulated in this study, a shortcut approach has been followed to quantify the necessary fuel for each fuel-consuming piece of equipment in the simulation and the refrigeration cycle in particular, which is as follows:
  • Reversible work ( W rev ) of each piece of equipment is determined using exergy as outlined in Equation (1).
    W rev   =   ex out   ex in
    where ex out and ex in represent the exergy flowrate of streams exiting and entering the equipment, respectively.
  • Actual work ( W actual )
    W actual = W rev   efficiency   of   the   process
    where the efficiency of the refrigeration cycles employed for the LNG sub-cooling, BOG liquefaction, and LFG condensation was assumed to be 40% based on a previously simulated process [17].
For the gas turbines, providing the necessary power and fuel need is calculated using the gas turbine work and thermal efficiency according to the following equation:
LHV Fuel = W GT ɳ GT
As outlined in our previous work, the efficiency of the gas turbine is 30%, as calculated from the ratio of work generated ( W GT ) to the fuel feed LNG LHV Fuel [17].
While 805 MW fuel is required to run the plant, a preliminary simulation with the application of a shortcut approach resulted in only 389 MW fuel being needed. The indicates that the additional 416 MW fuel is required for other segments that are not taken into consideration in the simulation, and it is a fixed amount. However, as the available SFG in the plant reaches 72 MW, the required fixed fuel amount from the BOG, RFG, and LFR are equivalent to 344 MW on a lower heating value (LHV) basis.
Further, the base case shortcut simulation (loading period) is designed in such a way that fuel is supplied by using all of the available SFG, LFG, RFG, and TBOG, and taking the remaining required amount from the JBOG that exists after the vapor replacement. The surplus BOG, if any, would require another strategy to be minimized and/or recovered to avoid flaring and to minimize the energy and material losses. The combination of design specs and a calculator is used to maintain this balance and split the required fraction out of each fuel stream, which ensures that the simulation is updated automatically if there are any parameter changes.
The excess JBOG was calculated as follows:
JBOG excess = JBOG Total Total   fuel   requirement SFG RFG LFG TBOG fuel JBOG VR
where JBOG Total is the total JBOG generated, the value in parentheses represents the JBOG fuel amount, and JBOG VR is the portion of the JBOG routed to the storage tank as VR.

3.3. Loading Time Scale

The LNG loading is an intermittent process [19]. The calculations indicate that the time required to load a 216,200 m3 LNG capacity ship is 21 h. Given that, it was estimated that 38 shipments are required to deliver the annual of 8.13 × 10 6   m 3   LNG to the end-user. For the calculation, it was known that the loading process takes 24 h and daily shipments are loaded at 365 shipment/yr. As such, the time ratio between the intermittent and continuous loading was calculated following Equation (5) to be 0.08:
continuous   to   intermittent   loading   time   ratio = 21   h   × 38   Shipment   24   h   × 365   Shipment  
Then, the time ratio can be used to account for the intermittency of the loading time.

3.4. BOG Minimization and Recovery Strategies

During LNG holding, TBOG is conventionally compressed and sent back to the fuel system. On the other hand, during the loading process, the total combined BOG (JBOG and TBOG) generation rate is significantly greater than the required fuel; thus, it is flared or vented into the atmosphere. Both of the scenarios incur an economic loss and are detrimental to the environment due to heightened GHG emissions. Thus, it is necessary to minimize the native impact of excessive BOG production, as it will increase LNG production, reduce plant energy consumption, and cause less environmental damage.
Minimizing BOG is achievable through the optimal design of LNG plant components to effectively handle the generated BOG or by altering the process conditions to reduce the BOG generation rate. As such, in this work, the following BOG handling strategies were considered: (1) JBOG liquefaction; (2) LNG sub-cooling, with two locations considered: in a standalone refrigeration cycle after NRU and in the existing refrigeration cycle; and (3) lean fuel gas (LFG) reflux.

3.4.1. JBOG Liquefaction

Figure 3b highlights the scheme for JBOG liquefaction. The fuel was balanced through the system, as discussed in Section 3.2. First, excess JBOG is compressed to 50 bar using a simple gas turbine cycle with an efficiency of 30% (K-6). The compressed BOG is then sent to a standalone liquefaction facility with a refrigeration cycle efficiency of 40%, as represented by a simple heat exchanger (E-31). The liquefaction temperature was manipulated using the Aspen Plus® Design Specs option to achieve the partial condensation of the JBOG such that the LHV of the vapor phase stream (106) is equivalent to fuel needed by the BOG compression and liquefaction without leaving excess fuel. The liquefied BOG was sent to the ship tanks as excess LNG.

3.4.2. LNG Sub-Cooling

Up to 23% of the total generated BOG (JBOG and TBOG) is attributed to heat leaks into the LNG plant [17]. If the temperature of the LNG is low enough such that it absorbs heat while still in the liquid phase, the BOG generation may be significantly reduced or even eliminated. Two possible locations were considered for the sub-cooling: (1) in the main cryogenic heat exchanger (MCHE), which is in the existing NG liquefaction cycle, and (2) after the NRU (i.e., before the LNG storage). The sub-cooling process here is represented by a simple heat exchanger and the sub-cooling refrigeration energy was calculated, as discussed in Section 3.2.

LNG Sub-Cooling after NRU

Figure 3c presents the schematic process of this scenario. LNG leaving the NRU at a temperature of −154 °C is cooled down to a lower range of temperatures. The sensitivity analysis was used to observe the effect of the LNG temperature on BOG generation. The simulation was automated such that fuel is balanced, and if there was any excess BOG, it would become liquefied and sent back to storage, as described in Section 3.2. Then, the optimum degree of sub-cooling was selected to minimize the BOG generation rate. Moreover, the available fuel is enough to satisfy the system’s fuel requirement without the need for an external fuel supply.

LNG Sub-Cooling in MCHE

This option suggests that the LNG is further sub-cooled in the MCHE using the refrigeration loop that is available for the main liquefaction process (C3MR cycle). As previously discussed, a separate simple heat exchanger is used in the simulation. The temperature of the LNG from the MCHE can be controlled and altered by varying the refrigerant composition, amount, and pressure. However, in this work, only the effect of temperature change was studied. Thus, the temperature of the LNG exiting the sub-cooler was varied stepwise for a range of temperatures lower than the base case.

3.4.3. LFG Reflux

Downstream to the LNG liquefaction plant, it is necessary to remove nitrogen to ensure that the nitrogen level in the LNG is less than 1%. To meet this specification, the LNG plant includes a nitrogen rejection unit stripping column with a flash stream to separate the nitrogen. The stripping column process is effective at removing nitrogen from the LNG. However, during the stripping column process, significant quantities of methane evaporate and pass with the overhead stripped nitrogen. This can lead to lowering the heating value of the LNG product while simultaneously producing excess fuel. Thus, developing nitrogen rejection units ensures a minimum waste of material (i.e., due to excess fuel), which will decrease the methane loss, increase the LNG production, and meet the LNG specifications.
The proposed configuration is shown in Figure 3d. A reflux section was added to the top of the stripping column to cool and partially condense the overhead vapor (stream 108) in the overhead condenser (E-32). Sensitivity analysis was conducted to monitor the effect of this configuration on the fuel/BOG system. The optimal temperature for the condenser was selected to ensure that any excess JBOG would be used as fuel to run the condenser and avoid liquefaction of excess BOG. The liquid stream that exits the condenser (109) is collected in vessel V-16 and used as reflux liquid (stream 110). Thereafter, the reflux liquid is returned to the top of the stripping column to enhance methane recovery. The overhead nitrogen-rich product (stream 96) was mixed with the fuel gas (helium-lean stream), which was produced from the helium extraction unit and used as a cooling stream in the high-pressure mixed refrigerant (MR). Conversely, the final LNG product exits from the bottom and is sent to the storage tank.

4. Results and Discussions

4.1. Base Case

LNG product flowing at a rate of 5106.42 MMSCFD is depressurized from 10 to 1.1 bar, the tank pressure, generating FBOG equivalent to 238.75 MW (LHV basis). The LNG is transferred through the pipelines and gain up to 0.4 MW of heat-generating 33.30 MW of BOG on an LHV basis. Additionally, the heat leak into the storage tank is 1.041 MW, which generates a BOG equivalent to an LHV of 87.13 MW. As previously discussed, loading a specific volume of net liquid into the tank can displace an equivalent volume of BOG vapor. To explain, loading 9954 cum/h of LNG into the cargo tank displaces an equivalent volume of 20,104 kg/h BOG with a density of 2.02 kg/m3. This volume accounts for 254.97 MW of BOG on an LHV basis. Consequently, the total LHV rate of BOG generated during the loading process is 614.14 MW. During the loading process, the LNG is discharged from the storage tank at a high flow rate of 867 m3/h, which in turn decreases the pressure inside the tank. Thus, make-up gas is added to the storage tank to maintain the operating pressure and prevent a vacuum. As the BOG is colder than the ambient temperature, it is able to be used for this purpose, as it will add less heat to the tank than the addition of external other gases (i.e., nitrogen, or a mixture of nitrogen and methane [34].
In this simulation, the use of BOG as the make-up gas was integral, as the required make-up gas provided the difference between unloading 10,000 m3/h and loading rates of 867 m3/h. The required make-up gas automatically updates in response to changes in loading or TBOG generation.
When the make-up gas requirement is much greater than the available TBOG, the balanced amount was secured with the JBOG. For instance, the calculations indicated that the total TBOG generation rate during the loading process is 11,132 m3/h. Removing 10,000 m3/h of LNG from the tank while feeding at 867 m3/h suggests that 9133 m3/h is required for VR. According to this simulation, the make-up gas need represents 82% (out of 27.16 MMSCFD) of the generated TBOG. Thus, for the base case operation and normal circumstances, only 4.88 MMSCFD (or 18%) of the TBOG should be taken out of the storage tank, while the remaining should be left in the tank as make-up gas. The total fuel needs supplied from the BOG (TBOG and JBOG) and LFG during the loading operation mode exclude the fuel being supplied from SFG and RFG, which is equivalent to 659.86 MW on an LHV basis. Out of the LHV equivalent fuel need, 400.69 MW was supplied from the TBOG and LFG, and the remaining 259.16 MW was taken from the JBOG. This fuel supply strategy results in an excess JBOG with an LHV of 355.06 MW.

4.2. BOG Minimization and Recovery Strategies

4.2.1. JBOG Liquefaction

As per the base case simulation results, there is a 355.06 MW surplus JBOG at the export terminal. Prior to liquefaction, the JBOG is compressed to lower its dew point and facilitate the condensation process. To validate this, a sensitivity analysis was carried out to examine the effect of pressure on the dew point temperature of the BOG, excess LNG, and fuel requirement. As shown in Figure 4a, the dew point temperature increases as a result of higher JBOG compression pressure. In essence, when the JBOG is fed into the refrigeration unit at high pressure, the liquefaction temperature becomes higher, which facilitates the refrigeration process. Similarly, Figure 4b illustrates the effect of JBOG compression on the LNG (i.e., liquefied BOG) and fuel need for the recovery process, as it indicates how the higher the pressure, the less excess LNG availability. Further, the required power and fuel for the recovery process increase. To explain, a higher compression power is required to achieve a higher JBOG pressure, and consequently, a higher fuel rate will be needed to drive the gas turbines, which will be taken from BOG. Thus, a greater amount of BOG used for fuel translates to less BOG liquefaction and thus less excess LNG. As such, there is a trade-off between refrigeration power requirements and greater LNG production. To determine which is more appropriate, economic and thermodynamic analyses are required.
For this study, the pressure was set at 50 bar, consuming 0.9 MW compression power, which is equivalent to the fuel of 3.1 MW LHV to drive a simple GT with 30% efficiency. As the pressure was not selected with a specific criterion, it is highly recommended to identify the optimum operating pressure in the future. Similarly, the hypothetical refrigeration cycle’s fuel requirement to generate 2.8 MW power and liquefy BOG at −160.81 °C was calculated to be 9.03 MW. Thus, the total fuel requirement for the BOG re-liquefaction process is 12.13 MW, accounting for 3.3% of the total excess BOG. Thus, the selected temperature resulted in liquefying 96.7% of the BOG. These results of excess JBOG distribution are presented in Figure 5.
The recovery of the waste BOG increased the annual LNG production by 0.02 MMTA at the cargo tanks. As the LNG price is roughly $7/MMBtu, the aforementioned energy recovery could increase the annual profit of the LNG plant by $7.36 million.
This strategy helps to debottleneck the LNG export terminals, as it allows for the conversion of residual power into a greater LNG production capacity. However, compressing and pumping the recovered BOG from the loading facility and the transport of refrigerant from the existing C3MR cycle to the loading facility would require separate cryogenic pipelines, which would be associated with additional capital costs. To ameliorate this challenge, a standalone refrigeration cycle (with a separate refrigerant loop) can be installed in the loading terminal. For this case, both the capital and operating costs should be taken into account.
Additionally, the loading process is not continuous, which implies that the BOG generation is intermittent, and the corresponding start-up and shutdown of the BOG liquefaction process may cause operational problems such as disruption to the fuel system, difficulties in planning and scheduling, and airflow into pipes during the shutdown. Moreover, another limitation to this option is the expensive cryogenic equipment and the challenges associated with handling due to the low-temperature operation issues. For instance, ductility loss of material, deformation of the crankcase, and mechanical friction under bone-dry running conditions [35].

4.2.2. LNG Sub-Cooling

LNG Subcooling after NRU

For this strategy, a standalone refrigeration cycle to further cool the LNG product was placed before the storage unit. Figure 6a illustrates the effect of the LNG temperature on the rate of TBOG generation. Initially, the total TBOG generated is LHV around 252 MW. Lowering the LNG temperature causes a dramatic decrease in the FLTBOG amount until it is completely eliminated with a temperature between −162.42 and −161.58 °C. To explain, from a thermodynamic perspective, at the same operating pressure, lowering the temperature will result in a lower vapor fraction. Similarly, the HLTBOG incrementally decreases and reaches a negligible amount within the temperature range of −164.10 and 163.26 °C. As such, the LNG temperature reduction, prior to storage, allows for the elimination of all TBOG. This is attributable to the fact that the saturated LNG evaporates after the addition of an insignificant amount of heat. Thus, LNG sub-cooling allows the LNG to adsorb a small amount of heat before the evaporation begins. Thus, the higher the sub-cooling degree, the lower the HLTBOG amount.
Similarly, Figure 6b shows the effect of temperature on JBOG generation. The total quantity of JBOG, in terms of LHV, slightly decreased with a corresponding decrease in the LNG temperature until it reached −163 °C, after which it drastically decreased at lower temperatures. The rate of generation for the FLJBOG and HLJBOG reached zero with a temperature between −164.95 and −164.11, which indicates that the FLJBOG and HLJBOG are able to be 100% eliminated. Conversely, only 8% of the VDJBOG was eliminated with this temperature range, and the LHV varied between 232.35 and 233.45 MW at the lowest examined temperature range. This indicates that VDJBOG is unavoidable even at extremely low temperatures, and though it is affected by temperature, it cannot be completely eliminated. Additionally, lower temperatures were not considered, as this would result in reduced BOG generation, and the available fuel would not be enough to fulfill the fuel requirement. This would result in needing to take a portion of fuel from the NG feed, which would cause lower LNG production. Thus, in contrast to the TBOG, the JBOG cannot be completely eliminated as a result of LNG sub-cooling.
The overall BOG (TBOG and JBOG) generation is negligible within the temperature range of −163 and −165 °C. However, it will not reach zero even with possible extreme sub-cooling degrees. The range of sub-cooling temperatures was minimized to find the endmost minimum generation of BOG, while the available fuel is enough to meet the system requirements without the need for an external source. Under these circumstances, the ultimate sub-cooling temperature was found to be −164 °C. At this temperature, 100% of the initial TBOG and 18% of the initial JBOG were recovered. The decrease in the BOG generation by applying the sub-cooling strategy recovered up to 0.07 MMTA of wasted LNG, which is equivalent to annual revenue of $24.58 million.
The LNG sub-cooling is a viable option to eliminate BOG generation and avoid wasting material and compression energy. As such, the recovered material has a slightly lower higher heating value (HHV) of 1168 Btu/ft3 in comparison to the conventional case with 1179 Btu/ft3. Additionally, the nitrogen content in the recovered stream increased to 0.62% mol in comparison to only 0.2% mol in the base case. This change is due to the recovery of more nitrogen with the BOG that lowers the heating value. However, the HHV of the LNG product is within the acceptable range (the specification falls between 1096 and 1140 Btu/scf).
For this strategy, the cold refrigerant should be pumped to the loading facility and the evaporated refrigerant should be compressed and returned to the plant. The implication of this operation is the use of separate cryogenic pipelines, which affects the fixed costs and the operating costs. However, energy-wise, the LNG sub-cooling lowers the chance for BOG formation, thus decreasing the energy requirement for surplus JBOG compression and liquefaction. Moreover, this energy-saving compensates for the additional energy demand for the sub-cooling process. To explain, there is an opposite effect of the two-energy consuming processes, which suggests an optimum point for energy need. Additionally, it was observed that no additional fuel was needed to achieve this degree of sub-cooling while the amount of BOG form decreased, which is advantageous as it leads to resource recovery and helps to protect the environment by reducing the amount of flared gas.

LNG Sub-Cooling in MCHE

The purpose of this option was to minimize the BOG formation from heat leakage via LNG sub-cooling in the existing refrigeration cycle, particularly in the MCHE. Herein, the LNG from MCHE is further cooled before entering the NRU–HeXU. A sensitivity analysis was first conducted to study the effect of the LNG degree of sub-cooling on various quantities of BOG. Unlike in the previous option, sub-cooling in the MCHE also affects the LFG generated from the NRU–HeXU. Additionally, the sub-cooling temperature in the range of −144 to −154.7 °C was monitored, though it was limited by the constraints of E-45 and E-46.
Figure 7a illustrates how the FLTBOG and HLTBOG are decreased at lower LNG temperature and became negligible once the sub-cooling temperature reached −148.8 °C. Given that, at this temperature, the TBOG was generated only due to heat leaks. Similarly, Figure 7b illustrates how decreasing the temperature reduces the contribution of the FLJBOG, HLJBOG, and VDJBOG, which consequently reduces the total JBOG generation. However, it was not possible to completely eliminate the BOG formation because of the vapor displacement phenomenon, which cannot be totally controlled by the degree of sub-cooling within the aforementioned temperature range.
Moreover, the stripping column in the NRU process is controlled by three factors: column temperature, operating pressure, and the temperature of the LNG from the MCHE [36]. Varying the temperature of the LNG from the MCHE affects the rate of LFG generation. Figure 7c presents the variation of LFG LHV as a function of temperature. It was observed that the LFG amount significantly decreased from 314 MW at the base case temperature (−144 °C) down to 264.229 MW at approximately −148 °C, after which point it increased again. The jump in the graph signifies how the NRU–HeXU operates abnormally at this temperature in such a way that the LFG increases by nearly 50%. Thus, the maximum degree of sub-cooling was limited to −148 °C, as this seemed to be the maximum degree of sub-cooling that the existing process could appropriately handle.
At a temperature of −148 °C, out of 892.23 MW on an LHV basis, 13% is eliminated due to sub-cooling in the MCHE only. Given that, the remaining total BOG is 773.59 MW, with 27% used as VR and 51% used as fuel, and the remaining 22% requires handling to fully utilize the available BOG. The excess BOG (equivalent to 171.88 MW) is further recoverable through liquefaction in a separate refrigeration cycle as outlined in Section 3.4.1. To liquefy this amount, roughly 2 MW is needed, which is equivalent to 6.4 MW fuel of LHV. This distribution is illustrated in Figure 8.
Accordingly, this strategy integrates LNG sub-cooling into the MCHE with a surplus amount of BOG liquefaction while the fuel requirement is satisfied. Thus, a net-zero BOG emission and maximum LNG production are achievable with this strategy.
Additionally, for this strategy, it was noted that the LFG that is sourced from LNG was lowered by nearly 19% in comparison to the base case. This indicates feeding more LNG into the storage tank. However, a lower LFG means a greater portion of BOG is necessary for the fuel supply, which ultimately eliminates excess BOG. As such, the integrated strategy results in net-zero BOG out of the system, with 100% recovery achieved.
The recovered LNG was estimated to be 0.03 MMTA, which is equivalent to 52 MW HHV LNG and accounts for an annual extra profit of $12.24 million. However, this revenue does not include retrofitting and operational expenses.
However, a key future recommendation when considering cooling in the MCHE is that different process variables need to be monitored with the required adjustments made to keep a steady and controlled refrigerant supply. Monitoring the process variables will ensure that the MCHE cooling is within acceptable cool down rate guides.

4.2.3. LFG Reflux

This option aimed to lower the fuel sourced from the NRU by adding a reflux section to the nitrogen scrub column. In Aspen Plus® software, a combination of design specs and calculator options were used to maintain the process constraints and required specifications (i.e., nitrogen content, temperature, and pressure). A sensitivity analysis was used to identify the range of reflux condenser temperatures and their effect on the whole system. Figure 9a illustrates the variation of LHV for the LFG, TBOG, and JBOG as a function of the temperature in the reflux condenser. Lower temperature resulted in a significant decrease in the amounts of LFG and BOG.
Likewise, Figure 8 and Figure 9 illustrate the variation of LNG at the jetty (MMTA) and excess JBOG in the plant on LHV basis (MW). Low temperatures increase the reflux back to the column and subsequently increase the LNG production, with a considerable portion of the fuel taken from BOG, which in turn results in a negligible amount of BOG formation at approximately −173 °C. However, the temperature cannot be further lowered because of fuel deficiency constraints. However, at −174 °C the reflux flow was 28.65 MMSCFD, which accounts for a 56% reflux ratio with 50% less generated LFG in comparison to the conventional scenario. Under this condition, the TBOG and JBOG decreased by 0.31% and 3.7%, respectively.
Another major factor affecting the LFG reflux is the reduction in the amount of methane in the rejected nitrogen stream. Sensitivity analysis was used to determine how the methane content in the column’s overhead correlates to the change in the reflux condensing temperature.
As highlighted in Figure 9c, this strategy reduces the amount of methane in the rejection stream, as 6% of the methane entering the NRU–HeXU is recovered in the reflux at −174 °C. The increased methane content in the LNG at the export terminal by 0.6% translates to more than 0.2 MMTA of LNG, which corresponds to 35.1 MW surplus LNG LHV. The additional profit associated with this increment is roughly $8.14 million/year. However, with the increase in the LFG reflux and LNG production, the N 2   content in the fuel gas increased and consequently lowered the Wobbe Index, as highlighted in Figure 9d. Thus, implementing this strategy requires monitoring the N2 level in the LNG to ensure it is within the acceptable limit to be used as fuel. The process of the LFG scenario is simple to operate, reliable, and could easily be integrated into a new or existing LNG plant.

5. Comparison

Table 2 lists the main results of the proposed strategies. All strategies allow 100% recovery of the BOG. Ensuring minimal to zero flaring helps avoid the waste of energy and material. The case of LNG subcooling after NRU is the best option, which resulted in 0.07 MMTA surplus LNG, which translates to $24.58 million per annum as profit. This is followed by LNG sub-cooling in MCHE, and finally, LFG reflux and JBOG liquefaction result in almost equivalent surplus LNG. In contrast, N2 content in LNG is higher in LNG sub-cooling in MCHE and LNG sub-cooling after NRU compared to the other two options (LFG reflux and JBOG Liquefaction).
While these processes may provide a greater profit, they have higher N2 content in the LNG, which affects the quality of the LNG. As such, there is a trade-off between the quantity and quality of the LNG. Therefore, further rigorous analysis is needed to determine the best option that considers the various aspects and nuances of LNG profit.

6. Conclusions

This study addressed boil-off gas (BOG) (including TBOG and JBOG) handling in an actual LNG plant export terminal as one of the main issues facing the liquefied natural gas (LNG) sector. BOG is generated in an export terminal due to several factors, including LNG depressurization, heat leak into the LNG storage tanks, carrier, process equipment, process piping, and displaced vapor from the LNG tanks during the loading and unloading processes. Additionally, BOG requires proper handling and utilization to decrease energy and economic loss while simultaneously increasing the profitability of the LNG plant. Various strategies (BOG liquefaction, LNG sub-cooling, and NRU reflux) were proposed to handle surplus BOG in an actual baseload LNG plant. A shortcut approach was followed for the quick evaluation of the proposed options. This study was unique, as it took into account the fuel requirements for the proposed processes, indicating that all of the proposed configurations were coupled with maintaining the appropriate fuel level. Another novelty of the proposed options is that integration of more than one BOG handling strategy was considered whenever excess BOG presented. All of the options proved the capability to increase the LNG production, which consequently increases the profit of the LNG plant.

7. Future Recommendations

The results and discussion in this work demonstrated how the proposed options could increase both LNG production and profit. The approach and conclusions are a good starting point for further rigorous analysis and a more accurate assessment of the proposed BOG management strategies. Nonetheless, the optimum point for each case was determined using a sensitivity analysis defined by the maximum attainable LNG production only, though it should also consider the minimum retrofitting, the feasibility of implementation, capital cost, operating cost, and maintenance needed. As such, future work should consider: (1) an economic analysis of all of the proposed options, with consideration for the capital and operating costs, and (2) a rigorous simulation to investigate the convergence of the suggested scenarios and to obtain the exact values of different aspects of each scenario, such as the LNG production, BOG generation, and power consumption. The aforementioned aspects are necessary to obtain an accurate assessment and comparison of all of the scenarios.
For simplicity and to obtain a quick evaluation of the proposed strategies, a steady state was assumed for the inherently dynamic operations, including heat leakage into tanks, pipping, LNG loading and unloading, and subsequently JBOG generation.
For the heat leakage from the tanks, the steady-state assumption could only be valid if the LNG is stored for an appropriate duration at variant liquid levels. However, with a steady-state process, the maximum JBOG generation is examined, leading to less surplus LNG, which results in needing smaller equipment. Thus, the use of a dynamic model for tank operations (heat leakage, loading, and unloading) is highly recommended to better represent the system and obtain precise BOG generation rates.

Author Contributions

Data curation, A.R.S.; Formal analysis, F.A.; Investigation, E.I.A.-m., M.A.K. and M.M.H.; Methodology, Z.B. and I.A.K.; Project administration, H.A. All authors have read and agreed to the published version of the manuscript.

Funding

This paper was made possible by NPRP11S-1231-170152 grant No. NPRP-from the Qatar Na-tional Research Fund (a member of the Qatar Foundation). The statements made herein are solely the responsibility of the authors.

Conflicts of Interest

The authors declare no conflict of interest.

Nomenclature

BOGBoil-off gas
FLBOGFlash boil-off gas
FLJBOGFlash jetty boil-off gas
FLTBOGFlash Tankage boil-off gas
GHGGreenhouse gas
HeXUHelium extraction unit
HHVHigher Heating Value
HLBOGHeat leak boil-off gas
HLJBOGHeat leak jetty boil-off gas
HLTBOGHeat leak tankage boil-off gas
JBOGJetty boil-off gas
LFGLean fuel gas
LHVLower heating value
MCHEMain cryogenic heat exchanger
MMSCFDMillion standard cubic feet per day
MMTAMillion metric tons per annum
NRUNitrogen rejection unit
RFGRich fuel gas
SFGSour fuel gas
TBOGTankage boil-off gas
VDVapor displacement
VDBOGVapor displacement boil-off gas
VDJBOGVapor displacement jetty boil-off gas, vapors displaced due to cargo/ship tank filling.
VDTBOGVapor displacement tankage boil-off gas, vapors displaced due to storage tank filling.
VRVapor replacement or makeup gas

References

  1. Dudley, B. BP Energy Outlook 2030; IAEE: Cleveland, OH, USA, 2011. [Google Scholar]
  2. Tilagone, R.; Venturi, S.; Monnier, G. Natural gas-an environmentally friendly fuel for urban vehicles: The smart demonstrator approach. Oil Gas Sci. Technol. 2006, 61, 155–164. [Google Scholar] [CrossRef] [Green Version]
  3. Khan, M.I.; Yasmin, T.; Shakoor, A. International experience with compressed natural gas (CNG) as environmental friendly fuel. Energy Syst. 2015, 6, 507–531. [Google Scholar] [CrossRef]
  4. Faramawy, S.; Zaki, T.; Sakr, A.-E. Natural gas origin, composition, and processing: A review. J. Nat. Gas Sci. Eng. 2016, 34, 34–54. [Google Scholar] [CrossRef]
  5. Kakaee, A.-H.; Paykani, A. Research and development of natural-gas fueled engines in Iran. Renew. Sustain. Energy Rev. 2013, 26, 805–821. [Google Scholar] [CrossRef]
  6. U.S. Energy Information Administration—EIA—Independent Statistics and Analysis; United States Energy Information Administration—EIA: Washington, DC, USA, 2013.
  7. The Natural Gas. Industry Has a Methane Problem; NRDC: New York, NY, USA, 2019. [Google Scholar]
  8. Scientists UoC. Environmental Impacts of Natural Gas; Union of Concerned Scientists: Cambridge, MA, USA, 2014. [Google Scholar]
  9. Methods of Natural Gas Transport; Egypt Oil & Gas: Cairo, Egypt, 2014.
  10. Kumar, S.; Kwon, H.-T.; Choi, K.-H.; Lim, W.; Cho, J.H.; Tak, K.; Moon, I. LNG: An eco-friendly cryogenic fuel for sustainable development. Appl. Energy 2011, 88, 4264–4273. [Google Scholar] [CrossRef]
  11. Corporation EM. 2018 Outlook for Energy: A View to 2040; Energy Global: Irving, TX, USA, 2018. [Google Scholar]
  12. Global BP. BP Statistical Review of World Energy June 2017. 2017. Available online: https://www.bp.com/content/dam/bp/business-sites/en/global/corporate/pdfs/news-and-insights/speeches/bp-stats-review-2019-bob-dudley-speech.pdf (accessed on 22 May 2021).
  13. Petroleum, B. BP Energy Outlook 2035; BP Stats: London, UK, 2014. [Google Scholar]
  14. Wu, M.; Zhu, Z.; Sun, D.; He, J.; Tang, K.; Hu, B.; Tian, S. Optimization model and application for the recondensation process of boil-off gas in a liquefied natural gas receiving terminal. Appl. Therm. Eng. 2019, 147, 610–622. [Google Scholar] [CrossRef]
  15. Bao, J.; Yuan, T.; Zhang, L.; Zhang, N.; Zhang, X. Comparative study of three boil-off gas treatment schemes: From an economic perspective. Energy Convers. Manag. 2019, 201, 112185. [Google Scholar] [CrossRef]
  16. Bouabidi, Z.; Katebah, M.A.; Hussein, M.M.; Shazed, A.R.; Al-musleh, E.I. Towards improved and multi-scale liquefied natural gas supply chains: Thermodynamic analysis. Comput. Chem. Eng. 2021, 151, 107359. [Google Scholar] [CrossRef]
  17. Katebah, M.A.; Hussein, M.M.; Shazed, A.; Bouabidi, Z.; Al-musleh, E.I. Rigorous simulation, energy and environmental analysis of an actual baseload LNG supply chain. Comput. Chem. Eng. 2020, 141, 106993. [Google Scholar] [CrossRef]
  18. Liu, C.; Zhang, J.; Xu, Q.; Gossage, J.L. Thermodynamic-analysis-based design and operation for boil-off gas flare minimization at LNG receiving terminals. Ind. Eng. Chem. Res. 2010, 49, 7412–7420. [Google Scholar] [CrossRef]
  19. Huang, S.; Hartono, J.; Pankaj, S. BOG recovery from long jetties during LNG ship-loading. In Proceedings of the 15th International Conference and Exhibition on Liquefied Natural Gas (LNG15), Barcelona, Spain, 24–27 April 2007; Gas Technology Institute: Barcelona, Spain, 2007; Volume 2, p. PO-34.1. [Google Scholar]
  20. Li, Y.; Chen, X.; Chein, M.-H. Flexible and cost-effective optimization of BOG (boil-off gas) recondensation process at LNG receiving terminals. Chem. Eng. Res. Des. 2012, 90, 1500–1505. [Google Scholar] [CrossRef]
  21. Wicaksono, D.S.; Karimi, I.A.; Alfadala, H.; Al-Hatou, O. Integrating recovered jetty boil-off gas as a fuel in an LNG plant. In Proceedings of the 17th European Symposium of Computer Aided Process Engineering, Bucharest, Romania, 27–30 May 2007. [Google Scholar]
  22. Hasan, M.F.; Karimi, I.; Avison, C.M. Preliminary synthesis of fuel gas networks to conserve energy and preserve the environment. Ind. Eng. Chem. Res. 2011, 50, 7414–7427. [Google Scholar] [CrossRef]
  23. Jang, N.; Shin, M.W.; Choi, S.H.; Yoon, E.S. Dynamic simulation and optimization of the operation of boil-off gas compressors in a liquefied natural gas gasification plant. Korean J. Chem. Eng. 2011, 28, 1166–1171. [Google Scholar] [CrossRef]
  24. Shin, M.W.; Shin, D.; Choi, S.H.; Yoon, E.S. Optimal operation of the boil-off gas compression process using a boil-off rate model for LNG storage tanks. Korean J. Chem. Eng. 2008, 25, 7–12. [Google Scholar] [CrossRef]
  25. Zakaria, M.S.; Osman, K.; Abdullah, H. Greenhouse Gas Reduction by Utilization of Cold LNG Boil-off Gas. Procedia Eng. 2013, 53, 645–649. [Google Scholar] [CrossRef] [Green Version]
  26. Romero, J.; Orosa, J.A.; Oliveira, A.C. Research on the Brayton cycle design conditions for reliquefaction cooling of LNG boil off. J. Mar. Sci. Technol. 2012, 17, 532–541. [Google Scholar] [CrossRef]
  27. Romero Gómez, J.; Romero Gómez, M.; Lopez Bernal, J.; Baaliña Insua, A. Analysis and efficiency enhancement of a boil-off gas reliquefaction system with cascade cycle on board LNG carriers. Energy Convers. Manag. 2015, 94, 261–274. [Google Scholar] [CrossRef]
  28. Kurle, Y.M.; Wang, S.; Xu, Q. Dynamic simulation of LNG loading, BOG generation, and BOG recovery at LNG exporting terminals. Comput. Chem. Eng. 2017, 97, 47–58. [Google Scholar] [CrossRef]
  29. Kurle, Y.M.; Wang, S.; Xu, Q. Simulation study on boil-off gas minimization and recovery strategies at LNG exporting terminals. Appl. Energy 2015, 156, 628–641. [Google Scholar] [CrossRef]
  30. Cho, H.; Shah, S.; Lim, K. Case History for Gas Re-Liquefaction System at the Pyeongtaek LNG Terminal. 2000. Available online: http://www.ivt.ntnu.no/ept/fag/tep4215/innhold/LNG%20Conferences/2000/Data/Papers/Cho.pdf (accessed on 30 April 2021).
  31. Mokhatab, S.; Poe, W.A.; Speight, J.G. Handbook of Natural Gas Transmission and Processing; Gulf Professional Pub.: Oxford, UK, 2006. [Google Scholar]
  32. Uwitonze, H.; Lee, I.; Hwang, K.S. Alternatives of integrated processes for coproduction of LNG and NGLs recovery. Chem. Eng. Process. Process. Intensif. 2016, 107, 157–167. [Google Scholar] [CrossRef]
  33. Jin, C.; Lim, Y. Optimization and economic evaluation of integrated natural gas liquids (NGL) and liquefied natural gas (LNG) processing for lean feed gas. Appl. Therm. Eng. 2019, 149, 1265–1273. [Google Scholar] [CrossRef]
  34. Kurle, Y.M.; Xu, Q.; Palanki, S. Dynamic simulation study for boil-off gas minimization at liquefied natural gas exporting terminals. Ind. Eng. Chem. Res. 2017, 57, 5903–5913. [Google Scholar] [CrossRef]
  35. Kwak, D.-H.; Heo, J.-H.; Park, S.-H.; Seo, S.-J.; Kim, J.-K. Energy-efficient design and optimization of boil-off gas (BOG) re-liquefaction process for liquefied natural gas (LNG)-fuelled ship. Energy 2018, 148, 915–929. [Google Scholar] [CrossRef]
  36. Chen, F.; Okasinski, M.; Sabram, T. Novel Nitrogen Removal Schemes for LNG Plants with Electric Motor Drive and Varying Feed Composition. 2015. Available online: http://www.airproducts.net.br/~/media/Files/PDF/company/company-overview/news-center/LNG18-nitrogen-removal.pdf (accessed on 30 April 2021).
Figure 1. BOG distribution by source, (a) during holding mode, (b) during loading mode.
Energies 14 03478 g001
Figure 2. LNG plant flow block diagram.
Energies 14 03478 g002
Figure 3. (a) Base-case flowsheet, (b) excess JBOG liquefaction, (c) LNG sub-cooling after NRU, and (d) LFG reflux.
Energies 14 03478 g003aEnergies 14 03478 g003b
Figure 4. Effect of JBOG compression before liquefaction, (a) variation of BOG dew point temperature, (b) effect on LNG product and fuel requirement.
Energies 14 03478 g004
Figure 5. Excess JBOG distribution in JBOG liquefaction scenario.
Energies 14 03478 g005
Figure 6. Effect of LNG sub-cooling temperature on (a) TBOG LHV, (b) JBOG LHV.
Energies 14 03478 g006
Figure 7. Effect of MCHE sub-cooling temperature on (a) TBOG LHV, (b) JBOG LHV, and (c) LFG LHV.
Energies 14 03478 g007
Figure 8. BOG distribution in LNG subcooling in MCHE strategy.
Energies 14 03478 g008
Figure 9. Effect of NRU reflux condenser temperature on (a) BOG and LFG, (b) excess JBOG and LNG production, (c) methane content of LFG, and (d) nitrogen content and Wobbe index of LFG.
Energies 14 03478 g009
Table 1. Chain feed conditions and LNG product specifications at the export terminal tank [17].
PropertyCondition
Feed condition
Temperature, °C27
Pressure, bar80
NG feed compositionMole fraction, %
Nitrogen4.50
Hydrogen-sulfide1.50
Carbon-dioxide2.84
Methane80.83
Ethane4.75
Propane1.79
Butanes1.03
Pentane+2.57
BTX0.13
Mercaptans0.02
LNG product condition at the tank inlet
Temperature, °C≤−158
HHV, BTU/SCF1000 to 1200
LNG production, MTA3.65
LNG product compositionMole fraction (%)
Nitrogen≤1.24
Methane85 to 97
Hydrogen sulfide, ppm≤4
Maximum carbon dioxide, ppm≤57
Water, ppm≤0.1
Table 2. BOG minimization/recovery strategies summary.
JBOG LiquefactionLNG Sub-Cooling after NRULNG Sub-Cooling in MCHELFG Reflux
Excess LNG Flow (MMTA)0.020.070.030.02
Profit (Million $/year)7.6324.5812.248.14
%N20.22%0.57%0.93%0.38%
TBOG LHV, MW277.90.0237.3262.1
JBOG LHV, MW617.9464.0540.3572.2
LFG LHV, MW350.8350.8277.571.9
Publisher’s Note: MDPI stays neutral with regard to jurisdictional claims in published maps and institutional affiliations.

