Article

Assessing Future Water Demand and Associated Energy Input with Plausible Scenarios for Water Service Providers (WSPs) in Sub-Saharan Africa

1
Institute for Water and Resource Management, Faculty of Civil Engineering, Vienna University of Technology, Karlsplatz, 1040 Vienna, Austria
2
Biological Sciences Department, Faculty of Sciences, Egerton University, P.O. Box 536-20115, Egerton, Kenya
3
Water Security Research Group, Biodiversity and Natural Resources Program, International Institute for Applied Systems Analysis (IIASA), Schlossplatz 1, 2361 Laxenburg, Austria
*
Author to whom correspondence should be addressed.
Energies 2021, 14(8), 2169; https://doi.org/10.3390/en14082169
Submission received: 15 March 2021 / Revised: 6 April 2021 / Accepted: 8 April 2021 / Published: 13 April 2021
(This article belongs to the Special Issue Energy Water Food Nexus)

Abstract

:
This study examined the current state of water demand and associated energy input for water supply against a projected increase in water demand in sub-Saharan Africa. Three plausible scenarios, namely, Current State Extends (CSE), Current State Improves (CSI) and Current State Deteriorates (CSD) were developed and applied using nine quantifiable indicators for water demand projections and the associated impact on energy input for water supply for five Water Service Providers (WSPs) in Kenya to demonstrate the feasibility of the approach based on real data in sub-Saharan Africa. Currently, the daily per capita water-use in the service area of four of the five WSPs was below minimum daily requirement of 50 L/p/d. Further, non-revenue water losses were up to three times higher than the regulated benchmark (range 26–63%). Calculations showed a leakage reduction potential of up to 70% and energy savings of up to 12 MWh/a. The projected water demand is expected to increase by at least twelve times the current demand to achieve universal coverage and an average daily per capita consumption of 120 L/p/d for the urban population by 2030. Consequently, the energy input could increase almost twelve-folds with the CSI scenario or up to fifty-folds with the CSE scenario for WSPs where desalination or additional groundwater abstraction is proposed. The approach used can be applied for other WSPs which are experiencing a similar evolution of their water supply and demand drivers in sub-Saharan Africa. WSPs in the sub-region should explore aggressive strategies to jointly address persistent water losses and associated energy input. This would reduce the current water supply-demand gap and minimize the energy input that will be associated with exploring additional water sources that are typically energy intensive.

Graphical Abstract

1. Introduction

Energy is a major input and cost factor for water supply. It effects the operational costs recovery of water supply and the ability of Water Services Providers (WSPs) to extend and deliver quality water services [1]. The largest energy consuming devices are the pumping systems which take up to 90% of the total energy input for water abstraction, conveyance, treatment, and distribution [2]. Energy requirement for water supply is influenced mainly by the operational efficiency of water supply infrastructure, type of raw water input, climate, topographical features, and water consumption patterns [3].
In recent years, there is an increased focus on water and energy efficiency measures for WSPs due to high and unstable energy prices, an ever-increasing water demand and the need to explore alternative water sources that are relatively less energy intensive. Consequently, undertaking energy efficiency measures provides opportunities for WSPs to manage operational costs and enhance operational sustainability through a systematic reduction in energy costs without compromising on the quality of service delivered [4]. However, as noted in [5], the motivation to implement energy efficiency measures by most WSPs is largely due to requirements by the sector regulators or legislation to avoid penalties as opposed to an intrinsic motivation for improving revenue generation for the expansion of service. In addition, most WSPs concentrate on efforts to reduce daily volume of water losses alone. However, such efforts are not sufficient to support impactful operational efficiency and sustainability of services since water loss reduction interventions including pressure management, leaks detection and repair also affect energy demand [6,7,8].
The provision of water services is largely influenced by demographic and socio-economic drivers on the demand side, and climatic variables, technological development, and pollution of water sources on the supply side. Whereas demand side drivers are usually within the operational and management boundaries of WSPs, supply side drivers especially availability of water supply typically go beyond those boundaries [9]. Long-term projections of water service provision by WSPs show increase in water demand in areas projected to experience sustained population growth and the influence of climate change on water sources [10,11]. Consequently, a shift in the state of these drivers continues to widen the water supply-demand gap and the need to explore alternative water sources that are often energy intensive [10]. High rates of urbanization which is largely arising from expansion of metropolitan areas and population growth within the service areas of WSPs requires increased production of water and associated increase in energy demand to convey water from different sources to consumers. In addition, growth in Gross Domestic Product resulting in increased per capita income increases the per capita water demand as consumers can afford to pay for water services. On the other hand, the role of climate change on water supply especially in Africa has been addressed in [11,12]. Most projections point to increased precipitation and wetter days in the Eastern, Central and Western Africa regions compared to the Northern and Southern Africa where reduced precipitation and extended drier period months are expected by 2050 [12]. Hence, there will be increased need to explore energy-intensive water sources including deep-aquifer groundwater supplies or extensive desalination schemes in the latter regions [13]. Additionally, increased infrastructural capacity challenges to cope with water shortages especially in urbanizing areas in sub-Saharan Africa are expected [14].
Furthermore, the total population in Africa is expected to reach 2 billion people, with about 55% of this population expected to live in urban and urbanizing areas by 2050 [14]. Additionally, the expansion of unplanned urban sprawls complicates establishment and expansion of safely managed water supply infrastructure. Hence, most of the population rely on water vendors where the quality is sometimes compromised [15]. Although progress has been reported in access to basic water services, with an average of 56% of urban population with access to improved water supply in 2018, large populations in rural and urban poor areas are still without access to improved water services in many countries sub-Saharan Africa [16]. Additionally, the lack of water supply infrastructure and the poor state of existing water supply infrastructure in some places makes the ambition to achieve target 6.1 of the 2015 Sustainable Development Goal 6 on universal water coverage by 2030 unattainable. Although there are some WSPs which are performing relatively well with non-revenue water losses below the stipulated national benchmark, many WSPs in the sub-region are performing poorly with very high non-revenue water losses [17]. Therefore, joint long-term strategies to address the growing water demand, persistent water losses and associated energy needs for water supply are needed.
However, implementing joint water and energy management measures to increase efficiency is a major challenge for many WSPs, especially in low-income countries in sub-Saharan Africa. Such challenges include (i) budgetary constraints for service expansion, (ii) rapidly evolving water demand and supply drivers, (iii) persistently huge water losses and associated energy input, (iv) large proportions of the population still without access to water services, (v) increased energy demand and a lack of appropriate metrics to assess and benchmark energy use performance and (vi) aging infrastructure leading to high system inefficiencies. These challenges have persisted despite numerous interventions to address poor performance of WSPs and inability to deliver water services effectively [17]. Consequently, there is a clear need to make a turn-around from the business-as-usual approach to address the persistent water losses and inefficiencies in the associated energy input for water supply [18]. This shift can be explored through envisioning plausible future scenarios of water availability and supply-demand ratio and exploring long-term feasible options available. This approach is particularly useful when dominant trends are part of the problem (e.g., increased water scarcity, persistent water losses and inefficiencies in associated energy input). In addition, the approach can be applied when the problem is complex and requires a major overhaul and the time horizon is long enough for consideration of alternative possibilities and developing strategic action plans [19].
The aim of this study is to assess the energy requirements for water supply against a rapid change in water demand. Three plausible scenarios are developed and applied to estimate future water demand and the associated energy input required. The approach was applied for five WSPs in Kenya to demonstrate the potential application of the approach for WSPs in sub-Saharan Africa with similar evolution of their water supply and demand drivers. In addition, some potential solution options WSPs could implement are explored to address the anticipated water demand-supply gap and the associated energy input that would be required. The following research questions are put into context: What is the current state of water demand and supply and associated energy input for water supply? How will the expected increase in water demand influence energy input for water supply to meet water demand in future? What are the feasible solution options for WSPs to address current and expected increase in water demand and the associated energy input for water supply?

2. Rationale for the Study

Long-term planning for water demand and supply requires an understanding of the major water demand and supply drivers through projections and predictions of evolution of these drivers. The future state of these drivers is highly uncertain and complex water supply challenges will likely continue in the future. Accordingly, several studies have provided projections of future water demand and supply at short and medium-term [20] and long-term horizons [11] and at global, regional, national, and local scales [21]. Nevertheless, uncertainty in the evolution of water demand and supply drivers remains a major threat to water supply. Consequently, WSPs need to explore possible alternatives and consider the implications of exploring and pursuing plausible scenarios and water management options associated with those scenarios. Deriving plausible narratives from likely scenarios in the future is a powerful tool to understand uncertainties and inform policy and planning in water sector management [22]. Long-term planning and management strategies of future water supply and demand are guided by the following fundamental questions: How much water would be supplied to meet projected water demand in the future? How will water demand and supply drivers evolve to influence water supply and energy requirements for water supply? Which additional water sources would be abstracted to meet projected water demand? How will energy input for water supply change based on the likely water sources that would be abstracted?
To address these questions, different approaches including forecasting, backcasting and scenario building are applied [19]. Forecasting entails predicting the future based on assumptions and extrapolation of current and historical trends over a specific period (hours, days, weeks or years) while backcasting is a normative approach which entails exploration of desired and attainable futures and pathways to achieve set goals by looking at the current situation from a future perspective in a retrospective way and directing strategies towards achieving the desired futures. On the other hand, scenario building entails formulation of hypothetical narratives of possible futures which are employed in strategic decision planning to explore alternatives to deal with future uncertainties. A scenario is a consistent view of what the future might look like without forecasting it. It entails building images about the desired future or the future wished to be avoided relative to the past and present situation, and articulation of how the present-future gap may be bridged [19]. Scenario building seeks to understand the pathways and approaches of the potential futures that can be avoided or could be missed to promote preparedness for the future. According to [22], scenario building approach in addressing water sector challenges entails the following steps:
(1)
Definition of the problem and driving forces from which uncertainties arise,
(2)
Drafting the narratives (storylines) and assumptions,
(3)
Quantification of the future development and intensification of the driving forces
(4)
Quantification of water-related variables
Broad narratives of socio-economic changes under different future pathways have been quantified and described at a global scale as shared socio-economic pathways presented in [21]. However, alignment of the proposed scenarios with globally developed and modelled pathways enhances consistency of the scenarios. It also allows for assessment of different studies across different disciplines and are an important tool for research with limitations to generate own comprehensive scenarios of future changes in socio-economic parameters, for which projections do not vary significantly with different models [22,23]. In this context, comprehensive narratives of three future development scenarios namely the sustainability road, the middle of the road and the regional rivalry until 2050 and some projections extended until 2100 have been provided in [21].
This study builds upon the background work and approach of scenarios development used by the Water Security Research Group at the Internal Institute for Applied Systems Analysis (IIASA) [21]. The approach was adapted to generate specific narratives for three plausible futures relevant for water supply and demand management with implications on energy demand for water supply in sub-Saharan Africa until 2030.

3. Materials and Methods

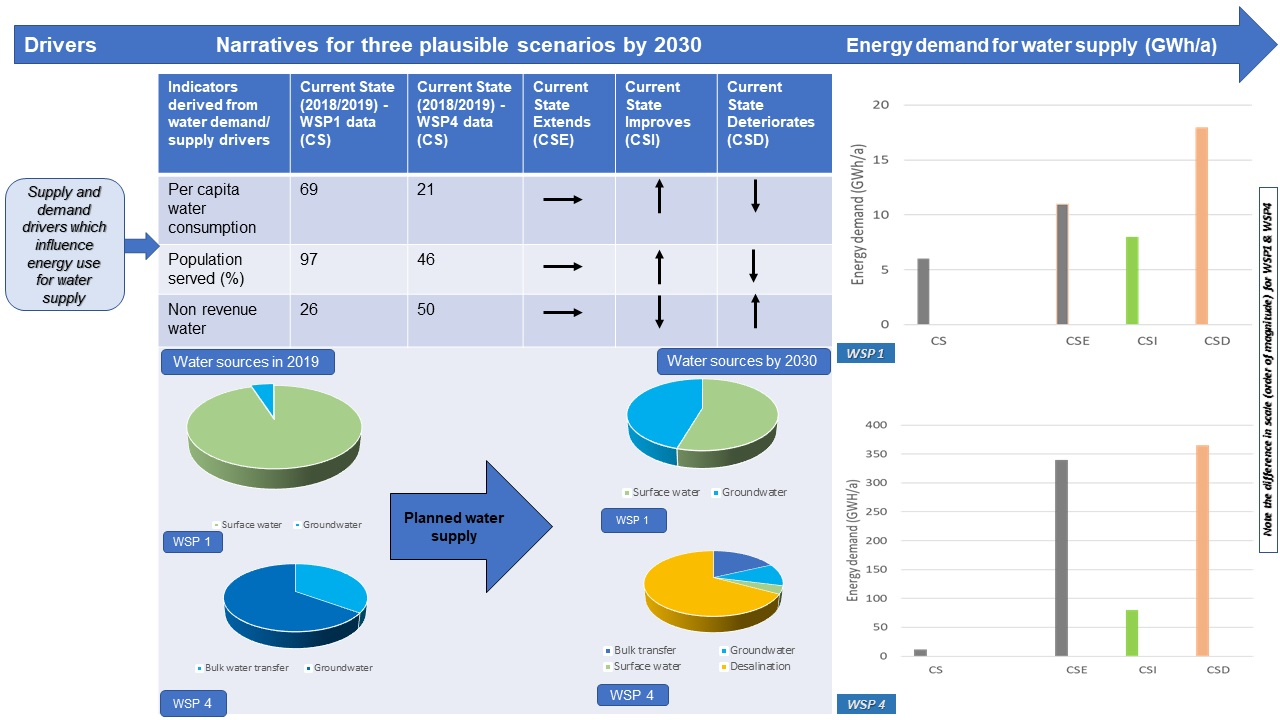
3.1. Scenarios Development

Table 1 summarizes narratives of water demand and supply drivers, associated parameters, and their likely evolution across three plausible scenarios, namely, Current State Extends (CSE), Current State Improves (CSI), and Current State Deteriorates (CSD). These narratives are the basis for data acquisition and scenario calculations used for the current study. Population growth and urbanization are major water demand driver which influence service coverage and the daily per capita water demand. Furthermore, economic growth influences the per capita water demand and hence per capita energy demand for water supply. In addition, leverage on technology influences system operations through optimization and scheduling of pumps and motors and enhances the efficiency of the water supply system.

3.1.1. Scenarios Description

The Current State Extends (CSE) scenario would mean continued high population growth and expansion of urban and metropolitan areas and large population especially in urban poor and rural areas without access to safely managed water supply; WSPs would still struggle to meet the projected water demand with huge uncertainty in fulfilling future increase in water demand; In addition, the adoption of highly efficient water treatment and supply technology develops gradually, and the huge water losses currently would continue unchecked or moderately addressed, requiring WSPs to explore other water sources, which would be energy intensive; The water losses and associated energy input would remain above the regulated benchmark for most WSPs; Huge energy bills and frequent power outages would affect service delivery and operational sustainability.
The Current State Improves (CSI) scenario would lead towards sustainability in water supply systems. It assumes that even though increased water demand is expected from a huge population growth and high rates of urbanization, WSPs can meet the water demand and achieve universal coverage of water supply services. Further, planned urban development would translate to increased water demand but a large part of the population would afford to pay for water services due to increase in income levels. Increased cooperation between WSPs would enhance peer learning on best practices and benchmarking would be fully adopted to enhance water and energy efficiency. Water losses would be below the regulated benchmark and energy inefficiencies associated with water losses would be at or below stipulated benchmark levels. In addition, WSPs would seek to transition to decentralized renewable energy sources which would reduce over-reliance on the national energy grid and reduce service interruption. High energy efficiency and low energy costs due accelerated leverage on technology including for pump scheduling and system-wide optimization would mean WSPs operate efficiently.
The Current State Deteriorates (CSD) scenario would mean a huge segment of population are still without water services in most regions; There would be little or no motivation to address water losses and system inefficiencies, hence, little progress in efficiency enhancement and in implementation of water and energy-saving technologies; some WSPs would continue to perform well while others lag behind due to high competition and non-cooperation; water losses remain high and transition to clean energy for water supply would progress at a slow pace; benchmarking and peer learning of best practices in energy efficiency would be lacking. Lack of water demand management strategies would result in accelerated non-revenue water losses and reduced ability for WSPs to meet operational costs and generate revenue. In addition, continued reliance on the grid would mean huge electricity bills and frequent power cuts leading to service interruption. The possibility of this scenario playing out is credible as an increase in non-revenue water by up to 23% points and a reduction in the per capita water production by half in the last decade in some WSPs in Kenya was observed. An illustration of deterioration regarding non-revenue water, reduction in per capita water consumption and water coverage for selected WSPs in Kenya over the last decade is provided as Supplementary Material. The data was compiled from the annual performance reports of the Water Services Regulatory Board of Kenya (WASREB) and additionally from the WSPs.

3.1.2. Quantification of Scenario Parameters

Table 2 provides a selection of water supply and demand parameters and the reference values that applied in this study for calculations. The criteria for the selection and definition of quantified parameters list as outlined in [24] and the quantified values were adopted from the key performance indicator benchmark values set by WASREB [25]. Additionally, since energy assessment is not considered a key performance indicator for the assessment of WSPs in Kenya, reference values were adopted from literature. The quantified parameters were then applied in selected WSPs in Kenya to assess the current state of water supply drivers and energy input as presented in Section 4.1 in the results section and for the estimation of future water demand and the energy requirement for water supply under the three plausible scenarios.
Several assumptions were developed to generate the coefficients used for the quantifiable parameters applied for the three plausible scenarios (Table 2). Although the assumptions were developed from analysis of the Kenyan water supply and demand situation, the assumptions and approach used can be applied for other WSPs in sub-Saharan Africa. The assumptions are as follows:
  • Population growth and urbanization continues to grow at similar rates for all three scenarios until 2050.
  • Universal water supply by 2030 with a per capita water demand of 120 L/p/d is assumed for the CSI scenario. For the CSE scenario, the average value of the current per capita water demand for each WSP is considered, whereas the basic daily per capita water demand of 20 L/p/d as prescribed by the World Health Organizations hierarchy of water requirements was used for the CSD scenario.
  • The WASREB benchmark for non-revenue water loss (20%) is assumed as the most feasible option in the foreseeable feature and applied for the CSI scenario while the current values reported for each WSP were assumed for the CSE scenario. A non-revenue water loss of 20% for the CSI scenario is still very high compared to reported values in developed countries, which averages at 10% in Australia and Japan or less than 10% in the Netherlands (5%), Denmark (7%), [26]. However, achieving 20% level can be considered a significant improvement of the current state given that the current non- revenue water loss levels in Kenya average at 43%, having reduced by only four-percentage point in the last decade.
  • The average non-revenue water loss reported in 2018/2019 is assumed for the CSE scenario. On the other hand, the highest non-revenue water loss reported among the five WSPs was assumed for the CSD scenario. An increase in non-revenue water loss to 63% from 25% (WSP1) for the CSD scenario may seem unlikely but the likelihood of this scenario playing out is plausible. An illustration showing such a deterioration over a ten-year period is provided as Supplementary Materials for two WSPs in Kenya which are not considered in the current study. (see Supplementary Materials)
  • Universal coverage of piped water supply by registered WSPs is assumed for the projections and applied for the CSI scenario. Whereas the reported coverage for each WSP is assumed to continue in the CSE scenario. 50% coverage in piped water supply in the respective service area of the WSPs is assumed for CSD scenario.

3.2. Water Demand and Water Demand-Supply Gap Analysis

Municipal water demand is categorized into residential and non-residential water demand. This study focuses on residential water demand. The water demand was estimated as the total annual volume of water needed to meet the daily per capita water demand as provided in [3]. This was estimated by multiplying the total population served by the average daily per capita water use and converting the estimates to m3/year. These estimates assume no significant seasonal variation in the daily per capita water use.
On the other hand, a water supply-demand gap is defined as the difference between the quantities of water available and supplied and the unmet demand which exists if the available supply is lower than the demand. Gap analysis helps to assess the current situation and what is required to achieve the target milestones [32]. Gap analysis entails identification of a desirable target level, analysis of the current situation and assessment of the difference between the current and the desired level.
To provide an overview of the current situation regarding water demand, water supply and the unmet demand, a baseline situation analysis was undertaken on the water demand, the major water sources composition, total energy budget, pump and total energy efficiency assessment and the projected population growth, urbanization was analyzed. Three-year data was obtained from selected WSPs reports and examination of the last ten-year performance reports by the water services regulator. This provided a starting point of the diagnostic picture of the current energy demand, the energy consuming processes and extent of water and energy losses and the water demand gap.

3.3. Water Loss Reduction

Water losses within the water supply networks are largely attributed to background leaks and pipe bursts. The volume of water lost through detectable leaks is highly dependent on the response time to detect and repair the leaks. Thus, the volume of water saved through leaks could be estimated as shown in Equation (1) following a similar approach in [33]. It is crucial in the water balance to show the state of the network and the annual volumes lost based on the leaks detected and repaired per year. This approach assumes that about 95% of leaks within the supply network are detected and corrected:
Volume lost per detectable leak = Total volume lost through leaks (m3)
Total number of leaks detected
Furthermore, once the volume lost through detectable leaks is established, it is possible to estimate the leakage reduction potential based on the current leakage levels. This was estimated following a similar approach in [29]:
Leakage Reduction Potential = Volume lost through Current Leakage −
Minimum Leakage level

3.4. Estimation of Energy Input and Assumptions for the Three Scenarios

Several metrics exist for the estimation of energy input for water supply [24,30]. Specific energy input is a widely used metric for energy checks and energy performance assessment. However, this metric is not applicable for comparison of energy use for water supply systems in varying topographic locations. To estimate the energy intensity for water supply, the lower limit of energy intensity values obtained from peer-reviewed literature for different water sources was applied for the CSI scenario, whereas the upper limit of the same was applied for the CSD scenario. For the CSE scenario, data on energy input for water supply and the type of raw water supplied was obtained from selected WSPs. The unit energy intensities for the supply of the different water types were used for the estimation of energy requirements for each WSP based on estimates provided in [3,34,35]. For the supply of surface water, the energy intensity was 0.02 kWh/m3 for the CSI and 0.64 kWh/m3 for the CSD while for groundwater supply, 0.40 kWh/m3 and 0.94 kWh/m3 were applied under CSI and CSD scenarios, respectively. For desalination using reverse osmosis, 0.79 kWh/m3 was adopted for CSI and 3.5 kWh/m3 for CSD scenarios, respectively.
The theoretical minimum energy consumption for lifting one cubic meter of groundwater to a height of one meter in a frictionless, water-loss free system at high-efficiency (up to 100% efficiency) is estimated at 0.0027 kWh [34]. Furthermore, the energy requirement for surface water supply is highly dependent on the distance from source to consumers, water losses and pump efficiency. This has been reported to range from 0.02–0.41 kWh/m3 in Kenya [35] and up to 4.07 kWh/m3 for inter-basin water transfer over about 745 km in Spain [34]. On the other hand, the minimum specific energy requirement for conventional desalination processes varies greatly with salt concentration, water recovery potential and the treatment process used [36]. Reverse osmosis is the most common desalination process with specific energy requirement for sea water estimated at 3–7 kWh/m3 for a production capacity of 24,000 m3/day, while for electrodialysis it is estimate at 2.6–5.1 kWh/m3, for multi-stage flash thermal distillation is estimated at 23–68 kWh/m3 and 6.5–11 kWh/m3 for multiple-effect distillation for a production capacity of 5000–15,000 m3/day [37,38]. Reverse osmosis was chosen for this study as it is the most common desalination process with relatively lower energy intensity compared to thermal processes [34,38].
In addition, the per capita energy input for water supply was estimated as stated in [3] by multiplying the energy intensity for water supply by the expected per capita water consumption (PCWC) for the three scenarios.

3.5. Data Collection

Five representative Water Service Providers (WSPs) in Kenya were selected for the current study. For anonymity, the WSPs have been labelled WSP1, 2, 3, 4, & 5. Field visits were made to each WSP and structured questionnaires were used to obtain the reported data from representatives of the technical team at the WSPs.
Table 3 summarizes the systems characteristics based on the latest available data from the WSPs. The transmission length averaged at 592 km in WSP5 and slightly over one thousand in WSP3. The number of hours of water supply per day was lowest in WSP3 and WSP4, averaging at 6 and 5 h per day respectively against an acceptable benchmark of 16–20 h per day. Additionally, the average pump efficiency ranged from 60–70% and the age of the pumps in operation ranged from 8–14 years. The maintenance schedules were mostly scheduled on monthly basis.
The first question posed in the selection of the WSPs as suggested in [6], was: is energy efficiency an issue for the WSPs and if so, is it likely to be an issue of major concern as water demand grows? This was an important reflection since some WSPs are largely gravity-fed, with relatively low energy costs compared to their total operational costs. Hence, energy input for water supply is currently not of major operational concern. A minimum three-year data was obtained through field visits, questionnaires, and interviews with selected WSPs in Kenya. Data was obtained on water supply, water demand, energy use for water supply and proposed water supply plans for the WSPs as outlined in [25]. Further, the 2030 Kenya National Water Management Plan (NWMP2030), drafted to provide estimates of available water resources and propose water resources available to close the water demand-supply gap in Kenya, was analyzed for projections on water demand and supply and proposed raw water sources for the year 2030 [39]. Additionally, the strategic plans of the selected WSPs were examined to derive scenario narratives and quantify the selected parameters
Due to the projected accelerated urbanization and expansion of metropolitan areas, four of the five WSPs selected were in the Very Large (with over 35,000 connections within the service area) and one Large (with 10,000–34,999 connections) category of WSPs, based on the size categorization used by WASREB. The five WSPs abstracted both surface and groundwater in varying proportions. The population in the service areas is largely urban, with all of them experiencing expanding metropolitan areas some of which lack water supply infrastructure. The WSPs operate several boreholes with groundwater wells about 150–200m below ground. WSP2, WSP3 and WSP4 largely rely on bulk water transfer pumped at estimated distances of 30–50 km from the source to the treatment plants and or to the consumers.

4. Results

4.1. Estimates of Water Demand and Supply Driver Parameters

To provide an overview of the current state of the water supply and demand drivers for selected WSPs and a basis to show evolution of the drivers for the three plausible scenarios, this section presents an analysis of quantified parameter as outlined in Table 2. The parameters quantified include population in the service areas of WSPs, current water demand and the water demand-supply gap, water losses and the estimated leakage reduction potential as well as the energy input for current water supply.

4.1.1. Total and Urban Population in the Service Areas of WSPs

Table 4 shows the total population and the urban population within the service area of the five WSPs for 2020 and the projected years (2030 and 2050) using the medium-variant population growth as the base for all scenarios. The population in the service areas of the five WSPs is expected to double between 2020 and 2030, reaching almost three times the 2020 estimates by 2050. However, most of the expanding urban areas do not have water supply infrastructure in place and most of the population rely on decentralized water supply sources through tankers and small-scale vendors. The urban population is expected to accelerate in all WSPs, except for WSP5 where about 66% of the population within its service area are projected to live in urban areas compared to WSP3, for example, where over 90% of the population in the service area will be urban.

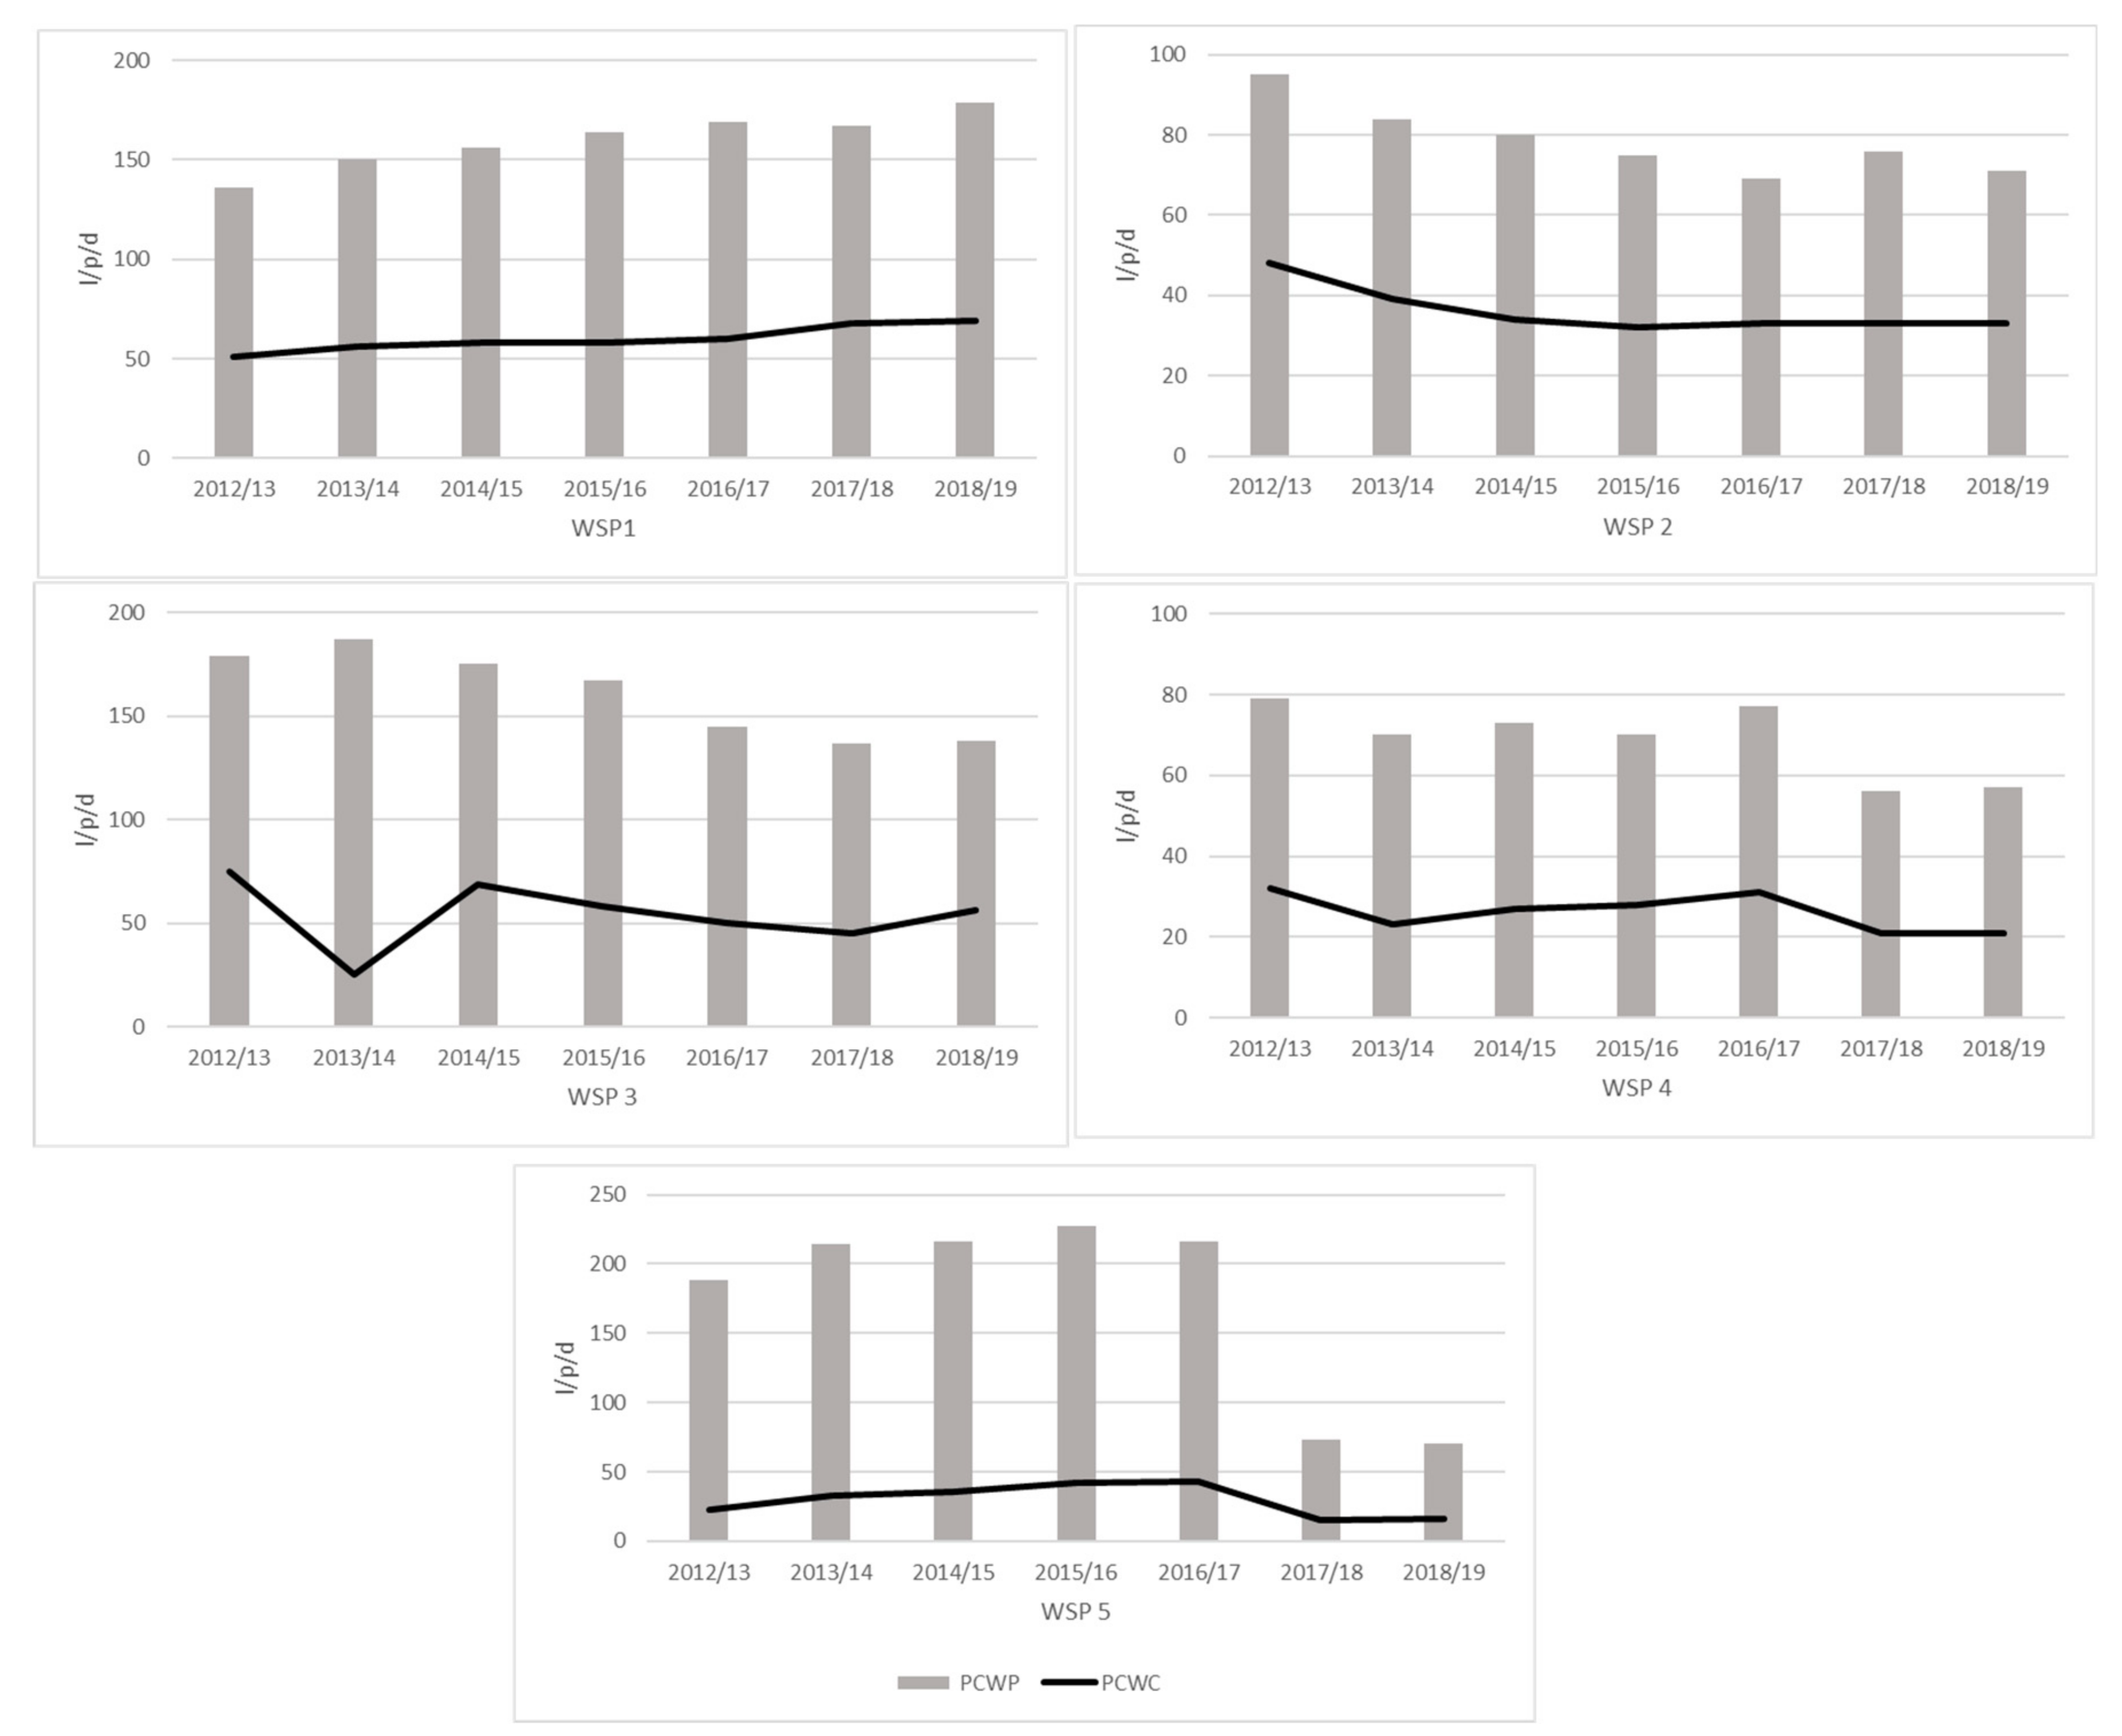
4.1.2. Water Production and Consumption

The daily per capita water production (PCWP) and per capita water consumption (PCWC) provides estimates of the average daily volume of water supplied and utilized per person in liters per person per day (L/p/d) within the jurisdiction of the WSPs. Figure 1 presents a seven-year trend of daily per capita water production and per capita water consumption for five WSPs in 2012–2019. During this period (2012–2019), WSP1 reported the highest per capita water consumption among all the WSPs. The per capita water consumption increased 5% per annum (51 in 2012/2013 to 69 L per person per day in 2018/2019). On the other hand, per capita water consumption decreased for the other four WSPs at an annual average of 7%, 6%, 10% and 21% in WSP 2, WSP3, WSP4 and WSP5, respectively. For instance, there was a decrease in the per capita water consumption in WSP2 from 48 L/p/d in 2012/2013 to 33 L/p/d in 2018/2019 and 75 L/p/d to 56 L/p/d in WSP 3 within the same period.
Additionally, WSP1 had an increase in per capita water production from 136 L/p/d to 179 L/p/d between this period. In comparison, WSP4 had a decline in per capita water production from 79 L/p/d to 57 L/p/d and a reduction in per capita water consumption from 79 L/p/d to 21 L/p/d. At WSP5, per capita water production decreased from 188 L/p/d to 70 L/p/d while per capita water consumption declined from 25 L/p/d to 16 L/p/d within the same period. However, an increase in per capita water production and consumption was observed between 2014 and 2017, and a steep decline in the years 2017 through 2019.
In the 2018/2019 financial year, water coverage in the service areas of WSP1 and WSP2 was 97% and 93% respectively. The coverage for WSP3, WSP4 and WSP5 was comparatively lower, i.e., 79%, 46% and 62%, respectively. However, although WSP2 reported drinking water coverage above the acceptable benchmark set by the national water regulator (>80%), the daily per capita water consumption was below the minimum requirement of 50 L/p/d. WSP4 and WSP5 also reported water coverage below the stipulated benchmark and the daily per capita water consumption was almost half the recommended daily consumption.

4.1.3. Water Demand-Supply Gap Analysis

Table 5 compares the per capita water demand to the volume supplied (i.e., volume produced less the non-revenue water) and the deficit (gap) thereof to achieve the domestic water demand at the current water loss levels for all WSPs. WSP1 had the smallest water-demand-supply gap of 3% and as noted above, the highest per capita water consumption among all the WSPs considered. WSP2 and WSP3 have a 12% and 30% gap respectively between the water supplied and the water demand. The largest gap was observed for WSP4 and WSP5 with 50% and 35% of the current water supply needed. Intriguingly, WSP4 and WSP5 had the highest rates of non-revenue water losses (Table 6 This implies that although the per capita water production was relatively higher at WSP4 and WSP5, 57 L/p/d and 68 L/p/d, respectively in 2019, a large proportion of the water produced was lost as non-revenue water.

4.1.4. Water Losses and Leakage Reduction Potential for the Year 2019

Non-revenue water (NRW) loss at the five WSPs was above the regulated benchmark for WSPs in Kenya. Non-revenue water at WSP 3 was 40%. However, further analysis in this section was not possible as the data on leakage that was provided was inconsistent.
WSP5 had the highest non-revenue water loss (63% of the water supplied) compared to the other WSPs. This was more than 3 times the regulated benchmark of 20%. WSP4 reported an NRW loss of 50% while NRW loss at WSP1 and WSP2 were 26% and 32%, respectively. WSP5 had the highest water loss per connection per day which was 1213 L/connection/day compared to 264 L/connection/day for WSP1.
On the other hand, the water losses associated with leaks was estimated for each detectable leak. The estimated volume of water loss was highest for WSP2 at over 8000 m3/a compared to 788 m3/a for WSP1. Furthermore, WSP1 had the highest leakage reduction potential of up to 85% while the leakage reduction potential for WSP2 was 70%. WSP4 and WSP5 had a leakage reduction potential of 69% and 90%, respectively. This leak reduction translates to a water savings of 4333 m3/a and 5130 m3/a for WSP4 and WSP5, respectively i.e., water that could be saved from each of the leaks detected.
Both WSP4 and WSP5 had the lowest water coverage of 62% and 46%, respectively, and a per capita water consumption of 16 L/p/d and 21 L/p/d, respectively. If these high number of leaks were minimized, water savings from leaks could provide a year’s supply of the minimum per capita water requirement of 50 l per person for over 86,000 persons and over 100,000 persons in the service areas of WSP4 and WSP5, respectively. The volume of water that could be reclaimed from leakage reduction could reduce the water coverage deficits within service areas of the WSPs. For instance, the annual per capita water demand to meet the minimum daily per capita water requirement for the population within the service area of WSP2 was 9.6 M m3/a. However, only 58% of the water demand was met, yet 32% of the water supplied was lost as non-revenue water.

4.1.5. Energy Input for Water Supply–2019

Table 7 presents the energy input for water supply at the selected WSPs in 2019. The specific energy input for water supply was highest at WSP2 (1.60 kWh/m3) which largely rely on groundwater as its main raw water source. On the hand, the specific energy use for water supply was lowest at WSP5 (0.20 kWh/m3) which mostly supplied surface water. The WSPs abstracting surface water used conventional drinking water treatment methods (mixing, flocculation, sedimentation, filtration, and chlorine disinfection), with energy required mostly for chemical dosage and backwashing. The energy intensity for water treatment was very low for all five WSPs (Mean: 0.02 ± 0.03 kWh/m3; Range: 0–0.04 kWh/m3).
The standard average efficiency of the pumps was above the regulated benchmark of 0.27–0.40 kWh/m3 100 m. The specific energy input associated with water supply was also high at WSP3 and WSP4 (the largest among the selected WSPs). As a result of their size, WSP3 and WSP4 transfer water over long distances from source to consumers, thereby requiring higher energy input for pumping. Although WSP5 had the highest water losses recorded, the energy input associated with water loss was lowest as the water supply source was largely surface water with minimal energy requirements.
Per capita energy input for water supply was highest at WSP2 (37.6 kWh/p/a) largely due to the high energy consumption for groundwater supply and WSP 4 with bulk transfer of water over long distances from source to consumption. Per capita energy consumption was lowest at WSP 5 owed to the large proportion of surface water supply with minimal energy requirement and reliance on gravity for water conveyance.
WSP2 had the highest energy input associated with water loss estimated at 54 kWh/m3. However, implementation of leakage reduction could provide energy savings of up to 6 MWh/a forWSP2 and up to 2 MWh/a for WSP1 from the energy associated with water losses through leaks.

4.2. Future Water Supply and Demand and Energy Input for the Scenarios

4.2.1. Water Demand Estimates under the Scenarios

Table 8 shows the water demand in 2019 for the five WSPs and estimates for 2030 under the three scenarios. The values presented for each WSP under the scenarios are estimated following the approach described earlier. The water demand estimates for all scenarios considers the projected population for 2030. A continuation of the current state (Current State Extends) would mean water demand at WSPs 1,2,4 and 5, for example, will be double the current water demand largely attributed to increase in projected population. At WSP3, the projected water demand is expected to be almost twice as much as the current water demand under the same scenario. Estimates of the water demand under the CSI shows that the water demand could increase over four times the current state in WSP4 to meet the water demand for the total population in service area at 120 L/p/d. The highest increase in water demand is observed for WSP4 and WSP 5 which as earlier stated currently covers 46% and 62% at 21 L/p/d and 16 L/p/d respectively.

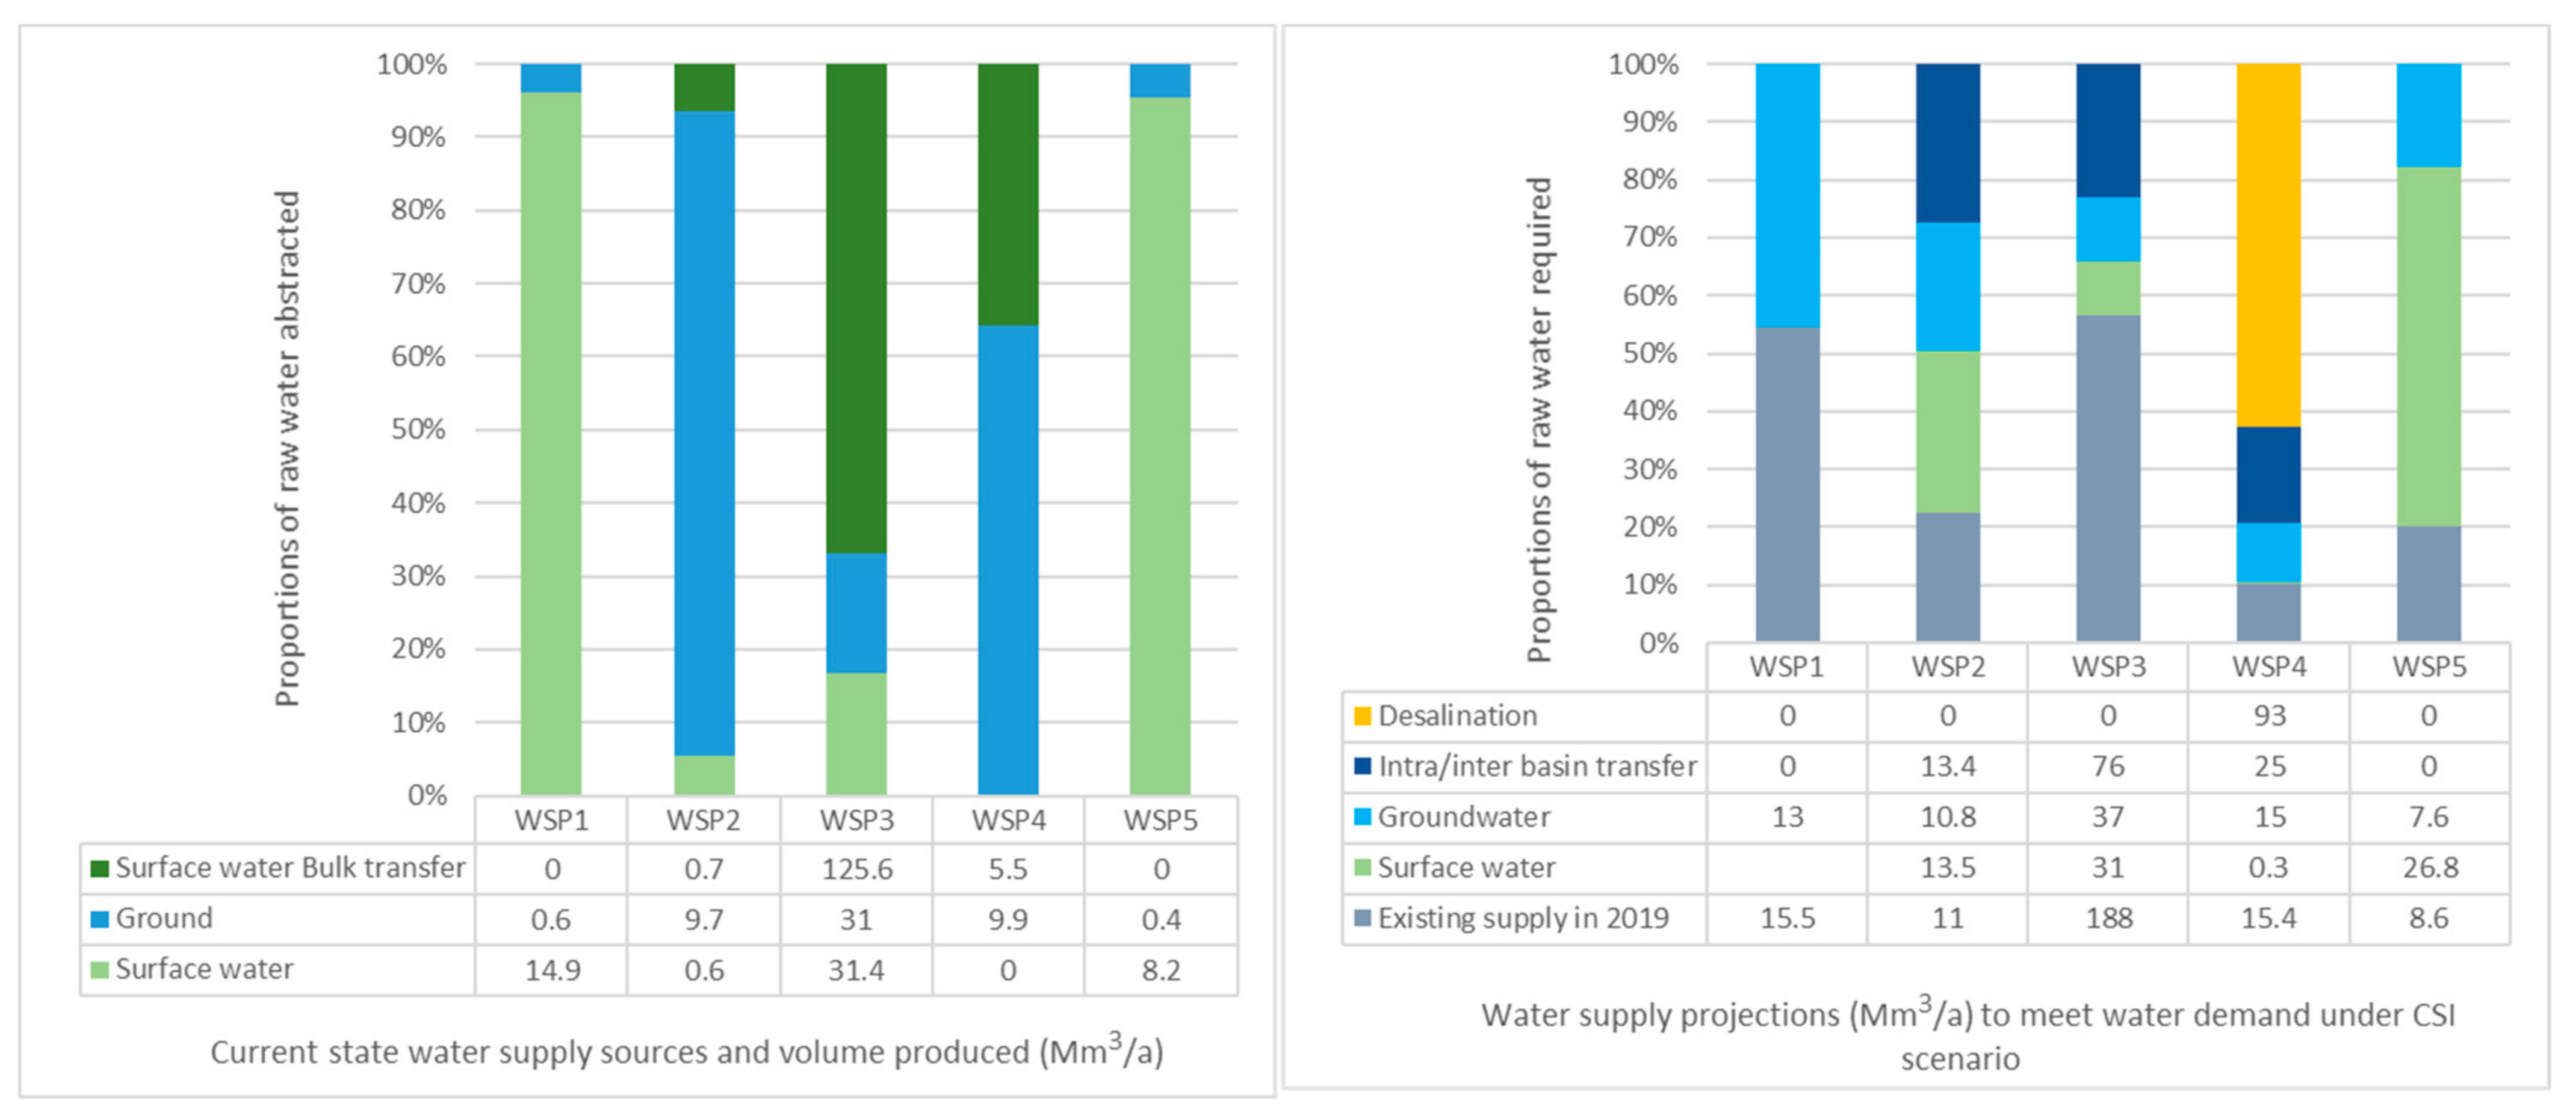
4.2.2. Water Sources to Meet Projected Water Demand

Figure 2 compares the proportions of different raw water types and volumes currently produced by each WSP and projections to meet the projected water demand under the Current State Improves (CSI) scenario. The current water production and projected estimates were used in this case as data on water sources and proportions abstracted was available.
A 100% increase in groundwater abstraction is expected at WSP1 to achieve 13 Mm3/a production needed to meet the projected demand. This increase will provide 47% of the total supply required while the existing water supply is expected to contribute 53%. On the other hand, desalination is expected to supply 93 Mm3/a at WSP4, contributing almost 60% of the total volumes required and an additional 10% increase in groundwater abstraction is expected by 2030. In addition, these projections show that existing supply only accounts for 10% of the water supply required at WSP4 to achieve the target supply and almost 90% will be contributed from new sources. An increase in bulk water transfer is expected to continue at WSP3 while for WSP2, an increase in precipitation in the catchment area (projection in NWMP2030) coupled with an increase in surface water abstraction and bulk transfer. The existing capacity for water supply will contribute to slightly over 20% at WSP2 and 50% at WSP3. WSP3 is expected to increase the proportions of bulk-transfer which will contribute over 80% of the supply.

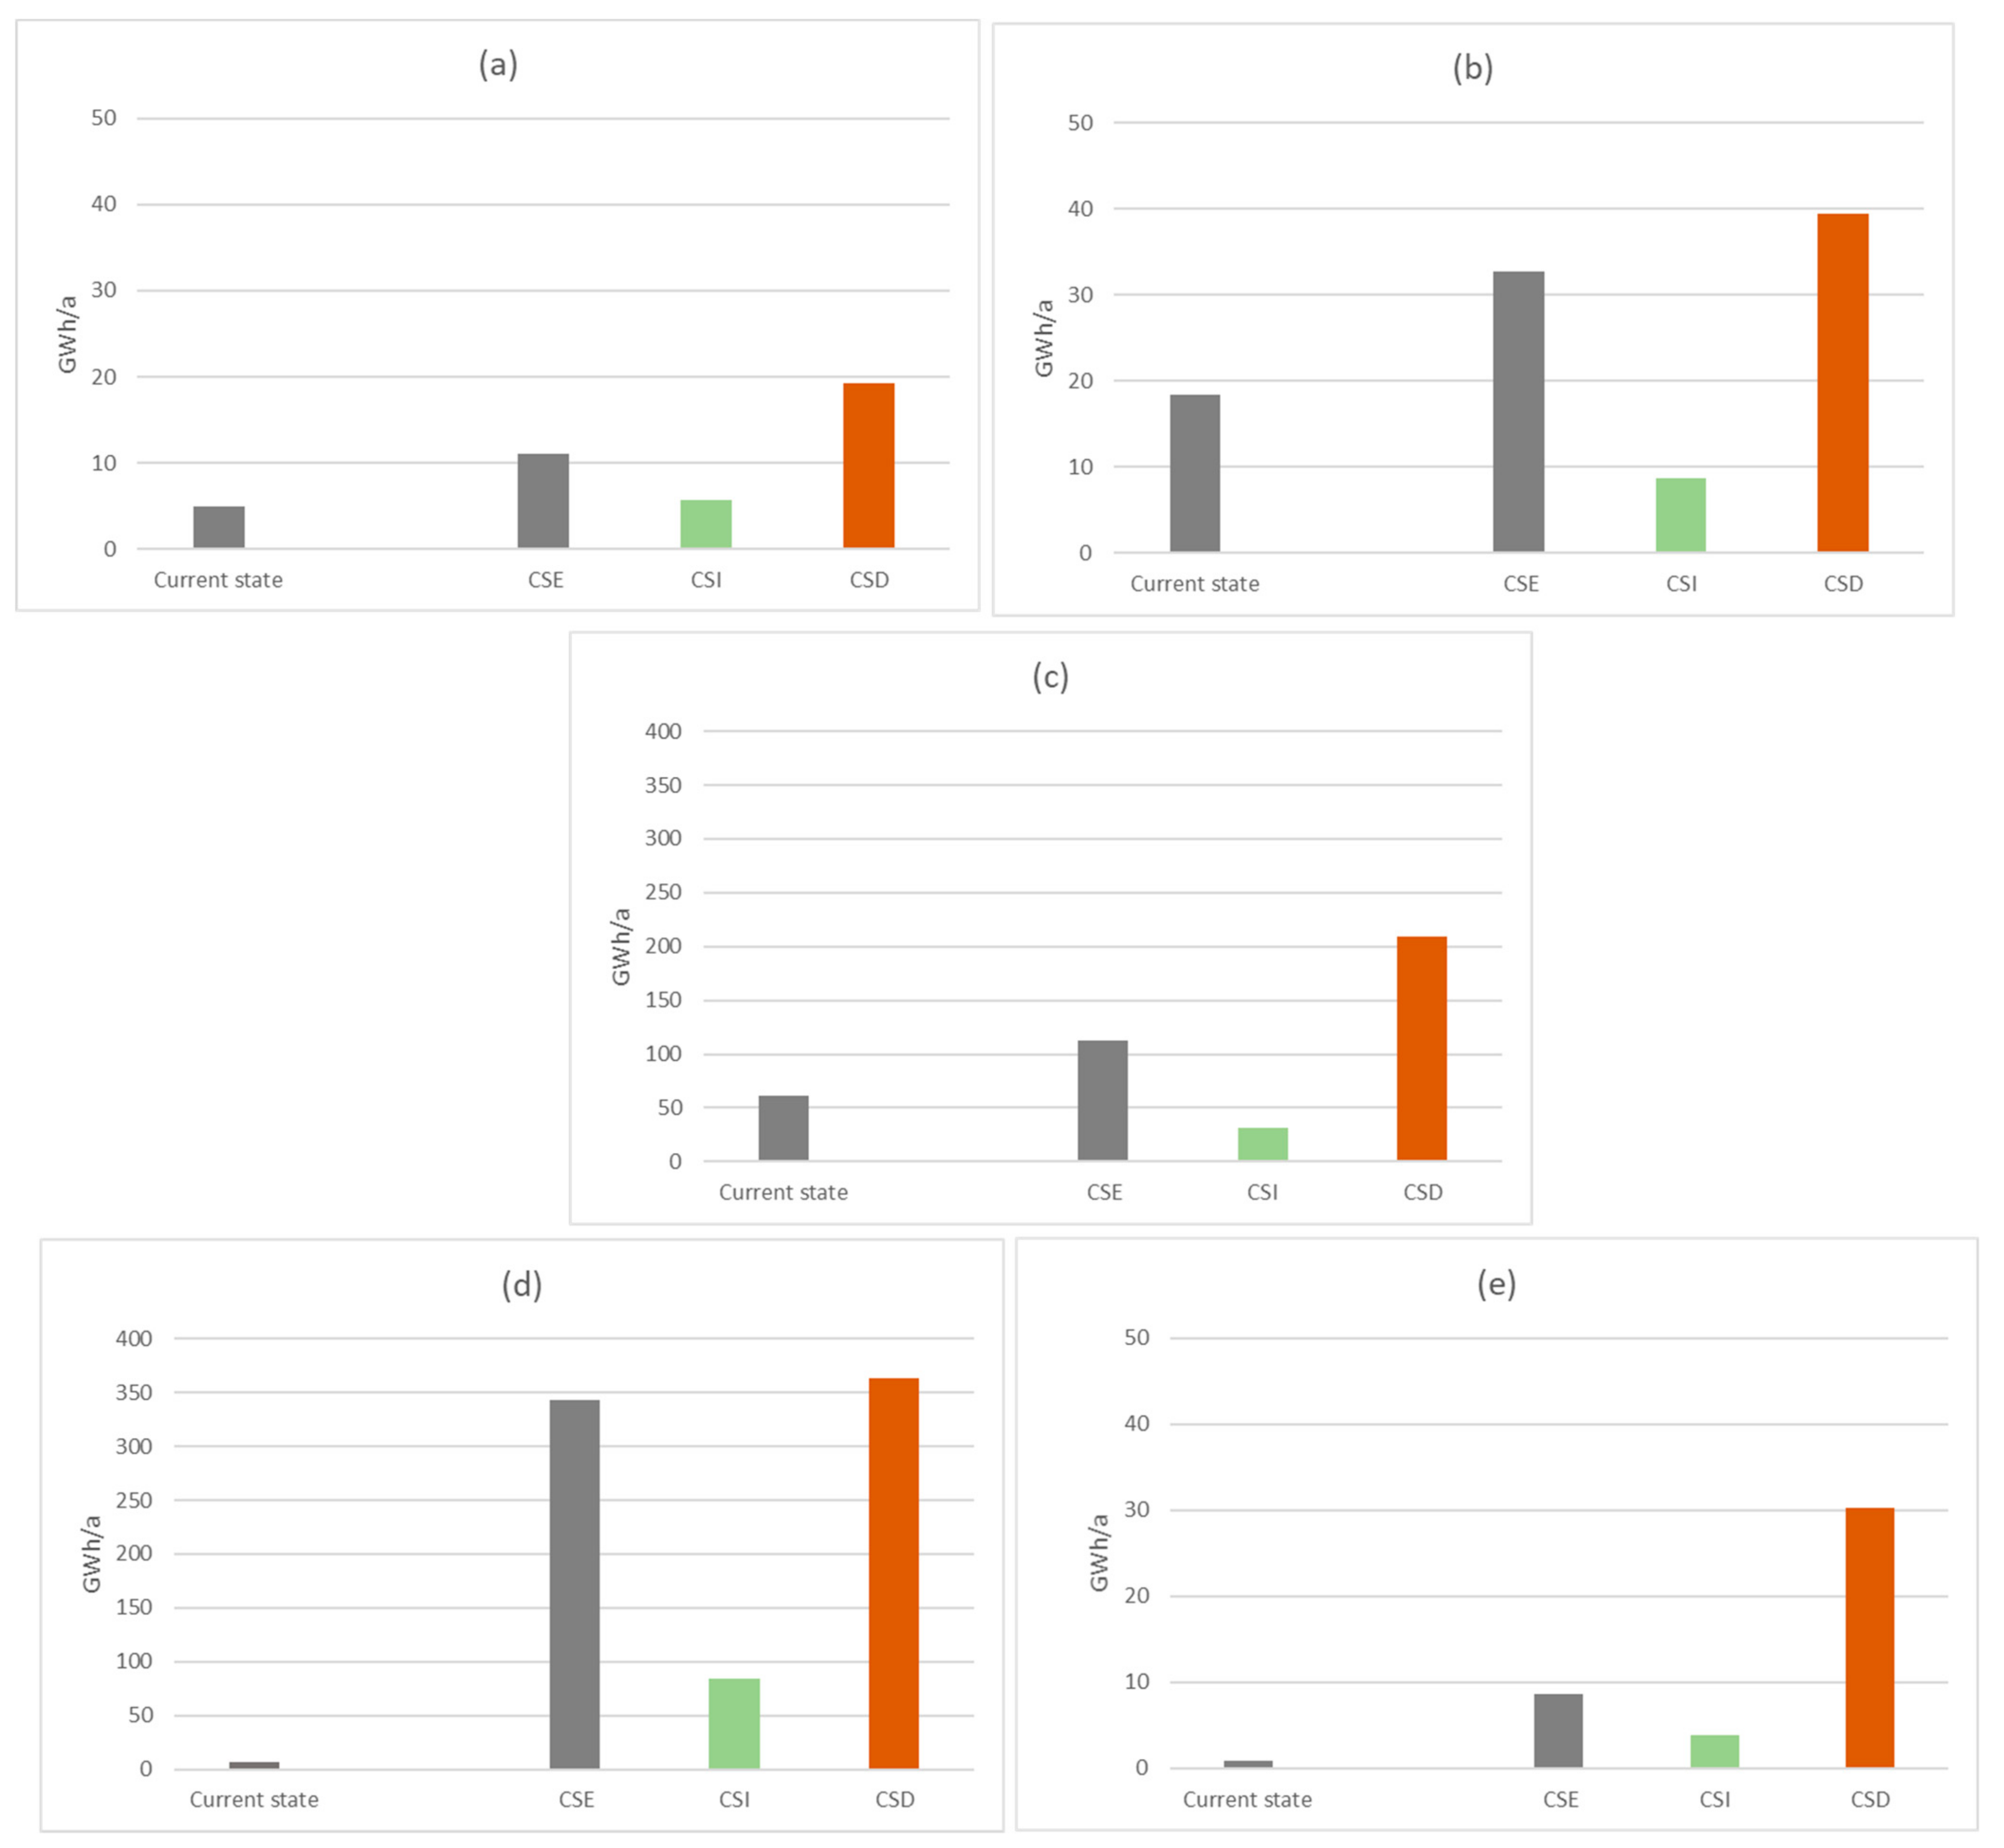
4.3. Estimates of Energy Requirement to Meet Projected Water Demand

4.3.1. Energy Intensity for Water Supply

Figure 3 provides estimates of total energy input for water supply in 2019 and the projected energy input for projected water demand in 2030 under the three scenarios (Current State Extends, Current State Improves and Current State Deteriorates).
An increase in energy input is expected at WSP1 due to increase in groundwater abstraction compared to the current groundwater production. Across the three scenarios, energy input under Current State Improves is expected to be slightly higher than the present energy demand. However, energy input could double with the Current State Extension scenario. On the other hand, energy intensity for water production could increase four-fold at WSP1 under the Current State Deteriorates.
In the case of WSP5 the energy intensity for water production will increase almost ten times due to the expected increase in groundwater abstraction under Current State Extends. With Current State Improves scenario, the energy intensity is estimated to increase by about five times compared to the current energy input. However, reduction of the current huge water losses (over half of the total production is currently lost due to NRW losses), could reduce the need for the planned investments in huge groundwater abstraction which is projected to increase from less than 1 Mm3/a to 7 Mm3/a by 2030. Addressing current NRW losses at WSP5 could reduce the need for additional groundwater abstraction and subsequently reduce the need for increased energy input for water supply in future.
WSP4 is expected to have the largest energy budget due to the plans by the service provider to abstract and desalinate saline raw water sources in addition to the extension of groundwater production and intra/inter-basin water transfer. As observed earlier, the existing water supply in the service area of WSP4 represents less than 5% of the total supply required for universal water supply by 2030. Hence, alternative water supply options will be needed to bridge the water supply-demand gap, which could partly be addressed through measures to reduce of water losses. NRW loss reduction of over 4000 m3/ a could be achieved potentially. The energy intensity to meet the projected water demand would increase almost fifty times the current energy intensity with the Current State Extends scenario. Under Current State Improves, the energy intensity would increase twelve times the current energy input with the use of desalination techniques that are less energy intensive like reverse osmosis.

4.3.2. Per Capita Energy Use for Water Supply.

Table 9 presents estimates of per capita energy use for water supply in five WSPs. The per capita energy use for water supply is expected to increase as water demand and energy intensity for water supply increases. No change is expected in the per capita energy use for water supply between the current state and the CSE scenario. However, per capita energy input is expected to increase by three folds at WSP 4 with the CSI scenario due to an increase in energy intensity for water supply attributed to groundwater abstraction and sea water desalination. Furthermore, per capita energy use for water supply is expected to increase twice as much the current use at WSP 5 under the CSI scenario due to an expected increase in groundwater abstraction. Although non-revenue water losses are expected to deteriorate and remain high with the CSD scenario, per capita energy use for water supply is expected to decrease in comparison to the current state. This is largely due to the very low per capita water consumption that is expected for this scenario among the WSPs.

5. Discussion

The water demand-supply gap is likely to widen as population and urbanization accelerates. Although considerable progress was achieved in the proportion of the population with access to improved water services in sub-Saharan Africa, coverage and expansion of service remains low in poorer neighborhoods in expanding urban and rural areas [14]. Many countries in the sub-Saharan have undertaken developed plans and/or measures to improve water service provision to achieve universal access by 2030. For example, Kenya has plans to expand water service provision to achieve universal access to drinking water by 2030. This is an ambitious plan that requires investment in the production capacity, the water supply infrastructure, and accelerated leverage in technology in the water sector [10]. Yet, whereas the current water supply infrastructure remains inadequate, key drivers of water demand such as population, irrigation water needs, expanding middle-class and urbanization of metropolitan areas are expected to increase water demand significantly in the coming years [10]. As observed in the service areas of some of the WSPs in the current study, some WSPs meet less than 50% of the water demand and most supply about half of the minimum daily drinking water requirement of 50 L/p/d. This situation cuts across many WSPs in sub-Saharan Africa [40]. Therefore, in light of the global and regional efforts to accelerate universal water service coverage in sufficient amounts to meet the daily per capita water needs within this decade, there is a need for WSPs to plan well for the projected increase in water demand to address the anticipated increase in the water supply-demand gap and the energy input associated with water supply amidst unpredictable energy prices. In their study on the future of African cities, [41], argue that to reduce the water demand-supply gap in Africa, water-sector players need a wholistic approach to water supply management through integrated water resources management. This would also include among other approaches, matching the water quality to its needs, stormwater harvesting, scaling of wastewater re-use and stage development of alternative water sources. Such approaches present different energy needs for water supply and hence, dynamic water demand and energy management programs should be implemented to address the energy requirements.
As water demand and the drivers of demand change, so does the need to explore new water sources to meet that demand [42]. Some of those additional water sources are typically energy intensive. For instance, proposals for desalination by WSP4 under the CSI scenario in the current study could increase energy input by about twelve to fifty times the current energy input for water supply depending on which scenario plays out. Currently, WSP4 relies on the national electricity grid for its energy requirement for groundwater abstraction and distribution. Hence, the proposed shift to desalination will significantly increase the energy requirement of WSP4. Investment in large-scale desalination would require careful consideration of the influence of the increased energy demand on WSP’s operational costs. For instance, the energy demand for desalination varies with the water treatment process, with membrane filtration processes including reverse osmosis and nano-filtration gaining increased application as they are less energy intensive compared to thermal processes [36]. Energy intensity for reverse osmosis is estimated to range between 3.5–5.0 kWh/m3 whereas multi-stage flash thermal distillation which uses heat to vaporize freshwater from sea water consumes up to 80 kWh/m3 [43]. However, with improved technologies and efficiencies and hybridization of desalination energy sources, lower energy intensities can be achieved for desalination, e.g., about 0.79 kWh/m3 for reverse osmosis of sea water at 55–70 pressure bars and 26–69 kWh/m3 for multi-stage flash thermal distillation [34]. Furthermore, the energy costs associated with using conventional grid electricity for raw water abstraction, treatment and distribution compared to decentralized renewable energy options owned and operated by WSPs is important as some WSPs pivot from conventional water treatment processes to energy intensive options such as desalination and additional groundwater abstraction. The most common sources of renewable energy are solar-powered plants, geo-thermal, wind and wave energy [43,44]. However, establishing cost-effective and high-efficiency energy systems are quite difficult to achieve, largely due to cost constrains and environmental concerns [45]. Therefore, hybrid energy solutions have been highlighted in several studies. For instance, [45,46] summarize the energy demand for sea water desalination and water production cost of hybrid desalination process including a combination of reverse osmosis with solar stills, solar ponds, geothermal and wind energy. The choice and design of such alternatives is site-specific and highly dependent on the economic and technical capabilities as well as the local climatic conditions such as solar insolation, wind intensity and ambient temperature. Furthermore, [45,46] provides an evaluation of energy recovery in existing water supply networks through optimal scheduling of pumps, resulting in up to 36% energy use reduction.
The total energy input in a water supply system is either associated with water consumption that is authorized and accounted for or associated with water losses and/or dissipated at consumption nodes within the water supply system [7]. High and unsustainable water losses for some WSPs and the cost of associated energy required to abstract and distribute that water is a huge impediment for achieving planned universal access objectives. The high non-revenue water losses among WSPs could be attributed largely to lack of incentives and/or disincentives to tackle the water loss challenge. As long as the cost of water production remains relatively lower than the cost of repairs of the infrastructure to reduce water losses, most WSPs will opt for increased production to meet rising demand [40]. This, in addition to aging infrastructure, illegal connections and high densities of leakages could partly explain the little progress achieved so far with reducing non-revenue water losses in many developing countries in Africa. The CSI scenario assumes reduction of current water losses to 20% by 2030. Such a target especially among WSPs with up to 60% no-revenue water losses require strategic and wholistic water loss management plans and investment. As observed in the current study, there is huge potential for addressing such water losses. For instance, a leakage reduction potential of up to 85% was possible for WSP 1 and about 70% for WSP 2 and 3. This would save the WSPs an equivalent amount of energy needed for water supply. Consequently, achieving such leakage reduction would delay the need to explore additional water sources that are energy intensive at least for a short-term horizon [5].
Leakage control in water supply systems can be addressed following two broad strategies: pressure management and improvement of pipe resistance [47]. A positive correlation exists between water pressure reduction and leakage reduction, with one-unit reduction in distribution water pressure in meters at the inlets of hydraulically separated zones resulting in about 1% reduction in leakage. This invariably have consequences on energy input for water supply. Furthermore, leakages contribute to joint water and energy inefficiencies through increase in water losses in addition to the energy required to deliver the required water pressure at the point of consumption. Pressure management entail location of areas of high pressure and implementation of pressure reduction valves to control pressure at different times of the day depending on water demand [2,33]. On the other hand, pipe wall friction imposes frictional energy dissipation due to age or deteriorating quality which leads to energy inefficiencies which can vary across pipe types and across the water distribution system [47]. Consequently, frequent variations in peak and off-peak daily water demand and intermittent water supply often creates pressure variations which then results in high frequencies of leaks and bursts in the pipe networks [33]. Leakage reduction in water supply requires comprehensive water loss reduction plans, considering the environmental and financial consequences of water loss targets and an understanding of the limit of such water loss reduction programs, beyond which, it is not economically feasible for further reduction [29]. Implementation and follow-up measures to enhance energy efficiency in water supply is a big challenge. For WSPs in low- and middle- income countries with budgetary constraints, it is sometimes considered ‘cheaper’ to abstract raw water from new water sources than to focus on reducing losses within the system [17]. In addition, the motivation to commit to energy efficiency programs is largely driven by the requirements of water regulators which often attracts penalties and disincentives for non-compliance as opposed to making any financial gains or energy saving associated with such programs [5]. The success of energy efficiency intervention measures is site-specific and depends on the operating environment of the WSPs. Since pumps are the largest energy consuming devices for WSPs, they also present the largest opportunities for energy efficiency improvements [2]. Interventions may include: (i) operation of pumps closest to the best operation points (ii) correct sizing of the pumps and motors (iii) Increasing pipe diameter to match the flow (iv) pressure management and leakage reduction (v) use of variable speed drives (VSDs) and (vi) off-peak pumping and storage facilities optimization [30].
The benefits of pursuing joint water and energy efficiency for water services providers are outlined in [6,8] for Portugal, Romania [48] and Italy [49]. Such efforts lead to saving not only water and the associated energy input but also reductions in the energy costs and energy demand associated with water losses. Strategies to explore a joint energy and water management approach to conserve both water and energy have been summarized in six levels of cost and complexity in implementation [30]. According to the authors, reduction of leakage through speedy detection and repair and increasing the efficiency of energy consuming devices top the list while decentralization of supply and water demand management are ranked fifth and sixth, respectively. Exploration of renewable energy sources and water re-use and recycling rank third and fourth, respectively. In addition, several studies have outlined the benefits of water and energy savings through pump optimization and scheduling [2], benchmarking [1] and leaks and pressure management [30,47]. These benefits are optimized through consideration of the whole system energy consumption, controlling peak demand energy use through investment in water storage and improvement in reliance to the grid energy supply through generation of own energy or investment in renewable energy source. As presented [30], the correct pump sizing to match the water supplied and delivered could save up to 15–25% of the annual energy consumption while investment in storage facilities to maximize pumping at off-peak rates could save between 10–20% of the energy consumption. In addition, as WSPs plan for expansion of the water supply infrastructure to meet the projected demand, knowledge of cost and high-efficiency technology in the market is crucial in the selection of the best technologies that suit the water supply needs of WSPs.
Fulfilling long-term water demand projections and associated energy needed to meet the projected demand requires planning and investment in energy supply systems that are both cost-effective and highly efficient, especially where desalination is proposed as an additional source of water supply. Given the uncertainty in the evolution of water demand and supply drivers, WSPs need to explore strategies for joint water-energy efficiency and innovative integrated water-energy solutions to fulfil long-term water demand through strategic planning. Joint water and energy management efforts implemented through strategic and careful water demand-supply management measures and operational interventions increase the efficient use of both resources and provides opportunities for revenue generation and expansion of water services. This would also benefit realization of the CSI assumptions. In this regard, WSPs can integrate robust water and energy efficiency goals including energy recovery, venturing into renewable energy options and enhanced energy efficiency within their overall decisions on utility management [8]. As noted in [5,49], focusing on efficiency enhancement though regular monitoring of the energy balance ranks better as constant interaction with the major energy consuming processes and stages allows for a better understanding of their operation which delivers additional benefits of saving water and improved reliability. As a long-term strategy WSPs should develop and evaluate comprehensive energy management plans. According to [50,51], an energy management strategy entails a four-tiered process that involves routine and basic energy checks, energy consumption analysis, energy audits and implementation of energy management system as a prerequisite for successful operational sustainability of WSPs, Figure 4). Such a system allows for the auditing and benchmarking of energy use through the management principle of the Plan-Do-Check-Act cycle outlined in the International Standards of Operation (ISO). It should be guided by clearly outlined goals and targets towards system-wide energy use improvement. Furthermore, such a program should effectively respond to changes in the water supply and demand drivers which influence energy demand for water supply, guided by a robust data collection system and monitoring [4].

6. Conclusions

An approach to assess the influence of changes in water supply and demand drivers on future energy requirement for water supply against future water demand under three plausible scenarios is presented. Due to expected rapid population growth and urbanization in sub-Saharan Africa, future water demand is expected to increase to achieve universal access to drinking water by 2030. In the Kenyan situation, water coverage in three of the five WSPs selected is below the regulated benchmark of above 80% of the population in the service area and water use is below the minimum recommended daily per capita water use of 50 L/p/d in the service areas of the three WSPs included in the study. Yet, non-revenue water losses are 2–3 times above the benchmark stipulated by the national regulator although a leakage reduction potential of up to 70% and associated annual energy savings of up to 6000 kWh/a was possible.
The projected water demand will necessitate additional raw water abstraction based on analysis of Kenya’s 2030 National Water Management Plan (NWMP2030) and the individual strategic plans of each WSP that were examined. For some WSPs, additional groundwater abstraction or desalination of saline water have been proposed, expected to contribute up to 50% of the expected growth in water demand. However, these raw water sources would significantly increase the energy input for water supply even with Current State Improves scenario. Consequently, efforts to integrate hybrid decentralized sources of energy should be considered in WSPs tactical and strategic planning.
Reducing current water losses to achieve the regulated benchmark presents opportunities to minimize energy input for water supply. Therefore, it is necessary to jointly address current non-revenue water losses and the associated energy input given that most WSPs showed a high leakage reduction potential. Furthermore, water supply network conditions including the nature, age and type of piping systems which influence water losses and ultimately associated energy input can be considered in future studies. In addition, such interventions could reduce the current water demand-supply gap and increase the daily per capita water use above the minimum requirement that is recommended. This would ensure that WSPs are better prepared to respond to the expected increase in water demand and potentially reduce the need for additional water sources that are energy intensive.

Supplementary Materials

The following are available online at https://www.mdpi.com/article/10.3390/en14082169/s1, Figure S1: Trends of NRW, Water Coverage and per capita water production and consumption for all registered WSPs in Kenya. Figure S2: Nine-year trend of selected parameters among selected WSPs. Compiled from WSP performance Reports available at www.wasreb.go.ke (accessed on 12 February 2021). Figure S3: Trends of selected parameters in two additional WSPs illustrating deteriorating water losses, water coverage and per capita water production and consumption. Compiled from WSP performance Reports available at www.wasreb.go.ke (accessed on 12 February 2021).

Author Contributions

All authors contributed as follows; Conceptualization, P.M., P.Y. and N.K. (Norbert Kreuzinger); methodology, N.K. (Norbert Kreuzinger), P.M. writing—original draft preparation, P.M.; writing—review and editing, P.M., N.K. (Nzula Kitaka), P.Y. and N.K. (Norbert Kreuzinger); supervision, N.K. (Nzula Kitaka) and N.K. (Norbert Kreuzinger); funding acquisition, P.M. All authors have read and agreed to the published version of the manuscript.

Funding

This research was funded by the Austrian Partnership Programme in Higher Education and Research for Development (APPEAR), a programme of the Austrian Development Cooperation (ADC) implemented by the Austrian Agency for International Cooperation in Education and Research (OeAD). The grant specification number is OEZA Project number: 0894-00/2014.The authors acknowledge TU Wien Bibliothek for the financial support through its Open Access Funding Programme.

Institutional Review Board Statement

Not applicable.

Data Availability Statement

Not applicable.

Acknowledgments

The Secretariat of Water Services Providers Association of Kenya (WASPA) and the member WSPs who participated in the current study are highly acknowledged for their immense contribution through data provision and availability for interviews and field visits.

Conflicts of Interest

The authors declare no conflict of interest. The Funders had no role in the design of the study; in the collection, analyses, or interpretation of data; in the writing of the manuscript, or in the decision to publish the results.

References

  1. Molinos-Senante, M.; Guzmán, C. Benchmarking energy efficiency in drinking water treatment plants: Quantification of potential savings. J. Clean. Prod. 2018, 176, 417–425. [Google Scholar] [CrossRef]
  2. Luna, T.; Ribau, J.; Figueiredo, D.; Alves, R. Improving energy efficiency in water supply systems with pump scheduling optimization. J. Clean. Prod. 2019, 213, 342–356. [Google Scholar] [CrossRef]
  3. Lam, K.L.; Kenway, S.J.; Lant, P.A. Energy use for water provision in cities. J. Clean. Prod. 2017, 143, 699–709. [Google Scholar] [CrossRef] [Green Version]
  4. Lackey, K.; Fillmore, L. Energy Management for Water Utilities in Latin America and the Caribbean: Exploring Energy Efficiency and Energy Recovery Potential in Wastewater Treatment Plants. 2017. Available online: [email protected] (accessed on 20 November 2020).
  5. Voltz, T.; Grischek, T. Energy management in the water sector—Comparative case study of Germany and the United States. Water-Energy Nexus 2018, 1, 2–16. [Google Scholar] [CrossRef]
  6. Loureiro, D.; Silva, C.; Cardoso, M.A.; Mamade, A.; Alegre, H.; Rosa, M.J. The Development of a Framework for Assessing the Energy Efficiency in Urban Water Systems and Its Demonstration in the Portuguese Water Sector. Water 2020, 12, 134. [Google Scholar] [CrossRef] [Green Version]
  7. Mamade, A.; Loureiro, D.; Alegre, H.; Covas, D. Top-Down and Bottom-Up Approaches for Water-Energy Balance in Portuguese Supply Systems. Water 2018, 10, 577. [Google Scholar] [CrossRef] [Green Version]
  8. Loureiro, D.; Alegre, H.; Silva, M.S.; Ribeiro, R.; Mamade, A.; Pocas, A. Implementing tactical plans to improve water-energy loss management. Water Supply 2017, 17, 381–388. [Google Scholar] [CrossRef]
  9. Böhmelt, T.; Bernauer, T.; Buhaug, H.; Gleditsch, N.P.; Tribaldos, T.; Wischnath, G. Demand, supply, and restraint: Determinants of domestic water conflict and cooperation. Glob. Environ. Chang. 2014, 29, 337–348. [Google Scholar] [CrossRef] [Green Version]
  10. Wu, W.; Maier, H.R.; Dandy, G.C.; Arora, M.; Castelletti, A. The changing nature of the water–energy nexus in urban water supply systems: A critical review of changes and responses. J. Water Clim. Chang. 2020, 11, 1095–1122. [Google Scholar] [CrossRef]
  11. McDonald, R.I.; Green, P.; Balk, D.; Fekete, B.M.; Revenga, C.; Todd, M.; Montgomery, M. Urban growth, climate change, and freshwater availability. Proc. Natl. Acad. Sci. USA 2011, 108, 6312–6317. [Google Scholar] [CrossRef] [Green Version]
  12. Serdeczny, O.; Adams, S.; Baarsch, F.; Coumou, D.; Robinson, A.; Hare, W.; Schaeffer, M.; Perrette, M.; Reinhardt, J. Climate change impacts in Sub-Saharan Africa: From physical changes to their social repercussions. Reg. Environ. Chang. 2017, 17, 1585–1600. [Google Scholar] [CrossRef]
  13. Siddiqi, A.; Anadon, L.D. The water–energy nexus in Middle East and North Africa. Energy Policy 2011, 39, 4529–4540. [Google Scholar] [CrossRef]
  14. Dos Santos, S.; Adams, E.; Neville, G.; Wada, Y.; de Sherbinin, A.; Bernhardt, M.E.; Adamo, S.B. Urban growth and water access in sub-Saharan Africa: Progress, challenges, and emerging research directions. Sci. Total Environ. 2018, 607–608, 497–598. [Google Scholar] [CrossRef]
  15. Macharia, P.W.; Yillia, P.T.; Muia, W.A.; Byamukama, D.; Kreuzinger, N. Microbial quality of domestic water: Following the contamination chain in a rural township in Kenya. J. Water Sanit. Hyg. Dev. 2015, 5, 39–49. [Google Scholar] [CrossRef]
  16. Eberhard, R. Access to Water and Sanitation in Sub-Saharan Africa: Review of Sector Reforms and Investments, Key Findings to Inform Future Support to Sector Development. 2019. Available online: www.giz.de (accessed on 10 November 2020).
  17. Van den Berg, C.; Danilenko, A. Performance of Water Utilities in Africa; World Bank: Washington, DC, USA, 2017; Available online: https://openknowledge.worldbank.org/handle/10986/26186 (accessed on 9 November 2020).
  18. Soppe, G.; Janson, N.; Piantini, S. Water Utility Turnaround Framework: A Guide for Improving Performance; World Bank: Washington, DC, USA, 2018; Available online: https://openknowledge.worldbank.org/handle/10986/30863 (accessed on 5 December 2020).
  19. Bibri, S.E. Backcasting in futures studies: A synthesized scholarly and planning approach to strategic smart sustainable city development. Eur. J. Futures Res. 2018, 6, 13. [Google Scholar] [CrossRef]
  20. Farias, R.L.; Puig, V.; Rangel, H.R.; Flores, J.J. Multi-Model Prediction for Demand Forecast in Water Distribution Networks. Energies 2018, 11, 660. [Google Scholar] [CrossRef] [Green Version]
  21. Burek, P.; Satoh, Y.; Fischer, G.; Taher Kahil, M.; Scherzer, A.; Tramberend, S.; Fabiola Nava, L.; Wada, Y.; Flörke, E.M.; Hanasaki, N.; et al. Water Futures and Solution Fast Track Initiative (Final Report); IIASA Working Paper (WP 16-0016); IIASA: Laxenburg, Austria, 2016; Available online: www.iiasa.ac.at/wfas/wfas-publications (accessed on 21 November 2020).
  22. Dong, C.; Schoups, G.; van de Giesen, N. Scenario development for water resource planning and management: A review. Technol. Forecast. Soc. Chang. 2013, 80, 749–761. [Google Scholar] [CrossRef]
  23. Van Vuuren, D.P.; Kriegler, E.; O’Neill, B.C.; Ebi, K.L.; Riahi, K.; Carter, T.R.; Edmonds, J.; Hallegatte, S.; Kram, T.; Mathur, R.; et al. A new scenario framework for Climate Change Research: Scenario matrix architecture. Clim. Chang. 2014, 122, 373–386. [Google Scholar] [CrossRef] [Green Version]
  24. Teixeira, M.R.; Mendes, P.; Murta, E.; Nunes, L.M. Performance indicators matrix as a methodology for energy management in municipal water services. J. Clean. Prod. 2016, 125, 108–120. [Google Scholar] [CrossRef]
  25. WASREB (Water Services Regulatory Board). A Performance Report of Kenya’s Water Services Sector: IMPACT Reports 1-12. 2020. Available online: www.wasreb.go.ke./impact-reports/ (accessed on 20 November 2020).
  26. Liemberger, R.; Wyatt, A. Quantifying the global non-revenue water problem. Water Supply 2019, 19, 831–837. [Google Scholar] [CrossRef]
  27. UN-DESA (United Nations Department of Economic and Social Affairs). World Economic Situation and Prospects 2020. 2020. Available online: www.un.org/en/desa/products/publications (accessed on 5 December 2020).
  28. Cira, D.A.; Kamunyori, S.W.; Babijes, R.M. Republic of Kenya Urbanization Review. 2016. Available online: http://documents.worldbank.org/curated/en/639231468043512906/Kenya-urbanization-review (accessed on 19 January 2021).
  29. Ahopelto, S.; Vahala, R. Cost–Benefit Analysis of Leakage Reduction Methods in Water Supply Networks. Water 2020, 12, 195. [Google Scholar] [CrossRef] [Green Version]
  30. Vilanova, M.R.N.; Balestieri, J.A.P. Energy and hydraulic efficiency in conventional water supply systems. Renew. Sustain. Energy Rev. 2014, 30, 701–714. [Google Scholar] [CrossRef]
  31. Reed, B. World Health Organization Technical Notes on Drinking Water, Sanitation and Hygiene in Emergencies. 2011. Available online: www.who.int/water_sanitation_health/publications/2011/tn9 (accessed on 12 February 2021).
  32. Latinopoulos, D.; Sidiropoulos, P.; Kagalou, I. Gap Analysis Targeting WFD Monitoring and Pressure Mapping: Lessons Learned from “EcoSUSTAIN”, Interreg-MED Project. Proceedings 2018, 2, 621. [Google Scholar] [CrossRef] [Green Version]
  33. Pillot, J.; Catel, L.; Renaud, E.; Augeard, B.; Roux, P. Up to what point is loss reduction environmentally friendly?: The LCA of loss reduction scenarios in drinking water networks. Water Res. 2016, 104, 231–241. [Google Scholar] [CrossRef] [PubMed]
  34. Wakeel, M.; Chen, B.; Hayat, T.; Alsaedi, A.; Ahmad, B. Energy consumption for water use cycles in different countries: A review. Appl. Energy 2016, 178, 868–885. [Google Scholar] [CrossRef]
  35. Macharia, P.; Kitaka, N.; Kreuzinger, N. Evaluating Energy performance and Energy losses associated with water supply in Africa. Water-Energy Nexus J. Unpublished Manuscript for submission.
  36. Shahzad, M.W.; Burhan, M.; Ybyraiymkul, D.; Ng, K.C. Desalination Processes’ Efficiency and Future Roadmap. Entropy 2019, 21, 84. [Google Scholar] [CrossRef] [PubMed] [Green Version]
  37. Alkaisi, A.; Mossad, R.; Sharifian-Barforoush, A. A Review of the Water Desalination Systems Integrated with Renewable Energy. Energy Procedia 2017, 110, 268–274. [Google Scholar] [CrossRef]
  38. Khan, M.A.; Rehman, S.; Al-Sulaiman, F.A. A hybrid renewable energy system as a potential energy source for water desalination using reverse osmosis: A review. Renew. Sustain. Energy Rev. 2018, 97, 456–477. [Google Scholar] [CrossRef]
  39. GOK-Ministry of Water and Irrigation, JICA (Japan International Cooperation Agency). The Development of the Kenya National Water Master Plan 2030. 2013. Available online: www.wasreb.go.ke/national-water-master-plan-2030/ (accessed on 24 October 2020).
  40. Van den Berg, C. The Drivers of Non-Revenue Water How Effective Are Non-Revenue Water Reduction Programs? Policy Research Working Paper No. 6997; World Bank Group; World Bank: Washington, DC, USA, 2014; Available online: https://openknowledge.worldbank.org/handle/10986/19396 (accessed on 20 August 2020).
  41. Jacobsen, M.; Webster, M.; Vairavamoorthy, K. (Eds.) The Future of Water in African Cities: Why Waste Water? Directions in Development; World Bank: Washington, DC, USA, 2012. [Google Scholar] [CrossRef]
  42. Stokes, J.; Horvath, A. Life Cycle Energy Assessment of Alternative Water Supply Systems. Int. J. Life Cycle Assess. 2005, 11, 335–343. [Google Scholar] [CrossRef]
  43. Esmaeilion, F. Hybrid renewable energy systems for desalination. Appl. Water Sci. 2020, 10, 1–47. [Google Scholar] [CrossRef] [Green Version]
  44. Mollahosseini, A.; Abdelrasoul, A.; Sheibany, S.; Amini, M.; Salestan, S.K. Renewable energy-driven desalination opportunities—A case study. J. Environ. Manag. 2019, 239, 187–197. [Google Scholar] [CrossRef] [PubMed]
  45. Telci, I.T.; Aral, M.M. Optimal Energy Recovery from Water Distribution Systems Using Smart Operation Scheduling. Water 2018, 10, 1464. [Google Scholar] [CrossRef] [Green Version]
  46. Pérez-Sánchez, M.; Sánchez-Romero, F.J.; Ramos, H.M.; López-Jiménez, P.A. Energy Recovery in Existing Water Networks: Towards Greater Sustainability. Water 2017, 9, 97. [Google Scholar] [CrossRef] [Green Version]
  47. Xu, Q.; Chen, Q.; Ma, J.; Blanckaert, K.; Wan, Z. Water Saving and Energy Reduction through Pressure Management in Urban Water Distribution Networks. Water Resour. Manag. 2014, 28, 3715–3726. [Google Scholar] [CrossRef]
  48. Delcea, A.; Bitir-Istrate, I.; Pătraşcu, R.; Gheorghiu, C. Joint energy and water management scheme for water supply systems in Romania. E3S Web Conf. 2019, 85, 06008. [Google Scholar] [CrossRef]
  49. Notaro, V.; Puleo, V.; Fontanazza, C.M.; Sambito, M.; La Loggia, G. A Decision Support Tool for Water and Energy Savingin the Integrated Water System. Procedia Eng. 2015, 119, 1109–1118. [Google Scholar] [CrossRef] [Green Version]
  50. Gramlich, E.; Schröder, M. Guidelines for Energy Checks and Energy Analysis in Water and Wastewater Utilities. 2014. Available online: www.mena-water.net (accessed on 15 January 2021).
  51. Ercolano, L.; Laenge, H.; Haberkern, B. Energy Efficiency in Water and Wastewater Utilities. 2015. Available online: www.giz.de (accessed on 15 January 2021).
Figure 1. Seven-year trends of daily Per Capita Water Production (PCWP) and per Capita Water Consumption (PCWC) for WSP1, 2, 3, 4 & 5. (Source: Water Sector performance. Reports available at [24]).
Energies 14 02169 g001
Figure 2. Comparison of current state water production and the projected supply needed to meet projected demand in 2030 under the Current State Improves (CSI) scenario (Projections assume service coverage to total population within service area to meet a per capita water demand of 120 L/p/d at 20% non-revenue water loss).
Energies 14 02169 g002
Figure 3. Estimates of energy intensity for water production with the three scenarios (Current State Extends (CSE), Current State Improves (CSI) and Current State Deteriorates (CSD) for 2030 compared to current energy intensity (2019). Note the difference in magnitude for energy intensity between WSP1 (a), WSP2 (b) & WSP5 (e) and WSP 3 (c) & WSP4 (d).
Energies 14 02169 g003
Figure 4. Energy management strategy processes for water supply adapted from [51].
Energies 14 02169 g004
Table 1. Summary of the key narratives for three plausible scenarios (Current State Extends, Current State Improves and Current State Deteriorates) that were developed and applied for the current study.
ParameterCurrent State Extends (CSE)Current State Improves (CSI)Current State Deteriorates (CSD)Parameter Quantified
Water demand drivers:
1. Economic growth: Moderate AcceleratedSlow
2. Population growth: HighHighHigh
3. Urbanization: HighHigh but plannedHigh
4. Population served: Large population without accessUniversal/near universal coverageLarge population without access
5. Per capita water consumption:Moderate to highHighLow
6. Per capita energy demand for water supply:Moderate to highLowHigh
7. Water supply/demand management programs: ModerateHighLow
8. Service connection density (connections per km): HighLowHigh
Water supply drivers:
9. Impact of climate change (droughts and floods):Moderately high ModerateHigh
10. Water production: High High High
11. Water loss: High Low High
12. Leakage reduction potential: High Low High
13. Water-Energy efficiency: Moderate High Low
14. Adoption of decentralized or hybrid renewable energy sources: Gradual FastSlow
15. Energy demand for water supply:HighLowHigh
16. Leverage on technology for treatment, optimization of pumps, asset management and online monitoring of leaks & water use: Gradual Advanced Slow
17. Energy use benchmarking: AbsentFully adoptedAbsent
√ (denotes the parameter was quantified in the present study).
Table 2. Selected quantifiable parameters applied for the three plausible scenarios.
ParameterUnit Scenarios Reference
Current State
Extends (CSE)
Current State
Improves (CSI)
Current State
Deteriorates (CSD)
Population growthNo. of people2c λ2c λ2c λ[27]
Urban population% of total population60–9060–9060–90[28]
Access to water services% pop. coverage6010050[25]
Unit water supply for domestic use L/p/d16–69 *12020–50 **[25]
Water loss as a fraction of system input volume%26–63 a2063 b[25]
Leakage reduction potential%20–50<20>70[29]
Water–Energy efficiency%50100<50[30]
Standardized pump efficiencykWh/m3 100 m0.40–0.540.27–0.400.54–5.0[6]
α Pump efficiency%5070–100<50[6]
λ Medium variant population projection which projects the 2030 population in the service areas will be double the current population * Range for current per capita water demand among selected WSPs ** Basic and minimum per capita water demand as required in the World Health Organization hierarchy of water requirements [31] a Range for current water losses for each WSP under consideration b Highest non-revenue water loss reported among the selected WSPs α Varies with the water supply system layout and the water-energy efficiency and only current state estimates are provided.
Table 3. Water supply network characteristics of selected WSPs as at 2018/2019.
WaterService Providers (WSPs)Length of the Transmission and Distribution Network (km)No. of Connections Total Number of Leaks Detected and Repaired/year Hours of Water SupplyAverage Source- Distribution Elevation Difference (m)Average Age of Pumps (years) Average Efficiency of Pumps (%)
WSP 165058,3162419216010–1370
WSP 261561,0344001935865
WSP 31066593,42427306501265
WSP 467386,32610455301460
WSP 559224,820136812401060
Data source: (Selected WSPs in Kenya).
Table 4. Total and urban population (×1000) within the service area of the five WSPs for 2020 and the projected years (2030 and 2050) as provided in [27].
202020302050
Water Services Provider (WSPs)UrbanTotalUrbanTotalUrbanTotal
WSP 1200237430513630749
WSP 2383528550115611301687
WSP 3464047356502703180548881
WSP 480010901889264430863858
WSP 51745282828527711150
Table 5. Comparison of annual water demand and volume of water supplied and percentage water demand-supply deficit.
Water Services
Provider (WSPs)
Water Demand (Mm3/a)Water Supply (Mm3/a)Deficit (%)
WSP16.05.83
WSP26.45.612
WSP376.057.524
WSP48.44.250
WSP53.12.035
Table 6. Non-revenue water, leakage and leakage reduction potential for the WSPs in 2019. Data for WSP3 is not shown.
Water
Services
Provider (WSPs)
NRW (%)NRW
(L/conn/day)
Vol. Lost/
Detectable Leak (m3/a)
Current Leakage
Level (m3/a)
Minimum Leakage
Level (m3/a)
Leakage Reduction
Potential (m3/a)
WSP126264 78864509665484
WSP232309 8607559816983900
WSP450565 4013632119884333
WSP5631213 245456805505130
Table 7. Specific energy input for water production, the standard efficiency of pumps and the energy input associated with water loss for the five WSPs in 2019.
Water Services Provider (WSPs)Specific Energy Input Per Vol Supplied (kWh/m3)Specific Energy Input Per Vol. Billed (kWh/m3)Standard Average Efficiency of the Pump (kWh/m3100m) Per Capita Energy Consumption/Vol. Supplied (kWh/p/a)Specific Energy Input Associated with Water Loss
(kWh/m3)
Energy Savings Associated with Leak Reduction (kWh/a)
WSP10.390.450.4221.59.62139
WSP21.601.760.5252.8546240
WSP30.340.450.642418.7No credible data
WSP40.320.610.6937.616.21387
WSP50.400.570.5619.95.91026
Table 8. Water demand for 2019 (current state) and 2030 under the three scenarios.
Current State
(2019)
Current State Extends (CSE–2030)Current State Improves (CSI–2030)Current State Deteriorates (CSD–2030)
Water Services Provider (WSPs)Water Demand (Mm3/a) *Demand ** (Mm3/a)Demand *** (Mm3/a)Demand *** (Mm3/a)
WSP15.812.528.11.9
WSP25.812.763.34.2
WSP357.685.8384.925.7
WSP44.210.1144.89.7
WSP51.93.146.63.1
* Assumes the proportion of current population served continues for each WSP as presented in 4.1.2 and at the current daily per capita water demand as shown in Table 2, ** Assumes total population in the service areas is served, and the per capita water demand is 120 L/p/d *** Assumes only 50% of the population is served with basic daily per capita water demand of 20 L/p/d as outlined in WHO hierarchy of water requirement [30]
Table 9. Current state Per capita energy use for water supply and across the CSE, CSI and CSD scenarios.
Water Services
Provider (WSPs)
Current State (kW/p/a) CSE (kWh/p/a)CSI (kWh/p/a)CSD (kWh/p/a)
WSP 121.521.530.669
WSP 252.852.839.4212
WSP 3242439.426
WSP 437.637.6105.127
WSP 519.919.952.564
Publisher’s Note: MDPI stays neutral with regard to jurisdictional claims in published maps and institutional affiliations.

