
Barriers to BIM Implementation in Architecture, Construction, and Engineering Projects—The Polish Study


1
Faculty of Civil Engineering, Cracow University of Technology, 31-155 Cracow, Poland
2
Faculty of Civil and Environmental Engineering and Architecture, Rzeszow University of Technology, 35-082 Rzeszow, Poland
*
Author to whom correspondence should be addressed.
Energies 2021, 14(8), 2090; https://doi.org/10.3390/en14082090
Submission received: 17 March 2021
/
Revised: 5 April 2021
/
Accepted: 6 April 2021
/
Published: 9 April 2021
Abstract
:BIM (building information modeling) is a kind of technology that has great potential to enhance the level of automation in architecture, engineering, and construction (AEC) projects. The created virtual model of the facility allows coordinating all industries during the entire life cycle of the building. The possibility to save the data related to the given facility in one place, namely in the BIM model, enables control and management of the AEC projects at every stage. During the design and implementation phase, BIM models facilitate the optimization of time, costs, and quality, and in the operational phase, they support effective management of the facility. The use of BIM for building energy modeling (BEM) is the next step of evolution in architecture and engineering design practice. The benefits of using the BIM approach are widely discussed in the literature; however, they may be hard to achieve if appropriate attention is not directed to minimizing the barriers to the implementation of this technology. Observing Europe, one can notice that western and northern countries successfully use BIM for their needs, while the countries of the Eastern Bloc, including Poland, introduce it at a slower pace. In the present paper, the authors conducted a cause-and-effect analysis of the identified barriers to the implementation of BIM technology in the construction process. For this purpose, the authors applied the Ishikawa diagram, which is a tool that helps to recognize the actual or potential causes of failure. The analysis conducted showed that one of the weakest links in the successful BIM implementation is people and, in particular, their lack of knowledge and reluctance to change. The authors indicated the need to introduce and strengthen preventive actions, mainly through education: training, courses, and studies focused on BIM technology.
1. Introduction
The acronym BIM, (building information modeling), derives from the concept of product information modeling. BIM is a standard for integrating the information about modeling in construction between its various areas, creating virtual models of intelligent parameterized facilities [1]. BIM covers all aspects of stages of a building’s lifecycle—design, construction operation, and replacement or disposal and allows stakeholder collaboration [2,3]. BIM technology enables the creation of a virtual environment for a construction project which aims at improving its course and implementation. Information modeling, by developing a multi-faceted and multi-industry model, facilitates cooperation and communication between all participants responsible for the investment [4]. It enables automated creation of documentation which becomes a digital representation of the entire construction process image. The task of BIM technology is to support activities performed during the entire life cycle of a building by providing not only information about the geometry of the facility but also descriptive information about the building and its individual elements. [5]. There are many definitions of BIM. According to [6], BIM is an n-D modeling, virtual model, or virtual prototyping technology. In 2014, the United States National Building Information Model Standard Project Committee agreed on a definition, according to which “a BIM model is a digital representation of physical and functional characteristics of a facility and a shared knowledge resource for information about a facility forming a reliable basis for decisions during its life cycle, defined as existing from earliest conception to demolition” [7].
The development of information technologies in the construction industry dates back to the 1980s and the implementation of CAD software based on the information about the object in 2D technology [8]. During the 90s, there were attempts to combine graphic and non-graphic information in the conceptual model of a building, which initiated the dynamic development of the SBM concept (single building model) [9]. The following years saw the expansion of traditional three-dimensional BIM modeling (3D). BIM 4D technology is a virtual model of a building with construction plans and the ability to control the progress of works over time along with the visualization of the virtually created building, the 5D model allows the creation of a cost estimate and elimination of potential errors in the bill of quantities, the 6D model introduces sustainable development in the investment process, while the 7D model enables product lifecycle management (PLM) which, in construction, is referred to as building lifecycle management—BLM [10,11].
Undoubtedly, the most important feature and advantage of BIM is its ability to save data about a given facility in one place, that is, in the BIM model and in the resulting graphic model in a multidimensional view. What is significant, BIM enables quick creation of different versions of objects in the conceptual phase, which reduces subsequent costs of changes already at the construction stage [12]. BIM technology thus facilitates planning, effective control, and monitoring of implementation of construction projects, contributing to the successful execution of the project [13]. The issue of periodical monitoring activity of buildings and infrastructures is another challenge of the BIM method: the implementation of BIM could be attractive to make correct choices of monitoring techniques addressed to ease their use, efficiency, and capacity in detecting damage or deteriorations [14]. BIM models can also conduct extensive analyses of the facility’s impact on the environment. In [15] it was pointed that an automated link between LCA (live cycle assessment) and BIM can be achieved, and this could enable the streamlining of LCA methodology applications in design practice, and thus support the improvements in the environmental performance of buildings. Recently, the big importance and impact of the BIM technology is noticed on a building’s energy performance [16]. In [17] studies on BIM’s application in energy analysis and also proposition of solutions for the interoperability between building information modeling and energy simulation tools were presented. A building’s energy performance is often predicted by creating a building energy model (BEM). BIM enables the share and exports the information and data available from the architectural model required to create a BEM—another digital model, which finally allows the performance of energy simulation (ES) [18]. It is named a BIM-to-BEM process and it offers the possibility for multiple iterations towards an optimized design in a shared environment [16,19,20]. The main issue in this process is a bidirectional interaction between the two models and data transmission. For this reason, BIM for energy simulation is mainly used for an early design step [21]. The use of BIM in operation and maintenance step of the existing construction resources is based on the so-called “scan-to-BIM” process (survey, 3D modeling, and BIM implementation) [22]. The use of laser scanning technology to measure objects allows obtaining a point cloud and then generating digital documentation, which in turn enables the creation of a BIM model of the scanned facility [23]. This approach is also successfully used in historical buildings where there is a need to prepare missing project documentation, or where creating a BIM model is necessary as part of the building’s renovation. It is related to heritage BIM (HBIM), which is considered to be a promising source of information for monument conservation planning [24]. To encourage the adoption of BIM in restoration of buildings, it is relevant to perform an integrated intervention, in view to maximize structural and energetic performance, by assigning a prescribed economic budget or fixing a prescribed carbon footprint as in [25]. In this case, the issue of energy efficiency has become increasingly important. The need to balance energy efficiency improvement with the requirements of preservation is required, especially when buildings are built with different materials and techniques than modern ones. In [26] study, the authors indicated that between over 200 existing tools for building energy simulation (BES) only a few of them are able to take into account properly some specific issues related to historical buildings. Control and management of the construction process at every stage of its development, automatic detection of collisions and errors as well as cooperation between all the participants of the investment process are not the only advantages of using BIM. In the literature to date, many works emphasize the benefits of using BIM technology [27,28]. The study [29] showed that by educating and developing a culture of using BIM technology it is possible to achieve the benefits such as increased utilization of human resources, better management of capital costs, energy consumption and resources, identifying and removing activities with no added value.
The possibilities offered by BIM technology made many countries quickly implement spatial modeling in the entire construction process. In [30] a map of the global overview of BIM application is described. Only in Africa have there been no efforts to adopt BIM, although in Egypt its implementation has been recommended. On the other hand, North America is the most advanced continent in this respect (in the USA, BIM has been obligatory since 2008). In South and Central America, in 2020–2022, it is planned to introduce BIM in government projects. In Asia, Korea and Hong Kong have become leaders, and China and Japan are implementing BIM standards with extensive support from the government. In the Middle East, the practical use of BIM is basically insignificant. In Europe, western and northern countries have widely implemented BIM technology for their needs, in particular Great Britain and Scandinavian countries (Finland and Norway), as well as France and Italy. In turn, the countries of the Eastern Bloc, including Poland and the South, are adopting BIM technology as the mainstream of design and management of a building facility at a slower pace.
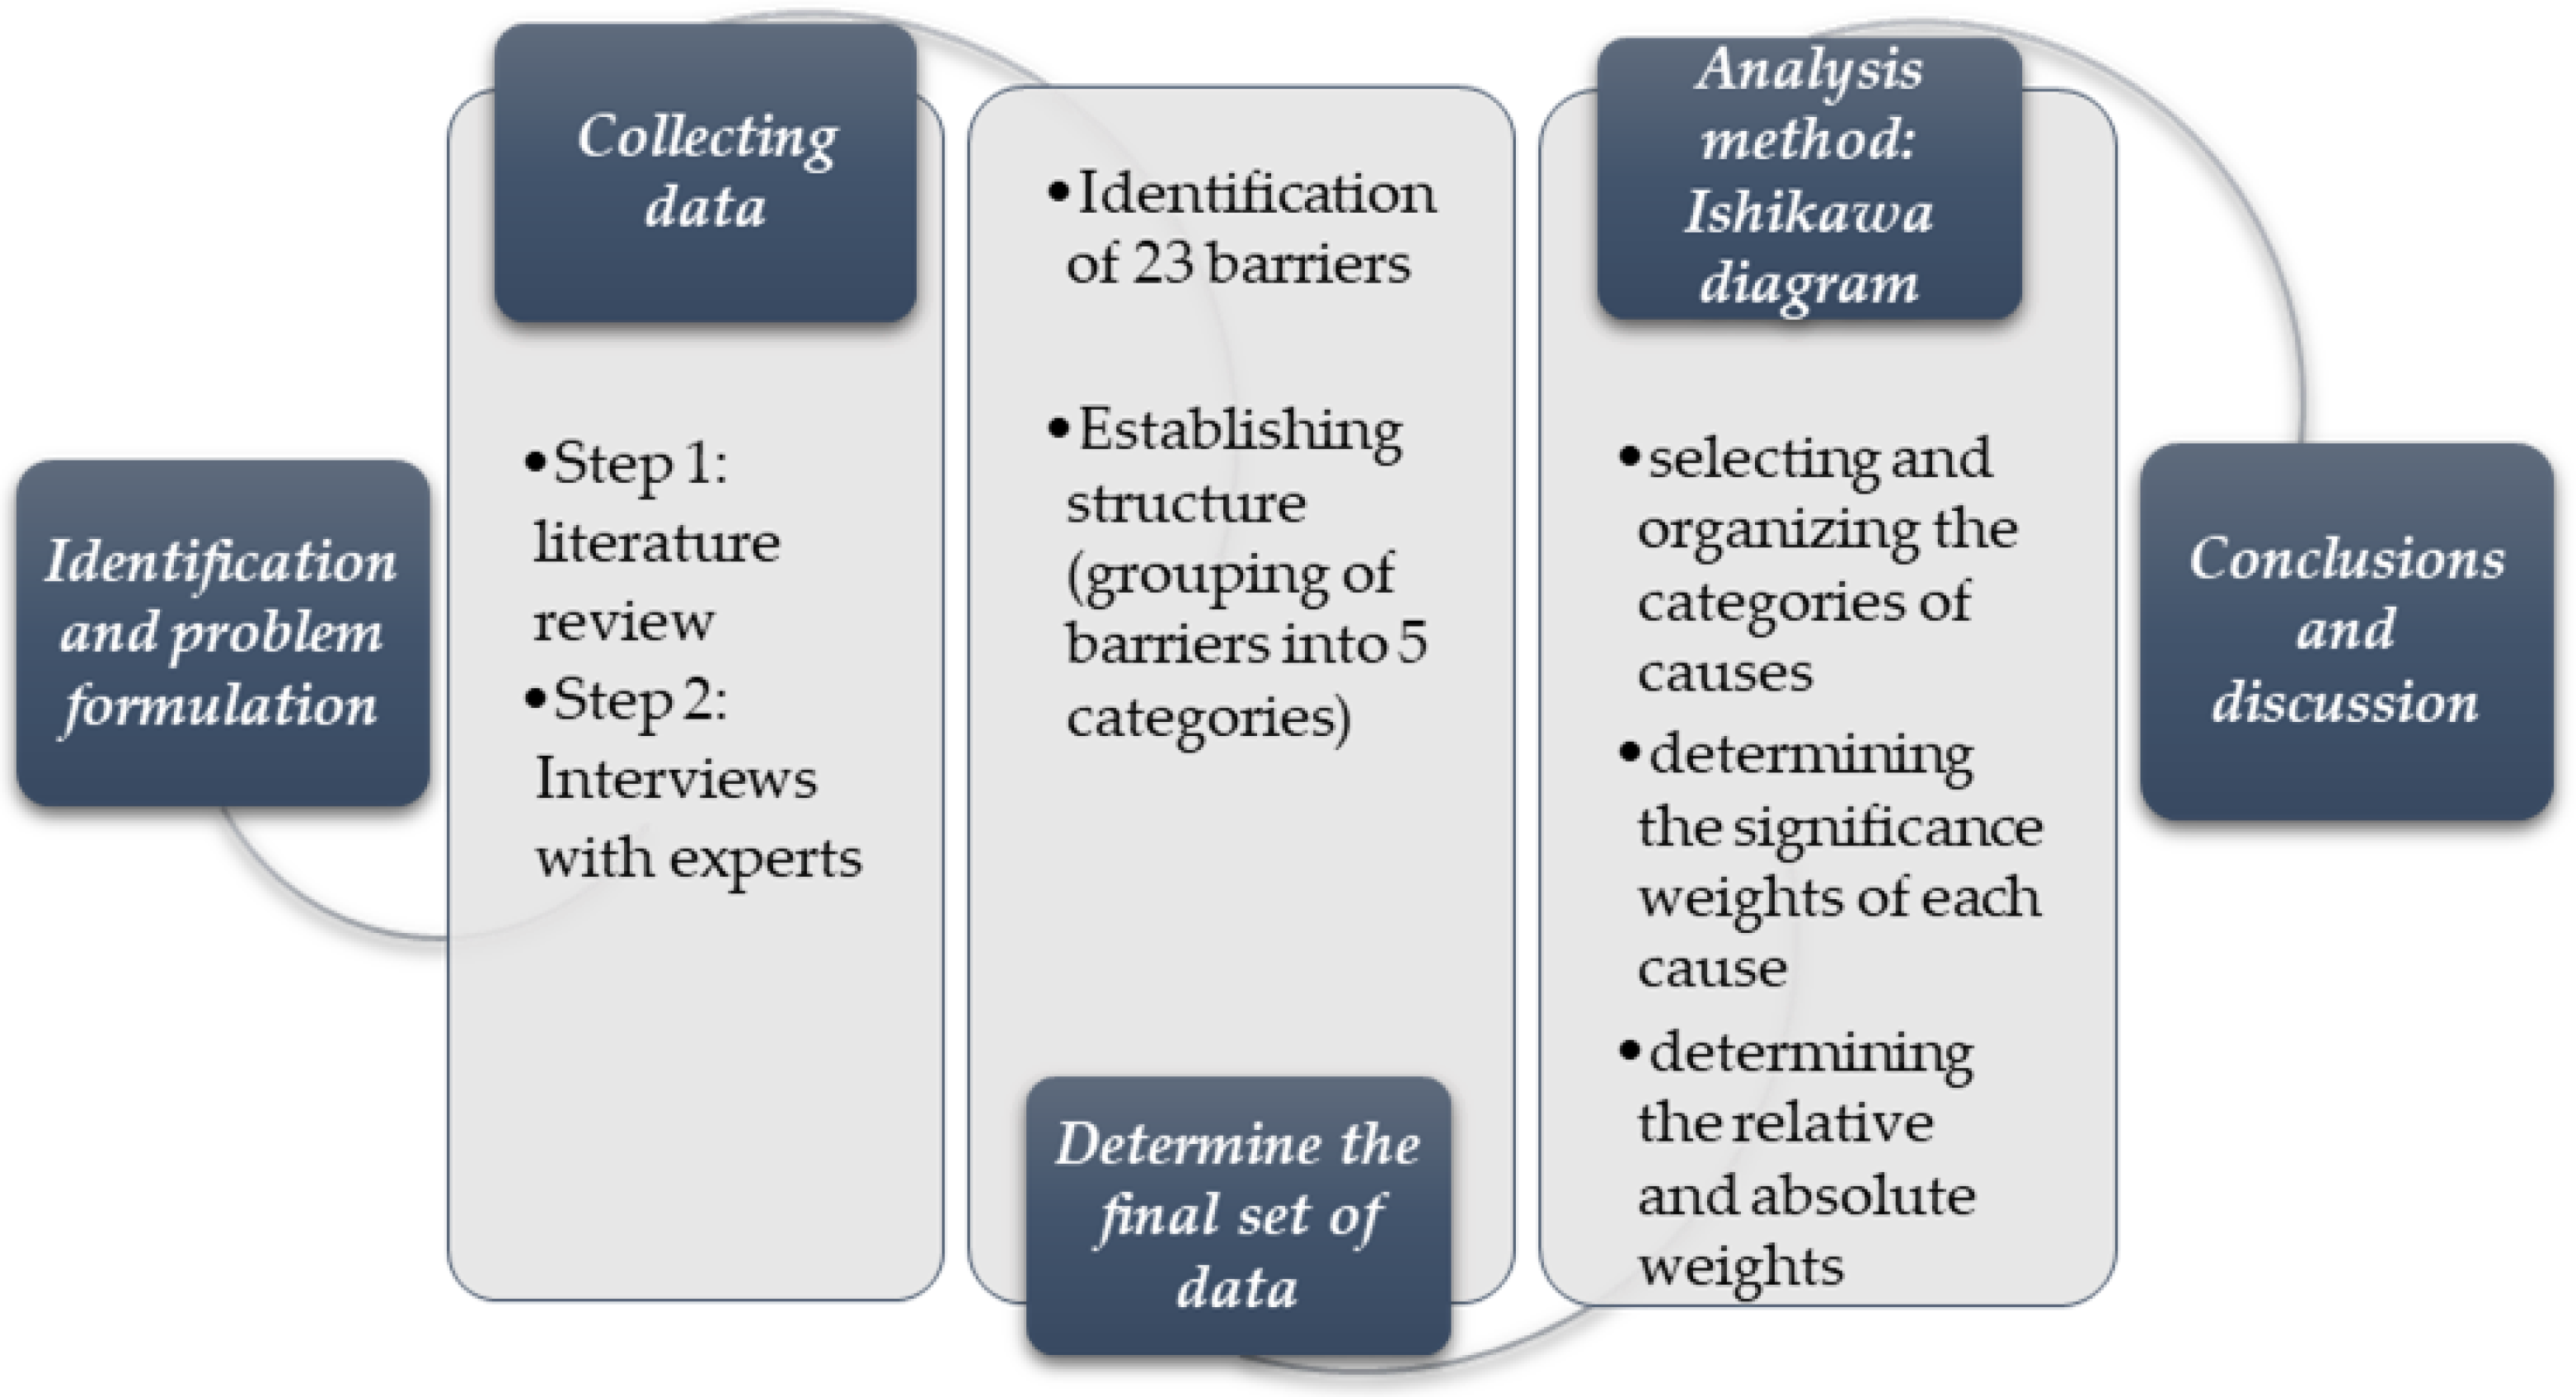
For this reason, the Authors of the present paper attempted to analyze the reasons for the slower implementation of BIM technology in the Polish construction process. The literature on the subject was reviewed, the available Polish market reports were analyzed, as well as documentation of individual cases of construction projects, and interviews with experts were performed in order to identify obstacles in the use of BIM technology in Poland. In order to classify and analyze the identified barriers, a quality management tool, namely the Ishikawa diagram [31], was used. The diagram makes it possible to identify phenomena and errors that influence the lack of success and the risk of failure of a given project. Its advantage is primarily the identification of areas where processes need to be improved [31]. Cause-and-effect analysis using the Ishikawa diagram may be burdened with a subjectivism error, therefore, in the conducted analysis, the Authors presented a weighted Ishikawa diagram, where individual factors were given appropriate significance weights, in order to indicate the best structure of causes affecting the poor implementation of BIM technology in projects performed in Poland. The subsequent stages of the research are presented in Figure 1.
2. Literature Studies—Identifying Barriers to BIM Implementation in the World
In [32] an analysis of the articles on the implementation of BIM technology published in 2009–2018 was performed, according to the keywords selected by the authors, the source of the articles, and the country of the authors. The Authors noted that the implementation of BIM was associated with factors that had been categorized to technical, management, environmental, financial, and legal types. As a result, the Authors concluded that implementation of BIM was low because of the existence of significant negative influence factors causing barriers challenges among construction participants. In [33] 14 barriers around the world identified by various researchers are listed. Lack of expertise (within the project team or within the organizations), high investment cost, lack of standardization, and legal issues are most often cited as significant barriers to BIM implementation. The study [34] analyzed the full texts of 73 selected articles in journals which were coded, with 89 barriers identified and assigned to five main categories: Context, Process, Team, Task, and Actors. In the second step of coding, barriers describing similar concepts were combined and, as a result, the list of barriers was reduced to 26 and further grouped into sub-categories. The largest number of barriers was classified into the category Context, with the following subcategories: Culture (7 barriers), Organization (2 barriers), and Environment (1 barrier). The fewest barriers were identified in the category Actors: 1 barrier: insufficient collaboration knowledge, skills, and abilities (KSAs) of team members. In [35] the authors examined the barriers hindering the implementation of BIM in construction. The aim of the research was to analyze 47 papers and available information about BIM, as well as to select and focus on the most frequently repeated barriers. As a result of the research, five major problems in BIM implementation were discovered: legal and contractual issues, cultural issues, management, financial issues, and security, which were divided by location (the UK, the USA, rest of word). It is worth noting that the map of origins of the reviewed articles presented in the paper did not include works from central and eastern Europe.
The extensive literature research on barriers and challenges in the implementation of BIM technology in construction revealed that, despite the recurring factors, the distribution of these barriers and challenges was different from region to region. For this reason, research conducted in various countries is still continued. Table 1 shows the 3 most important barriers identified by the researchers in the selected countries, according to the latest publications on this issue (2019–2021):
The literature also includes papers on the use of BIM in engineering [46,47] and solutions proposed [48,49,50]. In [51] attention was paid to the problem of cooperation between architects and structural engineers while developing BIM models. It was revealed that, despite the existence of collaboration platforms, especially in the case of designing tall buildings, they worked independently and only later they performed a labor-intensive and cumbersome combination of their separate models.
Work on the development of BIM technology in Poland goes back to 2014. Initially, these efforts concerned the practical application of BIM technology [52] and the analysis of the available software used for BIM [53]. In the following years, research into BIM was directed in selected directions and concerned, for example, BIM-based cost estimation [54], green BIM [55], BIM-based planning of works [56], and papers involving case studies [57]. Among the latest works related to the use of BIM technology in Poland, the following should be mentioned: [5] in which the authors conducted a SWOT (Strengths, Weaknesses, Opportunities, and Threats) analysis and described the elements of the resulting matrix in detail [58], regarding the current impact of BIM implementation on architecture, and [59] which proposes BIM and augmented reality (AR) application, which integrates a location-based management system (LBMS) to improve construction performance.
So far, the most extensive research on BIM in Poland was conducted twice by Autodesk in 2015 [60]: “BIM: a Polish Perspective” and in 2019: “BIM, cooperation, cloud in Polish construction” [61]. About 300 representatives of companies from the architectural and construction industry participated. The aim was to obtain information about elements related to BIM in Poland. A comparison of the results obtained from 2015 and 2019 shows that BIM technology is becoming more and more popular in the Polish architectural and construction market. The architects have by far the greatest contact with the implemented technology, and the level of knowledge about BIM in this group is consistently increasing (in 2015: 46%; in 2019: 76% of the respondents). On the other hand, the lowest level of knowledge about BIM, according to the latest research, is shown by private investors and legislators (in 2019: 11%). Interestingly, in the group of public investors, the knowledge and interest in this technology almost doubled compared to the 2015 research (2019: 30%). The differences between the groups of AEC sector stakeholders are significant, therefore the Authors made an attempt to identify the barriers to BIM implementation in Poland and, by using the Ishikawa diagram, indicate their interrelationships.
3. Method and Materials
3.1. The Ishikawa Diagram
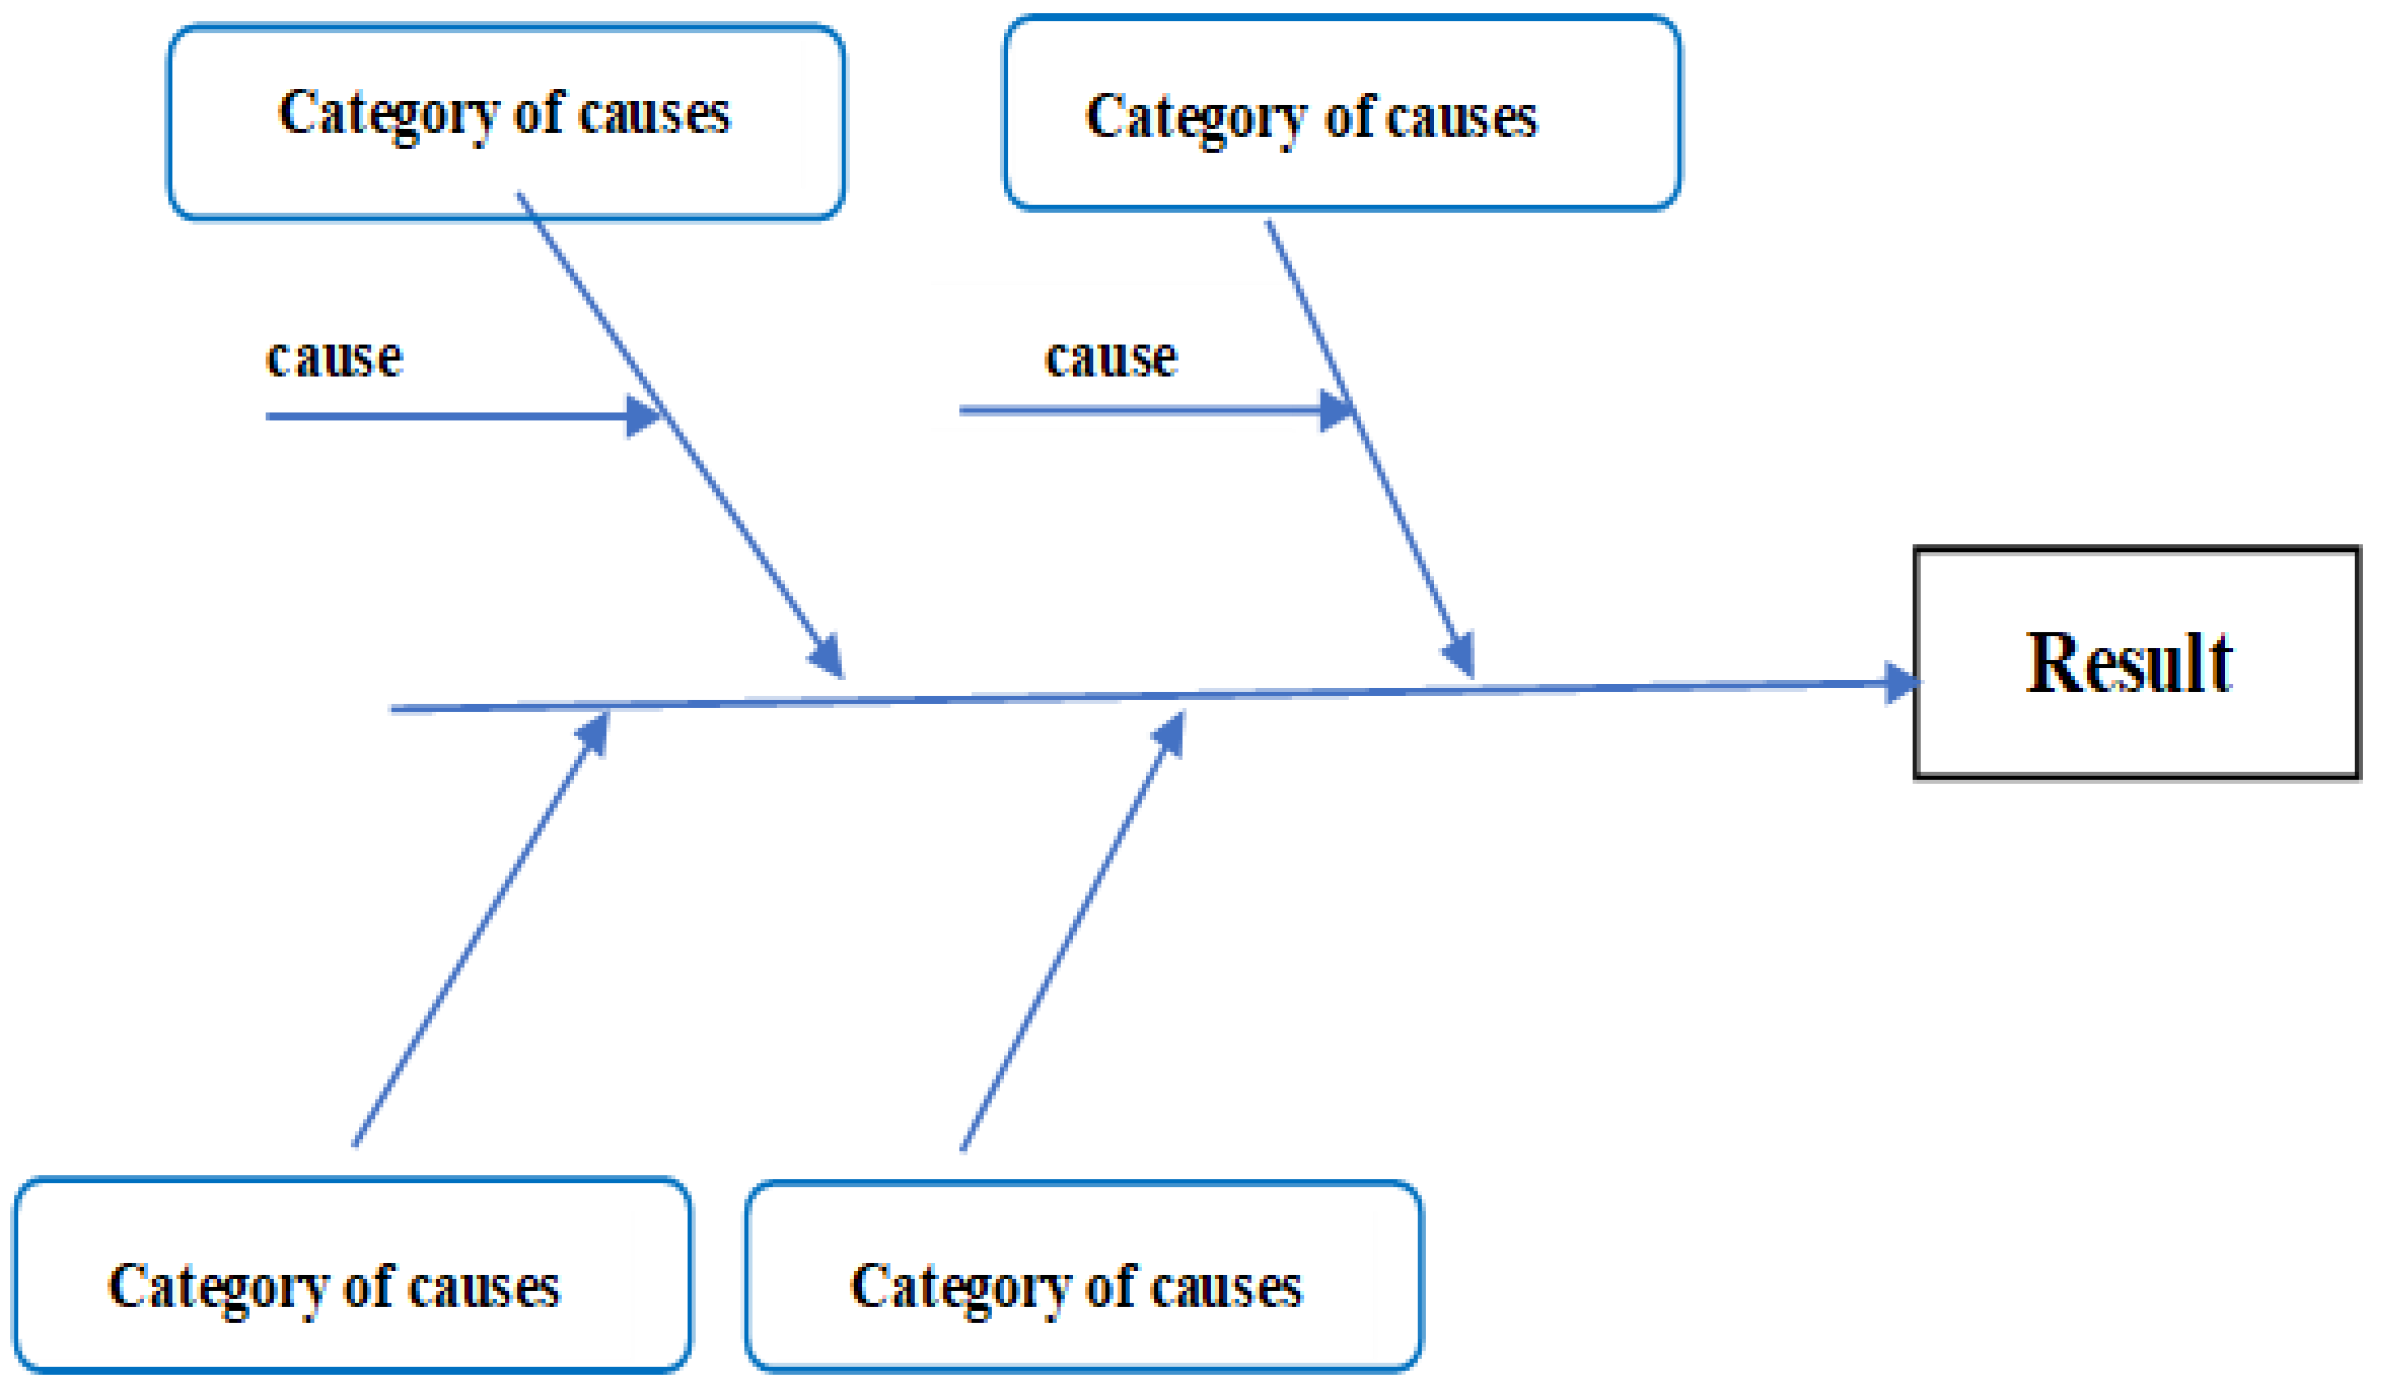
The Ishikawa diagram was developed by Kaoru Ishikawa, professor at the University of Tokyo, and was first used by the Japanese company Sumitomo Electric [62]. It is a traditional and frequent tool used in the field of quality management. It is defined as a graphic representation that schematically illustrates the relations between a specific result and its causes. The main assumptions of this tool are to rank the occurring causes of errors and inconsistencies in a given research area and to determine the interrelationships between these causes. The identified causes are presented graphically as a fish bone diagram (or a fish skeleton) where [63]:
- “fish head”—it is the result of defect and, at the same time, a problem to be solved;
- “spine”—brings together individual groups of causes,
- “bones”—indicate causes included in a given category.
3.2. Identifying Possible Causes for a Problem
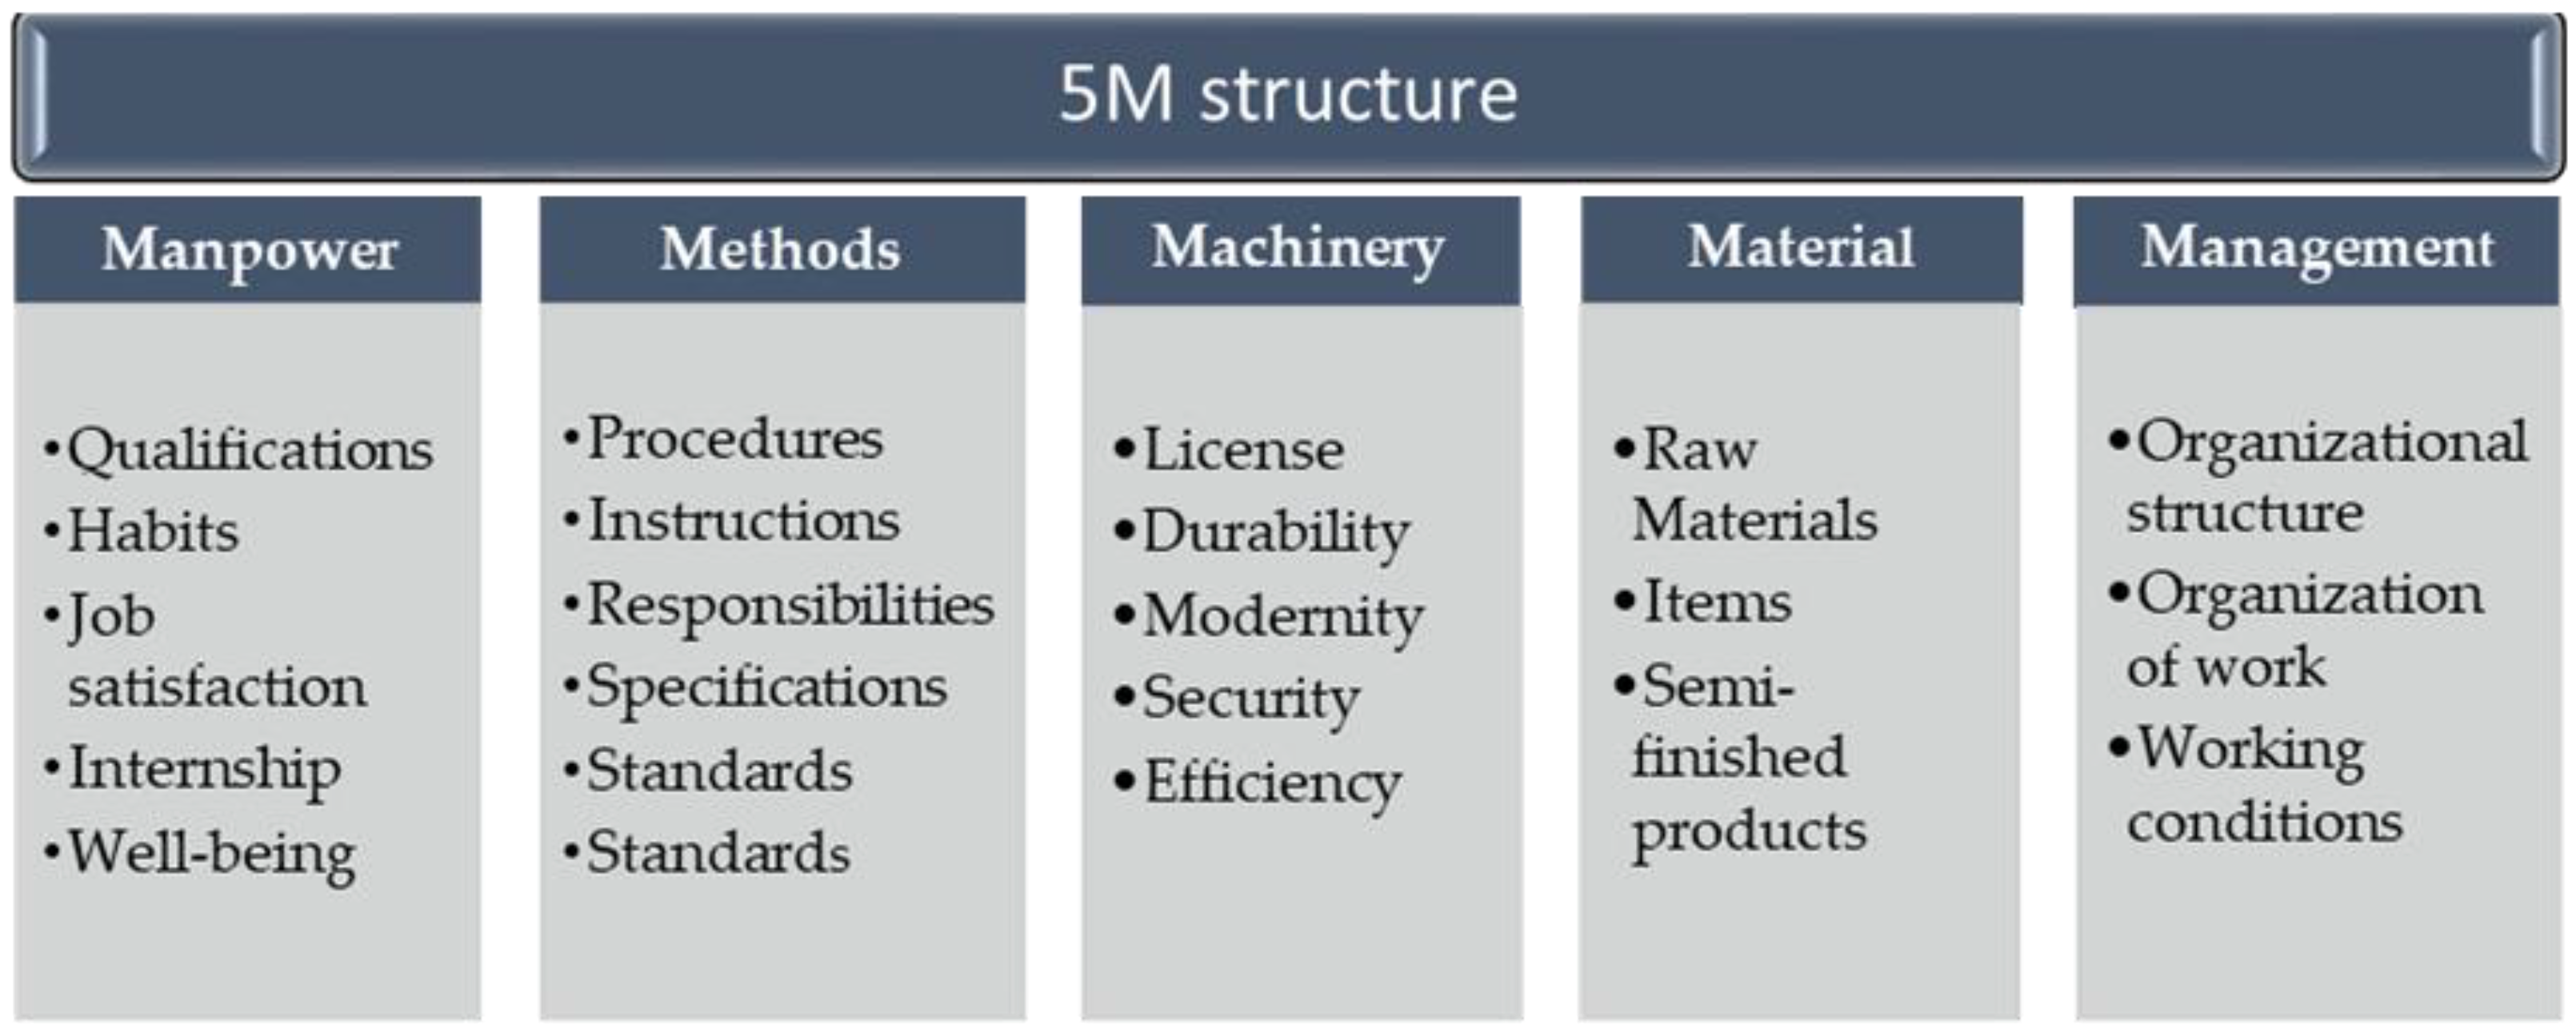
The essence of the qualitative tool which is the Ishikawa diagram is to identify the causes and sub-causes influencing the research area. In order to efficiently search and determine the nature of variation in the process, the so-called the 5M framework was adopted, according to which most problems and errors concentrate in five categories: People (Manpower), Method, Machine, Material, Management. An example of the scope of each category is presented in Figure 4.
It should be remembered in the application of the 5M framework that the division of causes into particular categories can be quite flexible [63] because a lot depends on the problem and the features of the area under study. Quite often there are causes that cannot be categorized, such as environmental (Environment) or financial ones (Money). Therefore, it is possible to expand the 5M framework with new categories, and the Ishikawa diagram may be structured according to the 5M + E (Environment) or 5M + F (Finance) frameworks. However, it is not recommended to enter more than eight categories [64]. In the field of construction, the Ishikawa diagram has already been used effectively. The studies to date concern, for example, assessing the quality of building materials and structures [65,66,67], the evaluation of factors affecting the accident rate [68], factors of investment delays [69], and the causes of the most frequent claims [70].
4. Results and Discussion
4.1. Identyfication of Barriers to BIM Implementation in Polish Architecture, Engineering and Construction Sectors
The latest report published in Poland by Autodesk in October 2019 under the name of “BIM, cooperation, cloud in Polish construction” [61] revealed that only 19.9% of all participants (N = 287) had ever been involved in the preparation of projects with the BIM methodology used in the current or previous workplace. This is a very small percentage of incorporating BIM technology into the construction process. According to the 2019 Report [61], the highest percentage of BIM use was recorded in architectural and design companies (43%), very low percentage in construction (contracting) companies (8.9%), and among property managers (5.3%). In the third quarter of 2020, the authors of the present paper conducted interviews in southern Poland in which 24 experts participated: professionals of Architecture, Engineering, and Construction. 50% of them were employees of contractors, 30% (7 people) designers, and 20% (5 people) consultants. The participants in the interviews had over 10 years of experience in the profession but did not exceed the limit of 20 years of service. Based on the study of literature, the reports mentioned before and interviews, 23 reasons were identified as barriers hindering the development of BIM technology in Poland, broken down into 5 main categories, that is, People, Finance, Method, Management, and Machinery.
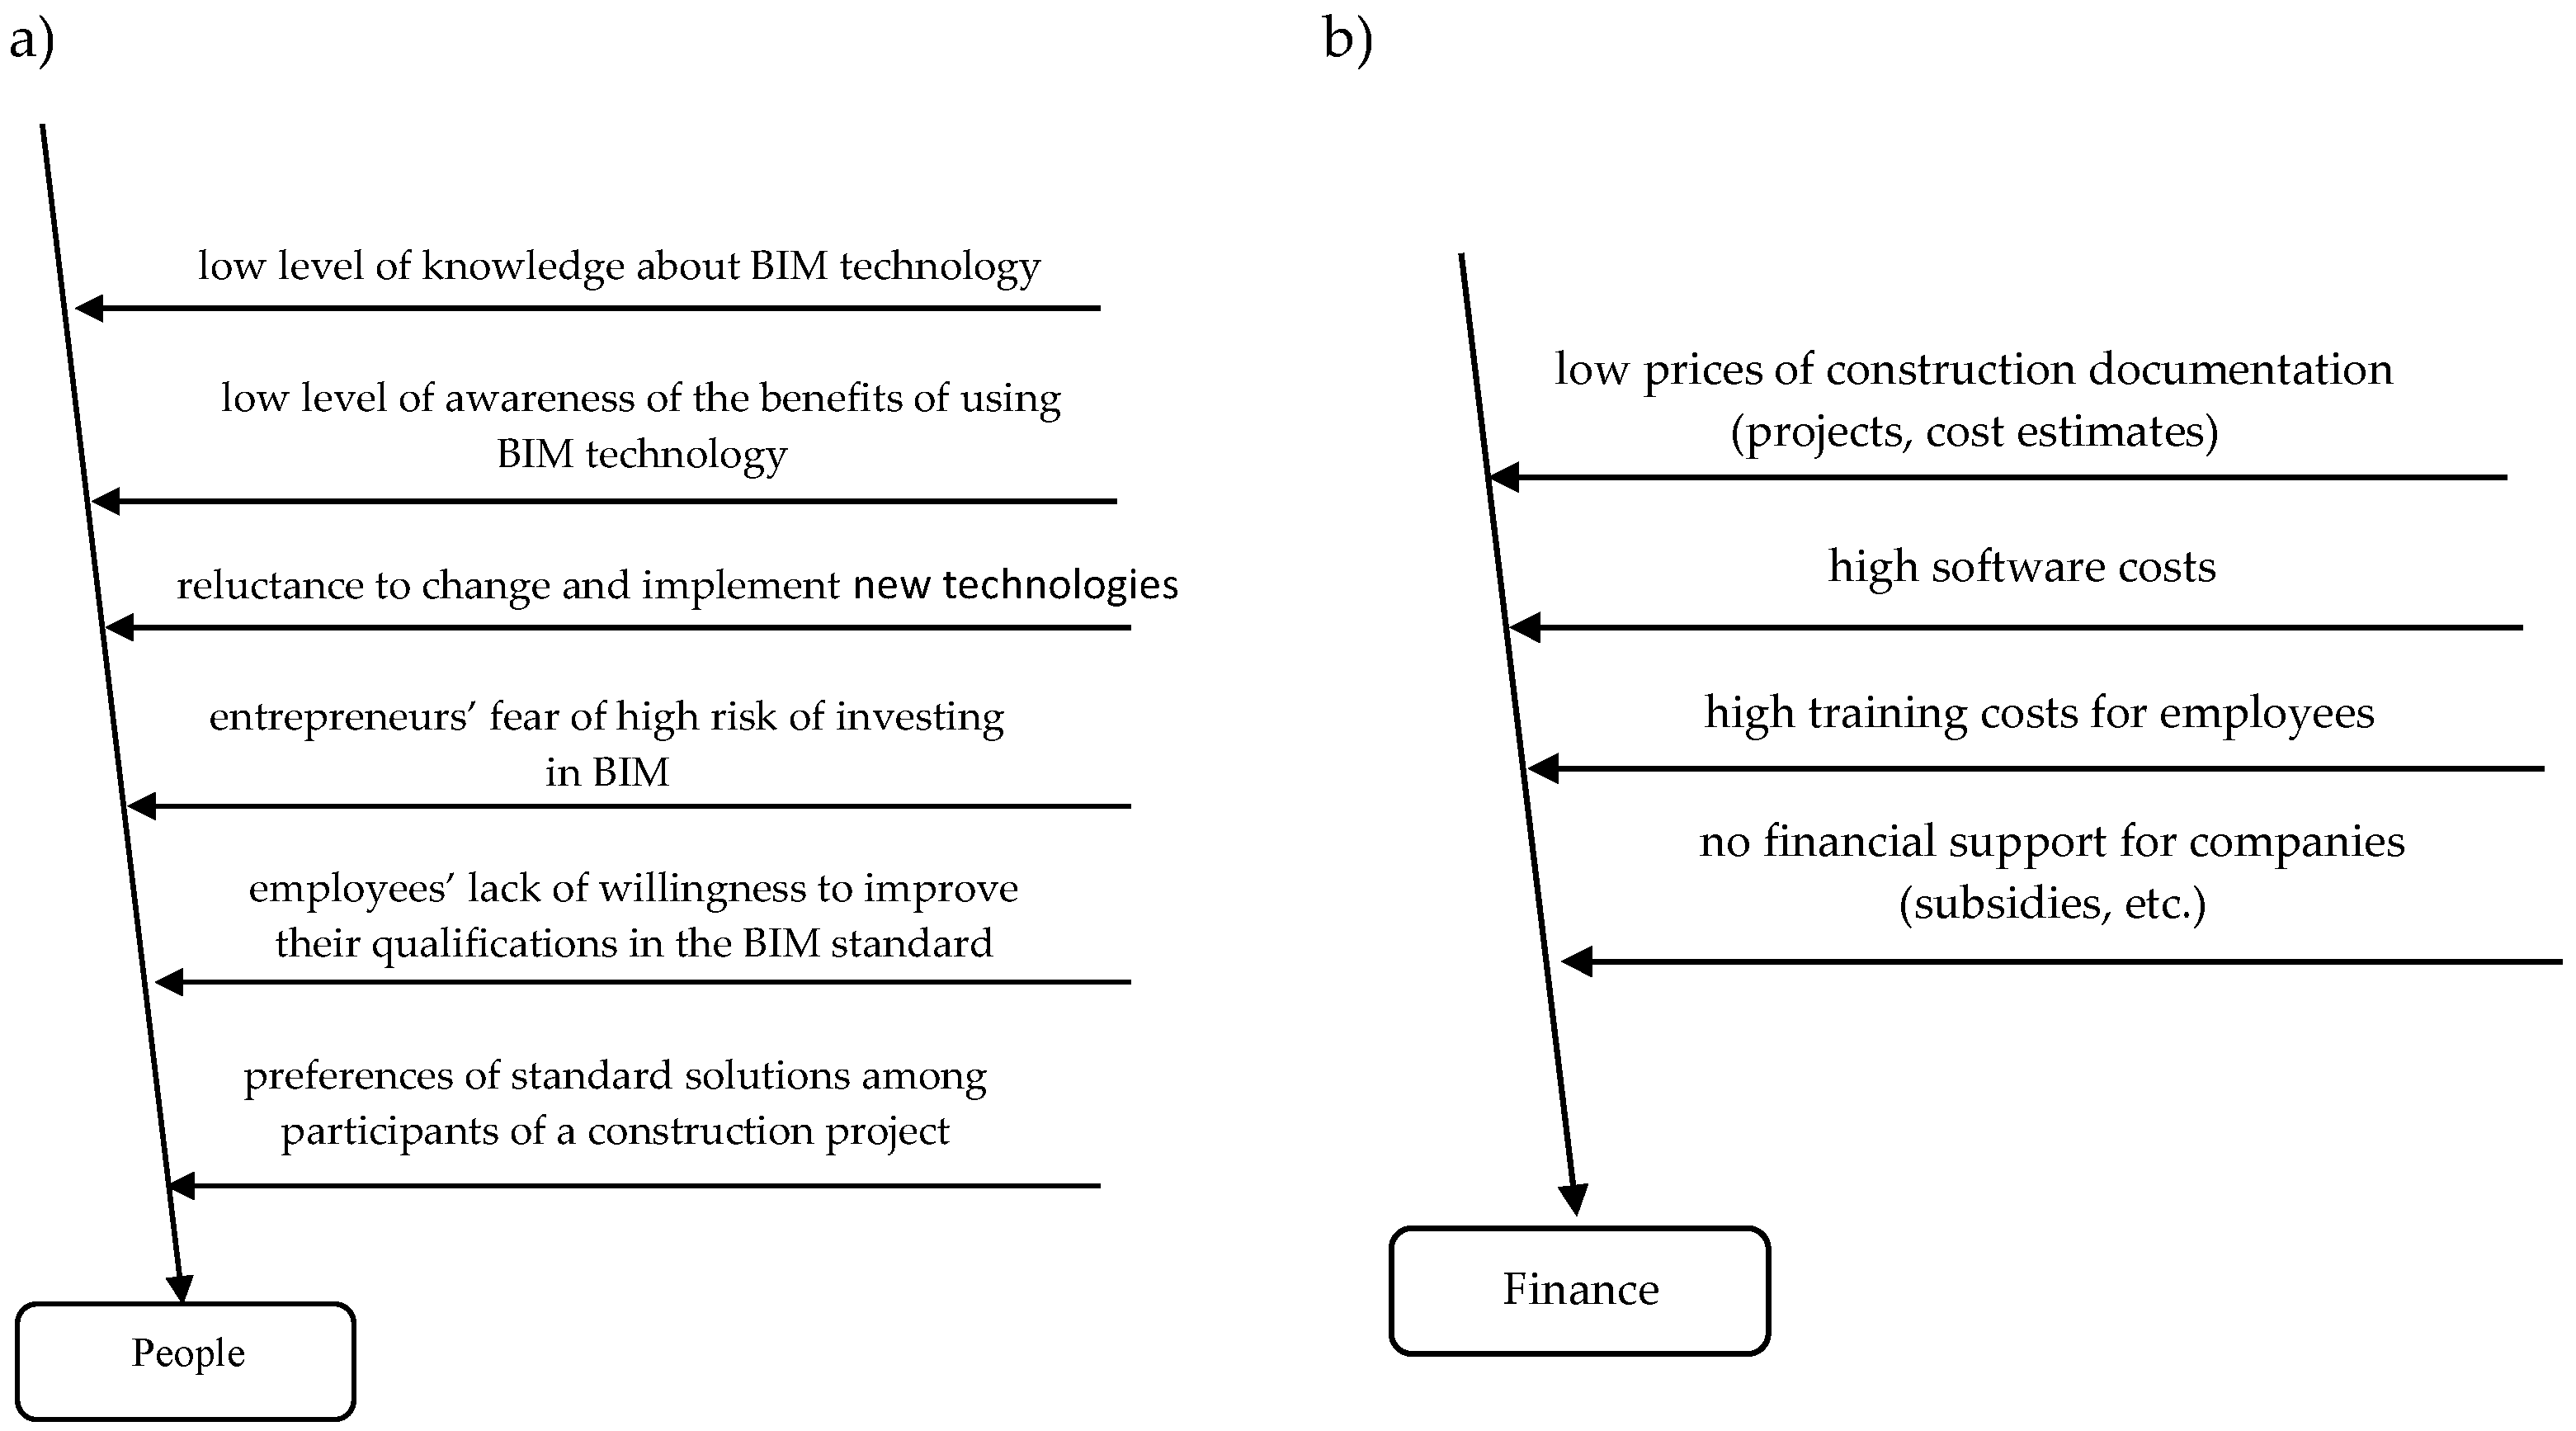
Category I—People—this group includes 6 reasons that contribute to the poor implementation of BIM in the construction process in Poland. The causes are shown in Figure 5a, as part of the Ishikawa diagram, the fishbone.
The identified barriers in the People category (Figure 5a), influencing the lack of BIM implementation, are mainly factors describing the employee’s attitude to new technologies and the nature of the work performed. The barriers limiting the implementation of BIM technology include employee habits, reluctance or fear of changes, the lack of willingness to improve their qualifications in the field of BIM technology, and a very low level of awareness of the benefits of introducing a virtual environment to the design, execution and later management of a building to the participants in the construction process, both regular and managerial staff.
Category II—Finance (Figure 5b)—4 reasons are included in this category, some of which refer to the excessively high costs of software and training for employees. These are the costs that the company must incur at the very beginning of the investment, and the low prices of projects and construction documentation do not cover the costs allocated to the implementation of BIM technology. Moreover, no co-financing or subsidies are intended for the implementation of the BIM environment in the construction process that would allow small- and medium-sized companies to implement and start modeling in the virtual cloud.
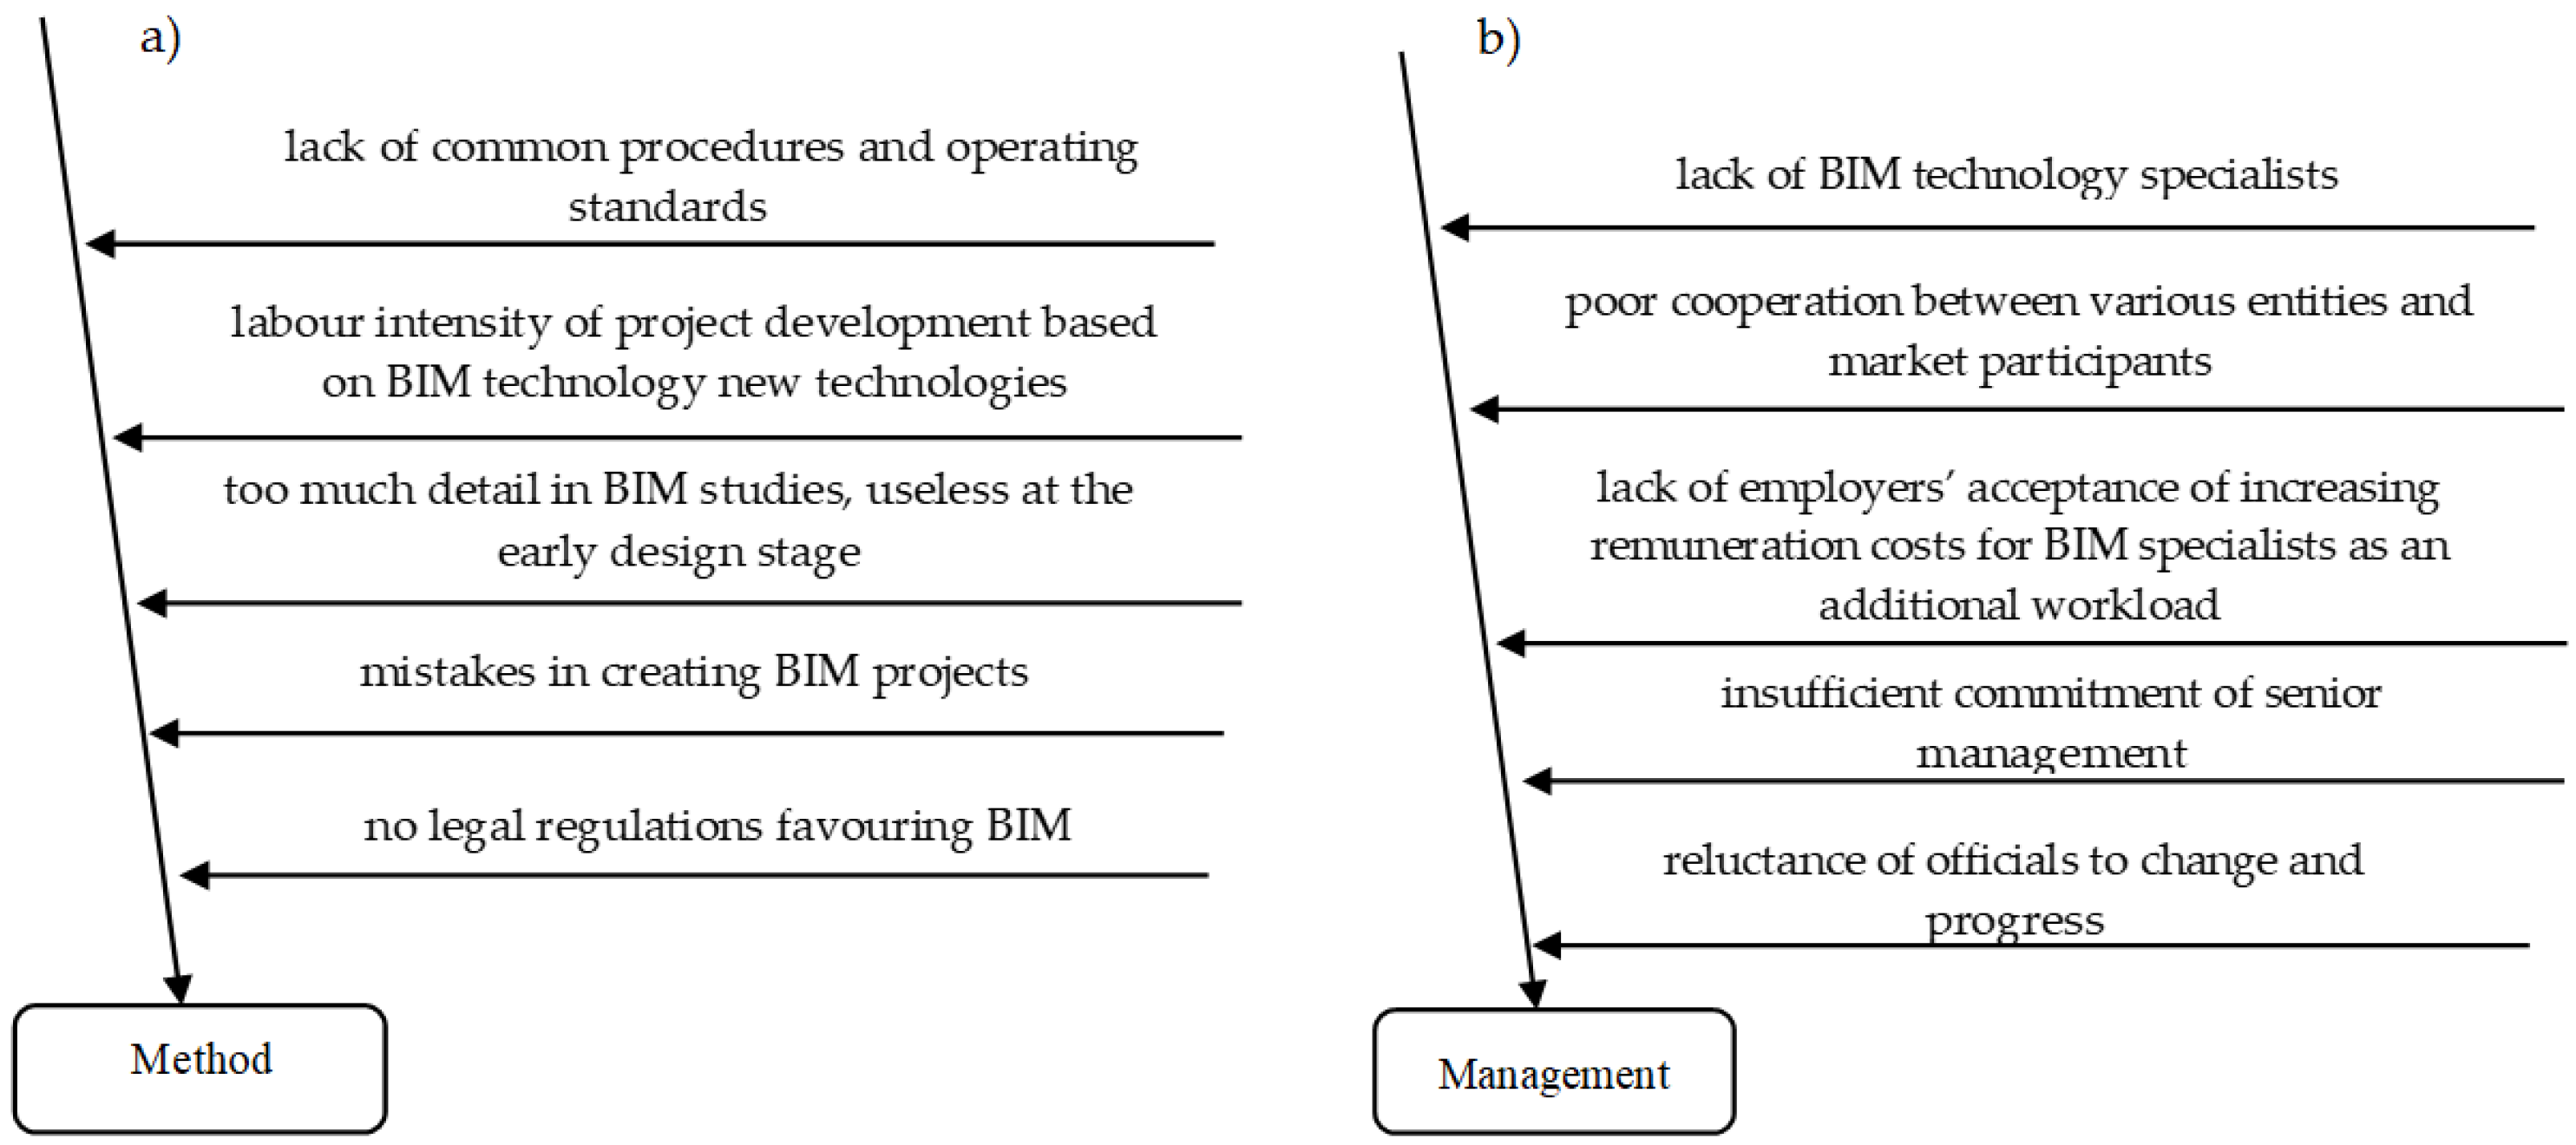
Category III—Method—in the Method category, 5 causes were identified, which can be divided into 3 groups. The first one concerns the design and virtual modeling itself and the resulting limitations, such as very high labor consumption in the implementation of multidimensional models, very high detail, which is not required in the early preparation of the concept of a facility, and frequently occurring errors, resulting mainly from the designer’s lack of knowledge. The second group of reasons consists of barriers related to the developed methods and standards of operation, which are not standardized or common to each participant in the construction process. The last group includes the lack of legal regulations that would support faster implementation of BIM technologies, for instance in public procurement. The 5 identified causes are presented in Figure 6a.
Category IV—Management (Figure 6b)—5 reasons for the poor implementation of BIM in Poland were assigned to this category. The factors identified relate to the organizational structures of private enterprises as well as public and state bodies. Bad management, lack of willingness to cooperate with other authorities, lack of commitment of the management team, and lack of consent to higher remuneration for BIM coordinators result in the lack of specialists, thus becoming barriers that hinder the implementation of BIM in Polish enterprises. The barriers in the Management category are presented in Figure 7b.
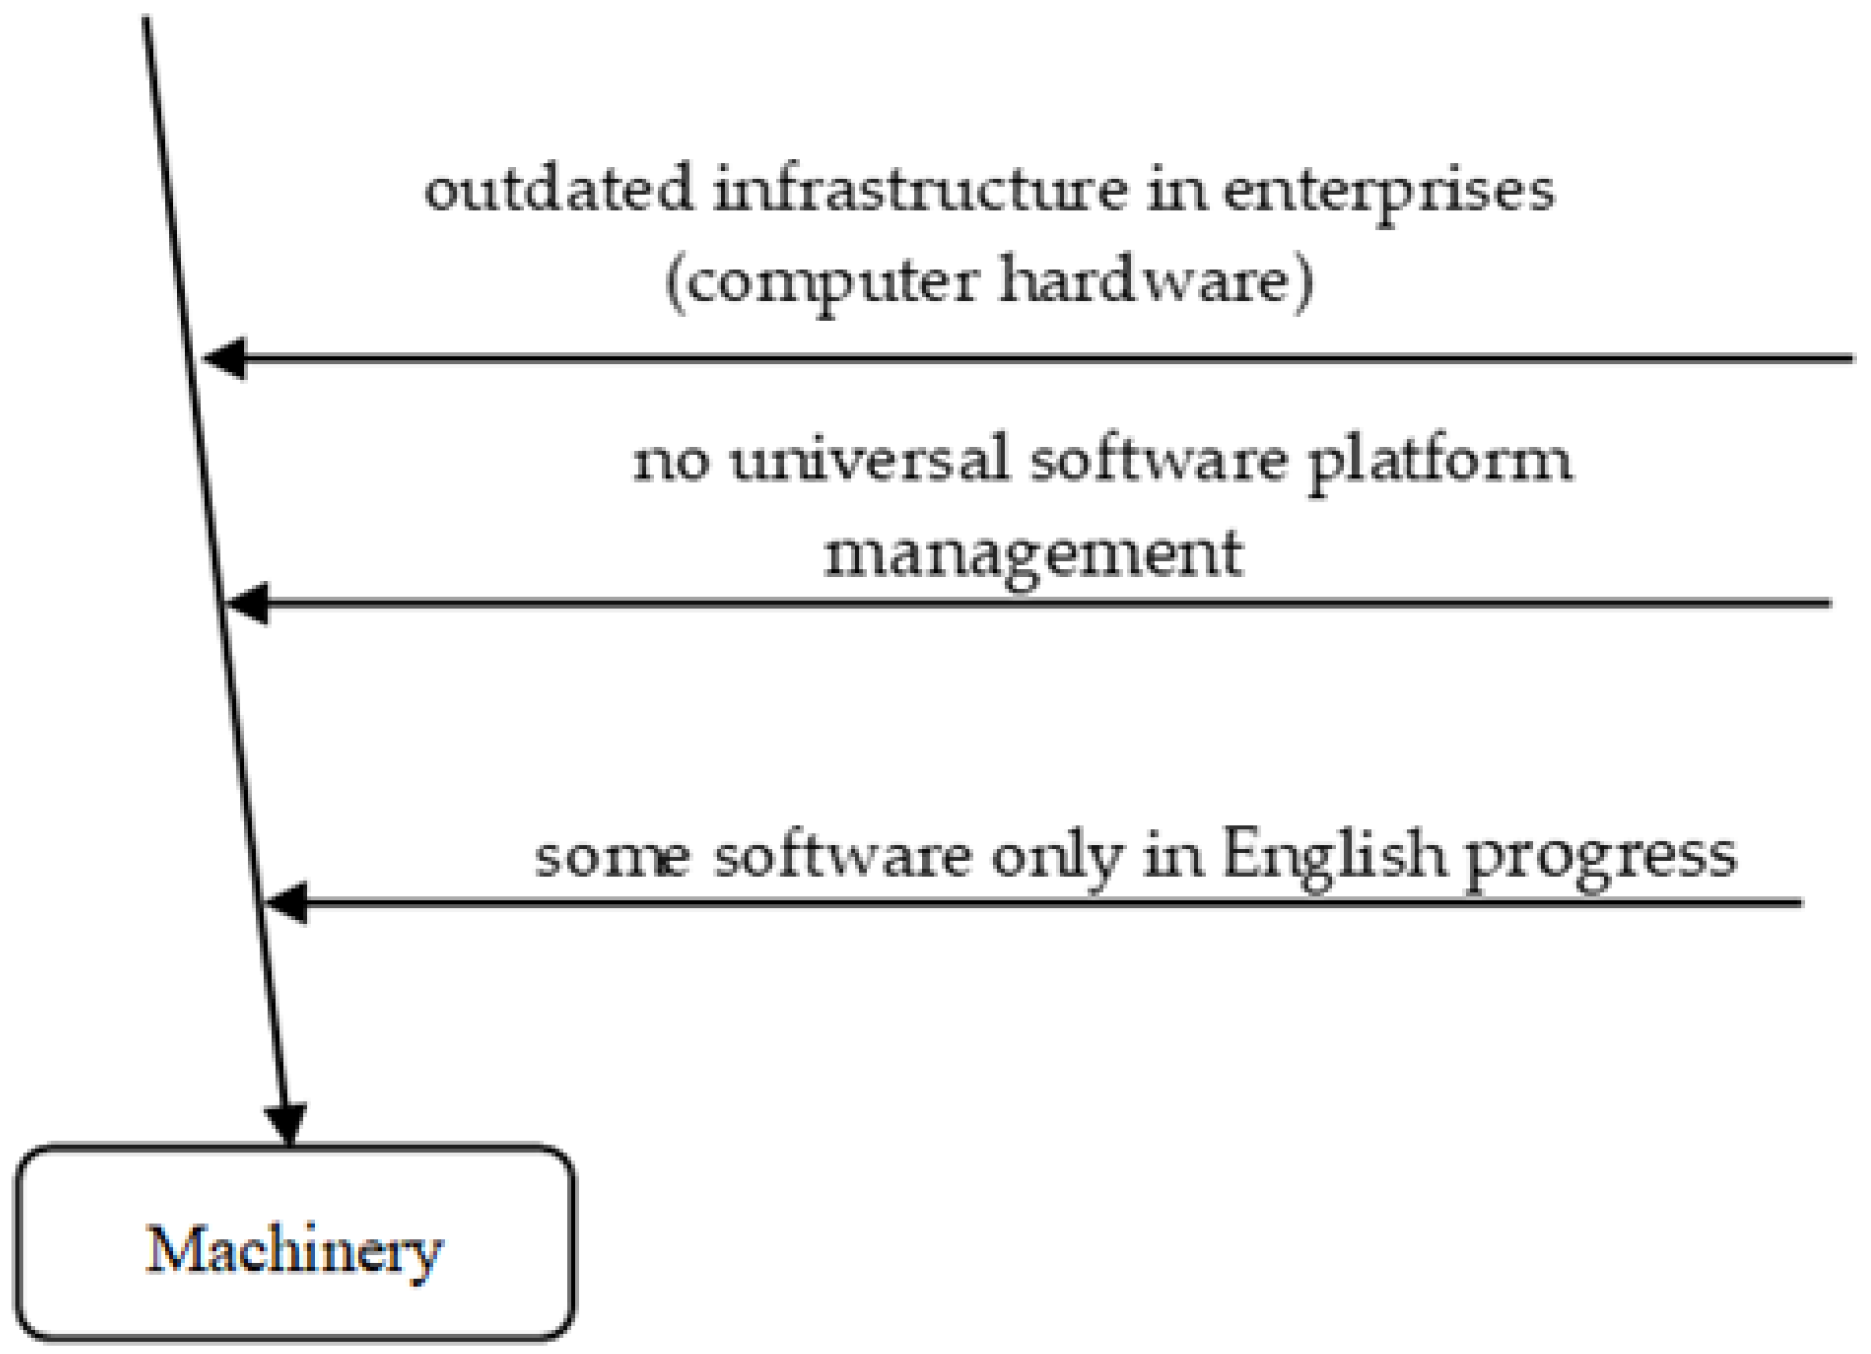
Category V—Machinery—3 barriers have been assigned to the last category, namely the Machinery, regarding both BIM software and computer hardware available in companies. Such factors as the lack of a universal platform for BIM software were distinguished here and attention was drawn to the fact that the add-ons and plugs the software uses are only in English, which causes great difficulties for older participants in the construction process. Another limitation concerns computer hardware in small and medium-sized companies, which is sometimes outdated and insufficient to generate multi-dimensional models. These reasons are presented in Figure 7.
4.2. Cause and Effect Analysis
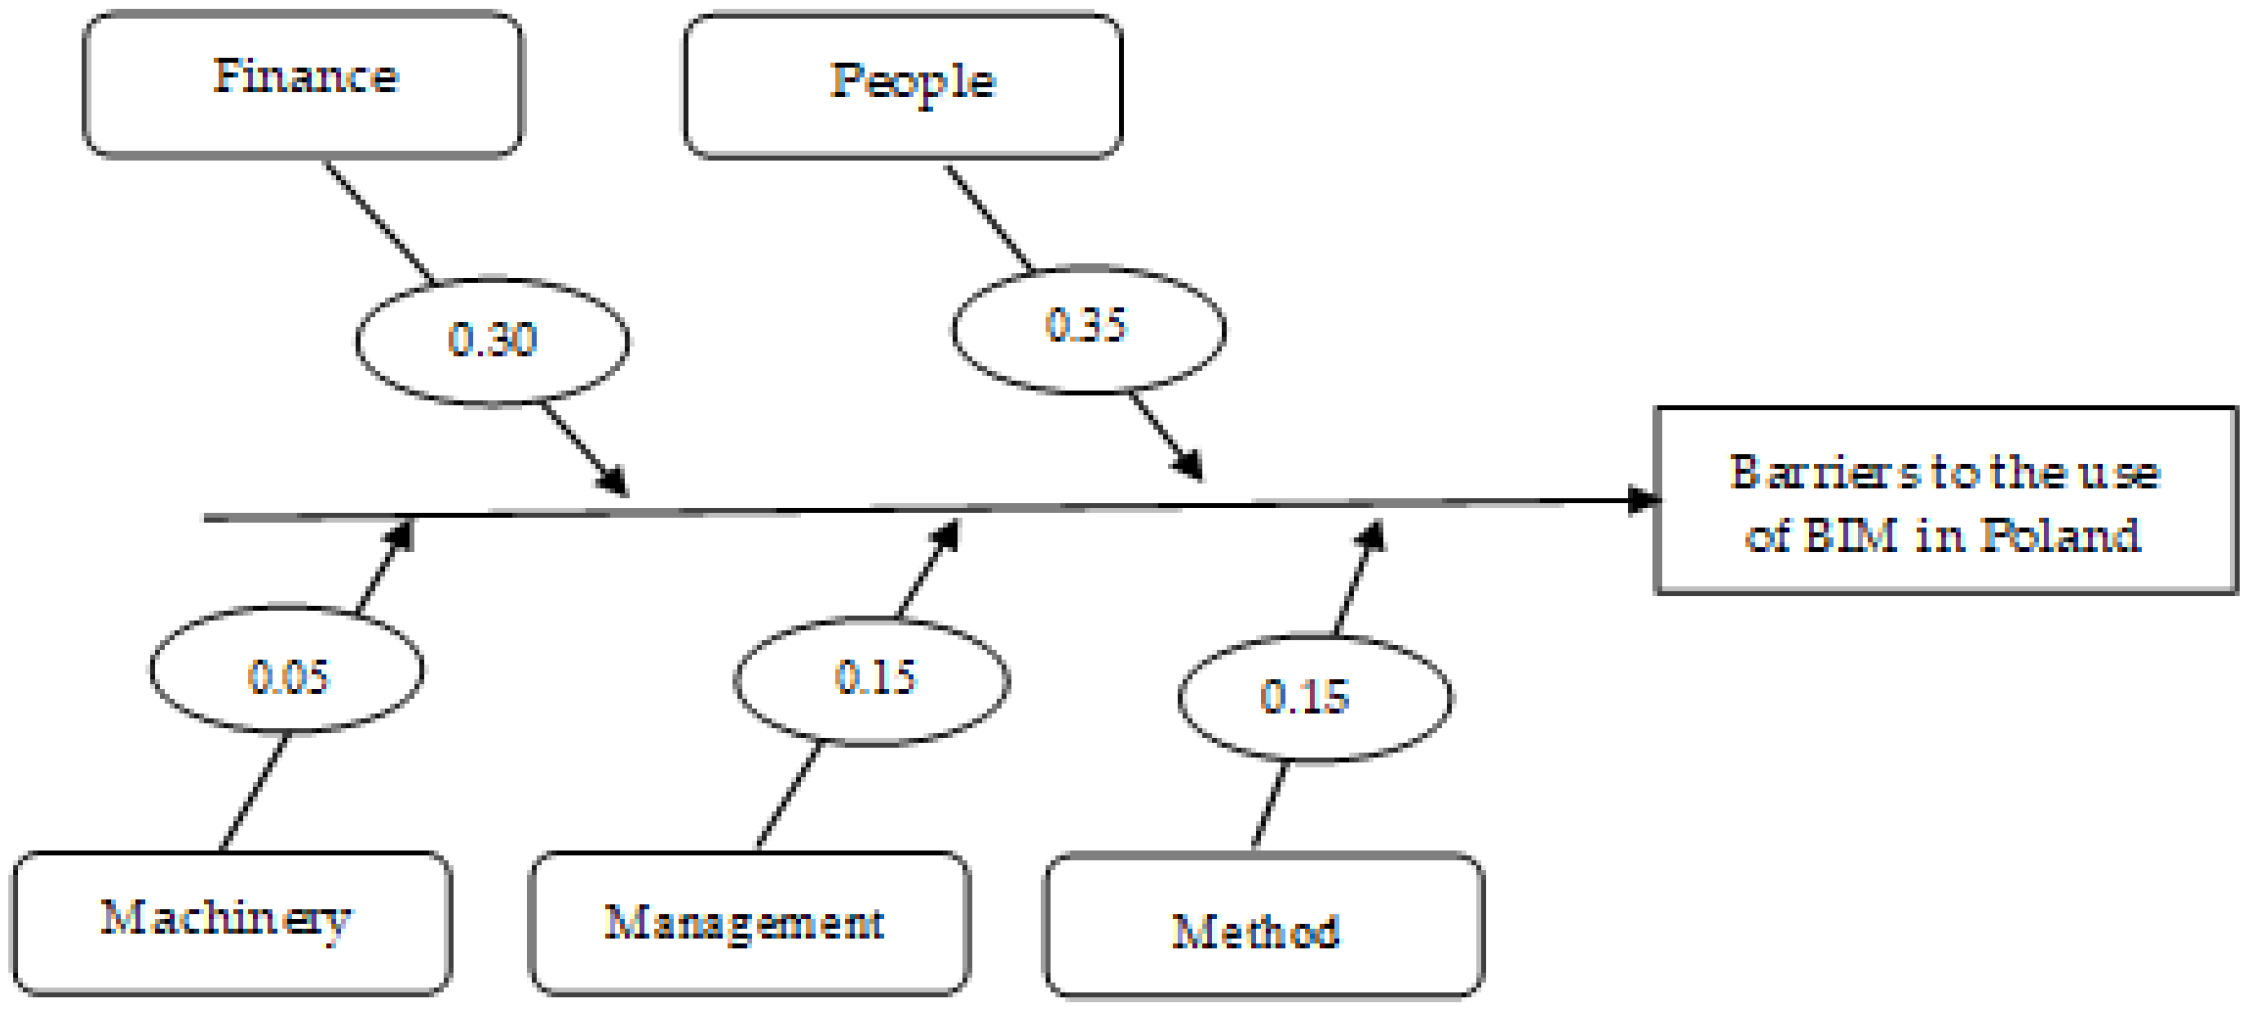
The first stage of the cause-and-effect analysis of barriers to the implementation of BIM technology in Poland was the identification and ordering of the most important groups of causes. The analysis was performed using the pairwise comparison method and the significance weights of the main categories were determined. Six experts were invited, including two architects, two constructors, contractor manager, and investor’s representative, to describe the relationships between the main categories and then identified factors. Significance weight value was described as a 3-point scale: 1—superiority of the first category over the second, 0.5—equivalence of both categories and 0—inferiority of the first category over the second. The 5-point scale proposed by Likert is a known and widely used opinion measurement tool in questionnaires and expert interviews [71]. Researchers also propose its variants, namely 4-point, 6-point, and 7-point Likert alternatives [72]. By increasing the number of points on the rating scale, the rounding error of the results is reduced; however, this may cause fatigue and weariness in the respondents, as well as cognitive dissonance [73]. In the case under consideration, to issues related to barriers of BIM technology implementation in civil engineering projects, the authors, guided by their experience, decided that to conduct the interview it would be sufficient to adopt a 3-point scale, and the analyzes would be based on average values from the ratings assigned by individual respondents. This approach is a simplification, yet it is successfully used in, for example, medical science, where a weighted Ishikawa diagram using a 3-point rating scale was used to analyze the causes of infections [74]. The results are presented in Table 2.
Based on the calculated significance weights and the identified root causes, a classic Ishikawa diagram was constructed: Figure 8.
The next step in the analysis is to determine the significance weights for 23 identified causes. Table 3 presents the significance weights of each of the causes against the other specified reason. The significance weight value was described as: 1—superiority of the first category over the second, 0.5—equivalence of both categories, 0—inferiority of the first category over the second.
Table 3 presents the significance weights in the People, Finance, Method, Management, and Machinery category.
Based on the defined weights of significance for each of the reasons, the relative weights of significance were determined. The absolute weights of factors were determined by multiplying their relative weights by the value of the weight of a given category. The results are presented in Table 4.
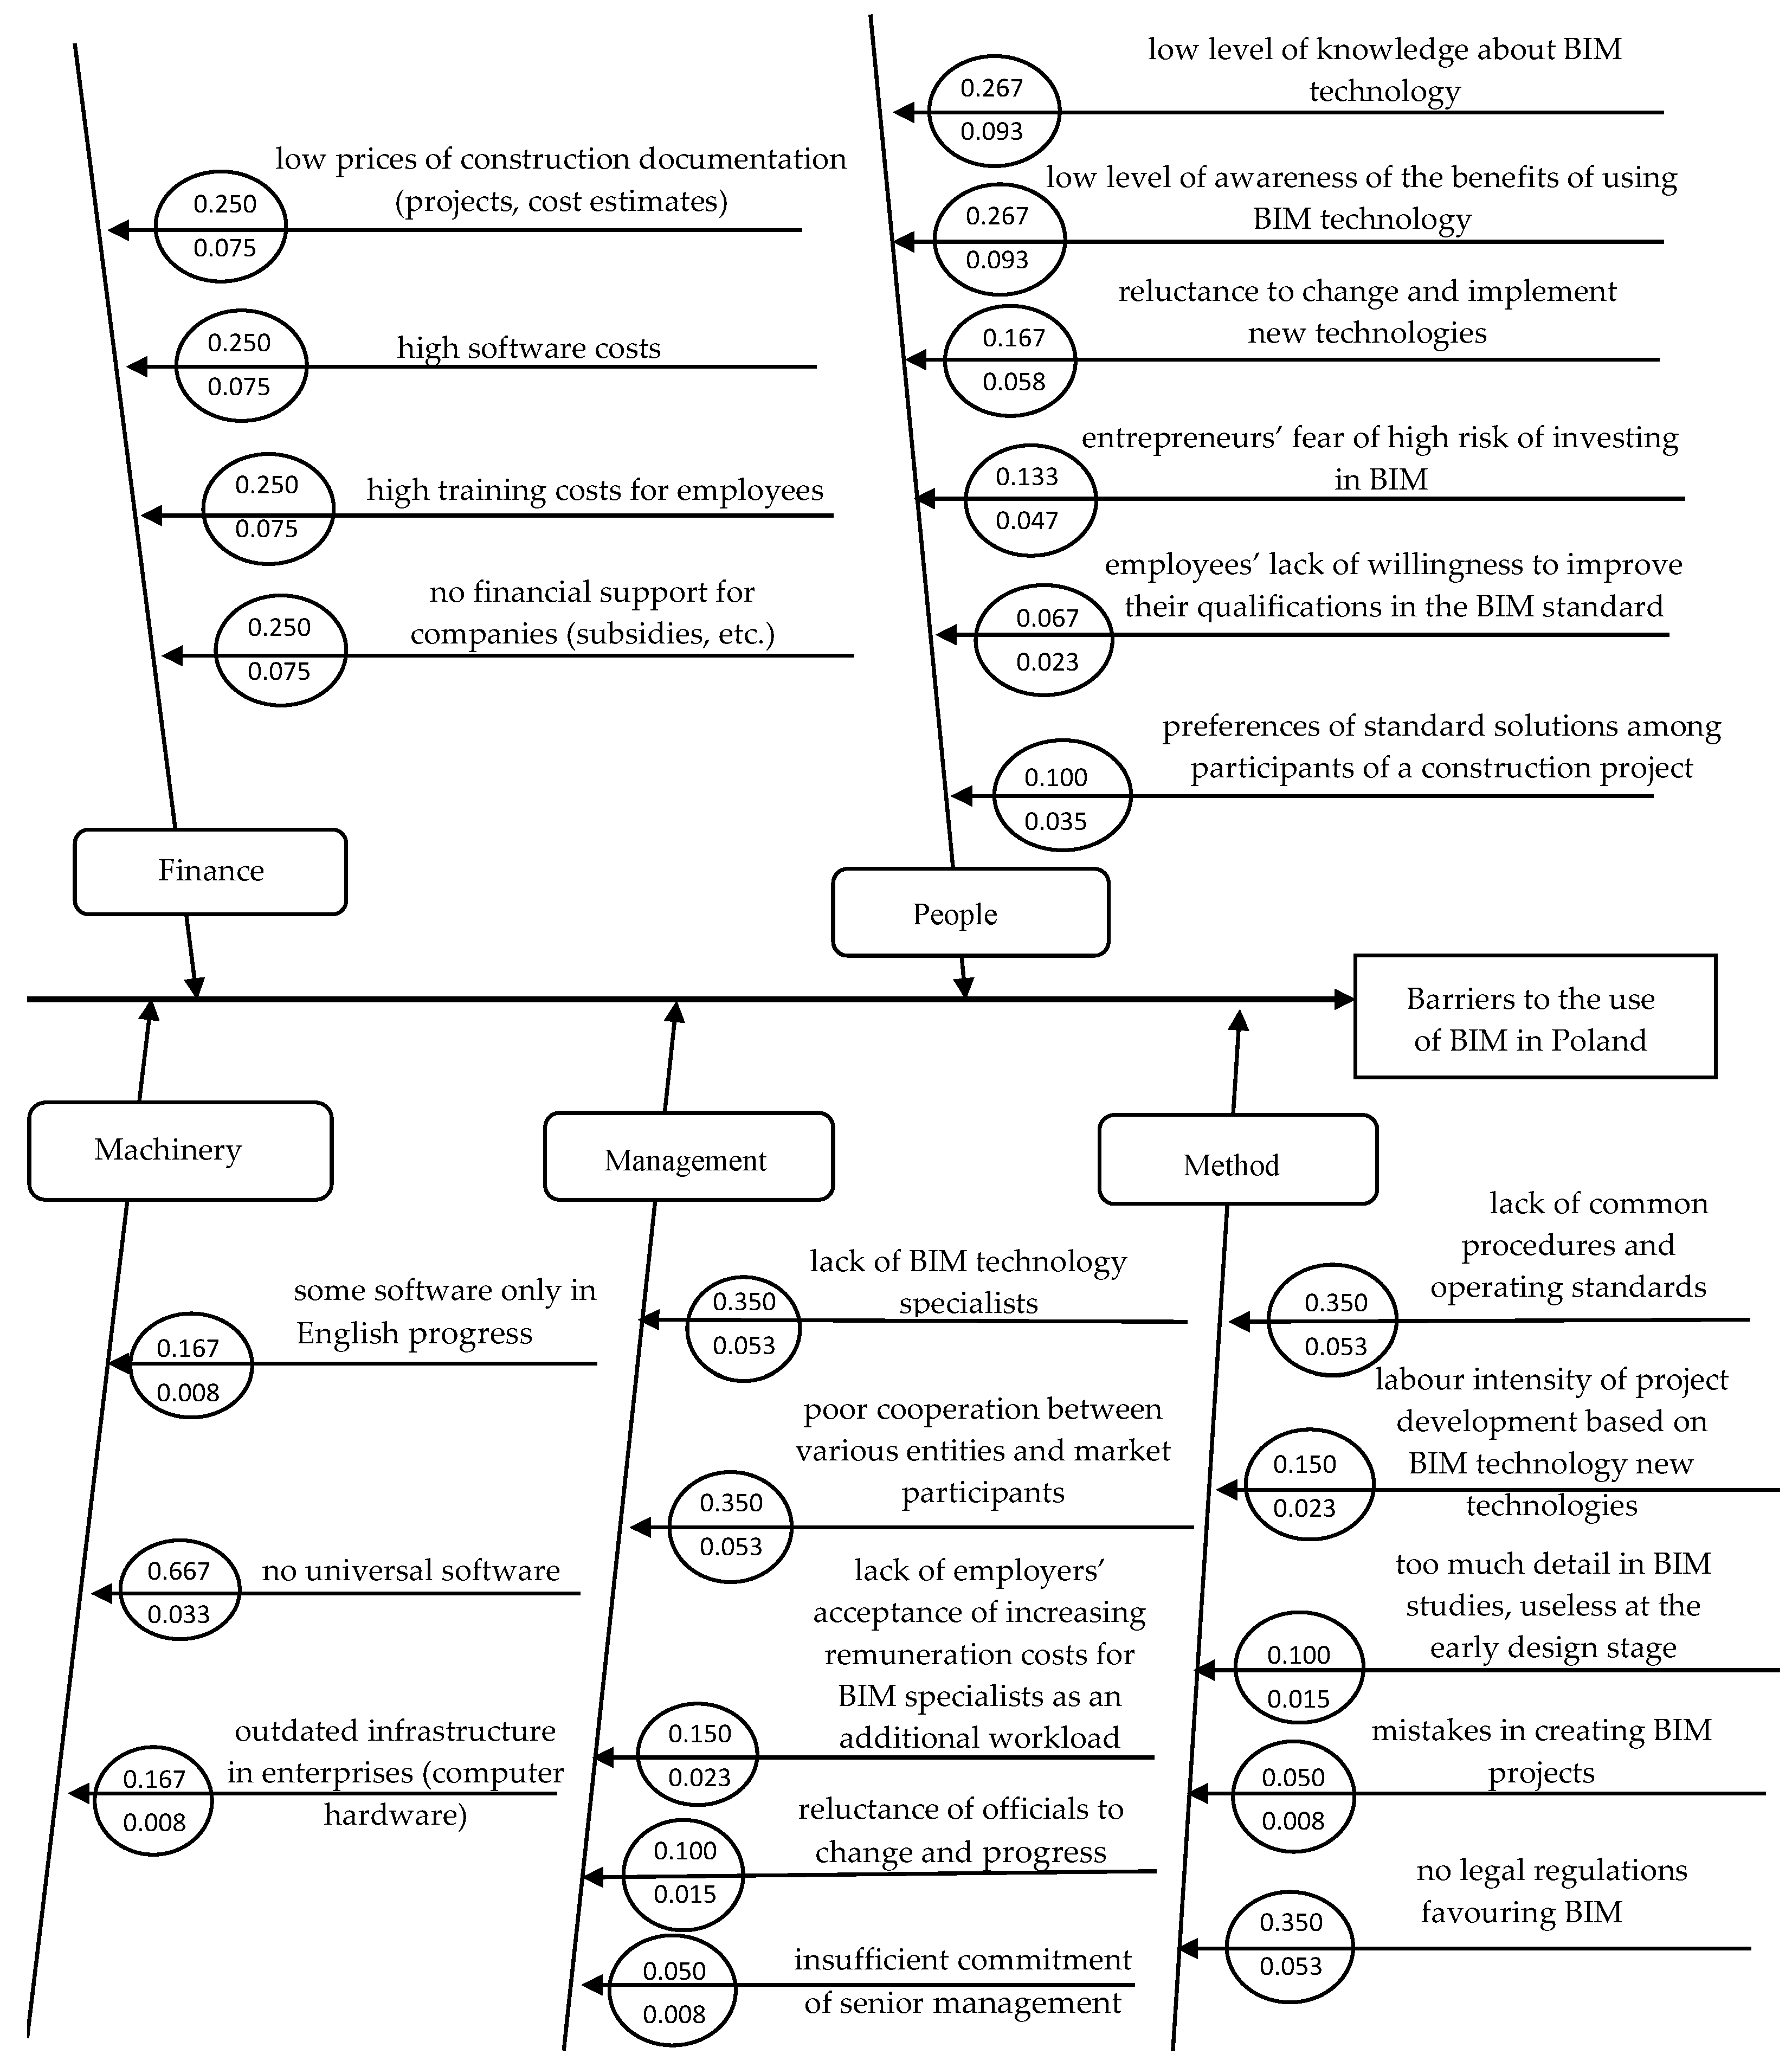
Based on the calculated relative and absolute weights of significance for the identified causes, the Ishikawa diagram was extended with the data of the characteristics (Figure 9).
4.3. Final Results and Discussion: The Most Important Barriers Limiting the Full Implementation of BIM Technology to the Construction Process
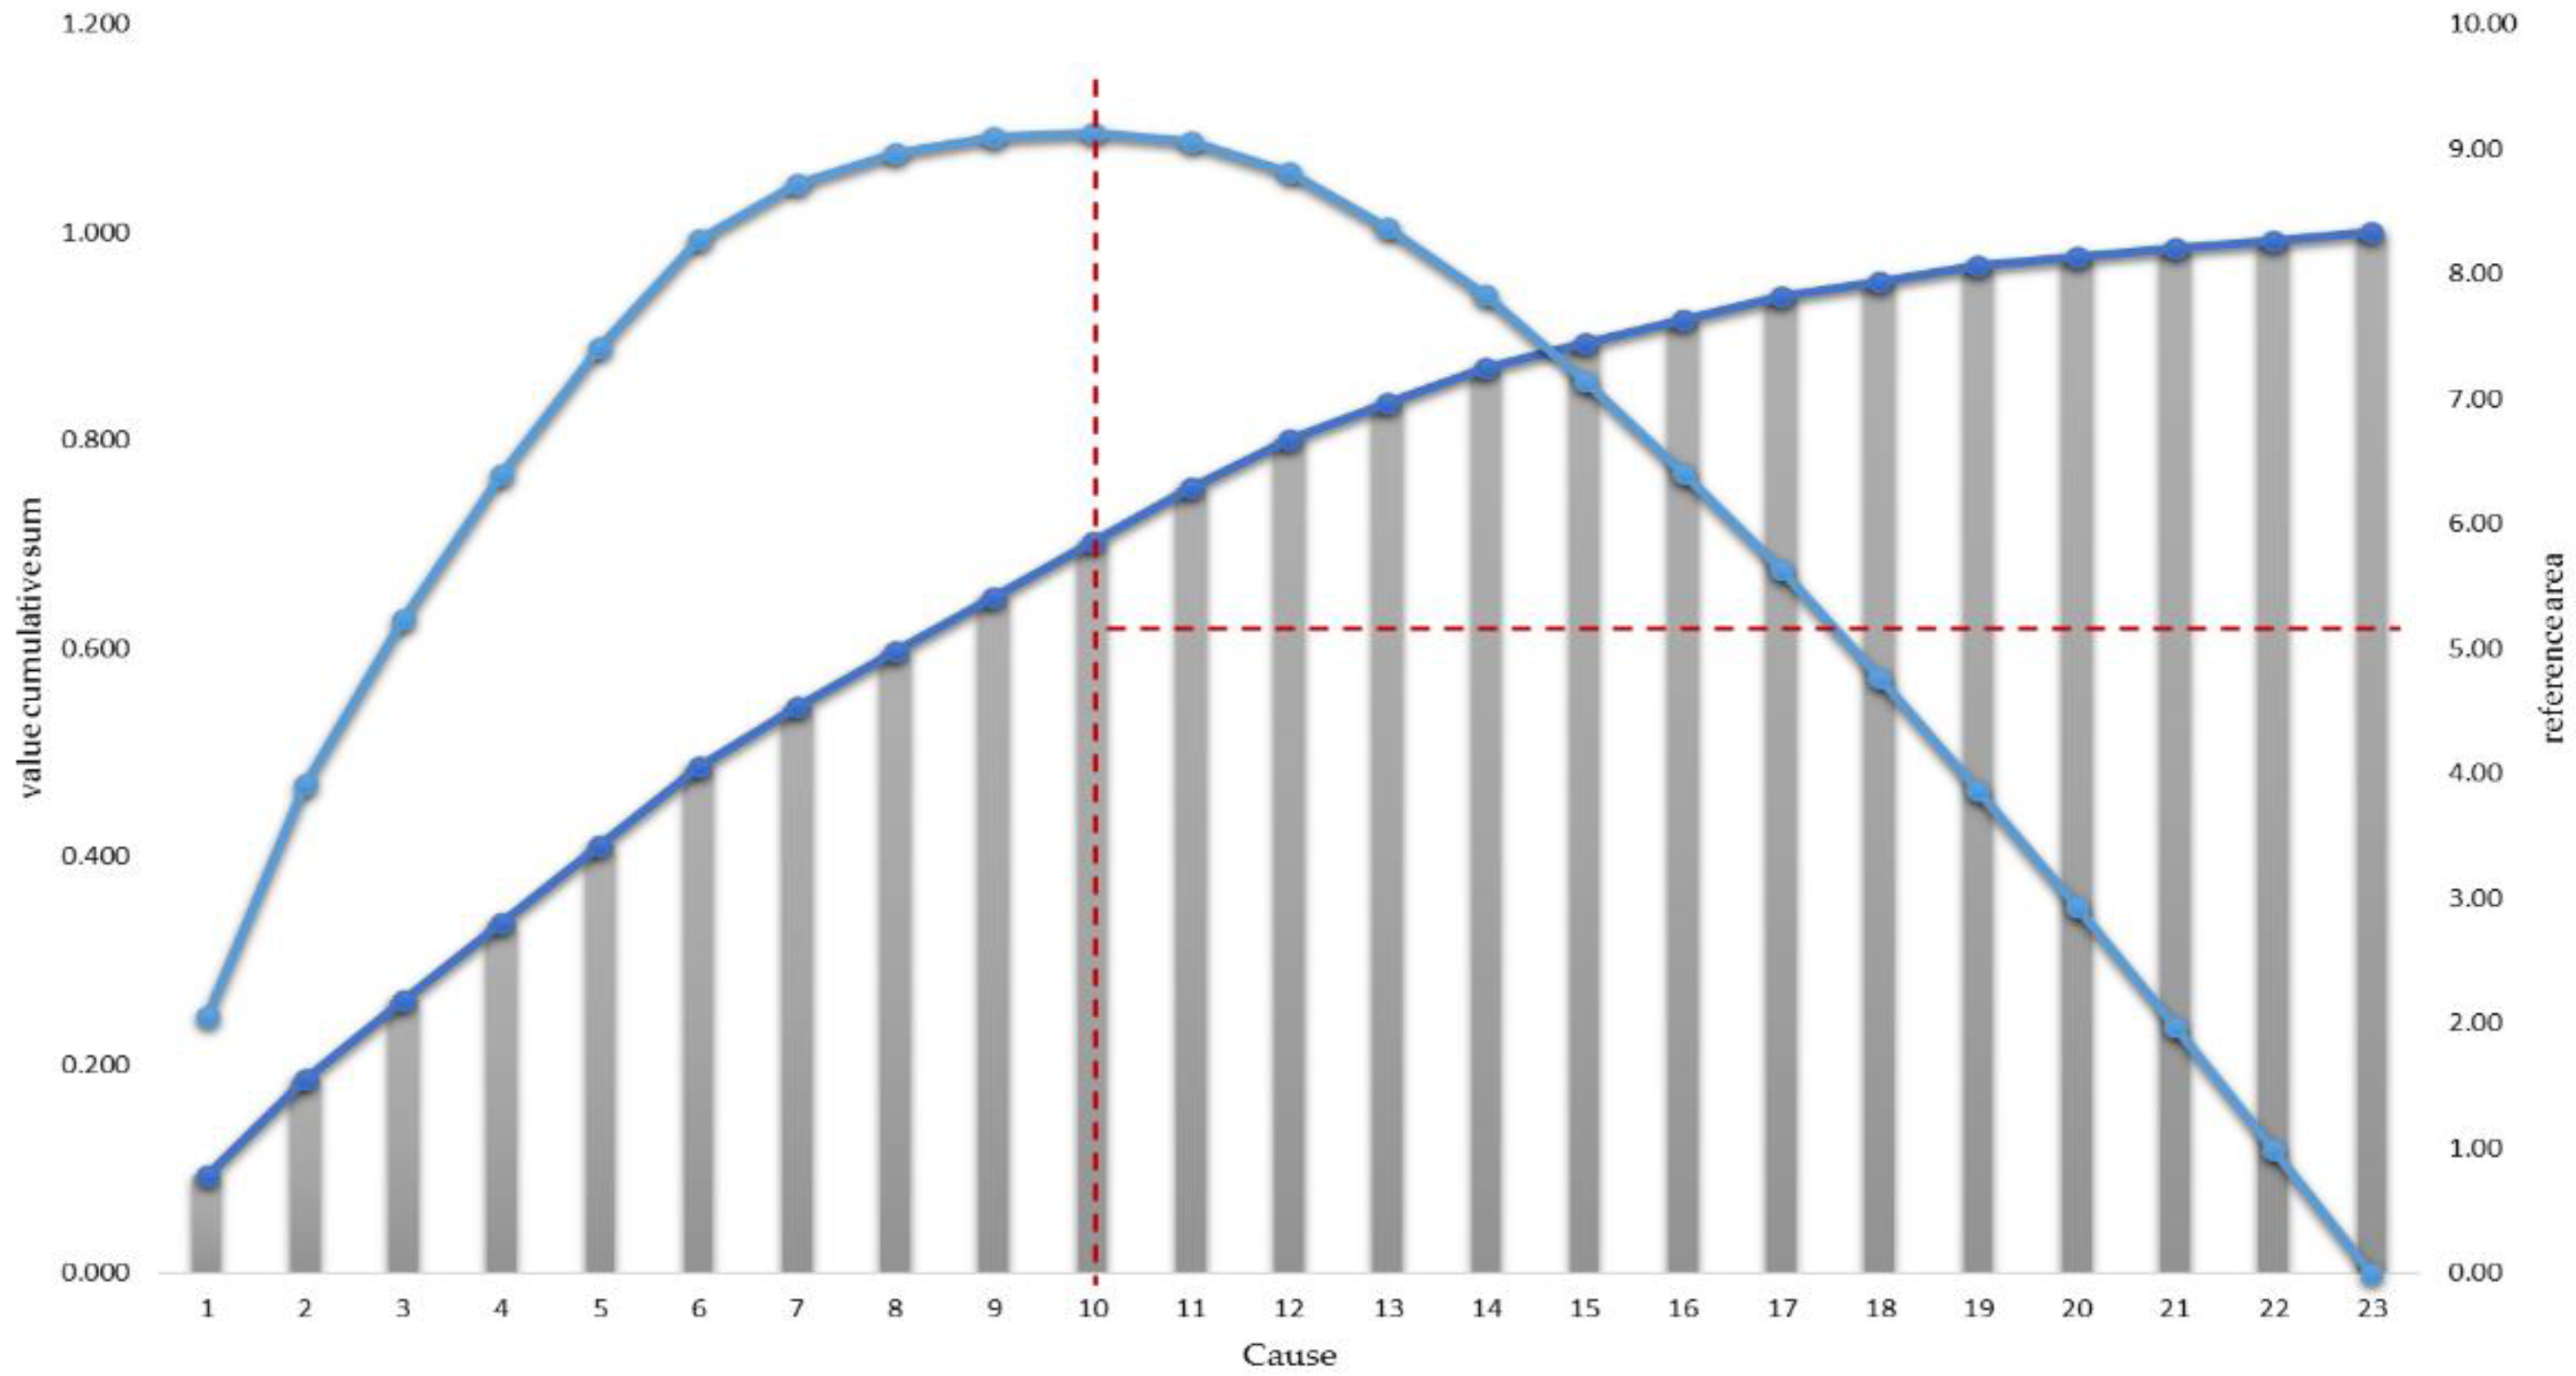
Due to the use of stratification analysis, which is based on the Pareto rule (80:20), the main areas and groups of phenomena were identified, where preventive measures should be introduced in the first place. The index of division of the most important factors is the reference area, that is, the area of the rectangle defined by a point on the Lorenz curve. Figure 10 shows the Lorenz curve and the curve of the reference field for each cause.
The results of the stratification analysis are presented in Table 5. Due to the same absolute weight of factor 10 and factor 11, the eleven most important factors requiring improvement were identified.
As a result, 11 main reasons inhibiting BIM implementation in the Polish construction sector were selected. In the People group, 3 reasons were identified: low level of knowledge about BIM technology, low level of awareness of the benefits of using BIM technology, and reluctance to change and implement new technologies. In the Finance group, 4 reasons were identified: low prices of construction documentation (projects, cost estimates), high software costs, high training costs for employees, and no financial support for companies (subsidies, etc.). The Method group contains 2 causes: no common procedures and standards of operation, and no legal regulations favoring BIM. There are two causes in the Management group too: poor cooperation between various entities and market participants, as well as lack of BIM technology specialists. In the Machinery category, no factor was identified as a significant barrier to the implementation of BIM technology. This is due to the wide range of software on the market that is constantly being improved.
With reference to the conducted studies of the literature, especially the works on broad analyses of barriers around the world, it should be noted that the selected 11 main reasons for the implementation of BIM in Poland are consistent with the main reasons for the implementation of BIM specified in other countries. The causes identified during the analysis, depending on the culture or wealth of a given country, are at a different level of significance of the problem of implementing BIM technology. Based on the analysis of barriers to BIM implementation in Poland, the following three main reasons can be identified:
- Low level of knowledge about BIM technology
- Low level of awareness of the benefits of using BIM technology
- Low prices of construction documentation (projects, cost estimates)
The two most important reasons concern the participants of the construction process, where they constitute the weakest link of the entire BIM technology implementation process. It should be noted that not only in Poland but also in other countries, the main problem of the low adaptation of new technologies in companies is the lack of knowledge and awareness of managers and employees of the construction sector. In Kazakhstan, the barrier “People” is listed first, as well as in Estonia, Nigeria, and Malaysia. Attention was drawn to the lack of experts in BIM technology, as well as to the lack of knowledge and awareness of the benefits that can be achieved by implementing BIM technology in the enterprise (Table 1).
The third very important factor blocking the implementation of BIM technology in Poland, included in the analysis conducted by the authors, is low prices of construction documentation (projects, cost estimates). For many small and medium-sized companies, the low cost of cost estimate documentation that they offer to clients does not cover the costs of implementing BIM technology, purchasing software, or employing specialists in this field. It should be noted that the group of 11 most important barriers to BIM implementations includes 4 factors from the Finance category. Companies are concerned about the high costs of investing in BIM technology, which results from the limited awareness of the benefits of using BIM technology.
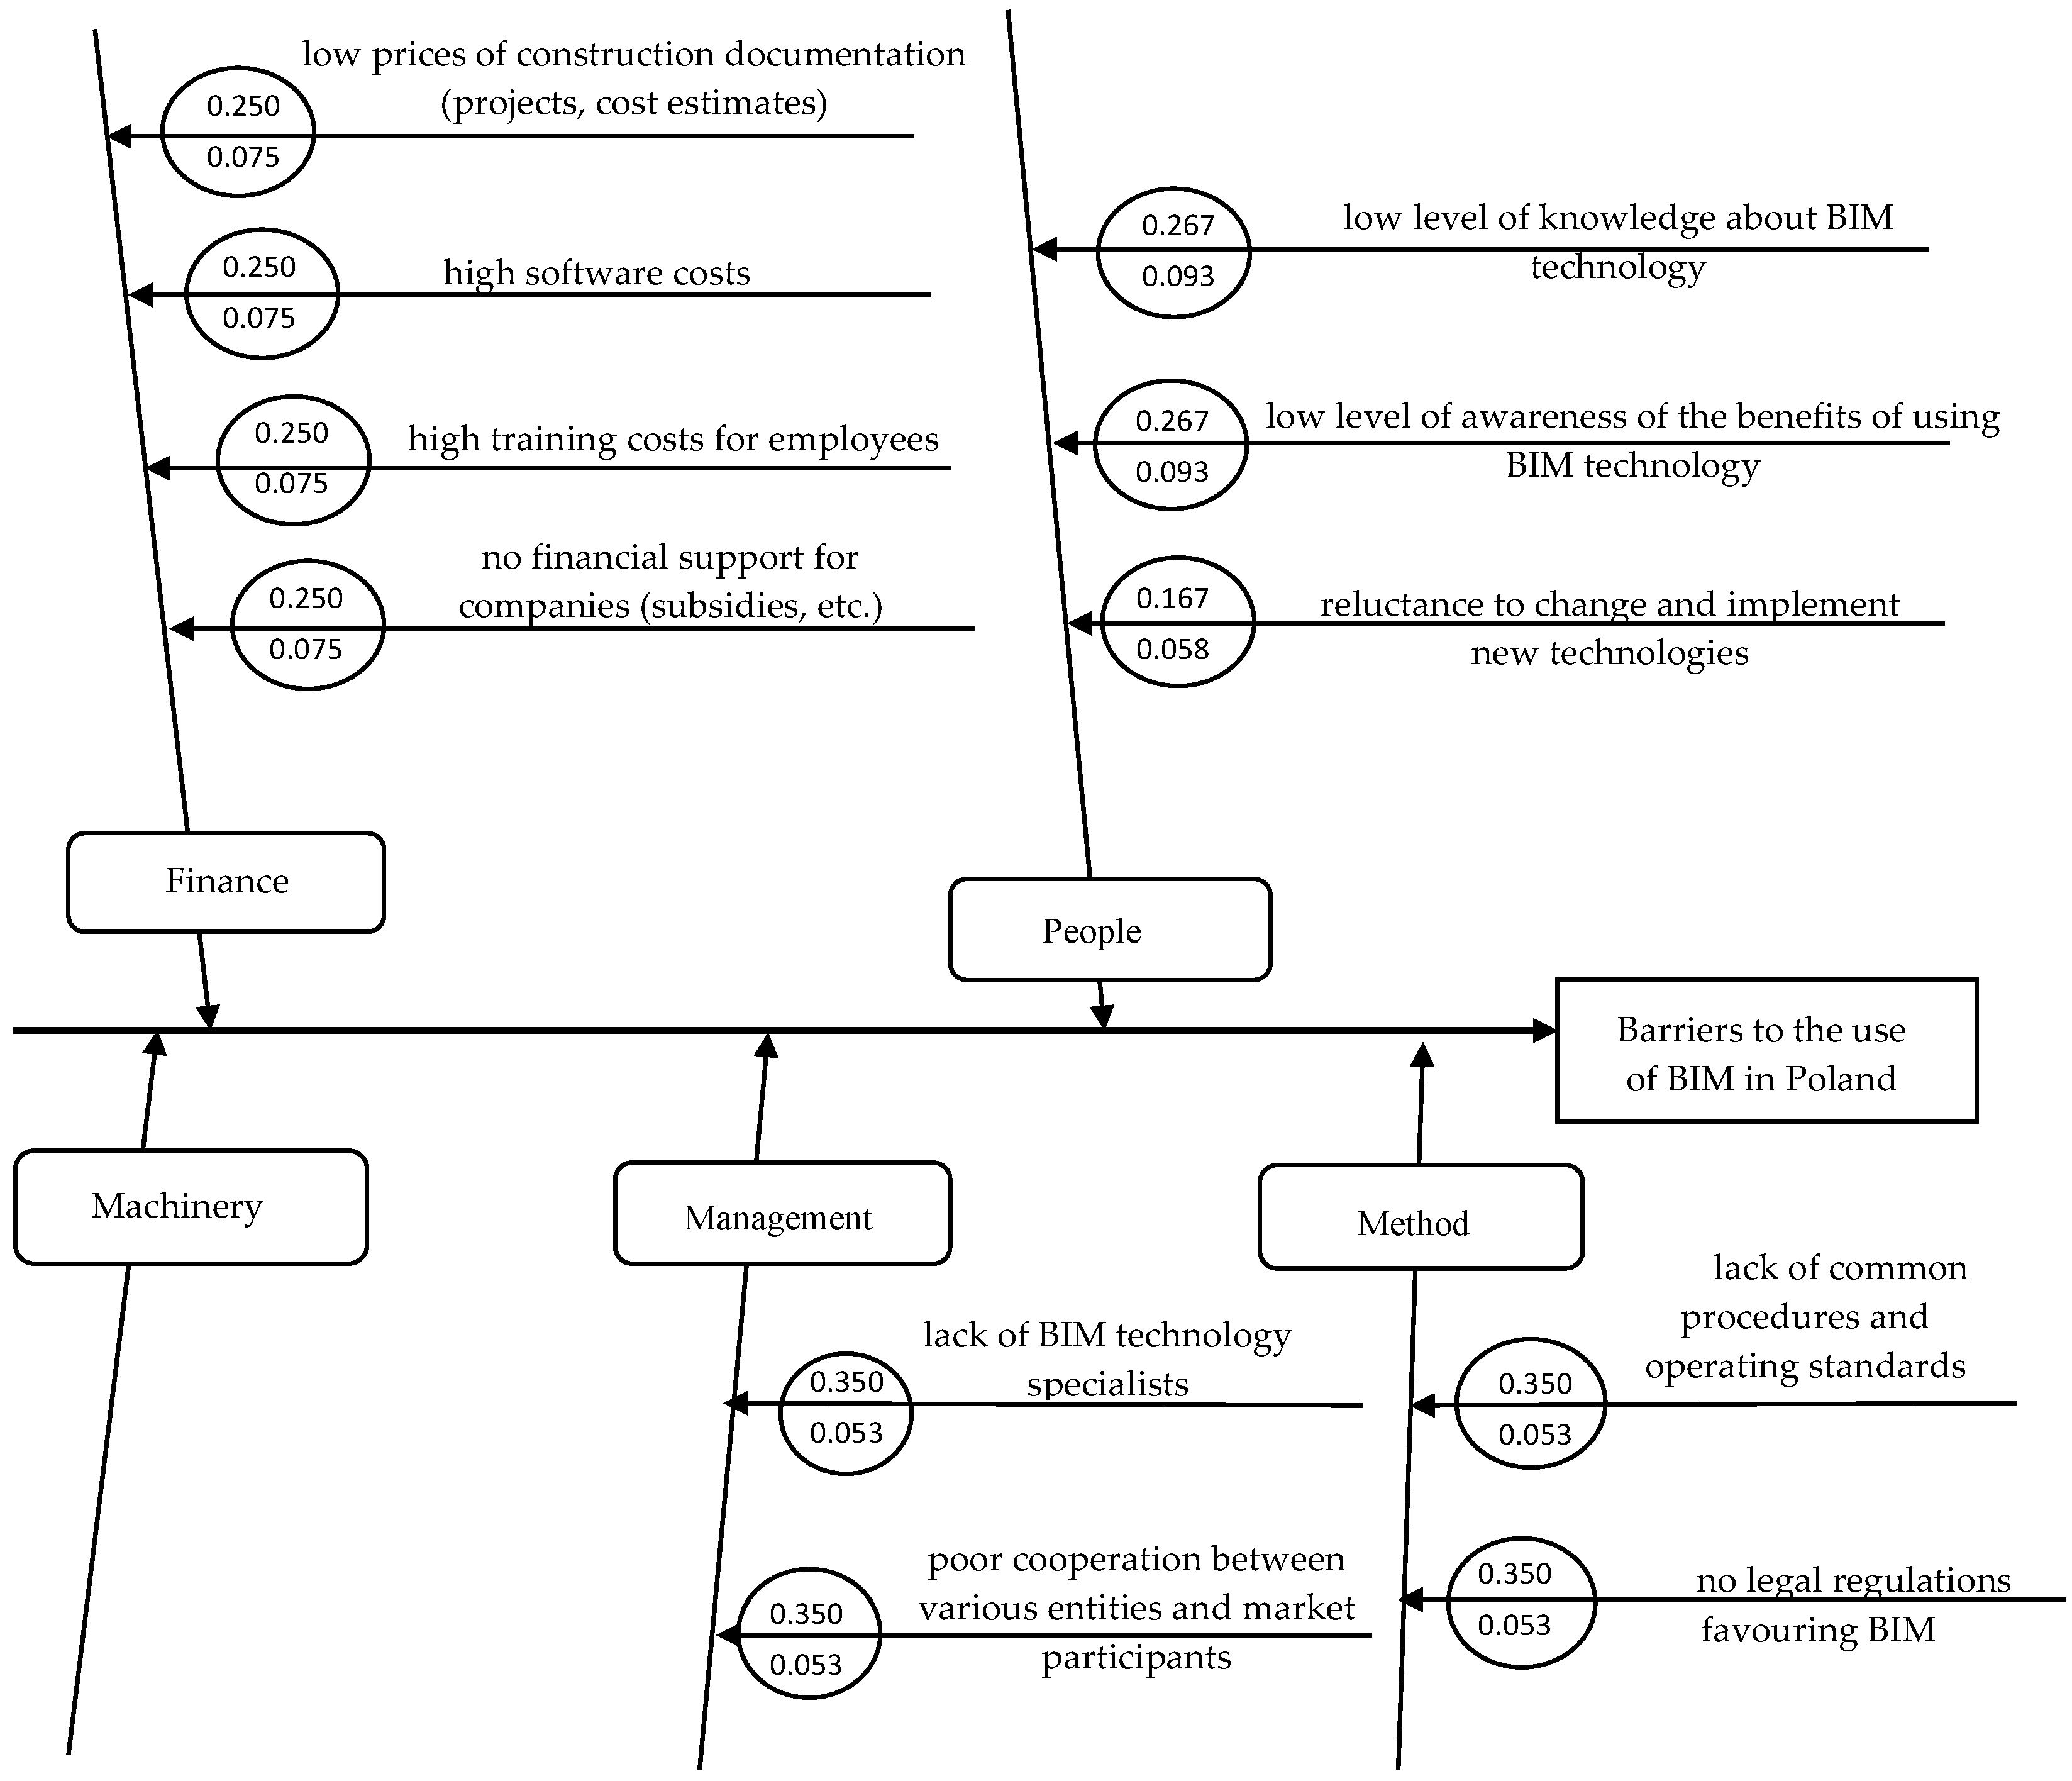
The final shape of the Ishikawa diagram is shown in Figure 11, which illustrates the main barriers and the most important reasons in the categories limiting the implementation of BIM technology to construction projects in Poland.
5. Conclusions
Eastern European countries, including Poland, are adopting BIM technology as the mainstream of building design and management at a slower pace. For this reason, the authors of the study made an attempt to identify and analyze the reasons for the slower implementation of BIM technology in construction projects in Poland. The undertaking of the research is justified by the previous publications, which draw attention to the fact that despite many recurring factors inhibiting the development of BIM technology in different countries, their importance hierarchy differs from region to region [35]. In order to distinguish the main areas where preventive actions should be introduced, the basic quality management tool, namely the Ishikawa diagram or the fishbone diagram, was applied. This tool illustrates the main phenomena and processes where the effectiveness of activities should be improved. After the study of literature, the findings of the previous reports and interviews with experts conducted by the authors, 5 main categories of factors inhibiting the development of BIM technology in Polish conditions were identified, namely: People, Finance, Method, Management, as well as Devices and Equipment. All five groups and related activities were analyzed in detail, and 23 factors that hinder the development of BIM in Poland were identified. In order to prioritize the significance of each of the reasons, they were given significance weights and a stratification analysis was performed on the basis of the Pareto rule.
The analysis shows that the weakest link in the success of the entire operation, which is the implementation and use of BIM technology in the construction process on a large scale, is people and their lack of knowledge and awareness and reluctance to change. That is why it is so important to introduce preventive measures through training, courses and studies focused on BIM technology in order to increase people’s knowledge and the quality of construction projects, and above all, to show the benefits that can be achieved by introducing BIM technology, especially to small and medium-sized construction companies. The next category limiting the introduction of BIM technology by companies are low prices of construction documentation, which do not cover the costs of expensive software, employee training, or remuneration of specialists in this field. Therefore, as a preventive measure, the appropriate solution would be financial aid, such as training grants, or loans for BIM hardware and software.
Author Contributions
Conceptualization, A.L. and M.G.; methodology, M.G.; validation, A.L. and M.G.; formal analysis, A.L.; M.G. and I.S.; investigation, A.L. and M.G.; resources M.G.; writing—original draft preparation A.L. and M.G.; writing—review and editing, A.L. and I.S.; visualization, A.L.; I.S. and M.G.; supervision, A.L.; project administration, A.L. All authors have read and agreed to the published version of the manuscript.
Funding
This research received no external funding.
Institutional Review Board Statement
Not applicable.
Informed Consent Statement
Not applicable.
Data Availability Statement
Data sharing is not applicable.
Conflicts of Interest
The authors declare no conflict of interest.
References
- Lee, S.; Ha, M. Customer interactive building information modeling for apartment unit design. Autom. Constr. 2013, 35, 424–430. [Google Scholar] [CrossRef]
- Isikdag, U.; Zlatanova, S. A SWOT analysis on the implementation of Building Information Models within the Geospatial Environment. In Urban and Regional Data Management; UDMS Annual 2009, Taylor & Francis Group; CRC Press: Wageningen, The Netherlands, 2009; pp. 15–30. [Google Scholar]
- US National Institute of Building Sciences. National Building Information Modelling Standard, Version 1—Part 1: Overview, Principles, and Methodologies; Glossary; National Institute of Building Sciences: Washington, DC, USA, 2007. [Google Scholar]
- Trach, R.; Pawluk, K.; Lendo-Siwicka, M. The assessment of the effect of BIM and IPD on construction projects in Ukraine. Int. J. Constr. Manag. 2020, 1, 1562–3599. [Google Scholar] [CrossRef]
- Zima, K.; Plebankiewicz, E.; Wieczorek, D. A SWOT Analysis of the Use of BIM Technology in the Polish Construction Industry. Buildings 2020, 10, 16. [Google Scholar] [CrossRef] [Green Version]
- Eastman, C.; Teicholz, P.; Sacks, R.; Liston, K. BIM Handbook A: A Guide to Building Information Modeling for Owners, Managers, Designers, Engineers, and Contractors; WILEY: Hoboken, NJ, USA, 2011. [Google Scholar]
- Frequently Asked Questions about the National BIM Standard-United States™. Available online: https://www.nationalbimstandard.org/faqs (accessed on 22 September 2020).
- Eastman, C. BIM Handbook: A Guide to Building Information Modeling for Owners, Managers, Designers, Engineers and Contractors; Wiley: Hoboken, NJ, USA, 2008. [Google Scholar]
- Jung, Y.; Joo, M. Building information modeling (BIM) framework for practical implementation. Autom. Constr. 2011, 20, 126–133. [Google Scholar] [CrossRef]
- Kim, H. Generating construction schedules through automatic data extraction using open BIM (building information modeling) technology. Autom. Constr. 2013, 35, 285–295. [Google Scholar] [CrossRef]
- Ding, L.; Zhou, Y.; Akinci, B. Building Information modeling (BIM) application framework: The process of expanding from 3D to computable. Autom. Constr. 2014, 46, 82–93. [Google Scholar] [CrossRef]
- Demian, P.; Walters, D. The advantages of information management through building information modeling. J. Constr. Manag. Econ. 2014, 32, 1153–1165. [Google Scholar] [CrossRef]
- Konior, J.; Szóstak, M. Methodology of Planning the Course of the Cumulative Cost Curve in Construction Projects. Sustainability 2020, 12, 2347. [Google Scholar] [CrossRef] [Green Version]
- Potrč Obrecht, T.; Röck, M.; Hoxha, E.; Passer, A. BIM and LCA Integration: A Systematic Literature Review. Sustainability 2020, 12, 5534. [Google Scholar]
- Mistretta, F.; Sanna, G.; Stochino, F.; Vacca, G. Structure from motion point clouds for structural monitoring. Remote Sens. 2019, 11, 1940. [Google Scholar] [CrossRef] [Green Version]
- Farzaneh, A.; Monfet, D.; Forgues, D. Review of using Building Information Modeling for building energy modeling during the design process. J. Build. Eng. 2019, 23, 127–135. [Google Scholar] [CrossRef]
- Ramaji, E.; Memari, A.M. Review of BIM’s application in energy simulation: Tools, issues, and solutions. Autom. Constr. 2019, 97, 164–180. [Google Scholar]
- Bonomolo, M.; Di Lisi, S.; Leone, G. Building Information Modelling and Energy Simulation for Architecture Design. Appl. Sci. 2021, 11, 2252. [Google Scholar]
- Bastos Porsani, G.; Del Valle de Lersundi, K.; Sánchez-Ostiz Gutiérrez, A.; Fernández Bandera, C. Interoperability between Building Information Modelling (BIM) and Building Energy Model (BEM). Appl. Sci. 2021, 11, 2167. [Google Scholar]
- Gómez Melgar, S.; Sánchez Cordero, A.; Videras Rodríguez, M.; Andújar Márquez, J.M. Matching Energy Consumption and Photovoltaic Production in a Retrofitted Dwelling in Subtropical Climate without a Backup System. Energies 2020, 13, 6026. [Google Scholar] [CrossRef]
- Jeong, W.; Yan, W.; Lee, C.J. Thermal Performance Visualization Using Object-Oriented Physical and Building Information Modeling. Appl. Sci. 2020, 10, 5888. [Google Scholar] [CrossRef]
- Bruno, N.; Roncella, R. HBIM for Conservation: A New Proposal for Information Modeling. Remote Sens. 2019, 11, 1751. [Google Scholar] [CrossRef] [Green Version]
- Sztubecki, J.; Mrówczyńska, M.; Bujarkiewicz, A. Proposition of determination of displacements using the TDRA 6000 laser station. E3S Web Conf. 2018, 55, 00011. [Google Scholar] [CrossRef]
- Tommasi, C.; Achille, C.; Fassi, F. From point cloud to BIM: A modelling challenge in the Cultural Heritage field. Int. Arch. Photogramm. Remote Sens. Spat. Inf. Sci. 2016, XLI-B5, 429–436. [Google Scholar]
- Giresini, L.; Stochino, F.; Sassu, M. Economic vs environmental isocost and isoperformance curves for the seismic and energy improvement of buildings considering Life Cycle Assessment. Eng. Struct. 2021, 233, 111923. [Google Scholar] [CrossRef]
- Akkurt, G.G.; Aste, N.; Borderon, J.; Buda, A.; Calzolari, M.; Chung, D.; Costanzo, V.; del Pero, C.; Evola, G.; Huerto-Cardenas, H.E.; et al. Dynamic thermal and hygrometric simulation of historical buildings: Critical factors and possible solutions. Renew. Sustain. Energy Rev. 2020, 118, 109509. [Google Scholar] [CrossRef]
- Ozturk, G.B. Identifying the advantages of BIM in structural design. Eurasian J. Civ. Eng. Archit. 2018, 2, 25–32. [Google Scholar]
- Shin, M.H.; Lee, H.K.; Kim, H.Y. Benefit–Cost Analysis of Building Information Modeling (BIM) in a Railway Site. Sustainability 2018, 10, 4303. [Google Scholar] [CrossRef] [Green Version]
- Sarvari, H.; Chan, D.W.M.; Rakhshanifar, M.; Banaitiene, N.; Banaitis, A. Evaluating the Impact of Building Information Modeling (BIM) on Mass House Building Projects. Buildings 2020, 10, 35. [Google Scholar] [CrossRef] [Green Version]
- McAuley, B.; Hore, A.; West, R. BICP Global BIM Study—Lessons for Ireland’s BIM Programme; Construction IT Alliance (CitA) Limited: New York, NY, USA, 2017. [Google Scholar]
- Ishikawa, K. What is Total Quality Control. In The Japanese Way; Prentice Hall: Englewood Cliffs, NJ, USA, 1985. [Google Scholar]
- Al-Ashmori, Y.Y.; Othman, I.; Rahmawati, Y. Bibliographic analysis of BIM Success Factors and Other BIM Literatures using Vosviewer: A Theoretical Mapping and Discussion. J. Phys. Conf. Ser. IOP Publ. 2020, 1529, 42105. [Google Scholar] [CrossRef]
- Hamma-adama, M.; Kouider, T.; Salman, H. Analysis of barriers and drivers for BIM adoption. Int. J. BIMa Eng. Sci. 2020, 3, 18–41. [Google Scholar]
- Oraee, M.; Hosseini, M.R.; Edwards, D.J.; Li, H.; Papadonikolaki, E.; Cao, D. Collaboration barriers in BIM-based construction networks: A conceptual model. Int. J. Proj. Manag. 2019, 37, 839–854. [Google Scholar] [CrossRef]
- Sardroud, J.M.; Mehdizadehtavasani, M.; Khorramabadi, A.; Ranjbardar, A. Barriers Analysis to Effective Implementation of BIM in the Construction Industry. In ISARC. Proceedings of the International Symposium on Automation and Robotics in Construction; IAARC Publications: Berlin, Germany, 2018; Volume 35, pp. 1–8. [Google Scholar]
- Mohammed, A.; Hasnain, S.A.; Quadir, A. Implementation of building information modelling (BIM) practices and challenges in construction industry in Qatar. J. Eng. Res. Rep. 2019, 9, 1–9. [Google Scholar] [CrossRef]
- Wong, S.Y.; Gray, J. Barriers to implementing Building Information Modelling (BIM) in the Malaysian construction industry. In IOP Conference Series: Materials Science and Engineering; IOP Publishing: Bristol, UK, 2019; Volume 495, p. 12002. [Google Scholar]
- Chan, D.W.; Olawumi, T.O.; Ho, A.M. Perceived benefits of and barriers to Building Information Modelling (BIM) implementation in construction: The case of Hong Kong. J. Build. Eng. 2019, 25, 100764. [Google Scholar] [CrossRef]
- Ullah, K.; Lill, I.; Witt, E. An overview of BIM adoption in the construction industry: Benefits and barriers. In Proceedings of the 10th Nordic Conference on Construction Economics and Organization, Tallinn, Estonia, 7–8 May 2019; Volume 10, p. 7250. [Google Scholar]
- Elagiry, M.; Marino, V.; Lasarte, N.; Elguezabal, P.; Messervey, T. BIM4Ren: Barriers to BIM implementation in renovation processes in the Italian market. Buildings 2019, 9, 200. [Google Scholar] [CrossRef] [Green Version]
- Olanrewaju, O.I.; Chileshe, N.; Babarinde, S.A.; Sandanayake, M. Investigating the barriers to building information modeling (BIM) implementation within the Nigerian construction industry. Eng. Constr. Archit. Manag. 2020, 27, 2931–2958. [Google Scholar] [CrossRef]
- Aitbayeva, D.; Hossain, M.A. Building Information Model (BIM) Implementation in Perspective of Kazakhstan: Opportunities and Barriers. J. Eng. Res. Rep. 2020, 14, 13–24. [Google Scholar] [CrossRef]
- Mahdi, M.M.; Mawlood, D.K. Challenges Facing the Implementation of Building Information Modeling (BIM) Techniques in Iraq. Zanco J. Pure Appl. Sci. 2020, 32, 48–57. [Google Scholar]
- Farooq, U.; Rehman, S.K.U.; Javed, M.F.; Jameel, M.; Aslam, F.; Alyousef, R. Investigating BIM Implementation Barriers and Issues in Pakistan Using ISM Approach. Appl. Sci. 2020, 10, 7250. [Google Scholar] [CrossRef]
- Wu, P.; Jin, R.; Xu, Y.; Lin, F.; Dong, Y.; Pan, Z. The analysis of barriers to BIM implementation for industrialized building construction: A China study. J. Civ. Eng. Manag. 2020, 27, 1–13. [Google Scholar] [CrossRef]
- Mignone, G.; Hosseini, M.R.; Chileshe, N.; Arashpour, M. Enhancing collaboration in BIM-based construction networks through organisational discontinuity theory: A case study of the new Royal Adelaide Hospital. Archit. Eng. Des. Manag. 2016, 12, 333–352. [Google Scholar] [CrossRef]
- Kaewunruen, S.; Sresakoolchai, J.; Zhou, Z. Sustainability-based lifecycle management for bridge infrastructure using 6d Bim. Sustainability 2020, 12, 2436. [Google Scholar] [CrossRef] [Green Version]
- Biolek, V.; Hanak, T.; Hanak, M. Proposed interconnecting database for BIM models and construction-economic systems in the Czech Republic. In IOP Conference Series: Materials Science and Engineering; IOP Publishing: Bristol, UK, 2019; Volume 471, p. 112079. [Google Scholar]
- Xu, X.; Mumford, T.; Zou, P.X. Life-cycle building information modelling (BIM) engaged framework for improving building energy performance. Energy Build. 2020, 231, 110496. [Google Scholar] [CrossRef]
- Mesaros, P.; Spisakova, M.; Mandicak, T. Analysing the implementation motivations of BIM Technology in Construction Project Management. In IOP Conference Series: Materials Science and Engineering; IOP Publishing: Bristol, UK, 2020; Volume 960, p. 042064. [Google Scholar]
- Hamidavi, T.; Abrishami, S.; Hosseini, M.R. Towards intelligent structural design of buildings: A BIM-based solution. J. Build. Eng. 2020, 32, 101685. [Google Scholar] [CrossRef]
- Czmoch, I.; Pękala, A. Traditional design versus BIM based design. Procedia Eng. 2014, 91, 210–215. [Google Scholar] [CrossRef]
- Nassery, F.A.R.I.D. BIM Technology in Preservation of Historical City Buildings. Tradit. Herit. Contemp. Image City 2014, 3, 57–64. [Google Scholar]
- Plebankiewicz, E.; Zima, K.; Skibniewski, M. Analysis of the first Polish BIM-Based cost estimation application. Procedia Eng. 2015, 123, 405–414. [Google Scholar] [CrossRef] [Green Version]
- Bonenberg, W.; Wei, X. Green BIM in sustainable infrastructure. Procedia Manuf. 2015, 3, 1654–1659. [Google Scholar] [CrossRef] [Green Version]
- Bartoszek, M.; Juszczyk, M. Selected problems of bim-based planning of construction works–case study. Tech. Trans. 2015, 4, 71–79. [Google Scholar]
- Valinejadshoubi, M.; Bagchi, A.; Moselhi, O. Development of a BIM-based data management system for structural health monitoring with application to modular buildings: Case study. J. Comput. Civ. Eng. 2019, 33, 05019003. [Google Scholar] [CrossRef]
- Jasiński, A. Impact of BIM implementation on architectural practice. Archit. Eng. Des. Manag. 2020, 1–11, 1745–2007. [Google Scholar]
- Ratajczak, J.; Riedl, M.; Matt, D.T. BIM-based and AR application combined with location-based management system for the improvement of the construction performance. Buildings 2019, 9, 118. [Google Scholar] [CrossRef] [Green Version]
- BIM Polish Perspective, Autodesk Report—2015. Available online: https://damassets.autodesk.net/content/dam/autodesk/www/campaigns/bim-event/BIM_raport_final.pdf (accessed on 20 September 2020).
- BIM, Collaboration, Cloud in Polish Construction, Autodesk Report—2019. Available online: https://www.autodesk.pl/campaigns/aec/bim-report-2019#form-section (accessed on 20 September 2020).
- Wong, K.C.; Woo, K.Z.; Woo, K.H. Ishikawa Diagram. In Quality Improvement in Behavioral Health; Springer: Cham, Switzerland, 2016; pp. 119–132. [Google Scholar]
- Ishikawa, K.; Loftus, J.H. Introduction to Quality Control; 3A Corporation: Tokyo, Japan, 1990. [Google Scholar]
- Doggett, A.M. Root Cause Analysis: A Framework for Tool Selection. Qual. Manag. J. 2005, 12, 4. [Google Scholar] [CrossRef]
- Aichouni, M. On the Use of the Basic Quality Tools for the Improvement of the Construction Industry: A Case Study of a Ready Mixed Concrete Production Process. Int. J. Civ. Environ. Eng. 2012, 12, 28–35. [Google Scholar]
- Alaa, A.S.; Pasławski, J.; Nowotarski, P. Quality Management to continuous improvements in process of Ready Mix Concrete production. In IOP Conference Series: Materials Science and Engineering; IOP Publishing: Bristol, UK, 2019; Volume 518, p. 022019. [Google Scholar]
- Topchiy, D.; Bolotova, A.; Vorobev, A.; Atamanenko, A. Reprofiling of objects with monolithic reinforced concrete frame. IOP Conf. Ser. Mater. Sci. Eng. 2020, 890, 012137. [Google Scholar] [CrossRef]
- Hoła, B.; Nowobilski, T.; Szer, I.; Szer, J. Identification of factors affecting the accident rate in the construction industry. Procedia Eng. 2017, 208, 35–42. [Google Scholar] [CrossRef]
- Gündüz, M.; Nielsen, Y.; Özdemir, M. Quantification of delay factors using the relative importance index method for construction projects in Turkey. J. Manag. Eng. 2013, 29, 133–139. [Google Scholar] [CrossRef]
- Parchami Jalal, M.; Noorzai, E.; Yavari Roushan, T. Root cause analysis of the most frequent claims in the building industry through the SCoP3E Ishikawa diagram. J. Leg. Aff. Disput. Resolut. Eng. Constr. 2019, 11, 04519004. [Google Scholar] [CrossRef]
- Joshi, A.; Kale, S.; Chandel, S.; Pal, D.K. Likert scale: Explored and explained. Curr. J. Appl. Sci. Technol. 2015, 3, 96–403. [Google Scholar] [CrossRef]
- Boone, H.N.; Boone, D.A. Analyzing likert data. J. Ext. 2012, 50, 1–5. [Google Scholar]
- Czerwiński, K. Methodological aspects of evaluation of evaluation as a resultant value. In Social Communication and Values in Education. New Meanings and Situations; Maliszewski, W., Ed.; Adam Marszalek Publisher: Toruń, Poland, 2007. [Google Scholar]
- Wiśniewska, M.; Jasiak-Kujawska, A. Analysis of the causes of medical infections using a weighted Ishikawa diagram. Zarządzanie I Finans. 2012, 10, 328–343. [Google Scholar]
Figure 1.
Research flow.

Figure 2.
Outline of the Ishikawa diagram. Own study based on [63].
Figure 2.
Outline of the Ishikawa diagram. Own study based on [63].

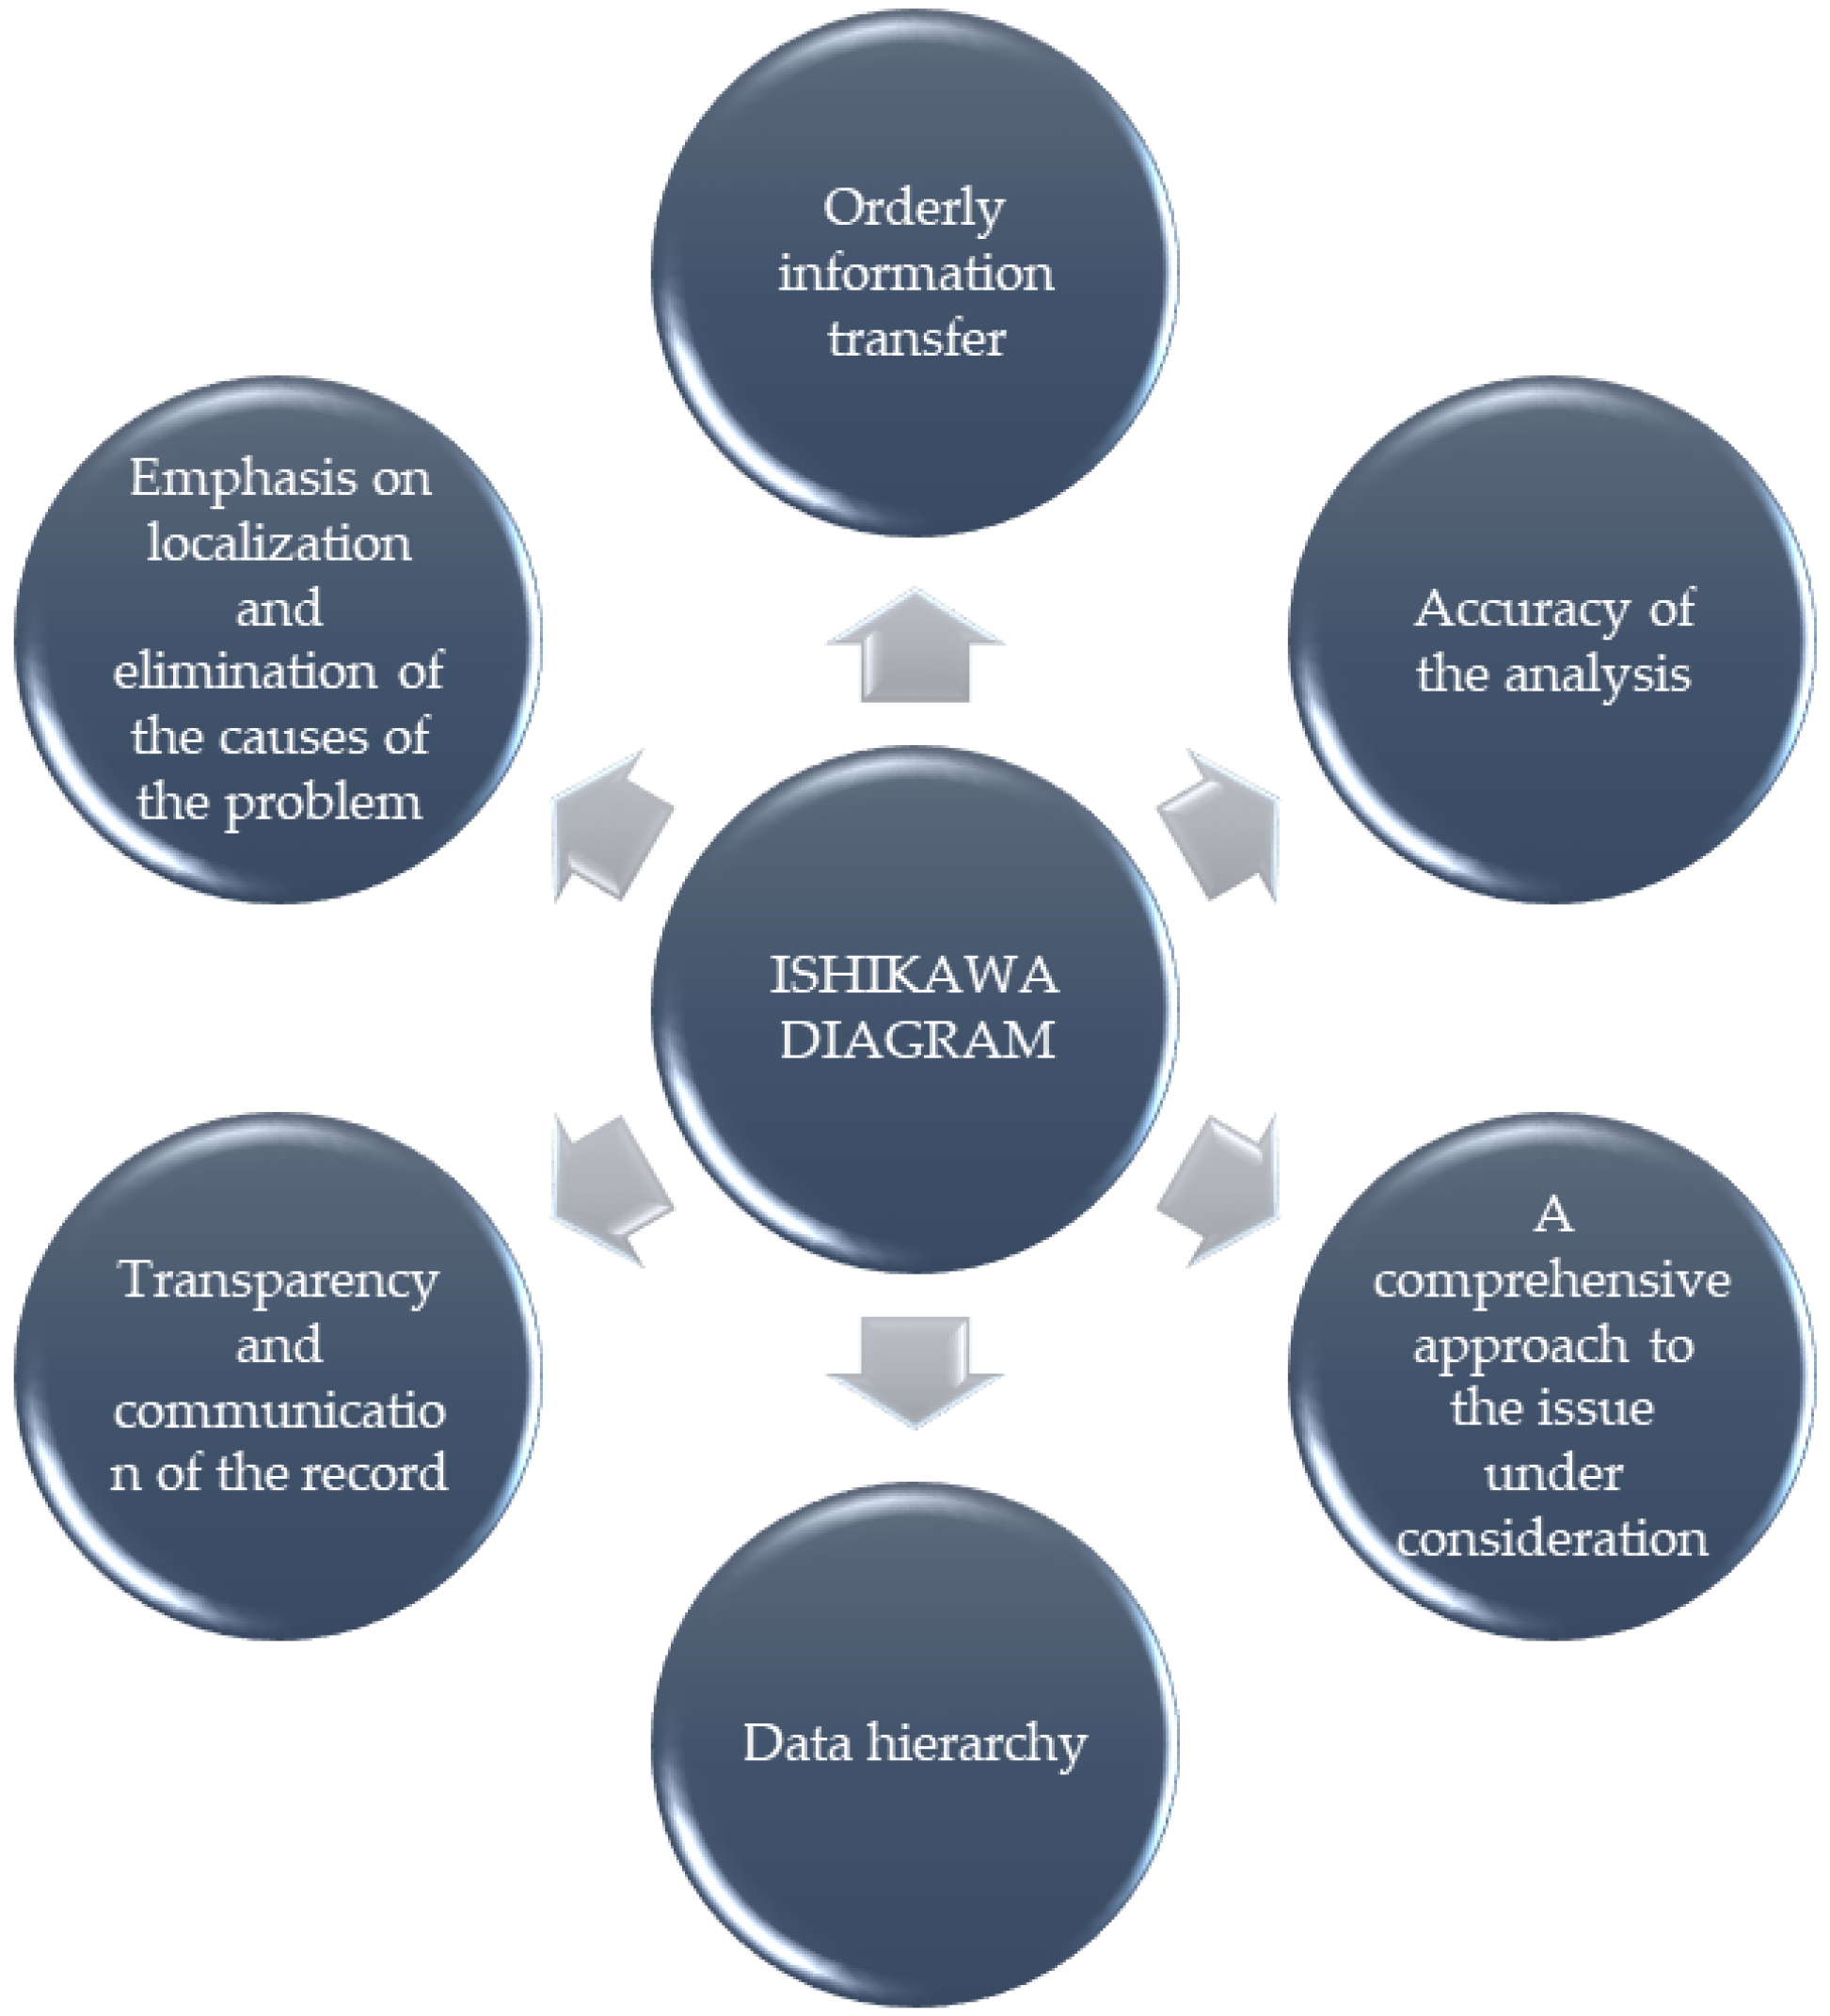
Figure 3.
Features of the Ishikawa diagram. Own study based on [62].
Figure 3.
Features of the Ishikawa diagram. Own study based on [62].

Figure 4.
Sample 5M structure layout [59].
Figure 4.
Sample 5M structure layout [59].

Figure 5.
Reasons for the poor implementation of BIM in Poland (a) in the People category; (b) in the Finance category.
Figure 5.
Reasons for the poor implementation of BIM in Poland (a) in the People category; (b) in the Finance category.

Figure 6.
The reasons for the poor implementation of BIM in Poland (a) in the Method category; (b) in the Management category.
Figure 6.
The reasons for the poor implementation of BIM in Poland (a) in the Method category; (b) in the Management category.

Figure 7.
The reasons for the poor implementation of BIM in Poland in the Machinery category.

Figure 8.
Ishikawa diagram—significance weights of the main categories of barriers to the use of BIM in Poland.
Figure 8.
Ishikawa diagram—significance weights of the main categories of barriers to the use of BIM in Poland.

Figure 9.
Ishikawa diagram: barriers to applying BIM in Poland.

Figure 10.
Graph of the Lorenz curve and the curve of the reference area.

Figure 11.
Ishikawa diagram: barriers to the application of BIM in Poland.


Table 1.
The three most important barriers to BIM implementation identified in selected countries (2019–2021).
Table 1.
The three most important barriers to BIM implementation identified in selected countries (2019–2021).
| Country | Year of Publication | Source/Author | The 3 Most Important Barriers Identified |
|---|---|---|---|
| Qatar | 2019 | Mohammed, A., Hasnain, S.A.; Quadir, A [36] |
|
| Malaysia | 2019 | Wong, S.Y.; Gray, J. [37] |
|
| Hong Kong | 2019 | Chan, D.W.; Olawumi, T.O.; Ho, A.M. [38] |
|
| Estonia | 2019 | Ullah, K.; Lill, I.; Witt, E. [39] |
|
| Italy | 2019 | Elagiry, M.; Marino, V.; Lasarte, N.; Elguezabal, P.; Messervey, T. [40] |
|
| Nigeria | 2020 | Olanrewaju, O.I.; Chileshe, N.; Babarinde, S.A.; Sandanayake, M. [41] |
|
| Kazakhstan | 2020 | Aitbayeva, D.; Hossain, M.A. [42] |
|
| Iraq | 2020 | Mahdi, M.M.; Mawlood, D.K. [43] |
|
| Pakistan | 2020 | Farooq, U; Rehman, S.K.U.; Javed, M.F.; Jameel, M.; Aslam. F.; Alyousef, R.; [44] |
|
| China | 2021 | Wu, P.; Jin, R.; Xu, Y.; Lin, F.; Dong, Y.; Pan, Z. [45] |
|
Table 2.
Significance weights of the main categories.
| People | Finance | Method | Management | Machinery | Relative Weight | |
|---|---|---|---|---|---|---|
| People | x | 0.5 | 1 | 1 | 1 | 0.35 |
| Finance | 0.5 | x | 1 | 1 | 0.5 | 0.30 |
| Method | 0 | 0 | x | 0.5 | 1 | 0.15 |
| Management | 0 | 0 | 0.5 | x | 1 | 0.15 |
| Machinery | 0 | 0.5 | 0 | 0 | x | 0.05 |
Table 3.
Factor significance weights (description of symbols of subsequent factors).
| Main Category | Symbol | A | B | C | D | E | F |
|---|---|---|---|---|---|---|---|
| People | A | x | 0.5 | 0.5 | 1 | 1 | 1 |
| B | 0.5 | x | 0.5 | 1 | 1 | 1 | |
| C | 0.5 | 0.5 | x | 0.5 | 0.5 | 0.5 | |
| D | 0 | 0 | 0.5 | x | 1 | 0.5 | |
| E | 0 | 0 | 0.5 | 0 | x | 0.5 | |
| F | 0 | 0 | 0.5 | 0.5 | 0.5 | x | |
| Finance | G | H | I | J | |||
| G | x | 0.5 | 0.5 | 0.5 | |||
| H | 0.5 | x | 0.5 | 0.5 | |||
| I | 0.5 | 0.5 | x | 0.5 | |||
| J | 0.5 | 0.5 | 0.5 | x | |||
| Method | K | L | M | N | O | ||
| K | x | 1 | 1 | 1 | 0.5 | ||
| L | 0 | x | 0.5 | 1 | 0 | ||
| M | 0 | 0.5 | x | 0.5 | 0 | ||
| N | 0 | 0 | 0.5 | x | 0 | ||
| O | 0.5 | 1 | 1 | 1 | x | ||
| Management | P | R | S | T | U | ||
| P | x | 0.5 | 1 | 1 | 1 | ||
| R | 0.5 | x | 1 | 1 | 1 | ||
| S | 0 | 0 | x | 0.5 | 1 | ||
| T | 0 | 0 | 0.5 | x | 0.5 | ||
| U | 0 | 0 | 0 | 0.5 | x | ||
| Machinery | W | X | Y | ||||
| W | x | 0 | 0.5 | ||||
| X | 1 | x | 1 | ||||
| Y | 0.5 | 0 | x | ||||
Table 4.
Factor relative and absolute weights of significance.
| Main Category | Symbol | Cause | Relative Weight | Absolute Weight |
|---|---|---|---|---|
| People | A | low level of knowledge about BIM technology | 0.267 | 0.093 |
| B | low level of awareness of the benefits of using BIM technology | 0.267 | 0.093 | |
| C | reluctance to change and implement new technologies | 0.167 | 0.058 | |
| D | entrepreneurs’ fear of high risk of investing in BIM | 0.133 | 0.047 | |
| E | employees’ lack of willingness to improve their qualifications in the BIM standard | 0.067 | 0.023 | |
| F | preferences of standard solutions among participants of a construction project | 0.100 | 0.035 | |
| Finance | G | low prices of construction documentation (projects, cost estimates) | 0.250 | 0.075 |
| H | high software costs | 0.250 | 0.075 | |
| I | high training costs for employees | 0.250 | 0.075 | |
| J | no financial support for companies (subsidies, etc.) | 0.250 | 0.075 | |
| Method | K | lack of common procedures and operating standards | 0.350 | 0.053 |
| L | labour intensity of project development based on BIM technology | 0.150 | 0.023 | |
| M | too much detail in BIM studies, useless at the early design stage | 0.100 | 0.015 | |
| N | mistakes in creating BIM projects | 0.050 | 0.008 | |
| O | no legal regulations favoring BIM | 0.350 | 0.053 | |
| Management | P | lack of BIM technology specialists | 0.350 | 0.053 |
| R | poor cooperation between various entities and market participants | 0.350 | 0.053 | |
| S | lack of employers’ acceptance of increasing remuneration costs for BIM specialists as an additional workload | 0.150 | 0.023 | |
| T | insufficient commitment of senior management | 0.100 | 0.015 | |
| U | reluctance of officials to change and progress | 0.050 | 0.008 | |
| Machinery | W | outdated infrastructure in enterprises (computer hardware) | 0.167 | 0.008 |
| X | no universal software platform | 0.667 | 0.033 | |
| Y | some software only in English | 0.167 | 0.008 |
Table 5.
Stratification analysis: the most important reasons for the lack of implementation of BIM technology in Poland.
Table 5.
Stratification analysis: the most important reasons for the lack of implementation of BIM technology in Poland.
| No. | Cause | Absolute Weight | Cumulative Sum | Reference Area |
|---|---|---|---|---|
| 1 | People—low level of knowledge about BIM technology | 0.093 | 0.093 | 2.053 |
| 2 | People—low level of awareness of the benefits of using BIM technology | 0.093 | 0.187 | 3.920 |
| 3 | Finance—low prices of construction documentation (projects, cost estimates) | 0.075 | 0.262 | 5.233 |
| 4 | Finance—high software costs | 0.075 | 0.337 | 6.397 |
| 5 | Finance—high training costs for employees | 0.075 | 0.412 | 7.410 |
| 6 | Finance—no financial support for companies (subsidies, etc.) | 0.075 | 0.487 | 8.273 |
| 7 | People—reluctance to change and implement new technologies | 0.058 | 0.545 | 8.720 |
| 8 | Method—lack of common procedures and operating standards | 0.053 | 0.598 | 8.963 |
| 9 | Method—no legal regulations favouring BIM | 0.053 | 0.650 | 9.100 |
| 10 | Management—lack of BIM technology specialists | 0.053 | 0.703 | 9.133 |
| 11 | Management—poor cooperation between various entities and market participants | 0.053 | 0.755 | 9.060 |
| 12 | entrepreneurs’ fear of high risk of investing in BIM | 0.047 | 0.802 | 8.818 |
| 13 | preferences of standard solutions among participants of a construction project | 0.035 | 0.837 | 8.367 |
| 14 | no universal software platform | 0.033 | 0.870 | 7.830 |
| 15 | employees’ lack of willingness to improve their qualifications in the BIM standard | 0.023 | 0.893 | 7.147 |
| 16 | labor intensity of project development based on BIM technology | 0.023 | 0.916 | 6.411 |
| 17 | lack of employers’ acceptance of increasing remuneration costs for BIM specialists as an additional workload | 0.023 | 0.938 | 5.630 |
| 18 | too much detail in BIM studies, useless at the early design stage | 0.015 | 0.953 | 4.767 |
| 19 | insufficient commitment of senior management | 0.015 | 0.968 | 3.873 |
| 20 | outdated infrastructure in enterprises (computer hardware) | 0.008 | 0.977 | 2.930 |
| 21 | some software only in English | 0.008 | 0.985 | 1.970 |
| 22 | mistakes in creating BIM projects | 0.008 | 0.993 | 0.993 |
| 23 | reluctance of officials to change and progress | 0.008 | 1.000 | 0.000 |
Publisher’s Note: MDPI stays neutral with regard to jurisdictional claims in published maps and institutional affiliations. |
© 2021 by the authors. Licensee MDPI, Basel, Switzerland. This article is an open access article distributed under the terms and conditions of the Creative Commons Attribution (CC BY) license (https://creativecommons.org/licenses/by/4.0/).
Share and Cite
MDPI and ACS Style
Leśniak, A.; Górka, M.; Skrzypczak, I. Barriers to BIM Implementation in Architecture, Construction, and Engineering Projects—The Polish Study. Energies 2021, 14, 2090. https://doi.org/10.3390/en14082090
AMA Style
Leśniak A, Górka M, Skrzypczak I. Barriers to BIM Implementation in Architecture, Construction, and Engineering Projects—The Polish Study. Energies. 2021; 14(8):2090. https://doi.org/10.3390/en14082090
Chicago/Turabian StyleLeśniak, Agnieszka, Monika Górka, and Izabela Skrzypczak. 2021. "Barriers to BIM Implementation in Architecture, Construction, and Engineering Projects—The Polish Study" Energies 14, no. 8: 2090. https://doi.org/10.3390/en14082090
Note that from the first issue of 2016, this journal uses article numbers instead of page numbers. See further details here.