1. Introduction
Traditionally, the planning for distribution networks has been strongly based on long-term demand forecasting and the network development timing [
1,
2]. Nowadays, such a decision-making process must be constantly adapted to consider new energy and environmental policies, rules of the electric market, transmission system planning, new technologies, and consumers’ energy efficiency free initiatives (efficient network access). The distribution network planning should also be capable of assessing the impact of plausible catastrophic events [
3] or the planned interconnection links with other energy systems using, for example, HVDC links [
4], and even evaluating the presence of microgrids connected to the grid (AC and hybrid AC/DC microgrids) [
5]. Therefore, it is getting increasingly important to develop adequate planning tools capable of giving the appropriate answer to such changes in legal, regulatory, and economic conditions. In this sense, the information and data available today in smart grids may play a key role.
Smart grids are basically electrical distribution networks that integrate information and communication technologies (ICTs), such as smart sensors, advanced measurement infrastructures and monitoring systems. Incorporating these ICTs allows the use of new information in all decision-making processes, including those associated with the planning of the distribution network, with the ultimate goal of improving, digitizing and accelerating them [
6]. Consequently, the deployment of smart grids entails a more efficient and intensive use of existing networks, better control of the management of their capacity as a system thanks to greater visibility of its components, connected energy resources and flexibility to access it [
7,
8].
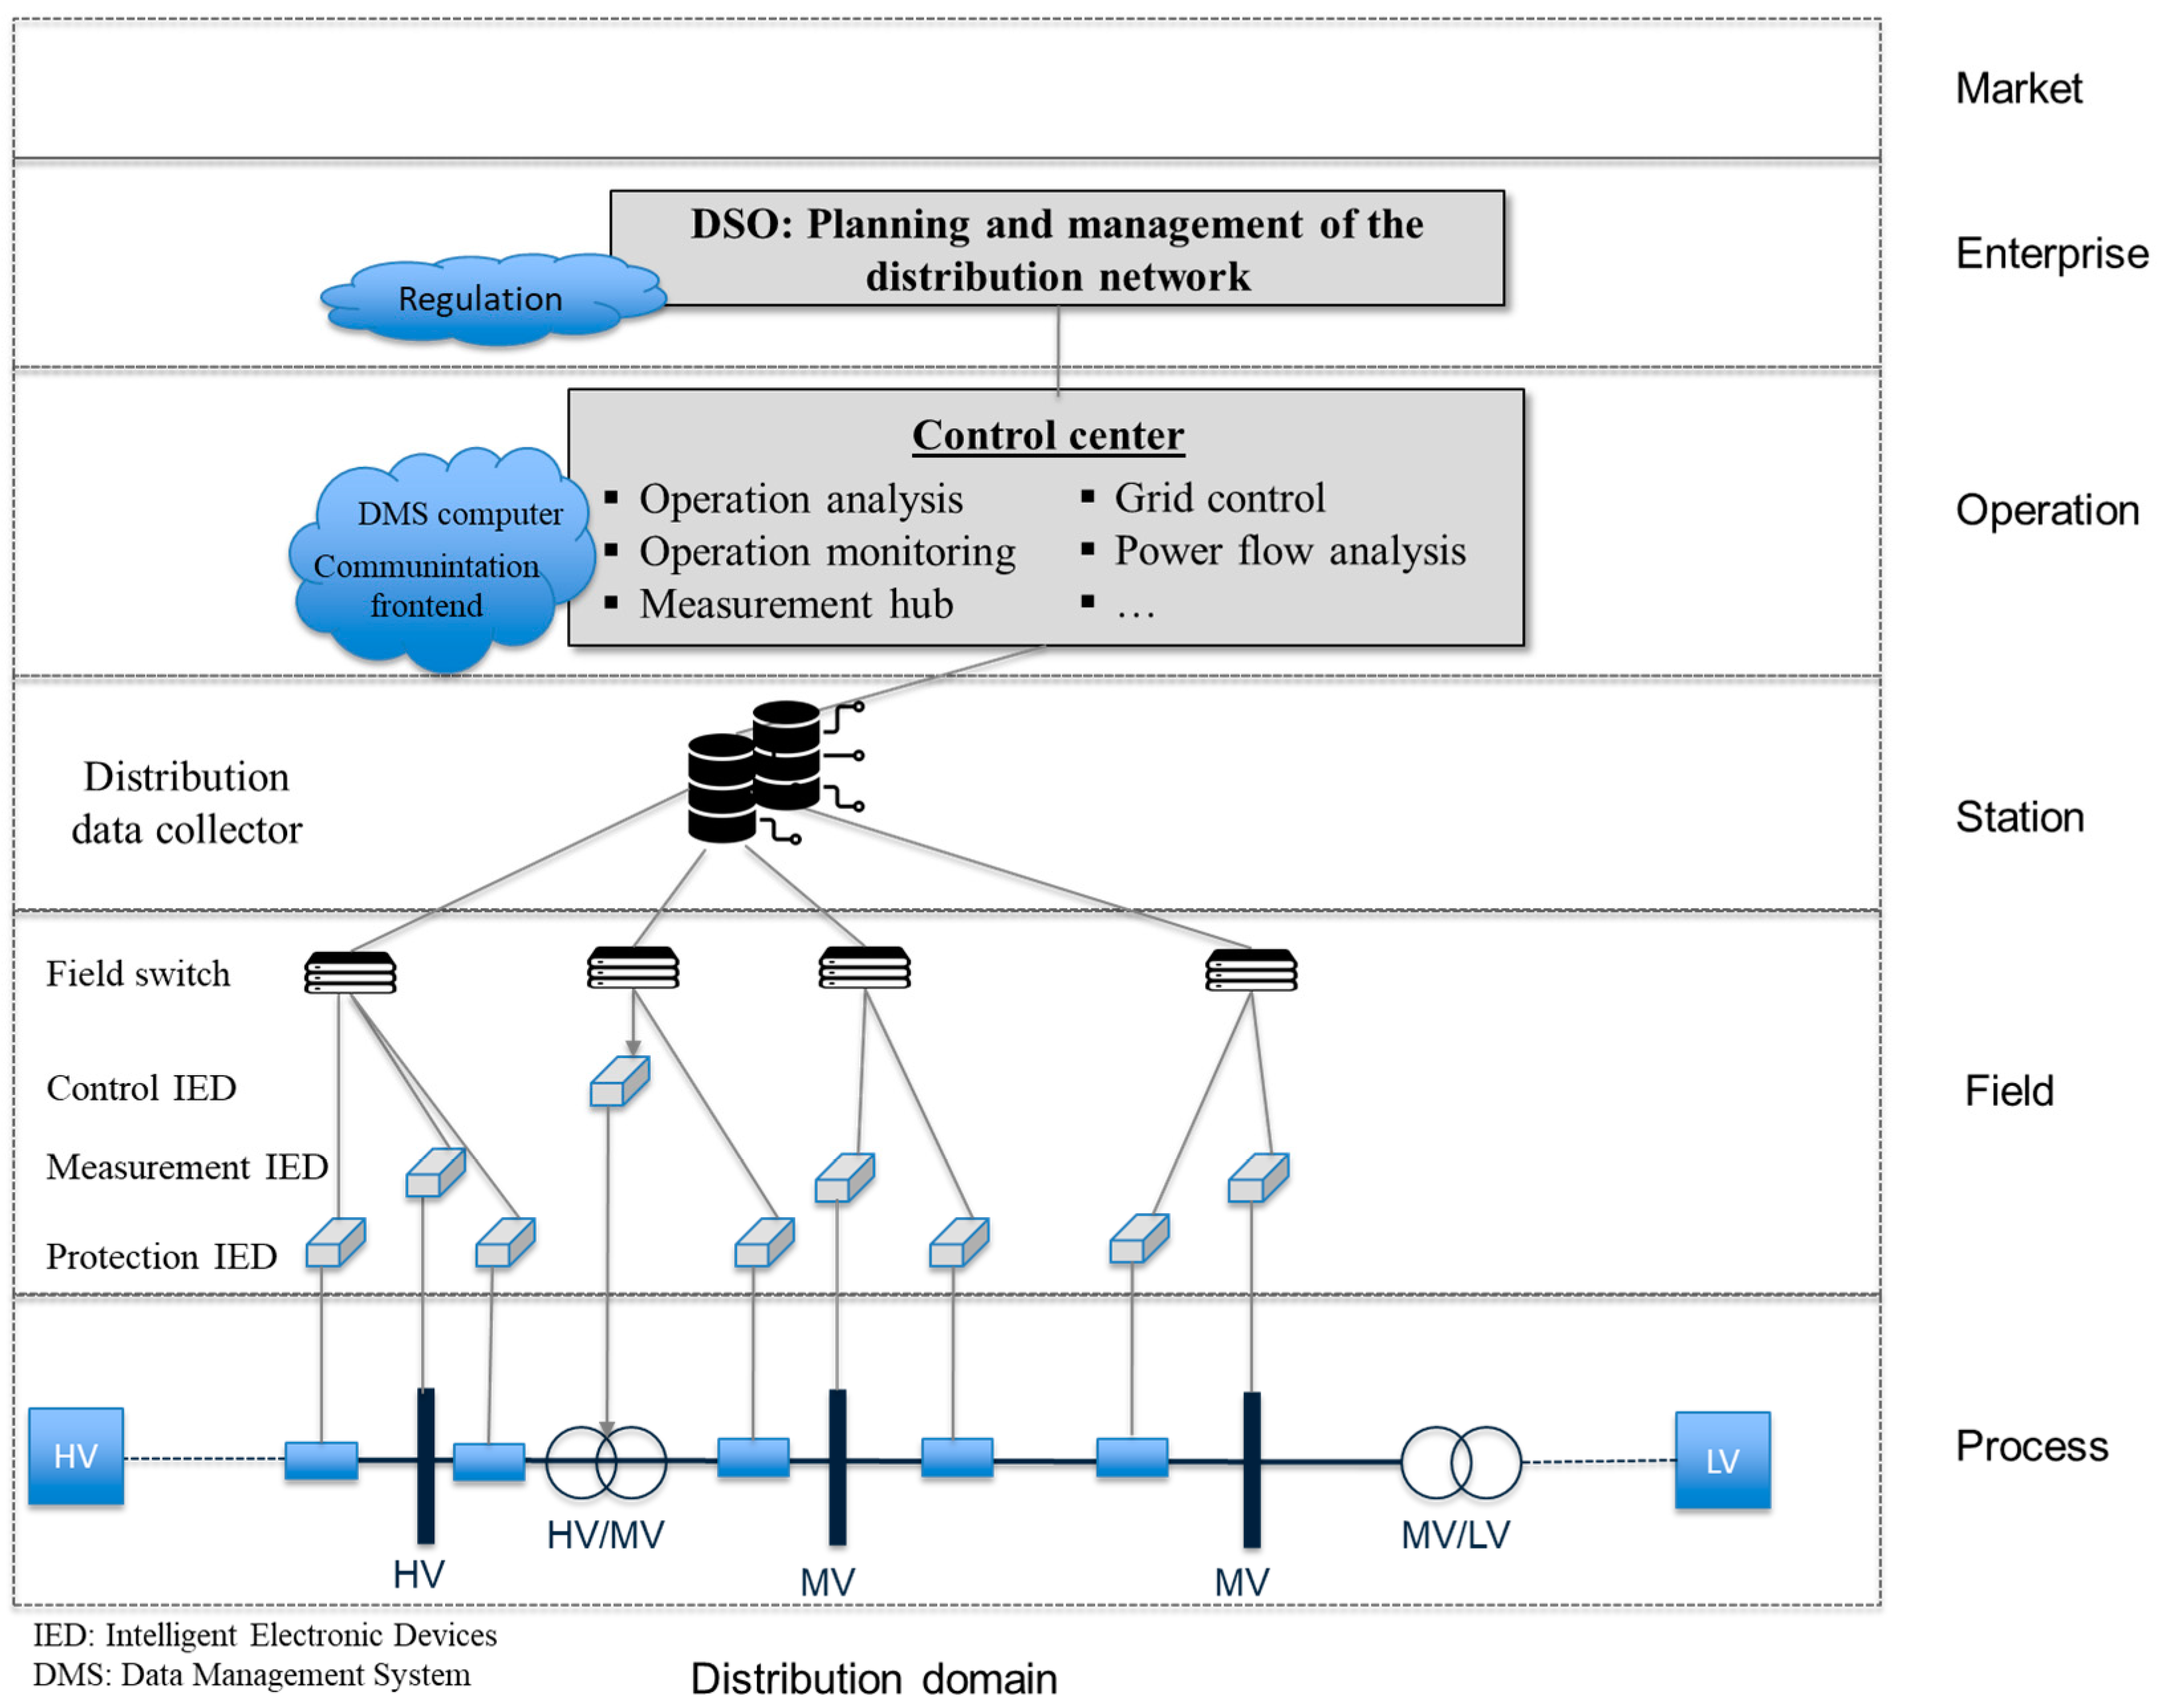
According to the smart grid architecture model (SGAM) framework proposed in [
9] by the Reference Architecture Smart Grid Coordination Group,
Figure 1 depicts the “component layer” of the smart grid architecture considered in this work. As defined in [
10], the SGAM consists of a three-dimensional model with five interoperability layers representing, respectively: (i) the business models, policies, and regulatory constraints (“Business layer”), (ii) the required system functions and services to achieve the business goals (“function layer”), (iii) the exchanged information and data models to realize the functions (“Information layer”), (iv) the required communication protocols (“Communication layer”), and finally (v) the system actors, applications, protection and tele-control devices, network infrastructure and any kind of ICTs that participate in the smart grid context (“component layer”). On the other hand, SGAM deconstructs the smart grid system landscape into the three following dimensions: (i) “domains”, representing the electrical energy conversion chain, (ii) “zones”, representing the hierarchical levels of power system management, and (iii) “interoperability” that includes the aforementioned interoperability layers. For a detailed description of the SGAM, the interested reader is referred to [
9].
The progressive application of ICTs to the distribution network management and the need for renewable energy resources (RES) integration requires the evolution from the Distribution network operator (DNO) to the distribution system operator (DSO). In this sense, in order to meet the new planning and operation requirements (i.e., guarantee the coverage forecasting demand with quality and regulated costs) in the scope of the concept of the smart grid, the DSO electric infrastructure must be able to provide active and flexible management [
11]. In addition, the regulated principle that states open network access safeguards the free initiative to locate distributed energy resources (DER) at any point of the distribution, regardless of local conditions, which may result in an excessive connection cost. In line with that, a new interaction between DER and the DSO allows the evolution of a DER access grid traditional concept (“fit and forget”) towards more flexible conditions.
For many years, the integration of high renewable generation levels in the distribution network operation has been seen as a problem to manage the quality and reliability of the electricity supply (i.e., control voltage profile and possible overcurrents). This fact is corroborated by the large amounts of studies published, which sought to answer the question as to how much DER capacity can be host by the distribution network [
12,
13,
14,
15]. However, such DER resources are no longer part of distribution network planning and may be understood as part of the solution. As stated in [
16], the integration of DER and smart grid technologies may pose numerous advantages for system planning and operation, including the reduction in energy losses and control of the voltage profile, among others. Nevertheless, the challenge for DER integration in the planning and operation of the electric distribution network requires the solution of some difficulties mainly due to: the real characteristics of the distribution network, the regulatory framework in each country, the DER availability and the management capability, the costs transferred to the system (CAPEX, OPEX and others, RES production incentives, incentives to improve supply quality, etc.) and the need to protect the environment [
17,
18]. Many of these aspects should be taken into account when the distribution network planning is performed.
Within this context of smart grids with high levels of DERs, a novel and computationally efficient deterministic methodology is proposed in this work for the planning of AC distribution networks in a steady state. The proposed methodology allows assessing the need for reinforcement, replacement and installation of assets in the distribution network, taking into account its real technical limitations, the impact of the integration of distributed energy resources (DER) on the investments, and many of the regulatory aspects involved in such a decision-making process. In particular, based on the efficiency of the regulated costs transferred to the regulated electric system, in the proposed methodology, different network planning solutions are optimized to meet demand under the quality and system security standards (e.g., N-1) established in the context of the EU Directives [
19]. This expanded scope of solutions considers the grid development and its reinforcement by traditional solutions but improved by incorporating DERs with the capacity to deliver distribution system services (DSS) to the system. At the distribution level, this capacity relies on offering ancillary services to support the grid operation, i.e., backup power and voltage control according to DSS signals from the distribution system operator (DSO) to grid users with the capacity to respond to such signals.
It should be noted that this work addresses the distribution network planning problem from the perspective of the DSO (3 to 5 years ahead), taking into account the incorporation of DER resources and their potential auxiliary and flexibility services (DSS) in its operation, leaving out of its reach, the impact of unbalances in real time, which can be effectively managed by the distribution system thanks to its own design (the inherent characteristics of three-phase HV and MV distribution networks and their regulation/compensation elements). The main objective of this work is to propose an alternative methodology to the classical methodologies traditionally used in the industry practice for planning of distribution networks, which are normally based on deterministic approaches and adopt a single-period setting. In other words, classical approaches normally use an instantaneous scenario in time, which now, with more and better information, can be improved by considering the consumption scenarios hidden by distributed generation. In addition, this work also seeks to bring out that, thanks to the large-scale deployment of smart grids together with their associated advance control and metering infrastructures, it is possible to improve the classical methodologies for distribution network planning making use of the information and data available.
In this regard, with respect to classical methodologies for distribution network planning, the main contributions of this paper are threefold:
- (1)
The proposed approach relies on the generation of a worst-case scenario (or nearly worst-case scenario), which is built from the data recorded from smart grids, and from a deep analysis of the real condition of the distribution network and other relevant aspects, such as the type of generation sources and types of consumption, or other characteristics of the environment in which the distribution network is located;
- (2)
It incorporates the DERs in the planning process of the smart grids respecting the property regime of these resources and considering their potential distribution system services. Furthermore, the proposed methodology can provide valuable information on the need for new investments in DERs;
- (3)
It considers the current regulatory perspective associated with DSOs’ regulated activities and performs a consistent treatment of DERs’ ancillary services to the electrical system.
In addition, due to the adoption of a deterministic approach, the proposed methodology allows considering relevant aspects normally neglected in the advanced methods and techniques that have been published in recent years with the aim of improving the classical methodologies for distribution network planning [
20,
21,
22]. Some examples of relevant works addressing the planning of distribution networks in the presence of distributed generation are [
23,
24,
25,
26,
27,
28,
29,
30,
31,
32]. However, such references rely on conservative assumptions, which may prevent their practical adoption by DSOs. In particular, many of these papers [
23,
24,
25,
26,
27,
28,
29,
30,
31] consider the installation decisions of new DER as a possible investment option for DSOs. In other words, these papers tacitly assume that DSO can decide between either reinforcing the network or investing in DER, which is not realistic considering the current legal separation between distribution and generation activities. On the other hand, in references [
23,
24], investment decisions are focused on the reinforcement of feeders and substations, thereby disregarding the incorporation of new assets. In addition, references [
25,
26,
27,
28,
29] use a power flow approximation; this makes the resulting model linear, and it can be solved with commercial solvers but it may limit its application to purely radial networks [
26]. On the contrary, some examples of references using an exact AC power flow are [
30,
31,
32]. Such references propose the use of heuristic and probabilistic approaches to address the resulting nonlinear formulations. Note that these methods do not ensure an optimal solution and usually require a large number of iterations or simulations to reach a local solution. Consequently, works [
30,
31,
32] may not guarantee that the solution provided will meet regulated requirements regarding the reliability of the electrical power supply. Finally, many of the previously reported works disregard the N-1 security criterion and/or the possibility of providing ancillary services by DERs when defining the optimal investment solution.
On the contrary, we propose a novel methodology that takes into account all the aforementioned limitations. First, the proposed methodology assesses the impact of incorporating DERs on the distribution network planning process by assuming that these resources are not owned by the DSO (i.e., their location, size and installation time are not decided by the DSO, thereby safeguarding the open and non-discriminatory access to the network). In addition, unlike previously reported works [
23,
24,
25,
26,
27,
28,
29] respectively, the proposed model considers both the construction of new assets and the reinforcement of existing ones as investment decisions and relies on the use of an AC power flow. Finally, as previously mentioned, the proposed methodology adopts a deterministic framework. As a result, unlike many previously reported works, the proposed methodology can be applied in realistic-size case studies since, as it will be demonstrated in
Section 3, it is computationally tractable for large distribution systems. It is worth mentioning that the successful application of the proposed deterministic methodology largely depends on the expert knowledge about the distribution network under study, as well as the availability of data. From the point of view of the regulated electricity industry, planning methodologies based on deterministic methods can be more reliable than those based on heuristic and probabilistic techniques due to the large amount of data currently available in smart grids. Note that in the current context of smart grid deployment, there is a large amount of data and information on the record regarding the real behavior of the network, and the proper management and exploitation, which allows obtaining good and rigorous solutions using deterministic models, such as the one presented here.
The rest of the paper is organized as follows:
Section 2 describes the proposed methodology for the electric distribution system planning problem. In
Section 3, the results obtained from applying the proposed methodology in a realistic-size case study are presented. Finally, in
Section 4, conclusions are drawn.
2. Proposed Methodology
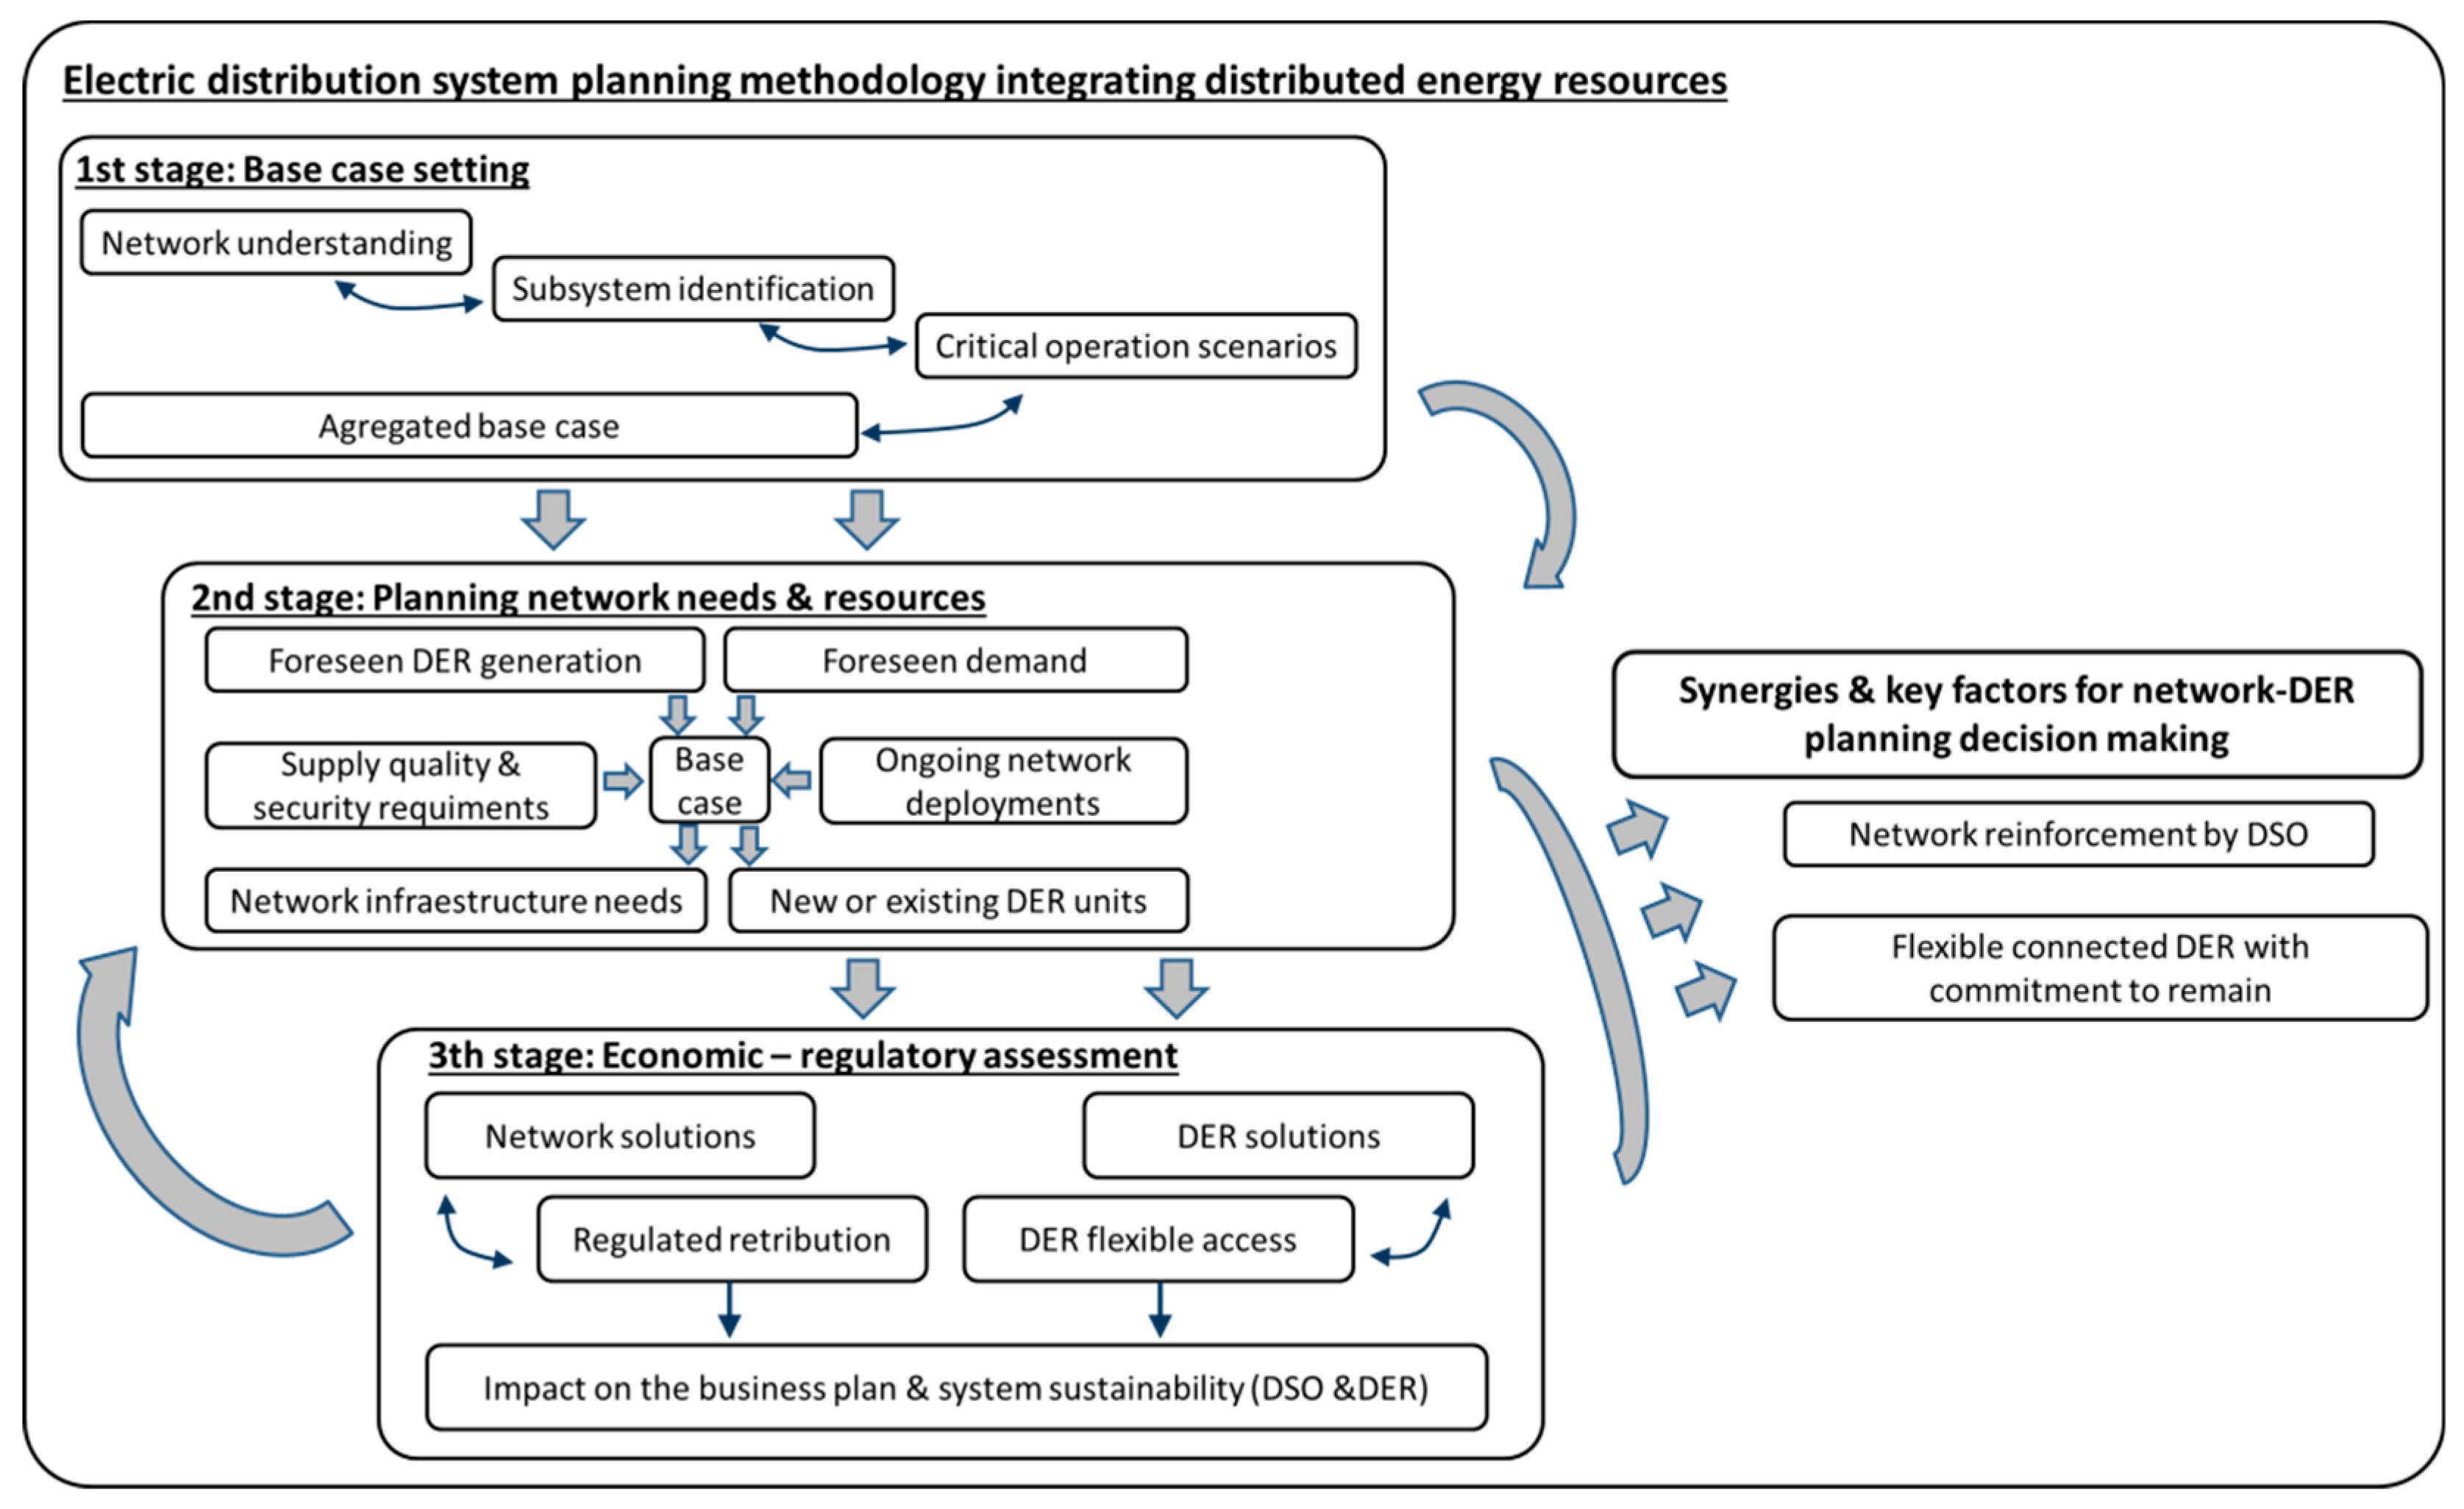
The proposed methodology is based on a three-stage schema, as is illustrated in
Figure 2. The first stage is the most important as it allows identifying the distribution network and its possible weaknesses by using the available information from the smart metering devices. In particular, in this stage: (i) relevant information for the analysis and planning process is obtained; (ii) the original distribution network is divided into electrical subsystems to reduce the complexity of the decision-making process without affecting the quality of the solution; and finally; (iii) an aggregated base case featuring critical operation points is identified. It is worth mentioning that this stage relies on an exhaustive data selection and processing procedure, which requires a large workload due to the large body of data coming from the advanced metering infrastructure and network information that smart grids offer now (
Figure 2). Based on the results obtained from this stage, in the remaining two stages, the best distribution network planning is evaluated by, respectively, assessing technical and economic-regulatory aspects. In particular, in the second stage, according to the information provided by the first one, the planning network needs and resources are defined. Finally, in the third stage, an economic-regulatory assessment of the solutions obtained from the second stage takes place.
It is worth mentioning that in the first and second stages, as done in [
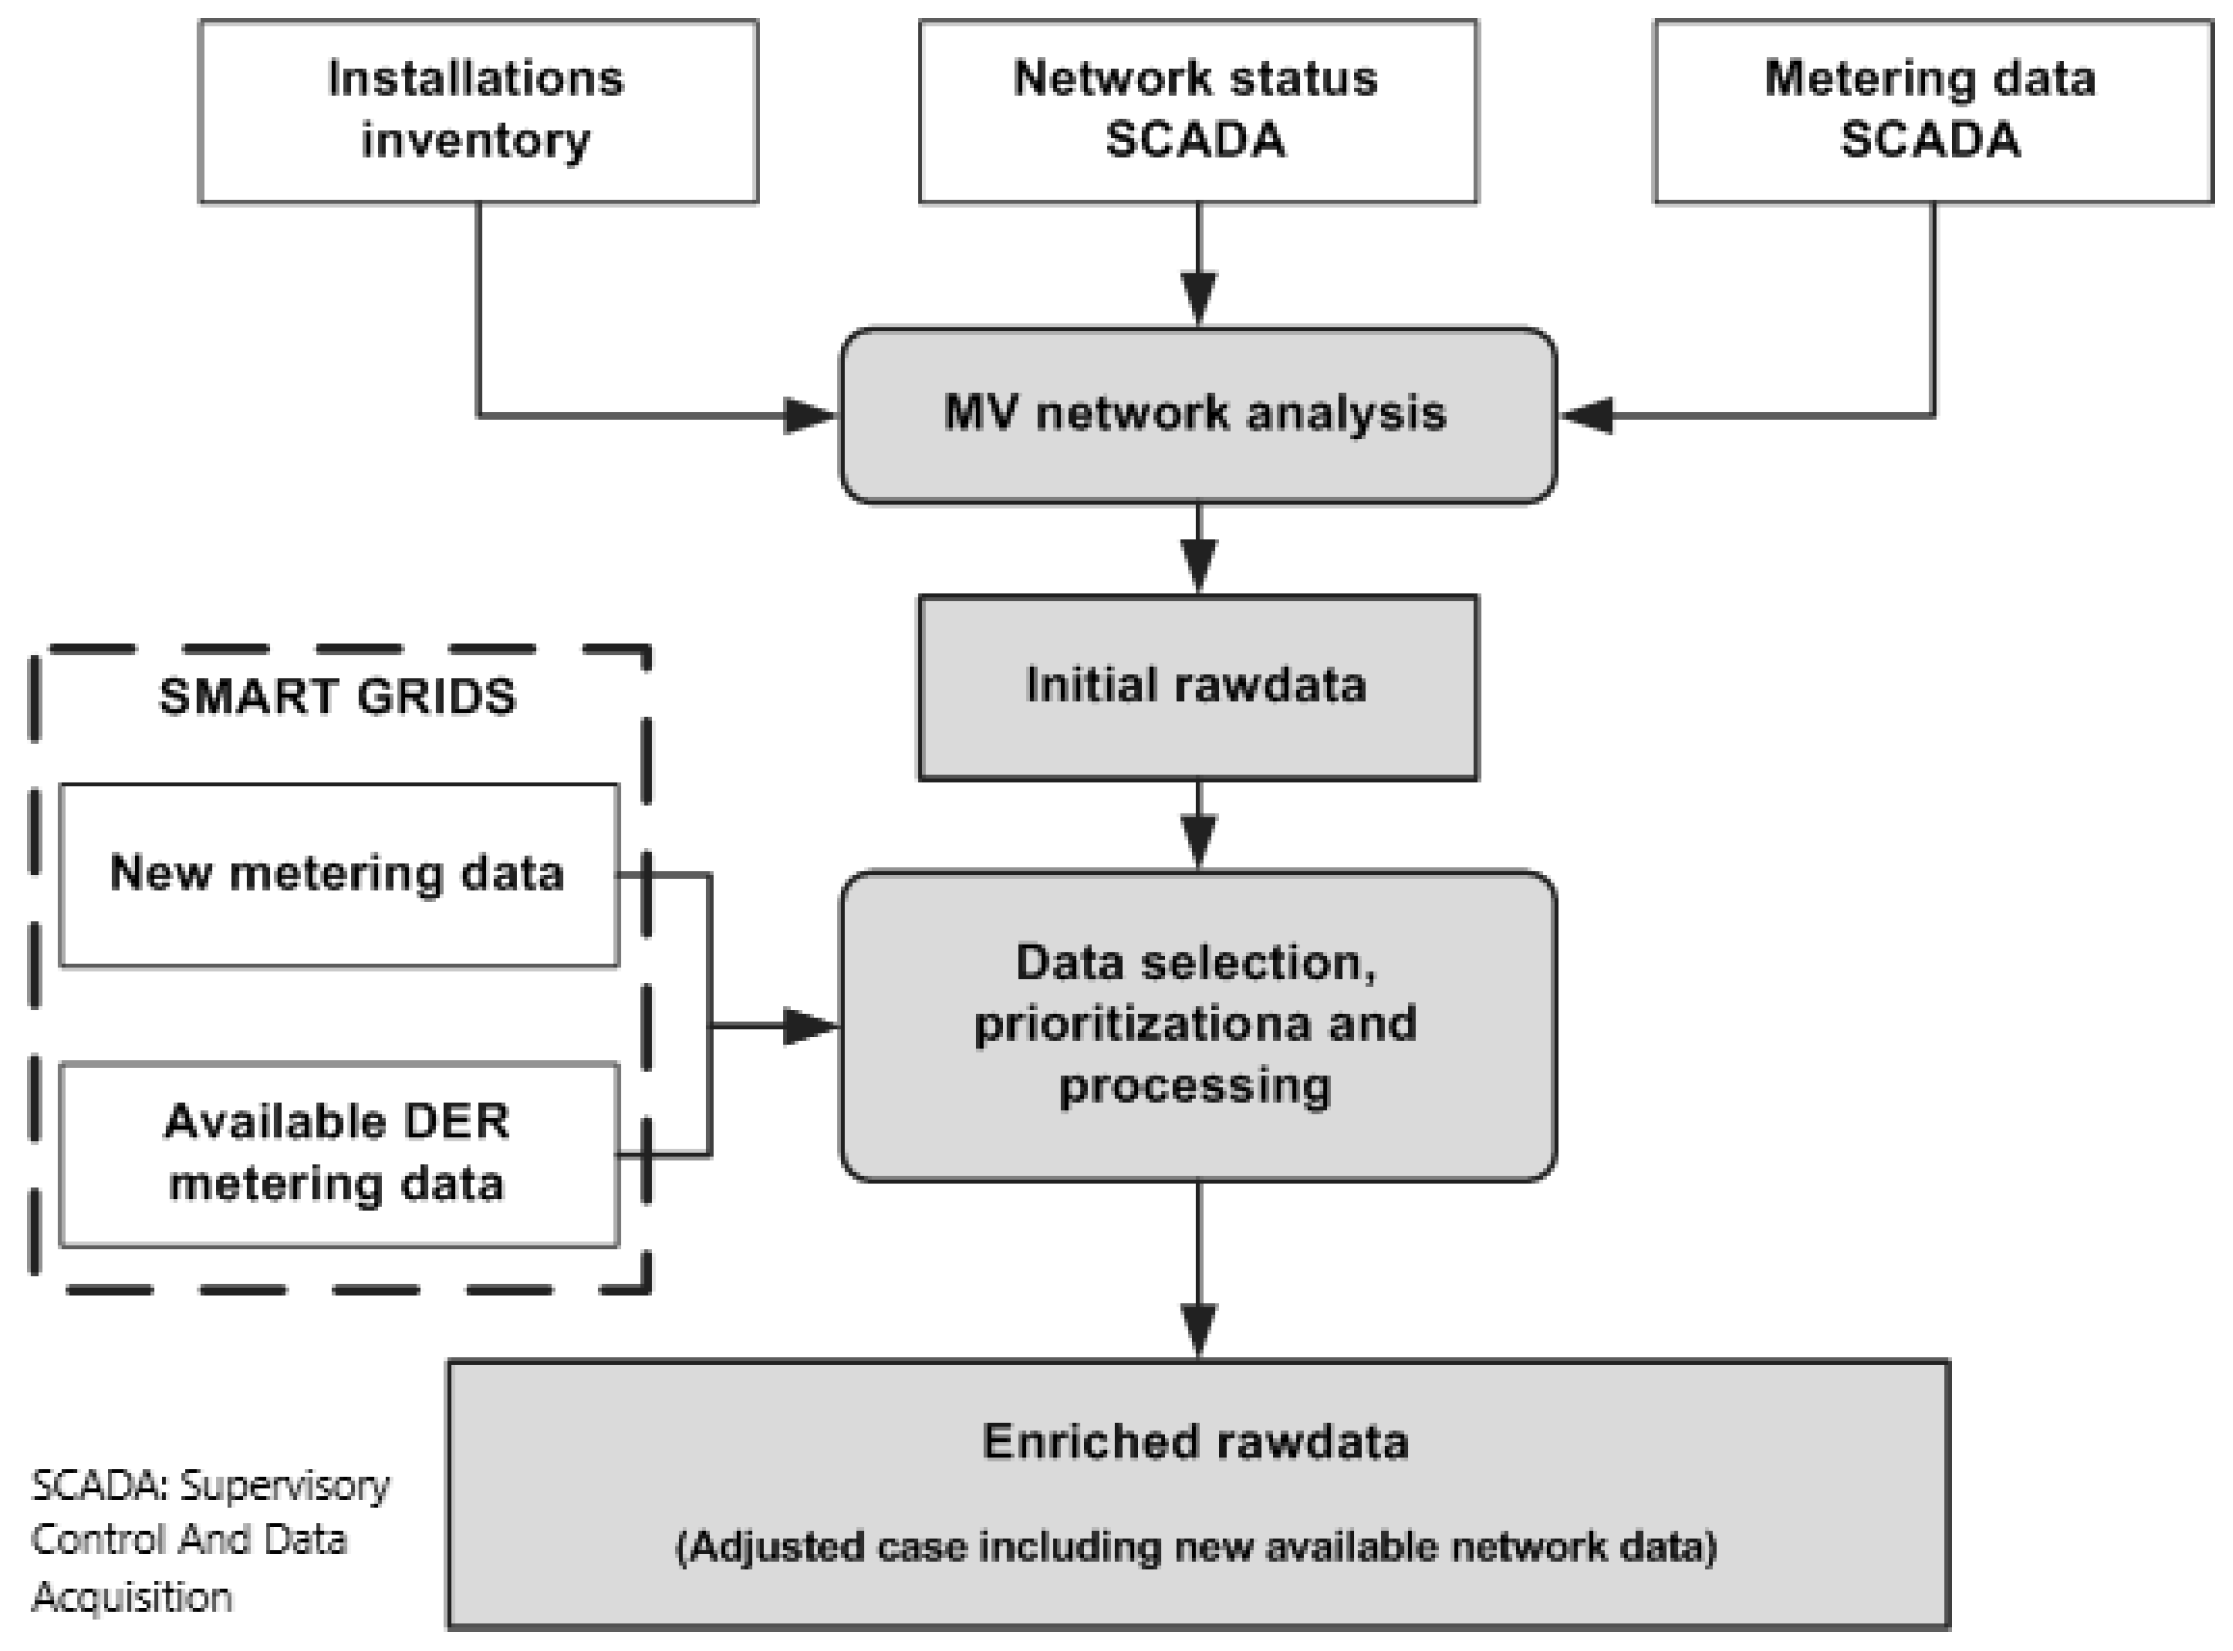
12], the alternating current optimal power flow (AC OPF) has been used to evaluate the behavior of the network and manage alternatives according to voltage regulation, power factor targets and generation constraints, among other factors. To that end, PSS
®E software [
33] has been used combined with several Python-based code developments (see
Figure 3). Thus, the proposed methodology guarantees an exact evaluation regarding the technical aspects of the distribution network. In the following subsections, each stage of the proposed methodology is described in detail.
2.1. First Stage: Base-Case Setting
The purpose of this stage is to obtain relevant information for network planning, reinforcements design, and future network investment to meet demand evolution according to safety and security regulated criteria (e.g., N-1). To do this, a base-case scenario is built, which hereinafter will be referred to as “aggregated base case”. The aggregated base case (BC) represents the distribution network operation with its current real operation constraints under critical situations registered. In order to build it, an identification process is carried out for detecting critical scenarios registered featuring situations of stress for the distribution network.
The problem is addressed by dividing the original distribution network into electrical subsystems and evaluating their performance under a critical scenario or aggregated base case, whose construction will be explained later. The proposed methodology makes a network segmentation in portions where demand and generation levels are homogeneous from an energy balance point of view, and therefore, their joint behavior is predictable. The network portions with a similar behavior allow a detailed analysis for network planning without losing a global point of view as part of an electrical system of major extension and scope.
The critical scenario identification can be addressed using the existing network knowledge about its topology and its real daily operation. For a given topology, using enough historical data (one year, for example) of all the meters installed in the network, the past behavior of the network can be simulated using 8760 power flows, one per hour. As a result, it is possible to detect the situation of major stress using data that may not necessarily be coincident in time. This is named the “aggregated base case”: a composition of the worst situations recorded in each subsystem. In order to meet the N-1 security criteria, these worst situations may include the loss of a feeder or substation transformer. In this way, this methodology opens up the classic composition of the base scenario by allowing an objective and comprehensive view of all the scenarios recorded in the operation of the network. As a result, it is possible to characterize the worst-case scenario by combining the recorded levels of demand and generation associated with critical situations in specific areas, under the criteria and knowledge of the real operation of the network.
Once the critical scenario has been identified, the next step is to reproduce the electrical operation system under this scenario, identifying the operative parameters in every node and line, the network losses and the potential non-delivered power (NDP).
2.2. Second Stage: Planning Network Needs and Resources
In this second stage, the operation of the distribution network under test is assessed considering the ongoing or planned network developments, consumption firm commitments as well as the contribution of existing DER. In addition, the demand trend and the foreseen DERs (including generation and/or demand) are considered to perform a network contingency evaluation and analysis [
2].
In this stage, existing or potential DER capabilities and new distribution network assets are added to the critical scenario following an iterative process that finishes when the network performance is satisfactory to cover a reasonable demand forecasting under the prescribed conditions of quality and security of supply. As a result, according to the most representative scenario identified in the first stage, the unpostponable network development needs are determined, and it is assessed the current available DER as a previous alternative to the future network reinforcements to solve the undesirable situations identified in the N and N-1 analysis. It is worth mentioning that the N analysis is useful to detect voltage and congestion issues that have occurred in the past, i.e., to identify the weak points in the real operation of the distribution network. On other hand, the N-1 analysis is used to identify potential non-delivered power (NDP) during the loss of a system component.
2.3. Third Stage: Economic-Regulatory Assessment
In the last stage, the economic aspects related to the regulated distribution activity are evaluated, including network reinforcements and/or new developments and DER services currently not paid from the system to the DSO.
DER services remuneration is valued based on the average price of energy in the electricity market, and it is included in the analysis of the economic performance of the project to reinforce or develop a network. The active and/or reactive power commands (DSS) to the potential DER resource allow the evaluation of the cost of DER services. Active energy can be obtained in terms of avoided energy supplied from the non-delivered power (NDP) and the replacement time to recover the normal network operating conditions. Reactive energy can be valued for its contribution to the control of voltage and the reduction of energy losses [
34,
35].
This stage, which interacts with the second, completes the technical and economic framework for decision-making in order to assess the opportunity for network investments identified as necessary, considering all the network resources (potential or induced) against the risk of not perform them on time.
3. Case Study
In this section, the application of the proposed planning methodology is better explained using an example based on a real distribution network [
36].
3.1. Distribution Network under Consideration
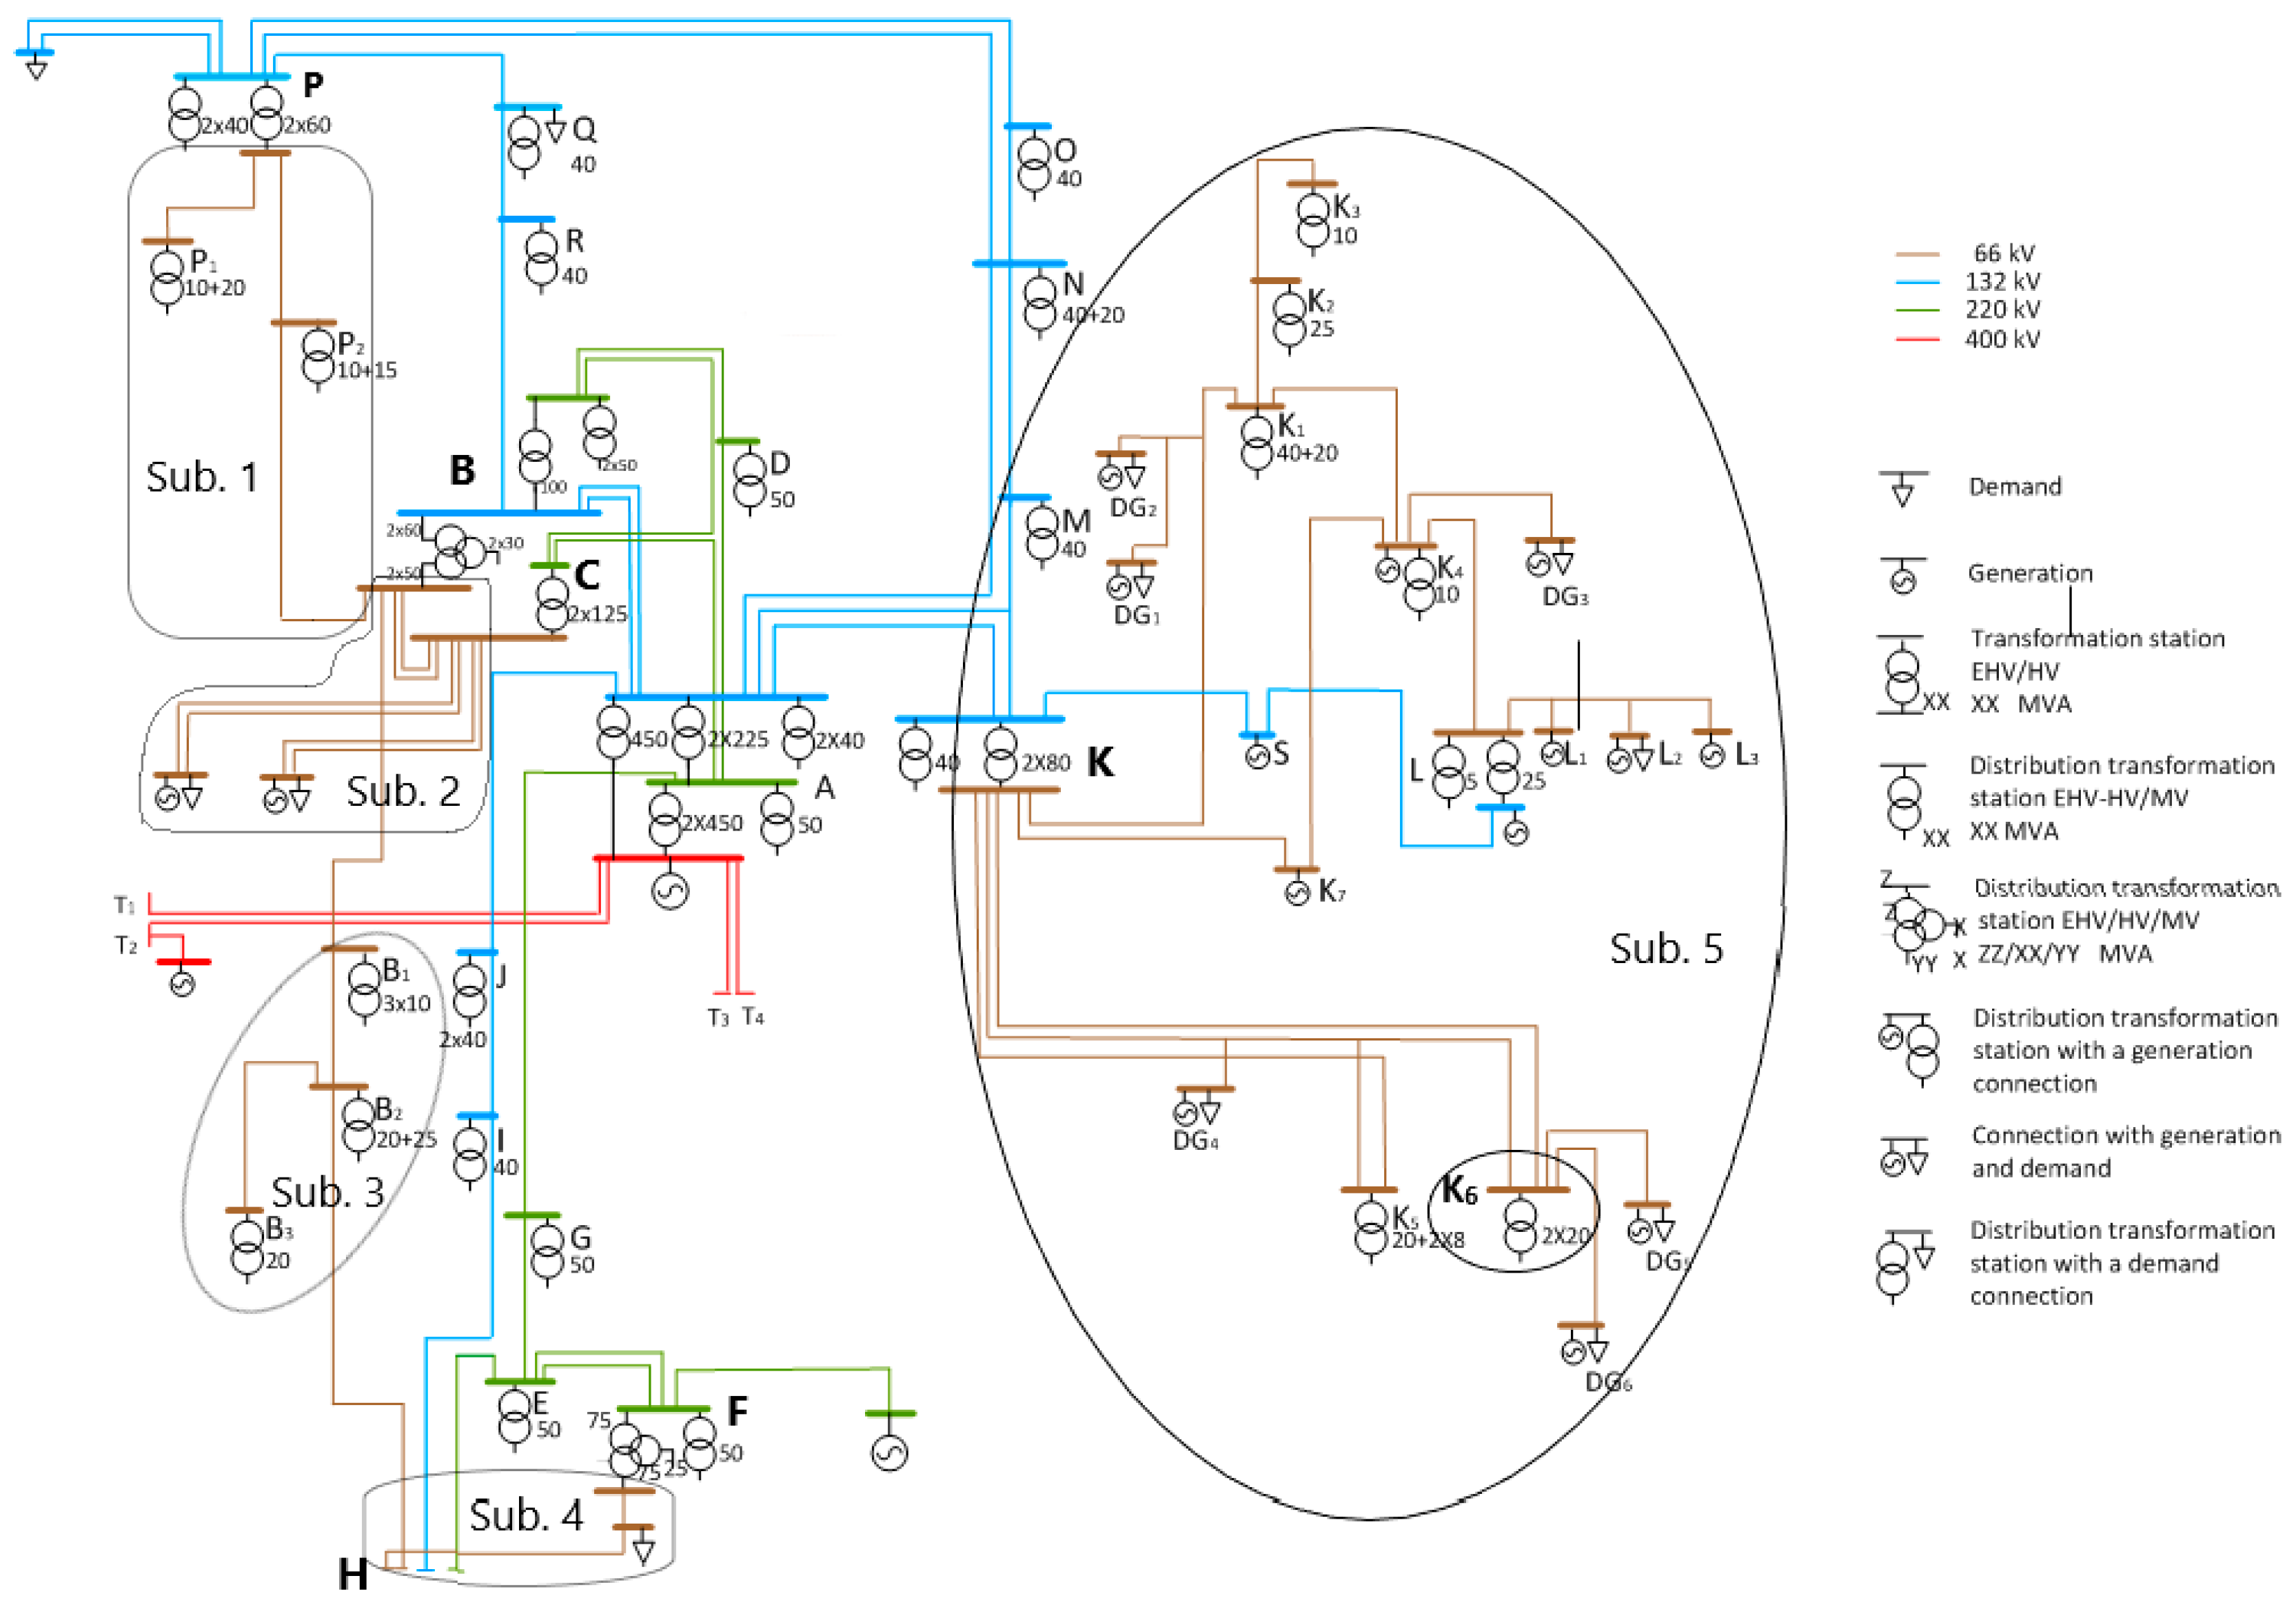
The case study consists of an existing Spanish distribution network supplying more than 450,000 delivery points on a geographical area of 5000 km
2 (
Figure 4). The transmission system includes the 400 kV and 220 kV (EHV) lines (managed by the Spanish TSO), one combined cycle power plant and two wind farms. The distribution system includes the following five voltage levels:
3.2. Base–Case Setting
The first step to address the planning problem is dividing the distribution network into smaller and consistent areas or subsystems. The division criterion is based on identifying each subsystem’s interconnections with the upper voltage (see
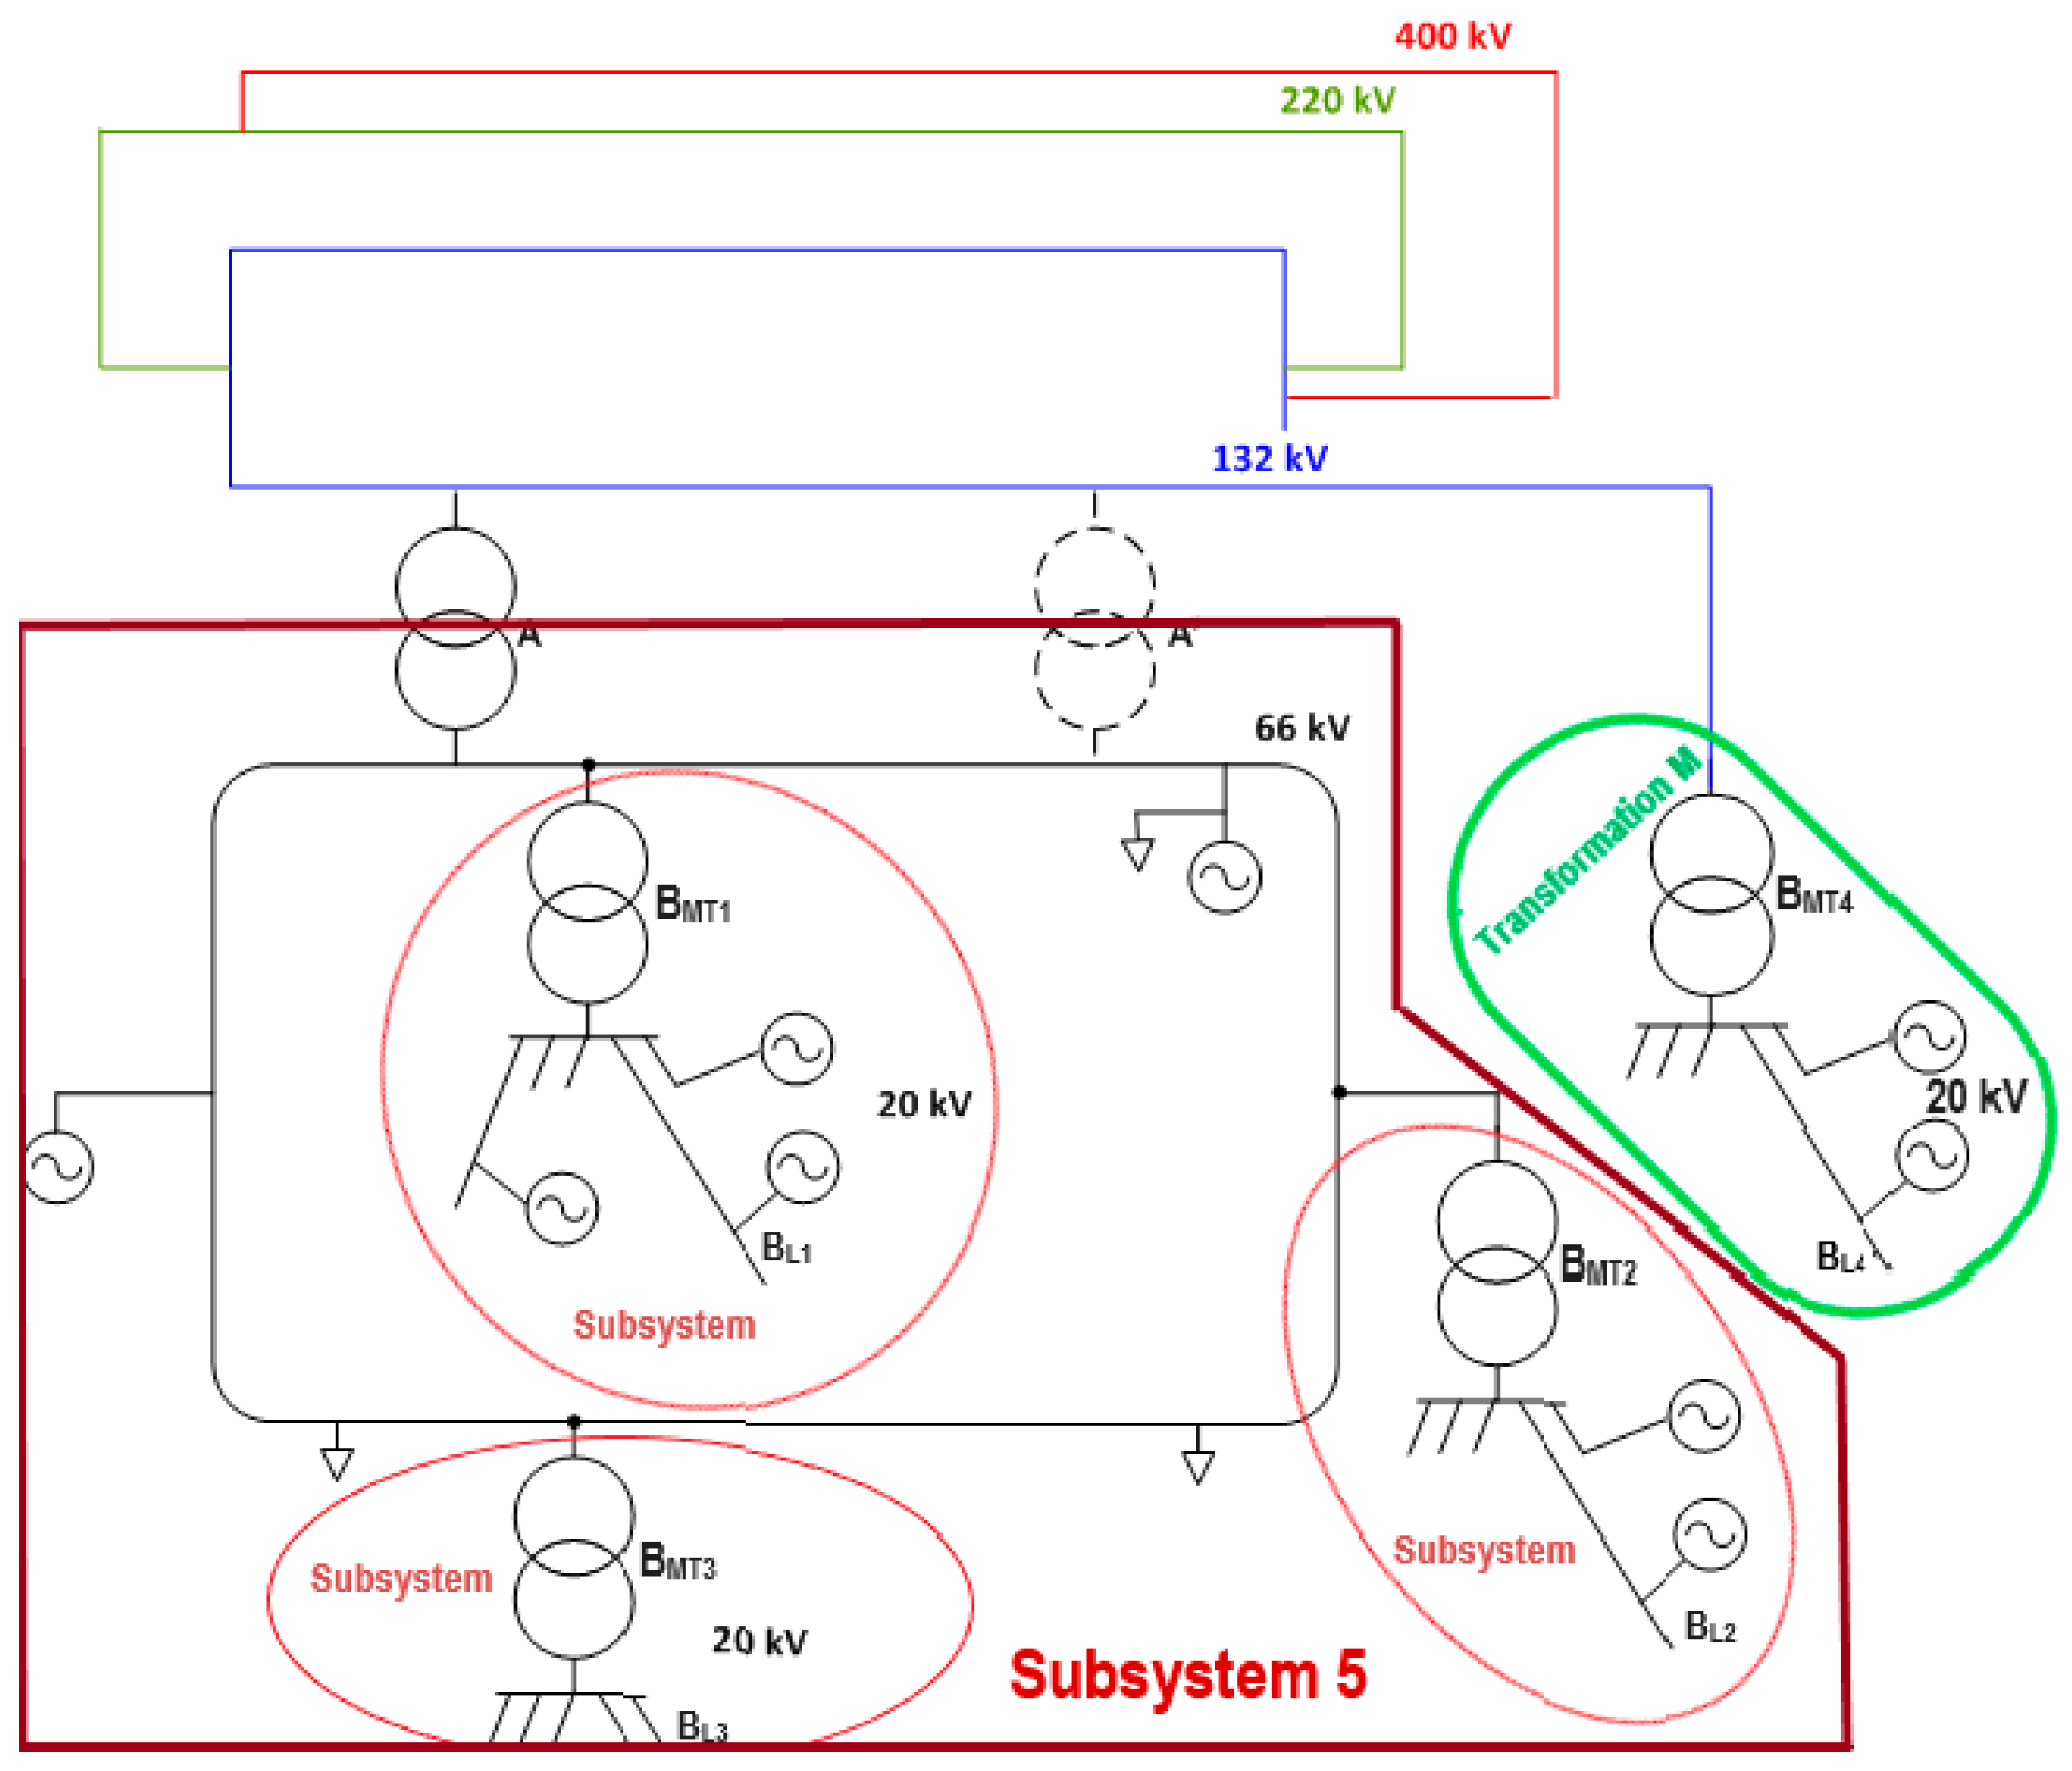
Figure 5). In the studied network, these interconnections materialize in each substation transformation from 132 to 66 kV and from 220, 132 or 66 kV to MV. If the interconnection is unique, the constraint to be checked is the interconnection element between the subsystem and the main system. If the interconnection is multiple, the subsystem can be divided based on the operation restrictions.
Figure 5 represents the interactions that the 66-kV subsystem (“subsystem 5”) has with other subsystems of the distribution network featuring different voltage levels, as well as how such a subsystem includes, in turn, several subsystems, which are previously analyzed and added as loads or generation nodes in the analysis of the main subsystem (66-kV subsystem).
This division criterion allows the analysis and study of the network behavior in the interconnection through the energy balance D = G + I, where D means the demand and losses in the subsystem, G the DER generation, and I is the energy coming from the upper voltage level through the interconnection.
As the voltage level is reduced, small DG installations (micro-generation for self-consumption with no network energy injection) integrate very well with consumption in what can be understood as “foreseeable”. This effect allows planning the LV network from the aggregation of demand (consumption and distributed generation), although this load curve may differ from the pure consumption curve. However, this approach based on the aggregation referred to above does not apply to discrete DER facilities, which are not necessarily integrated with the local consumption demand in the MV and HV voltage levels. Therefore, this study has been focused on this second type of facility as potential providers of services to the distribution network.
The 66 kV subsystems identified in the case study can be grouped into two types:
Four meshed subsystems connected in two points (132 kV or 220 kV): (i) “subsystem 1” comprising the distribution network located between B and P, (ii) “subsystem 2” comprising the distribution network located between B and C, (iii) “subsystem 3” comprising the distribution network located between B and H, and finally (iv) “subsystem 4” comprising the distribution network between F and H;
One subsystem meshed in its inner structure, but radial as seen from 132/66 kV level of voltage: “subsystem 5” connected to K.
Subsystem 5 (and its 20 kV subordinated systems, see
Figure 5), including the distribution network located downstream of the transformation K (EHV/HV), will be used in this paper to explain the methodology due to its characteristics and difficulties in behavioral terms. The analysis of the other subsystems was done in the same way. It should be noted that subsystem 5 comprises several subsystems (L, K1, K2, K3, K4, K5 and K6), which are individually analyzed in detail previously to 5, and the critical information obtained from such analysis is included in the study performed for subsystem 5. In other words, the proposed methodology relies on a cascade analysis “bottom–top” in which subsystems are segmented and analyzed sequentially, starting with those located at the ends of the distribution network.
Once the distribution system under study is segmented into portions, the next step is to build the aggregated base case (BC). As stated before, the BC is not intended to identify a past moment in time (snapshot), but a composite of the worst situations recorded in each subsystem, not necessarily coexisting in time. The BC is built upon each subsystem base case (most critical representative scenario), which includes its topology, demand and generation thanks to the information coming to the DSO SCADA from the advanced metering infrastructure of the smart grid.
As mentioned before, in subsystem 5, the interconnection element is in K (132/66 kV). For this reason, this subsystem will also be referred to in this case study as subsystem K. Using 2014 real data [
36], the non-delivered power (NDP) and the energy losses will be calculated for the critical scenario identified. The NDP is evaluated, taking into account the support capacity between the MV systems interconnected downstream of the EHV and HV systems shown in
Figure 4 [
37].
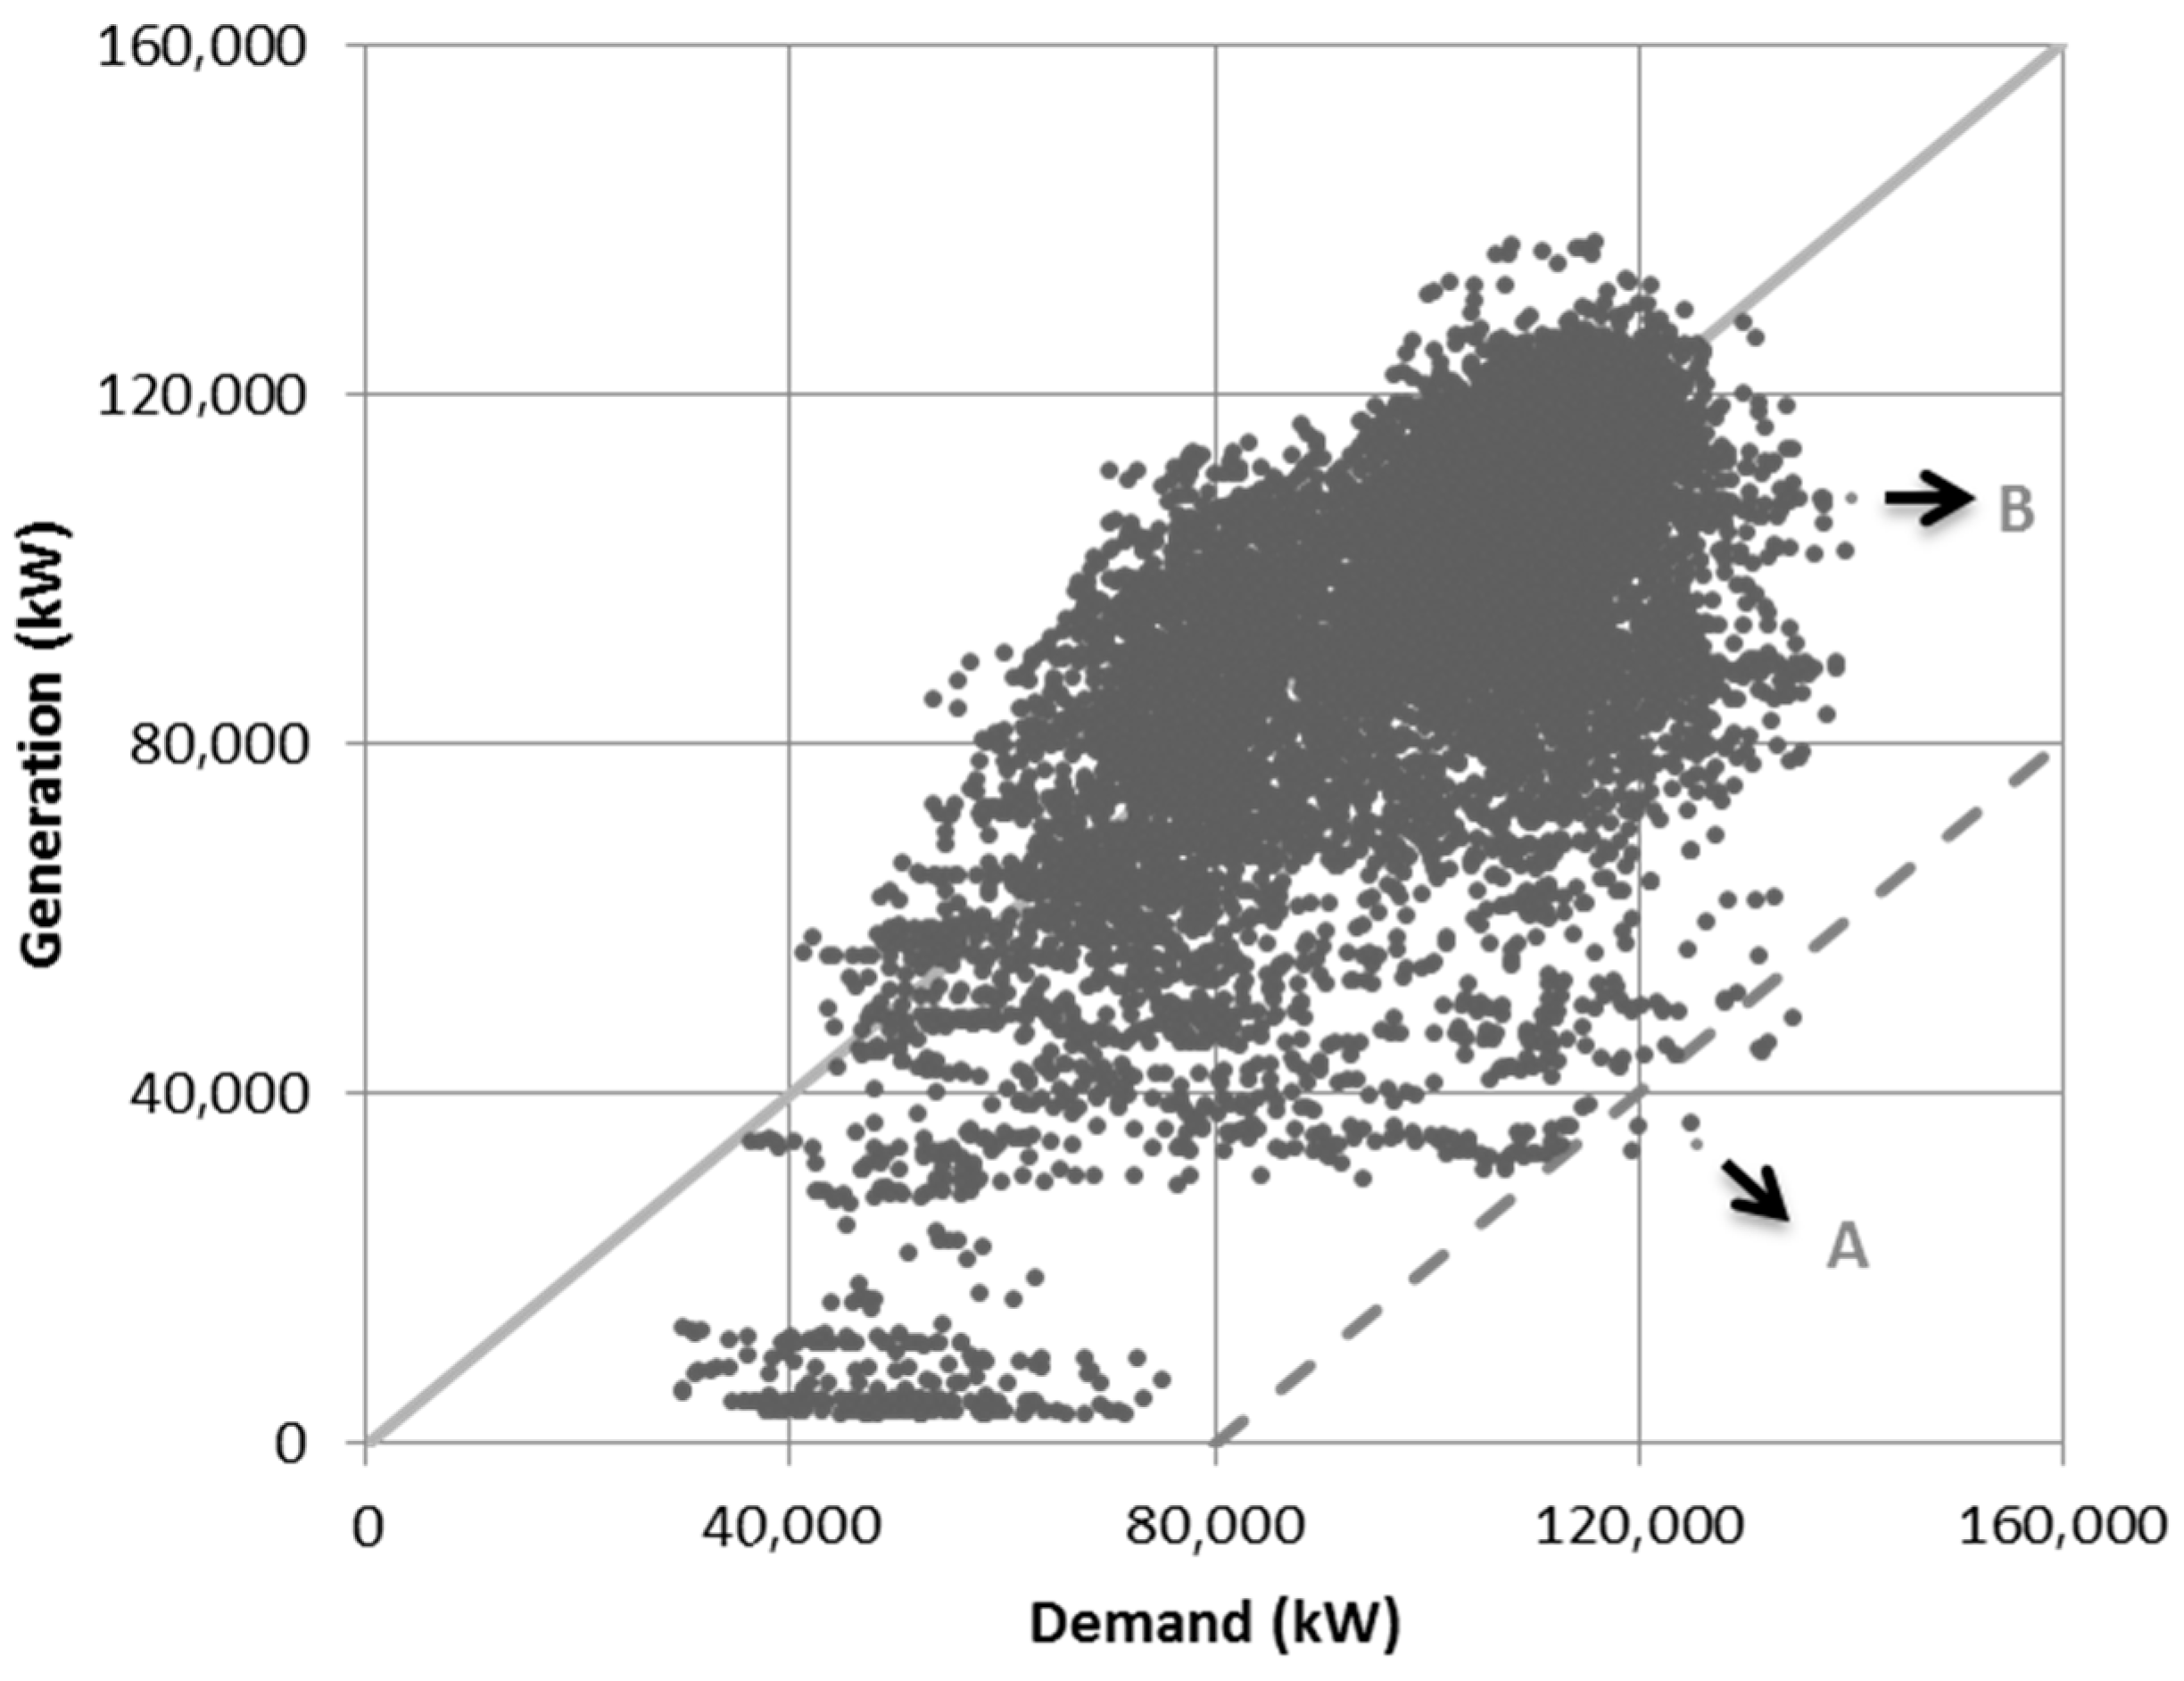
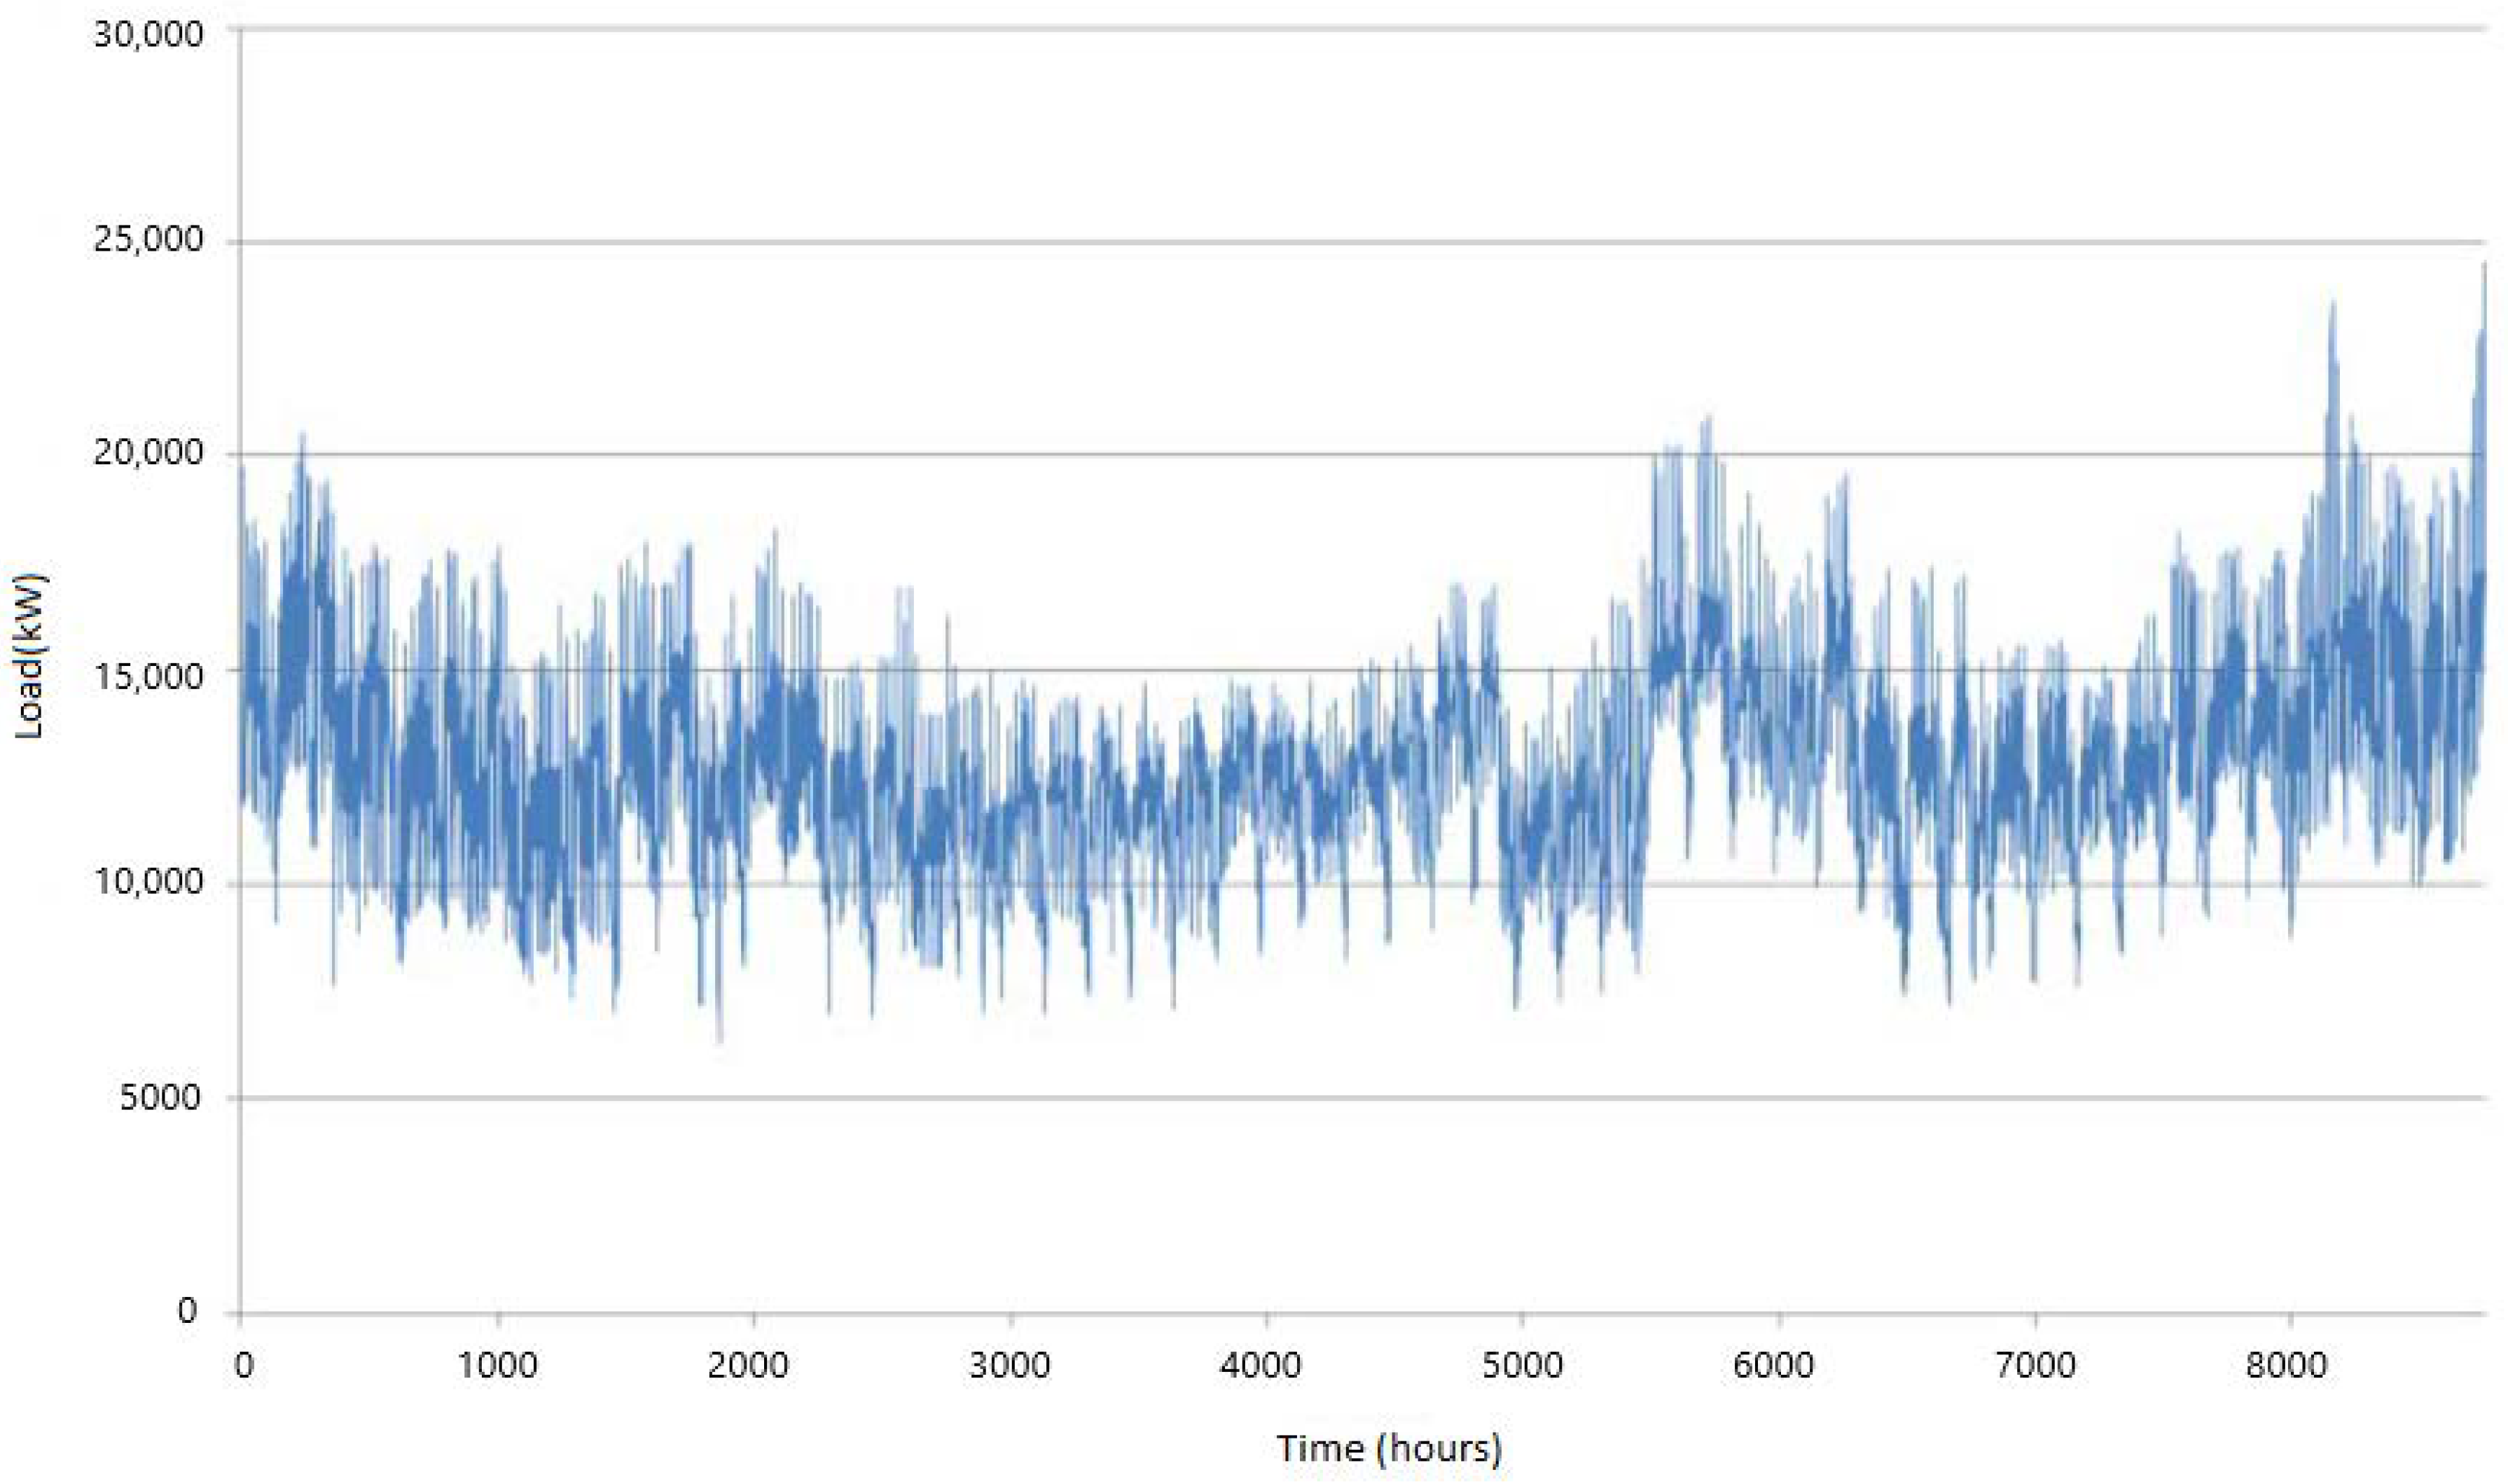
Figure 6 shows the demand (consumption and energy losses) and downstream generation in K. Note that the levels of generation considered in the case study correspond to those planned, and that was communicated to the distribution company. Each point in the graph represents the balance D = G + I, and hence, the solid line represents D = G situations. The spotted line represents the N-1 boundary when one of the 80 MVA transformers in K fails. The points located on the right of the line correspond to scenarios that do not meet N-1 criteria ending in a potential NDP. Point A is an example of these scenarios and, therefore, is identified as the most critical scenario with 34.194 MW generation and 125.574 MW demand at 08:00 04/03. The interconnection power at that moment was 91.38 MW. Point B is the maximum demand scenario with 108.154 MW generation and 139.964 MW demand at 21:00 21/01. Regarding the small levels of generation shown in this figure, it is worth mentioning that they coincided with the following circumstances: (i) holiday seasons, especially in summer, (ii) days with low intermittent and non-dispatchable renewable generation, in particular those from mini-hydropower plants, which cannot regulate their production, and (iii) scheduled shutdowns in factories with CHP systems.
The BC is built using the maximum recorded demand (point B, 139.964 MW) and a small, recorded generation (point A, 34.194 MW), which leads to an interconnection power of 105.769 MW with a potential NDP. While it is true that the selection of these levels of demand and generation may seem too conservative because they were not recorded in the same time interval, the non-occurrence of this aggregated base case in the future cannot be guaranteed. Note that demand and generation are independent variables [
36]. In other words, there is no a strong correlation between both variables, and consequently, these recorded levels may simultaneously occur in the future. The lack of a strong correlation between demand and generation is due, in part, to the fact that the operation of many distributed generators, e.g., combined heat and power (CHP) plants, depends on various operational and market factors (e.g., the evolution of gas prices), different from those that may influence on demand levels.
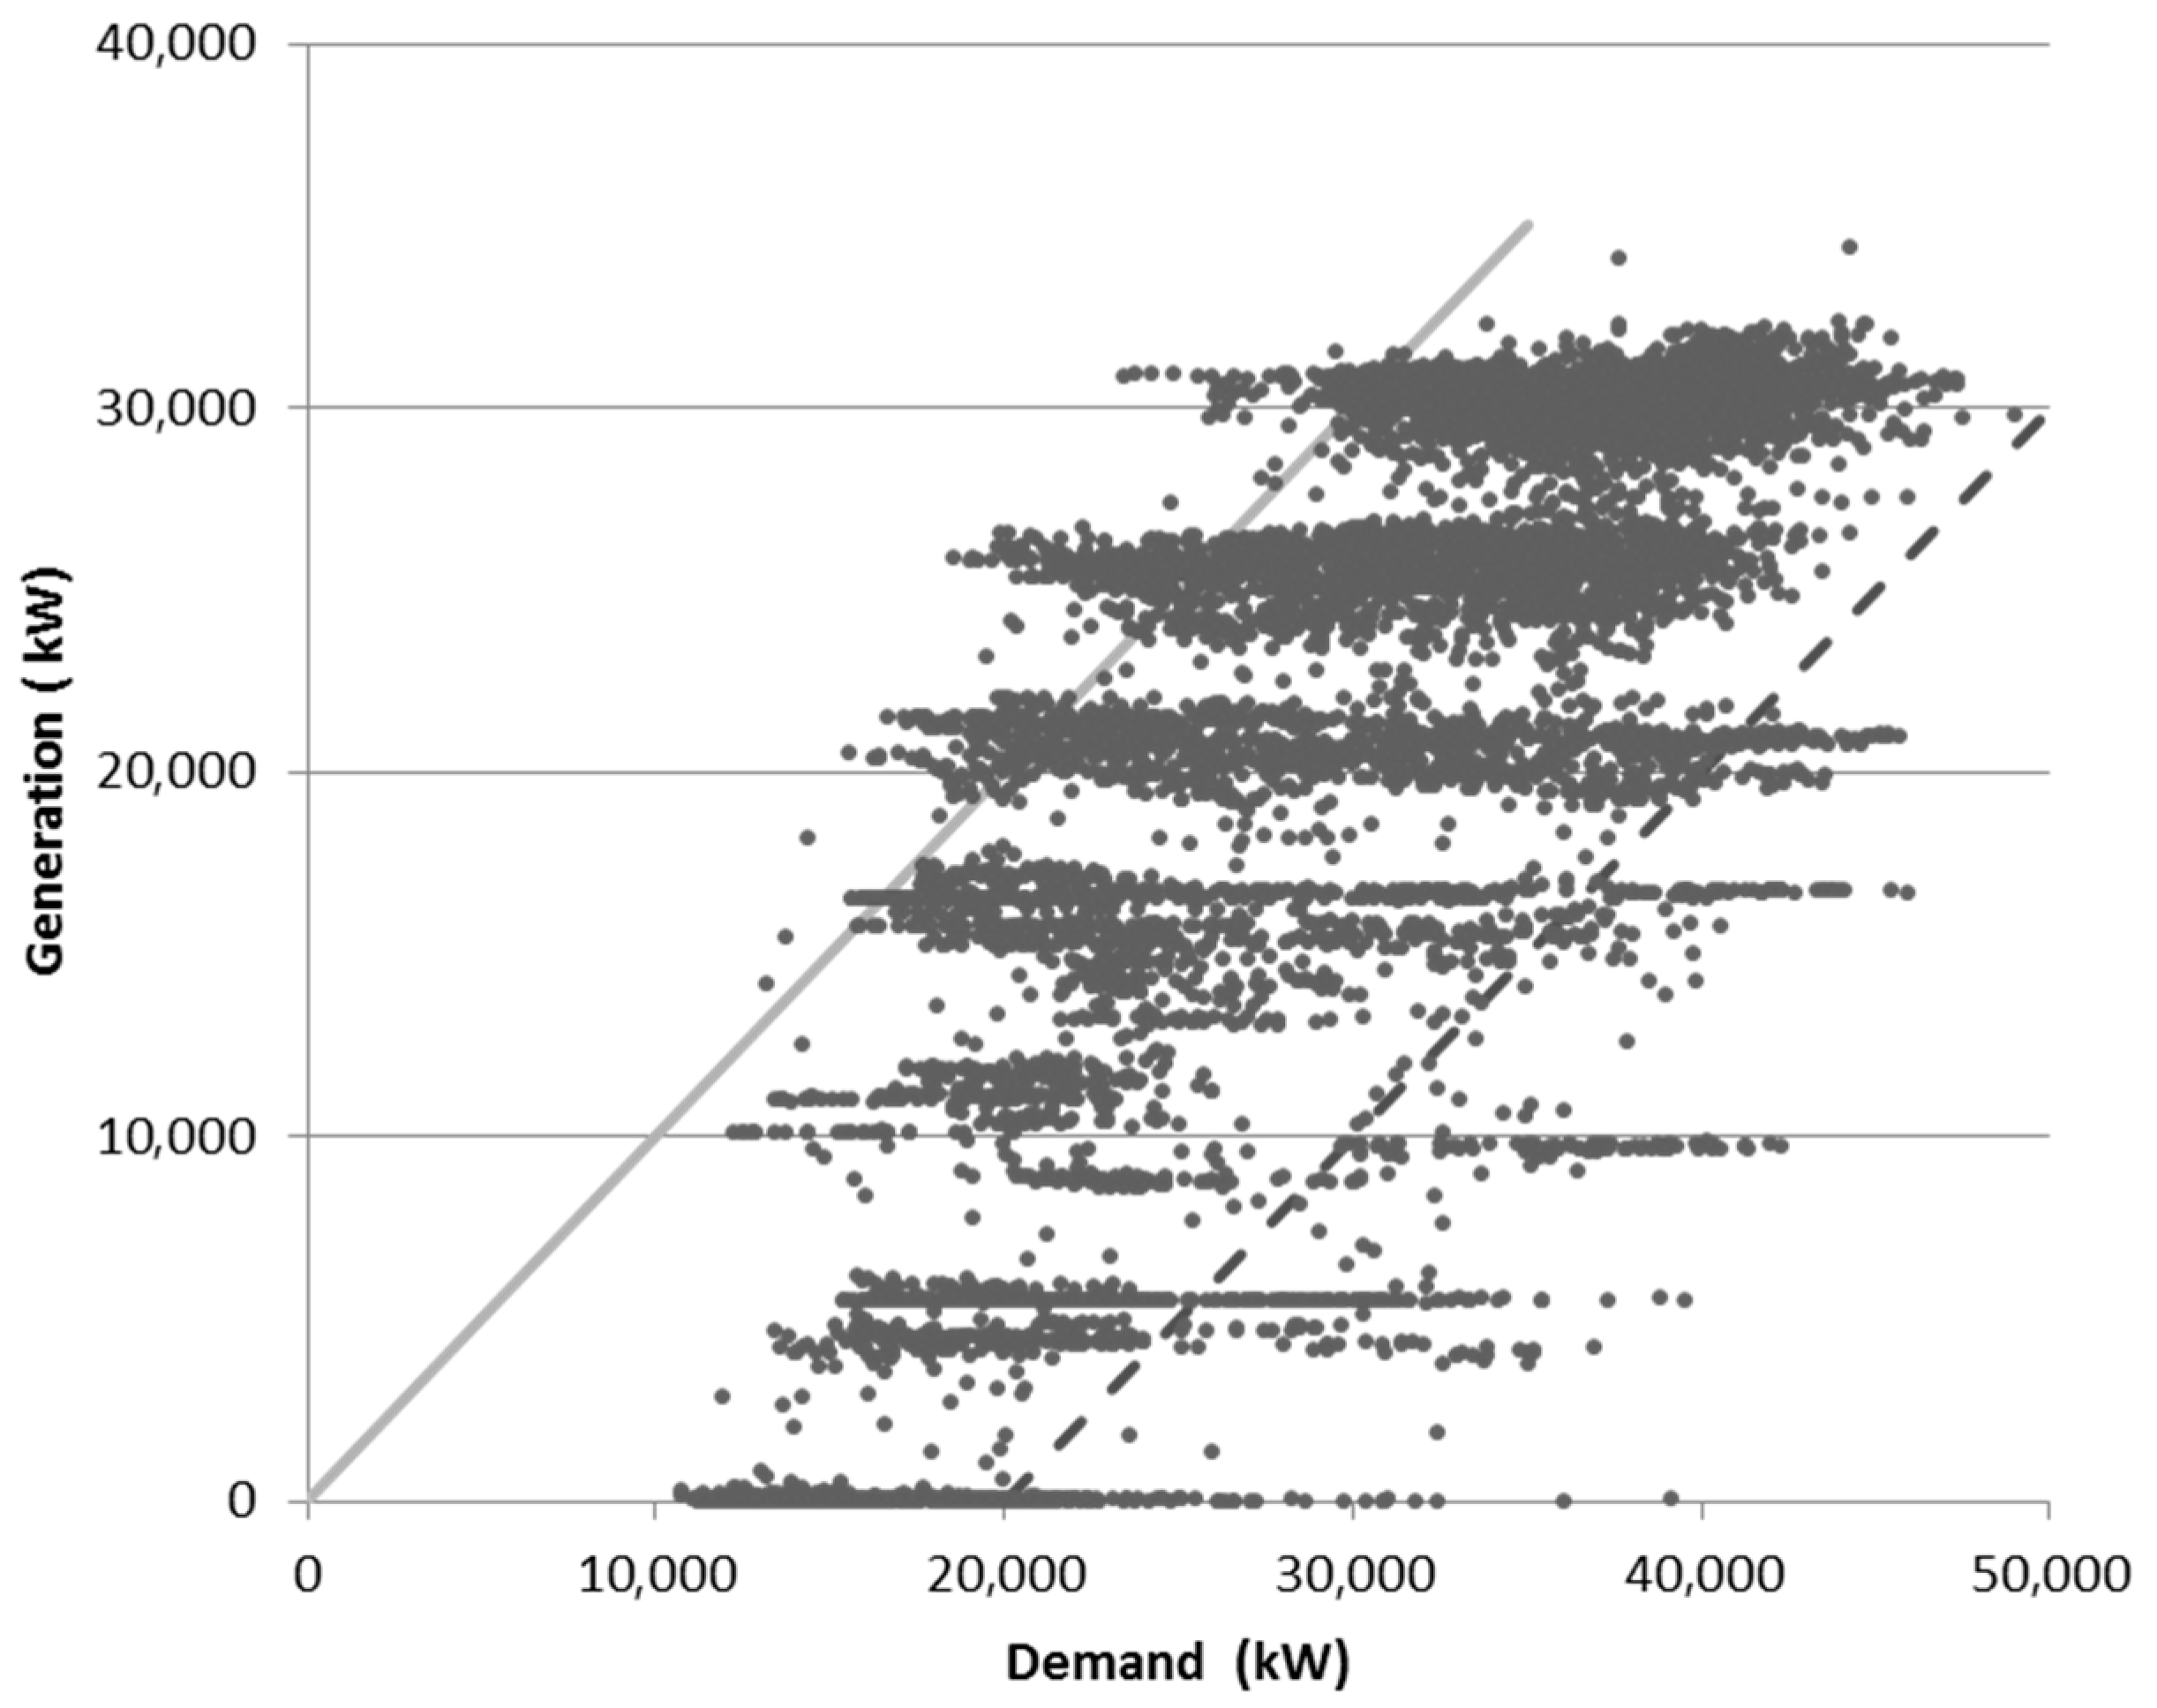
Figure 7 shows a good example of the possible lack of correlation between demand and generation. This figure depicts the generation and demand levels in K6 in 2014 (in the same way that it was done in
Figure 5 for K). It is important to note that during 2014 and 2015, generation levels were greatly affected by the evolution of the gas price on the international markets. On the other hand, in Spain, the planning of distribution networks is made seeking to prevent any loss of supply or problem in its operation since, among other aspects, it may result in a high penalization cost. To this must be added the negative social and economic impact that a blackout may cause. Consequently, the planning of the distribution network must cover any possible worst-case scenario, such as that contemplated in this case study. As done in the proposed methodology, these worst-case scenarios must be identified using expert knowledge on the operation of the distribution network as well as on other relevant aspects, such as the evolution of associated markets.
The same procedure followed in K (EHV/HV) was performed in the HV/MV downstream substations L, K1, K2, K3, K4, K5 and K6. K6 was selected as another representative example for this paper, as a demand concern was identified when high distributed generation (DG) levels hide demand in the interconnection point.
As already mentioned,
Figure 7 shows generation and demand levels in K6 in 2014. According to this figure, the BC for K6 is built using the maximum level of recorded demand (49 MW, 21:00 23/01) and a small level of recorded generation (209 kW, 08:00 04/04). This results in an interconnection power of 49 MW. K6 is composed of two transformers of 20 MVA each, so this value in the interconnection may imply a potential NDP.
In order to finally build the BC, a power flow was performed in each transformation using the generation and demand values identified for the base case, through which the voltage level in each node and the current in each line are checked. In addition, an N-1 contingency analysis was also performed in each transformation to calculate the NDP in the base case.
Table 1 summarizes the results obtained for distribution networks located downstream of substation transformations K and K6, respectively, regarding energy losses from transformers and lines, overloads, and non-delivered power levels obtained from the power flow and contingency analysis performed in the first stage.
Table 1 also provides information on energy coming from the upper voltage level through the interconnection, and demand levels and available DER capabilities identified downstream each transformation. Note that the levels of energy losses identified in the network under study, in a scenario of maximum demand and low generation, are quite reasonable. Moreover, the overloads and NDP identified in K and K6, in the first stage, are affordable for the distribution network thanks to a proper MV network and the allocation of the DG units able to follow DSS requests. This last statement is illustrated in
Table 2. Such a table summarizes the results obtained from the load flow analysis performed for the distribution network located downstream of substation transformation K6 when one of the 20 MVA transformers fails. As can be seen in this table, DERs’ auxiliary services related to the active power may largely support the distribution network operation when an infrastructure failure is detected.
3.3. Planning Network Needs and Resources
To identify the future network needs, a power flow and contingency analysis were performed again in subsystem 5 but in a planning time horizon of five years (2020). This means that the demand and DG will be projected, and also, the network planned developments will be included.
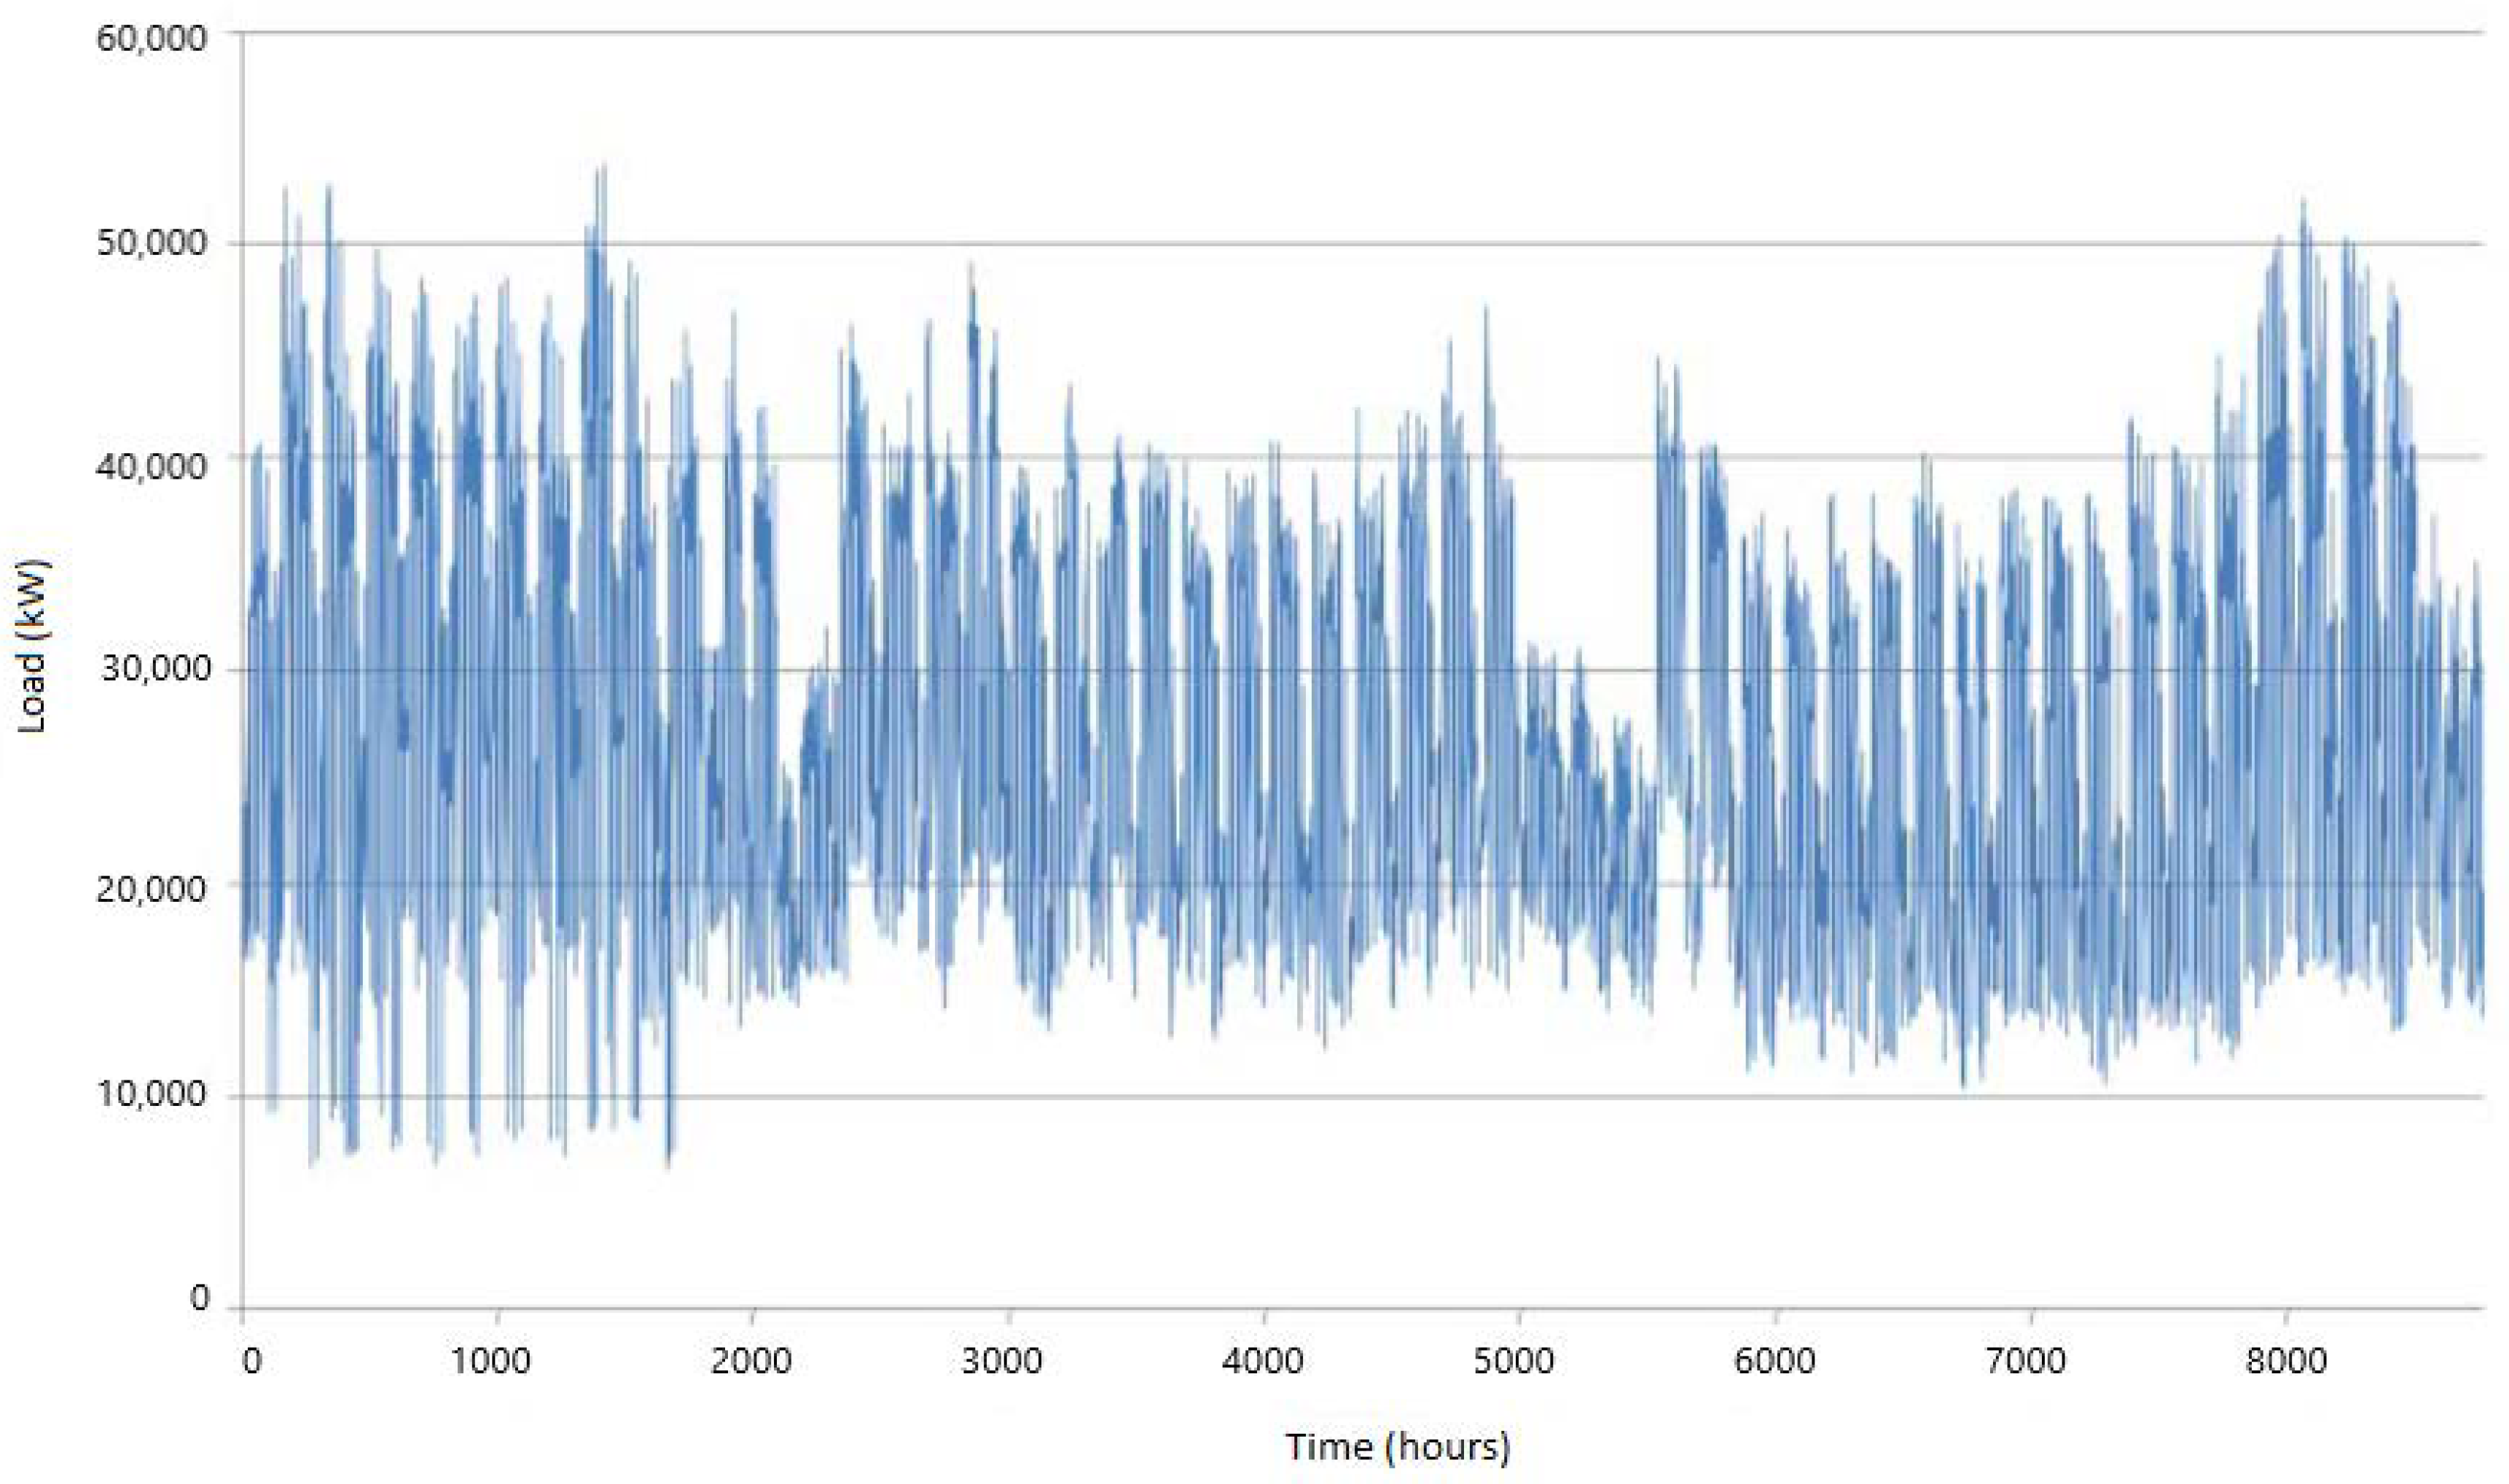
In this case study, there are four main demand patterns: the urban profile, touristic profile, industrial profile, and rural profile. Subsystem 5 demand follows the industrial profile combined in a small proportion with the rural profile. These profiles were represented in
Figure 8 and
Figure 9. The demand trend was projected using a 3% annual growth. This value is coherent according to the current demand profiles.
Regarding the subsystem 5 network planned developments, the HV supply network in K6 will be reinforced. No MV network development was necessary for the planning horizon 2015–2020. Regarding the DER, there are no new applications, and thus, the 2014 recorded values will also be used in the 2020 analysis.
Table 3 includes the second step results for the 2020 planning process for transformations K and K6, including the power flow and contingency analysis results and also the available DER capabilities, identified downstream each transformation.
The overloads and NDP identified in K and K6 are not affordable for the distribution network in 2020, even with the support of the DG units able to follow DSS requests. As done in the previous subsection,
Table 4 provides information on the possible contribution that DERs may have in reducing the non-delivered power level in the event of a failure in K6 transformation. Note that, although the available DERs may support the distribution network operation under a contingency to a large extent, they are not able to cover the total NDP produced; thus, further investment in distribution assets is required.
Following the assessment of projected 2020 results, the identified needs of development and/or reinforcement of the existing network in subsystem 5 are:
3.4. Economic-Regulatory Assessment
The main output of the previous step was the identification of the network needs. In this stage, the investment regarding this network needs will be assessed, taking also into account the potential DER operation support. To evaluate the network investment profitability from a regulatory point of view, the “reference network model” (optimal global network method) was adopted for the retribution concepts. Each network need was analyzed using a cash flow to calculate the net present value (NPV), internal rate of return (IRR) and payback. Different scenarios were built to analyze the existing DER contribution and the impact of investment delay. As distribution is a regulated activity, the regulation establishes an economic retribution model for network investments. This model was used in the cash flow and the regulatory value for distribution network investment [
38]. In addition, the flexible DER retribution (ancillary services—DSS) is included proportionally to the NDP that the DER supplies during the fault restoration time and also to the energy losses reduction, thanks to the DER power injection (P) and DER reactive power injection, (Q), respectively, according to the DSO requests. The economic revenues for the prevented NDP (P) and also the prevented losses (Q) were assessed using the medium MIBEL market price (60 €/MWh, December 2015).
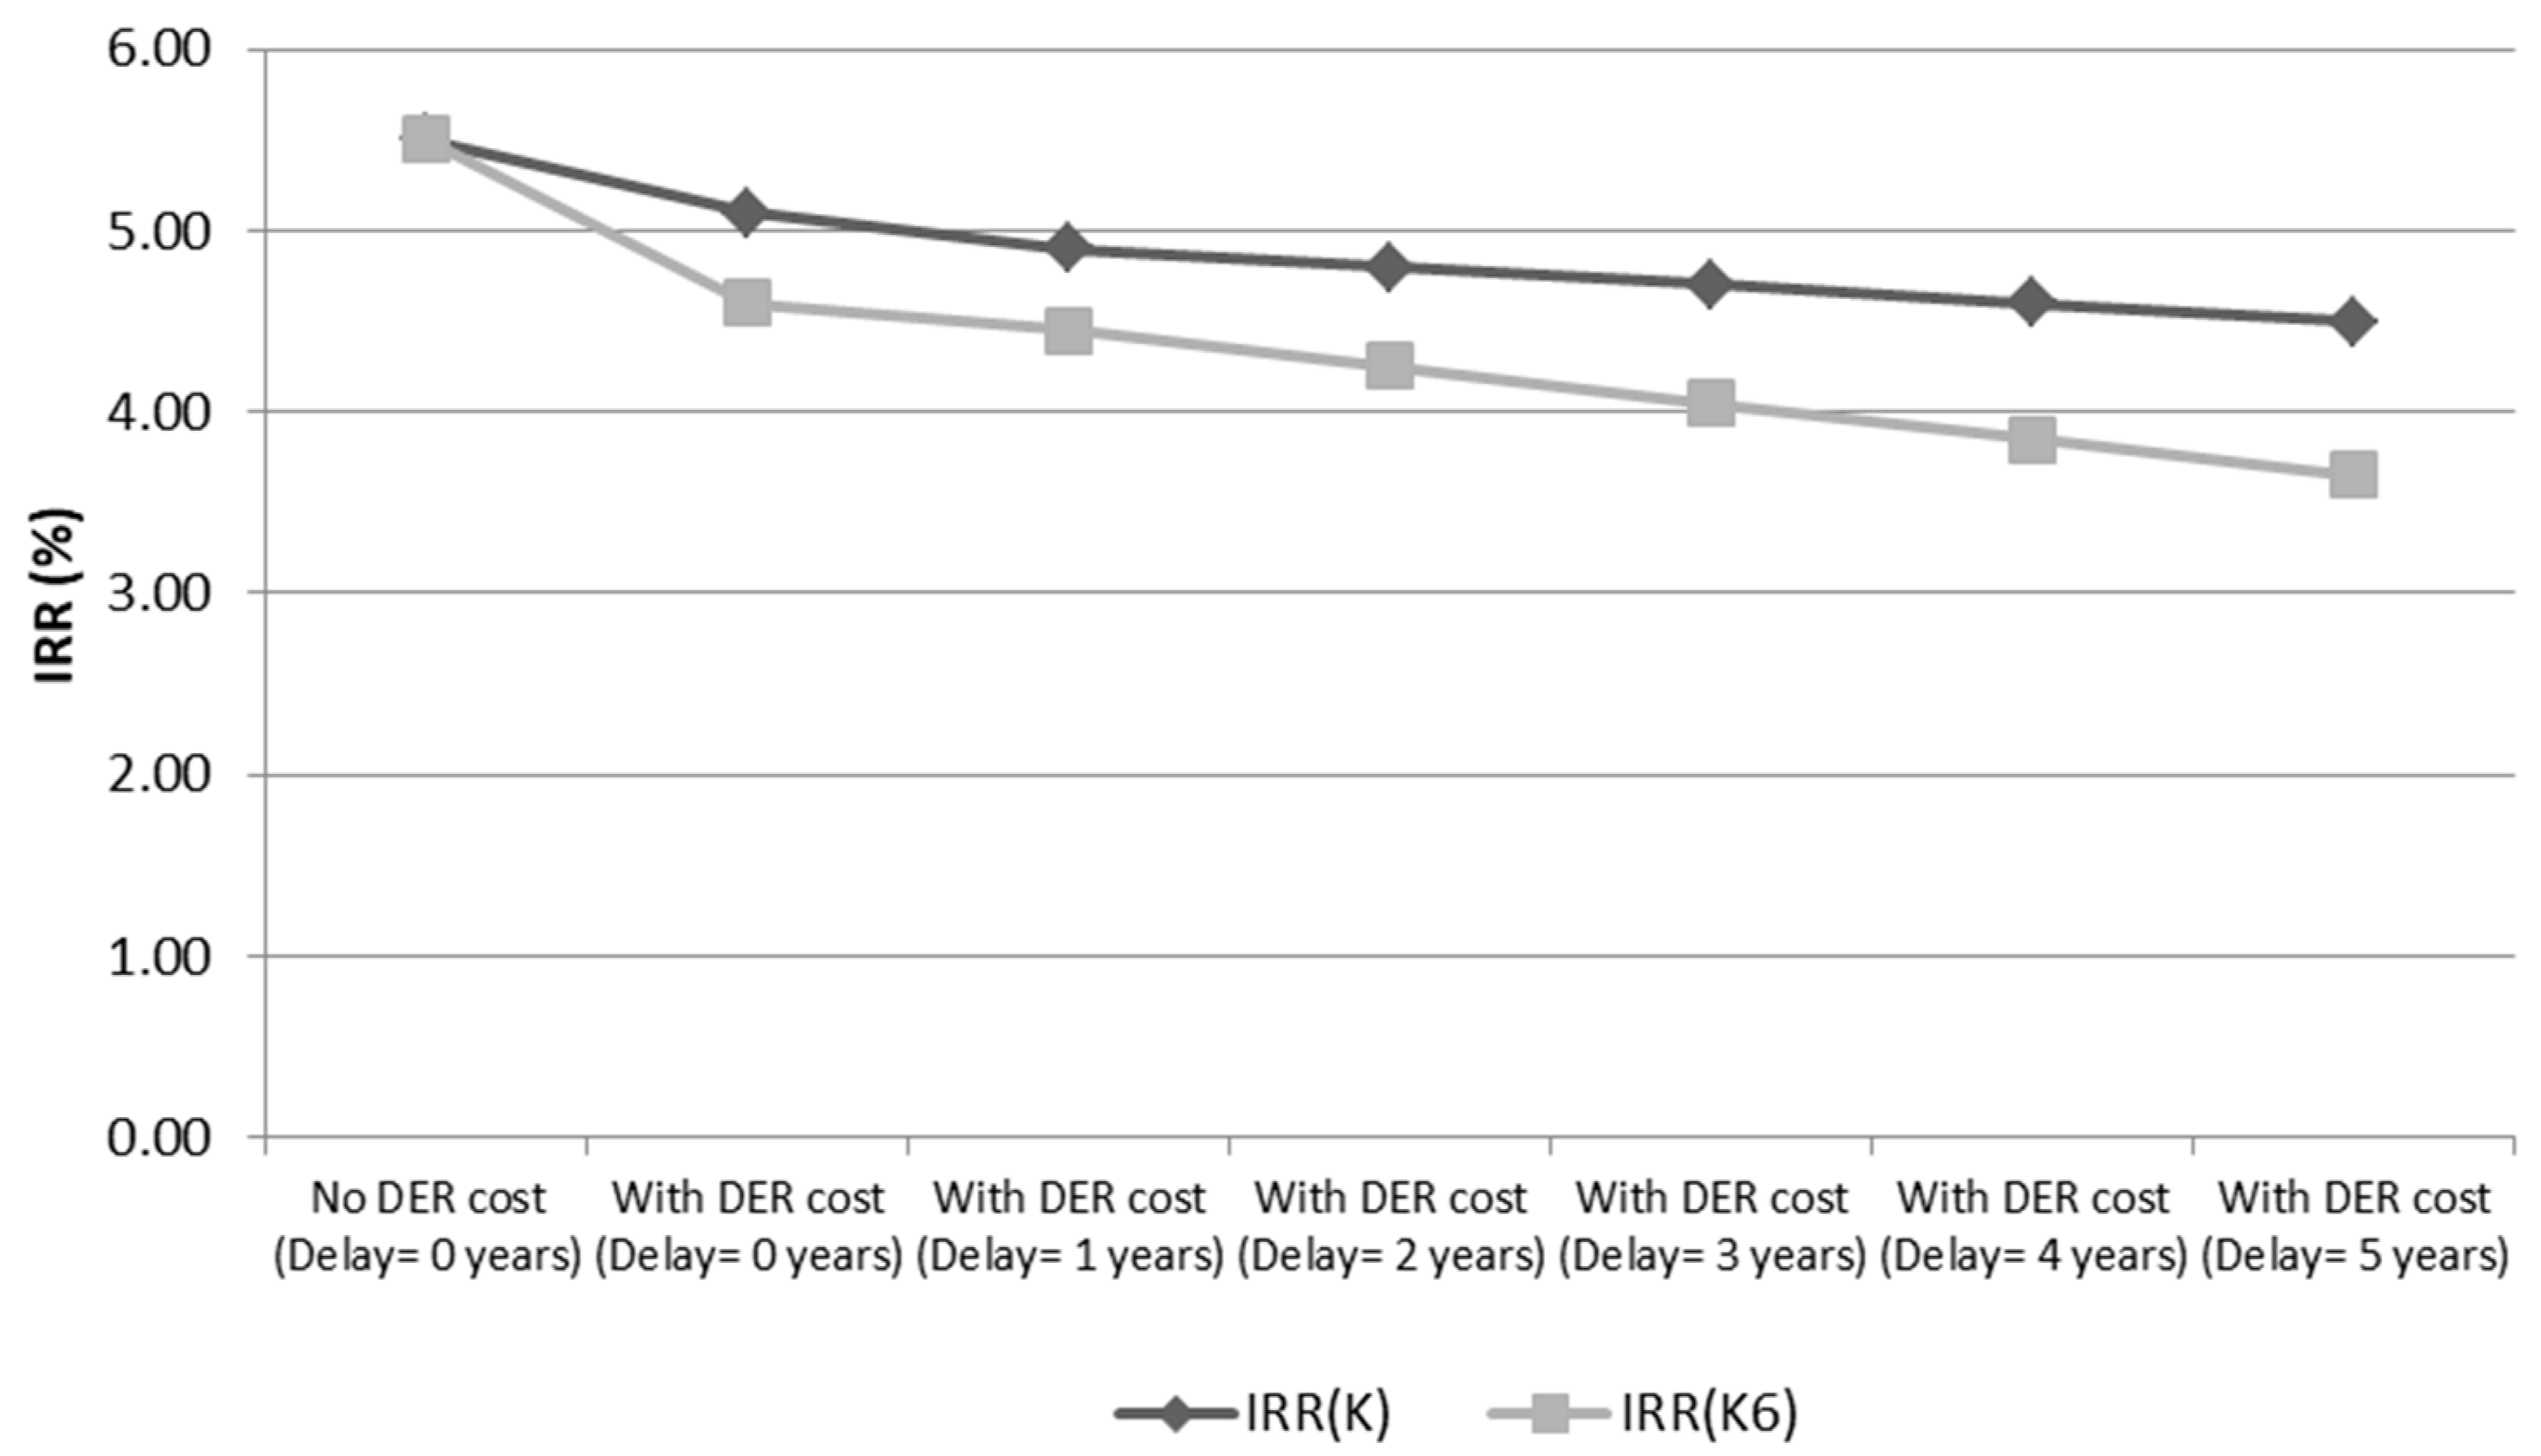
Figure 10 shows the seven scenarios designed to assess K and K6 investment: the first scenario does not consider the DER support, the second scenario considers DER support, and scenarios three to seven consider DER support and a progressive investment delay from one to five years.
To cover the NDP detected in K transformation for 2020, three DER will provide support to the distribution system. Regarding transformation K6, only one DER has enough power capacity to cover the NDP in 2020. The DER revenues were considered as part of the network project costs with an impact on his economic indicators (NPV, IRR and payback). Consequently, the graph can be interpreted as follows:
4. Conclusions
The proposed methodology improves the classic distribution network planning process by applying the integration of DER from the network perspective, making use of the information available thanks to the smart grid deployment.
As salient features, the developed methodology:
Improves the identification of critical scenarios of the existing distribution network (base case), in detail for each subsystem of the network analyzed;
Improves the evaluation of planning alternatives, including network development or reinforcement, but also the support of DER (DSS);
Checks, in economical and regulated terms, the network investment financial sustainability with DER ancillary services.
Moreover, the proposed methodology was successfully tested in a real distribution network with 450,000 delivery points on a geographical area of 5000 km2, where the zones in which new or existing DER will be more effective were identified.
The main result was the identification of a strategy to improve the current network knowledge, dividing it into subsystems to build the planning with specific base cases for each area and their corresponding needs (operation, type of consumption and generation). In a regulated distribution context, this new approach for planning was validated in economic terms considering new network infrastructure or DER integration to ease the decision-making process regarding the business plan of every involved agent.
Using the application of the proposed methodology to the case study, it was identified a window of opportunity for new flexible DER (generation or consumption) where a win–win situation can be met for both DSO and DER if the network access conditions can be agreed upon (lower network connection prices for DER) in a commitment-to-remain context to receive DSS requests and provide ancillary services to the network. Nevertheless, there is a need for regulation development in each country for DER flexible network access in order to enhance the DER capabilities to become an effective alternative versus network new reinforcements. On the other hand, under the DSO guidelines, it was corroborated that the DER auxiliary services related to the active power may support the distribution network operation in a timely and transitory way when an infrastructure failure is detected due to the delay in planned network investments, or during scheduled distribution maintenance tasks. As for reactive power, it is expected that they can also improve the control of voltage profiles and the management of network losses. In line with that, the proposed methodology can also be applied to identify and size the DER solution in the network areas where the reinforcement of the infrastructure is unaffordable for cost or environmental issues. This DER solution can be finally assigned or selected following a competitive selection process (such as capacity auctions) among the proposals covering the required features (location, active power, commitment, ancillary services, etc.).


 ,
, 


