Article

Coordination of Multiple Electric Vehicle Aggregators for Peak Shaving and Valley Filling in Distribution Feeders

by
Saad Ullah Khan
1,
Khawaja Khalid Mehmood
2,
Zunaib Maqsood Haider
3,
Muhammad Kashif Rafique
4,
Muhammad Omer Khan
5 and
Chul-Hwan Kim
6,*
1
Department of Electrical and Computer Engineering, Air University, Islamabad 44000, Pakistan
2
Department of Electrical Engineering, The University of Azad Jammu and Kashmir, Muzaffarabad 13100, Pakistan
3
Department of Electrical Engineering, The Islamia University of Bahawalpur, Bahawalpur 63100, Pakistan
4
Department of Electrical Engineering, Balochistan University of Engineering and Technology, Khuzdar 89100, Pakistan
5
Department of Electrical Engineering & Technology, Riphah International University, Faisalabad Campus, Punjab 38000, Pakistan
6
Department of Electrical and Computer Engineering, Sungkyunkwan University, Suwon 16419, Korea
*
Author to whom correspondence should be addressed.
Energies 2021, 14(2), 352; https://doi.org/10.3390/en14020352
Submission received: 21 December 2020 / Revised: 30 December 2020 / Accepted: 8 January 2021 / Published: 11 January 2021
(This article belongs to the Section F: Electrical Engineering)

Abstract

:
In this paper, a coordination method of multiple electric vehicle (EV) aggregators has been devised to flatten the system load profile. The proposed scheme tends to reduce the peak demand by discharging EVs and fills the valley gap through EV charging in the off-peak period. Upper level fair proportional power distribution to the EV aggregators is exercised by the system operator which provides coordination among the aggregators based on their aggregated energy demand or capacity. The lower level min max objective function is implemented at each aggregator to distribute power to the EVs. Each aggregator ensures that the EV customers’ driving requirements are not relinquished in spite of their employment to support the grid. The scheme has been tested on IEEE 13-node distribution system and an actual distribution system situated in Seoul, Republic of Korea whilst utilizing actual EV mobility data. The results show that the system load profile is smoothed by the coordination of aggregators under peak shaving and valley filling goals. Also, the EVs are fully charged before departure while maintaining a minimum energy for emergency travel.

1. Introduction

The demand for green technology is escalating due to the environmental concerns. Numerous developed countries are drafting novel policies to incorporate electric vehicles (EVs) in the transport sector [1]. With the higher influx of EVs, the present day uncoordinated charging process will overload the grid with problems such as undesirable peaks, distribution transformer stress, line congestion; increasing the system losses and voltage violations. Though some studies indicate that uncoordinated charging of EVs can be acceptable for 10% penetration [2]; their numbers more than that can have adverse impacts on the system.
Coordinated charging schemes have been proposed as a tentative solution where EVs are charged overnight in the off-peak hours, shifting the overloading conditions [3]. This process of charging EVs from the grid is called grid-to-vehicle (G2V). By shaving or shifting the peak load to off-peak periods, the power losses in the distribution system are reduced and the life of transformers is enhanced, improving the overall grid reliability. Also, the lower electricity prices in the off-peak period prove beneficial to the EV customers. Furthermore, EVs can be discharged to inject power back to the grid thus reducing the peak load. The active power injection by EVs to the grid is termed as vehicle-to-grid (V2G).
The EV related ancillary services call for adequate management and control strategies for prompt and efficient operation. Additionally, the prospective EV support in the mold of an aggregator can be well coordinated from the perspective of a smart grid. Various studies have proposed multiple EV aggregators coordination. Reference [4] proposed a multi EV aggregator schematic to minimize power imbalances in the system. The top-level power allocation to the aggregators has been executed in a simple manner based on the number of aggregators, without taking into account the number of EVs or their aggregated energy potential. In Reference [5], the authors have proposed the incorporation of EV aggregators to manage an EV based load frequency control. The vital aspect of EV availability at a given instant due its driving needs has been neglected. Reserve scheduling of EVs under multiple aggregators was proposed in Reference [6] to compensate the stochastic nature of renewables. It was discussed that the EV engagement in reserve provision can pose a threat to EV mobility requirements. Reference [7] also explored the utilization of EV aggregators to support the variable power output of the renewables. The motive of load variance minimization has not been considered.
In Reference [8], several EV parking lots operated by aggregators manage EV charging to reduce the peak load. Similarly, the authors in Reference [9] proposed peak load mitigation and load shifting through EV aggregator intermediaries utilizing a variable fair power allocation strategy. Although these studies have utilized EVs for load smoothing objective, the V2G operation has been overlooked.
Besides, in various studies, EVs are operated under a single central command. A fast water-filling based technique was employed in Reference [10] to smooth the load profile under various penetration of EVs at the low voltage transformer. Another scheme also incorporated EV discharging management apart from the charging load, to flatten the load curve [11]. Reference [12] successfully utilized a rule-based approach to achieve the objectives discussed in Reference [11]. The procedure to coordinate the prospects of a large number of EVs under multiple EV aggregators has not been investigated in these schemes.
Furthermore, the consideration of EV mobility to efficiently utilize their V2G/G2V application has not been sufficiently explored in the prior EV aggregator research [5,13,14]. Reference [13] models the fleet of EVs as single aggregated battery unit based on the combined capacity of all the EVs in the system. It is worth mentioning that the aggregated EV capacity will actually depend on the on-board available energy of the EV which is connected to the system for a specific time period. On the other hand, the assumption that 50% EV population is available to provide grid support at all times as discussed in Reference [14] could be a simplistic way to account for the stochastic behavior of large EV numbers.
Previously, a two-step approach was proposed to establish the EV power allocation by the aggregators in Reference [15]. The scheme designated variable power references to the low level EV chargers (within their power rating). As such, the practical implementation of such a scheme would pose difficulties due to the requirement of variable power output for low power EV chargers and could prove economically unfeasible.
The motive of this research is to establish coordination among multiple EV aggregators to flatten the demand profile of the distribution network through V2G/G2V approach. Special consideration is given to the essential role of low power EV charger output and the overall scheme is fashioned to accommodate this requirement. The proposed scheme uses a single level discrete power charging/discharging mechanism better suited for mains outlet available at residential level. The proposed strategy pursues the goals of peak demand minimization and valley filling whilst vital importance is given to the stochastic EV mobility patterns. The driving requirements of EV owners are not sacrificed for grid support. The objectives are implemented in the form of a hierarchical control flow better suited to the smart grid context [16]. The three layers of the hierarchy are top level distribution system operator (DSO), secondary level EV aggregators and bottom level EVs. The two-level coordination scheme algorithm is implemented at the DSO and aggregators. The DSO calculates the deviation of load demand from the target value and distributes the power to the aggregators under its domain based on fair proportional distribution of the aggregated energy. Afterward, each aggregator allocates power to all the EVs under its supervision by implementing an objective function which tends to minimize the maximal on-board energy of the EVs during V2G. In contrast, during G2V the maximal required energy is minimized by the objective function.
The proposed two-level technique has been applied on radial feeders. The scheme operation has been verified on IEEE 13-node distribution feeder and Korea Electric Power Corporation (KEPCO) X S/S - Z D/L feeder. Various indices have been defined to measure the performance of the method. The key contributions of this paper can be summarized as follows:
  • Development of an on-line multi EV aggregator coordination scheme which is better suited to administer the incoming/outgoing EVs at smaller intervals. The proposed scheme is rigorous in its approach as it integrates the key objectives of aggregator coordination, load leveling and EV mobility to function in a compatible manner.
  • Since the scheme is developed for low power level residential chargers, the power allocation to EVs is constant based on the charger’s rated power. Hence, the variable power allocation complexity is averted.
The rest of the paper is organized as follows. Section 2 elaborates the EV architecture with regards to EV mobility and state of charge (SoC) calculation. In Section 3, the proposed aggregator coordination scheme is demonstrated with its various steps. Section 4 states the test cases for simulation. The results are presented in Section 5. A discussion about various results is given in Section 6. Finally, the conclusion is drawn in Section 7.

2. EV Architecture

This section describes the modeling of EVs with respect to their mobility and architecture. The arrival time and the daily driving distance of EVs has been determined using Gaussian probability distribution functions. The arrival times t A r r of EVs are determined as follows:
f ( t A r r , μ A r r , σ A r r ) = 1 σ A r r 2 π e ( t μ A r r ) 2 2 σ A r r 2 × 1 Δ x ; t A r r > 0
where f ( t A r r , μ A r r , σ A r r ) is the probability density function of the arrival time of the EV, t is the index of time slots, Δ x is the length of one time slot, μ A r r is the mean value of the arrival time and σ A r r is the standard deviation. In the same manner, the daily trip distances d of EVs are calculated as:
f ( d , μ d , σ d ) = 1 σ d 2 π e ( t μ d ) 2 2 σ d 2 ; d > 0 ,
where f ( t d , μ d , σ d ) is the probability density function of the driving distance of the EV, μ d is the mean value of the distance and σ d is the standard deviation. The departure time t D e p of the EVs has been determined by utilizing Monte Carlo simulations [17].
The value of the percentage EV SoC represented by ζ E V ( i , j ) is updated to the corresponding aggregator at each time slot as stated by Equation (3):
ζ E V ( i , j ) ( t ) = ζ E V ( i , j ) ( t 1 ) + P E V ( i , j ) ( t ) ε E V ( i , j ) T Δ x 60 ,
where P E V ( i , j ) ( t ) is the power of the EV at t-th time slot and ε E V ( i , j ) T is the rated battery capacity which is forwarded to the aggregator when the EV is plugged-in.

3. Peak Shaving and Valley Filling Scheme for Aggregators

3.1. Calculation of Power Deviation

The initial step in the overall process is to compute the deviation of power P d e v from the target load profile P r e f . In this study, the target load profile is the average curve of the daily load profile of the system. For instance, Figure 1 shows the load profile trend of Republic of Korea. The summer season load profile has been considered, as it presents a worst case scenario: the minimum and maximum load demand variation is highest in the summer season [18].
Based on the the Figure 1, the intersection of the target curve with the load profile gives the peak and off-peak periods. The proposed scheme tends to minimize the peak load during the peak period by discharging the EVs. On other hand, EV charging fills the valley during the off-peak period. The P d e v is given by:
P d e v = P r e f P l o a d
where P l o a d is the total feeder load. The job at the DSO level is to distribute the P d e v among the aggregators at each time slot t and the total time slots in a 24 h day is T.

3.2. Power Allocation to EV Aggregators

The power allocated to j-th aggregator is based on the combined potential or requirements of the EVs under its domain. Initially the aggregated battery variable (ABV) represented by ε for each aggregator is computed. The required ABV ε N E V ( j ) R is given by Equation (5), where N E V ( j ) is the number of EVs in the aggregator:
ε N E V ( j ) R = i = 1 N E V ( j ) ε E V ( i , j ) T ε E V ( i , j ) A v l ,
where i is the index of EVs, and ε E V ( i , j ) A v l is the available battery capacity. The available ABV ε N E V ( j ) A which exhibits the energy potential of the aggregator is computed as:
ε N E V ( j ) A = i = 1 N E V ( j ) ε E V ( i , j ) T × ζ E V ( i , j ) .
Henceforth, the power P A G ( j ) allocated to each aggregator is calculated as given below by utilizing proportional fair distribution:
During charging when P d e v > 0 :
P A G ( j ) G 2 V = ε N E V ( j ) R j = 1 N A G ε N E V ( j ) R × P d e v ,
During discharging when P d e v < 0 :
P A G ( j ) V 2 G = ε N E V ( j ) A j = 1 N A G ε N E V ( j ) A × P d e v .
where N A G is the sum total of EV aggregators in the system.

3.3. Power Allocation to EVs under Each Aggregator

Once, each EV aggregator acquires the power reference from the DSO, its job is to distribute that power to all the EVs under its domain while making sure that the driving requirements of the EVs are not compromised and they are completely charged before departure time in the morning. This process is repeated at each time slot t and the status of EVs such as their SoC and plug-in situation is constantly updated to the aggregator.

3.3.1. Objective Function

The following objective function is established for the charging and discharging scenario:
G 2 V ( P A G ( j ) > 0 ) min max ε E V ( i , j ) T ε E V ( i , j ) A v l ( t ) V 2 G ( P A G ( j ) < 0 ) min max ε E V ( i , j ) A v l ( t ) i 1 , , N E V ( j ) j 1 , , N A G .
In the case of charging, the objective function tends to minimize the maximal term ε E V ( i , j ) T ε E V ( i , j ) A v l ( t ) . Whereas, during the discharging action; the maximal term ε E V ( i , j ) A v l ( t ) is minimized. This way, the objective function has a tendency to charge the EVs with least available energy first, while it discharges the EVs with the most available energy in a monotonic manner.

3.3.2. Constraints

  • During the charging/discharging operation, the battery energy of an EV is maintained to be within the minimum battery capacity ε E V ( i , j ) min and ε E V ( i , j ) T . The minimum battery capacity constraint prevents the over-discharging of the EV and it also makes the EV capable for emergency travel. The minimum battery capacity refers to the amount of energy required to travel a specific distance and ζ E V ( i , j ) min is the corresponding minimum percentage SoC. This specific distance in this study corresponds to the average daily mileage for private cars in South Korea.
    ε E V ( i , j ) min ε E V ( i , j ) A v l ε E V ( i , j ) T ,
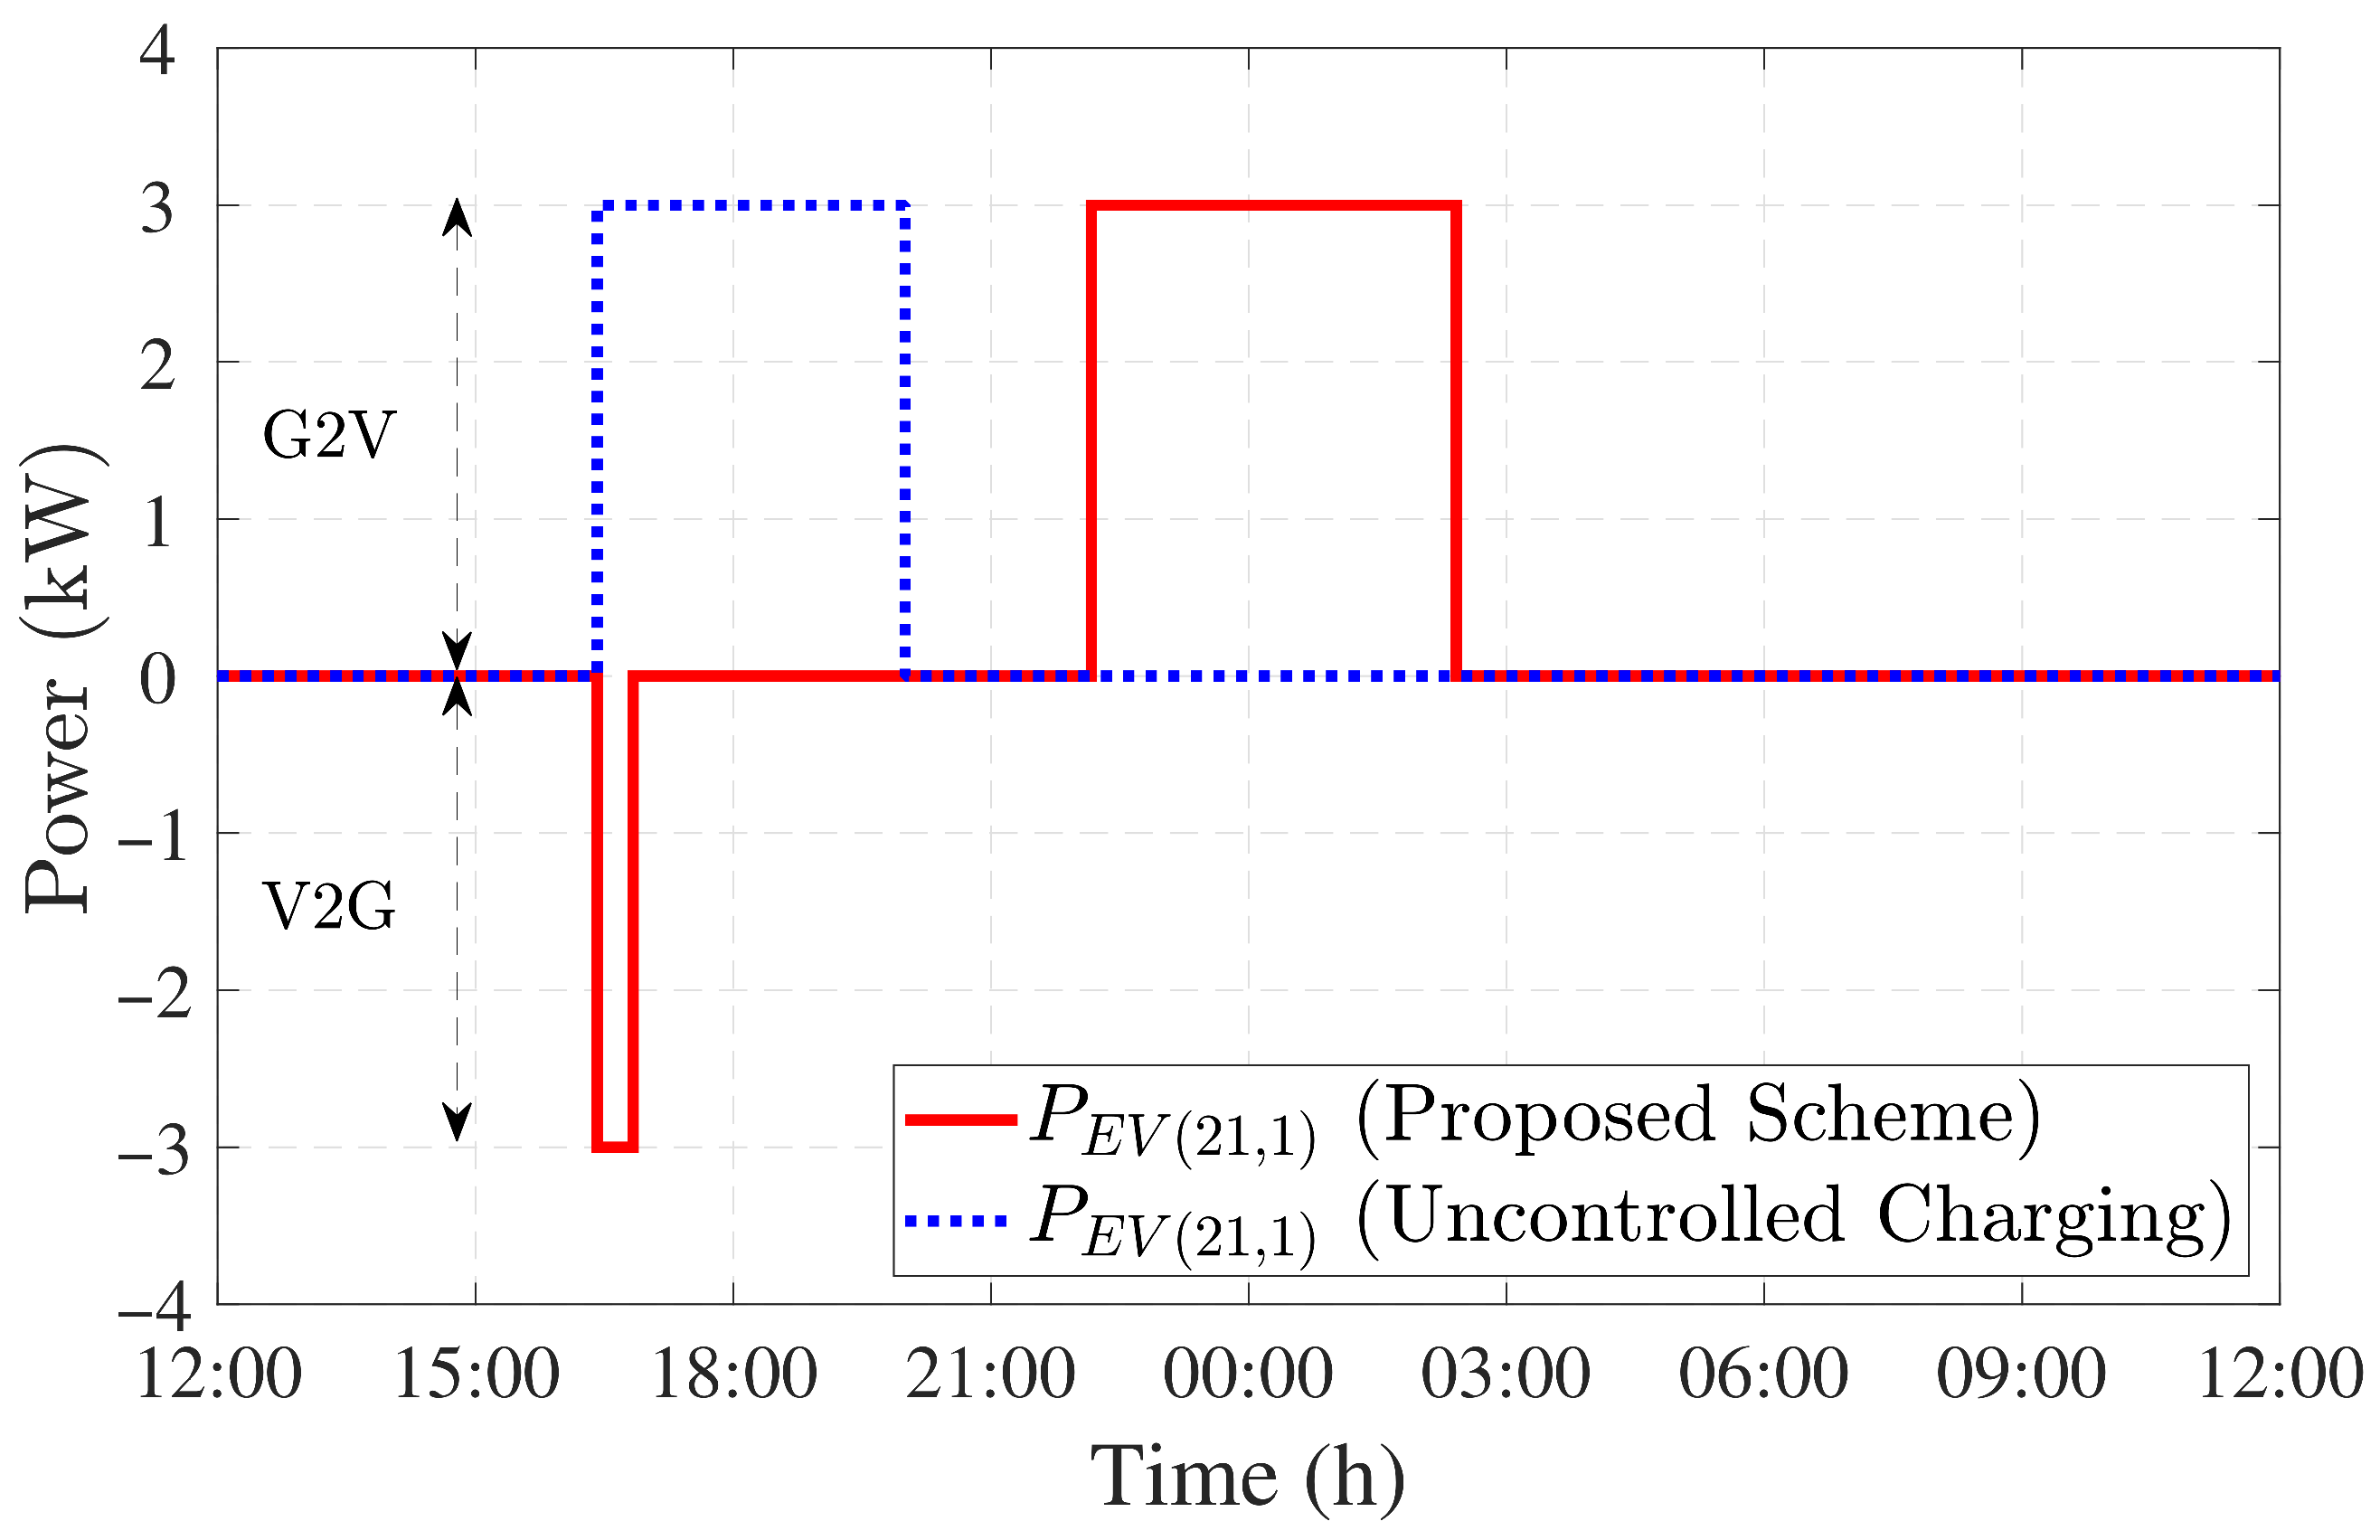
  • The whole V2G/G2V operation of an EV is constrained within its arrival time t E V ( j ) A r r and expected departure time t E V ( j ) D e p represented by:
    t t E V ( i , j ) A r r , t E V ( i , j ) D e p ,
  • When an EV is connected to the system according to Equation (11), the EV charging/discharging power based on the charger rating P E V T is:
    P E V ( i , j ) = P E V T during G 2 V and ζ E V ( i , j ) 100 % P E V T during V 2 G and ζ E V ( i , j ) ζ E V ( i , j ) min 0 otherwise .
  • The last constraint ensures that the total power provided or absorbed by all EVs within an aggregator does not exceed the allocated power of the aggregator by DSO.
    i = 1 N E V ( j ) | P E V ( i , j ) | | P A G ( j ) | ,
The net power transfer from the grid to the feeder with EV load incorporation is represented as:
P n e t = P l o a d + j = 1 N A G i = 1 N E V ( j ) P E V ( i , j ) .
The term P n e t represents the load profile of the feeder that has been smoothed by the V2G/G2V operation of the strategy implemented at each aggregator.

3.4. Control Process

The overall control of the scheme structure is represented in Figure 2. All the steps at each level of the scheme are executed during every time slot. With the propagation of smart grid technologies, the communication infrastructure will be enhanced and therefore, such communication links will enable the interaction of multiple entities at different levels of the system.

4. Simulation Cases

In this section, the simulation scenarios are outlined based on different distribution feeder environments. The duration of a time slot is 5 min. Thus, the total number of time slots during a 24 h daily period is 288.

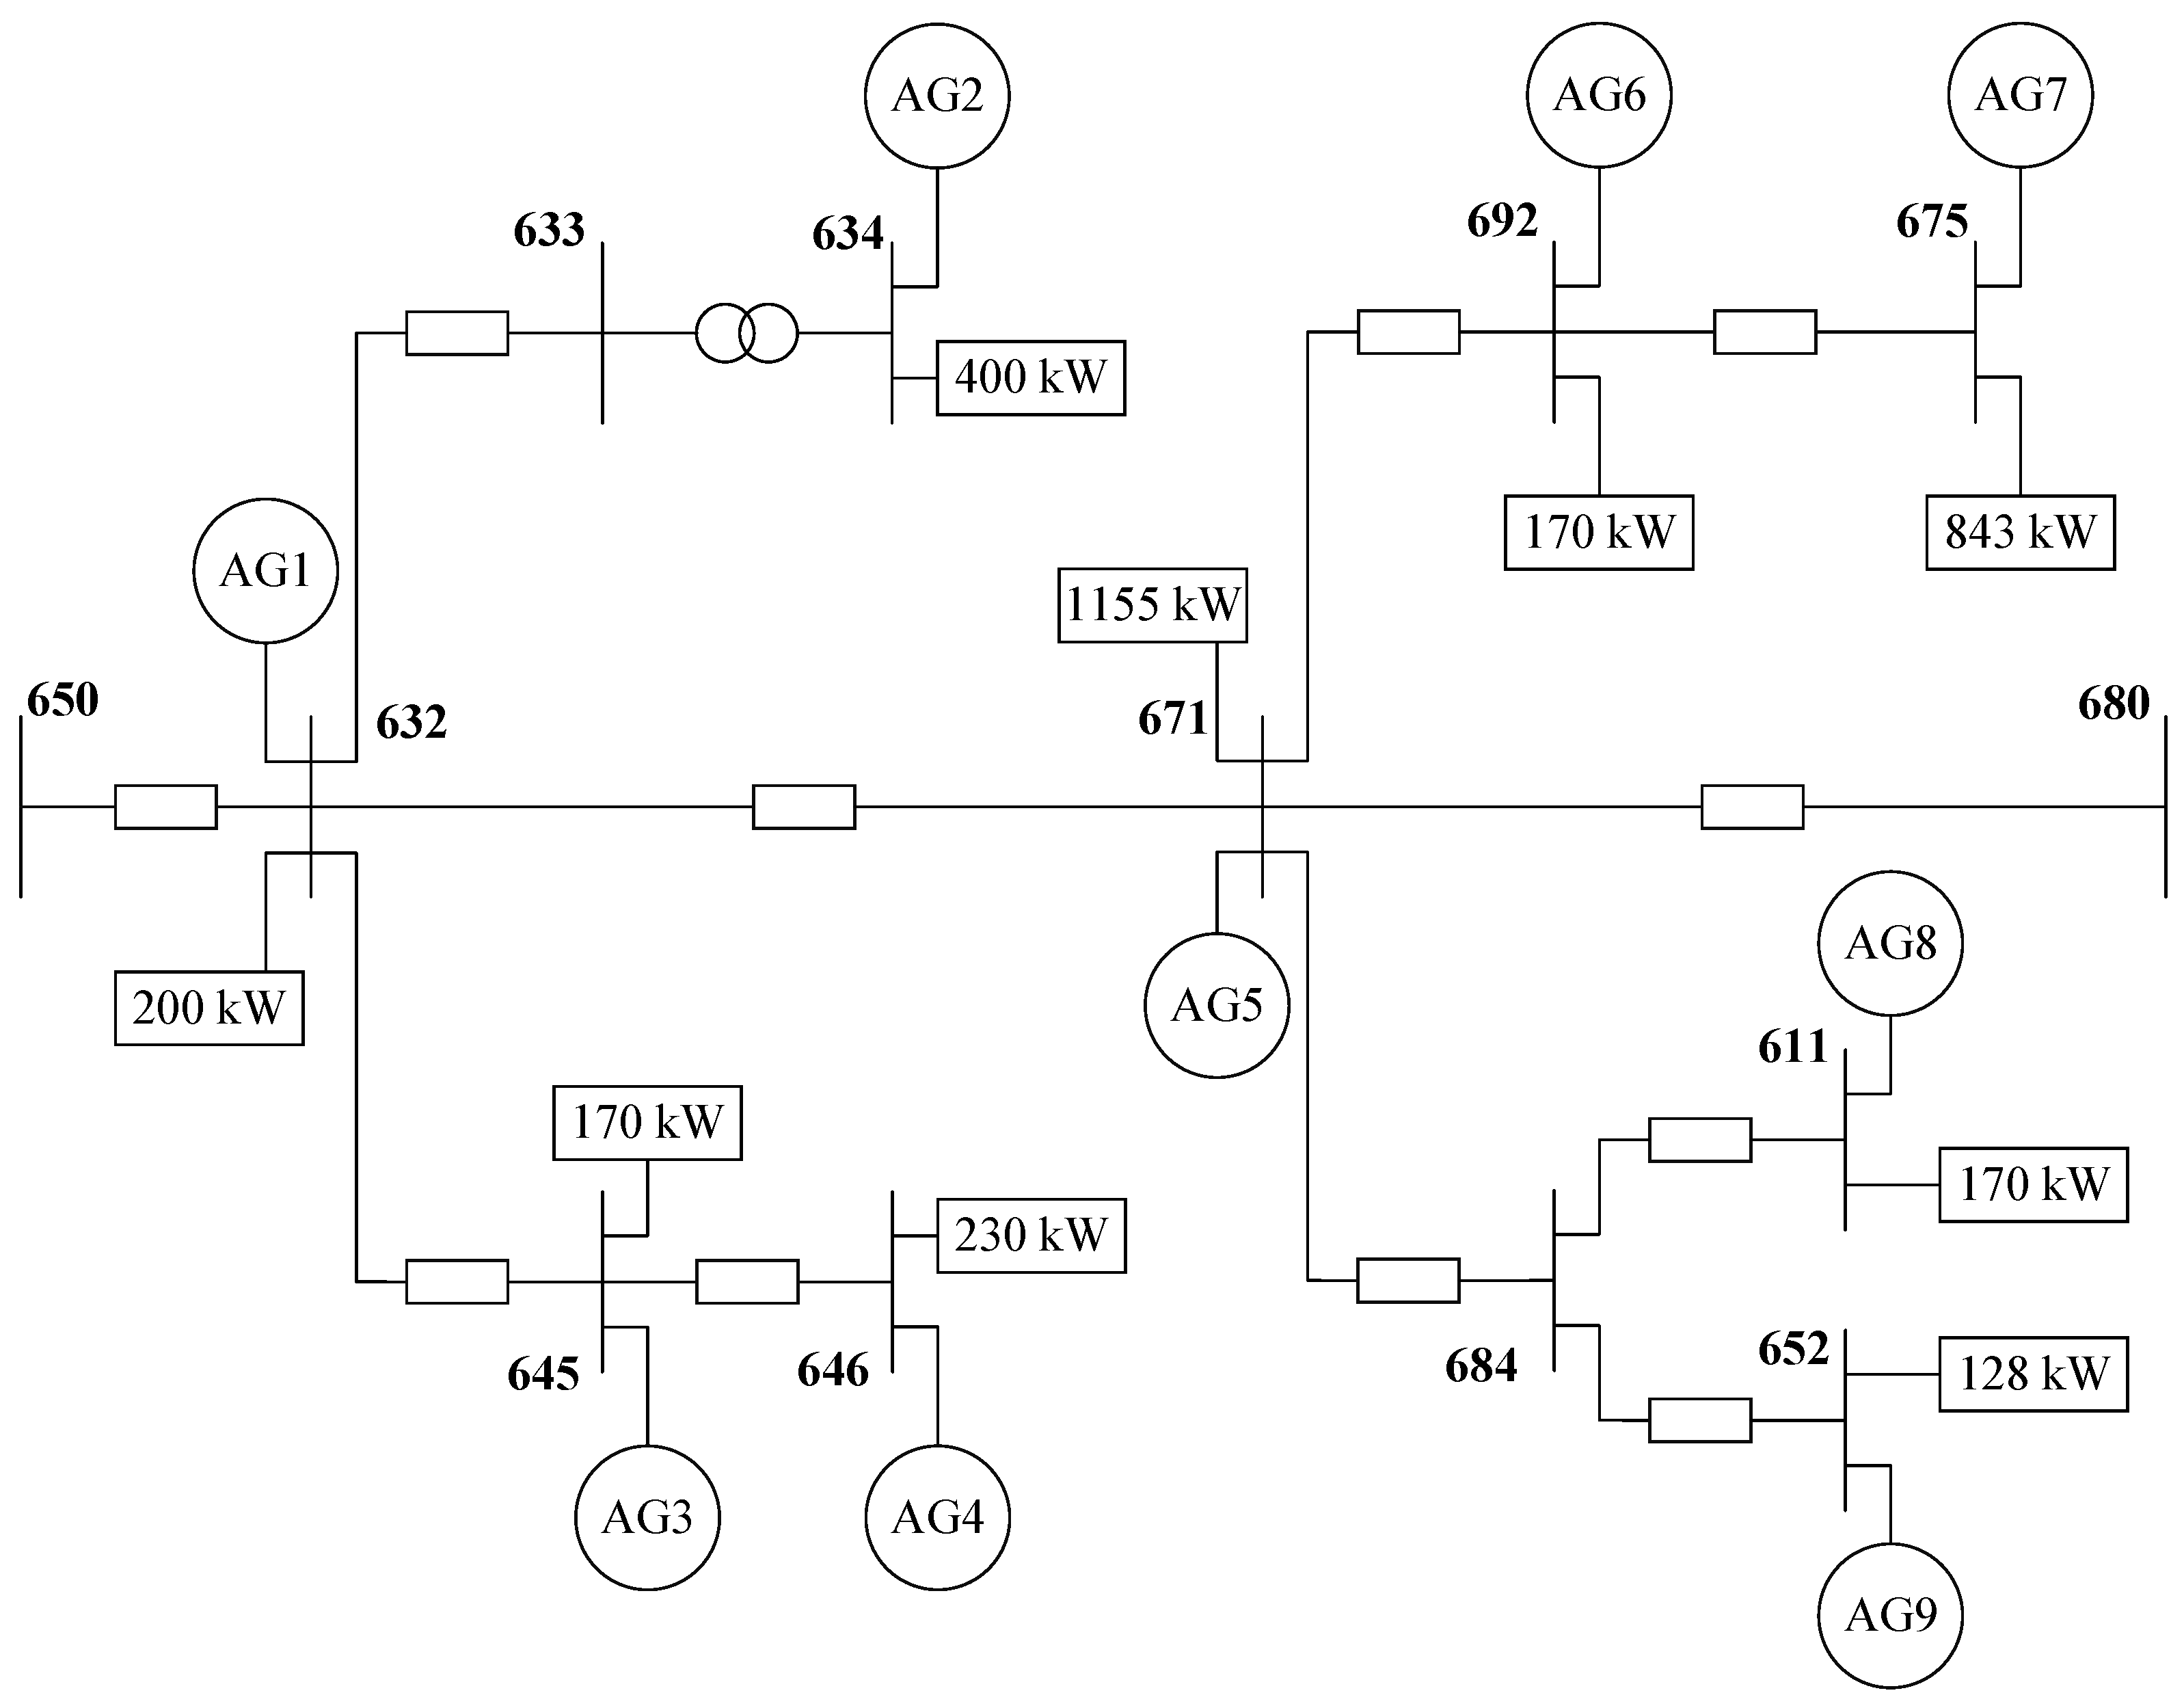
4.1. IEEE 13-Node Distribution Feeder

Initially, the proposed aggregator coordination strategy has been tested on the IEEE 13-node test distribution feeder. The detailed configuration of the feeder with respect to the load and its location on specific nodes is established in Reference [19]. The single-line representation of the feeder is illustrated in Figure 3.

EV Fleet

Since, the IEEE 13-node feeder is a test system, therefore data regarding the EV penetration is unavailable. Based on the methods considered in Reference [20], the number of EVs has been established for each load location which are supervised by the corresponding aggregator as stated in Table 1. The number of EVs within the aggregator is in accordance with the load penetration level at the node. The locations of aggregators in the feeder are shown in the Figure 3.

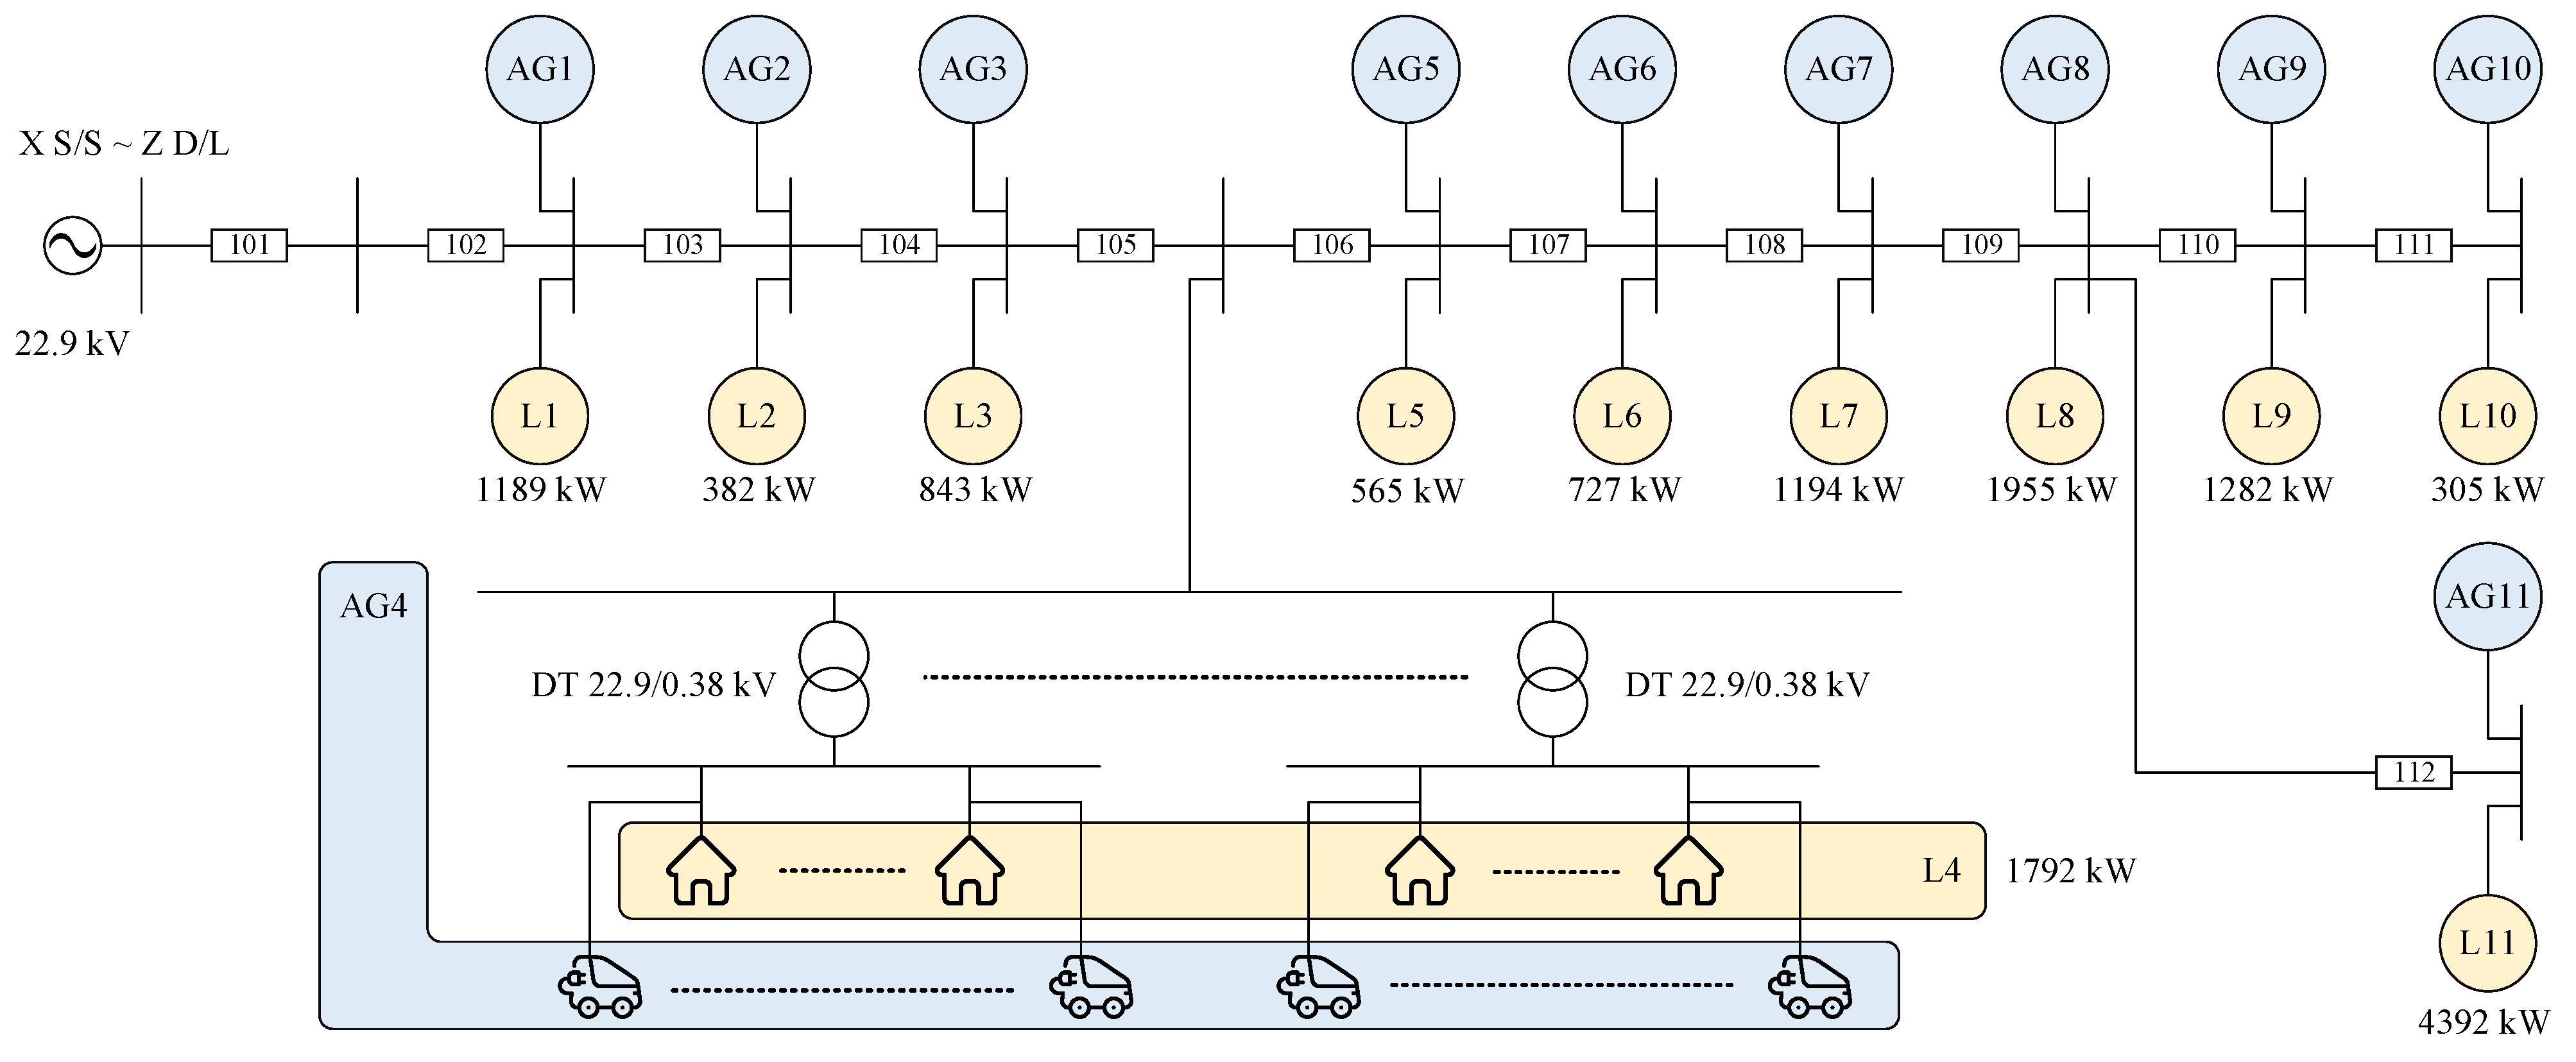
4.2. KEPCO X S/S-Z D/L Feeder

The performance of the scheme has also been verified on an actual distribution feeder, that is, KEPCO X S/S-Z D/L feeder, Seoul, Republic of Korea. The overall configuration of the feeder has been adopted from Reference [21] and shown in Figure 4.

EV Fleet

The number of EVs corresponding to each load location of the feeder has been established in Reference [20]. In this study, the entire EV fleet for that particular load location is supervised by the corresponding aggregator. Overall, there are 896 EVs in the feeder locality and they are divided under the command of the aggregators as stated by Table 2.

4.3. Performance Measuring Indices
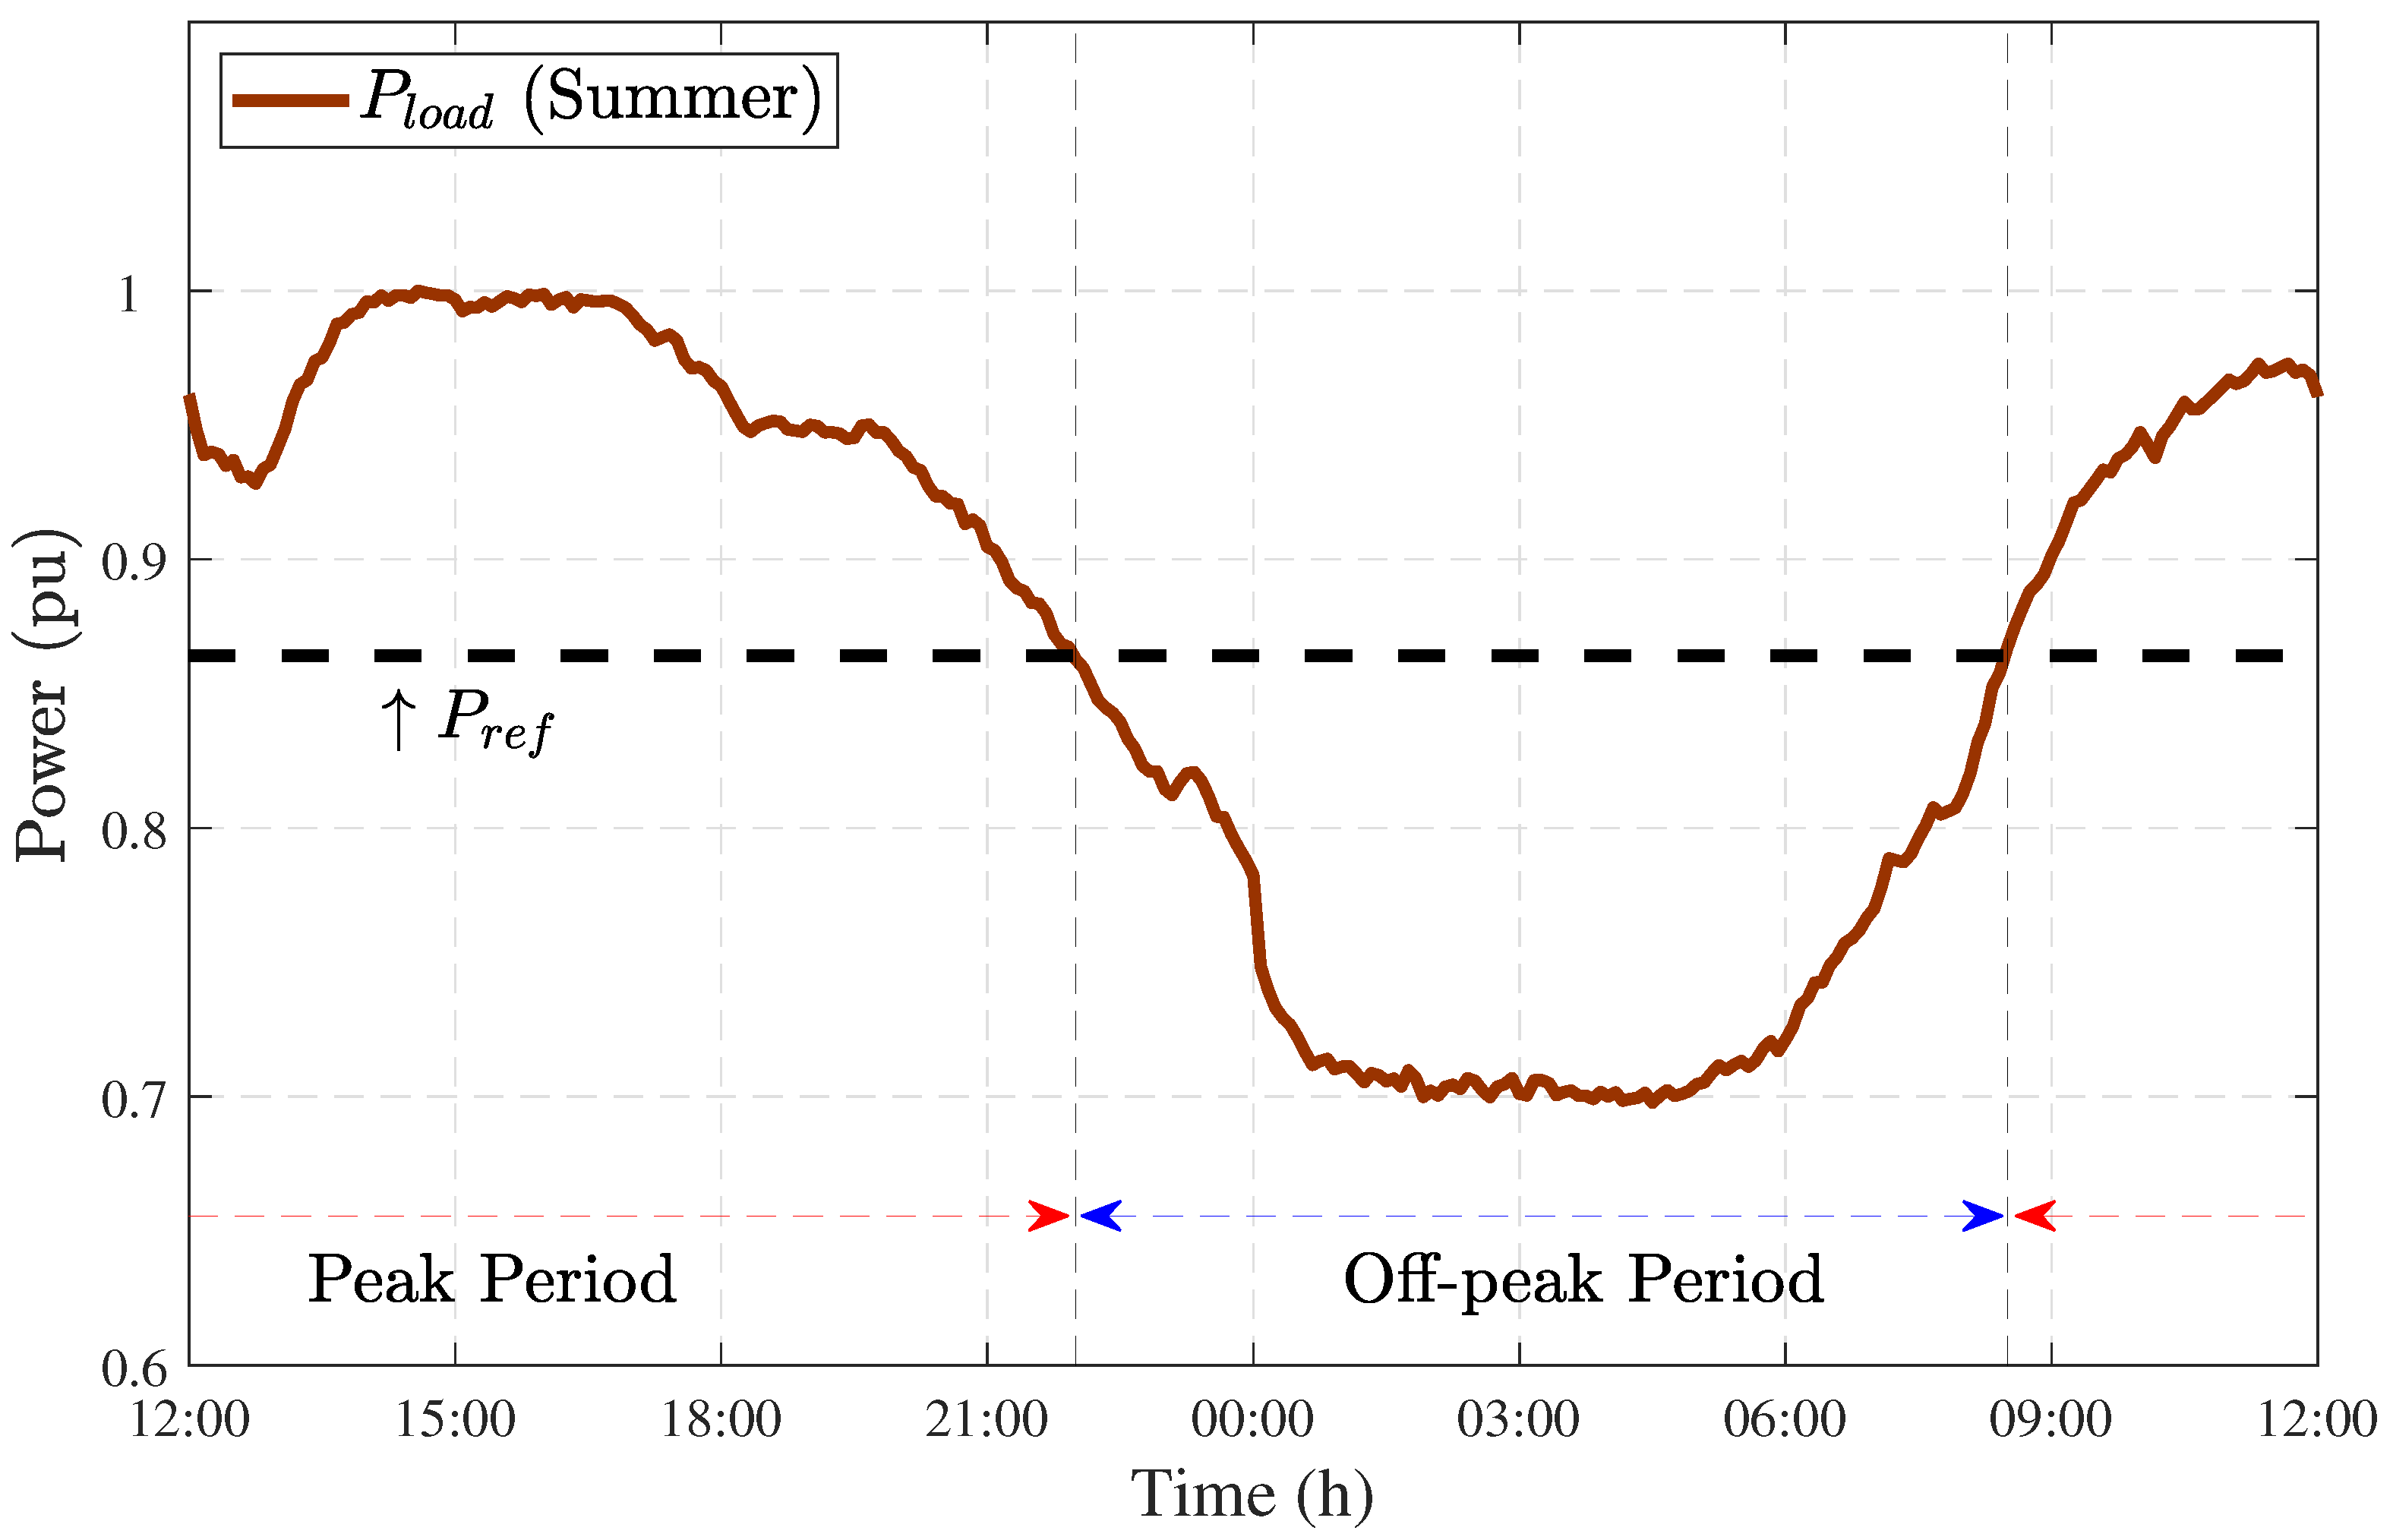
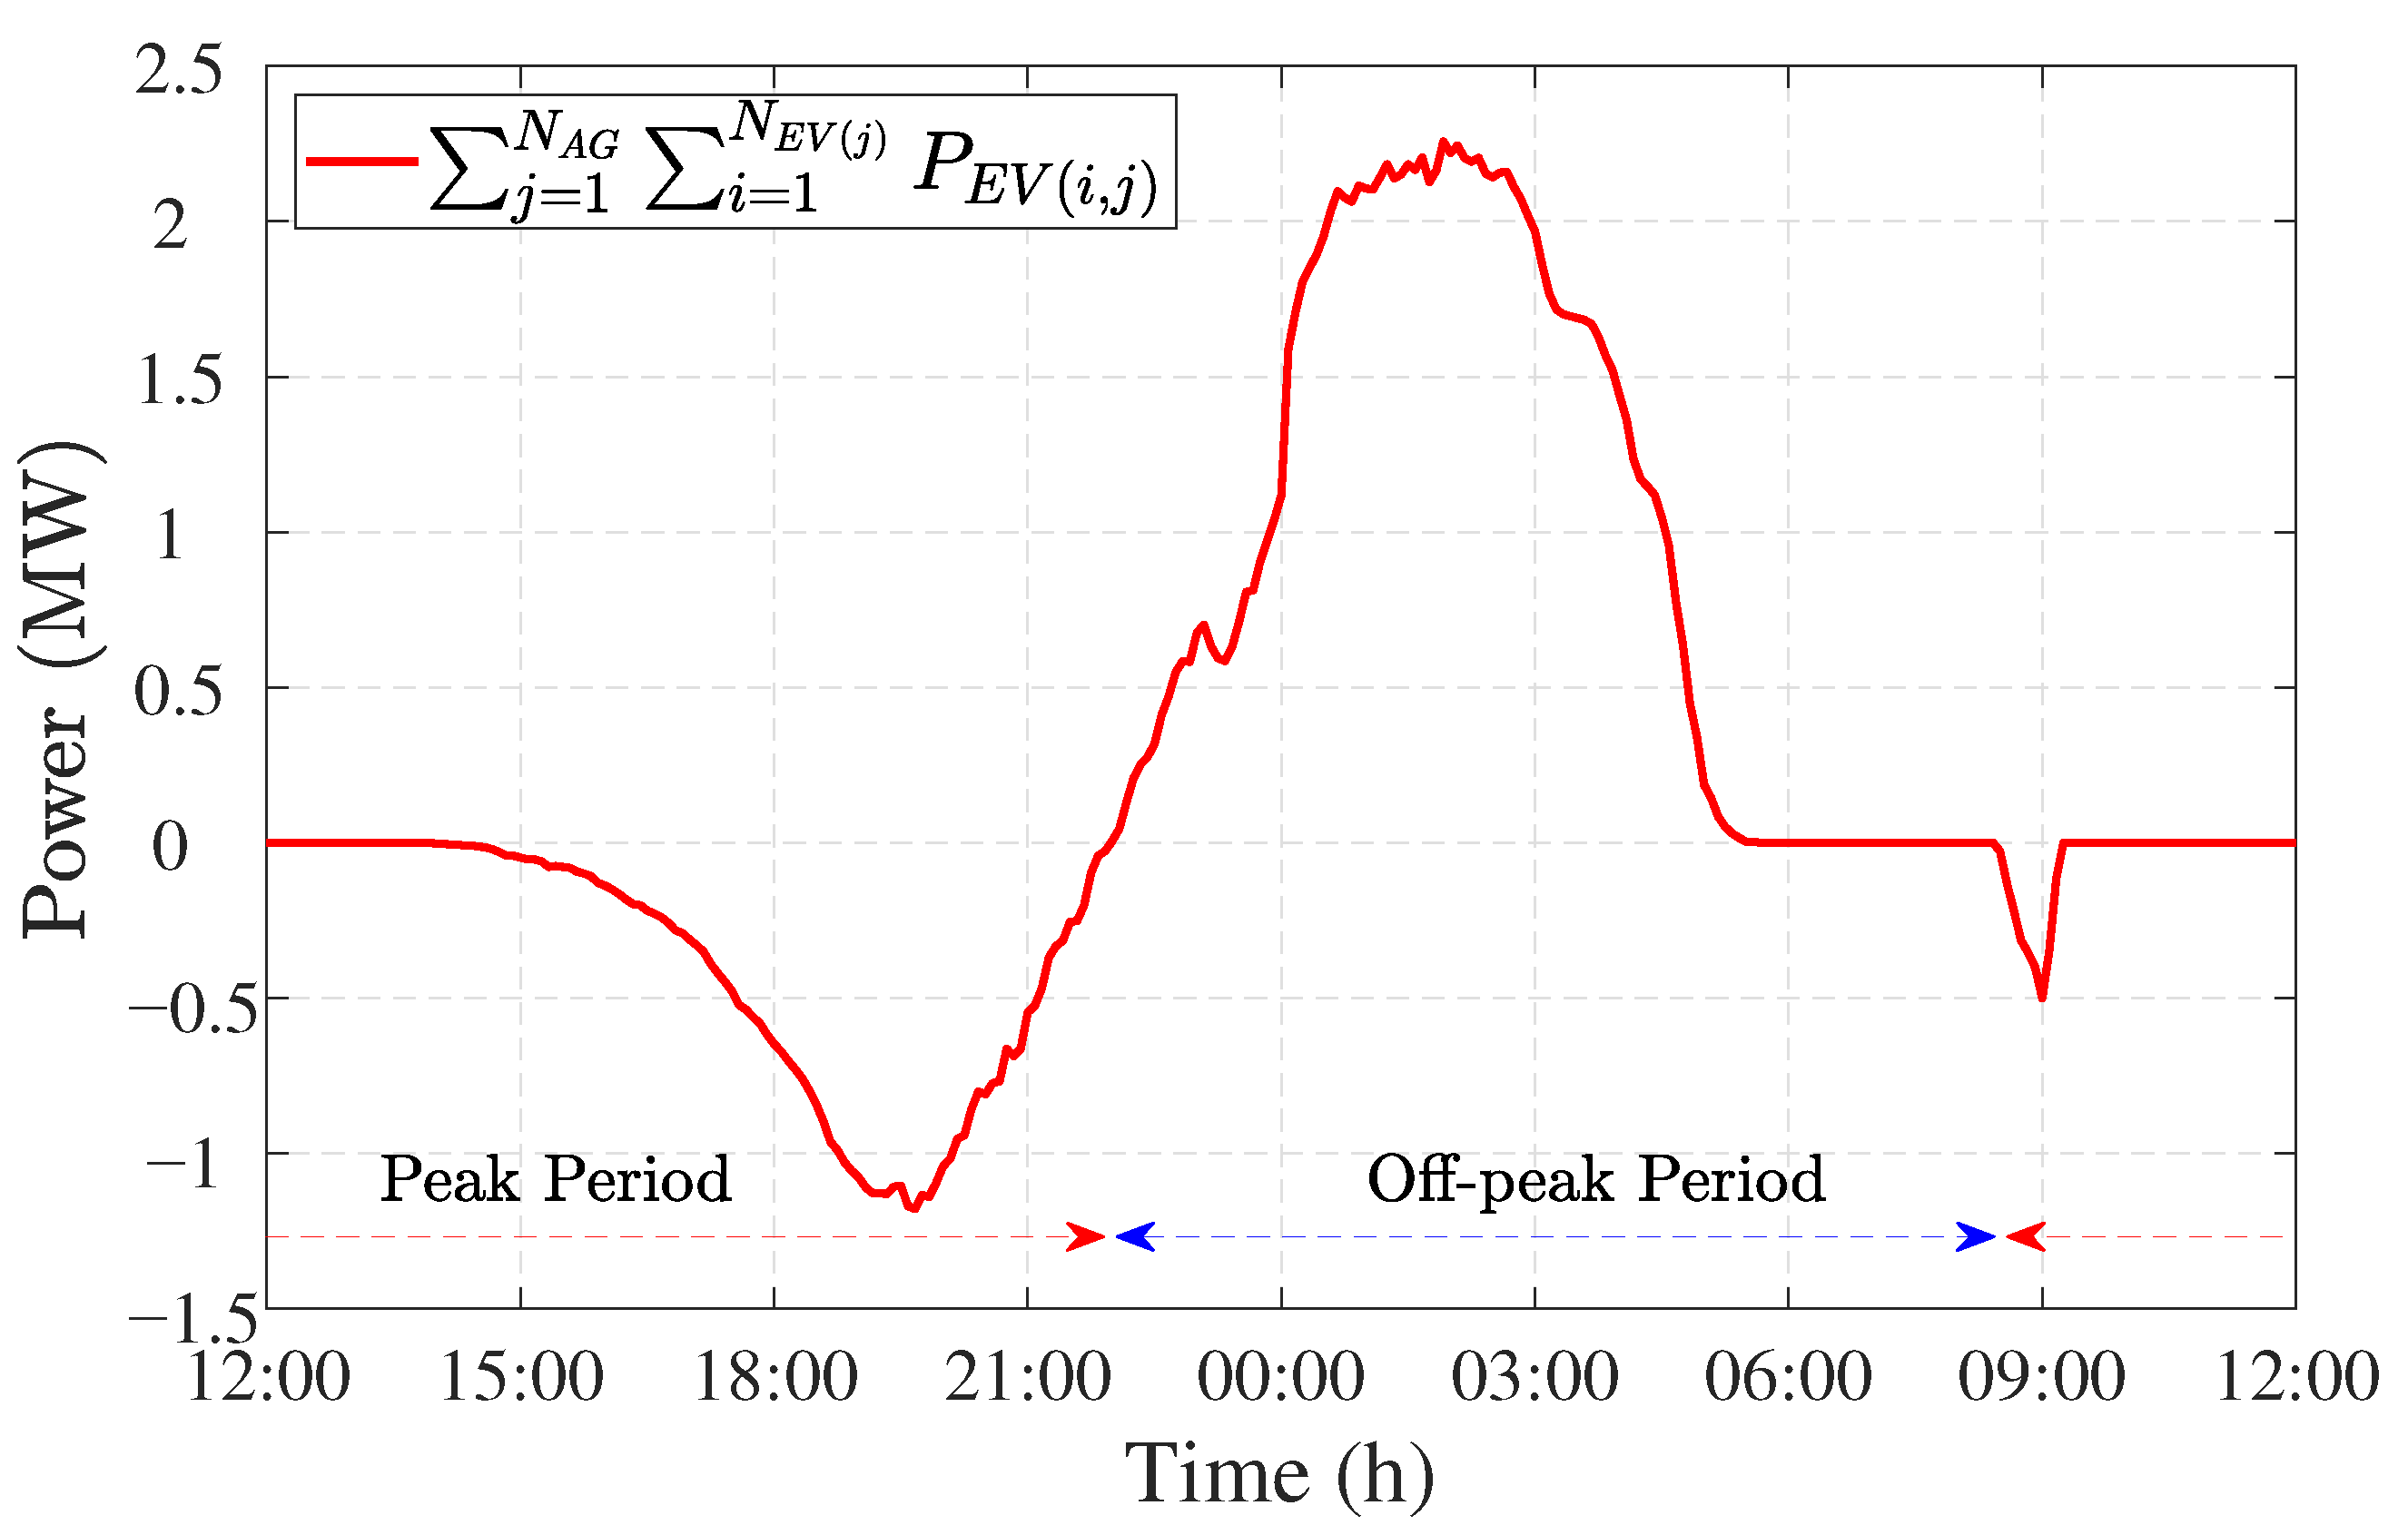
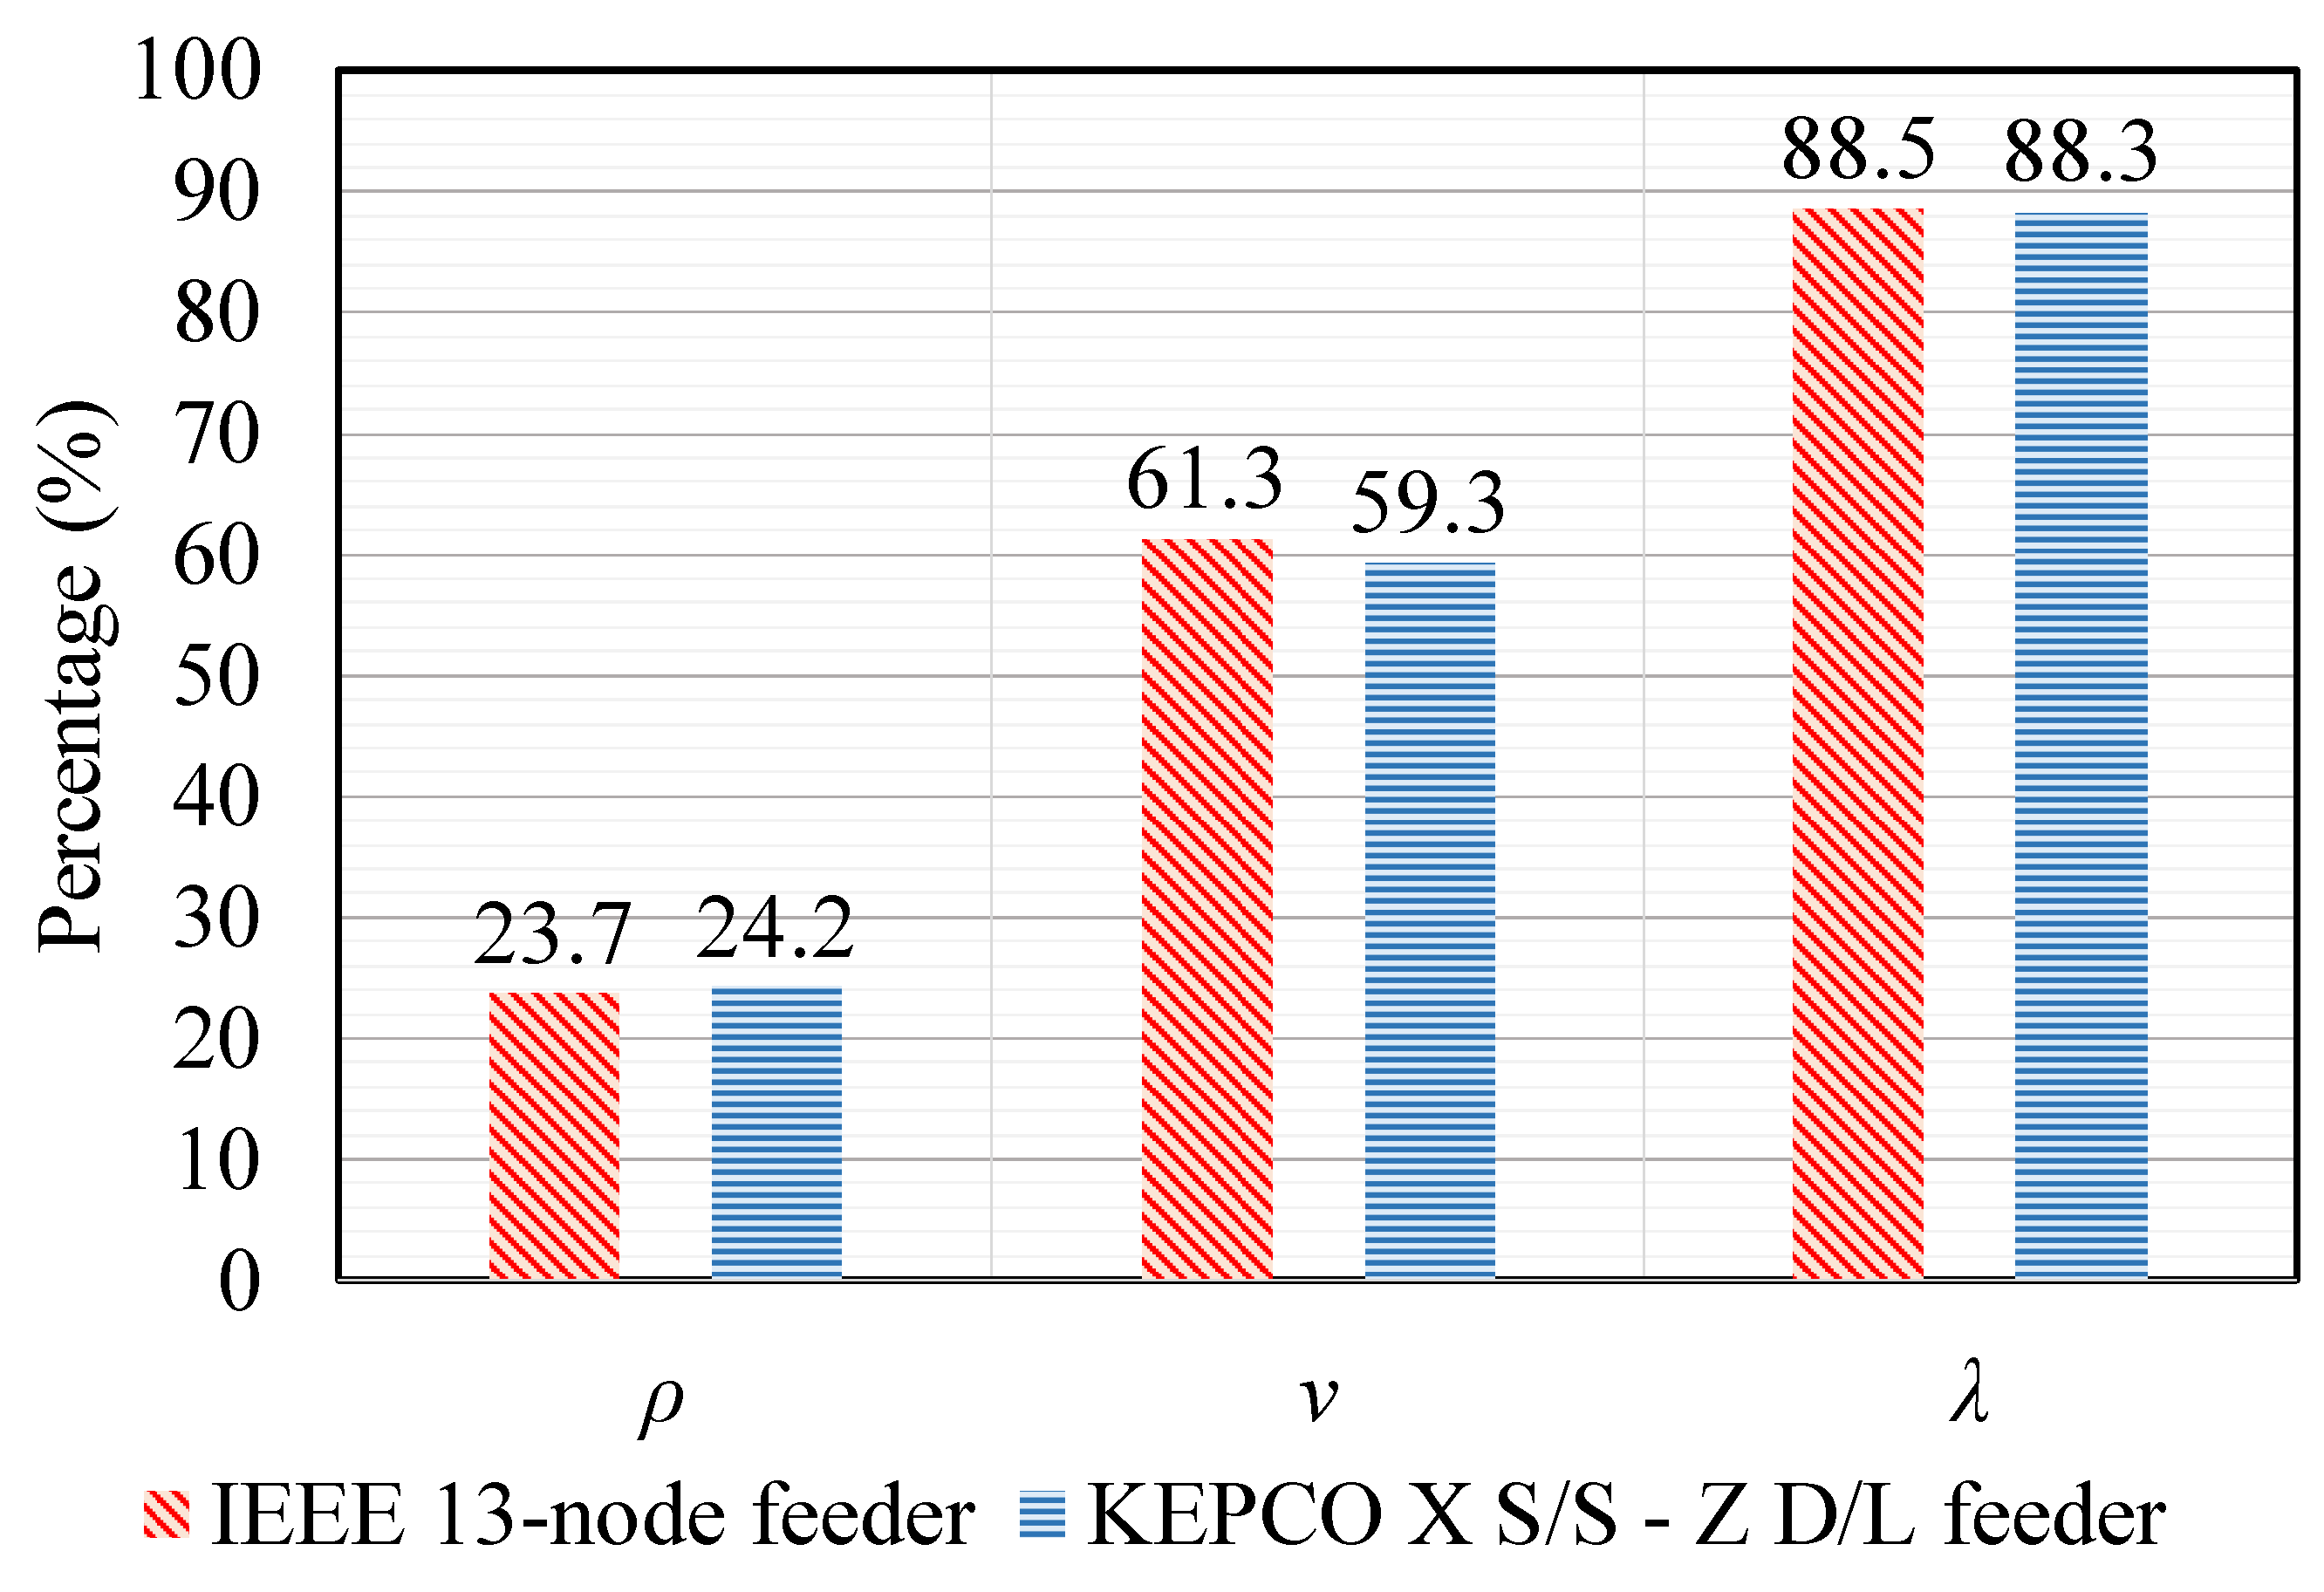
The performance of the scheme is evaluated by the following indices:
  • Peak shaving index ρ gives the ratio of the total energy shaved to the total energy expected to be shaved by the EVs in the feeder during peak period:
    ρ ( % ) = j = 1 N A G i = 1 N E V ( j ) t P K S t P K E P E V ( i , j ) ( t ) d t t P K S t P K E P d e v ( t ) d t × 100 ,
    where t P K S and t P K E are the starting and ending time of the peak period.
  • Valley filling index υ indicates the ratio of the total energy absorbed to the overall energy anticipated to be absorbed by the EVs in the feeder during off-peak period:
    υ ( % ) = j = 1 N A G i = 1 N E V ( j ) t V L S t V L E P E V ( i , j ) ( t ) d t t V L S t V L E P d e v ( t ) d t × 100 ,
    where t V L S and t V L E are the starting and ending time of the off-peak valley period.
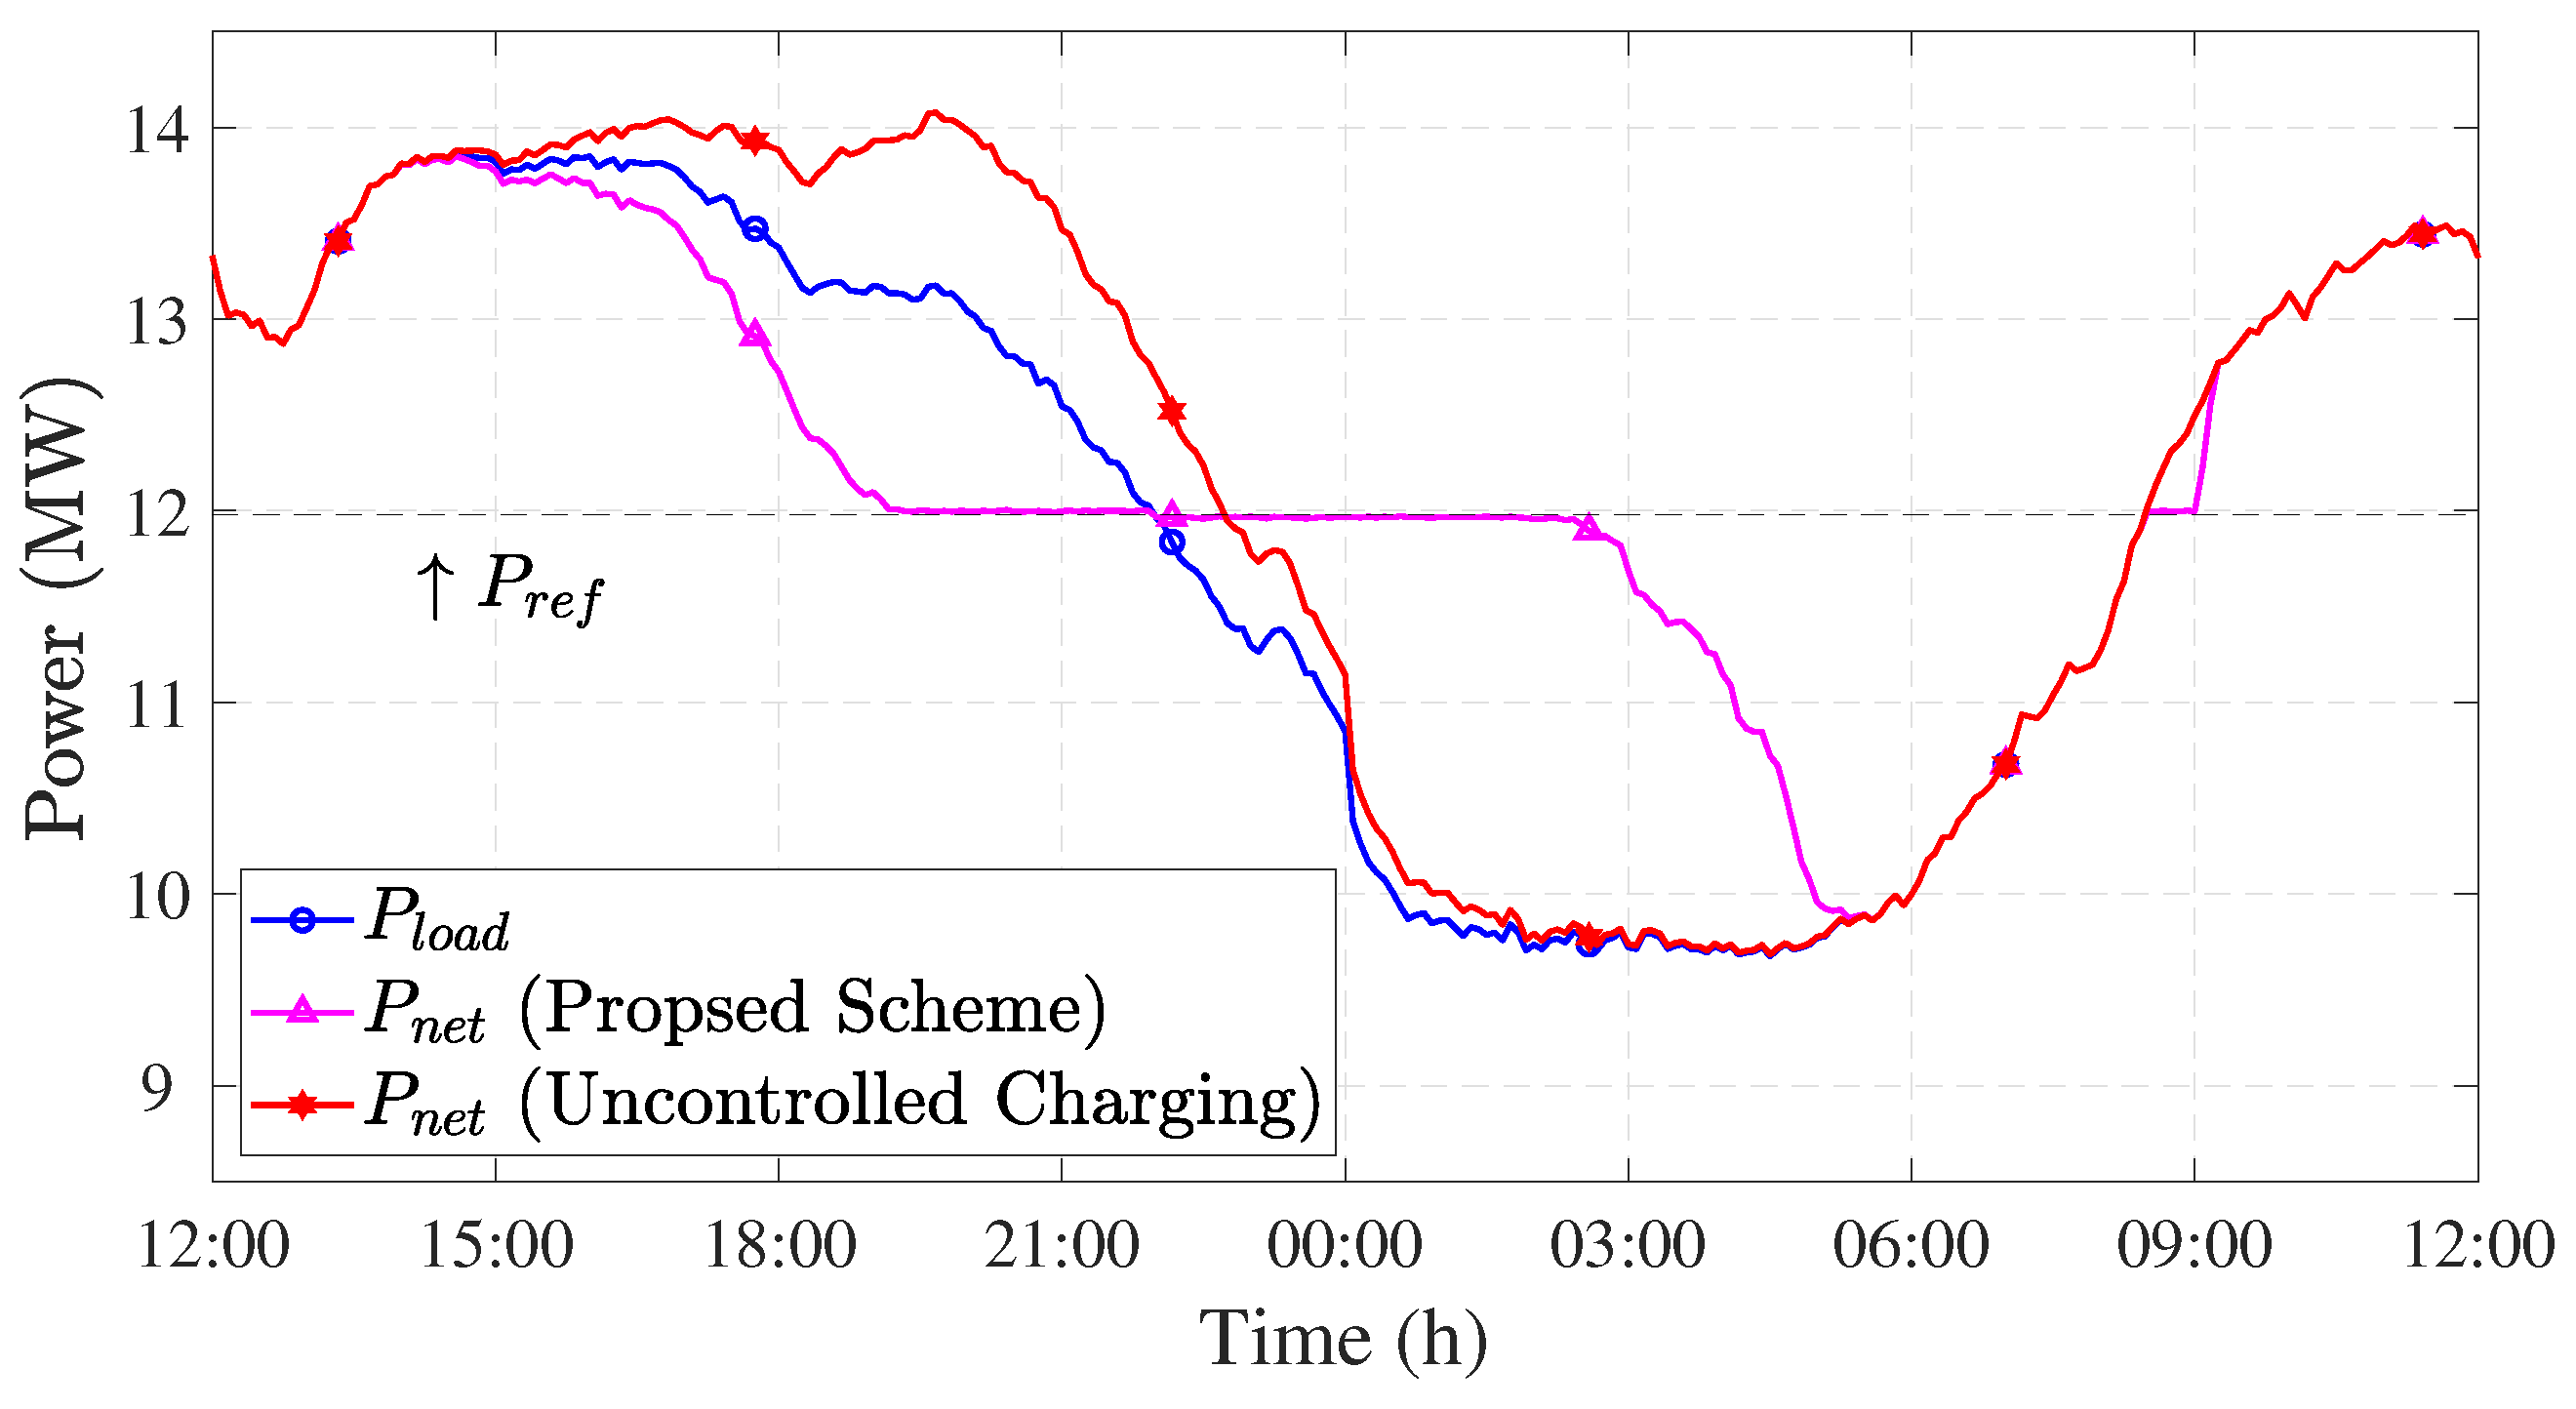
  • The load factor λ of the feeder is given by:
    λ ( % ) = P n e t ¯ P n e t max × 100 ,
    where P n e t max is the maximum value of net load profile while P n e t ¯ is given as:
    P n e t ¯ = 1 T t = 1 T P n e t ( t ) ,
  • The variance of load Φ is calculated as:
    Φ = 1 T t = 1 T | P n e t ( t ) P n e t ¯ | 2 ,
Apart from these indices, Mean ζ E V ( i , j ) D e p depicts the average departing SoC of all EVs in the feeder, whereas SD ζ E V ( i , j ) D e p gives the standard deviation. Furthermore, Equation (20) states the average daily battery cycle usage of the entire fleet of EVs in the feeder. The term β σ represents the standard deviation and the median is stated as Median ( β ).
β ¯ = 1 N F j = 1 N A G i = 1 N E V ( j ) β E V ( i , j ) .
where N F is the total number of EVs in the feeder and β E V ( i , j ) is the daily battery cycle usage of i-th EV of j-th aggregator.

5. Results

The proposed scheme has been implemented on the IEEE 13-node feeder and KEPCO X S/S-Z D/L feeder and the results are illustrated ahead. Since, the level-1 chargers are commonly available, the scheme has been analyzed from this point of view. Therefore, P E V T = 3 kW has been selected as the rated power of the EV charger.
The EV mobility data regarding the daily driving distance, arrival time and departure time has been utilized from References [22,23]. The average daily mileage of private vehicles in Korea is 38.8 km with 21.9 km standard deviation [22]. The average arrival time is 19:00 h with a standard deviation of 2 h. Moreover, the departure time of EVs has been determined from the morning peak of vehicle departure between 08:00 h and 09:00 h [23].
The simulations are executed using MATLAB 9.9/Simulink 10.2 software environment on a laptop computer with Intel Core i7-8550U CPU @ 1.80 GHz 1.99 GHz/16.00 GB RAM/x64-based architecture.
The aspect of uncontrolled charging has also been considered to provide a better comparison. For this purpose, both feeders have been fed with identical data without the scheme implementation to show the behavior of dumb plug-and-charge scenario. The uncontrolled EV charging practice escalates the peak load and imposes stress on the system.
Furthermore, a comparison of the scheme’s performance on both feeders has been drawn in Section 5.3.

5.1. Implementation of Proposed Scheme on IEEE 13-Node Distribution Feeder

In this section, the proposed two-level aggregator coordination scheme has been tested on the IEEE 13-node feeder system. The location of EV aggregators and the number of EVs are adopted from Table 1. Figure 5 shows the feeder load profile for various cases. The curve P l o a d has also been given for reference. The figure shows that the uncontrolled charging of EVs further increases the peak load. The highest peak load (3.52 MW) is observed when the number of incoming EVs is the highest.
With the application of the proposed strategy, it can be observed that the EV discharging during peak periods has shaved the peak load. The peak shaving performance is enhanced as the number of incoming EVs providing V2G increases. The G2V action of the EVs during the off-peak interval tends to replenish the valley gap to decrease the load variance.
Figure 6 shows the charging/discharging profile of the 21st EV of 1st aggregator which has been selected randomly. The EV provides its V2G services in the proposed scheme case under the supervision of aggregator.
Table 3 states the comparison of the proposed scheme with uncontrolled charging through the performance measuring indices. The peak shaving is absent in uncontrolled charging while the valley filling value is very low. Moreover, the load variance is quite high. The proposed scheme improves the performance of the system substantially.

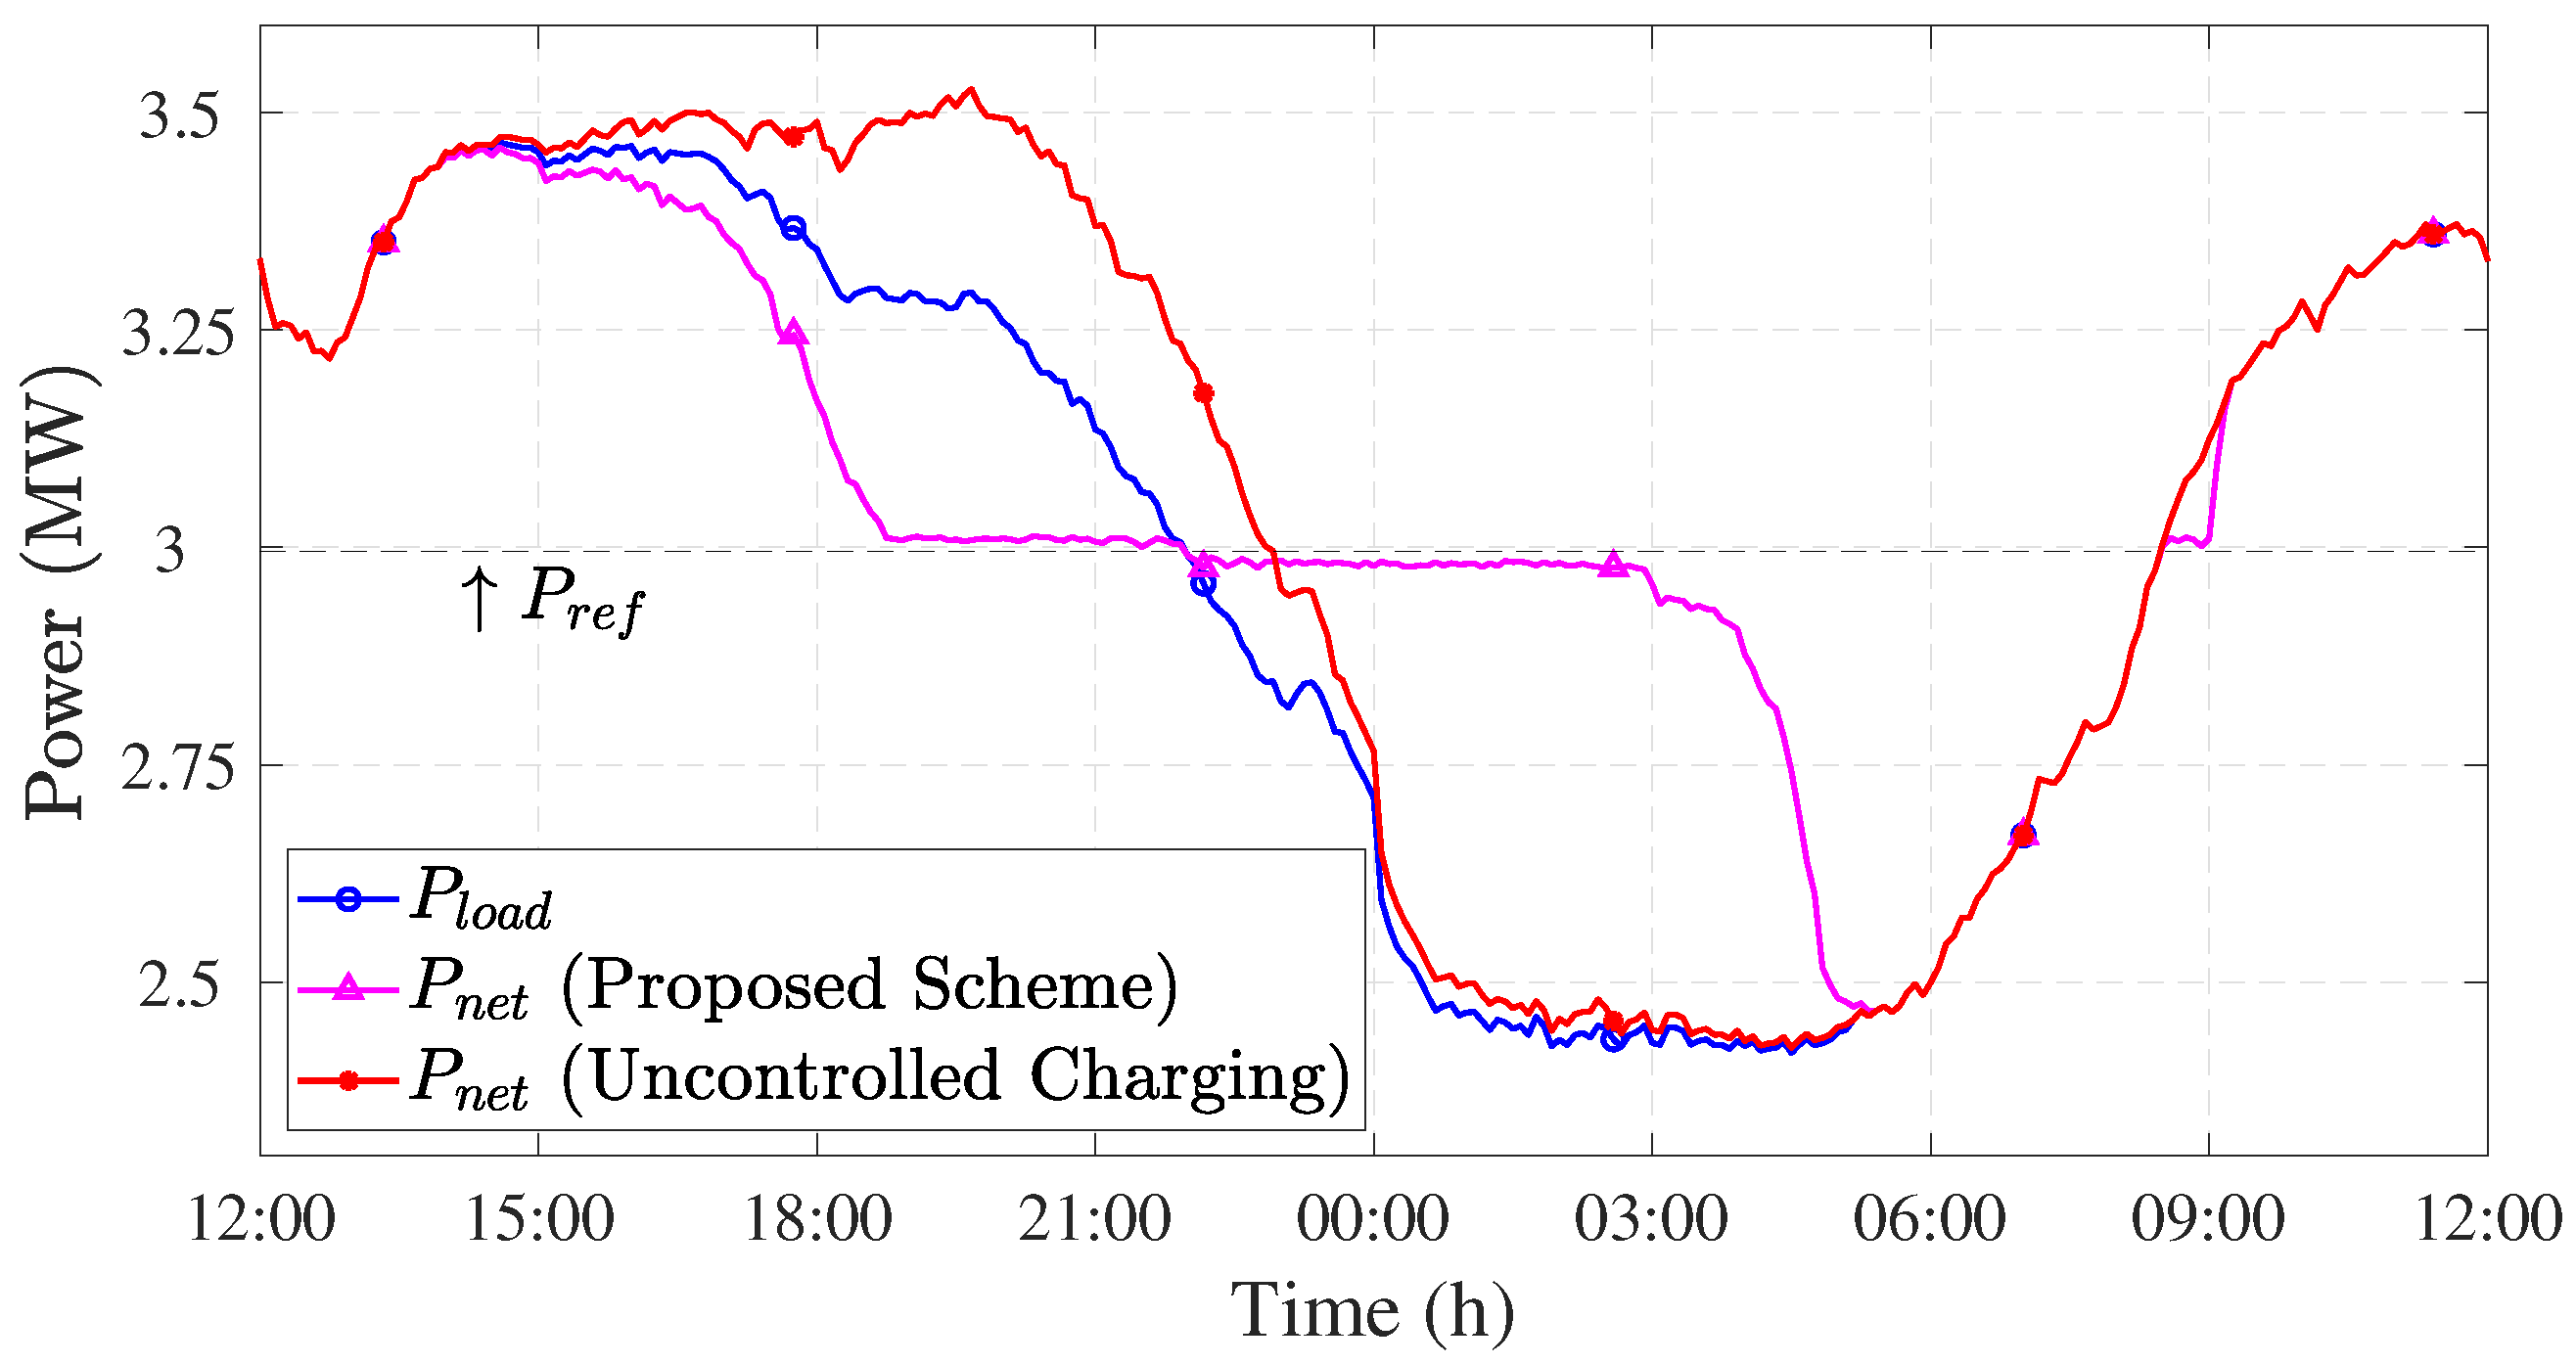
5.2. Implementation of Proposed Scheme on KEPCO X S/S-Z D/L Feeder

Figure 7 shows the net load profile of the KEPCO X S/S-Z D/L feeder under the application of proposed method and uncontrolled charging. The plug-and-charge scenario increases the peak load to 14.1 MW. Most of the EVs are charged before the off-peak period’s initiation and therefore the valley filling is negligible through EV charging.
By utilizing the proposed method, the system achieves the purpose of peak shaving and valley filling. The load curve is flattened and it complies with reference demand profile for almost one-third of the day. The total charging and discharging load of all the EVs in the feeder is depicted in Figure 8. The EVs discharge during the period of peak demand (negative power shows discharging of EVs). During the off-peak period, the EVs charge under the direction of proposed scheme (positive power shows EV charging).
Table 4 gives the precise comparison of uncontrolled charging and proposed scheme performance. Each index shows significant improvement and demonstrate the importance of the proposed peak shaving and valley filling scheme through aggregators coordination.

5.3. Comparison of Proposed Scheme on Various Feeders

For a detailed inspection, a comparison of the scheme performance on KEPCO X S/S-Z D/L feeder and IEEE 13-node distribution feeder has been developed. The results are stated in the Figure 9 and Table 5. The figure emphasizes that the objectives of peak shaving and valley filling are fulfilled for both distribution feeders. Moreover, the terms Mean ζ E V ( i , j ) D e p and SD ζ E V ( i , j ) D e p in the table show that the EVs are almost completely charged in each case and their daily battery cycle usage is also consistent.
Thus, it can been observed from the table that the proposed scheme delivers analogous results for both feeders and shows the diversity of the scheme with its applicability on multiple distribution feeder systems.

6. Discussion

The conventional generation for peak load reduction includes large-scale power generators which are not environment friendly. With the minimization of peak load using EVs (Table 3 and Table 4), the cost of generation to accommodate the peak loads can be diminished, promoting the economy as well as environmental concerns. In addition, the cost of utilizing high-ramp generators during the peak period is much higher than average [24] and these expenses also affect consumers with an increment in their utility bills. On the other hand, the EV customers who offer peak shaving or valley filling services to the grid (Figure 6) can receive financial incentives from the DSO. The flexibility of the grid is boosted with this application of EVs because of their rapid response to grid demands.
In systems with a high gap between maximum and minimum demand, the flattening of load profile is vital to minimize the cost of system infrastructure. During the off-peak period, the system resources are underutilized. The minimization of load variance and adherence of the load profile to its target value (as exhibited by P n e t in the Figure 5 and Figure 7) establishes the potential for further load addition without network reinforcement. This process of EV based valley filling and peak shaving improves the supply/demand balancing scenario [11] and the costs incurred for frequency control can also be saved as a result [25].
The peak shaving performance has been measured by the peak shaving index ρ in this study. The term power deviation P d e v is present in the denominator to measure ρ . On contrary to the worst case scenario considered for the simulation cases in this work; in any other case where the peak load is lesser, P d e v will also be smaller. Therefore, ρ will increase for the same number of connected EVs and same duration of peak period. In other words, the peak shaving will give better results. The same can also be applicable to the performance improvement of valley filling index υ , if the valley in the load curve is shallower. Additionally, if the number of connected EVs is increased for the given scenario, we will see an increase in the positive and negative peak of Figure 8, corresponding to an increase in the value of ρ and υ .
According to Table 5, the proposed scheme shows a close to 100% value of EV battery SoC when the EVs depart. This is an important aspect from the consumer point of view. Moreover, a daily cycle usage of less than half, while incorporating V2G services on top of driving requirements, lies in accordance with the lifetime of EV battery [26].

7. Conclusions

In this paper, a proposition is put forward to aggregate and coordinate EVs to support the grid for a reliable operation of distribution network. The proposed strategy works towards the objective of minimizing the peak load by discharging EVs to avoid overloading, and filling the demand valley by charging EVs in this period to minimize the load variance. Coordination among different aggregators at the DSO guarantees the proper utilization of EVs within a respective aggregator’s domain based on the real-time data from the EVs. The overall two-level control process ensures fast computation. This aspect enables the on-line implementation of the scheme which is ideal for large penetration of EVs. The objectives at each level of hierarchy are achieved without affecting the EV owner’s comfort; as they inherit fully charged EVs before departure whilst always maintaining an adequate amount of energy for emergency travel. Simple wall outlet based chargers can be used to implement this scheme. Thus, improving the complexity of the system.
EV aggregators through appropriate coordination among them for V2G/G2V application, can play a vital role to flatten the system load profile and thus, promoting an efficient utilization of power system resources. It also facilitates higher penetration of EVs in the grid as the undesirable effects of increased EV penetration in the distribution grid are averted. A decrease in load variance, improves the operation of the distribution system and paves way for higher penetration of renewables without further network reinforcements. For future work, the scheme can be modified to incorporate multiple objective optimization, especially to minimize losses with regards to distribution network power flows.

Author Contributions

Conceptualization, S.U.K.; methodology, S.U.K., K.K.M. and Z.M.H.; software, S.U.K., K.K.M. and Z.M.H.; validation, S.U.K., K.K.M. and Z.M.H.; formal analysis, K.K.M. and M.K.R.; investigation, S.U.K.; resources, S.U.K. and M.O.K.; data curation, K.K.M.; writing–original draft preparation, S.U.K. and Z.M.H.; writing–review and editing, S.U.K., M.K.R. and M.O.K.; visualization, S.U.K., M.K.R. and M.O.K.; supervision, C.-H.K.; project administration, C.-H.K.; funding acquisition, C.-H.K. All authors have read and agreed to the published version of the manuscript.

Funding

This research was funded by “National Research Foundation of Korea (NRF) grant funded by the Korean government (MSIP), grant number 2018R1A2A1A05078680” and “The APC was funded by S.U.K. and M.O.K”.

Data Availability Statement

Data available on reasonable request.

Conflicts of Interest

The authors declare no conflict of interest.

References

  1. Mehmood, K.K.; Kim, C.; Khan, S.U.; Haider, Z.M. Unified Planning of Wind Generators and Switched Capacitor Banks: A Multiagent Clustering-Based Distributed Approach. IEEE Trans. Power Syst. 2018. [Google Scholar] [CrossRef]
  2. Shareef, H.; Islam, M.M.; Mohamed, A. A review of the stage-of-the-art charging technologies, placement methodologies, and impacts of electric vehicles. Renew. Sustain. Energy Rev. 2016, 64, 403–420. [Google Scholar] [CrossRef]
  3. Yilmaz, M.; Krein, P.T. Review of the Impact of Vehicle-to-Grid Technologies on Distribution Systems and Utility Interfaces. IEEE Trans. Power Electron. 2013, 28, 5673–5689. [Google Scholar] [CrossRef]
  4. Kaur, K.; Rana, R.; Kumar, N.; Singh, M.; Mishra, S. A Colored Petri Net Based Frequency Support Scheme Using Fleet of Electric Vehicles in Smart Grid Environment. IEEE Trans. Power Syst. 2016, 31, 4638–4649. [Google Scholar] [CrossRef]
  5. Jia, H.; Li, X.; Mu, Y.; Xu, C.; Jiang, Y.; Yu, X.; Wu, J.; Dong, C. Coordinated control for EV aggregators and power plants in frequency regulation considering time-varying delays. Appl. Energy 2018, 210, 1363–1376. [Google Scholar] [CrossRef]
  6. Zakariazadeh, A.; Jadid, S.; Siano, P. Integrated operation of electric vehicles and renewable generation in a smart distribution system. Energy Convers. Manag. 2015, 89, 99–110. [Google Scholar] [CrossRef]
  7. Nguyen, H.N.T.; Zhang, C.; Zhang, J.; Le, L.B. Hierarchical control for electric vehicles in smart grid with renewables. In Proceedings of the 13th IEEE International Conference on Control Automation (ICCA), Ohrid, Macedonia, 3–6 July 2017; pp. 898–903. [Google Scholar] [CrossRef]
  8. Xu, Z.; Hu, Z.; Song, Y.; Zhao, W.; Zhang, Y. Coordination of PEVs charging across multiple aggregators. Appl. Energy 2014, 136, 582–589. [Google Scholar] [CrossRef]
  9. Xia, M.; Lai, Q.; Zhong, Y.; Li, C.; Chiang, H.D. Aggregator-Based Interactive Charging Management System for Electric Vehicle Charging. Energies 2016, 9, 159. [Google Scholar] [CrossRef] [Green Version]
  10. Mou, Y.; Xing, H.; Lin, Z.; Fu, M. Decentralized Optimal Demand-Side Management for PHEV Charging in a Smart Grid. IEEE Trans. Smart Grid 2015, 6, 726–736. [Google Scholar] [CrossRef]
  11. Wang, Z.; Wang, S. Grid Power Peak Shaving and Valley Filling Using Vehicle-to-Grid Systems. IEEE Trans. Power Deliv. 2013, 28, 1822–1829. [Google Scholar] [CrossRef]
  12. Erdogan, N.; Erden, F.; Kisacikoglu, M. A fast and efficient coordinated vehicle-to-grid discharging control scheme for peak shaving in power distribution system. J. Mod. Power Syst. Clean Energy 2018, 6, 555–566. [Google Scholar] [CrossRef] [Green Version]
  13. Pillai, J.R.; Bak-Jensen, B. Integration of Vehicle-to-Grid in the Western Danish Power System. IEEE Trans. Sustain. Energy 2011, 2, 12–19. [Google Scholar] [CrossRef]
  14. Alam, M.J.E.; Muttaqi, K.M.; Sutanto, D. Effective Utilization of Available PEV Battery Capacity for Mitigation of Solar PV Impact and Grid Support With Integrated V2G Functionality. IEEE Trans. Smart Grid 2016, 7, 1562–1571. [Google Scholar] [CrossRef] [Green Version]
  15. Khan, S.U.; Mehmood, K.K.; Haider, Z.M.; Rafique, M.K.; Kim, C.H. A Bi-Level EV Aggregator Coordination Scheme for Load Variance Minimization with Renewable Energy Penetration Adaptability. Energies 2018, 11, 2809. [Google Scholar] [CrossRef] [Green Version]
  16. Devidas, A.R.; Ramesh, M.V.; Rangan, V.P. High performance communication architecture for smart distribution power grid in developing nations. Wirel. Netw. 2018, 24, 1621–1638. [Google Scholar] [CrossRef]
  17. You, S.; Hu, J.; Ziras, C. An Overview of Modeling Approaches Applied to Aggregation-Based Fleet Management and Integration of Plug-in Electric Vehicles. Energies 2016, 9, 968. [Google Scholar] [CrossRef] [Green Version]
  18. Lee, S.J.; Kim, J.H.; Kim, C.H.; Kim, S.K.; Kim, E.S.; Kim, D.U.; Mehmood, K.K.; Khan, S.U. Coordinated Control Algorithm for Distributed Battery Energy Storage Systems for Mitigating Voltage and Frequency Deviations. IEEE Trans. Smart Grid 2016, 7, 1713–1722. [Google Scholar] [CrossRef]
  19. Kersting, W.H. Radial distribution test feeders. In Proceedings of the 2001 IEEE Power Engineering Society Winter Meeting (Cat. No.01CH37194), Columbus, OH, USA, 28 January–1 February 2001; Volume 2, pp. 908–912. [Google Scholar] [CrossRef]
  20. Lee, S.J.; Kim, J.H.; Kim, D.U.; Go, H.S.; Kim, C.H.; Kim, E.S.; Kim, S.K. Evaluation of voltage sag and unbalance due to the system connection of electric vehicles on distribution system. J. Electr. Eng. Technol. 2014, 9, 452–460. [Google Scholar] [CrossRef] [Green Version]
  21. Park, K.; Seo, H.; Kim, C.; Jung, C.; Yoo, Y.; Lim, Y. Analysis of the Neutral Current for Two-Step-Type Poles in Distribution Lines. IEEE Trans. Power Deliv. 2009, 24, 1483–1489. [Google Scholar] [CrossRef]
  22. Kim, J.H.; Kim, C.H. Smart EVs Charging Scheme for Load Leveling Considering ToU Price and Actual Data. J. Electr. Eng. Technol. 2017, 12, 1–10. [Google Scholar] [CrossRef] [Green Version]
  23. Arias, M.B.; Bae, S. Electric vehicle charging demand forecasting model based on big data technologies. Appl. Energy 2016, 183, 327–339. [Google Scholar] [CrossRef]
  24. Mahmud, K.; Hossain, M.J.; Ravishankar, J. Peak-Load Management in Commercial Systems With Electric Vehicles. IEEE Syst. J. 2018. [Google Scholar] [CrossRef]
  25. He, P.; Li, M.; Zhao, L.; Venkatesh, B.; Li, H. Water-Filling Exact Solutions for Load Balancing of Smart Power Grid Systems. IEEE Trans. Smart Grid 2018, 9, 1397–1407. [Google Scholar] [CrossRef]
  26. Jafari, M.; Gauchia, A.; Zhao, S.; Zhang, K.; Gauchia, L. Electric Vehicle Battery Cycle Aging Evaluation in Real-World Daily Driving and Vehicle-to-Grid Services. IEEE Trans. Transp. Electrif. 2018, 4, 122–134. [Google Scholar] [CrossRef]
Figure 1. Load profile trend of Republic of Korea for a summer day.
Energies 14 00352 g001
Figure 2. The comprehensive control flow chart of the proposed strategy at the three levels: distribution system operator (DSO), aggregator and electric vehicles (EVs).
Energies 14 00352 g002
Figure 3. IEEE 13-node feeder configuration.
Energies 14 00352 g003
Figure 4. KEPCO X S/S—Z D/L feeder configuration.
Energies 14 00352 g004
Figure 5. Net load profile of IEEE 13-node distribution feeder.
Energies 14 00352 g005
Figure 6. EV charging and discharging power profile.
Energies 14 00352 g006
Figure 7. Net load curve of KEPCO feeder.
Energies 14 00352 g007
Figure 8. Net EV load on the feeder.
Energies 14 00352 g008
Figure 9. Indices comparison on IEEE 13-node distribution feeder and KEPCO X S/S-Z D/L feeder.
Energies 14 00352 g009
Table 1. EV penetration in the IEEE 13-node feeder.
LocationAggregatorNumber of EVs
632AG113
634AG226
645AG311
646AG415
671AG574
692AG611
675AG754
611AG811
652AG98
Total223
Table 2. EV penetration in the KEPCO X S/S-Z D/L feeder.
LocationAggregatorNumber of EVs
L1AG177
L2AG225
L3AG354
L4AG4116
L5AG536
L6AG647
L7AG777
L8AG877
L9AG983
L10AG1020
L11AG11284
Total896
Table 3. Comparison of proposed scheme and uncontrolled charging on IEEE 13-node distribution feeder.
EntityProposed SchemeUncontrolled Charging
ρ 23.7%-
υ 61.32%8.91%
λ 88.47%86.57%
Φ 0.07 MW 2 0.17 MW 2
Table 4. Comparison of proposed scheme and uncontrolled charging on KEPCO X S/S-Z D/L feeder.
EntityProposed SchemeUncontrolled Charging
ρ 24.25%-
υ 59.3%7.95%
λ 88.28%86.67%
Φ 1.13 MW 2 2.69 MW 2
Table 5. State of charge (SoC) and battery cycle usage results for IEEE 13-node distribution feeder and KEPCO X S/S-Z D/L feeder.
EntityIEEE-13 FeederKEPCO Feeder
Mean ζ E V ( i , j ) D e p 99.34%99.2%
SD ζ E V ( i , j ) D e p 0.73%0.93%
β ¯ 0.470.47
β σ 0.130.16
Median ( β )0.460.48
Publisher’s Note: MDPI stays neutral with regard to jurisdictional claims in published maps and institutional affiliations.

