Modeling Energy Communities with Collective Photovoltaic Self-Consumption: Synergies between a Small City and a Winery in Portugal


Centre for Ecology, Evolution and Environmental Changes (CE3C), Faculdade de Ciências, Universidade de Lisboa, Campo Grande, 1749-016 Lisboa, Portugal
*
Authors to whom correspondence should be addressed.
†
Co-first author, these authors contributed equally to this work.
Energies 2021, 14(2), 323; https://doi.org/10.3390/en14020323
Submission received: 5 December 2020
/
Revised: 31 December 2020
/
Accepted: 2 January 2021
/
Published: 8 January 2021
(This article belongs to the Special Issue Novel Developments in Energy Resources Management, Distribution Systems, Microgrids and Energy Communities)
Abstract
:The recently approved regulation on Energy Communities in Europe is paving the way for new collective forms of energy consumption and production, mainly based on photovoltaics. However, energy modeling approaches that can adequately evaluate the impact of these new regulations on energy community configurations are still lacking, particularly with regards to the grid tariffs imposed on collective systems. Thus, the present work models three different energy community configurations sustained on collective photovoltaics self-consumption for a small city in southern Portugal. This energy community, which integrates the city consumers and a local winery, was modeled using the Python-based Calliope framework. Using real electricity demand data from power transformers and an actual winery, the techno-economic feasibility of each configuration was assessed. Results show that all collective arrangements can promote a higher penetration of photovoltaic capacity (up to 23%) and a modest reduction in the overall cost of electricity (up to 8%). However, there are clear trade-offs between the different pathways: more centralized configurations have 53% lower installation costs but are more sensitive to grid use costs (which can represent up to 74% of the total system costs). Moreover, key actor’s individual self-consumption rate may decrease by 10% in order to benefit the energy community as a whole.
1. Introduction
The recent approval of the Clean Energy Package (CEP) by the European Union, through the recast of the Renewable Energy Directive (Directive (EU) 2018/2001) [1] and the Internal Electricity Market Directive (Directive (EU) 2019/944) [2], provided a legal background for the emergence of new collective energy initiatives. Its main novelty is the introduction of new organizational and legal frameworks such as Renewable Energy Communities (REC) and Citizen Energy Communities (CEC)—legal entities that must be collective, voluntary, and open organizations and are primarily value-driven rather than by profits [3]. After the approval, the directives must be transposed into the member states’ specific regulatory frameworks, a process which is evolving at different speeds in each member state. For example, while specific activities such as collective self-consumption are already regulated in most EU countries, for the REC and CEC legal concepts, the transposition process is still lagging behind [4]. At the center of this process lies the emergence of prosumers as active actors in the energy system, with the expectation that new democratic forms of citizen participation are brought forward [5]. Thus, the CEP urges the EU member states to legislate REC and CEC but also new decentralized models, such as collective self-consumption, virtual power plants (VPP), peer-to-peer (P2P) energy trading schemes, or demand flexibility aggregators [6,7].
High expectations are being placed in collective self-consumption, one of the possible EC activities alongside energy generation, consumption, supply, and distribution, due to its technological readiness level and large potential for promoting a faster adoption of local renewable generation. Building up on its individual version, in which an investment in renewable generation close to a point of consumption is monetized through savings in electricity costs, collective self-consumption allows for several points of consumption to be virtually connected and share one or more renewable systems. Several advantages result from this new configuration, namely: (i) prosumers will be able to install larger renewable energy systems and, due to economies of scale, access lower unit costs; (ii) various consumers and consumer types can be grouped under the same collective arrangement increasing self-consumption [8,9,10,11,12]; and (iii) it will be easier for energy collectives to capitalize on more adequate installation sites, as they will have some flexibility to choose where to install their self-consumption system [9]. However, the new possibilities, enabled by collective setups, increase the complexity of adequately sizing the renewable generation system: a given collective will include several load profiles, possibly more than one potential location for a renewable energy system to be installed, and likely include members with different purchasing power. Additionally, the fact that in collective arrangements the renewable energy system and the consumption points do not need to be placed at the same location can imply the use of the public distribution grid for energy exchanges between participants of a given collective.
In such cases, grid tariffs will be charged to prosumers, with potential impacts on the economic feasibility of self-consumption investments that should not be disregarded [4,13,14]. This added complexity becomes even more evident for cases which integrate actors from considerably different sectors, which may be located in different tension levels or may differ in access to resources such as the available area (in quantity and type, such as rooftops or open terrains) for installing renewable capacity. This can impact the configuration as well as the size of the deployed renewable energy systems, with potential effects in the grid costs of a given collective self-consumption project and the unit cost of investment. Additionally, business models and design methodologies will need to facilitate a broad access to capital and be able to distribute the resulting savings proportionally to a member’s initial investment [15,16].
One of the most pressing issues in designing collective arrangements is the geographical proximity between generation and consumption. Although this issue has been subjected to immense discussion, the type of business model and activities that energy communities (EC) can undertake are, in concept, scale-agnostic and may even allow for different self-consumption collectives to interact with each other. Thus, ECs can be created by collectives with different spatial proportions (from multi-apartment buildings, to a neighborhood, municipality, or even entire regions) and integrate actors from different sectors (from citizens to local governments or industries). For example, Butturi et al. have reviewed the concept of urban industrial symbiosis from a renewable energy perspective, where eco-industrial parks develop synergistic relationships with adjacent urban areas to channel renewable generation surpluses [17]. While four main pathways to implement collective energy strategies are identified (i.e., collective purchase of energy, energy exchanges and recovery, collective production management of energy, and shared building services and utilities), the authors point out how the advantages of energy symbiosis between industrial and urban areas that also integrate renewable energy sources (RES) are still under-investigated.
As described previously, the context in which ECs and collective self-consumption emerge is complex, with regulatory, technical, and economic nuances. Moreover, these concepts and frameworks are all still under experimentation and testing, with updates and revisions being expected in the coming years for most EU countries. Thus, to pave the way for a successful EC adoption, techno-economic feasibility assessments must be performed. Energy system modeling, simulation, or optimization are valuable computational tools for this purpose and can provide deep insights on the operation of power systems while allowing to compare the impact of a range of scenarios and their assumptions in their optimal configuration [18].
Most of the literature considers photovoltaics (PV) as the most fitting generation technology for collective self-consumption schemes, due to its affordability and technological readiness level, but also its modularity, making it compatible with contexts of considerably different scales (from a single building to a large-scale power plant). Before collective self-consumption was even introduced by the CEP, several authors had shown that one of the benefits for collective PV schemes was the increase in the Self-Consumption Rate (the fraction of local production which is consumed on-site): the aggregation of somewhat decorrelated load profiles results in smoother aggregated profiles, thus reducing the mismatch with the PV profile [8,10,11,12]. Fina et al. (2019) expanded this type of approach (i.e., an arbitrary aggregation of loads) by using a Mixed Integer Linear Programming (MILP) model to determine the maximum net present value and optimal system capacities of PV and/or heating systems for a set of illustrative collective arrangements, which the authors named “settlement patterns” [9]. The same authors extended this work and moved to model greater scales using representative ECs at the neighborhood level [19]. On the other hand, Contreras-Ocaña et al. addressed the problem of sizing and operating a collective PV system with storage in the context of French regulation considering a business model where the renewable system is financed by an investor and the consumers are charged for consuming its energy [20]. The model the authors present has a coupled structure combining MILP and Model Predictive Control approaches. Other works explore well-established energy modeling tools such as TIMES [21,22,23] and EnergyPLAN [24,25,26] to study and optimize energy systems at the district or city scales, considering multiple energy sources and/or longer-term periods of analysis. Chen et al. explored the SystemC-AMS framework to design and simulate a power grid encompassing a residential community of 15 houses, a wind turbine, a PV array, and a battery pack [27]. This approach addresses the operation of a power grid at the power electronics-scale (modeling DC buses, converters, inverters, transformers), with incredibly high-resolution (seconds timescale). Other tools explicitly consider spatial resolution in their energy modeling and optimization [28], such as Calliope, an open-source energy modeling framework which has been used to address district-, city-, or even neighborhood-scale case studies [29,30]. Table 1 provides a comparison between the reviewed works considering several key parameters.
None of these works cumulatively consider collective PV arrangements while explicitly modeling the impact of self-consumption tariffs (which depend on the applicable regulation, EU or local) and the spatial configuration of ECs. As pointed out by Alaton et al., to properly evaluate collective EC frameworks at the light of the CEP, numerical modeling works must consider elements such as electricity sharing, management of distribution networks, geographical restrictions, and network tariffs [31]. Fina et al. (2020) further highlighted that future EC analyses must also address the associated grid costs [19].
Therefore, the present work aims at filling this research gap by assessing the potentialities of an EC in a small city in southern Portugal which integrates residential and commercial consumers (in particular, a local winery) to explore PV for collective self-consumption. This assessment is performed in Calliope, due to its considerable flexibility, allowing users to custom design power grid layouts, define the spatio-temporal scale and level of detail of the system under analysis, and to parametrize a wide range of technical and economic constraints. This framework is, thus, scale-agnostic and can explicitly model several key aspects involving the new business models and legal realities of ECs, namely collective energy configurations and the application of grid tariffs. In this work, the Calliope framework is applied to a real dataset containing electricity demand and distribution grid metadata. The optimal allocation of PV capacity is computed for a set of EC setups and then evaluated from a techno-economic perspective. To the best of authors understanding, this is the first work to extend the application of the Calliope framework to the modeling of ECs and collective PV arrangements.
The remainder of this work is organized as follows: Section 2 describes the case study, while Section 3 presents the datasets used, the modeling methodology, its assumptions, and the scenarios considered. Section 4 presents and discusses results and, lastly, Section 5 lays out the final conclusions.
2. Case Study Description
2.1. The Portuguese Context on Energy Communities and Collective Self-Consumption
The recent Portuguese Decree-Law 162/2019 [32], approved in late 2019, introduced for the first time the figure of REC and collective self-consumption in the Portuguese context. However, the new Portuguese law is still in a testing phase and its final version will be published in 2021 after a process of experimentation and pilot projects that are expected to emerge all around the country. This new legal framework is expected to further increase the penetration of RES in the Portuguese energy mix, with 39.8% of fossil energy (coal, natural gas, fossil co-generation) in 2020 [33].
Several key issues for the development and implementation of collective energy projects find themselves unclear or undefined, such as a precise definition of geographical proximity between consumers and production, concrete aspects of the interaction between an energy collective and the distribution system operator, and the operation of P2P energy trading, among other things. For example, the grid tariffs applicable for energy collectives with members at different tension levels is yet to be defined.
However, while ECs are presented as flexible legal structures, collective self-consumption is a concrete output of this new legal framework. However, the Portuguese energy sector and potential EC adopters (e.g., households, industries, and public sector) are still evaluating this new set of legislation in order to understand how to implement, in practice, these new collective arrangements, assess potential benefits and devise efficient business models. This situation further highlights the need for detailed techno-economic assessments in order to pave the way for a concrete adoption of EC and its associated collective schemes.
2.2. Reguengos de Monsaraz: A City + Winery Potential Energy Community in Southern Portugal
The present work is built on the outputs of the Living Lab developed during 2019 within the H2020 PROSEU project (PROSumers for the Energy Union) [34]. Throughout this Living Lab, several actors from the wine sector were involved in a series of co-creation sessions to design the future of RES adoption within the sector; one of the elaborated strategies was the establishment of ECs between wineries and nearby urban residential areas. As a sector which is considerably energy intensive and particularly vulnerable to climate change [35,36], vine growers and winemakers in Portugal are aware of the need to transform their energy sub-system and, thus, are receptive to the adoption of RES to increase the sector’s resilience [37]. However, these same actors highlighted how their highly seasonal electricity demand profile (with peak demand concentrated in a short 2-month period) poses a barrier for a massive adoption of renewable energy systems as it would require costly storage systems.
Thus, Reguengos de Monsaraz, a city in the district of Évora in southern Portugal, where the wine sector plays a major role in the local economy and has a relevant weight in the city’s energy budget, was a pertaining case study. With an area of less than 500 km2, its population was of 7261 inhabitants by 2012 [38]. Moreover, Campos et al. concluded that the wine sector is interested in going beyond the mere adoption of RES, showing interest in activities such as the selling of surplus energy to other companies or consumers, which the new Portuguese legislation now allows. These results further support the relevance for modeling and assessing the potentialities of EC where the wine sector and other local actors integrate collective prosumer setups.
Therefore, the motivation for an EC in Reguengos de Monsaraz starts with the idea that bringing different local actors together under the same collective arrangement may expose fruitful synergies among them, resulting in mutual economic, technical, and environmental benefits. Here, only PV technology is considered, mainly due to four factors: (i) Portugal has a considerable solar resource availability, with more than 1500 kWh/m2/year (from PVGIS [39]), resulting in very interesting PV generation yields; (ii) PV is an affordable technology and represents a profitable investment even without the support of feed-in tariffs; (iii) PV is also quite modular (as a given system can be as small as an individual module) and, thus, ideal for deployment in both urban and rural areas, where very diverse rooftops and terrains (in size and shape) exist; and (iv) the current self-consumption and EC regulations in Portugal often highlight PV collective schemes as illustrative examples, probably motivated by the previous factors.
The EC comprised a semi-rural city (mainly residential) and a local winery, with both actors being considered in the energy modeling process. There are many differentiating elements between these two actors, such as the electricity demand profiles (in quantity and seasonality), area availability for deploying PV, and the scale of such installations (i.e., whether residential rooftop or utility scale systems). The EC will share and manage a collective PV system to meet part of its electricity needs in the context of recently approved Portuguese regulation. Depending on the collective arrangement, the city and the local winery can interchange or complement the consumer/prosumer roles. The question addressed in this work is concerned with the determination of the different possible configurations for this collective energy project and the corresponding techno-economic implications.
3. Materials and Methods
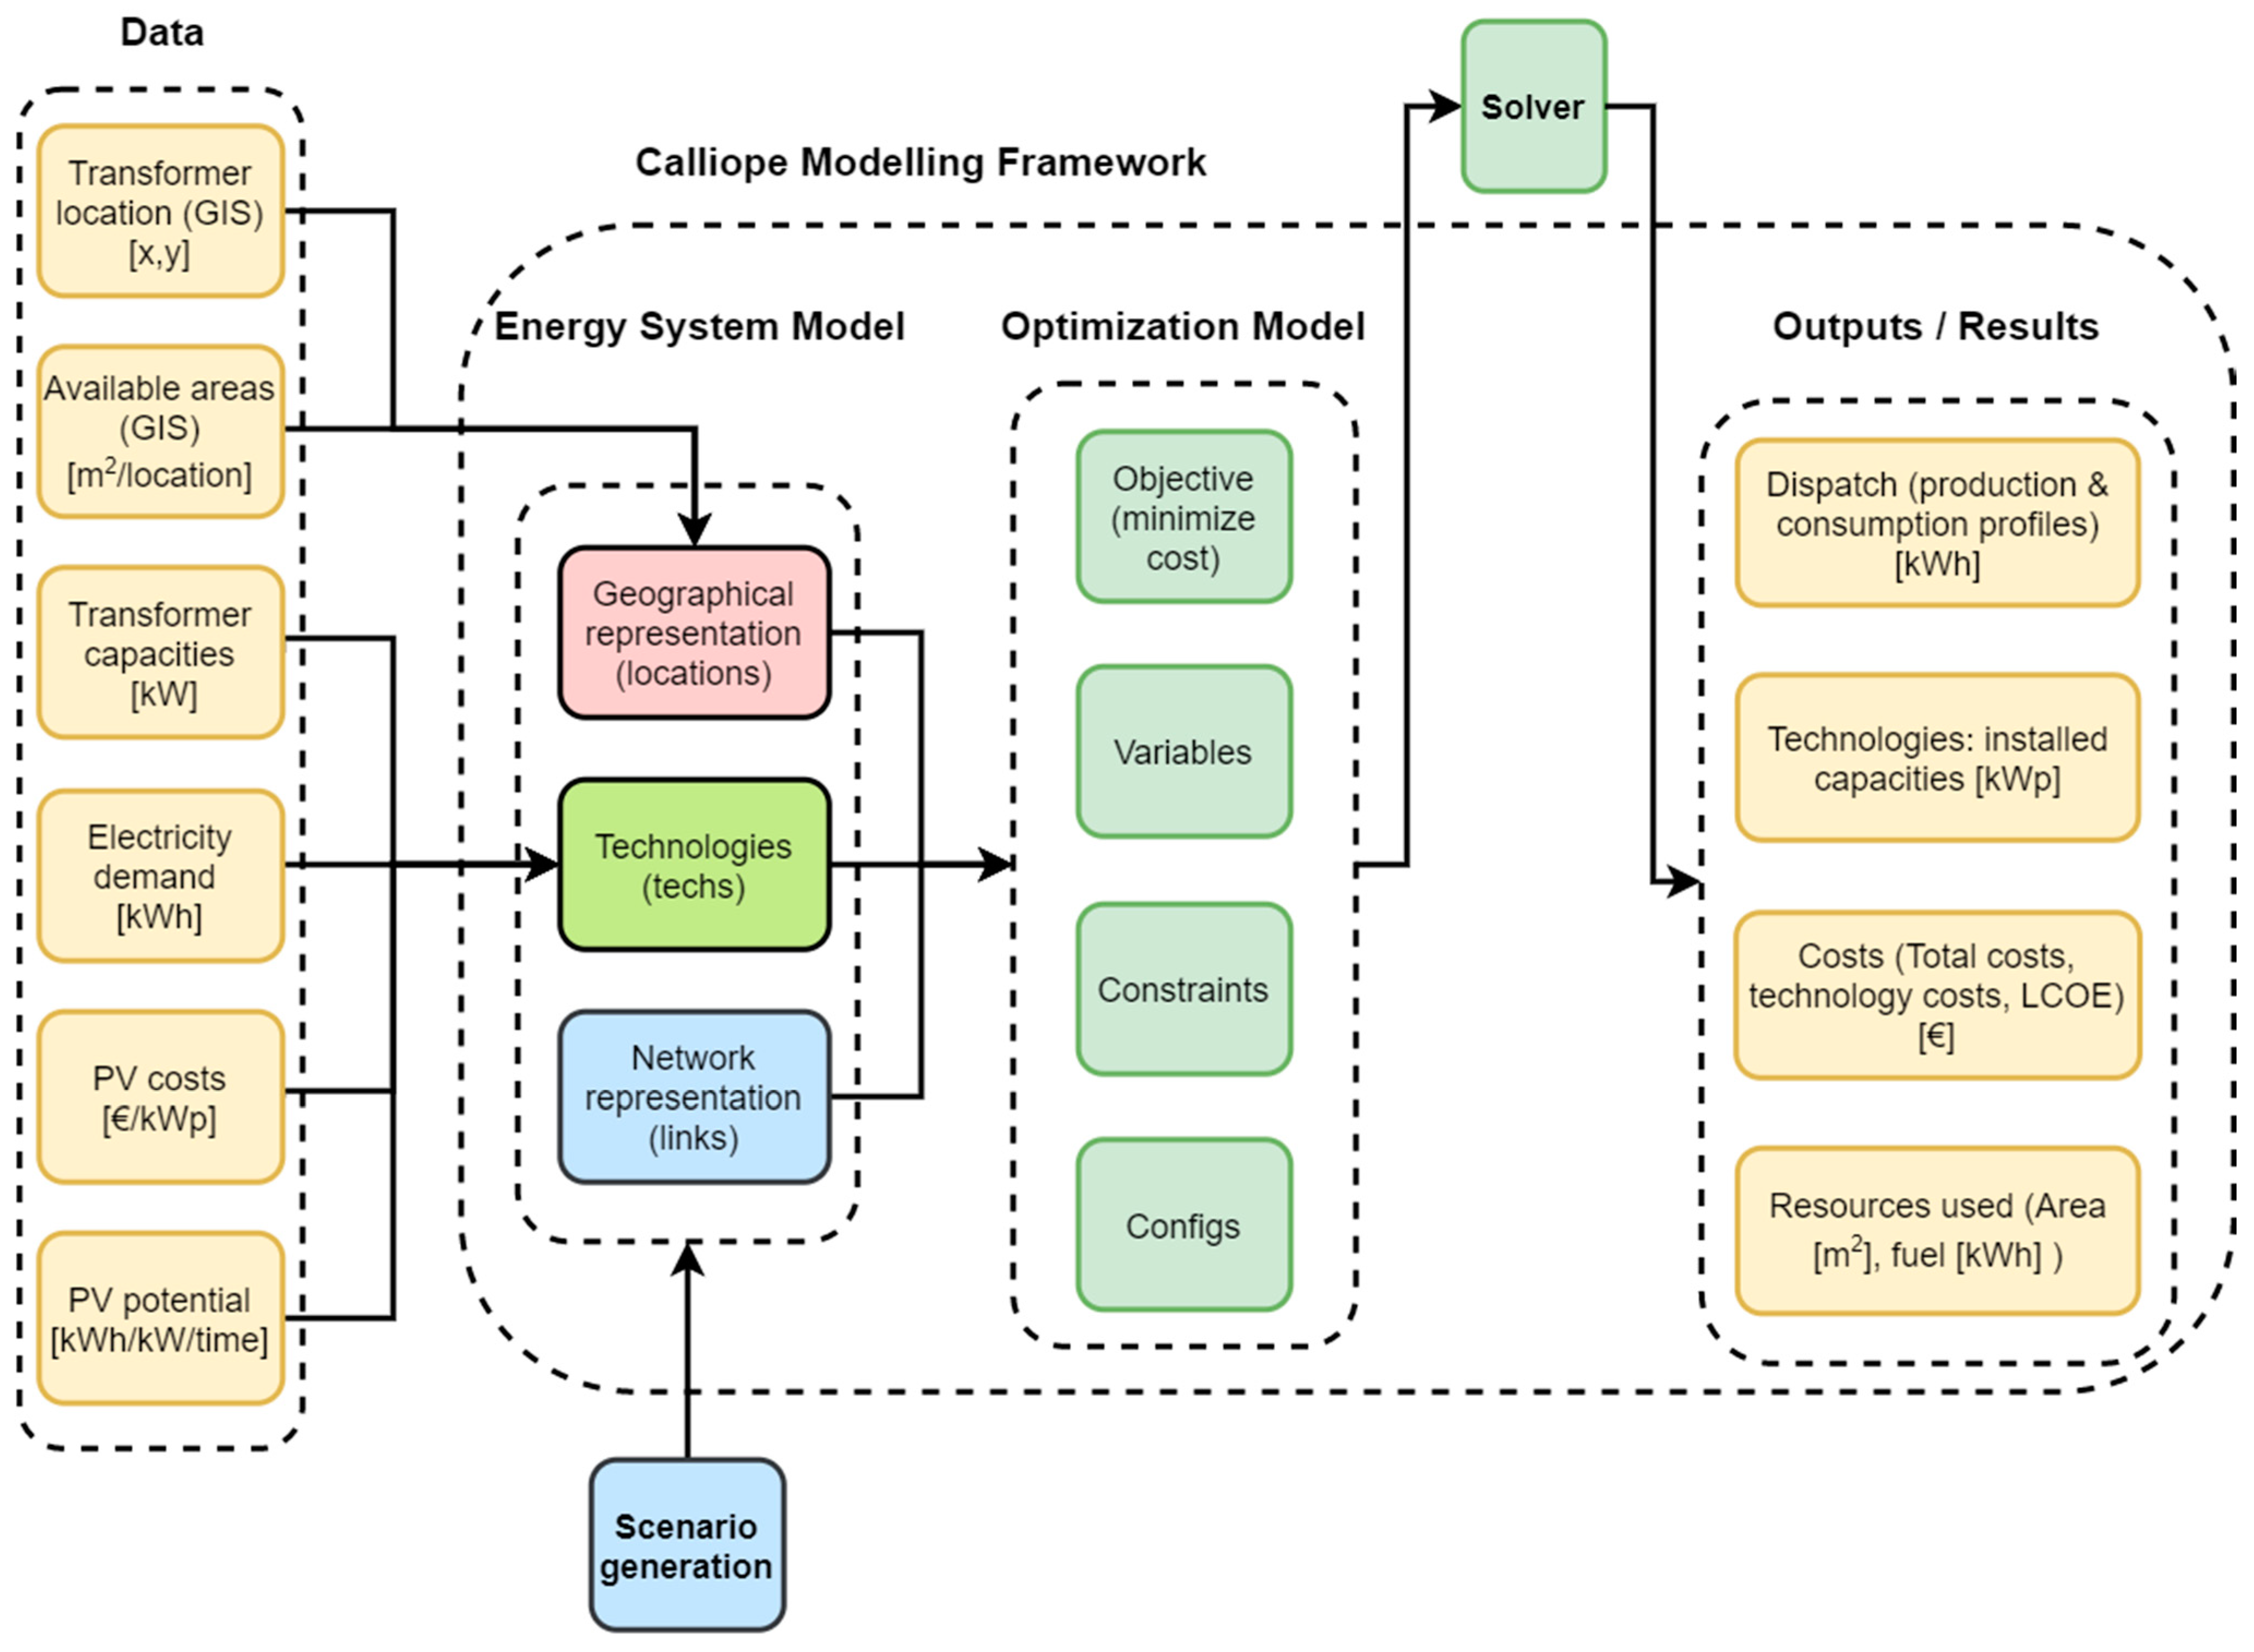
Figure 1 presents a high-level vision of the modeling workflow implemented in this work, showing the interdependence of the various elements of the modeling process. At first, a diverse dataset was gathered provided by several unrelated data sources. Then, the local power grid of Reguengos de Monsaraz was represented in the Calliope framework following its native architecture, comprised by locations, links, and technologies (cf. Section 3.2.1). At this point, different scenarios were built setting up different collective PV arrangements for assessment. At last, outputs were collected and a set of indicators were calculated. In the next subsections, the various data inputs and the modeling components are described in detail.
3.1. Data
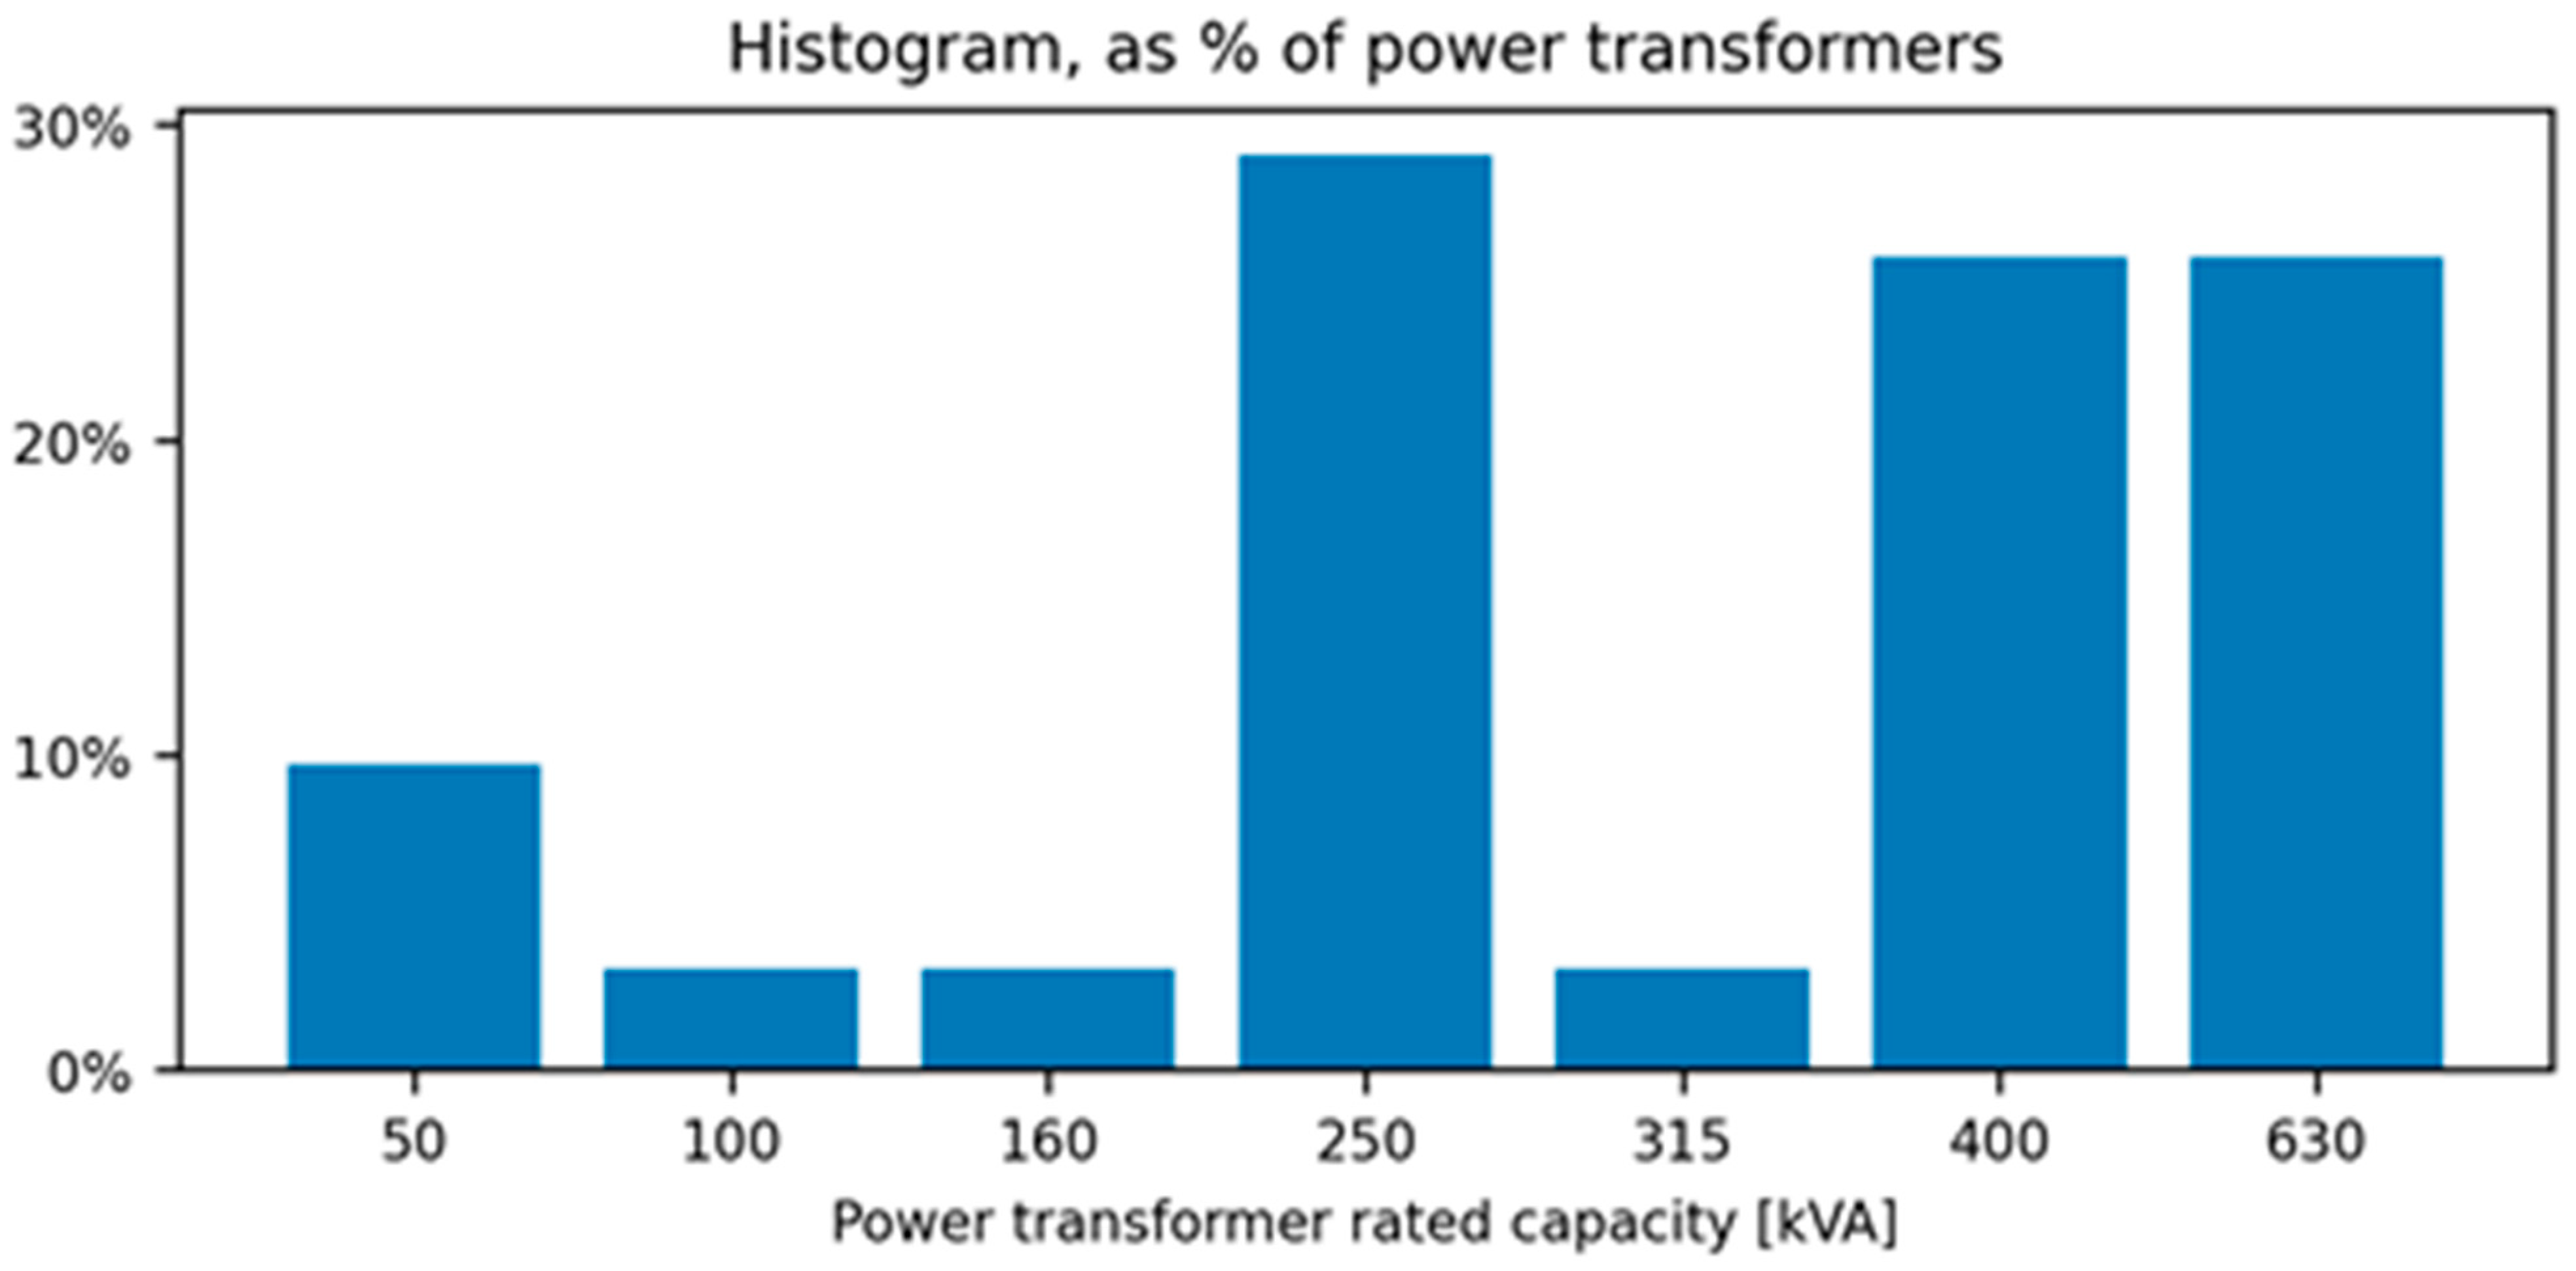
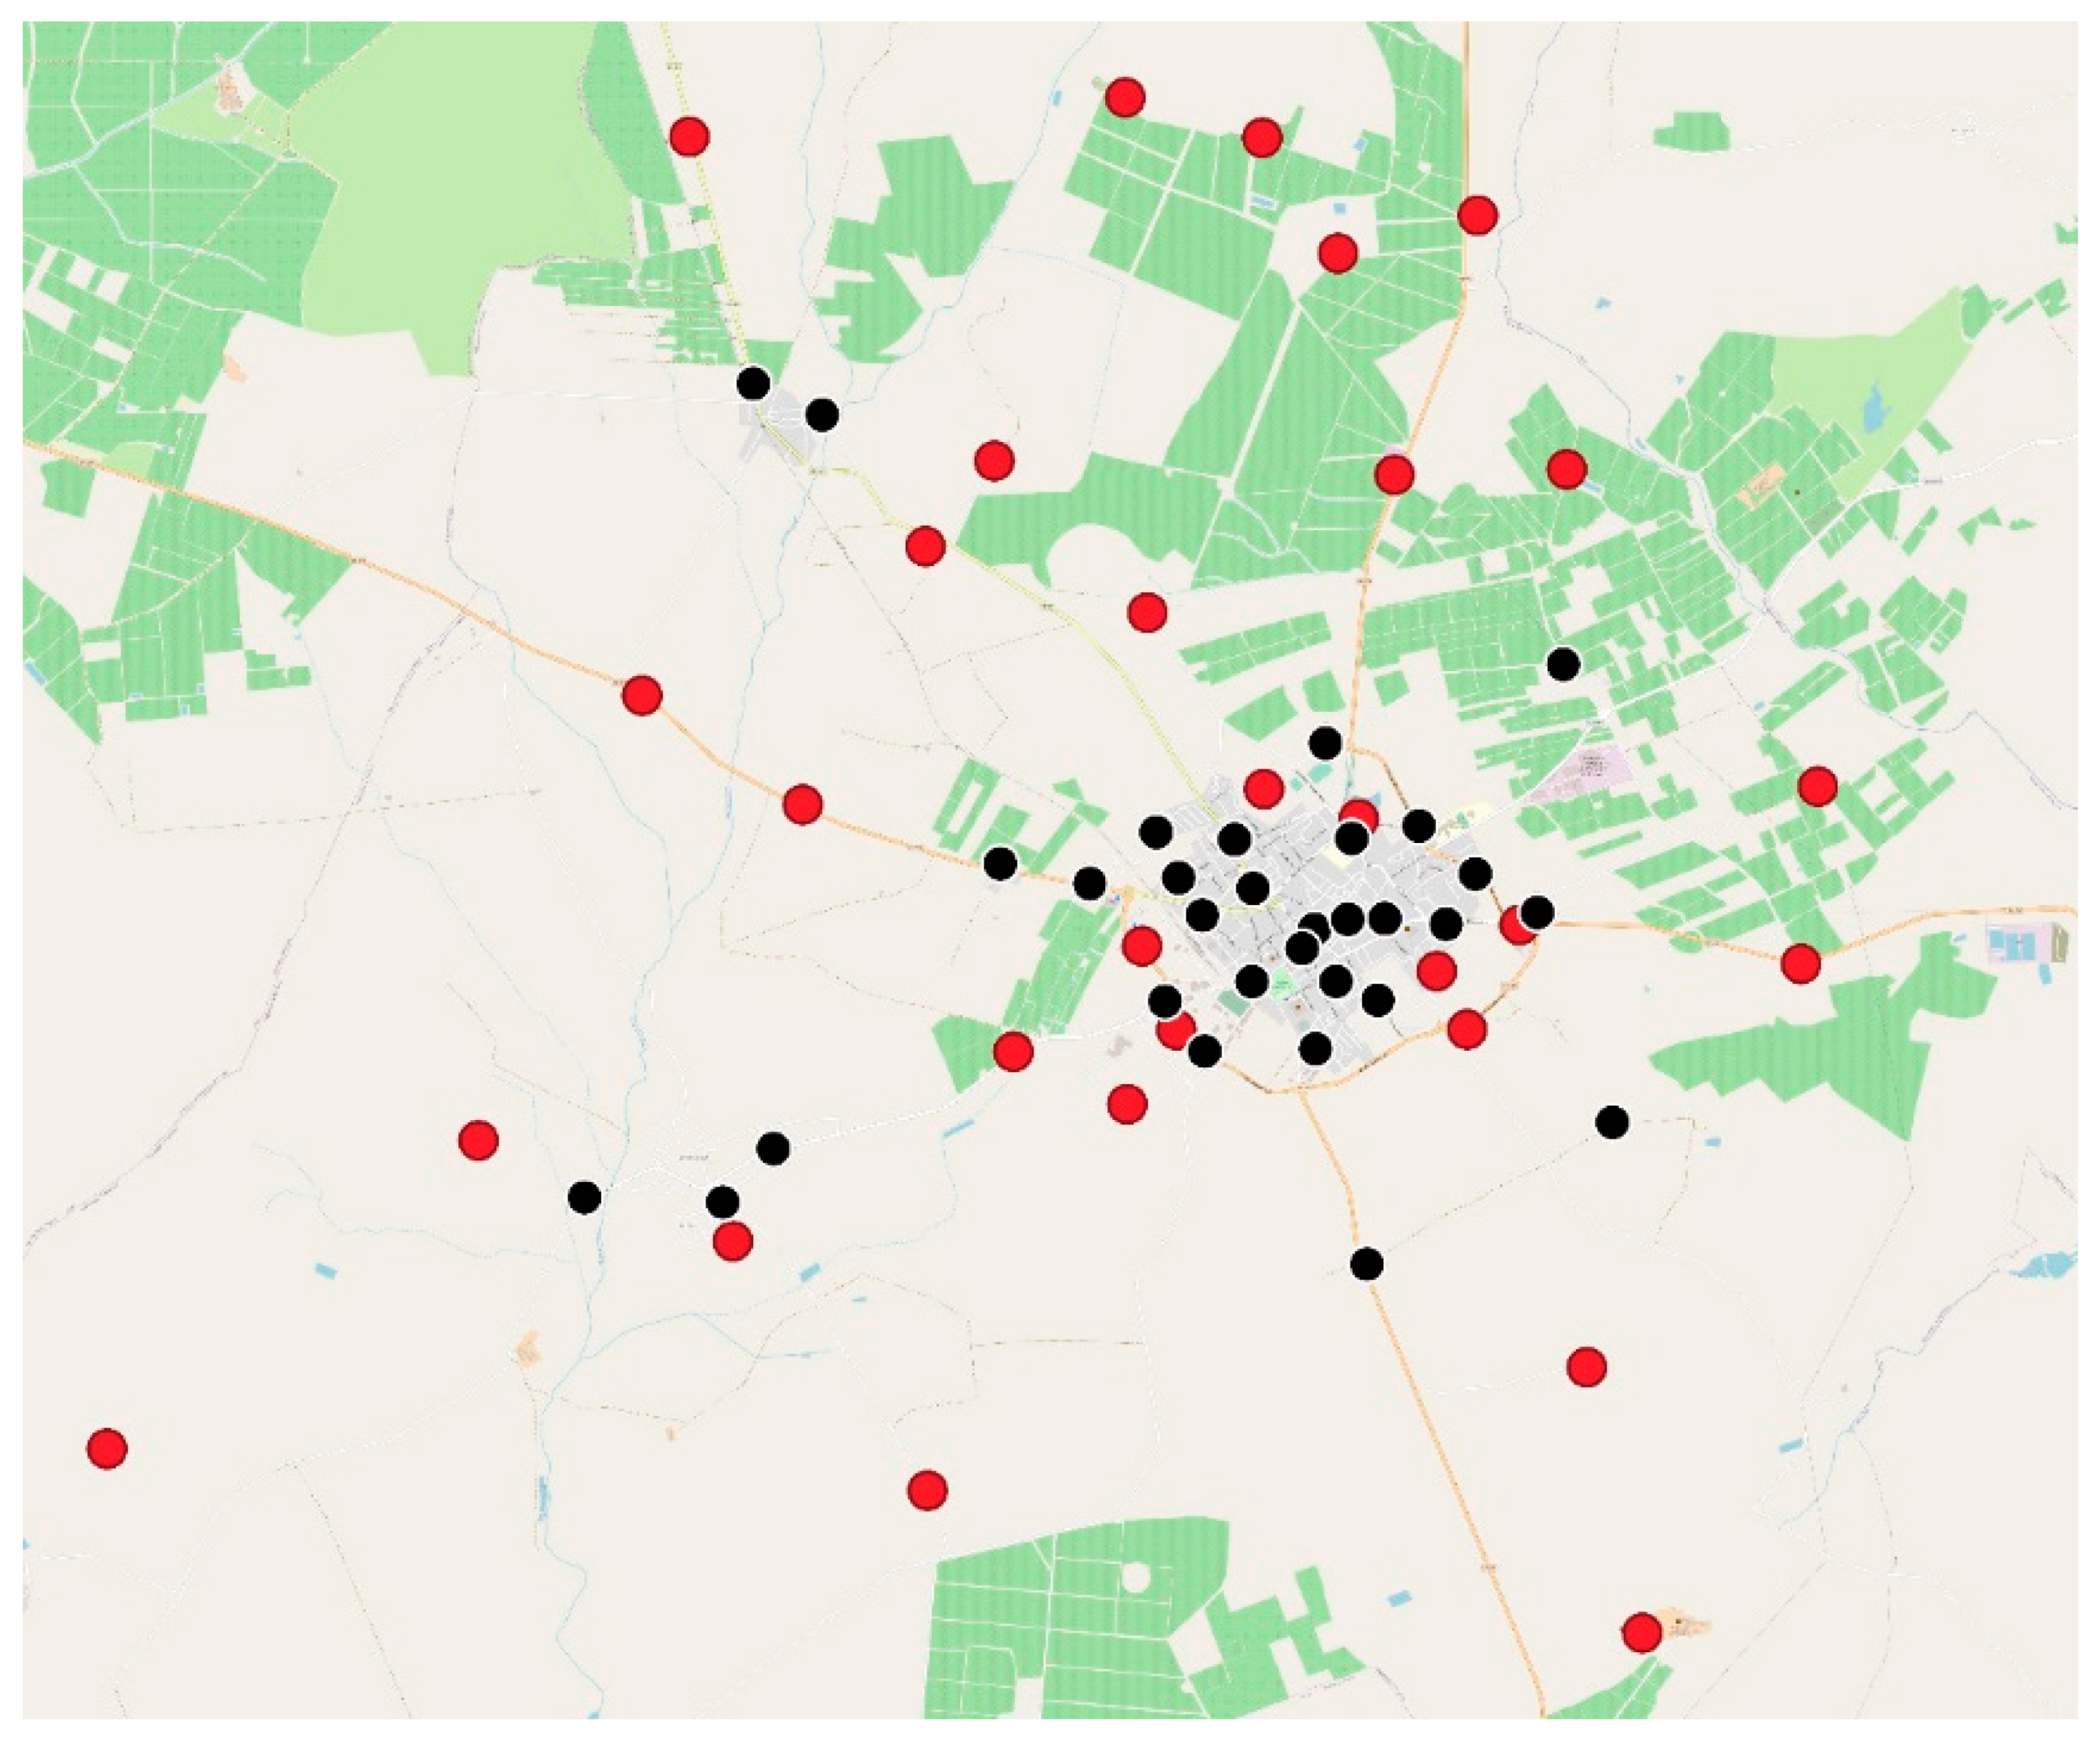
Implementing the EC model in Calliope required multiple datasets, obtained from unrelated sources. Electricity demand timeseries with 15-min resolution from 31 distribution power transformers (PT) installed in Reguengos de Monsaraz was provided by EDP Distribuição, the national Distribution System Operator (DSO). Although these represent 54% of the existing PTs in the region, their aggregated data corresponds to 73% of the region’s annual electricity demand (17.5 out of 23.9 GWh/year, estimated using municipal-level records [40] calibrated to the population of the city). This partial sampling is justified by data privacy compliance, since the DSO is only allowed to share demand data from PTs that comprise a minimum number of consumption points. This information was complemented by the rated capacity (Figure 2), as well as their geographical position (Figure 3).
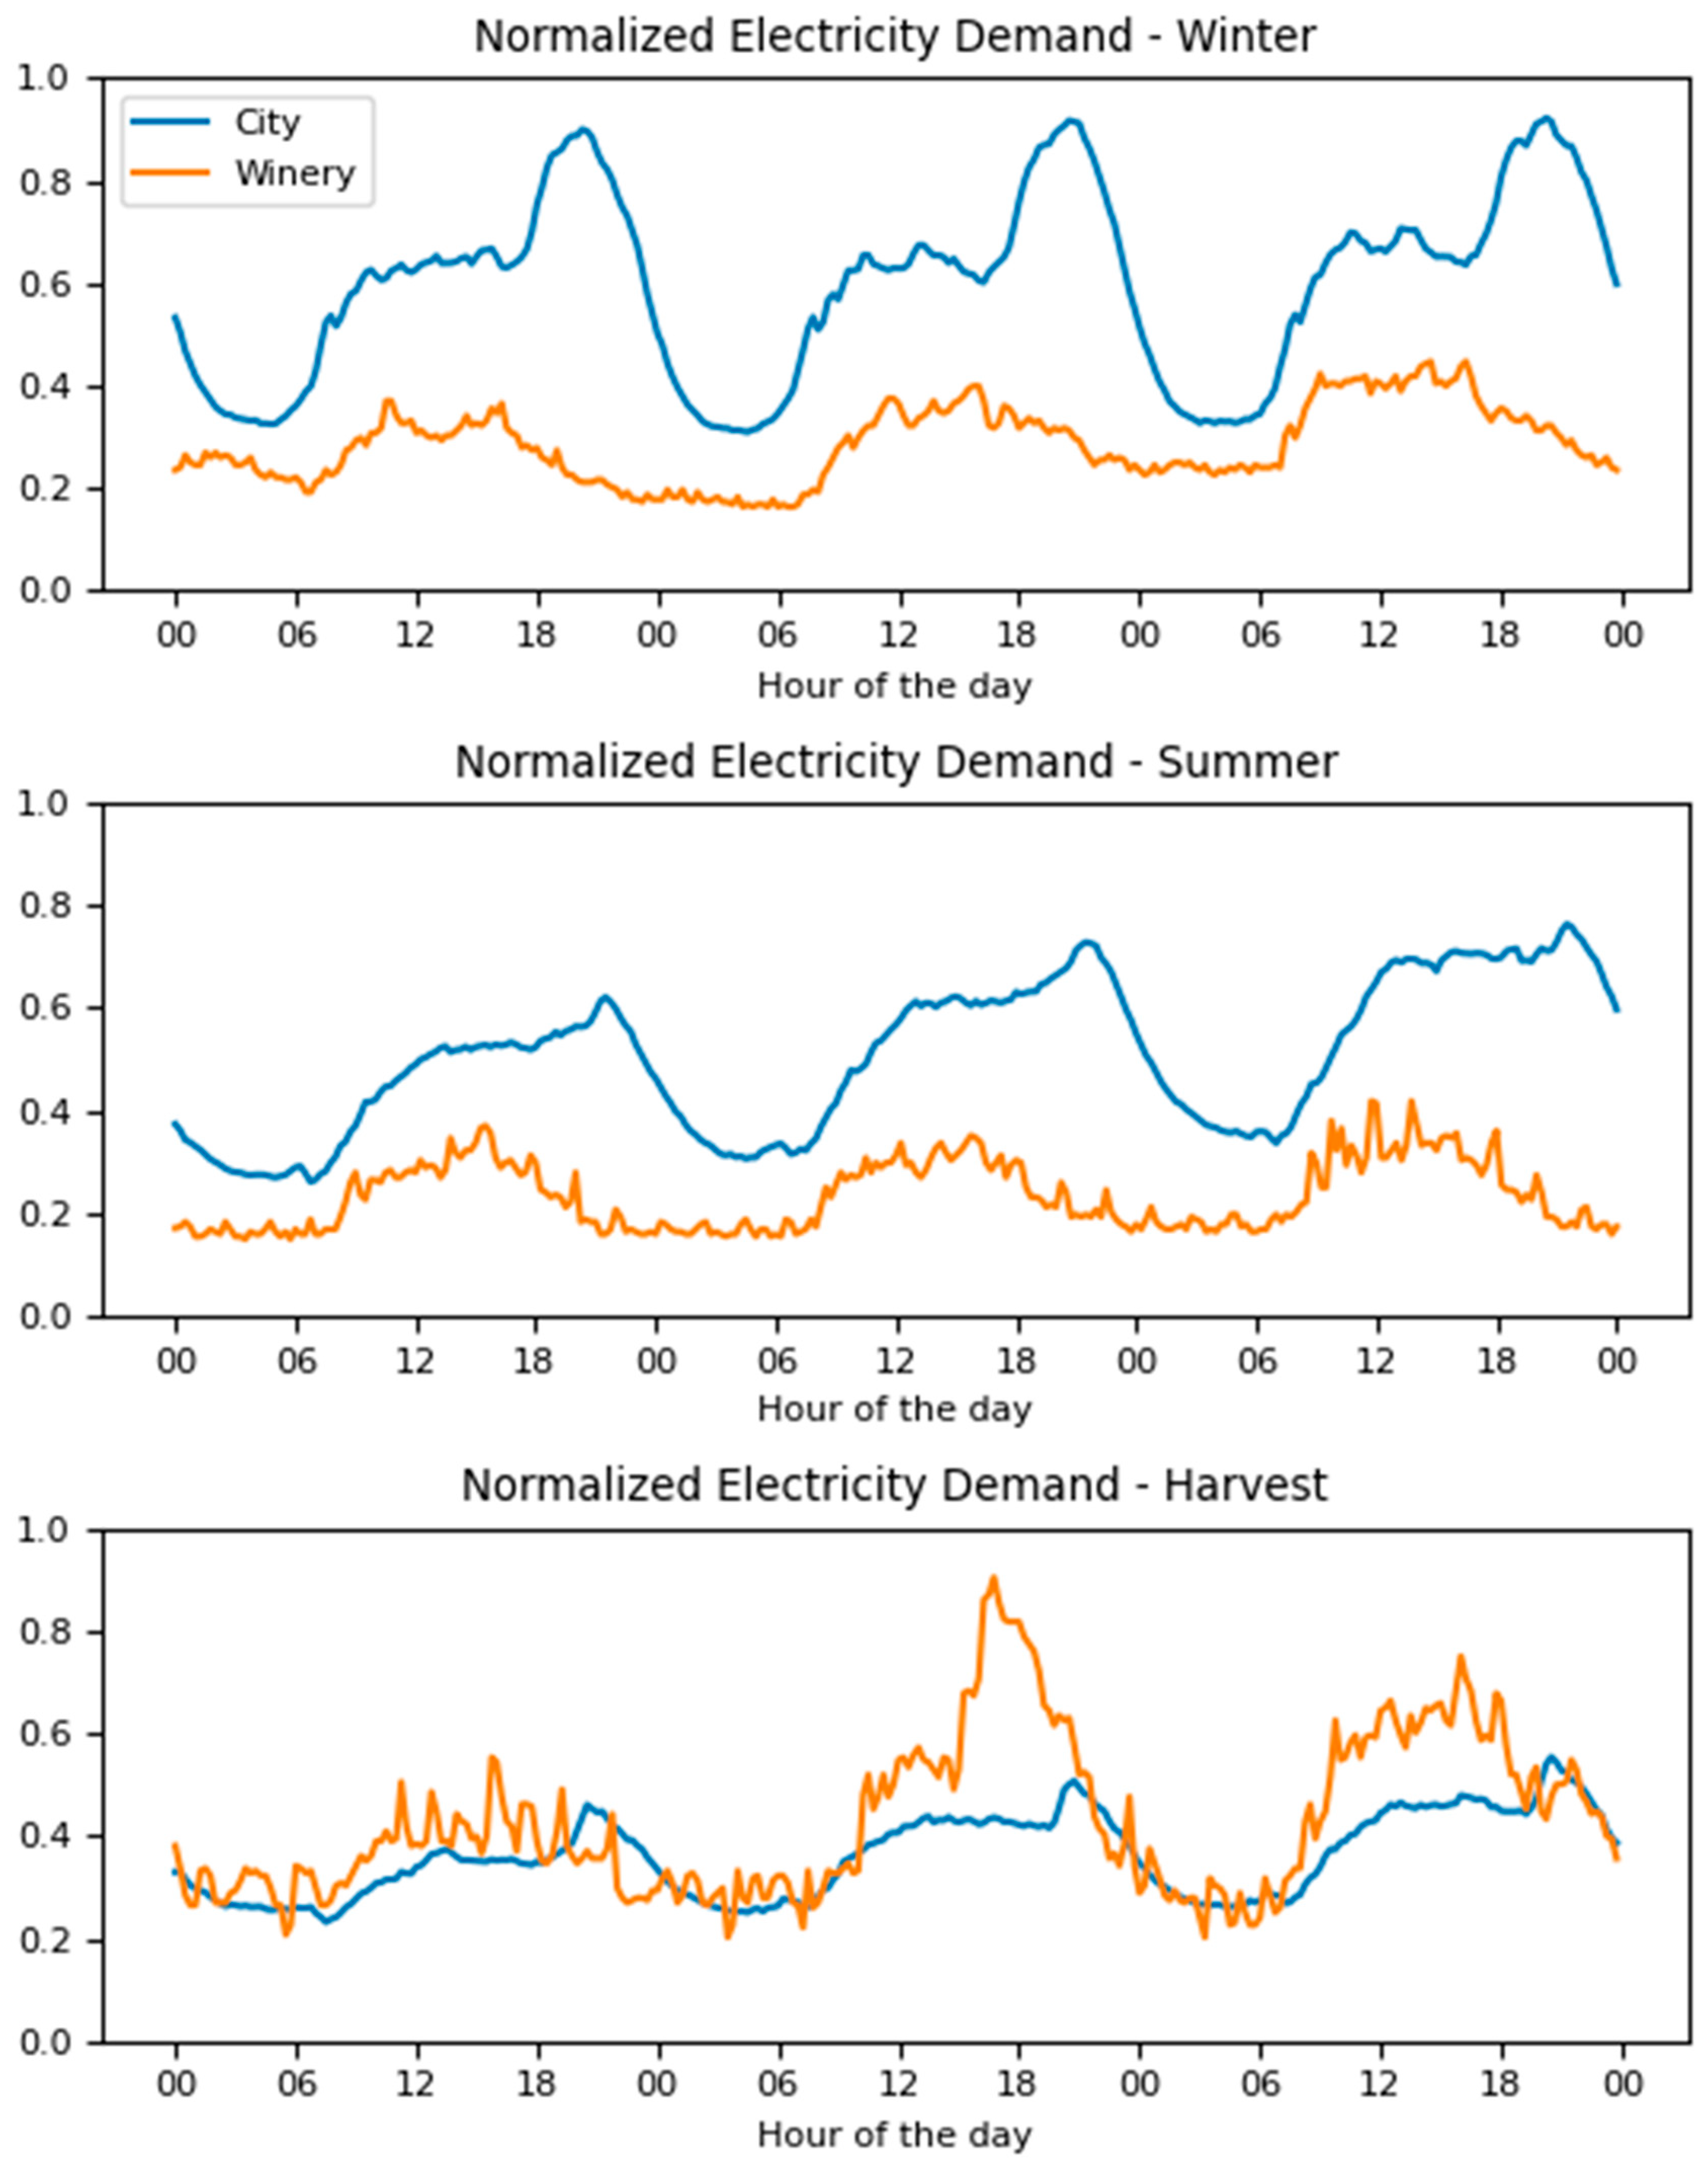
Additionally, electricity demand data was obtained from the local winery considered in this work, with a total electricity demand of 2.17 GWh/year. Figure 4 and Figure 5 compare the normalized load profile of the city and the local winery at different time scales. The first figure focuses on an intraday resolution, highlighting the afternoon peak load of the city, characteristic of residential consumers, mainly during the wintertime when demand is overall higher (Figure 4, top row). It is also possible to observe the high seasonality of the local winery, with considerably more demand during the harvest period and a stronger daily pattern during weekdays (the second and third day of Figure 4, bottom row). Figure 5, showing total daily demand throughout the year, clearly displays the seasonality of both load profiles, with the city having a higher electricity demand during wintertime and the local winery during September and October. The highly seasonal consumption pattern observed for the winery (with a peak between September-October) confirms the challenge that a massive adoption of renewable energy systems represents (mentioned in Section 2.2.). The establishment of an EC with other local actors with whom synergies can be established may be a solution to address this issue.
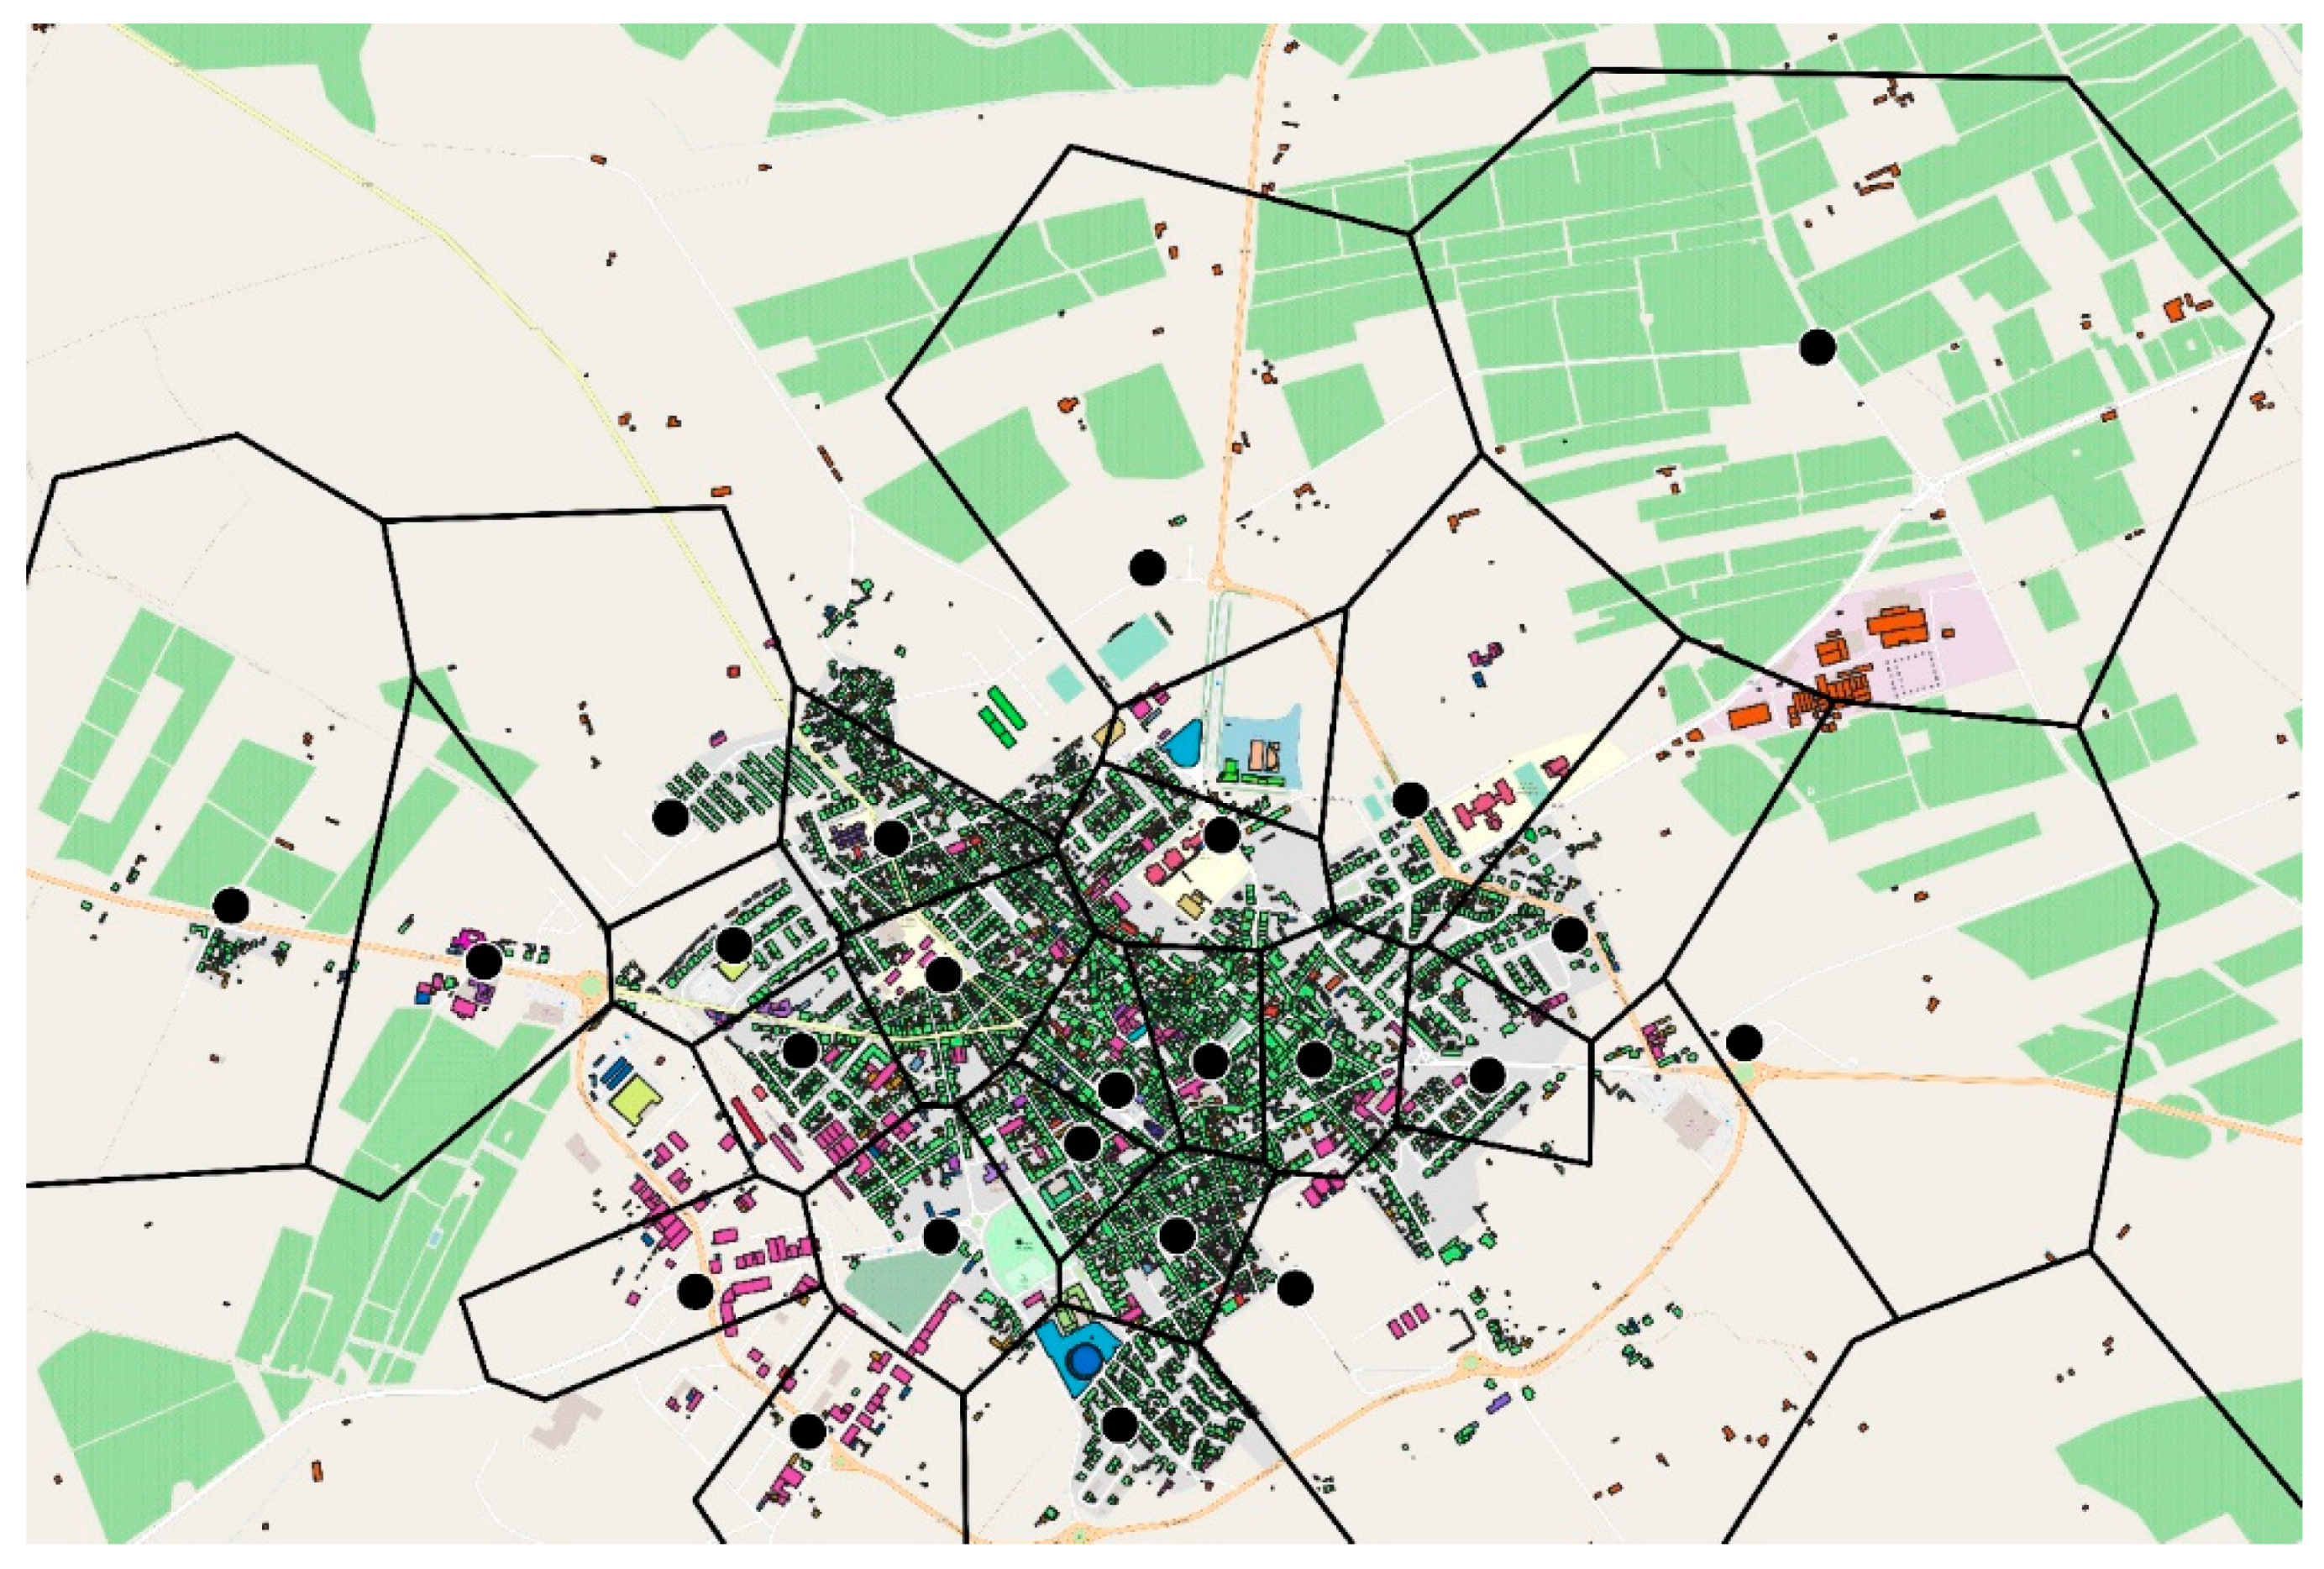
In order to quantify the available areas for the installation of rooftop PV, a GIS-based rooftop cadaster was provided by the local municipality. Unavailable or degraded areas were dismissed, according to their use classification already included in the dataset. As the correspondence between the various buildings and the respective PTs was unknown, Voronoi polygons were computed using the PTs as generating points (Figure 6). Based on this approach, the total rooftop area contained in each of the polygons (histogram in Figure 7) was assigned to the respective PT and inserted in Calliope as a constraining parameter (cf. Section 3.2.2). As the rooftop tilt and orientation was not provided, it was assumed, as a simplification, that all areas have an optimal geometry for PV generation, i.e., south-facing with orientation equal to latitude.
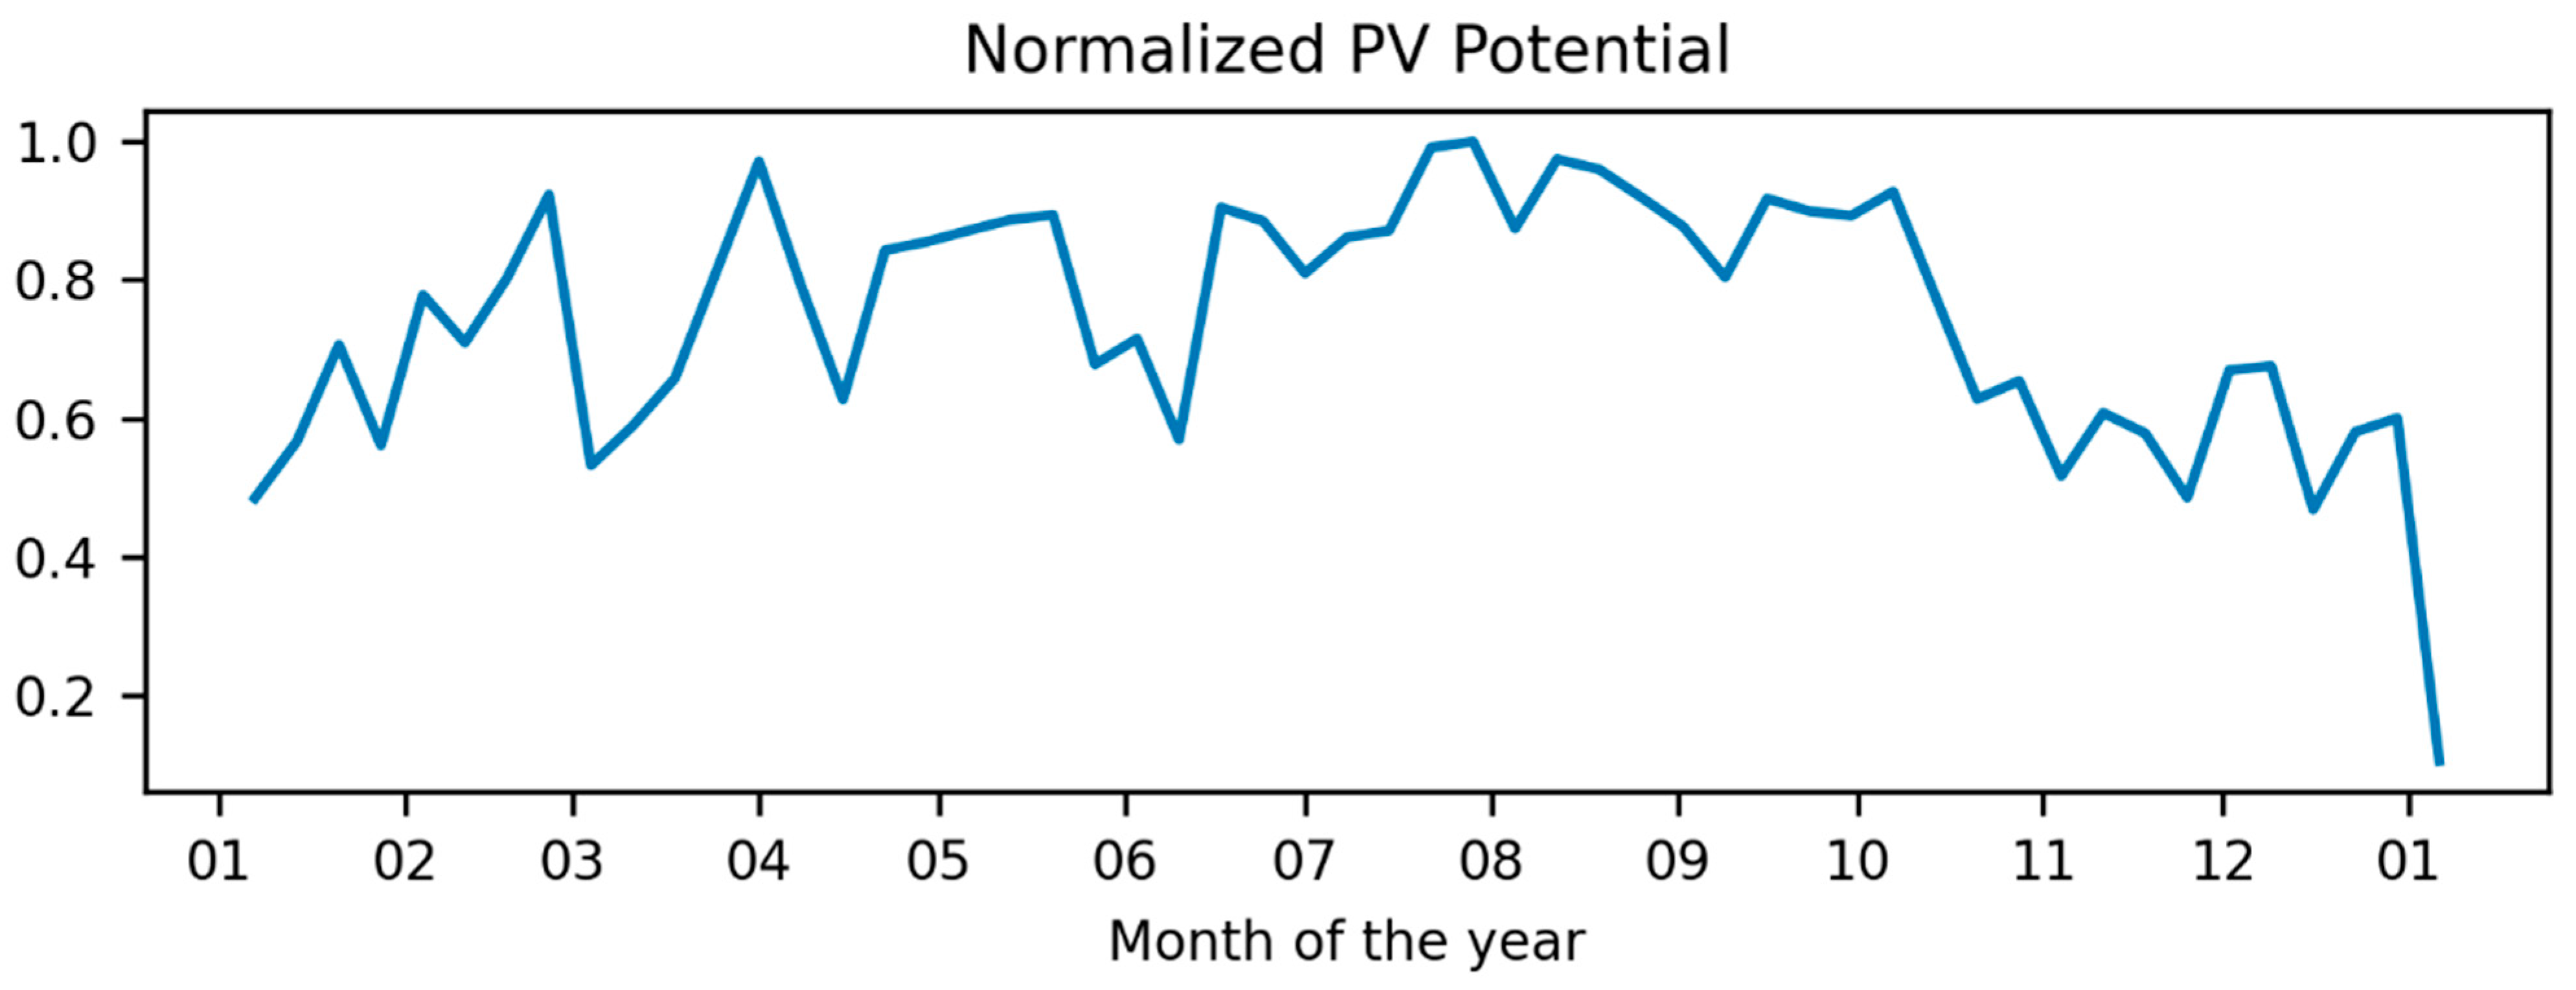
Lastly, 15-min weather data, i.e., on solar irradiance and air temperature, was provided by SoDa—Solar radiation Data [41]. The irradiance data are respective to a plane of array identical to the assumed rooftop geometry: south-facing and orientation equal to the location’s latitude. To convert the weather data to PV potential, a generic approach was considered, in order to avoid assuming a specific, but arbitrary, PV module. Thus, solar resource was converted to effective PV potential by assuming a 17% efficiency in Standard Test Conditions (STC) and a −0.04%/°C temperature coefficient. The module temperature was estimated using the Sandia model for a glass/cell/glass module type, with solar irradiance incident on the module, ambient air temperature, and wind speed as inputs. Figure 8 shows the calculated PV potential profile for Reguengos de Monsaraz, with typically higher values during summertime and some weather-related variability.
An overall description of the used datasets is synthesized in Table 2.
3.2. Modeling the Local Energy System and the Energy Community
For this work, the energy modeling tool should adequately describe three different perspectives of the local power grid: (i) a spatially-resolved characterization of the electricity demand and PV generation; (ii) the relevant technical constraints, i.e., the PTs rated capacity and corresponding rooftop area availability; and (iii) the various costs associated to equipment acquisition and grid use (through grid tariffs). To do so, the Calliope framework was used as a computational modeling and optimization tool.
3.2.1. Calliope—An Overview
Calliope is a Python-based multi-energy system modeling and linear optimization framework [42,43,44]. It allows users to consider the behavior of energy systems both in time and in space (i.e., energy fluxes between nodes) and is quite flexible as an energy modeling tool. There are several studies exploring this framework, with different spatial scales and end goals: evaluating concentrated solar power as a possible replacement for nuclear power plants in South Africa [45]; assessing if the phasing out of nuclear power in Switzerland is feasible [46]; explore the potential of gas power as a bridging fuel in the transition to wind and solar power [47]; or evaluating the trade-offs between geographic scale, cost, and infrastructure requirements in a 100% renewable Europe [48]. As pointed out before, Calliope has also been applied for smaller spatial scales, such as neighborhoods or small urban districts [29,30].
This modeling framework is built on three essential elements: locations (nodes), technologies, and links. Locations are specific points in space (e.g., a single house, a piece of land in which an individual power plant can be installed, entire cities, regions, or continents) to which users can associate energy consumption and/or generation. Technologies, on the other hand, correspond to equipment that consume, produce, convert, transport, or store energy (e.g., power generators, battery systems, electric devices, or grid cables). Additionally, as a multi-energy framework, Calliope can model any kind of energy carrier, whether it is heat or electricity. Links are the elements which interconnect the different locations and enable energy fluxes between them, usually coupled with energy transfer technologies (e.g., power lines, heat pipes). Furthermore, Calliope allows users to define a broad range of technical and economic parameters to characterize locations and technologies but also several constraints that allow for modeling energy systems behavior (e.g., the available area in a given location, the conversion efficiency, area occupancy or unitary cost of a given technology, the resource a given generator depends on—solar or wind—or the maximum power flow a given link can withstand). Calliope builds a linear optimization problem (c.f. [29] for its formulation) with the objective of minimizing the total system cost which can then be solved using any available solver (e.g., Gurobi, CPLEX, GLPK, CBC). Other objectives, such as minimizing CO2 emissions, may also be considered. Calliope returns a range of outputs, such as the optimal capacities for each technology and location, alongside a myriad of interest variables.
3.2.2. Designing the Local Power Grid Layout
The designed local power grid includes the following elements: a set of medium-voltage distribution PTs; a substation; and transmission cables interconnecting these elements. Each distribution PT represents an associated low-voltage grid section and the corresponding aggregated electricity demand, as well as rooftop area availability for installing PV. On the other hand, the electricity supply imports and PV generation surpluses flow through the substation, as it is a bidirectional interface between the PTs and the higher voltage generators or adjacent regional grids.
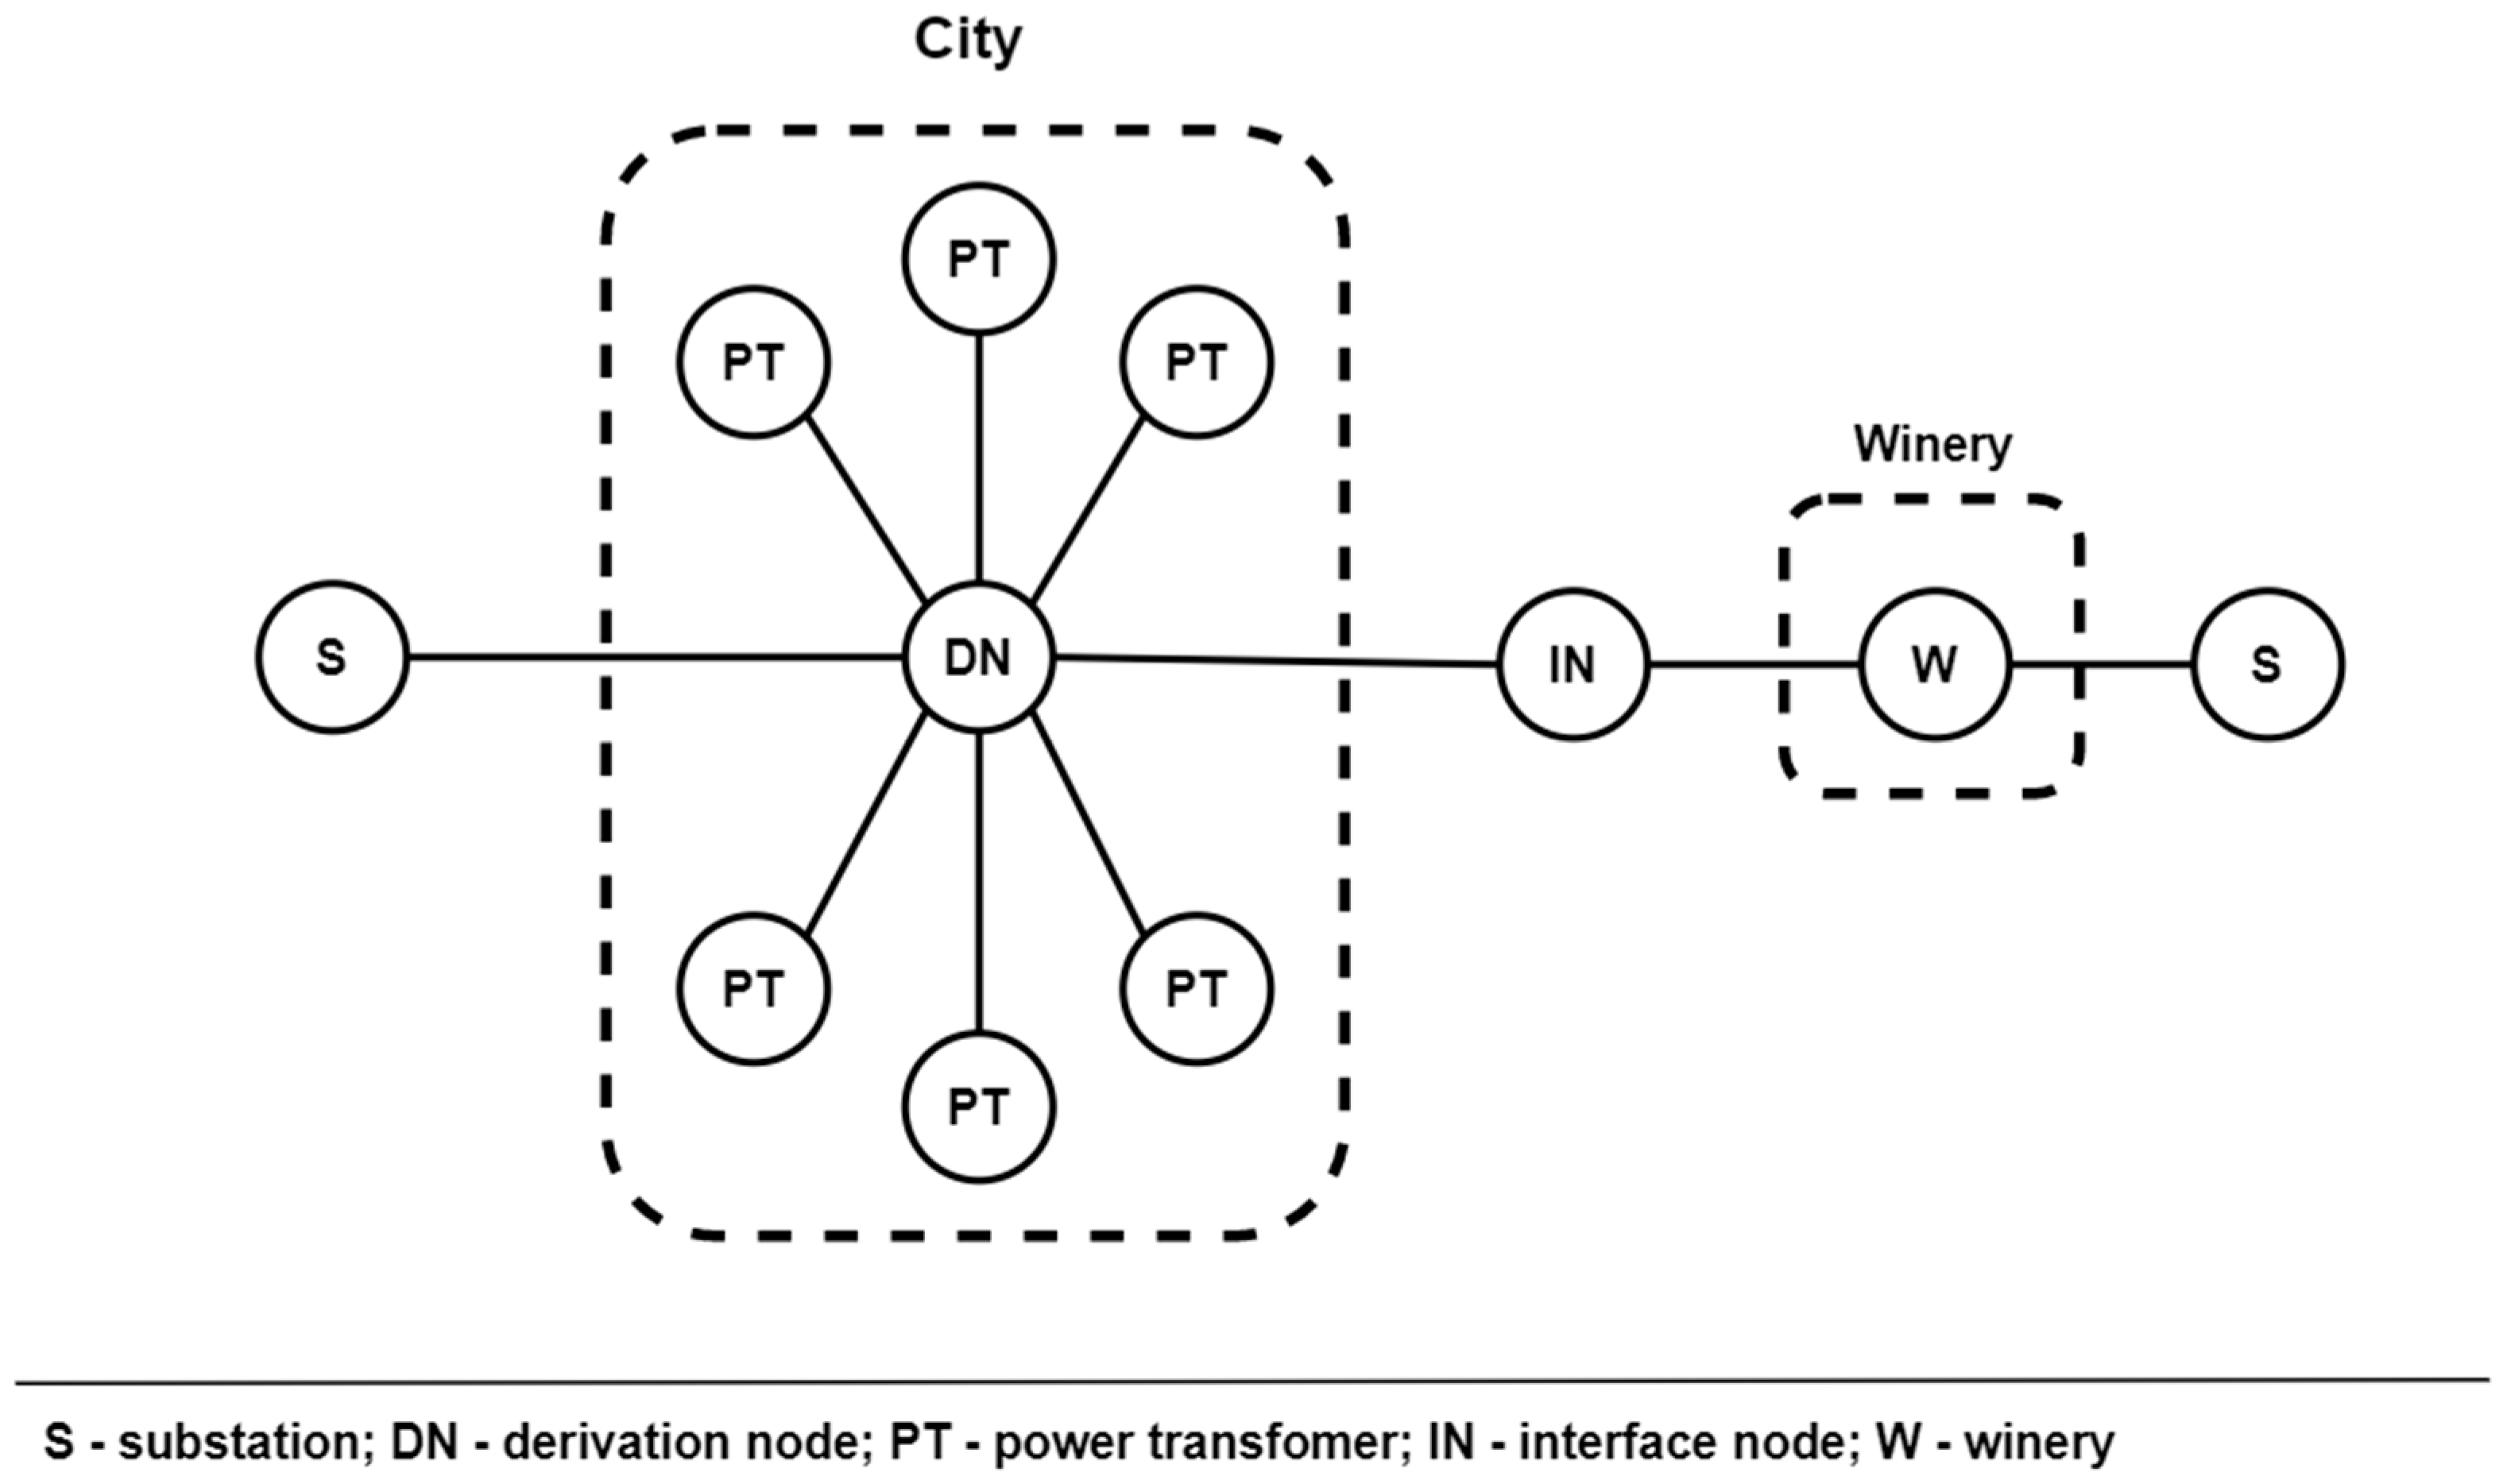
A detailed representation of how the various PTs are connected (i.e., the layout of the power grid) would lead, necessarily, to a larger computational complexity resulting in prohibitive computational times. However, as it would not bring an added value to the simulation, the power grid layout was simplified, assuming a star topology as shown in Figure 9. In this simplified representation, the substation is connected to a derivation node which, in turn, is connected to various PTs, each representing an LV grid section. Each of these nodes has associated the net demand from the corresponding PT as well as the total rooftop area available, with the latter corresponding to an upper bound for PV deployment in the Calliope optimization process. An extra location was inserted, working as an interface between the city and the winery and where, as described in more detail in the following subsection, the grid tariff for energy exchanges between actors on different voltage levels (in this case, the LV-grid and MV-grid for the city and the winery, respectively) is charged.
3.2.3. Grid Tariffs Allocation
Collective self-consumption schemes can have members residing in a location different from the one where the self-consumption system is installed, implying the possible use of the public grid. For consumers in the same voltage-level, the Portuguese regulation states that in such situations, the renewable generation is to be charged by the grid tariffs respective to the voltage levels it goes through to reach a given consumption point. In other words, a given collective self-consumption investment can maximize its profitability by minimizing the use of the public grid.
For low-voltage consumers, the grid tariff components are as follows: 5.88 c€/kWh for the use of the low-voltage grid (τgrid,LV); 0.65 c€/kWh for the mid-voltage grid (τgrid,MV); and 0.59 c€/kWh for the high-voltage grid (τgrid,HV). PV generation, which is consumed on-site and, therefore, does not use the public grid, is exempt from such tariffs.
Since electricity demand was only available at the PT level, the PV generation also has to be modeled at the same aggregation level. This does not allow to quantify how much of the PV generation is consumed on-site and how much of it uses the public grid to reach a prosumer on the same LV grid section (i.e., below a given a PT). Thus, the use of the public grid for collective self-consumption below a given PT and the corresponding grid tariffs application was parametrized under certain assumptions (described in the next section). The PV generation from the winery, which is consumed on-site, was considered to be exempt from grid tariffs even if the winery consists of different buildings, as the whole industrial facility is considered to belong to a single internal grid. On the other hand, the grid tariff for energy exchanges between low-voltage and mid-voltage grid consumers (τgrid,LV-MV) has not yet been regulated in Portugal. Thus, to assess the feasibility of collective PV arrangements which involve such exchanges, a sensitivity test was performed considering τgrid,LV-MV values between 5 and 11 c€/kWh.
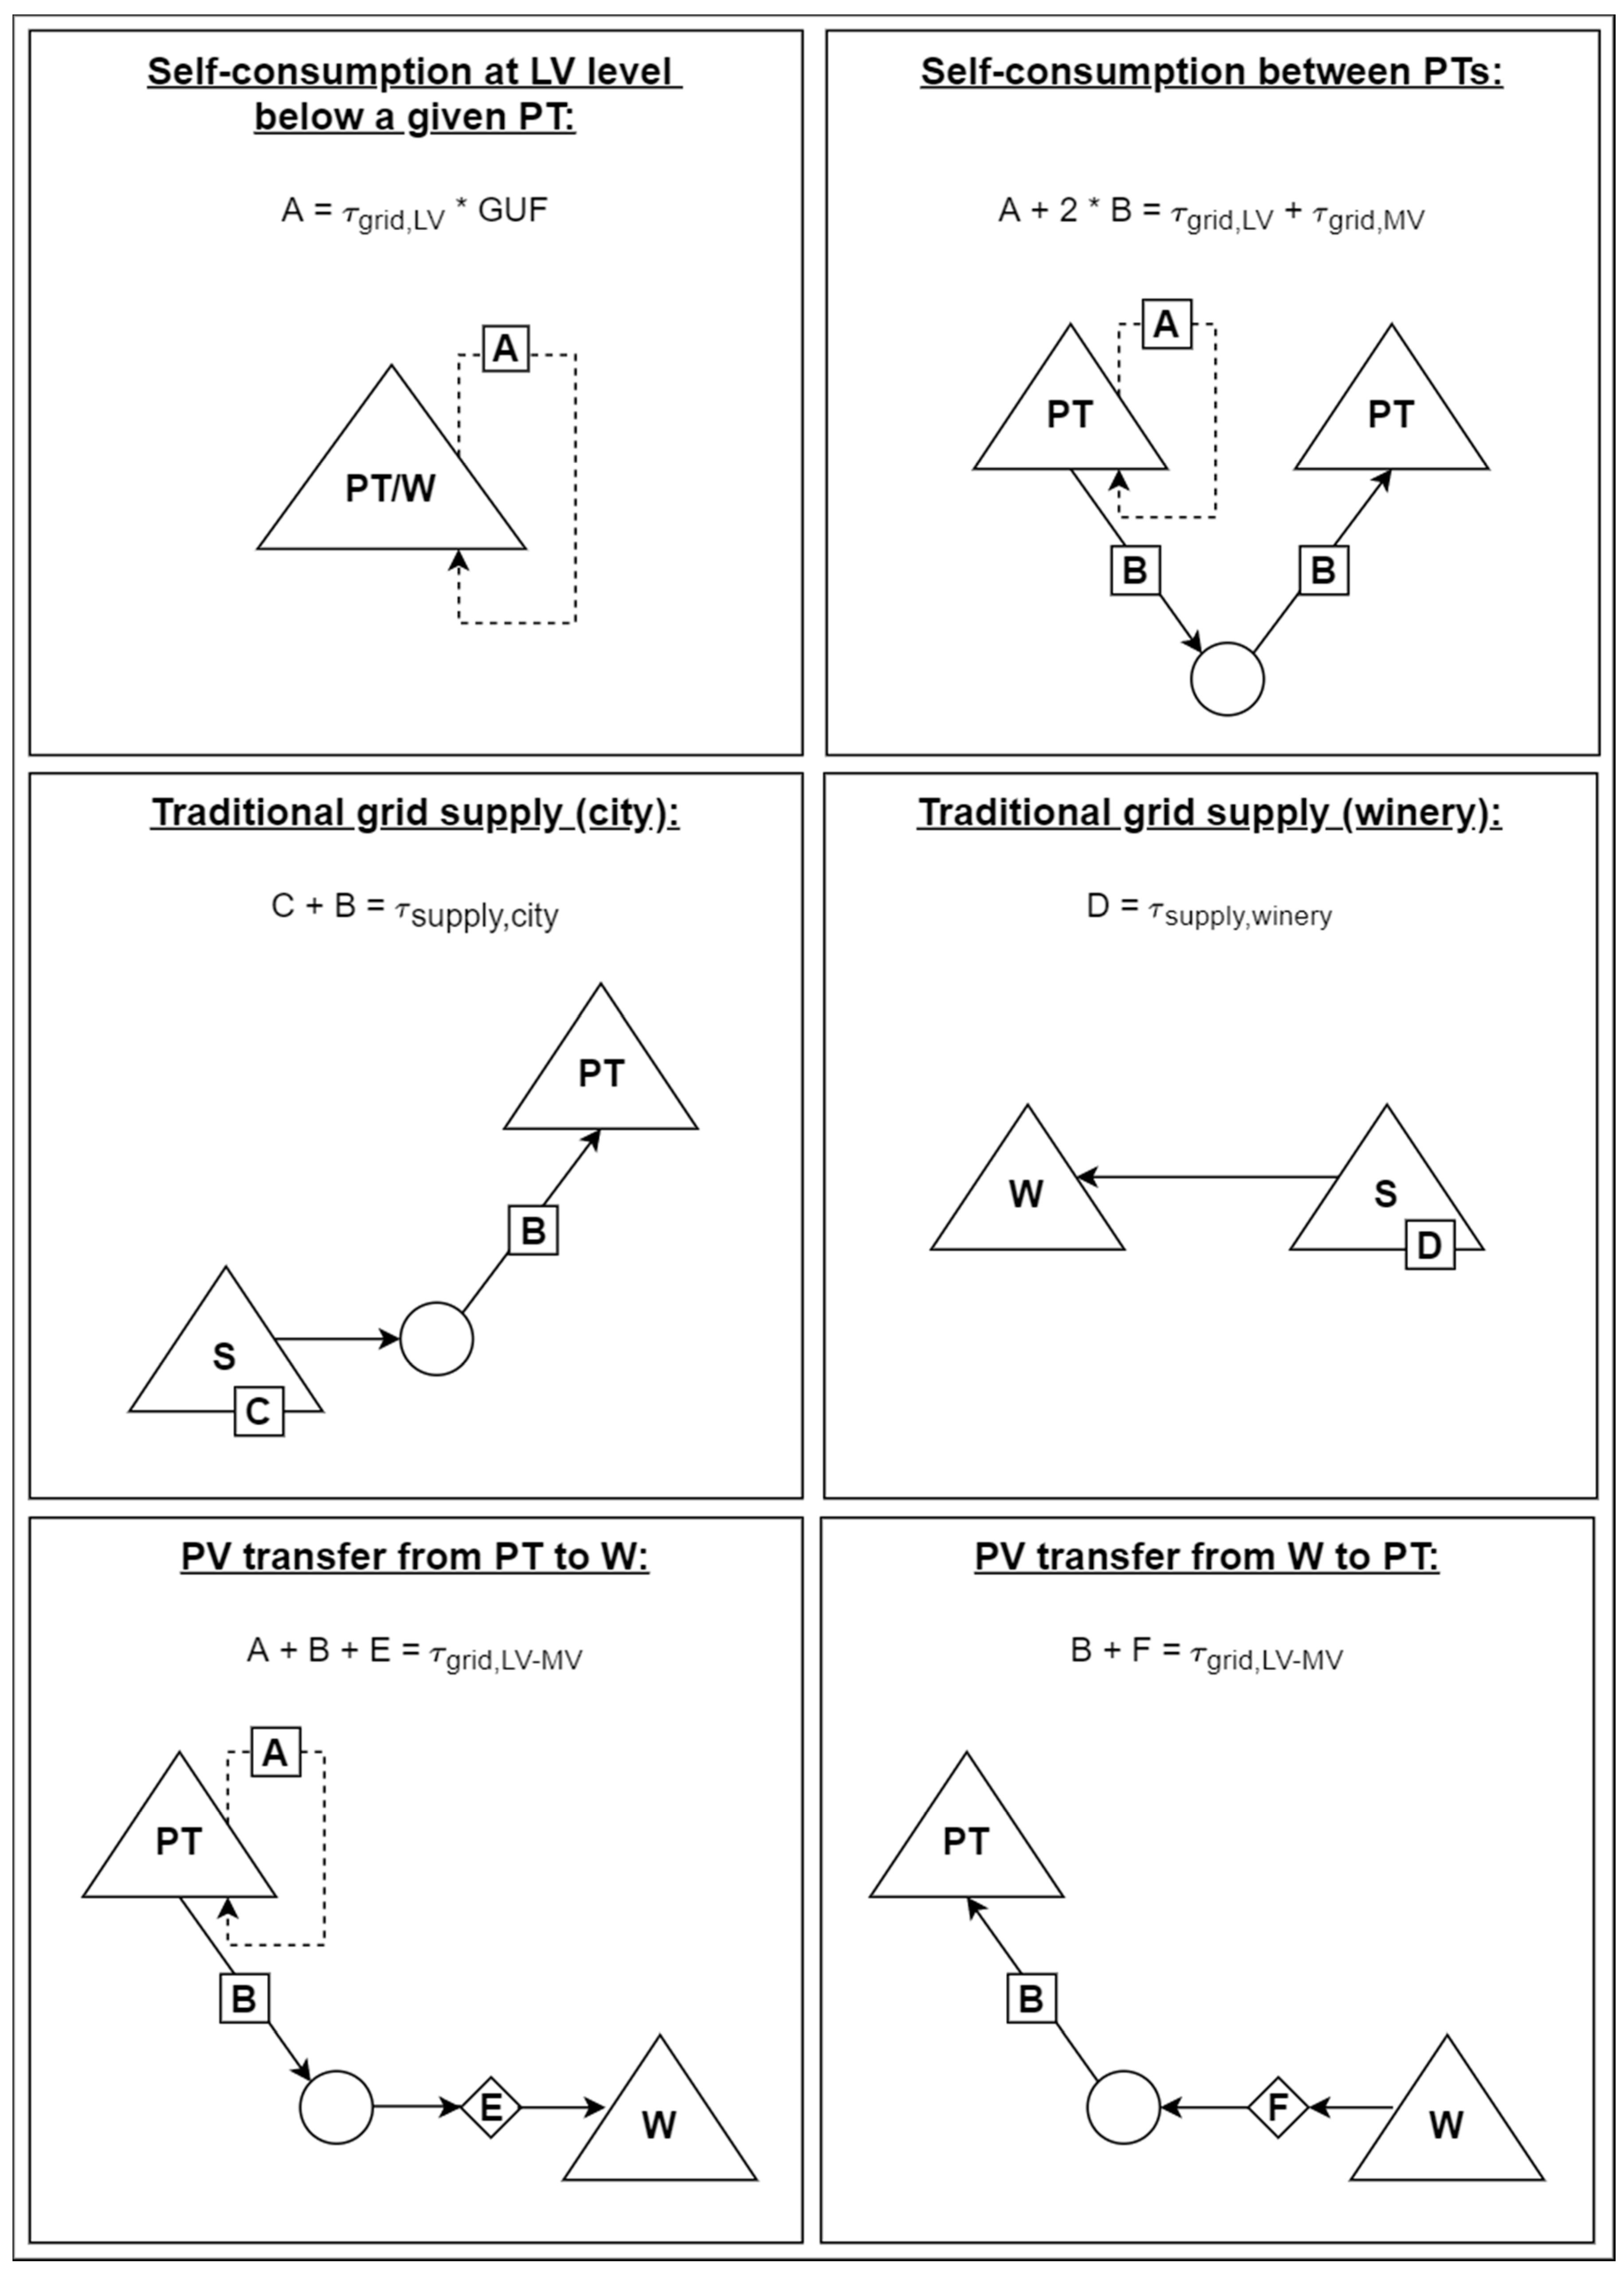
To correctly model this scheme in Calliope, it was important to consider how the energy flows across the designed grid. Four different situations may occur: (i) electricity is supplied from the substation directly to a given PT or the local winery; (ii) PV generation is consumed in the same PT where the PV system is installed; (iii) PV surplus from one PT is transferred to a neighboring PT; (iv) PV generation from the winery is transferred to one or more of the city’s power transformers (or the other way around). Based on this, Figure 10 illustrates how the various costs are allocated. Four volumetric cost parameters (which can correspond to the carrier production cost, or om_prod, parameter in Calliope) were then defined: A, which is allocated in the PV generation of each PT; B, which is allocated in the link (i.e., transmission cable) that connects each PT to the derivation node; C and D, which are allocated in the substations for the city and the winery, respectively (this apparent duplication is driven by the different electricity price and grid costs assumptions of these two actors); and E and F, which are allocated in the interfacing node between the city and the winery (in this case motivated by the different elements involved in the two possible directions, adding the possibility for the LV-MV tariff to depend on the assumed direction).
3.2.4. Modeling Assumptions and Simplifications
In order to implement the energy system model in Calliope, further assumptions were made, listed in Table 3 alongside the reasoning behind them.
Even though 15-min data was provided for the electricity demand and the solar resource, the corresponding model built in Calliope implied a prohibitive memory demand. To circumvent this, and in order to reach a viable compromise between temporal resolution and temporal coverage, the data were resampled to 30-min timesteps and alternate days were considered (i.e., the first of every two days). This approach reduces the amount of data by a factor of 4 while still maintaining the annual seasonality of electricity demand and solar resource as well as a rather high intra-day resolution.
When compared to other works identified in the literature (cf. Table 1), this work is, according to the authors’ best understanding, the first to model collective self-consumption systems while considering the application of grid tariffs to the RES generation using the public grid infrastructure. Regarding data characteristics, the considered 30-min temporal resolution and 1-year coverage is in line with most of the reported values (between 15 and 60 min; and 1 year, unless synthetic datasets are considered). From a spatial point of view, this work considered a coarser resolution than several other references (i.e., aggregated at the PT level opposed to individual household data), which required the set of assumptions previously described. However, the grid layout and network constraints (i.e., the PTs rated capacity) were considered, whereas most works in the literature assume a single-node approach. Several of the tools used (e.g., TIMES, Calliope, and SystemC-AMS) are in fact complementary with each other, as they address different perspectives such as energy system planning or operation) with different spatio-temporal scales. Thus, the use of several tools to model the same case study can greatly contribute to a deeper understanding of the feasibility of a given EC configuration.
3.2.5. Scenarios and Pathways for an Energy Community in Reguengos de Monsaraz
The flexibility of ECs regarding how the distributed generation is allocated allows for EC designers to leverage on the different characteristics of the actors involved. Thus, this work considers and evaluates a set of scenarios with different PV arrangements, representing possible pathways for the implementation of the EC in which the involved actors (i.e., the city and the winery) can perform different roles and establish synergies.
The following scenarios are here considered:
- Independent self-consumption.
- Alternating the prosumer/consumer role between actors:
- Winery as a prosumer, city as a consumer.
- City as a prosumer, winery as a consumer.
- Both actors as prosumers, assuming two PV adoption scenarios for the city:
- Rooftop PV capacity equivalent to 10% of diurnal electricity demand.
- Rooftop PV capacity equivalent to 75% of diurnal electricity demand.
In scenario 1, PV generation is not allowed to flow between the city and the winery. This constrains PV’s capacity to be installed in each of the actors, with each one optimizing its own system in a self-consumption model. In scenario 2, the exchange of PV generation between actors was allowed, but PV capacity could only be installed in the city or in the winery. In scenario 2a, only the winery can install PV capacity, being also able to supply the city. In scenario 2b, only rooftop PV capacity can be installed, distributed among the various low-voltage networks represented by each of the PTs. In scenario 3, PV capacity can be installed in both the city and the winery, and PV generation can flow from one to the other, i.e., energy trading is allowed. To understand how the residential PV deployment impacts the role of the winery in the EC (namely, its optimal PV capacity and the exchanges between the two actors), two sub-scenarios were designed: in scenario 3a, which corresponds to a modest penetration of PV, the installed capacity in each PT generates the equivalent of 10% of the corresponding diurnal electricity demand; in the more ambitious scenario 3b, this value is raised to 75%.
In short, while scenario 1 represents a context where there is no collaboration between the city and the winery, the remaining scenarios correspond to different collective arrangement possibilities that could be considered in an EC framework. Additionally, it is important to compare the electricity costs of all these scenarios with a baseline case where no PV capacity is installed (scenario 0), i.e., a scenario in which all energy is imported from the grid.
3.2.6. Considered Assessment Metrics
The different collective PV arrangements were evaluated and compared based on some of the relevant optimization outputs: PV installed capacities, area occupation (city rooftops and the winery terrains), and production/demand timeseries. However, in order to assess the technical and economic performance of the EC, additional metrics were considered: (i) the levelized cost of electricity (LCOE) for PV (LCOEPV, Equation (1)), which considers the initial capital investment (Ccapital,I,PV) and the capital associated to the grid use of PV (Cgrid use,PV), which represents the payment of the applicable grid tariffs; (ii) the LCOE for the energy system as a whole (LCOEtotal, Equation (2)), which expands the LCOE calculations to include the costs and generation from the energy imports; and (iii) the Self-Sufficiency Rate (SSR, Equation (3)), indicating how much of the electricity demand is supplied by PV generation. For this work, the PV generation exported through the substation was not considered for the SSR calculation:
4. Results
4.1. Scenario 1: Independent Self-Consumption
For this scenario, both the city and the winery were modeled under the assumption that both parties cannot exchange their PV surpluses between them. Thus, the PV capacities are sized considering the city and the winery energy needs individually.
Table 4 synthesizes the results and, as expected, the city installs more PV capacity, since it has a considerably larger electricity demand. However, it does so with a higher LCOE for its renewable generation: on the one hand, residential-scale rooftop systems have a higher unit cost; on the other hand, self-consumption in the city has associated grid costs due to the use of the public grid. Nonetheless, for both cases, the deployment of renewable capacity reduces the overall LCOE of the consumed electricity. While the absolute reduction is fairly similar for the city and the winery (3.69 and 3.02 c€/kWh, respectively), the winery achieves higher relative savings (18 and 30%). This is justified by the higher SSR, which corresponds to a lower dependence of the costlier supply grid, possibly driven by a higher penetration of PV capacity and a better correlation between the PV generation and electricity demand profiles.
4.2. Alternating the Prosumer/Consumer Role between Actors
Scenarios 2a and 2b introduce the possibility of power exchanges between the actors as described in Section 3.2.5. However, the deployment of PV capacity (i.e., the prosumer role) is only allowed in one of them, either the city or the winery. These sub-scenarios represent two opposing strategies towards collective schemes adoption: scenario 2a is a centralized option, in which a PV system, which is exclusively deployed in the terrains of the winery, supplies the whole Reguengos de Monsaraz electricity demand; scenario 2b represents a decentralized option, in which PV capacity is distributed across the rooftops of the city. In the first case, a possible business model would be the winery acting as an electricity supplier from which the city purchases PV energy through Power Purchase Agreements; in the second, a local aggregator of PV surpluses would gather the exceeding generation from the city and sell it to the winery. These scenarios allow for a simple, unidirectional analysis that serves to build more complex scenarios further ahead.
As discussed in Section 3.2.3, since the grid tariff for energy exchanges between low-voltage and mid-voltage is not yet regulated in Portugal, a sensitivity analysis was performed considering tariff values between 5 and 11 c€/kWh.
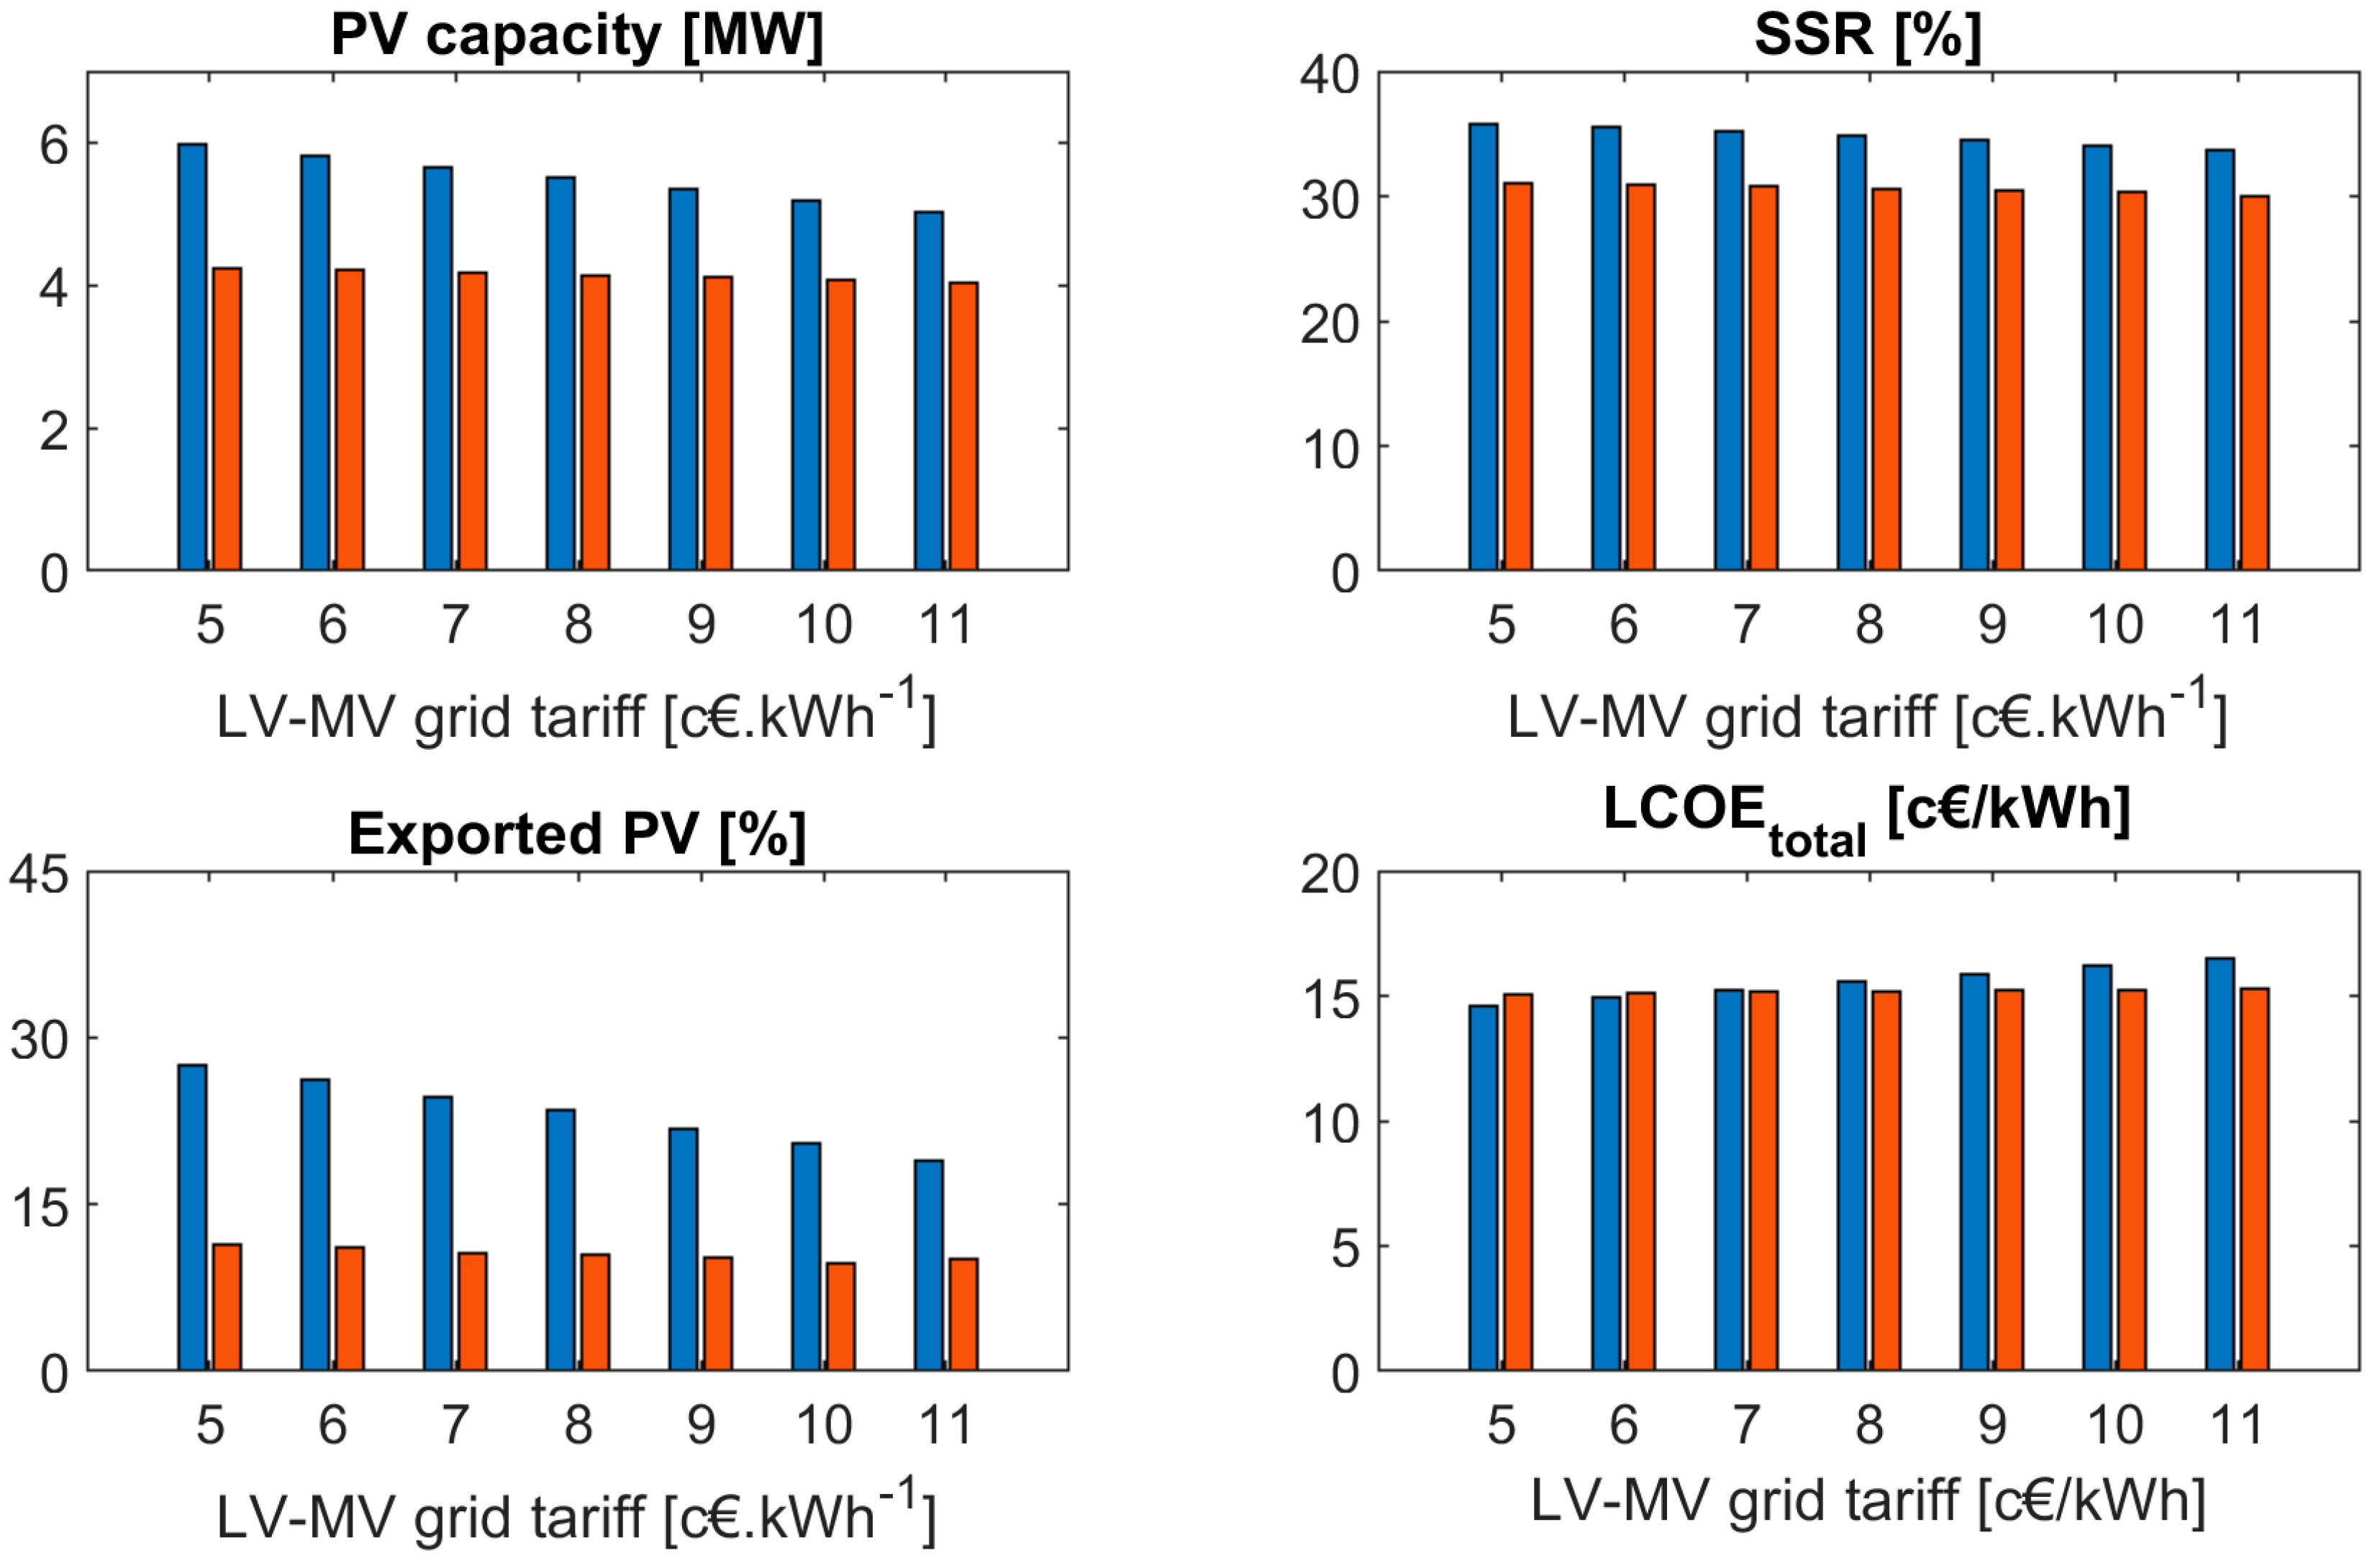
Figure 11 presents the results in a series of bar plots containing the relevant outputs. When comparing the two sub-scenarios, the first conclusion that can be drawn is that installing PV exclusively in the winery (scenario 2a), which implies a cheaper investment cost (cf. Table 3), leading to a larger capacity deployment (5–6 MW vs. 4.0–4.2 MW, when compared to scenario 2b). In both cases, higher LV-MV grid tariffs (c.f. Figure 10) results in installing less PV capacity, with scenario 2a showing considerably more sensitivity to this parameter.
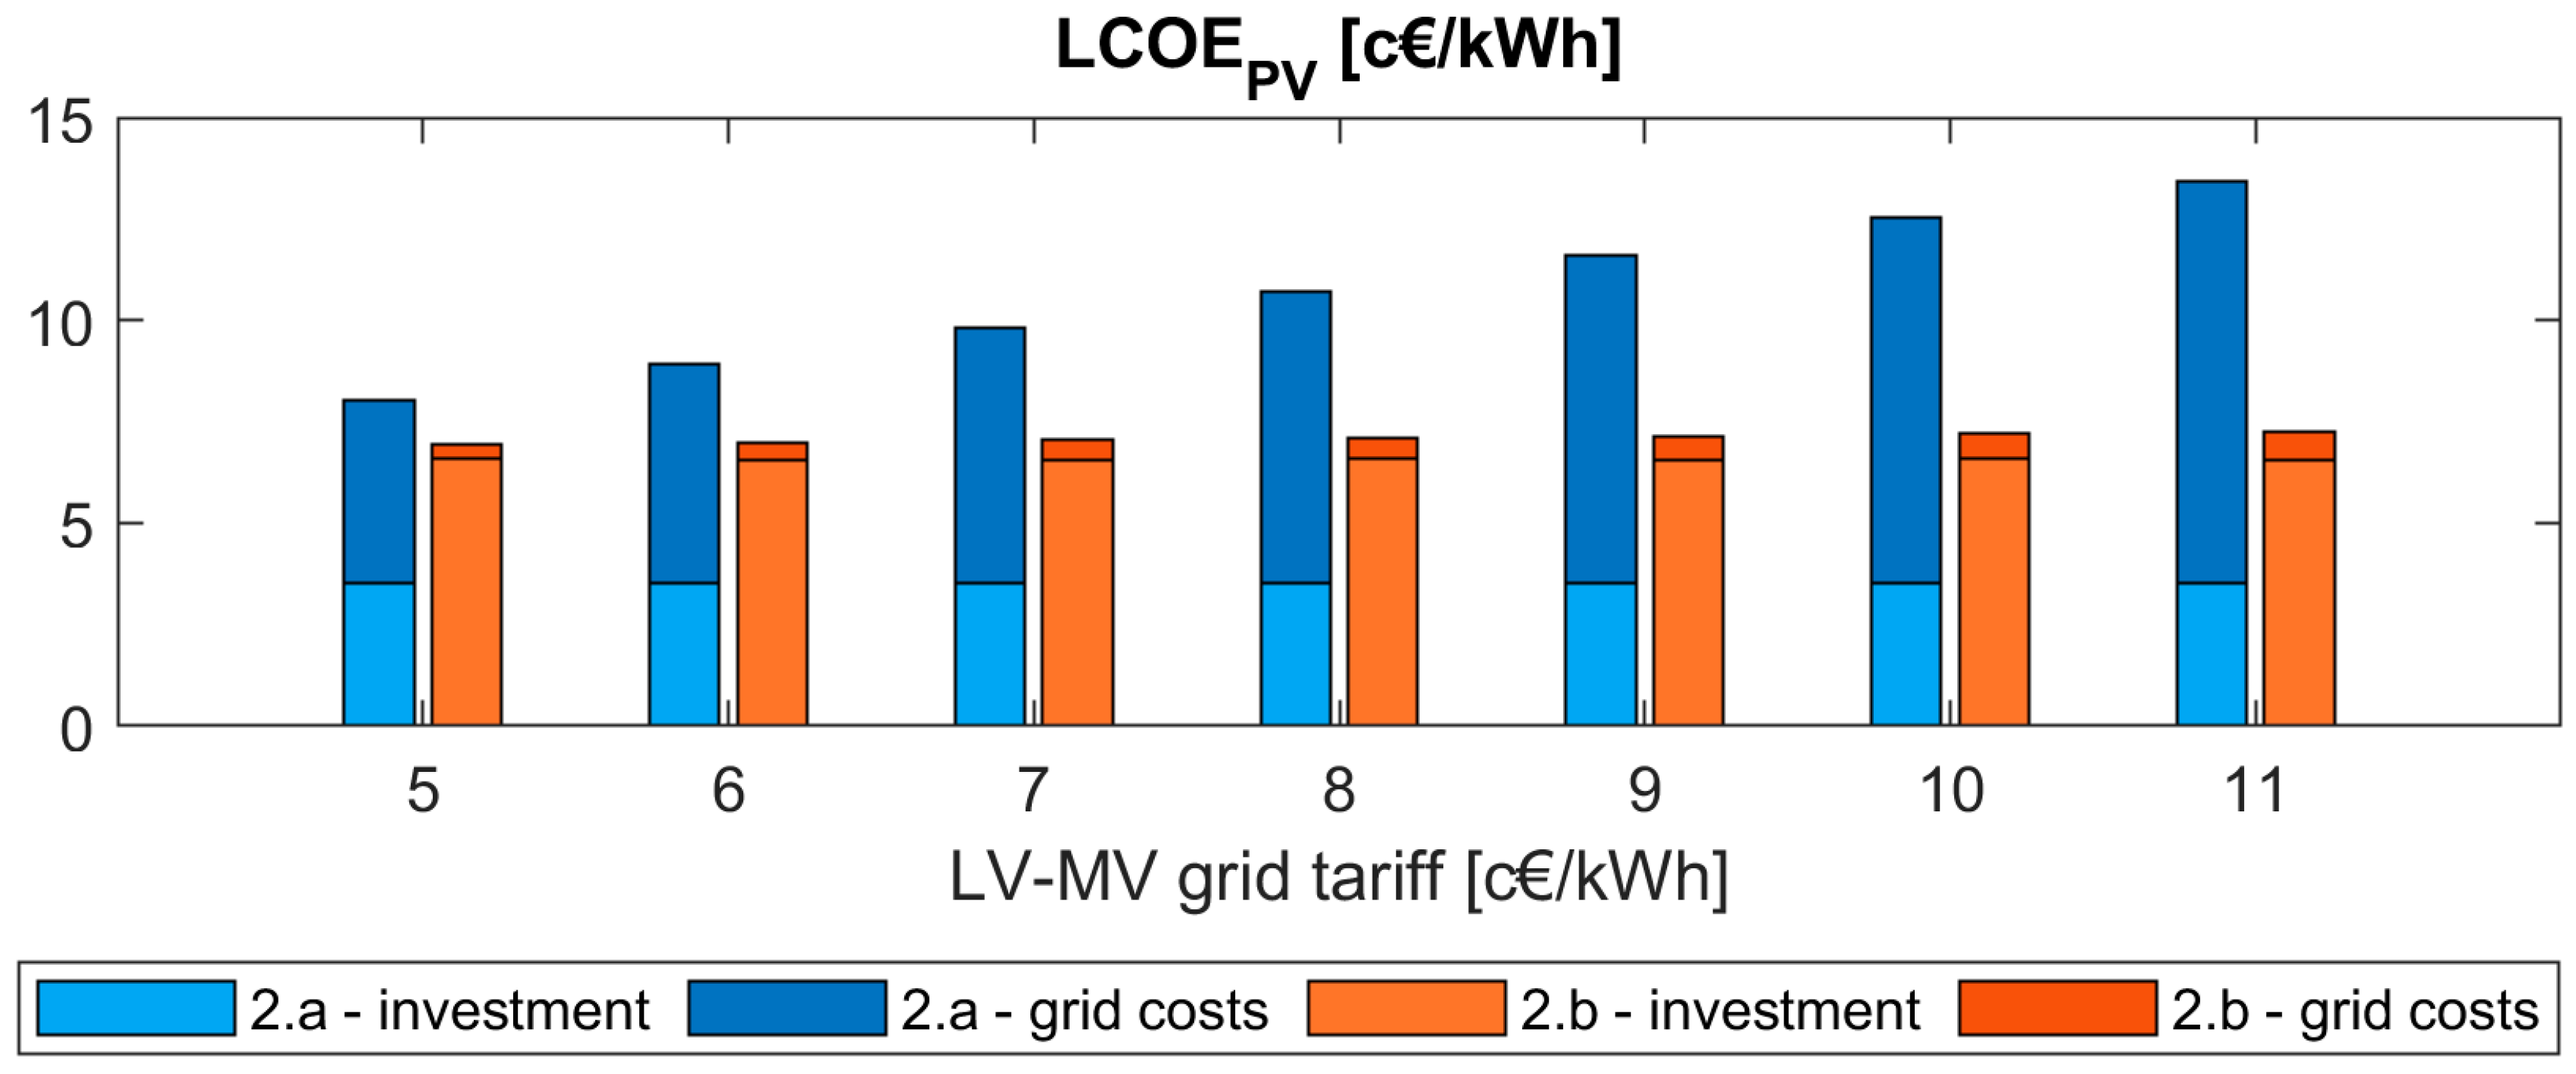
LCOEPV, shown in Figure 12, helps to understand this: installing PV in the winery (scenario 2a) is more efficient in terms of investment in technology, but its associated grid costs increase greatly with the considered LV-MV grid tariff and even surpass the LCOEPV of scenario 2b. This is justified by the considerable difference in electricity demand between the city and the winery: for scenario 2a, around 70% (6 GWh/year) of the PV generation is transferred to the city, whereas for scenario 2b, only around 6% (0.4 GWh/year) is transferred to the winery. This dependence has a greater impact on the electricity exports to adjacent regions than the SSR (8.7% variation vs. 2.1% for scenario 2a), as Calliope optimization model minimizes this non-remunerated generation. Nonetheless, it is important to note that allowing for some energy exports indirectly contributes to the increase in SSR: adding more PV capacity can lead to generation surpluses in some time periods (mainly around midday, when generation is maximum) but will also increase self-consumption (mostly in the beginning and end of the day, when generation is at its minimum). Depending on the balance between added costs and savings, exportations may lead to economic benefits.
In terms of overall economic benefit, the LCOEtotal for scenario 2a increases linearly with the LV-MV grid from 14.6 to 16.1 c€/kWh (2.3–4.2 c€/kWh reduction when compared to the scenario 0), depending on the considered grid tariff, whereas for scenario 2b, it is 15.1–15.3 c€/kWh (3.5–3.7 c€/kWh) with small oscillations. Additionally, scenario 2a is more cost-efficient if the LV-MV grid tariff is not higher than 6 c€/kWh, as this sub-scenario is greatly dependent on exchanges between the city and the winery. For costlier tariffs, the savings from a larger scale, i.e., cheaper, PV investment in the winery is surpassed by the consequent increase in grid costs, benefitting from the deployment of more distributed PV capacity.
Thus, both collective arrangements contribute to a more sustainable but also a more cost-efficient power system. From these two sub-scenarios, some high-level relevant conclusions must be highlighted: both cases present benefits and drawbacks, but a fundamental trade-off emerges from its comparison. On the one hand, the global energy cost in the whole EC is more dependent on grid costs when all the production is centralized in the winery what can be interpreted as the cost of centralization; on the other, for low tariff values, these centralization costs are balanced by the benefits of reduced investment costs. In any case, the more stable and decentralized solution (i.e., city as a PV production aggregator) does not allow for the PV penetration or SSR that the winery-only solution is able to reach.
4.3. Both Actors as Prosumers, Assuming Two PV Adoption Scenarios for the City
Besides the limitation in available area for each PT, the previous scenarios considered the installed PV capacity as an unbounded variable, constrained only by location (city or winery). Although this increases the search space of optimal system configurations, the fact is that the deployment of residential-scale PV is highly dependent on local RES adoption targets or climate change mitigation plans set up by municipalities or other regional actors [23,51]. However, the integration of such plans within the present modeling framework is straightforward. Scenarios 3a and 3b allow for PV to be deployed in the winery and in the city but constrains the city to two distinct levels of residential PV adoption: whereas the first sub-scenario assumes a modest deployment, with the installed capacity in each power transformer of the city generating as much energy as 10% (0.52 MW) of its corresponding diurnal electricity demand, the second considers this value to be 75% (3.87 MW). Thus, the optimization process resides in determining the optimal PV capacity to be installed in the winery, with its prosumer role becoming more relevant in scenario 3a.
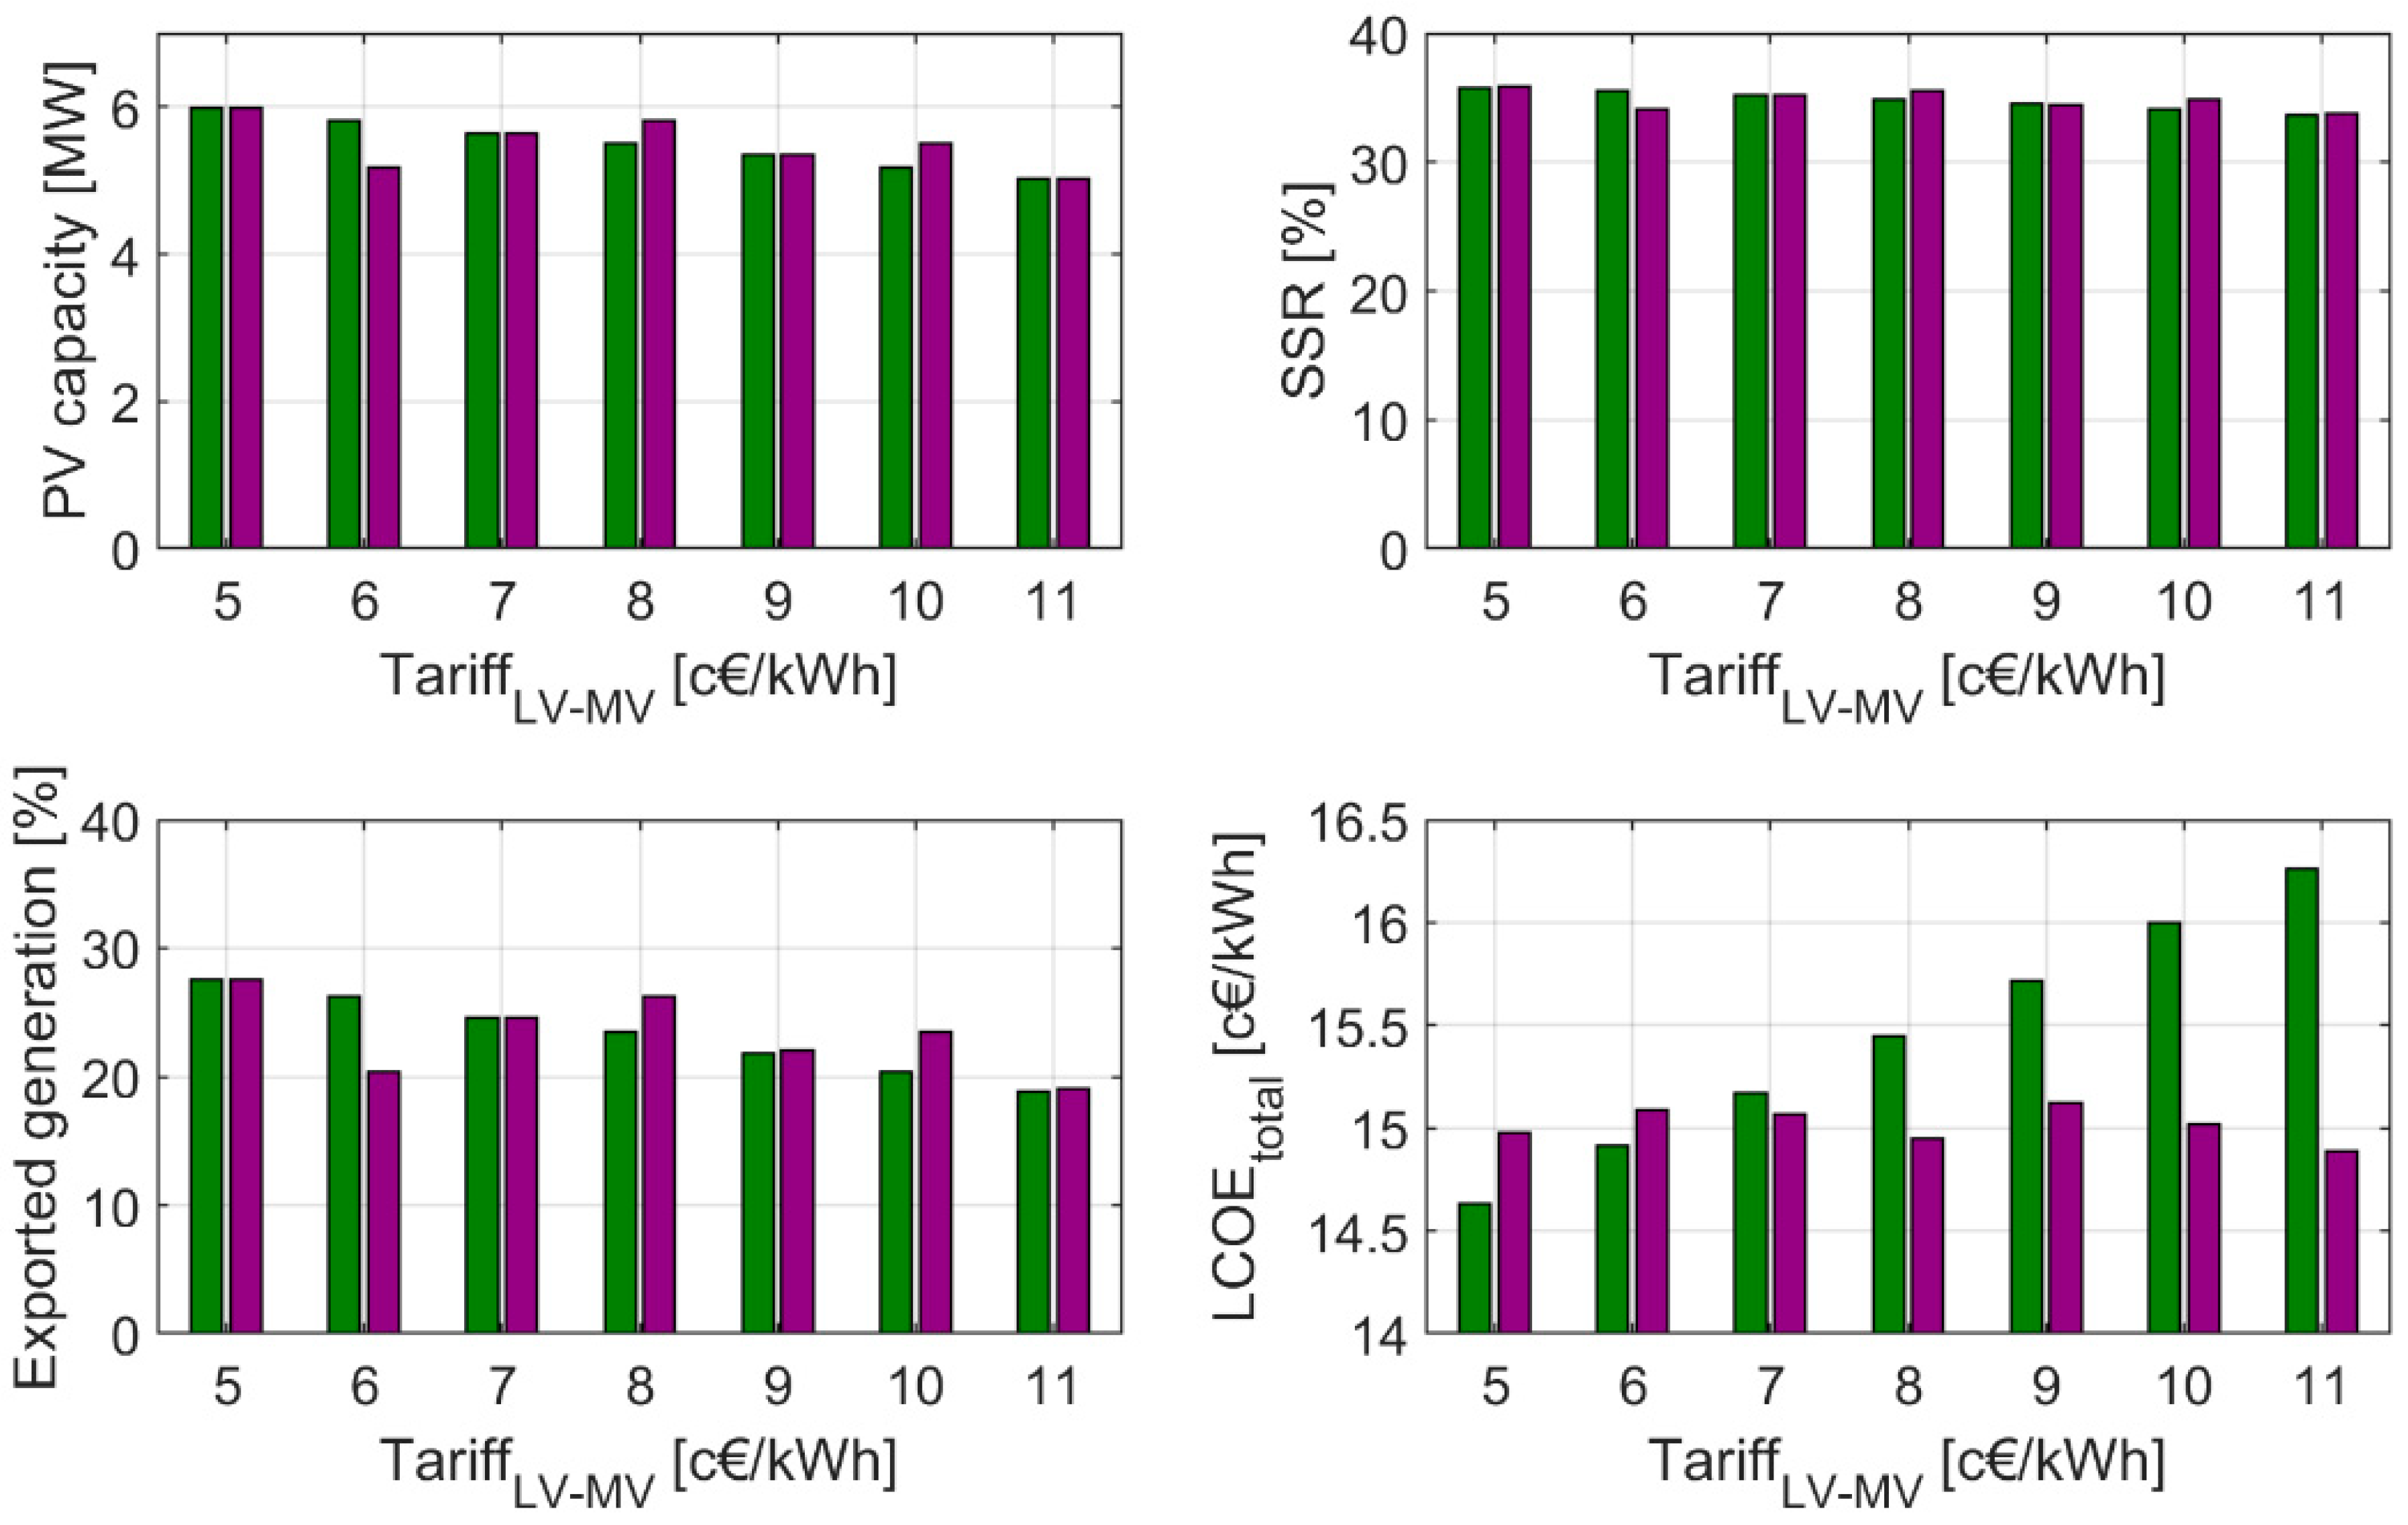
Figure 13 shows the relevant outputs and metrics. The technical outputs and indicators (i.e., total PV capacity, SSR, and exported generation) achieve fairly similar results for both sub-scenarios, seeming to be independent of the considered grid tariff and adoption level of residential PV. Additionally, it is important to note that even the more ambitious sub-scenario 3b leaves room for a considerable deployment of PV capacity in the winery (between 2.6–3.5 MW). Thus, a scenario with high residential PV penetration, can also be considered in a context where land availability in the winery is a limitation.
In terms of economic benefits, both sub-scenarios reduce the LCOEtotal when compared to the baseline scenario 0. However, while for scenario 3a, this indicator increases linearly with the considered LV-MV grid tariff value, ranging from 14.6 to 16.3 c€/kWh, scenario 3b is much less sensitive to the tariff value and ranges from 14.9 to 15.1c €/kWh. This compared evolution of LCOEtotal for these two configurations follows the same pattern that was already observed for scenarios 2a and 2b (i.e., the LV-MV grid tariff defines which configuration is more cost-efficient, with 6 c€/kWh being a threshold value). This is to be expected, as scenarios 2a and 2b can be seen as extreme versions of scenarios 3a and 3b (i.e., in terms of PV capacity, scenario 2a is more winery-oriented than 3a, and 2b more city-oriented than 3b).
4.4. An Overall Comparison of Pathways
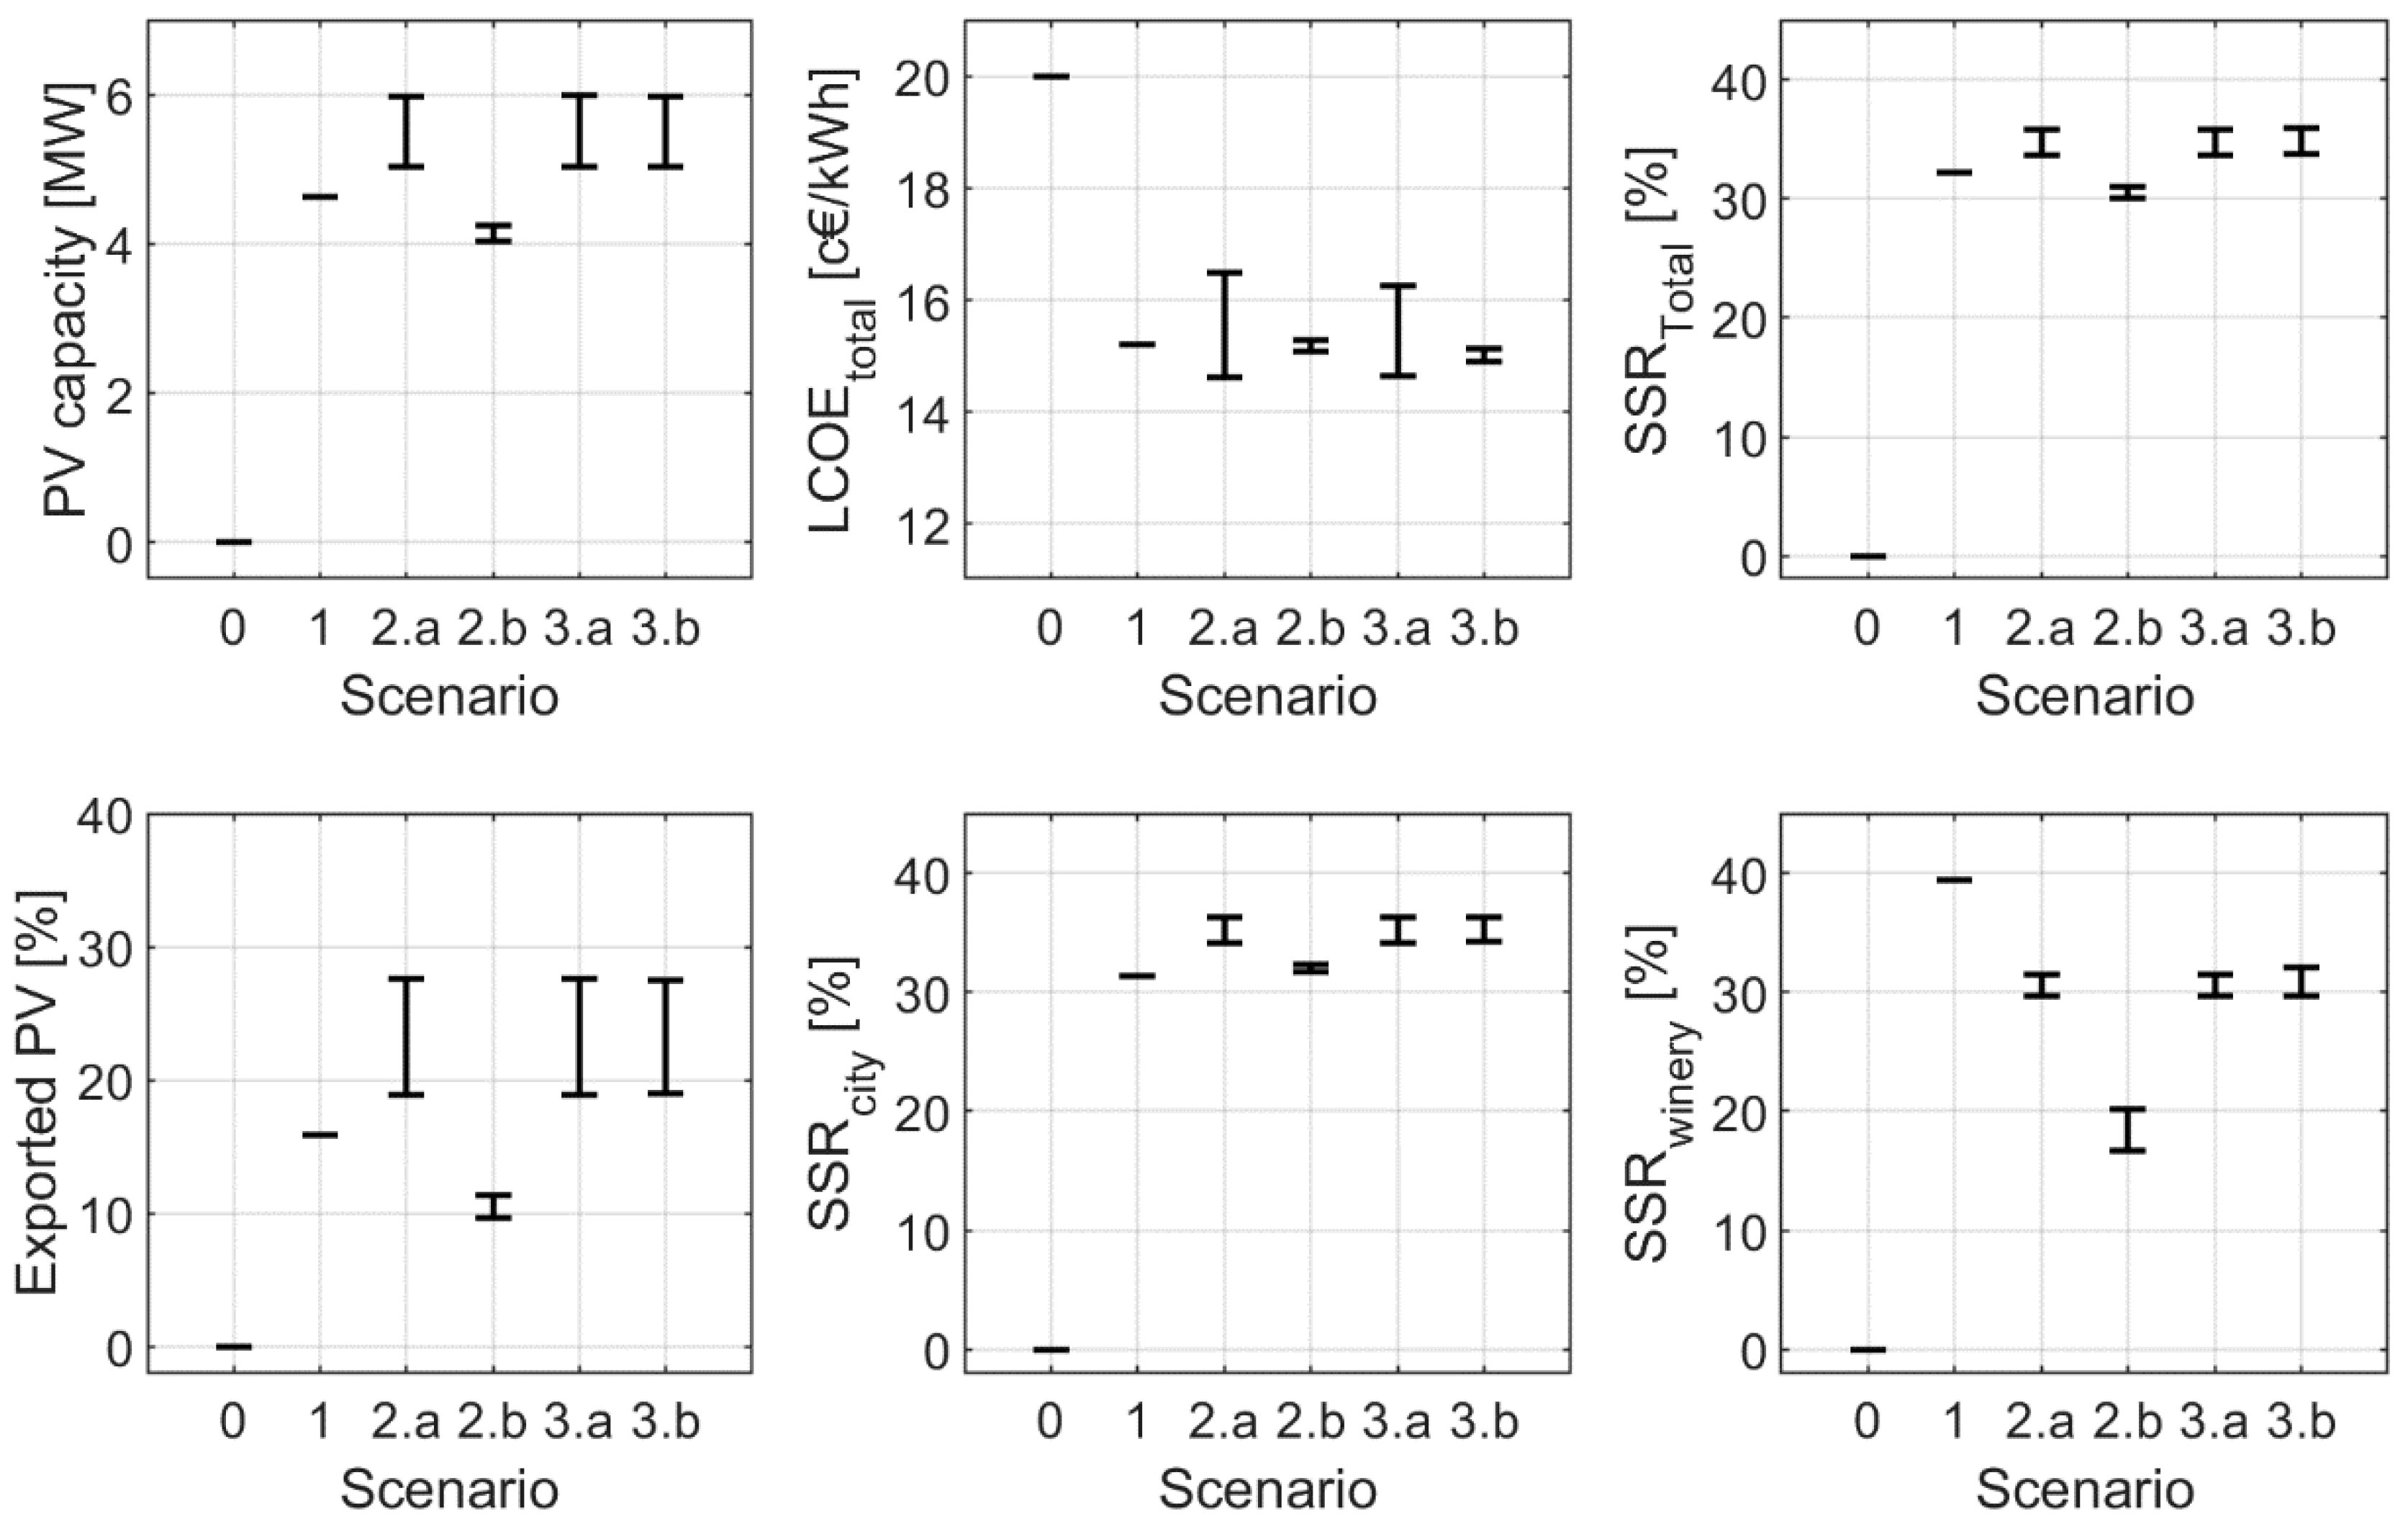
Figure 14 compares the various scenarios presented so far. This is an essential step to assess the implications of different pathways for the implementation of a coordinated self-consumption scheme between the residential actors in the city of Reguengos de Monsaraz and a local winery. For scenarios 2a, 2b, 3a, and 3b, the intervals of values presented correspond to the different LV-MV grid tariff values tested.
A first conclusion is that, except for scenario 2b, every collective arrangement promotes the deployment of additional 0.4 to 1.35 MW of PV capacity (an 8 to 29% increase) when compared with scenario 1 (independent self-consumption). This results in an increase in self-sufficiency by 1.5–3.6 percentual points (a 4.5–11.1% relative increase), which translates to a more sustainable power system with less greenhouse gas emissions.
In terms of economics, the adoption of PV, regardless of the considered arrangement, reduces the cost of electricity when compared to the actual context (i.e., scenario 0) where electricity is supplied by the grid with a grey energy mix (coal, natural gas, fossil co-generation, RES). However, the overall impact of the collective setups in the LCOEtotal, when compared to scenario 1, is, at most, modest: for a reduced LV-MV grid tariff, scenario 2a and scenario 3a lead to the higher savings (around 0.6 c€/kWh, near 4%). Moreover, for higher grid tariff values, these same scenarios can in fact increase the LCOEtotal by up to 1.1 c€/kWh or 8%. Nonetheless, these results are influenced by the assumption that the exported PV generation was not remunerated and that it does not contribute to the SSR of the EC. This highlights the need for further studies which evaluate the possibility for nearby regions to accommodate this excess generation and/or for the deployment of complementary technologies such as storage, electric mobility, or flexible demand. Additionally, the variation interval of LCOEtotal values for scenarios 2a and 3a highlight how centralized PV configurations (i.e., with most or all of the PV capacity corresponding to a single installation, in this case in the winery) are more sensitive to the considered LV-MV grid tariff.
It is also of further importance to consider how each collective arrangement translates into the individual performance of each actor. The bottom center and bottom right plots of Figure 14 show the individual SSR for the winery and for the city. In scenario 1, the winery reaches greater SSR values than the city (39.5% vs. 31.3%). However, the collective self-consumption arrangements prioritize the costlier electricity demand from the city. A slight increase in the SSR of the city (between 1.0 and 5.0 percentual points) is accompanied by a more considerable decrease for the SSR of the winery (between 7.3 and 19.3 percentual points), despite the overall increase (due to the difference in scale between the two actors). Thus, it is relevant to note that a collective arrangement between different actors can imply different compromises for the different actors: the winery as a prosumer in the EC increases the collective performance, but at the expense of its own individual performance. This behavior is to be expected, since the optimization process is driven by the minimization of the global costs of the considered energy system.
5. Conclusions
The present work explored the techno-economic feasibility of an EC in the semi-rural city of Reguengos de Monsaraz in southern Portugal. The considered EC involves two different local actors, namely the residential consumers and a local winery. A strong focus was placed in exploring different pathways to achieve higher renewable penetration scenarios at the local level by adopting different collective PV arrangements under the EC framework. These arrangements involved assigning different roles to the involved actors, choosing different system architectures, but that will also demand different business models.
Building on real electricity demand from PTs and from a local winery, as well as a GIS-based rooftop cadaster and weather data, the Reguengos de Monsaraz EC was modeled using the open-source Calliope modeling framework. Results showed that collective arrangements contribute to the deployment of additional PV capacity and, potentially, a modest reduction in the LCOE of the generated electricity. However, there are clear trade-offs between pathways: choosing to centralize the PV capacity in a small number of actors may lead to more cost-efficient investments (driven by economies of scale) but lead to a greater use of the public distribution grid and increases grid costs. On the other hand, a more decentralized configuration promotes energy democracy and citizen participation.
Overall, all configurations are feasible and with positive environmental and economic impacts for the Reguengos de Monsaraz case study. Moreover, the results show that local actors can make use of energy modeling tools for local decision-making processes, namely, to identify the most suitable EC set-up. Nonetheless, the implications of the trade-off between pathways suggest that collective PV arrangements and other business models fostered by EC (e.g., aggregators, VPP) may be addressed as multi-objective problems rather than only focusing on cost minimization (e.g., minimize greenhouse gas emissions and considering land use or social acceptance). In this context, the newly made-available Calliope feature SPORES [52] may be considered in order to determine several near-optimal alternative configurations.
The implementation of complementary technologies (e.g., demand-side management, storage, or curtailment) or local energy markets (grouping adjacent urban areas) could be considered to increase the local SSR and valorize eventual RES surpluses. It is also important for this type of study to be complemented with both multi-year and high-resolution analyses to validate and consolidate the reported findings (e.g., evaluate the impacts of deploying PV capacity in local grids from a power electronics perspective). However, this requires that energy optimization models be able to tackle computational complexity challenges to ensure model tractability when large datasets and/or complex power grids are considered.
Author Contributions
Conceptualization, G.P.L. and R.A.eS.; Investigation, G.P.L. and R.A.eS.; Software, G.P.L. and R.A.eS.; Writing—original draft, G.P.L. and R.A.eS.; Writing—review & editing, G.P.L. and R.A.eS. All authors have read and agreed to the published version of the manuscript.
Funding
This work was supported by the European Union’s Horizon 2020 research and innovation programme under grant agreement number 764056. The sole responsibility for the content of this document lies with the authors and does not necessarily reflect the opinion of the funding authorities. The funding authorities are not responsible for any use of the information contained therein.
Acknowledgments
The authors would like to thank the PROSEU team, Inês Campos (coordinator) and Esther Marin both from FCUL/CE3C. João Barroso (Comissão Vitivinícola Regional Alentejana), Nuno Oliveira, Miguel Jorge, Luis Cruz, Pedro Correia and Jousy Marques contributed to the understanding of the winery sector in the region of Reguengos de Monsaraz. Anderson Soares and Teresa Fonseca (EDP-Distribuição) and Ana Margarida Ferreira (Câmara Municipal de Reguengos de Monsaraz) provided the power transformers data and the GIS-based rooftop cadaster for Reguengos de Monsaraz, respectively. The Solar radiation Data (SoDa) company provided the solar irradiance and air temperature data. Miguel Centeno Brito (FCUL/IDL) provided helpful scientific insights. The authors would also like to thank David Pera for making available the workstation in which the Calliope models were ran.
Conflicts of Interest
The authors declare no conflict of interest.
Abbreviations
| EC | Energy Community |
| CEP | Clean Energy Package |
| REC | Renewable Energy Community |
| CEC | Citizen Energy Community |
| VPP | Virtual Power Plant |
| P2P | Peer-to-Peer |
| RES | Renewable Energy Sources |
| PV | Photovoltaics |
| MILP | Mixed-Integer Linear Programming |
| MPC | Model Predictive Control |
| PT | Power Transformer |
| DSO | Distribution System Operator |
| STC | Standard Test Conditions |
| GIS | Geographical Information System |
Variables and Parameters
| GUF | Grid-use factor [%] |
| τgrid,LV | Low-voltage grid tariff [€/kWh] |
| τgrid,MV | Medium-voltage grid tariff [€/kWh] |
| τgrid,HV | High-voltage grid tariff [€/kWh] |
| Ccapital,PV | Initial capital investment [€] |
| Cgrid use,PV (t) | Costs associated with the grid use of PV for each timeslot t [€] |
| Csupply,imports | Cost of the imported electricity for each timeslot t [€] |
| Cgrid use,imports | Cost associated with the grid use of imported electricity for each timeslot t [€] |
| EPV | PV generation for each timeslot t [kWh] |
| Edemand | Electricity demand for each timeslot t [kWh] |
| EPV,export | PV generation exported surplus for each timeslot t [kWh] |
| SSR | Self-sufficiency rate [%] |
| LCOEPV | Levelized cost of electricity for PV generation |
| LCOEtotal | System-wide levelized cost of electricity |
References
- Renewable Energy Directive (Directive (EU) 2018/2001). Available online: http://data.europa.eu/eli/dir/2018/2001/oj (accessed on 4 December 2020).
- Internal Electricity Market Directive (Directive (EU) 2019/944). Available online: http://data.europa.eu/eli/dir/2019/944/oj (accessed on 4 December 2020).
- Roberts, J.; Frieden, D.; D’Herbemont, S. Energy Community Definitions. 2019. Available online: https://www.compile-project.eu/wp-content/uploads/Explanatory-note-on-energy-community-definitions.pdf (accessed on 4 December 2020).
- Frieden, D.; Tuerk, A.; Roberts, J.; D’Herbemont, S.; Gubina, A. Collective Self-Consumption and Energy Communities: Overview of Emerging Regulatory Approaches in Europe. 2019. Available online: https://www.compile-project.eu/wp-content/uploads/COMPILE_Collective_self-consumption_EU_review_june_2019_FINAL-1.pdf (accessed on 4 December 2020).
- Horstink, L.; Wittmayer, J.M.; Ng, K.; Luz, G.P.; Marín-González, E.; Gährs, S.; Campos, I.; Holstenkamp, L.; Oxenaar, S.; Brown, D. Collective Renewable Energy Prosumers and the Promises of the Energy Union: Taking Stock. Energies 2020, 13, 421. [Google Scholar] [CrossRef] [Green Version]
- Gui, E.M.; MacGill, I. Typology of future clean energy communities: An exploratory structure, opportunities, and challenges. Energy Res. Soc. Sci. 2018, 35, 94–107. [Google Scholar] [CrossRef]
- Lettner, G.; Auer, H.; Fleischhacker, A.; Schwabeneder, D.; Dallinger, B.; Moisl, F.; Roman, E.; Velte, D.; Huidobro, A. Existing and Future PV Prosumer Concepts. 2018. Available online: https://www.pvp4grid.eu/wp-content/uploads/2018/08/D2.1_Existing-future-prosumer-concepts_PVP4Grid_FV.pdf (accessed on 4 December 2020).
- Reis, V.; Almeida, R.H.; Silva, J.A.; Brito, M.C. Demand aggregation for photovoltaic self-consumption. Energy Rep. 2019, 5, 54–61. [Google Scholar] [CrossRef]
- Fina, B.; Auer, H.; Friedl, W. Profitability of PV sharing in energy communities: Use cases for different settlement patterns. Energy 2019, 189, 116148. [Google Scholar] [CrossRef]
- Luthander, R.; Widén, J.; Munkhammar, J.; Lingfors, D. Self-consumption enhancement and peak shaving of residential photovoltaics using storage and curtailment. Energy 2016, 112, 221–231. [Google Scholar] [CrossRef]
- Roberts, M.B.; Bruce, A.; MacGill, I. A comparison of arrangements for increasing self-consumption and maximising the value of distributed photovoltaics on apartment buildings. Sol. Energy 2019, 193, 372–386. [Google Scholar] [CrossRef]
- Kästel, P.; Gilroy-Scott, B. Economics of pooling small local electricity prosumers—LCOE & self-consumption. Renew. Sustain. Energy Rev. 2015, 51, 718–729. [Google Scholar] [CrossRef]
- Moura, R.; Brito, M.C. Prosumer aggregation policies, country experience and business models. Energy Policy 2019, 132, 820–830. [Google Scholar] [CrossRef]
- Baroche, T.; Pinson, P.; Latimier, R.L.G.; Ahmed, H. Ben Exogenous Cost Allocation in Peer-to-Peer Electricity Markets. IEEE Trans. Power Syst. 2019, 34, 2553–2564. [Google Scholar] [CrossRef] [Green Version]
- Hall, S.; Brown, D.; Davis, M.; Ehrtmann, M.; Holstenkamp, L. Business Models for Prosumers in Europe; Mainstreaming Active Participation of Citizens in the Energy Transition (Deliverable N°D4.1); PROSEU—Prosumers for the Energy Union, 2020; Available online: https://proseu.eu/sites/default/files/Resources/PROSEU_D4.1_Business%20models%20for%20collective%20prosumers.pdf (accessed on 4 December 2020).
- Wittmayer, J.; Fraaije, M.; Horstink, L.; Avelino, F. A Multi-Dimensional Typology of Collective RES Prosumers across Europe; Mainstreaming Active Participation of Citizens in the Energy Transition (Deliverable N°2.2); PROSEU—Prosumers for the Energy Union, 2019; Available online: https://cordis.europa.eu/project/id/764056/reporting (accessed on 4 December 2020).
- Butturi, M.A.; Lolli, F.; Sellitto, M.A.; Balugani, E.; Gamberini, R.; Rimini, B. Renewable energy in eco-industrial parks and urban-industrial symbiosis: A literature review and a conceptual synthesis. Appl. Energy 2019, 255, 113825. [Google Scholar] [CrossRef]
- Pfenninger, S.; Hawkes, A.; Keirstead, J. Energy systems modeling for twenty-first century energy challenges. Renew. Sustain. Energy Rev. 2014, 33, 74–86. [Google Scholar] [CrossRef]
- Fina, B.; Auer, H.; Friedl, W. Cost-optimal economic potential of shared rooftop PV in energy communities: Evidence from Austria. Renew. Energy 2020, 152, 217–228. [Google Scholar] [CrossRef]
- Contreras-Ocana, J.E.; Singh, A.; Besanger, Y.; Wurtz, F. Integrated Planning of a Solar/Storage Collective. IEEE Trans. Smart Grid 2020. [Google Scholar] [CrossRef]
- Loulou, R.; Goldstein, G.; Noble, K. The Integrated MARKAL-EFOM System (TIMES). 2004. Available online: https://iea-etsap.org/index.php/etsap-tools/model-generators/times (accessed on 4 December 2020).
- Yazdanie, M.; Densing, M.; Wokaun, A. Cost optimal urban energy systems planning in the context of national energy policies: A case study for the city of Basel. Energy Policy 2017, 110, 176–190. [Google Scholar] [CrossRef]
- Dias, L.P.; Simões, S.; Gouveia, J.P.; Seixas, J. City energy modelling—Optimising local low carbon transitions with household budget constraints. Energy Strat. Rev. 2019, 26, 100387. [Google Scholar] [CrossRef]
- Marczinkowski, H.M.; Østergaard, P.A. Residential versus communal combination of photovoltaic and battery in smart energy systems. Energy 2018, 152, 466–475. [Google Scholar] [CrossRef] [Green Version]
- De Luca, G.; Fabozzi, S.; Massarotti, N.; Vanoli, L. A renewable energy system for a nearly zero greenhouse city: Case study of a small city in southern Italy. Energy 2018, 143, 347–362. [Google Scholar] [CrossRef]
- EnergyPLAN, Advanced Energy Systems Analysis Computer Model. Sustainable Energy Planning Research Group, Aalborg University. Available online: https://www.energyplan.eu/ (accessed on 4 December 2020).
- Chen, Y.; Vinco, S.; Baek, D.; Quer, S.; Macii, E.; Poncino, M. Cost-aware design and simulation of electrical energy systems. Energies 2020, 13, 2949. [Google Scholar] [CrossRef]
- Ringkjøb, H.-K.; Haugan, P.M.; Solbrekke, I.M. A review of modelling tools for energy and electricity systems with large shares of variable renewables. Renew. Sustain. Energy Rev. 2018, 96, 440–459. [Google Scholar] [CrossRef]
- Pickering, B.; Choudhary, R. District energy system optimisation under uncertain demand: Handling data-driven stochastic profiles. Appl. Energy 2019, 236, 1138–1157. [Google Scholar] [CrossRef] [Green Version]
- Del Pero, C.; Leonforte, F.; Lombardi, F.; Stevanato, N.; Barbieri, J.; Aste, N.; Huerto, H.; Colombo, E. Modelling of an Integrated Multi-Energy System for a Nearly Zero Energy Smart District. In Proceedings of the 2019 International Conference on Clean Electrical Power (ICCEP), Puglia, Italy, 2–4 July 2019; pp. 246–252. [Google Scholar]
- Alaton, C.; Contreras-Ocana, J.; de Radigues, P.; Doring, T.; Tounquet, F. Energy Communities: From European Law to Numerical Modeling. In Proceedings of the 2020 17th International Conference on the European Energy Market (EEM), Stockholm, Sweden, 16–18 September 2020; pp. 1–6. [Google Scholar]
- Portuguese Decree-Law (DL) 162/2019. Available online: https://dre.pt/pesquisa/-/search/125692189/details/maximized (accessed on 4 December 2020).
- APREN Boletim Eletricidade Renovável Novembro 2020. Available online: https://www.apren.pt/contents/publicationsreportcarditems/boletim-renovaveis-novembro-2020.pdf (accessed on 4 December 2020).
- H2020 PROSEU (PROSumers for the Energy Union) Project, Grant Agreement Number 764056. Available online: https://proseu.eu (accessed on 4 December 2020).
- Jones, G.V.; Webb, L.B. Climate Change, Viticulture, and Wine: Challenges and Opportunities. J. Wine Res. 2010, 21, 103–106. [Google Scholar] [CrossRef]
- Sacchelli, S.; Fabbrizzi, S.; Menghini, S. Climate change effects and adaptation strategies in the wine sector: A quantitative literature review. Wine Econ. Policy 2016, 5, 114–126. [Google Scholar] [CrossRef] [Green Version]
- Campos, I.; Marín-González, E.; Luz, G.; Barroso, J.; Oliveira, N. Renewable Energy Prosumers in Mediterranean Viticulture Social–Ecological Systems. Sustainability 2019, 11, 6781. [Google Scholar] [CrossRef] [Green Version]
- INE. Censos 2011 Resultados Definitivos—Região Alentejo. 2012. Available online: https://censos.ine.pt/ngt_server/attachfileu.jsp?look_parentBoui=156656957&att_display=n&att_download=y (accessed on 4 December 2020).
- Huld, T.; Pinedo, I.; Pascua, A.; Amillo, G.; Valle, R.U.; Dunlop, E. PVGIS version 5: Improvements to models and features. In Proceedings of the 33rd European Photovoltaic Solar Energy Conference and Exhibition, Amsterdam, The Netherlands, 25–29 September 2017; pp. 2069–2074. [Google Scholar]
- Pordata. Consumo de Energia Eléctrica: Total e Por Tipo de Consumo. 2020. Available online: https://www.pordata.pt/Municipios/Consumo+de+energia+el%C3%A9ctrica+total+e+por+tipo+de+consumo-25 (accessed on 4 December 2020).
- Solar Radiation Data (SoDa). Available online: http://www.soda-is.com/eng/index.html (accessed on 4 December 2020).
- Pfenninger, S.; Pickering, B. Calliope: A multi-scale energy systems modelling framework. J. Open Source Softw. 2018, 3, 825. [Google Scholar] [CrossRef] [Green Version]
- Calliope Website. Available online: https://www.callio.pe/ (accessed on 4 December 2020).
- Calliope Documentation. 2013. Available online: https://readthedocs.org/projects/calliope/ (accessed on 4 December 2020).
- Pfenninger, S.; Keirstead, J. Comparing concentrating solar and nuclear power as baseload providers using the example of South Africa. Energy 2015, 87, 303–314. [Google Scholar] [CrossRef]
- Díaz Redondo, P.; van Vliet, O. Modelling the Energy Future of Switzerland after the Phase Out of Nuclear Power Plants. Energy Procedia 2015, 76, 49–58. [Google Scholar] [CrossRef] [Green Version]
- Díaz, P.; Van Vliet, O.; Patt, A. Do we need gas as a bridging fuel? A case study of the electricity system of Switzerland. Energies 2017, 10, 861. [Google Scholar] [CrossRef] [Green Version]
- Tröndle, T.; Lilliestam, J.; Marelli, S.; Pfenninger, S. Trade-Offs between Geographic Scale, Cost, and Infrastructure Requirements for Fully Renewable Electricity in Europe. Joule 2020, 4, 1929–1948. [Google Scholar] [CrossRef]
- Talavera, D.L.; Muñoz-Rodriguez, F.J.; Jimenez-Castillo, G.; Rus-Casas, C. A new approach to sizing the photovoltaic generator in self-consumption systems based on cost–competitiveness, maximizing direct self-consumption. Renew. Energy 2019, 130, 1021–1035. [Google Scholar] [CrossRef]
- McKenna, E.; Pless, J.; Darby, S.J. Solar photovoltaic self-consumption in the UK residential sector: New estimates from a smart grid demonstration project. Energy Policy 2018, 118, 482–491. [Google Scholar] [CrossRef]
- IRENA. Future of Solar Photovoltaic: Deployment, Investment, Technology, Grid Integration and Socio-Economic aspects (A Global Energy Transformation: Paper); IRENA: Abu Dhabi, UAE, 2019. [Google Scholar]
- Lombardi, F.; Pickering, B.; Colombo, E.; Pfenninger, S. Policy Decision Support for Renewables Deployment through Spatially Explicit Practically Optimal Alternatives. Joule 2020, 4, 2185–2207. [Google Scholar] [CrossRef]
Figure 1.
High-level view of the modeling workflow used, comprising the interconnection between data and the modeling framework.
Figure 1.
High-level view of the modeling workflow used, comprising the interconnection between data and the modeling framework.

Figure 2.
Rated capacity distribution of the power transformers installed in Reguengos de Monsaraz.

Figure 3.
Geographical distribution of the power transformers in Reguengos de Monsaraz. In black are the transformers from which electricity demand data were made available by the DSO, while in red the transformers for which it was not possible to obtain data due to privacy reasons.
Figure 3.
Geographical distribution of the power transformers in Reguengos de Monsaraz. In black are the transformers from which electricity demand data were made available by the DSO, while in red the transformers for which it was not possible to obtain data due to privacy reasons.

Figure 4.
Normalized 15-min electricity demand profiles for the city of Reguengos de Monsaraz and a local winery with sets of three days for three different seasons of the year: wintertime (10 to 12 January), summertime (1 and 3 August), and the winery harvesting period (9 to 11 September).
Figure 4.
Normalized 15-min electricity demand profiles for the city of Reguengos de Monsaraz and a local winery with sets of three days for three different seasons of the year: wintertime (10 to 12 January), summertime (1 and 3 August), and the winery harvesting period (9 to 11 September).

Figure 5.
Normalized total daily electricity demand profiles for the city of Reguengos de Monsaraz and a local winery for the whole year.
Figure 5.
Normalized total daily electricity demand profiles for the city of Reguengos de Monsaraz and a local winery for the whole year.

Figure 6.
GIS representation of part of the map of Reguengos de Monsaraz, showing the power transformers (dark full circles), the rooftop cadaster and the determined Voronoi polygons with power transformers as generating points.
Figure 6.
GIS representation of part of the map of Reguengos de Monsaraz, showing the power transformers (dark full circles), the rooftop cadaster and the determined Voronoi polygons with power transformers as generating points.

Figure 7.
Available rooftop area distribution for the Voronoi polygons associated to each of the considered power transformers.
Figure 7.
Available rooftop area distribution for the Voronoi polygons associated to each of the considered power transformers.

Figure 8.
Normalized total weekly PV potential for Reguengos de Monsaraz for the whole year. A weekly resolution was chosen for visualization purposes.
Figure 8.
Normalized total weekly PV potential for Reguengos de Monsaraz for the whole year. A weekly resolution was chosen for visualization purposes.

Figure 9.
Local power grid layout assumed for this work/Reguengos de Monsaraz, which was implemented in calliope. Electricity can be generated in the substation (i.e., the traditional electricity supply/from the supply grid) and in the power transformers and winery (by means of PV), with the last two also incorporating their respective electricity demand.

Figure 10.
Allocation for the different cost components (A to F) in the designed power grid. The picture depicts how the Calliope parameters incorporate the tariff from the electricity supplied by retailers through the substation (S) to the power transformers that are connected to LV grid sections and the winery (W), τsupply,city and τsupply,winery; the LV and MV grid use tariffs for energy exchanges between LV prosumers (τgrid,LV and τgrid,MV), and the overall use tariff for exchanges between LV and MV prosumers (in this case, the winery (W)). The Grid Use Factor (GUF) is a scalar, parameterizing the percentage of PV generation that uses the public LV grid that flows from the PV system to the respective prosumer(s).

Figure 11.
Comparing scenarios 2a (in blue) and 2b (in orange) regarding the installed PV capacity (upper left plot), the achieved SSR (upper right plot), the percentage of exported PV generation (bottom left plot), and the LCOEtotal (bottom right plot).
Figure 11.
Comparing scenarios 2a (in blue) and 2b (in orange) regarding the installed PV capacity (upper left plot), the achieved SSR (upper right plot), the percentage of exported PV generation (bottom left plot), and the LCOEtotal (bottom right plot).

Figure 12.
Comparing scenarios 2a (in blue) and 2b (in orange) regarding the LCOEPV. This cost was decomposed in technology investment (in light color) and grid costs (in dark).
Figure 12.
Comparing scenarios 2a (in blue) and 2b (in orange) regarding the LCOEPV. This cost was decomposed in technology investment (in light color) and grid costs (in dark).

Figure 13.
Comparing scenarios 3a (in green) and 3b (in purple) regarding the installed PV capacity (upper left plot), the achieved SSR (upper right plot), the percentage of exported PV generation (bottom left plot), and the LCOEtotal (bottom right plot).
Figure 13.
Comparing scenarios 3a (in green) and 3b (in purple) regarding the installed PV capacity (upper left plot), the achieved SSR (upper right plot), the percentage of exported PV generation (bottom left plot), and the LCOEtotal (bottom right plot).

Figure 14.
Comparison of the various scenarios presented throughout this work (cf. Section 3.2.5). The vertical dispersion of values for scenarios result from the testing various LV-MV grid tariff values.
Figure 14.
Comparison of the various scenarios presented throughout this work (cf. Section 3.2.5). The vertical dispersion of values for scenarios result from the testing various LV-MV grid tariff values.


Table 1.
Detailed comparison of the reviewed literature (continues on the next page).
| Temporal coverage | Temporal Resolution | Spatially-Resolved Modeling | Level of Detail of Data | Spatial Scale | Collective Energy Arrangements? | Case Study Country | Modeling Approach | Energy Modeling Tool | Reference |
|---|---|---|---|---|---|---|---|---|---|
| 1 year | 10 min | No | Single-family houses + | 21 households | Yes | Sweden | Simulation and sensitivity analysis | Custom framework (MATLAB) | Luthander et al. [10] |
| 1 year | 15 min | No | Individual households +, businesses + | Up to a condominium coupled with 2 businesses | Yes | Portugal | Simulation and sensitivity analysis | Custom framework (MATLAB) | Reis et al. [8] |
| 1 year | 15 min | Yes | Individual households +, multi-apartment buildings +, businesses * | Neighborhood | Yes | Austria | Optimization (MILP) | Custom framework (MATLAB/YALMIP) | Fina et al. (2019) [9] |
| National (upscale of neighborhood-level ECs) | Fina et al. (2020) [19] | ||||||||
| 1 year | Sizing: 1 h, Scheduling: 30 min | No | Individual households + | 15 households | Yes | France | Optimization (MILP, MPC) | Custom framework (Julia/Gurobi) | Contretas-Ocaña [20] |
| 1 year | 30 min | No | Individual households + | Building | Yes | Australia | Simulation and sensitivity analysis | morePVs (Python) | Roberts et al. [11] |
| 1 year | 1 h | Yes | Individual buildings * | District | No | Italy | Optimization (LP) | Calliope (Python) | Del Pero et al. [30] |
| 1 year | 1 h | Yes | Individual buildings + | District | No | India, UK | Optimization (MILP) | Calliope (Python) | Pickering et al. [29] |
| 1 year | 1 s | Yes | Individual households + | Residential community (15 households) | Yes | NA | Simulation and design space exploration | SystemC-AMS | Chen et al. [27] |
| 18 years, 5-year steps | 32 time slices per year | No | City + | City | No | Switzerland | Optimization (LP) | TIMES and EnergyPlus | Yazdanie et al. [22] |
| 40 years, 5-year steps | 192 time slices per year | Yes, region level | Individual appliances * | City | No | Portugal | Optimization (LP) | TIMES-ÉVORA | Dias et al. [23] |
| 1 year | 1 h | No | Island + | Island | No | Denmark | Simulation and sensitivity analysis | EnergyPLAN | Marczinkowski et al. [24] |
| 1 year | 1 h | No | City + | City | No | Italy | Simulation | EnergyPLAN and TRNSYS | Luca et al. [25] |
SC: self-consumption, LP: linear programming, MILP: mixed-integer linear programming, MPC: model predictive control, +/*: real/synthetic data, NA: not applicable, as EU and national legislation was not yet put in place.
Table 2.
Description of the complete dataset considered in the present work.
| Dataset (Source) | Variables | Units | Data Format | Additional Information |
|---|---|---|---|---|
| Power grid features (EDP-D) | Transformers geolocation | coordinates (lat,lon) | CSV, metadata | Converted to GIS for analysis and visualization |
| Transformers rated capacity | kVA | Reactive power was disregarded, so this was assumed as kW | ||
| Active power consumption | kW | CSV, timeseries | 1 year of data, converted from 15 min to 30 min time steps | |
| Weather data (SoDa) | Solar irradiance | W/m2 | ||
| Temperature | °C | |||
| Cartographic features (municipality) | Rooftops | NA | Shapefile | Only adequate roofs are considered |
| Winery features | Active power consumption | kW | CSV, timeseries | 1 year of data, converted from 15 min to 30 min time steps |
| Electricity prices | €/kWh | CSV | Time-of-use prices for electricity supply |
Table 3.
Modeling assumptions considered in the present work.
| Assumption | Reasoning |
|---|---|
| Only 25% of the PV energy that is consumed in the same power transformer where it was generated uses the public grid (GUF = 25%). | While 40–55% of the PV generation is exported to the public grid in individual self-consumption systems [8,49,50], a lower percentage is to be expected in collective ones [8]. This parametrization of the LV grid below each PT is essential for the application of grid tariffs. |
| The solar resource is homogeneous in space across Reguengos de Monsaraz. | As no on-site weather data was available, a timeseries for a single point in space (provided by the SoDa—Solar radiation data company) is considered |
| PV generation exported through the substation (i.e., to adjacent regions) is not remunerated. | While enabling exportations can increase PV penetration and the self-sufficiency of the EC, the objective is still to promote the interaction between the city and the winery. |
| The unitary cost of residential PV is 1.5 €/Wp, while at the winery it is 0.7 €/Wp. | Reference values provided by agents operating in the PV sector. These translate the impact of economies of scale: while small-scale rooftop systems were considered for the city, the winery has more available land and can, thus, install a single larger-scale system. |
| The power density of residential PV is 10 Wp/m2, while at the winery it is 20 Wp/m2. | Reference values provided by agents operating in the PV sector. The larger area per unit of capacity of larger PV systems is justified by the need for additional equipment and the spacing between PV arrays (to take into account for shadowing effects). |
| The electricity tariff (τsupply,city) for the city is fixed and is 20 c€/kWh. | This is considered as a reasonable value for low-voltage consumers in Portugal, which, as can be seen by the late afternoon peak load in Figure 4, are dominant in the electricity demand profile of Reguengos de Monsaraz. |
| The electricity tariff for the winery (τsupply,winery) depends on the time of the day and season of the year, with an average value of 9.37 c€/kWh. | This information was provided by the winery; however, due to confidentiality issues, only the average value can be presented. |
| The interest rate for investment in PV, be it in the city or the winery, is 5%. | This value is commonly found in the PV literature. |
Table 4.
Numerical results for scenario 1 (independent self-consumption).
| City | Winery | Total | |
|---|---|---|---|
| PV installed capacity [MW] | 3.94 | 0.70 | 4.59 |
| Self-sufficiency ratio [%] | 31.3 | 39.5 | 32.2 |
| Exported electricity [%] | 14.4 | 24.6 | 15.9 |
| LCOEPV [c€/kWh] | 6.58 | 3.52 | 6.12 |
| LCOEPV+grid costs [c€/kWh] | 7.23 | 6.57 | |
| LCOEtotal [c€/kWh] | 16.31 | 6.78 | 15.21 |
| Baseline (Scenario 0) LCOEtotal | 20 | 9.8 | 18.8 (weighted mean) |
Publisher’s Note: MDPI stays neutral with regard to jurisdictional claims in published maps and institutional affiliations. |
© 2021 by the authors. Licensee MDPI, Basel, Switzerland. This article is an open access article distributed under the terms and conditions of the Creative Commons Attribution (CC BY) license (http://creativecommons.org/licenses/by/4.0/).
Share and Cite
MDPI and ACS Style
Pontes Luz, G.; Amaro e Silva, R. Modeling Energy Communities with Collective Photovoltaic Self-Consumption: Synergies between a Small City and a Winery in Portugal. Energies 2021, 14, 323. https://doi.org/10.3390/en14020323
AMA Style
Pontes Luz G, Amaro e Silva R. Modeling Energy Communities with Collective Photovoltaic Self-Consumption: Synergies between a Small City and a Winery in Portugal. Energies. 2021; 14(2):323. https://doi.org/10.3390/en14020323
Chicago/Turabian StylePontes Luz, Guilherme, and Rodrigo Amaro e Silva. 2021. "Modeling Energy Communities with Collective Photovoltaic Self-Consumption: Synergies between a Small City and a Winery in Portugal" Energies 14, no. 2: 323. https://doi.org/10.3390/en14020323
Note that from the first issue of 2016, this journal uses article numbers instead of page numbers. See further details here.