3D Concrete Printing for Sustainable Construction


1
Faculty of Civil and Environmental Engineering, West Pomeranian University of Technology in Szczecin, 70-310 Szczecin, Poland
2
Faculty of Mechanical Engineering and Mechatronics, West Pomeranian University of Technology in Szczecin, 70-310 Szczecin, Poland
*
Authors to whom correspondence should be addressed.
Energies 2020, 13(23), 6351; https://doi.org/10.3390/en13236351
Submission received: 29 October 2020
/
Revised: 24 November 2020
/
Accepted: 27 November 2020
/
Published: 1 December 2020
(This article belongs to the Special Issue Sustainable Materials and Technologies for Energy Efficient Buildings)
Abstract
:Despite the rapid development of 3D printing technology for cement composites, there are still a number of unsolved issues related to extrusion printing. One of them is proper mix design that allows for meeting criteria related to the printing of cementitious materials, such as pumpability, buildability, consistency on the materials, flowability and workability, simultaneously incorporating sustainable development ideas. In the case of mixes for 3D printing, the modification of the composition which increases the overall performance does not always go hand in hand with the reduction of negative environmental impact. The article presents the results of tests of eight mixtures modified with reactive and inert mineral additives designed for 3D printing. The mixes were evaluated in terms of their rheological and mechanical properties as well as environmental impact. Initial test results were verified by printing hollow columns up until collapse. Later, the differences between the compressive strength of standard samples and printed columns were determined. In order to summarize the results, a multi-faceted analysis of the properties of the mixes was carried out, introducing assessment indicators for its individual parameters. The article proves that appropriate material modification of mixes for 3D printing can significantly reduce the negative impact on the environment without hindering required 3D printing properties.
1. Introduction
An increase in the number of scientific research projects in the last few decades allowed for extensively developing the concrete technology. Ordinary concretes with their typical characteristics and mediocre strength do not meet modern expectations of both designers and contractors. The research on new materials focuses not only on improved material characteristics, but also on overall energy efficiency and environmental impact. In order to incorporate the idea of sustainable development, new materials should have the lowest possible energy consumption for their production, the greatest possible durability throughout their lifetime, best possible strength characteristics and resistance to aggressive environment, and also should be recyclable after their serviceability ends. The development of new technologies which will speed up all construction processes and increase the overall performance plays an extremely important role. Incorporation of 3D printing in civil engineering can help to achieve those goals.
The 3D concrete printing was developed by a team from the University of Southern California [1,2,3,4]. The first setup was equipped with a specific type of concrete trowel head. Their method of printing was named contour crafting [2,5,6]. The team from Loughborough University was another research group that has contributed to the development of concrete printing [7,8,9]. Their work allowed for developing the method of printing directly from the nozzle without troweling blades. Another interesting approach was to use the basics of the FDM (Fused Deposition Modeling) technology and introduce the support materials for 3D concrete printing. The technology was called D-Shape [10]. A different approach was taken by the team from the Institute of Advanced Architecture of Catalonia, who called their project Minibuilders [3]. Instead of a single printing machine, there are several small robots, each with their own task.
One of the main problems associated with 3D printing of concrete is to determine required properties of the mix [3,4,8,11,12,13,14,15]. To those we can include extrudability, buildability, flowability, and open time. In a well-printed structure, each layer should have the same height and width and should not exhibit extensive deformations or discontinuities. The problem of horizontal and vertical interlayer adhesion must also be considered. A parameter that defines those characteristics is called buildability. In practice, it determines how much stress can be transferred by lower layers of the printed structure as a result of loading with subsequent layers of concrete. During the printing process, fresh concrete begins to harden, increasing its compressive strength and stiffness over time. It is also continuously loaded with additional layers, at a rate depending on the speed and printing strategy.
Researchers analyze different rheological models to describe the behavior of the printed concrete mix and apply different test methods to determine its parameters. Some researchers assume that buildability depends on rheological (yield stress-) and thixotropic material properties (structural build-up) [4,9,16,17,18,19], and consider the mixture as non-Newtonian fluid. Others try to transform the and parameters defining the non-Newtonian fluids into parameters describing the mixture’s compressive strength [17,20,21]. The shape of the printed path depends on the yield stress and gravity, which is the main force imposed on the print in this phase of printing. In some cases, the shape of the printed path may also be significantly affected by surface tension [22]. In addition, a crucial role is played for the shape of the printed path, size and shape of the nozzle, deposit velocity, type of pumping device, and pump output [23,24,25,26].
In addition to the load-bearing capacity and stiffness of the material, the stability of the printed structure should also be taken into consideration. Buckling under the self-weight during the printing process is a critical issue [27]. In order to limit the influence of the loss of stability, it is possible to either increase the thickness of the printed wall or apply other solutions which increase its stiffness, e.g., creating lattice within the structure. The detailed considerations on the stability of printed structures were carried out by a team from Eindhoven [28,29]. Other teams tried to determine the parameters of the printed fresh concrete using the principles of soil mechanics, including direct shear and uniaxial compression in unconfined uniaxial compression tests [30]. A model based on the Coulomb–Mohr theory for cement materials was used in the studies [31,32,33]. Casagrande et al. [34] based on other studies [23,28,30] analyzed the way the printed structure failed due to loss of stability.
Many research teams [7,9,11,35,36,37] determine the buildability by printing structures several dozen layers high to analyze the behavior of the structure at different levels of load and to observe the occurring deformations. Apart from the number of layers, the printing speed should also be taken into consideration. Higher speed means shorter times between subsequent layers, while lower speed can affect the interlayer adhesion. A simple and quick method for determining whether the material has sufficient buildability is presented in the paper [11]. A method called a “cylinder stability” involves small cylindrical specimens (d = 40 mm, h = 80 mm) that are loaded with a 5.5 kg (σ = 4.77 kPa). The test involves determination of deformations. A similar solution has been used in [38,39].
A different simplified method for determining buildability was adopted by Le et al. [7,8]. In the study, the shear stress values required for printing (between 0.3 and 0.9 kPa) are initially determined in the shear test [40]. Then, a wall element is printed, and the buildability is determined on the basis of the number of layers at which the structure collapsed. A similar test procedure is used by Malaeb et al. [36], who also print the wall and count the number of layers until collapse. Perrot et al. [17], developed a method for simulating the printing process. In a printing process, the following layers are extruded on top of the previous layer after a certain interval which depends on the printing speed. Perrot proposed a method for simulating this process by loading cylindrical samples D = 60 mm; H = 35 mm at a given time interval between 11 s and 60 s (corresponding to the assumed nozzle speeds between R = 6.1 m/h and R = 1.1 m/h). The load was calculated to be the weight of a subsequent printed layer. On this basis, the time until the structure collapsed and the accompanying stresses were determined. The above described way of determining the mixture parameters was widely used by other researchers [4,30,34,41]. However, there are a number of factors that can affect the printing process such as nozzle type, deposit speed, printer type, or pump model [23,24,25,42].
Many researchers try to determine the mixture buildability by determining the yield stress in rheometric tests, but these methods do not provide unanimous results [22,43]. Lafhaj et al. [44] use a combination of extrudability and buildability assessment methods to determine the correlation between the rheological and mechanical properties. Shakor et al. [23] conducted the buildability test using an extrusion caulking gun. In addition, Shakor et al. [23] evaluated the properties of fresh concrete in a slump flow test and Squeeze Flow Test. Tay et al. [45] perform the evaluation of the printed fresh concrete on the slump flow table in accordance with the standard [46]. He considers the mixture with a flow rate between 150 and 190 mm and a slope between 4 and 8 mm to be suitable for printing.
A certain concern in concrete technology, especially 3D printing, is the environmental impact [47,48]. Additive manufacturing consumes almost exactly as much material as it is needed to produce a given structure, which results in a significant reduction of waste production and material consumption [49,50]. Based on estimates given in [36,51,52], the reduction of waste may be as high as 30%–60%. According to [53,54,55], appropriate optimization of the printing process may reduce the consumption of materials up to 70%. 3D printing as one of the methods of automating the construction processes significantly shortens the total construction time [49,56], which directly translates to lower general costs. One of the aspects is the reduction in formwork time usage. For ordinary concretes, the formwork is used for 50%–75% of the total execution time [57,58]. Abandoning the formwork significantly reduces the costs [49,51]. In traditional construction, the cost of formwork amounts to as much as 35%–54% of the total cost of making concrete structures [58,59,60,61]. Assessment of the whole printing process, including the preparation and clean-up stages, is presented in the paper [62]. Researchers printed the walls of the building with area of about 47.57 m2 (4.88 m × 9.75 m × 2.82 m) within 14 h (print time according to [62]). However, taking into account the setting and calibration of the machine, preparation for printing, preparation of the mixture, and cleaning, the time increased to 31.2 h (elapsed time according to [62]), while the whole operation took five days.
The use of 3D printing also reduces the cost of labour [49,51]. Automation of the construction process will reduce the demand for manual workers. Based on the estimates presented by [51,52,55,63], the reduction of labour costs may amount to 40%–80%. Reducing the number of manual workers on the construction site due to the use of additive manufacturing may reduce the number of accidents caused by human error [4,64,65], which increases the overall safety on the construction site.
Another aspect related to the cost reduction is related to the cost of prefabrication, which decreases with the increase of the number of produced elements. It results from the necessity of preparing additional work stand/framework and designing the proper execution technology for each individually shaped element. Using 3D printing, the quantity of unique elements has no major impact on the production cost. Moreover, making complicated structures does not increase the price of construction. Researchers [66,67] noticed that the cost of making the structure with the use of additive manufacturing will decrease with global commercialization. Reduction in costs and material usage translates directly into the reduction of global energy consumption, reduction of greenhouse gas emissions, reduction of water consumption, and waste production [53,68,69].
In order to further reduce the negative environmental impact of producing concrete elements, it is necessary to design the concrete mix in an appropriate way. Many research teams use mixes with a high cement content [7,8,26,36,70] in order to obtain required properties for printing, which increases the negative impact on the environment. To reduce the amount of cement in 3D printed mixes, it is recommended to use reactive and inert mineral additives, such as silica fume, fly ash, metakaolin, limestone powder, and quartz powder, similarly as in high-performance concretes [7,8,26,71,72,73,74,75]. Another way to achieve the desired properties is to modify the mixture with appropriate chemical admixtures including superplasticizers, accelerators, retarders, or Viscosity Modifying Agents (VMA) [5,11,72]. However, the use of chemical admixtures, especially in large quantities, may significantly increase the total cost of the mix. Proper selection of chemical admixtures that influence the viscosity allows for obtaining necessary rheological properties of fresh concrete, but may cause a decrease in its strength. However, for 3D printed architectural elements or low building walls, the high strength of concrete may not be necessary. An alternative solution for reducing negative environmental impact may be the use of geopolymer concrete [52,72,76].
Currently, there are no precise methods for determining the strength characteristics of fresh concrete (mixture) intended for 3D printing. The above overview of research and analysis carried out by various researchers shows the importance of this problem and shines light on the necessity for standardized test methods which will allow researchers to compare the achievements and introduce this technology for industrial purposes. The article presents the results of tests of concrete mixes for 3D printing and multi-faceted analyses of their characteristics and impact on the environment. Based on the test results, mixes with best rheological and strength characteristics were analyzed in terms of cost efficiency and five environmental impact categories (Global Warming, Carcinogenic, Ozone depletion, Ecotoxicity (CTUe), Fossil fuel depletion (MJ)).
2. Materials and Methods
2.1. Materials
The article presents the test results of eight concrete mixtures, four with a constant, high amount of binder B = 840 kg/m3 selected on the basis of previous research conducted by the authors [26,70] and four with a low amount of binder B = 640 kg/m3. Mixes were made using Portland cement CEM I 52,5R (European Standard EN 197-1:2000) or a composition of 70% cement, 20% fly ash (FA) and 10% silica fume (SF). Mixes were modified with superplasticizer (SP) Sika® ViscoCrete ® -225 Powder and based on a fine aggregate 0–2 mm. The W/B ratio or W/(C + SF + FA) in the study was assumed as constant value of 0.28. The limestone powder (LP) was used in four mixes to replace 20% of fine aggregate. The mix composition was made to allow for a qualitative evaluation of the influence of mineral additives and cement amount on the properties of printed concrete. The composition and notification of the investigated mixtures are presented in Table 1. The chemical composition of cement, fly ash, limestone powder and silica fume are presented in Table 2.
2.2. Test Methods
2.2.1. Workability
The workability test was performed using a slump flow table after 15, 30, and 45 min from water contact (4 specimens for each test). The test was performed according to European Standard [77].
2.2.2. Compressive Strength of Concrete
Determination of compressive strength was performed on standard cubic samples 40 × 40 × 40 mm after 10 h and 1, 3, 7, 28 days (4 specimens for each test). The test was performed according to European Standards [78].
2.2.3. Compressive Strength of the Mix in the Printing Simulation Test (Squeezing Test)
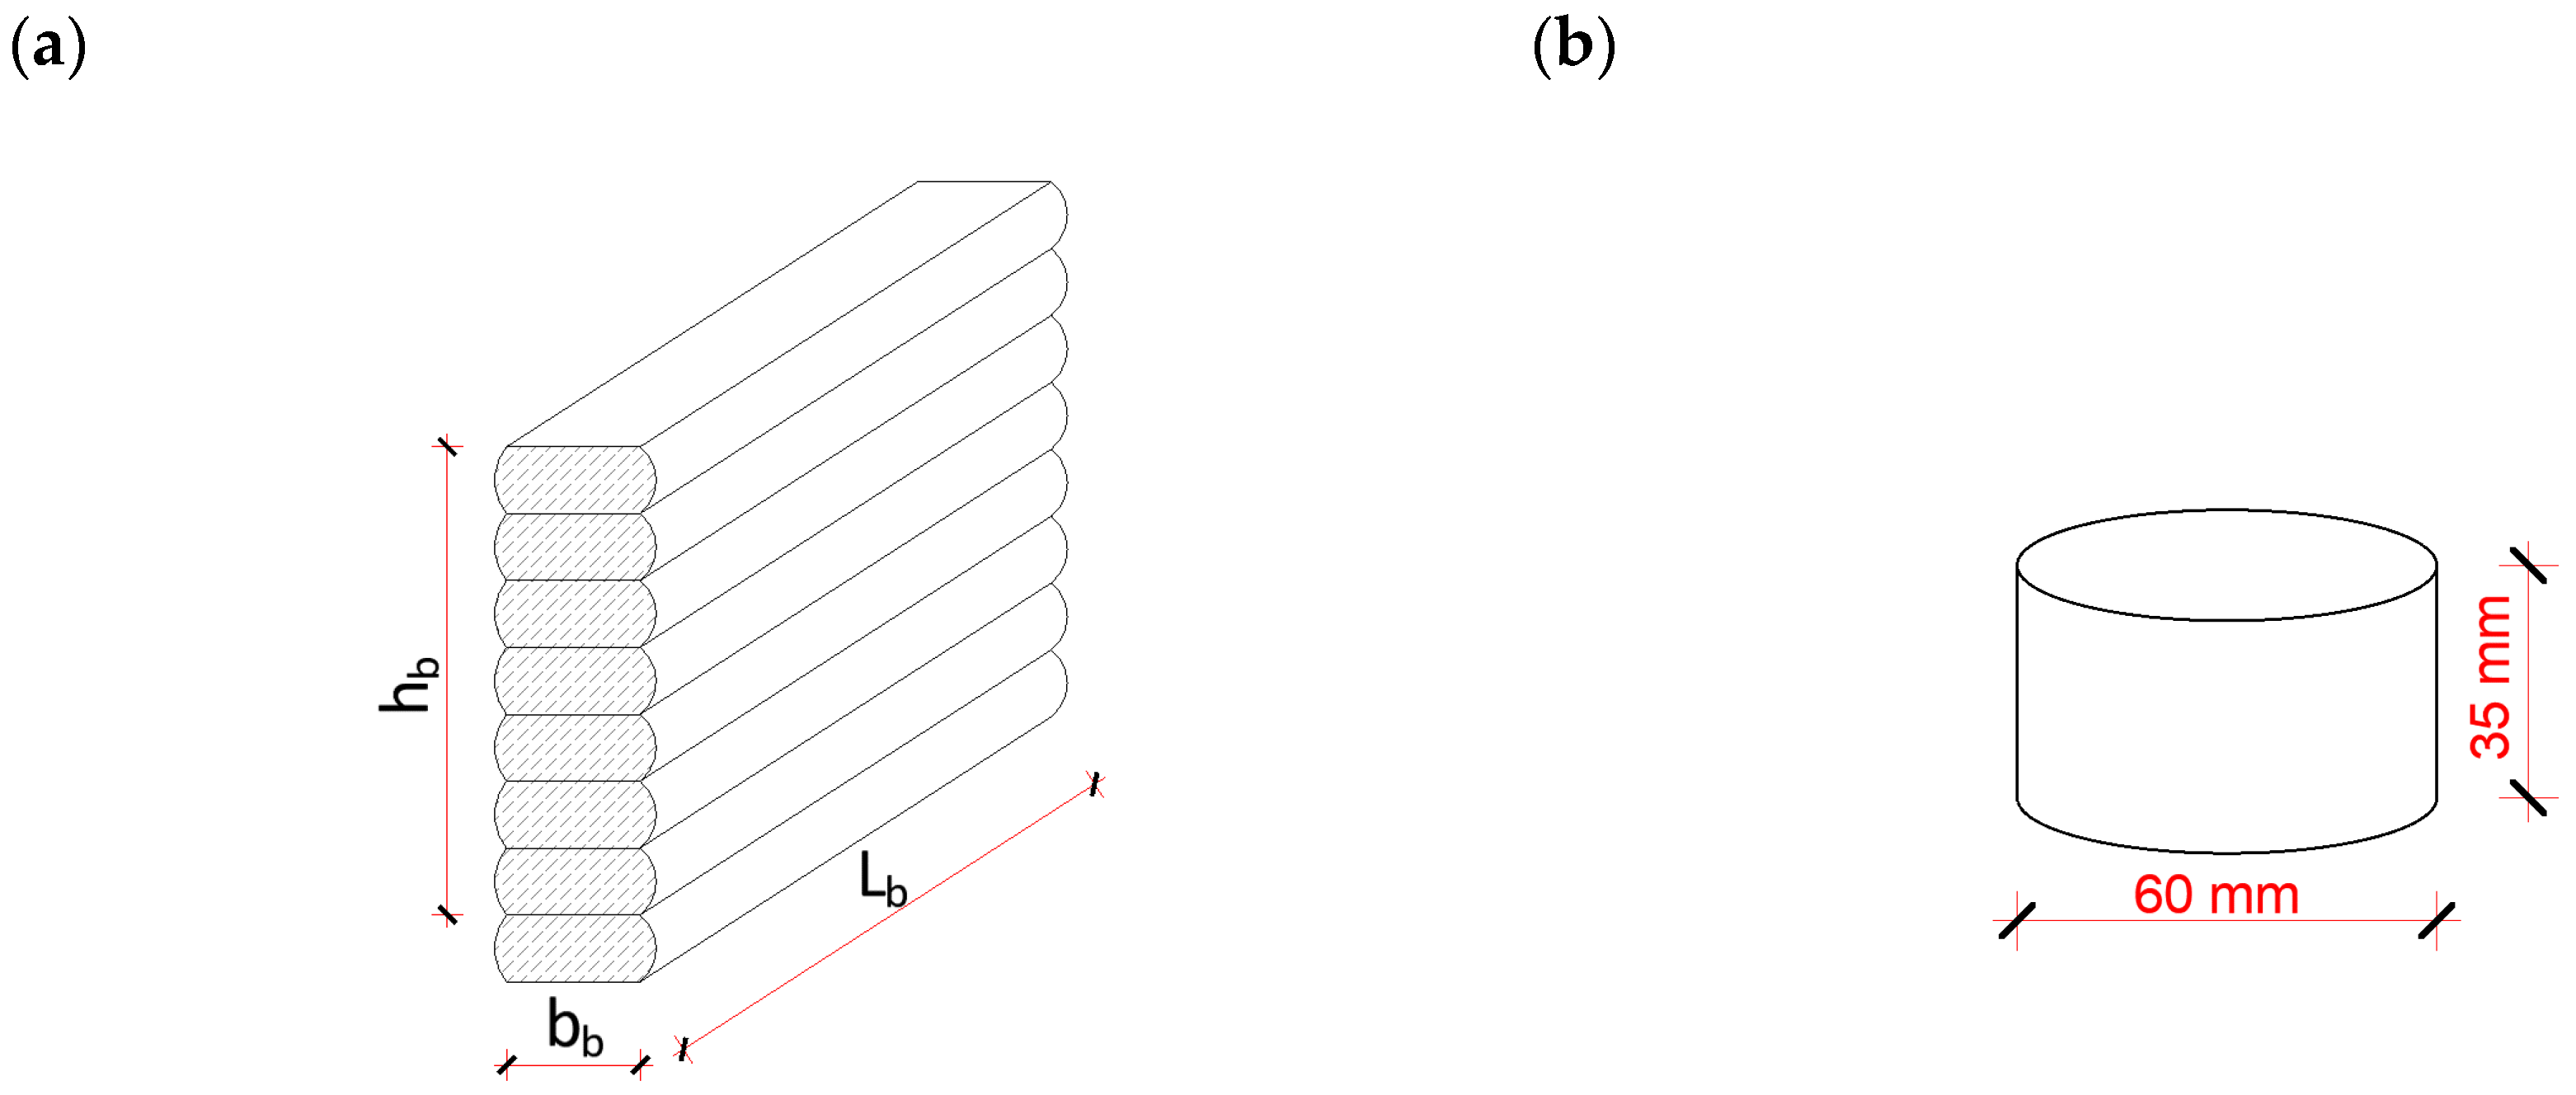
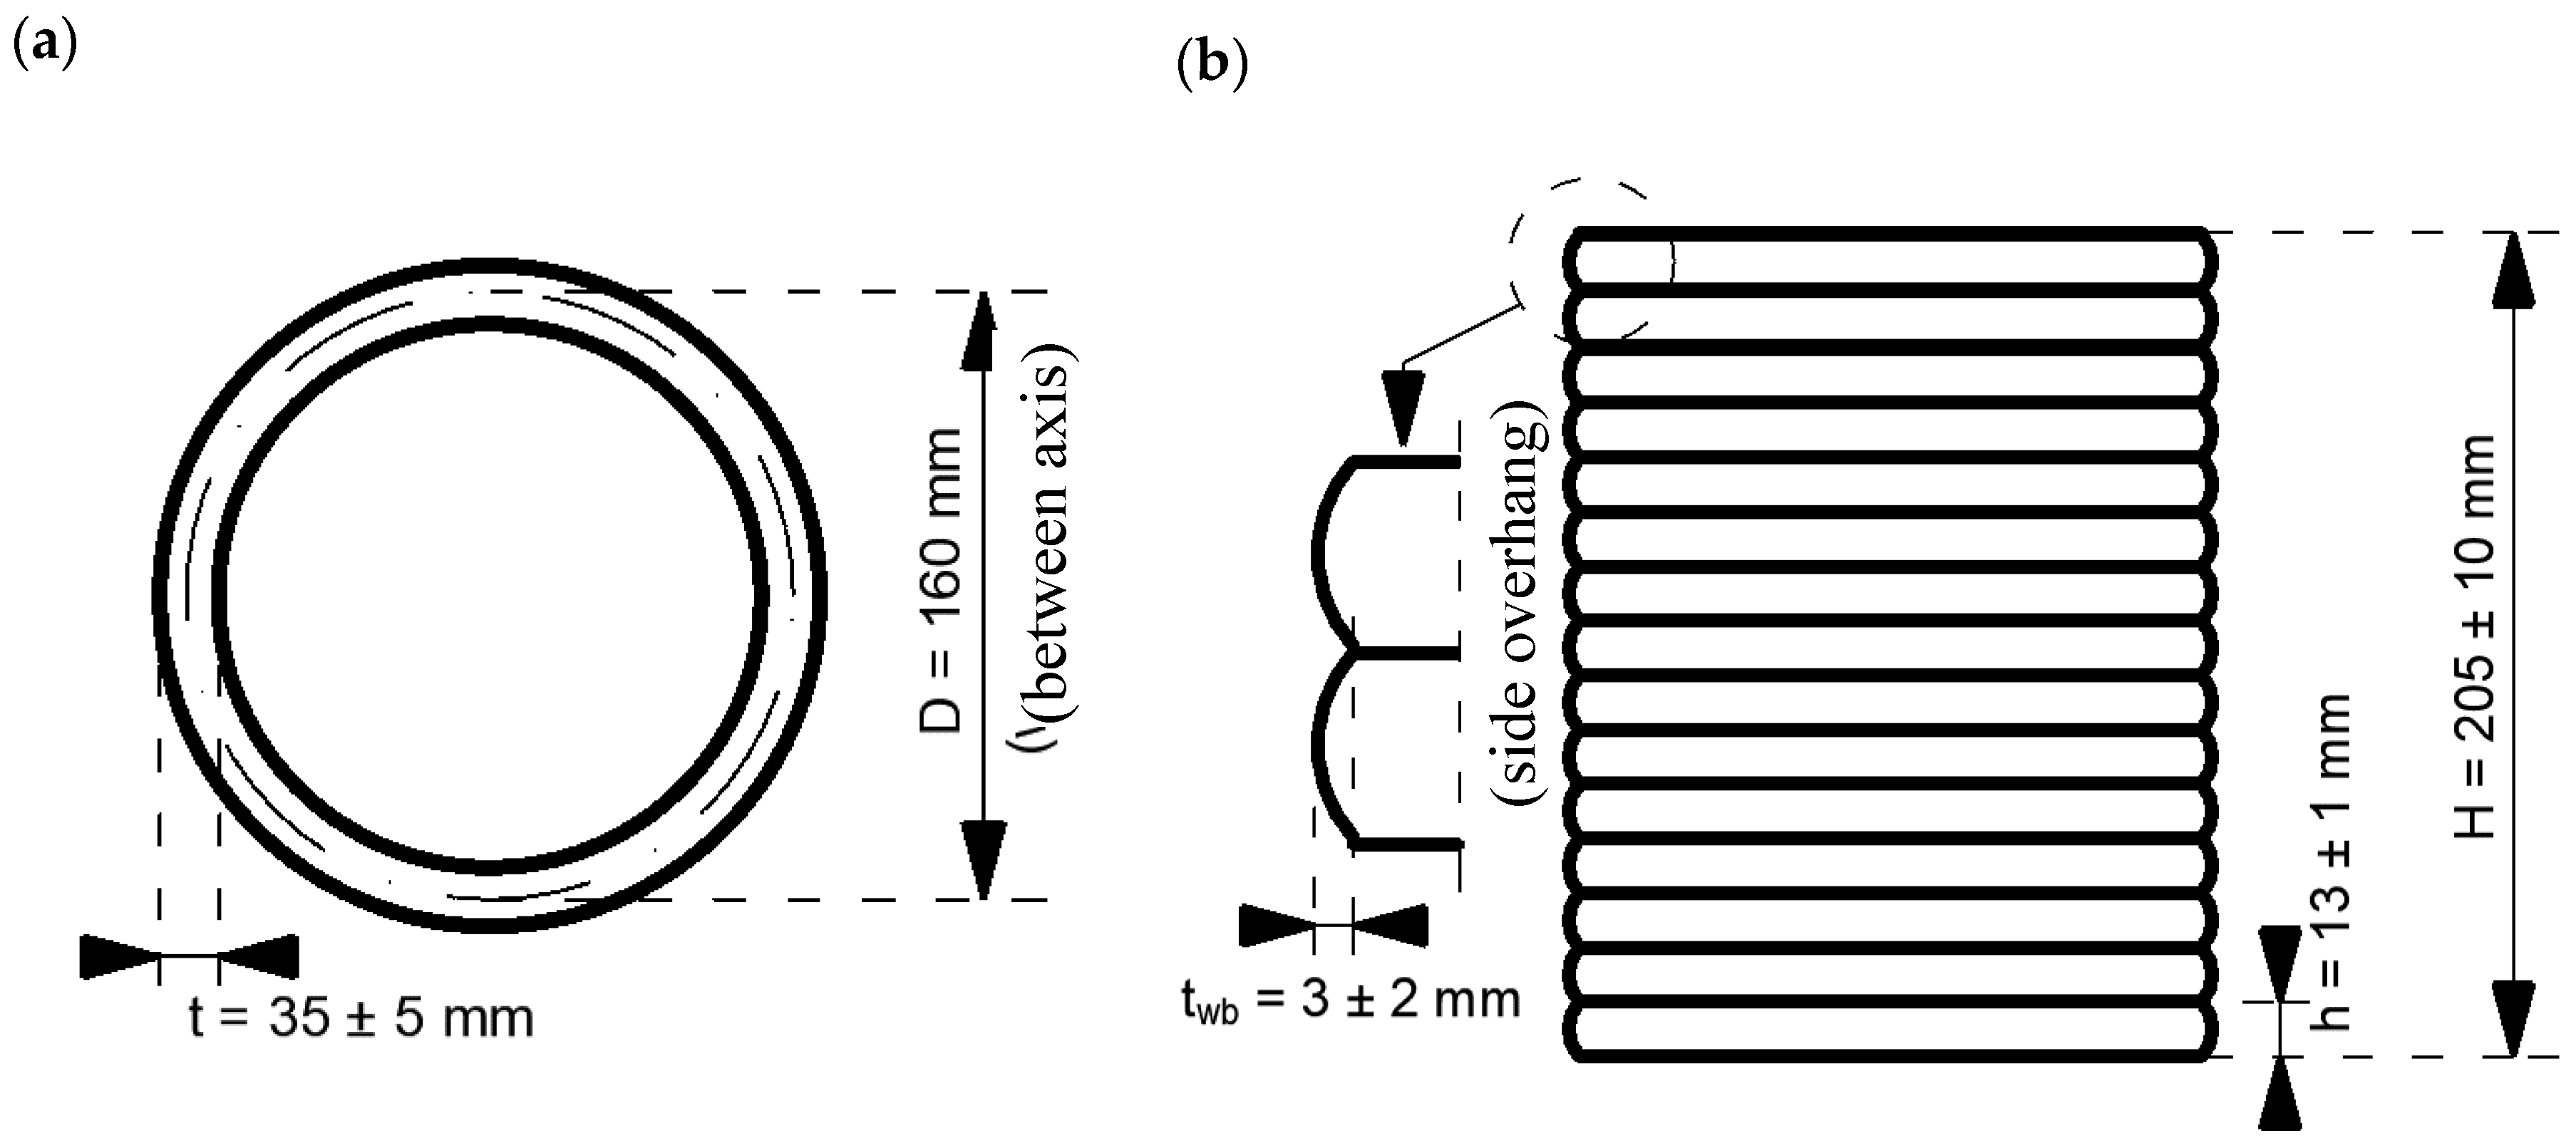
Mechanical characteristics of mixes were tested in a modified version of the squeezing test which was introduced by Roussel et al. [20,79] and adopted by Perrot et al. [17]. During the test, the samples are loaded periodically with a certain load. Increase of the load after a specific interval simulates the printing process. The load simulates the weight of layers above, applied at a certain time interval. The time interval (–cycle time) between subsequent layers corresponds to a real printing time. The shorter the time, the higher the printing speed. Tested samples are presented in Figure 1b).
The stress distribution in the lower layers of the printed wall (Figure 1a) does not depend on the area but only on the height of the layers and on the weight of concrete. The average density of the tested mixes was . Calculated force of a single subsequent layer (b = 25 mm) was assumed as 1.497 N (weight is approx. 153 g)—see Equation (1). Based on the above analysis, weights of 150 g ± 10 g were used in the study:
, , —length, width and height of analyzed wall fragment (Figure 1).
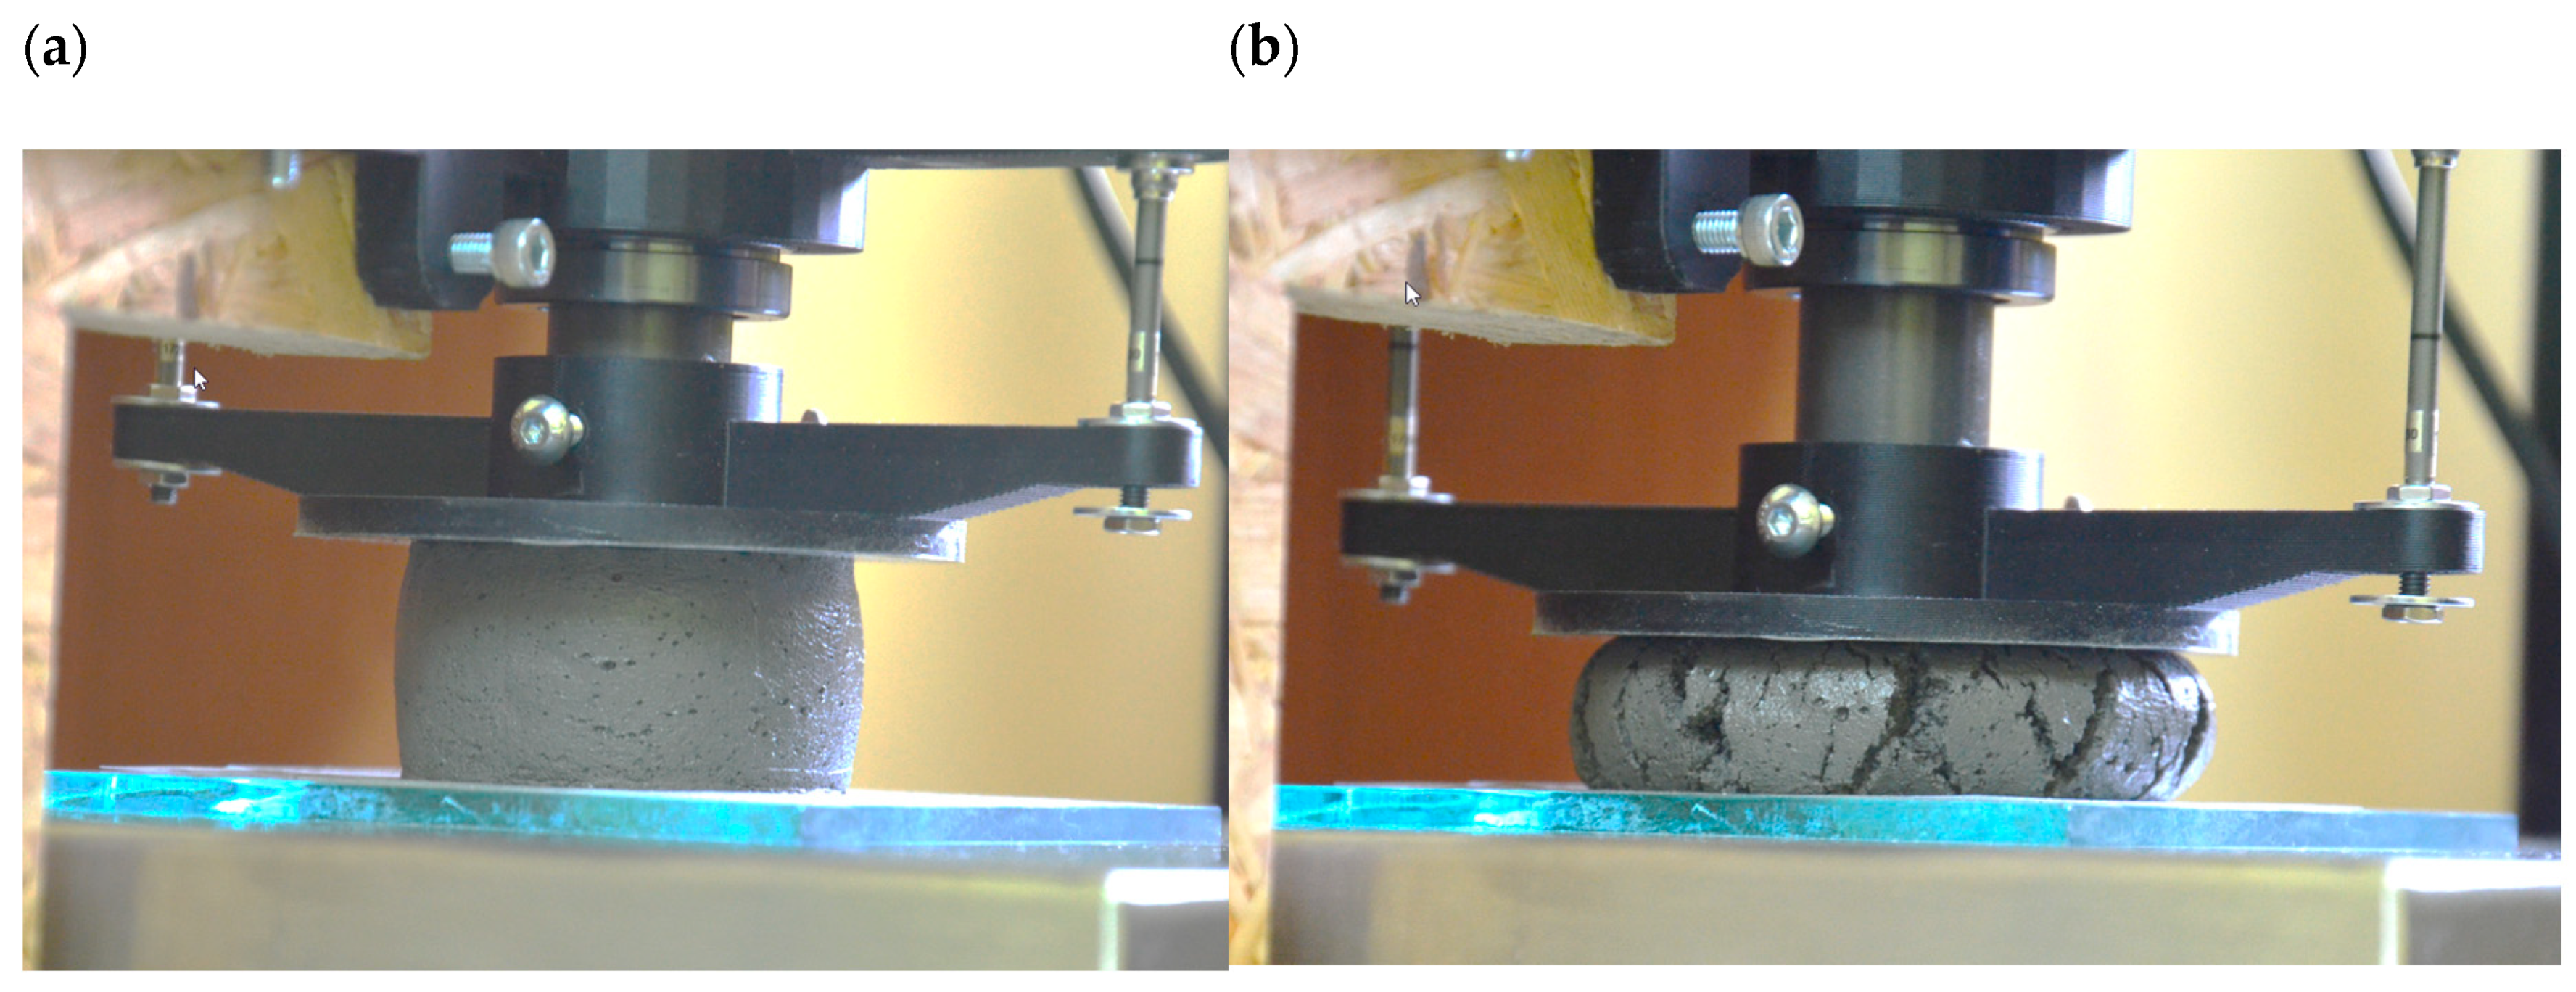
The deformation of the sample during the test was recorded by LVDT (Linear Variable Differential Transformer) displacement transducers (0.01 mm accuracy) connected to the HBM QuantumX strain gauge bridge (MX840A, HBM, Darmstadt, Germany). The reading was recorded by Catman software (HBM, Darmstadt, Germany). The results of the measurements were registered at 50 Hz. The sample during the test is presented in Figure 2.
The study determined the relationship between axial normal stress and axial normal strain () of materials measured in a squeezing test after 15, 30 and 45 min of adding the water (-printing time). The test was performed on a low-force compression device that allows for applying the force in the range of 5–200 N. The measurement error of the setup is ± 0.5 N. Consecutive loads were added at the appropriate time interval as presented in [17,34]. Three time intervals (cycle time) of 10 s, 15 s and 20 s were assumed. It gave a total of 9 time points (3 test times × 3 intervals) during which the properties of the mixture were evaluated. For each time point, at least 3 specimens were tested.
2.2.4. Compressive Strength of Mix during the Printing Process
The load-bearing capacity of fresh concrete was evaluated during the printing process of hollow columns. For each considered mix, three columns with D = 160 mm were printed until collapse.
Cycle time of the printing process indicates the time for a full nozzle cycle (from the starting point to the end of the layer). For assumed cycle times (10 s, 15 s, 20 s), proper printing speed was calculated. The printing speed for assumed cycle times was v = 50 mm/s (F = 3000 mm/min), v = 34 mm/s (F = 2040 mm/min), and v = 25 mm/s (F = 1500 mm/min), respectively. Values in the brackets are the values directly given into the G-Code. The pump output Q in the study was Q = 1.08 −1.68 l/min (F = 3000 mm/min), Q = 0.734 − 1.142 l/min (F = 2040 mm/min), and Q = 0.54 − 0.84 l/min (F = 1500 mm /min), respectively.
The printing was made using a Cartesian robot (frame printer, 3 DOF) of our own design connected to a pumping module. The robot has a working area of 1451 mm (x-axis) by 1200 mm (y-axis) by 860 mm (z-axis). Each axis is driven by a stepper motor.
The printing of each column was performed until the moment of collapse. The measured load-bearing capacity of the mixes was assumed as the buildability in accordance with [7,8,36]. The height of the structure before collapsing was measured allowing for calculating the stress in accordance with Equation (2):
—height of the column at collapse; —specific weight of the concrete.
2.2.5. Compressive Strength of the Printed Column
The compressive strength of hardened concretes was evaluated on the printed samples. Tests were conducted on printed hollow columns with D = 160 mm and H = 205 ± 10 mm (for each test, three specimens were printed). The width of the layer was assumed as t = 35 ± 5 mm. The side overhangs (Figure 3) of the layers were maintained within the margin of twb = 3 ± 2 mm. Figure 3 shows the plan and view of the printed structure. Before the printing, a quality assessment test was performed each time in accordance with [26].
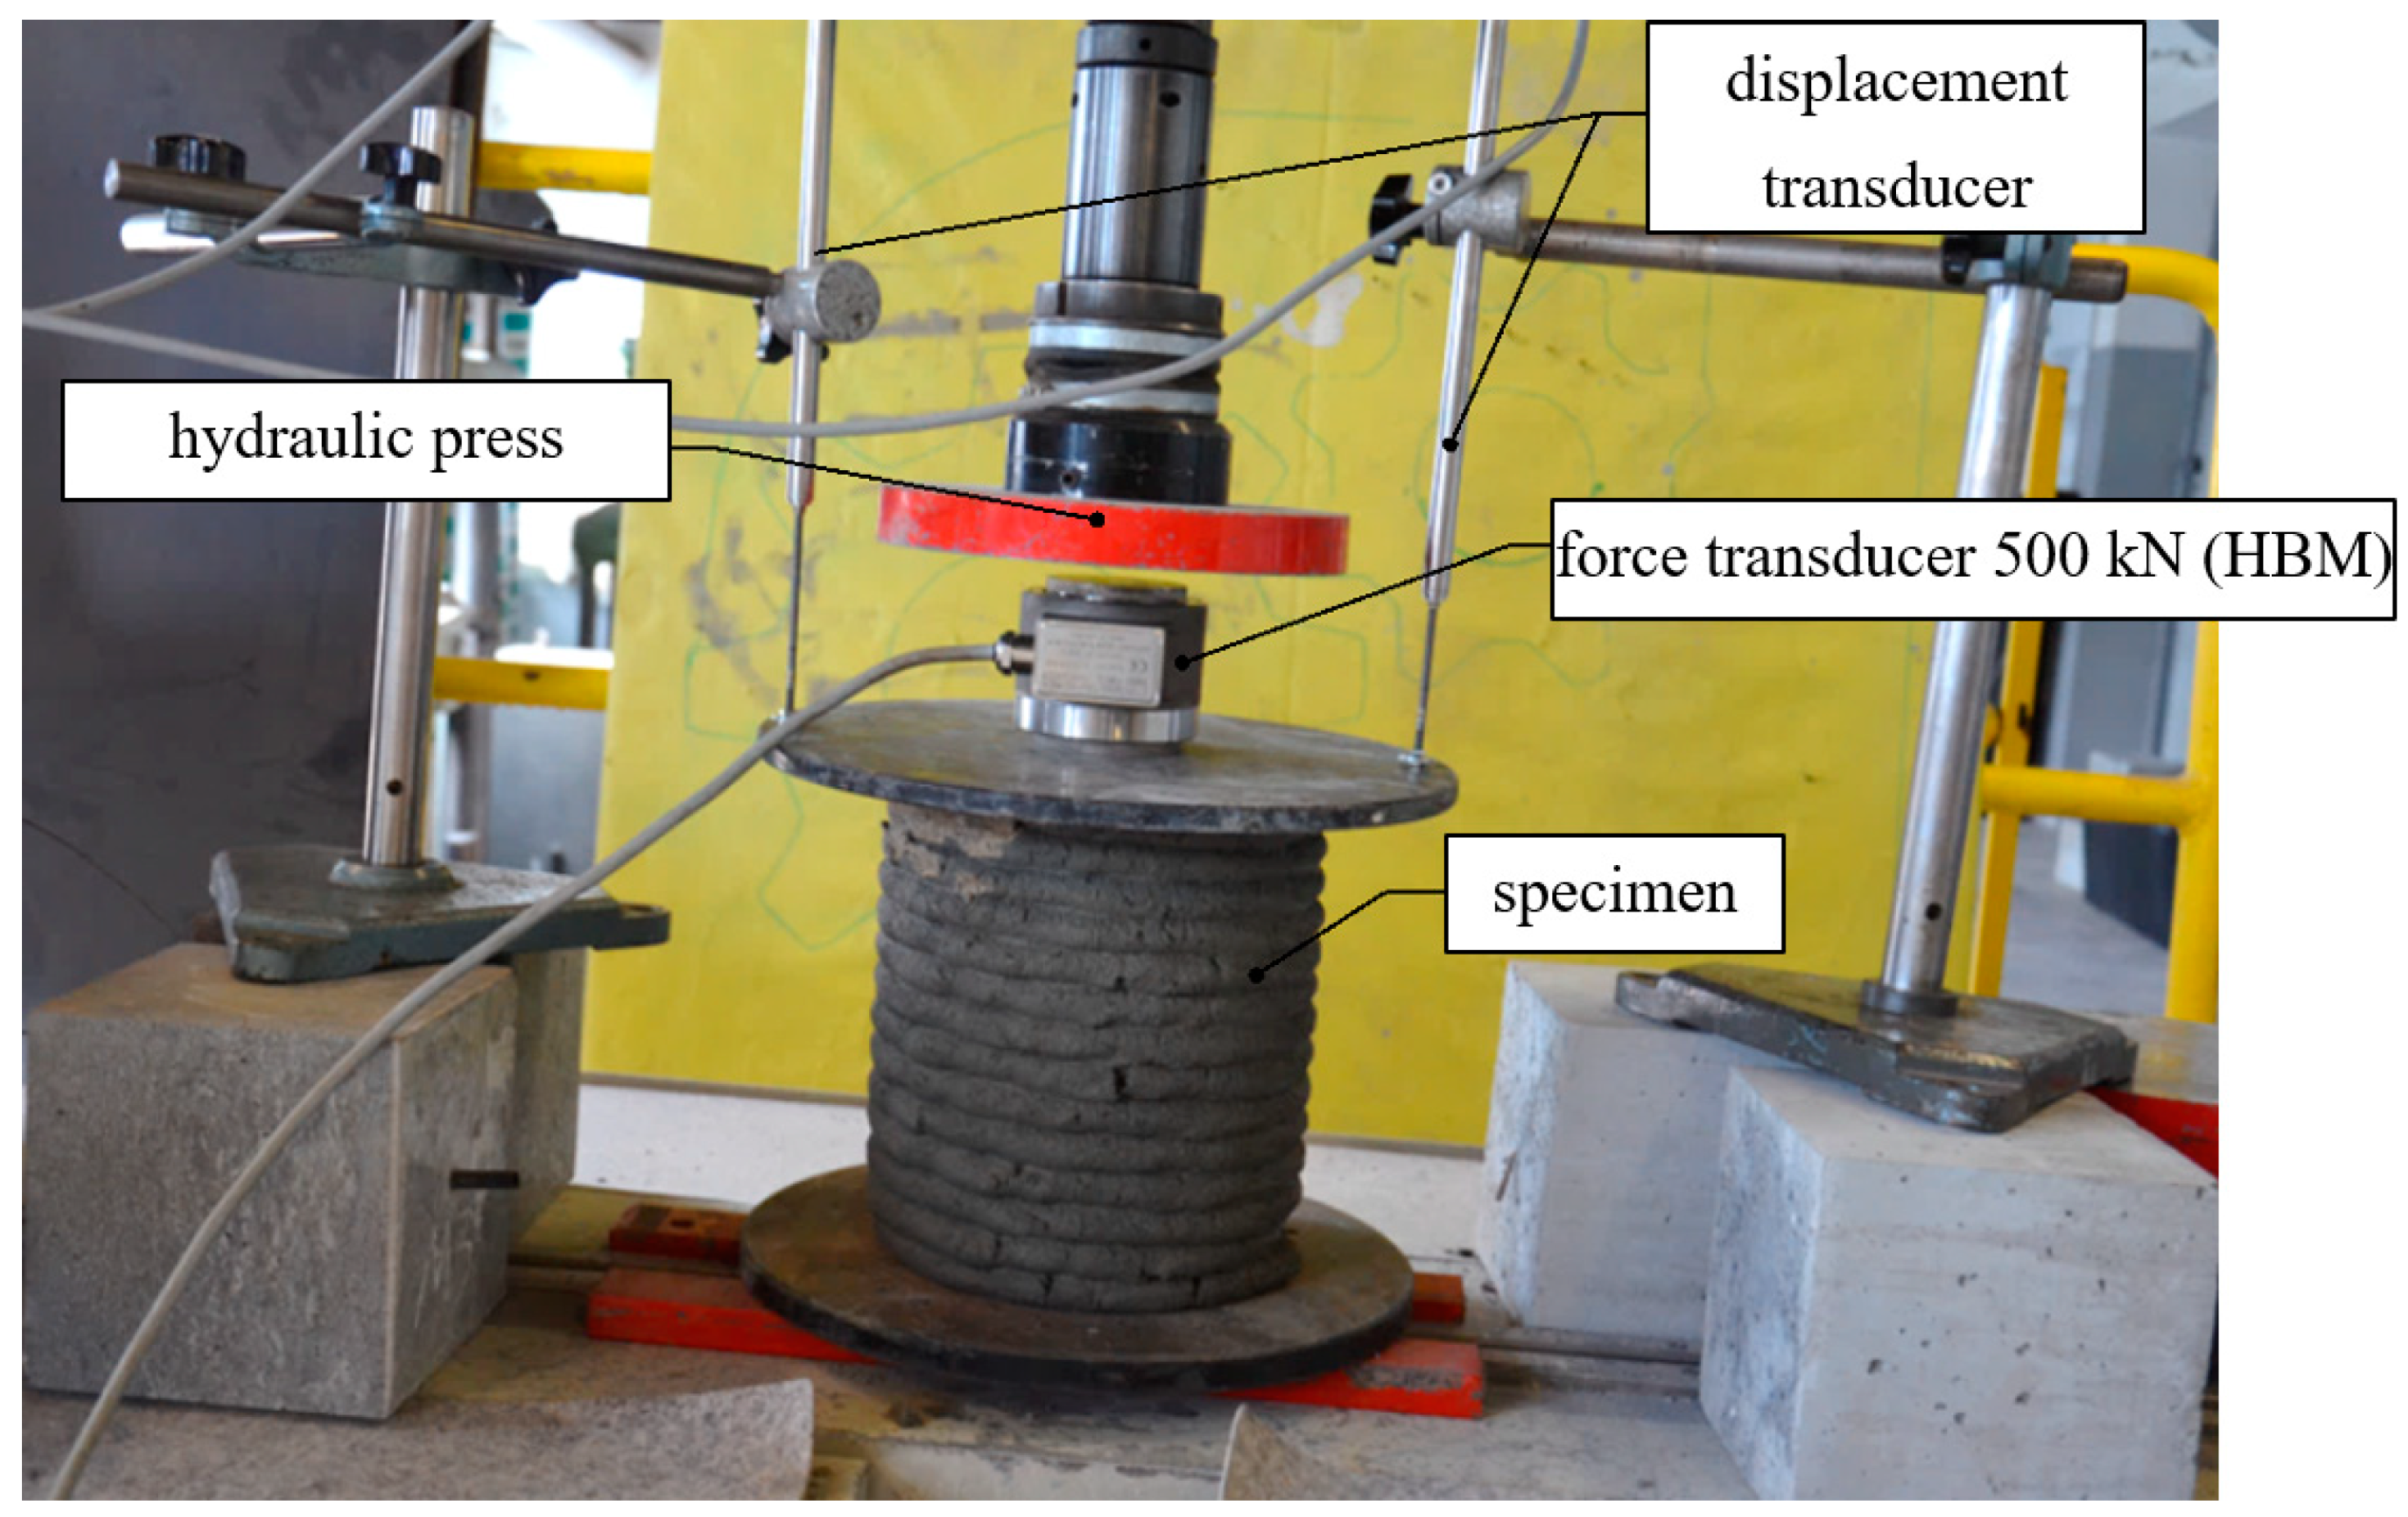
The load-bearing capacity of the samples was tested at 10 h after printing (early-age parameters of concrete are crucial in additive manufacturing). The test was performed on a hydraulic press with the use of additional equipment. The test stand consisted of: two LVDT displacement transducers installed on both sides of the sample. The average value of two measurements was taken for final considerations. An additional 500 kN (HMB C6A) force transducer was attached to the hydraulic press (100 kN). The additionally installed force and displacement transducer allowed for simultaneous registration of force and displacement. The results were recorded using the HBM QuantumX and Catman software. The test stand is presented in Figure 4.
3. Test Results
3.1. Workability of Mixes
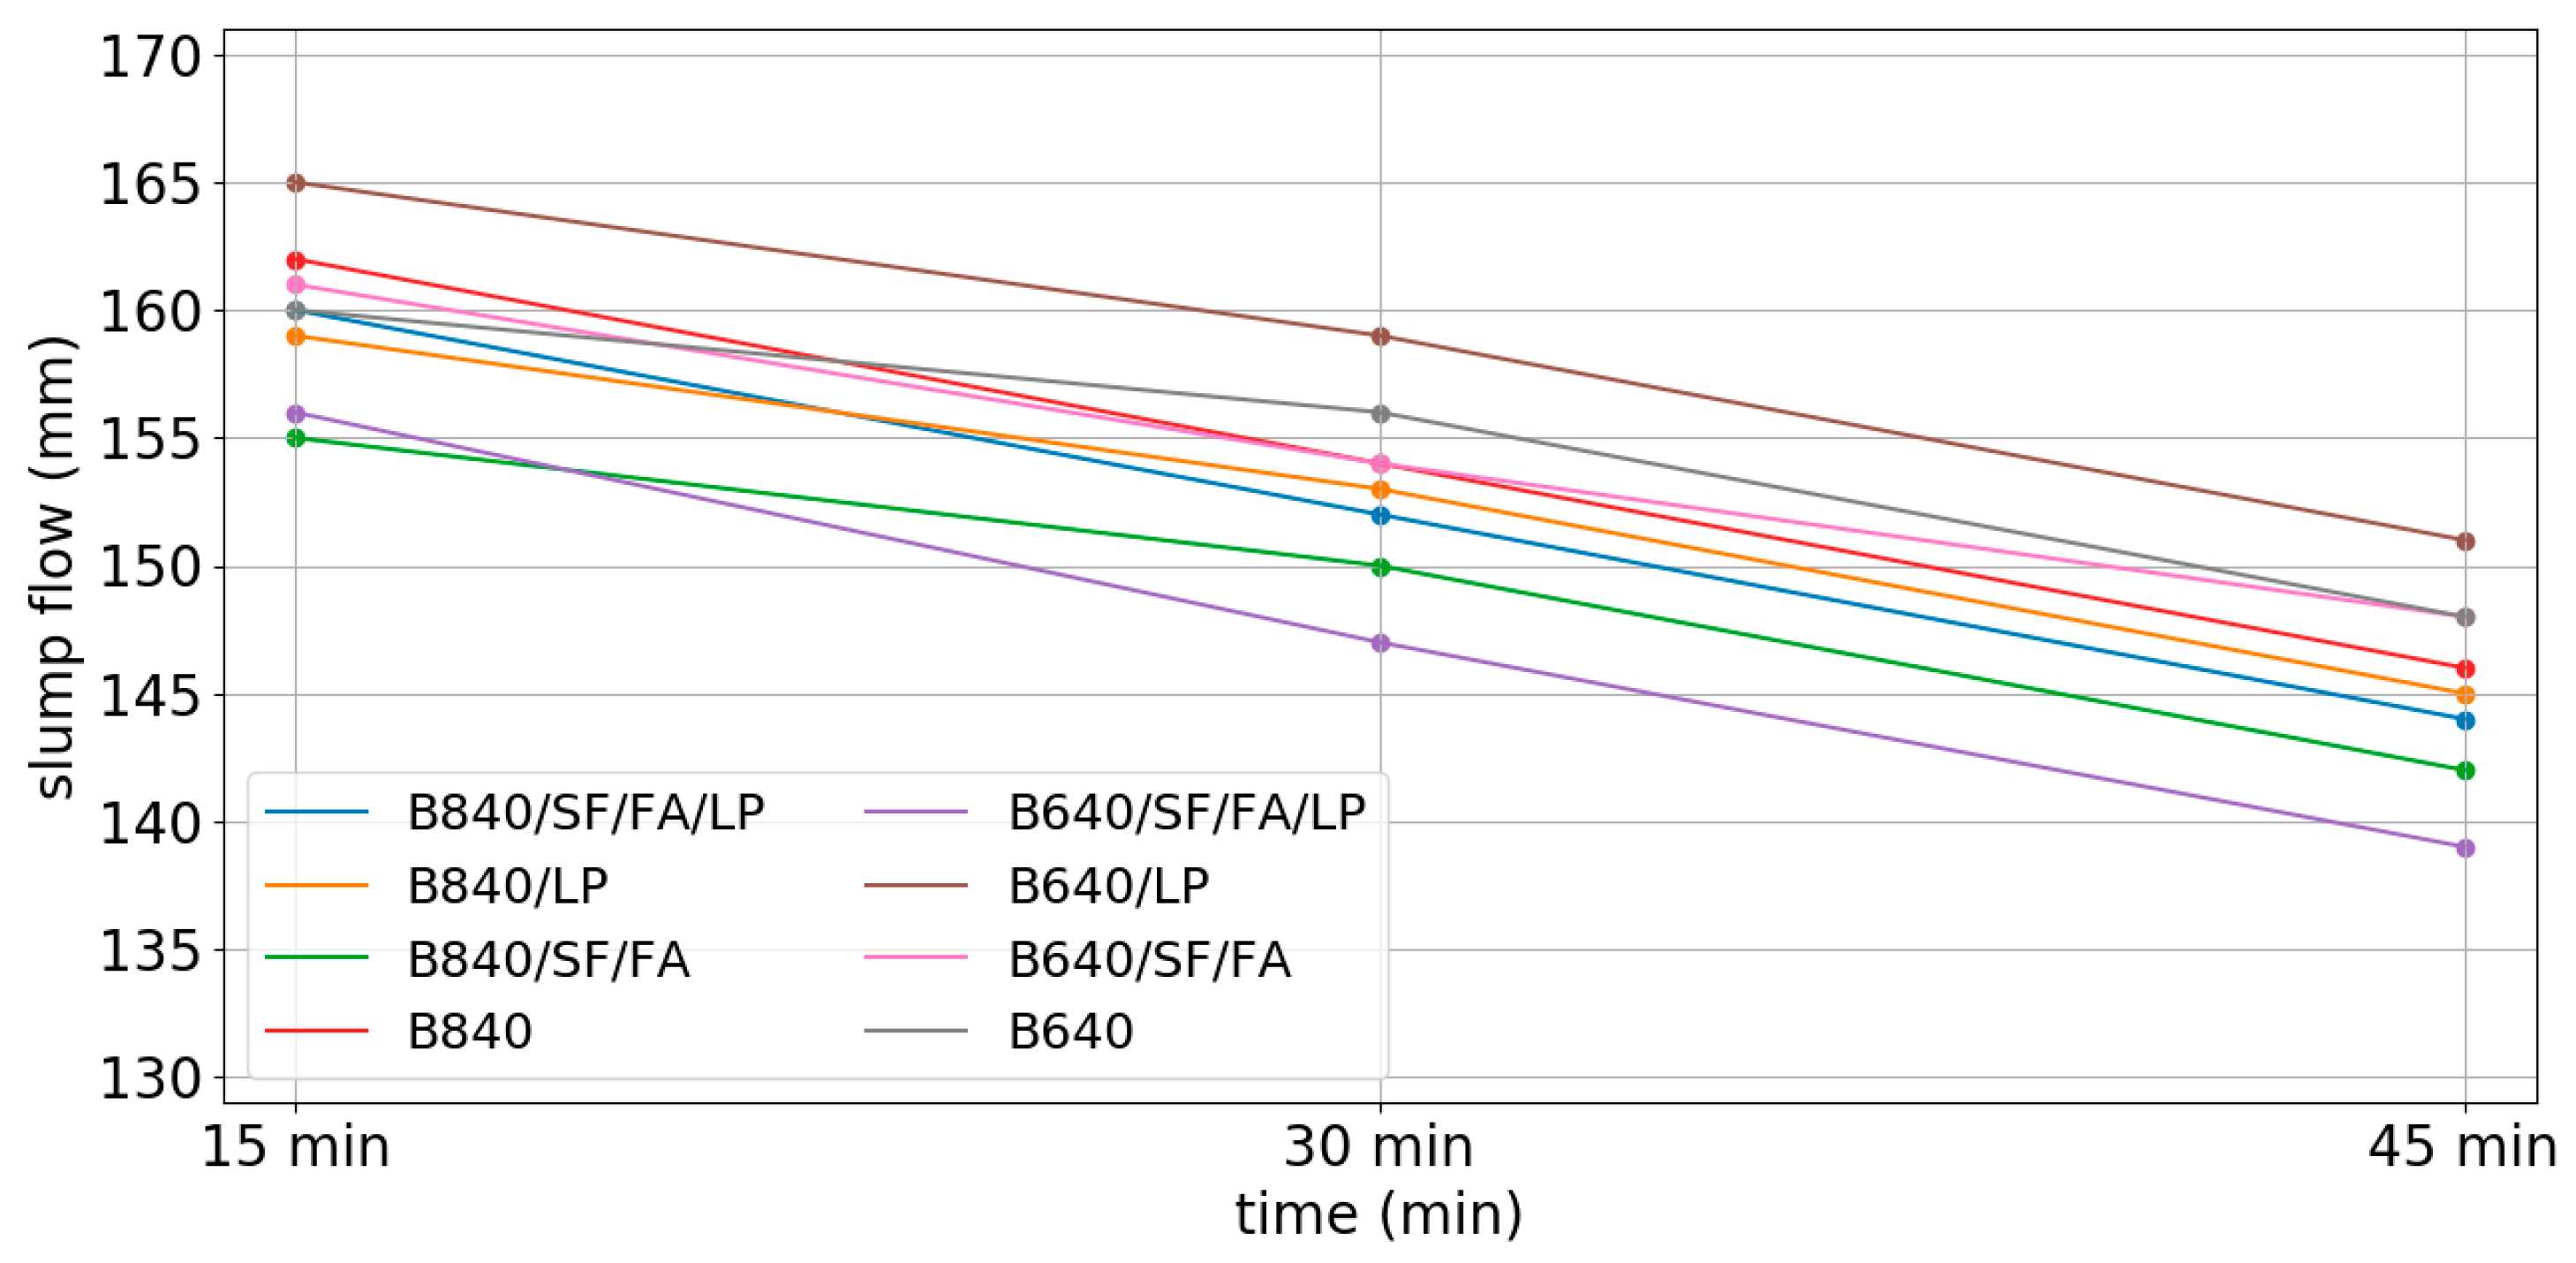
The initial adjustments for each mix were performed to determine the required amount of superplasticizer to reach the assumed slump flow of 160 ± 5 mm. Such value of the slump flow is recommended for 3D printing mixes and was established based on our own research [26,80] and other studies [45,81]. The slump flow in accordance with [82] was determined after 15, 30, and 45 min after adding the water. The results are presented in Figure 5. The results of the tests show a similar linear decrease of the slump flow (12–17 mm) in time.
3.2. Compressive Strength of Concrete
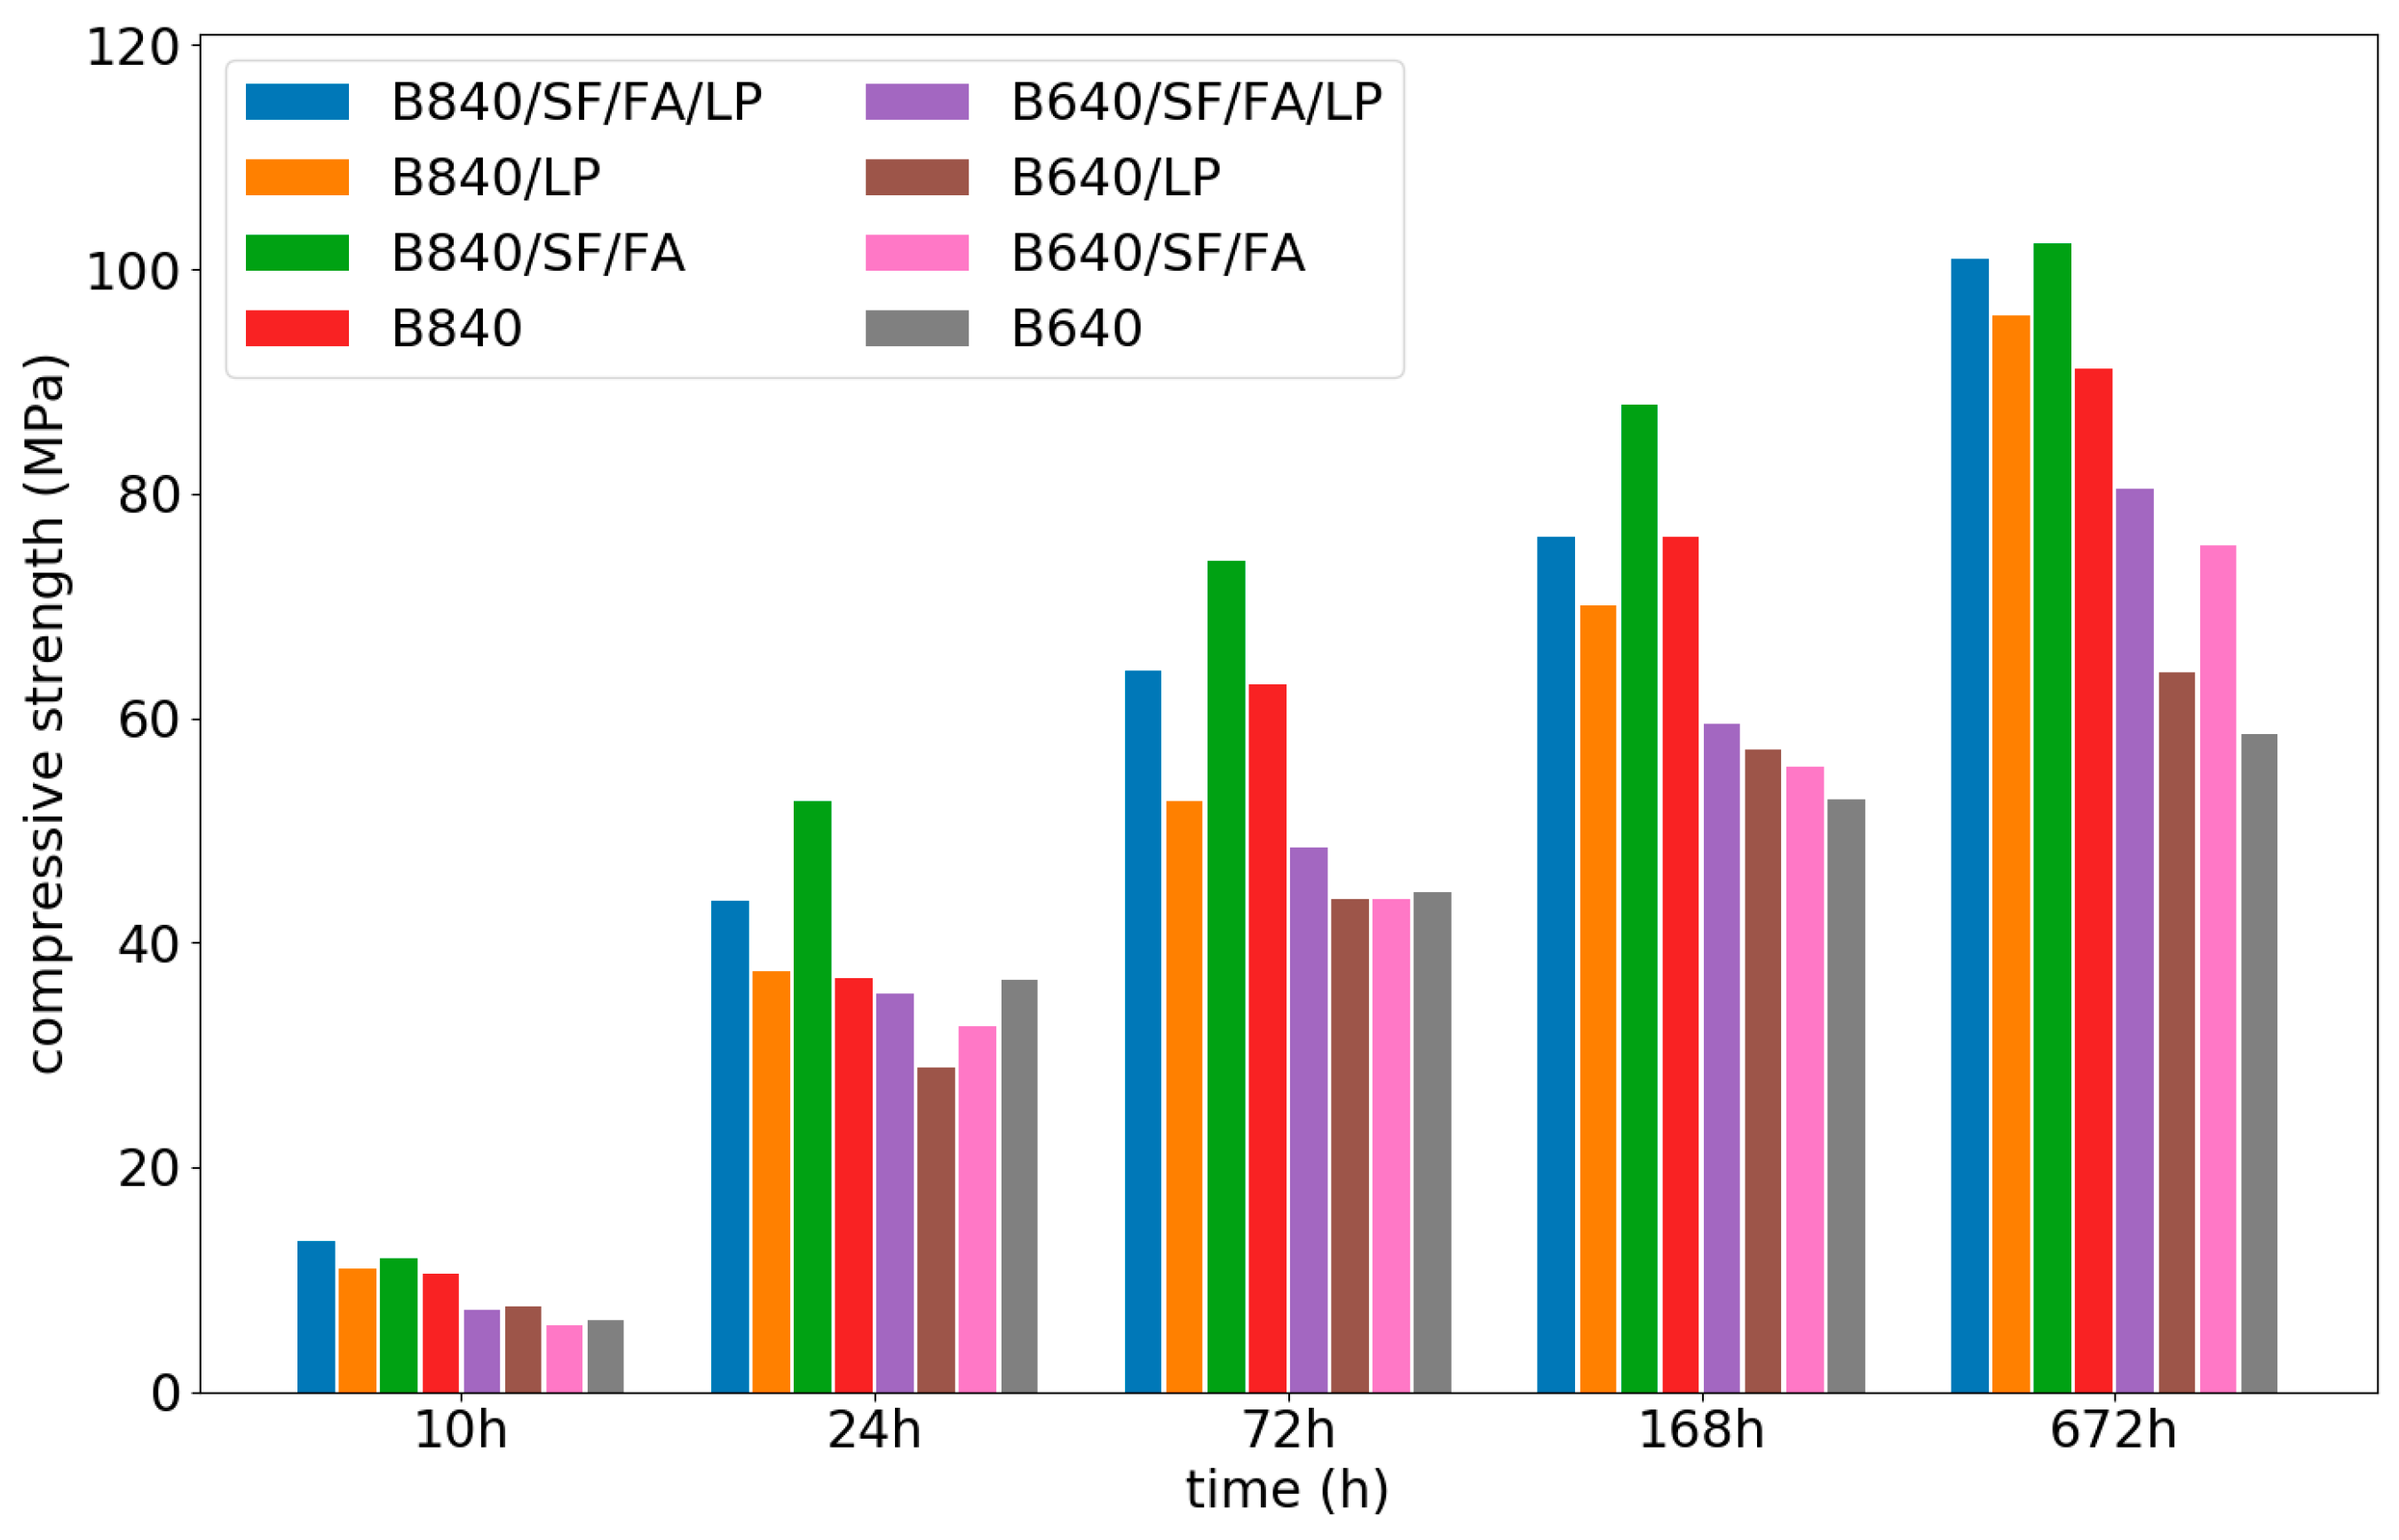
The compressive strength of concrete was determined after 10 h, 24 h (1 day), 72 h (3 days), 168 h (7 days), and 672 h (28 days) on cubic specimens 40 × 40 × 40 mm. The results are presented in Table 3 (mean value–fc,i,j, CoV–Coefficient of Variation) and in Figure 6 (only mean values). Highest compressive strength was obtained by the B840/SF/FA and B840/SF/FA/LP mixes, while the lowest by B640 and B640/LP. Results of compressive strength test after 28 days of curing in 20 °C has shown that the increase of total binder amount improves the mechanical properties of the composite. However, the results can be achieved not by increasing only the amount of cement, but all of the reactive mineral additives as well.
To evaluate the suitability of the mix for 3D printing strength evaluation coefficient for hardened concrete, was introduced (Equation (3)):
—compressive strength of mix for given time ;—mean compressive strength of all mixes.
Values for the analyses are given in Table 4. The coefficient indicates how close the value of the particular mixture is to the mean value in the study. For the values of the average strength of a given mixture (i) is greater than the average strength of all mixes.
3.3. Properties of Fresh Mix in the Printing Simulation Test (Squeezing Test)
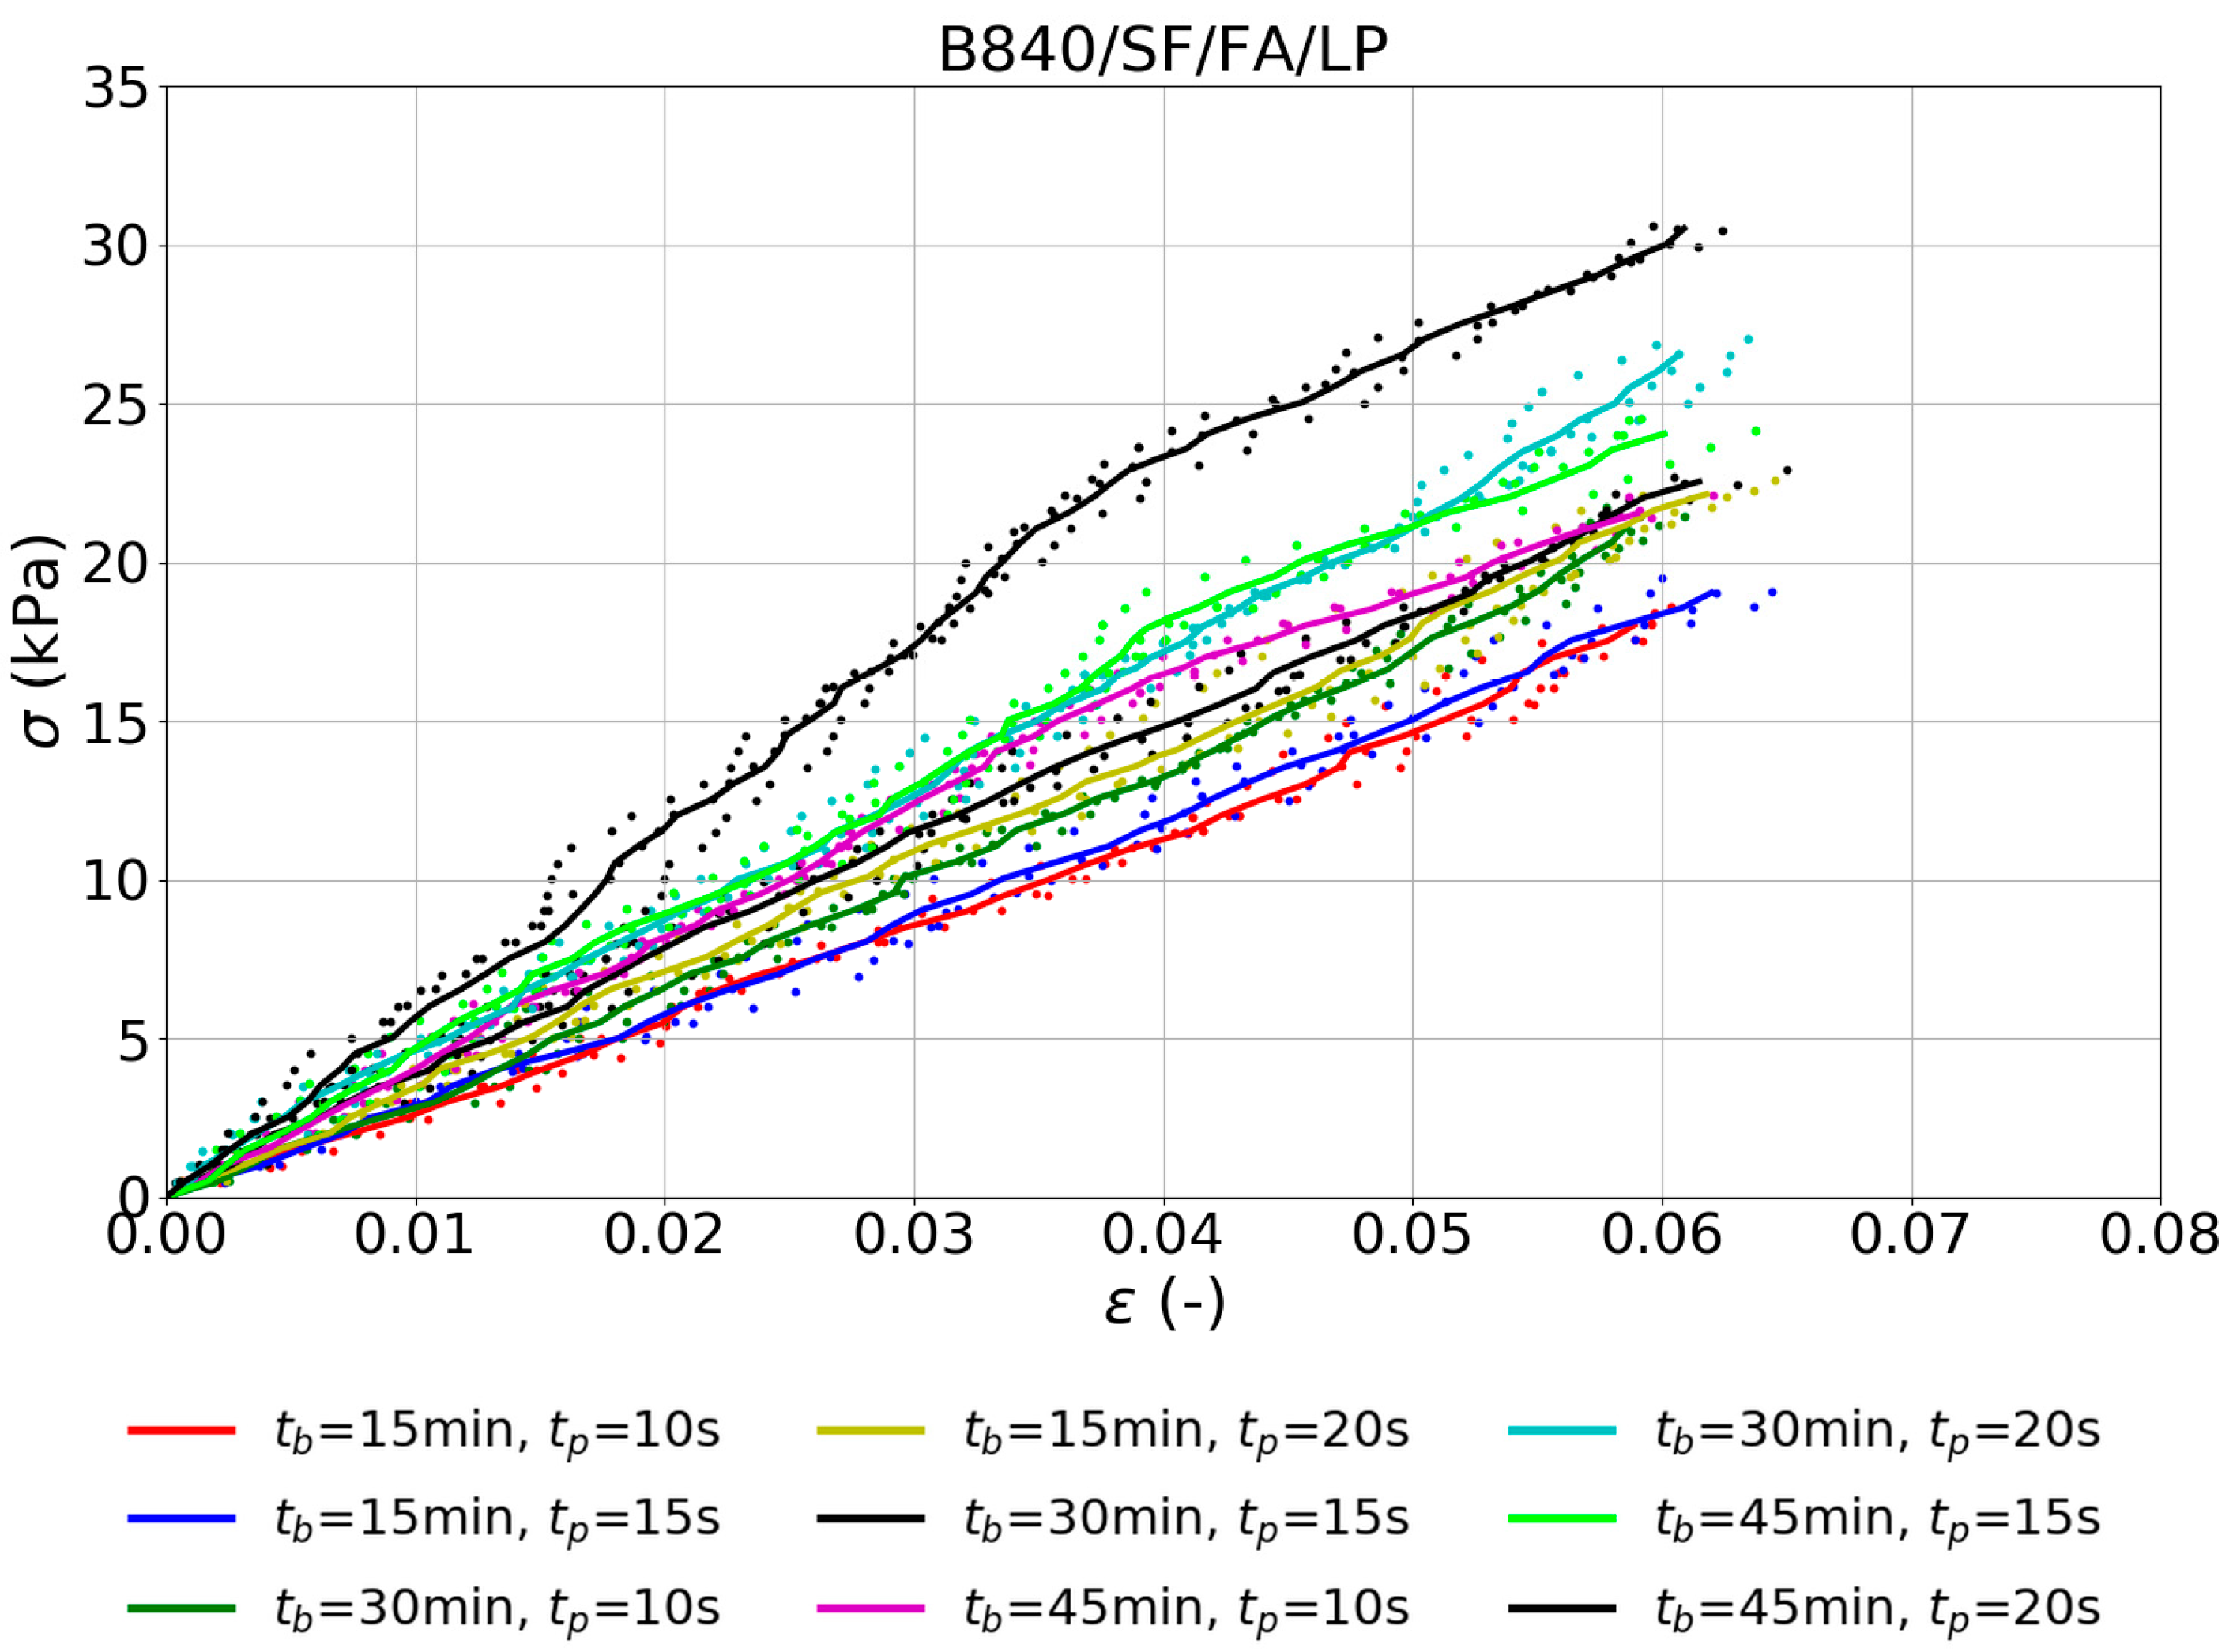
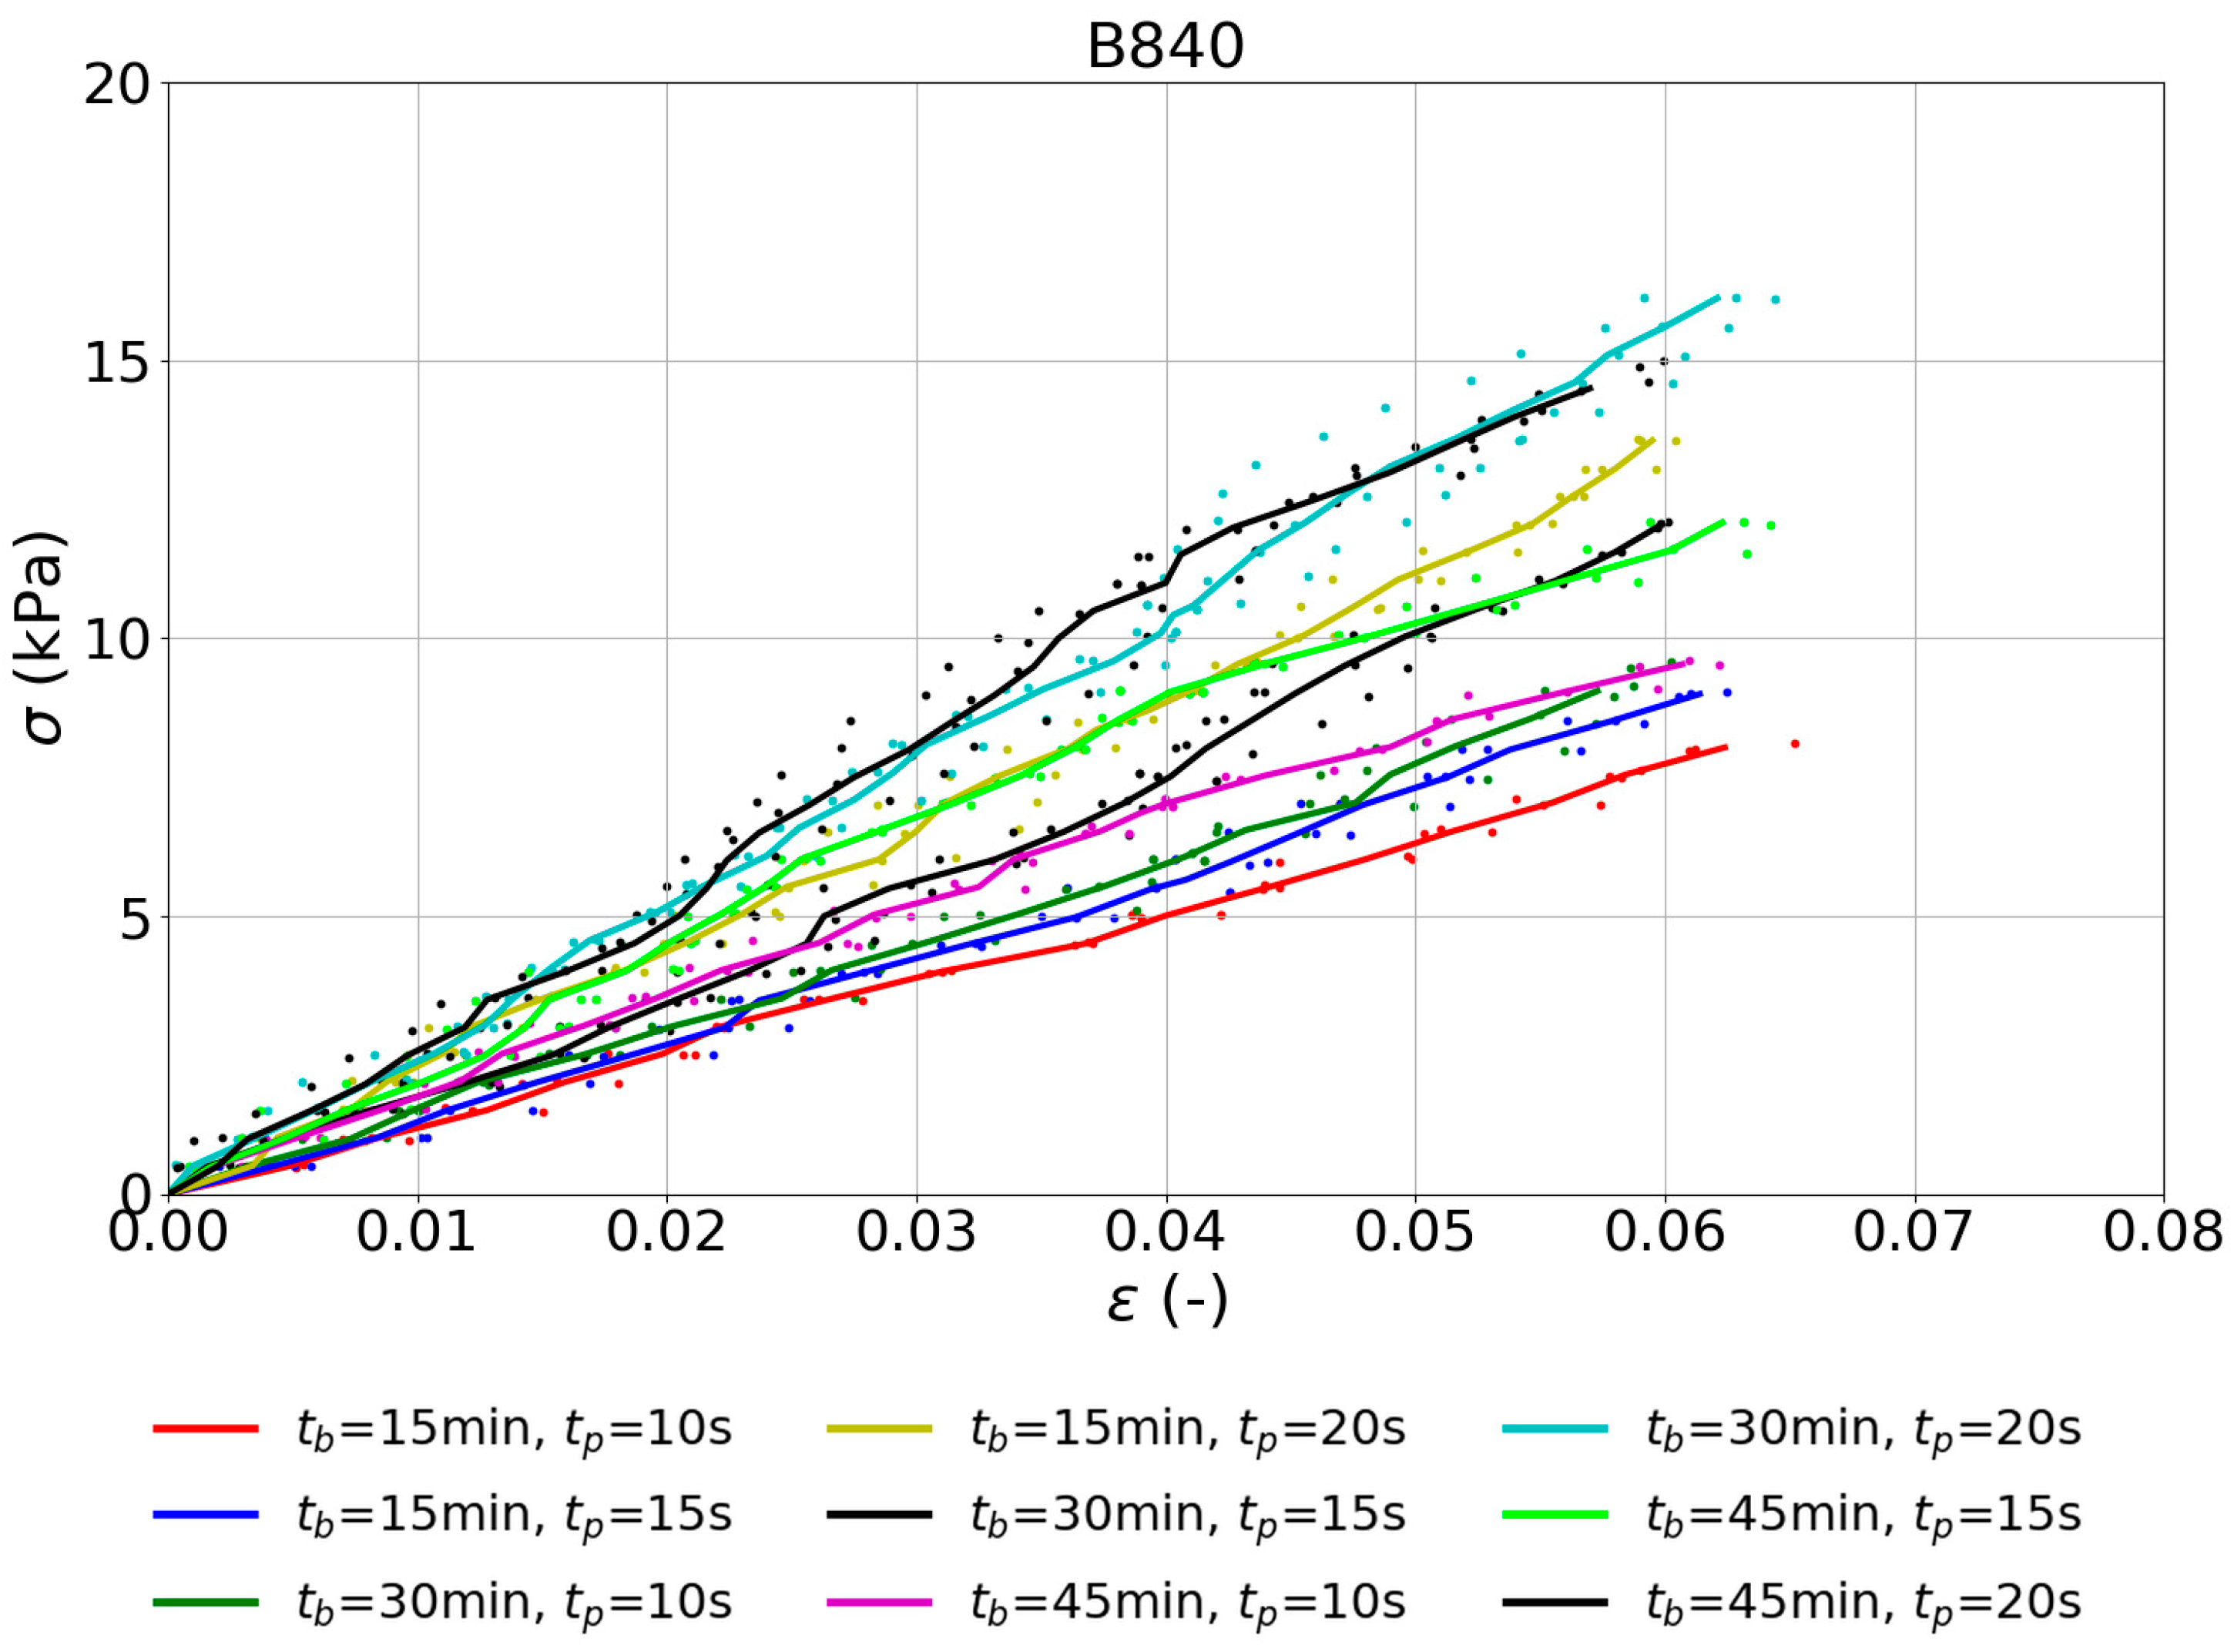
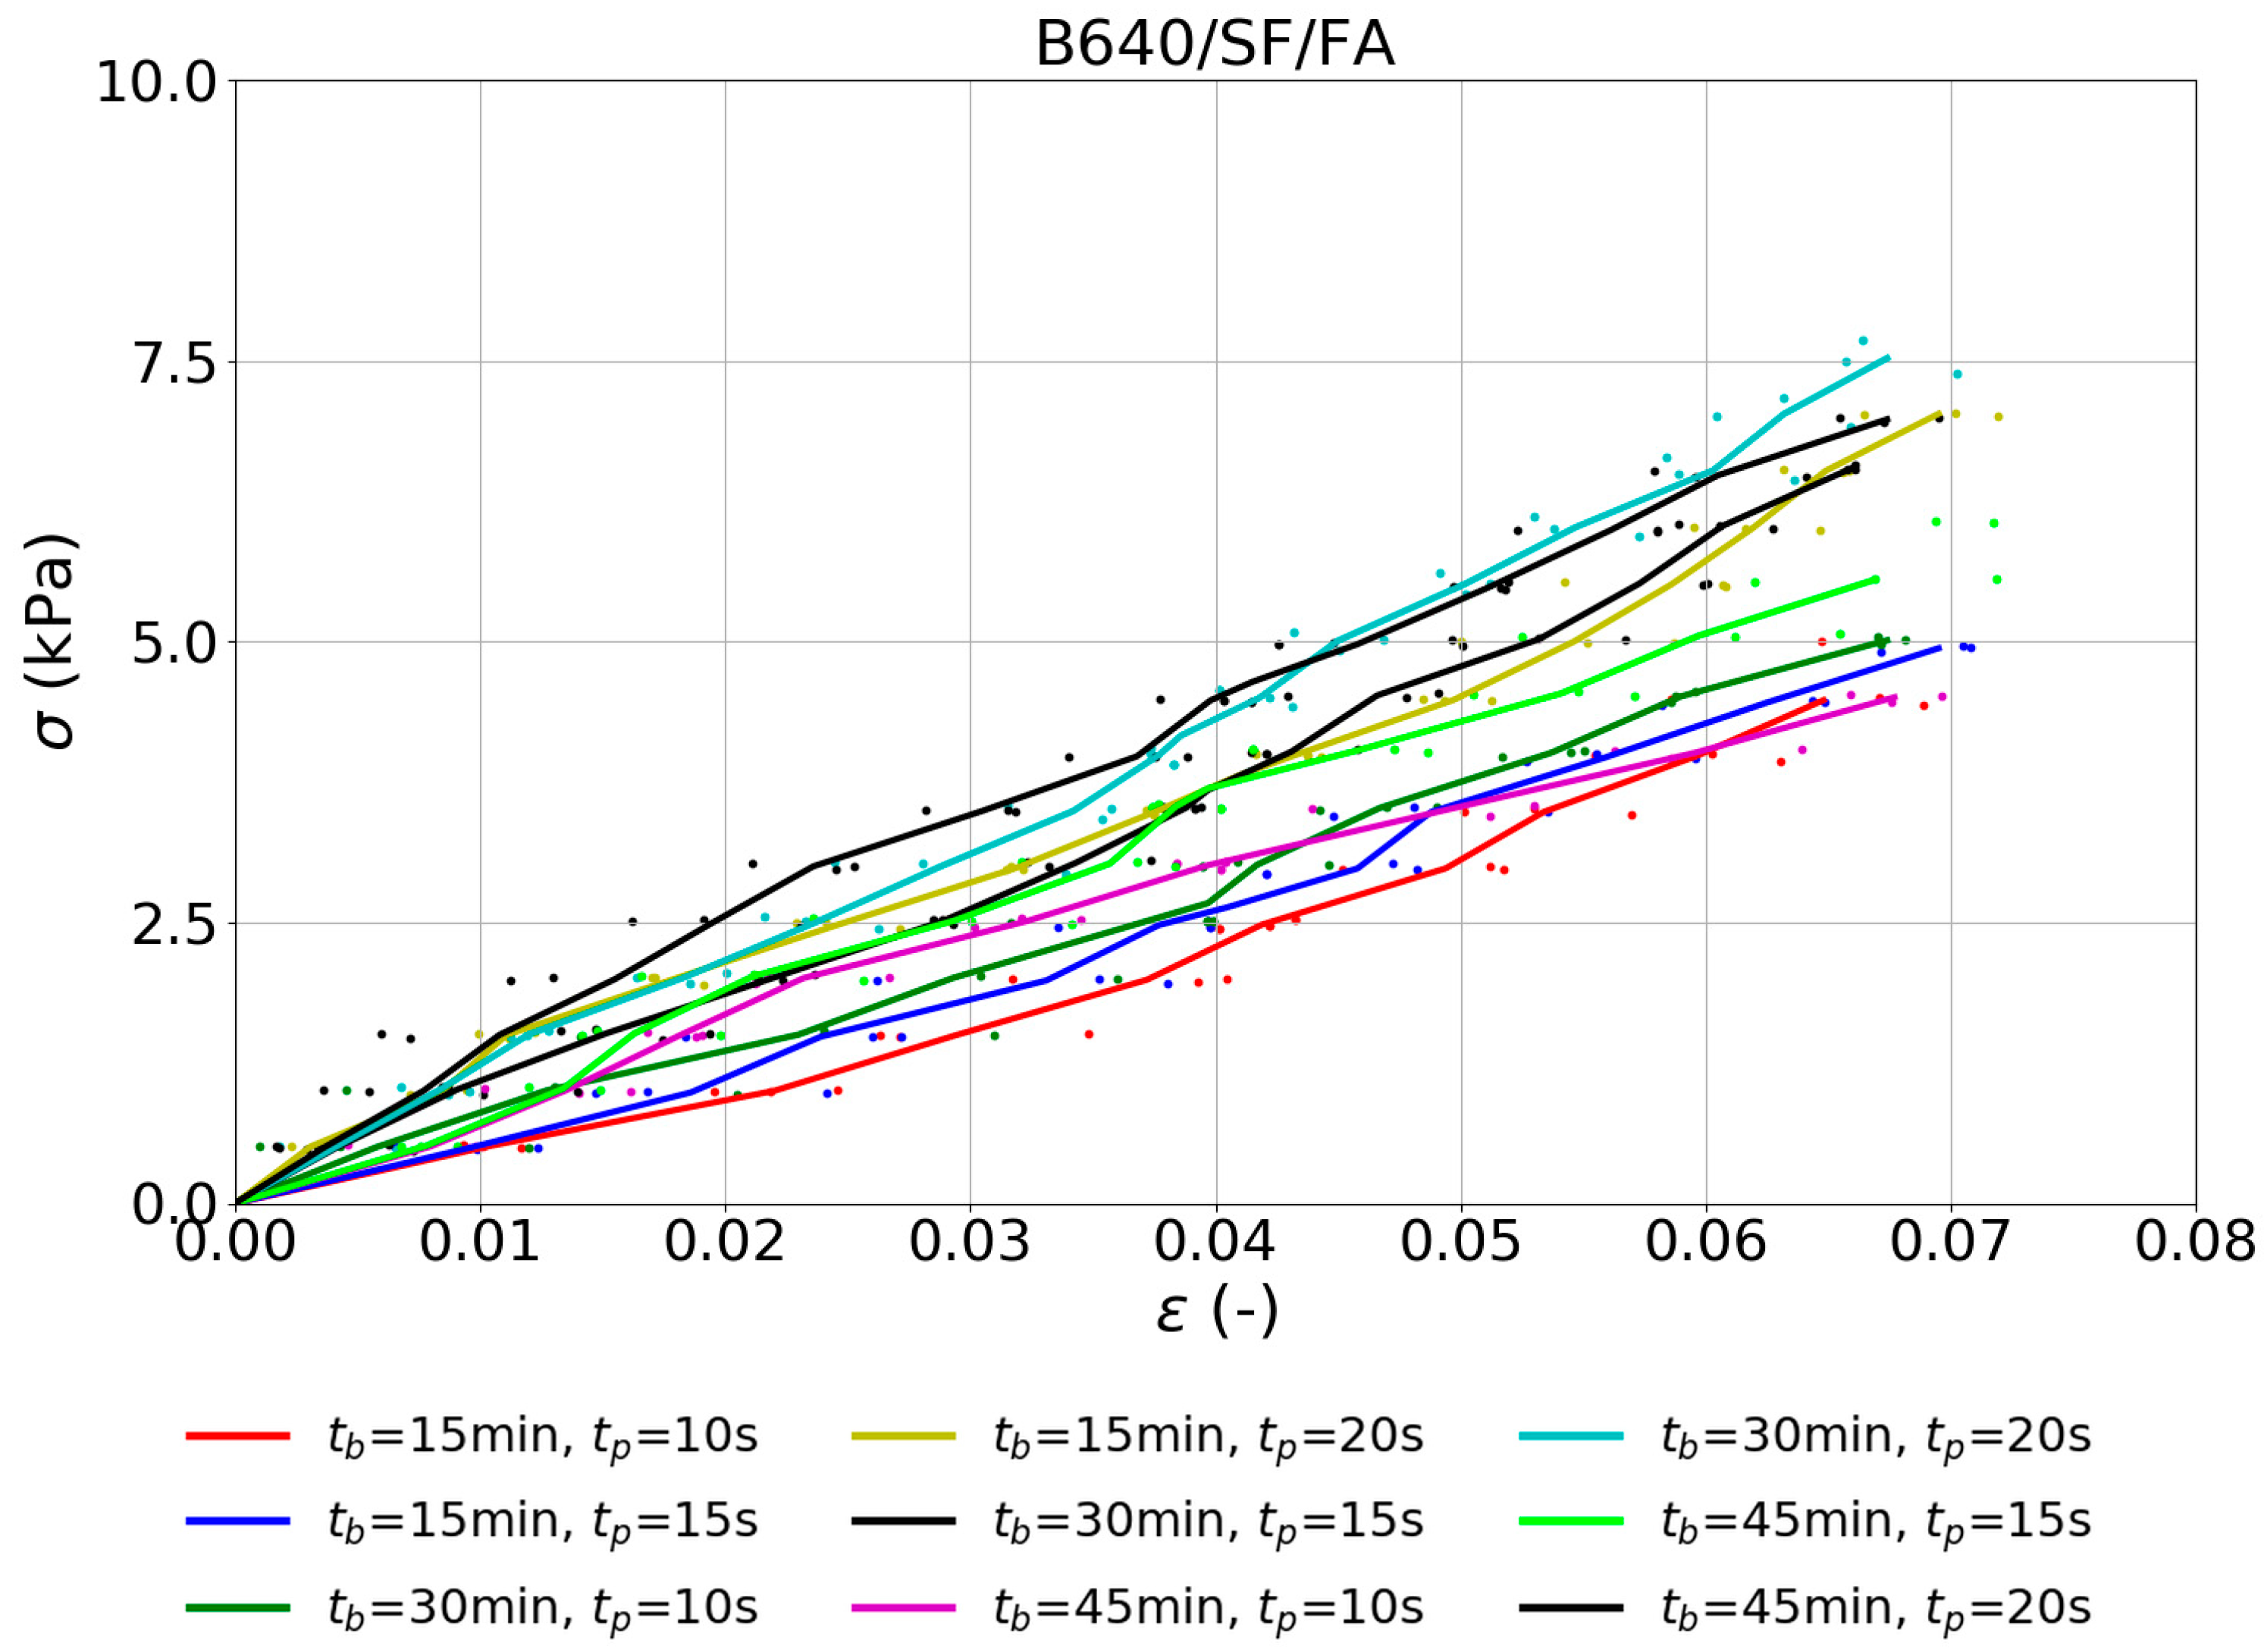
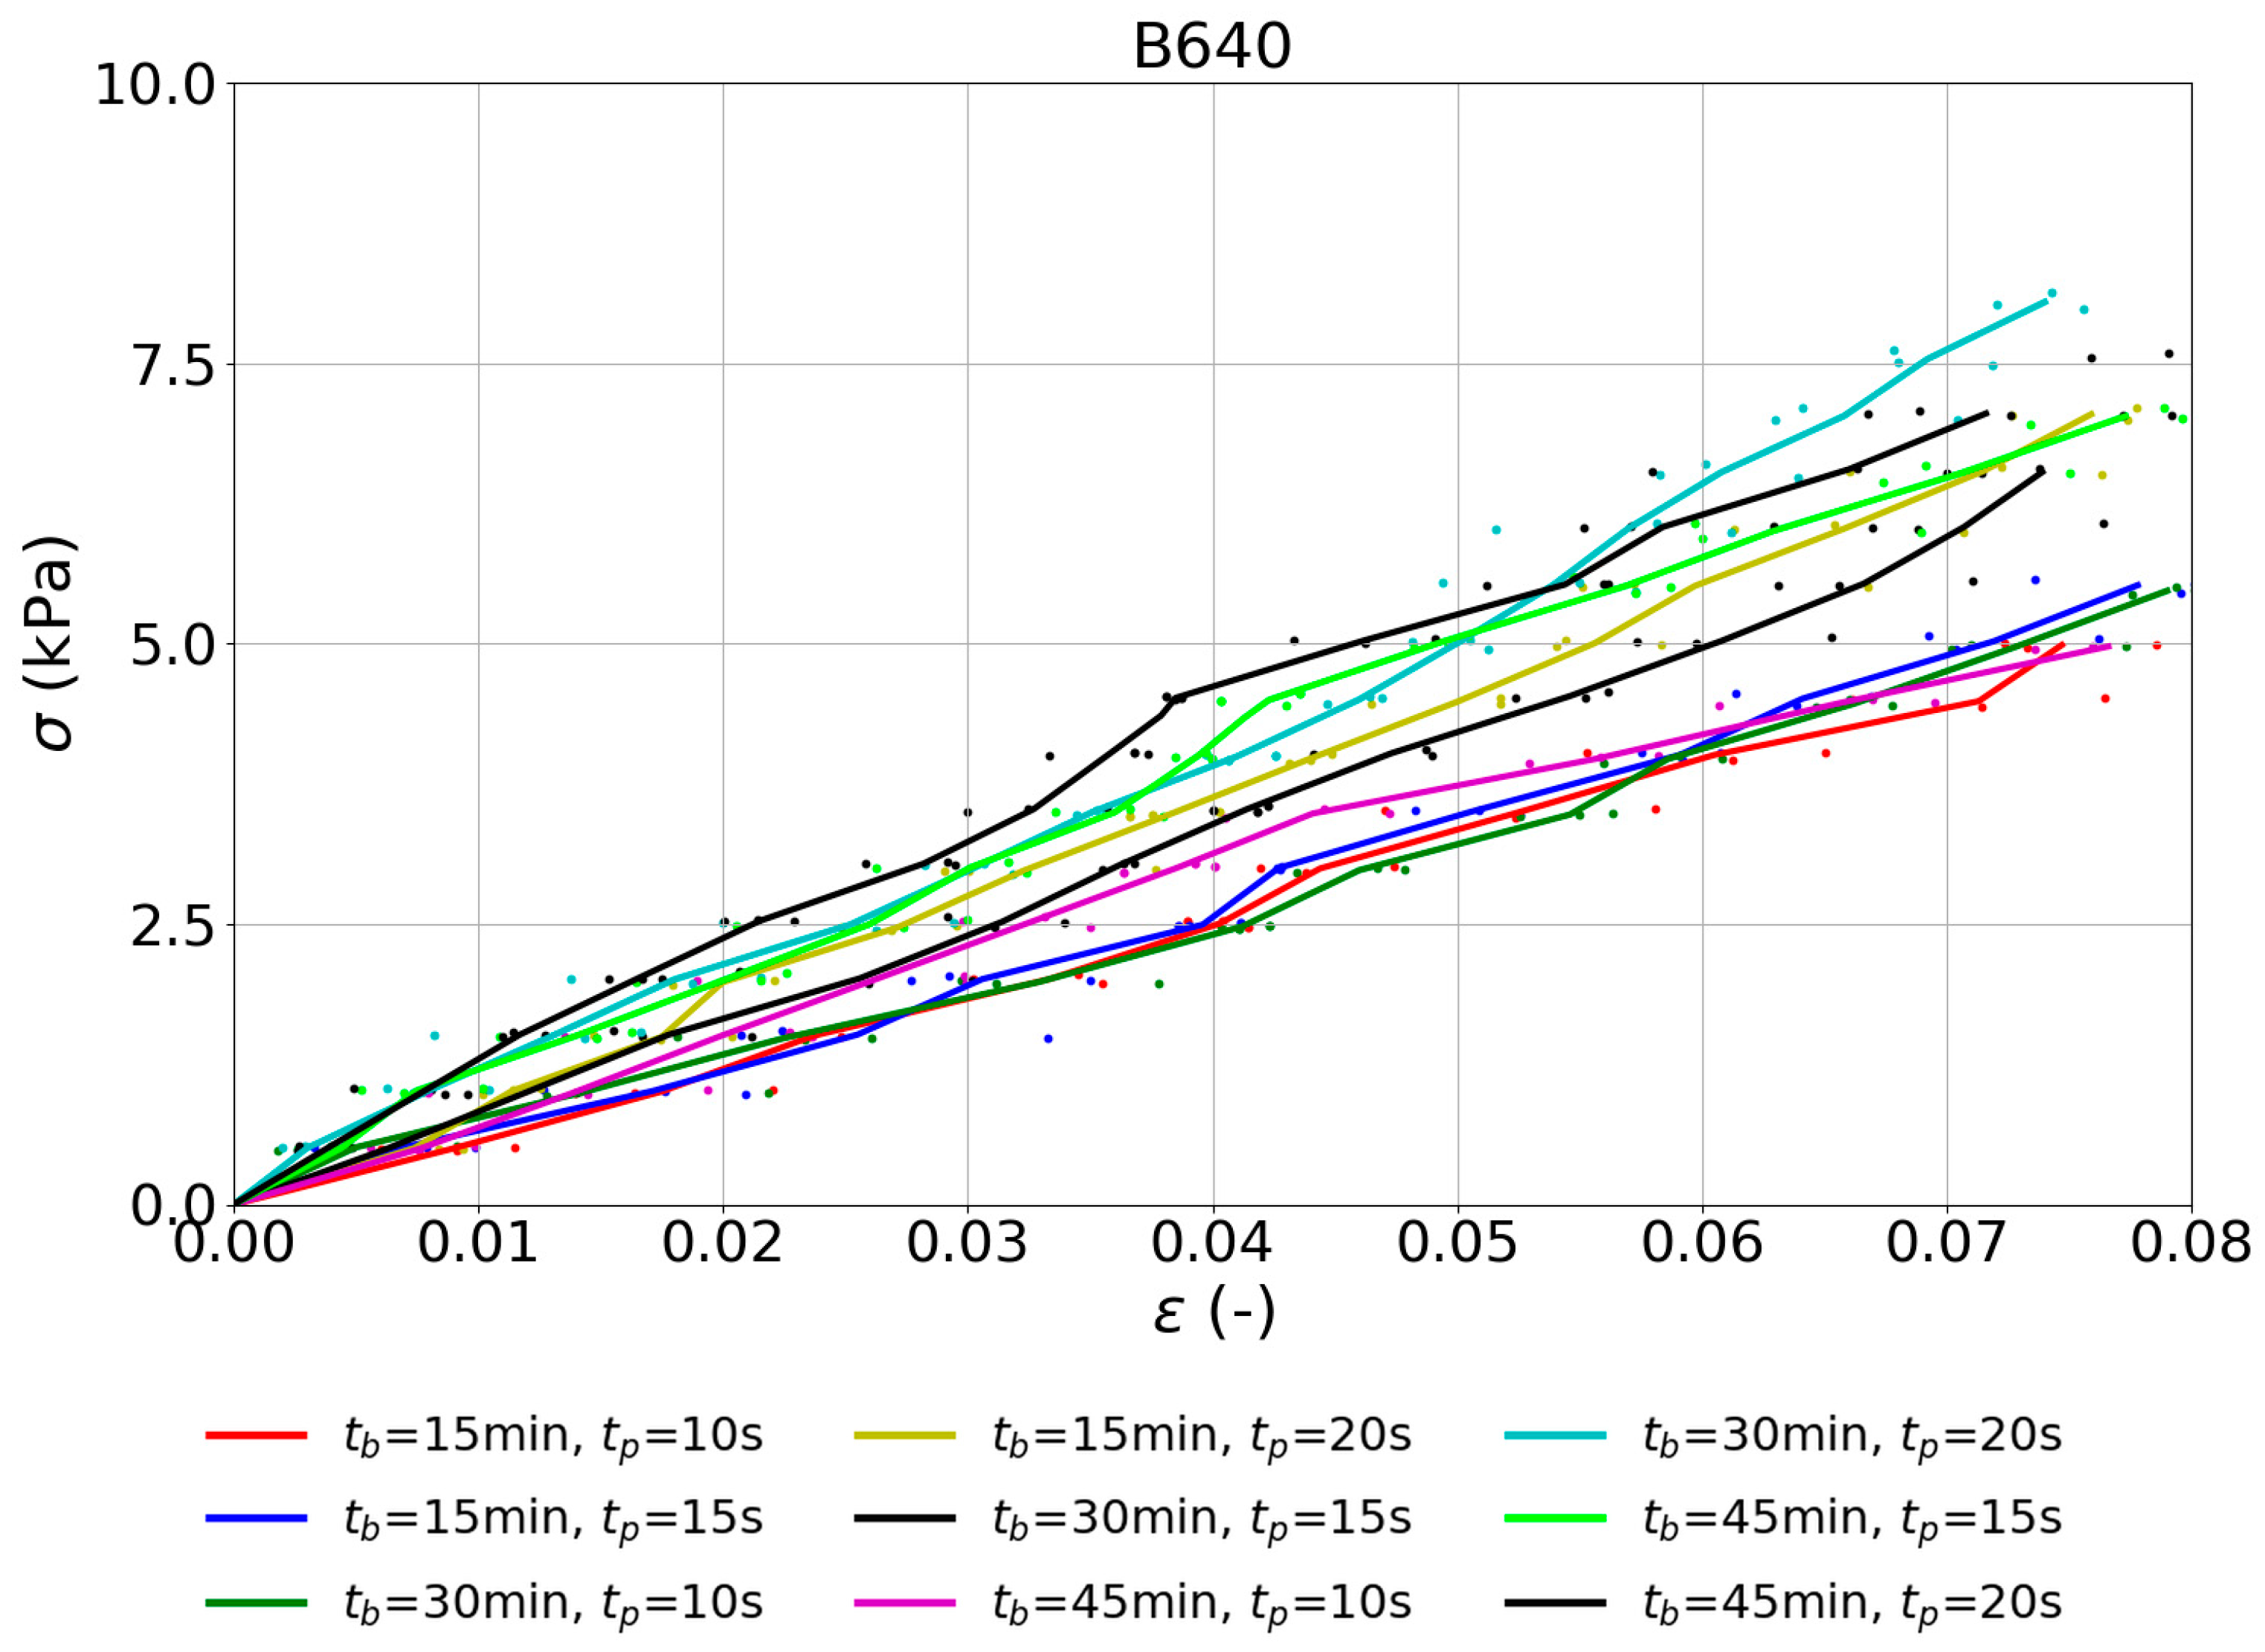
The test method for simulating the printing process was proposed in a study made by Perrot et al. [17]. Figure 7, Figure 8, Figure 9 and Figure 10 present the stress–strain relations for nine time points calculated from (time from water contact = 15 min; 30 min; 45 min) and (assumed cycle time between the subsequent layers ) for selected mixes.
Results are presented in Table 5.
In terms of the compressive strength of fresh concrete, mixes can be divided into three groups. The highest strength was exhibited by B840/SF/FA/LP and B840/LP mixes with a high amount of binder and modified with the limestone powder. The second group consists of B840/SF/FA, B840, B640/SF/FA/LP, and B640/LP mixes, with medium strength, and the highest for B840/SF/FA. The lowest strength was obtained by B640/SF/FA and B640. B640/SF/FA/LP and B640/LP mixes were modified with limestone powder. Despite a lower amount of binders, they exhibit similar strength to mixes with more binder without limestone powder (B840/SF/FA, B840).
In order to determine the compressive strength of fresh concrete at any given time during printing, an indicator for fresh concrete strength assessment , was introduced (Equation (4)):
—stress at strain 0.04 for mix and given time ; —average stress calculated for all time points and all mixes; —number of time points ().
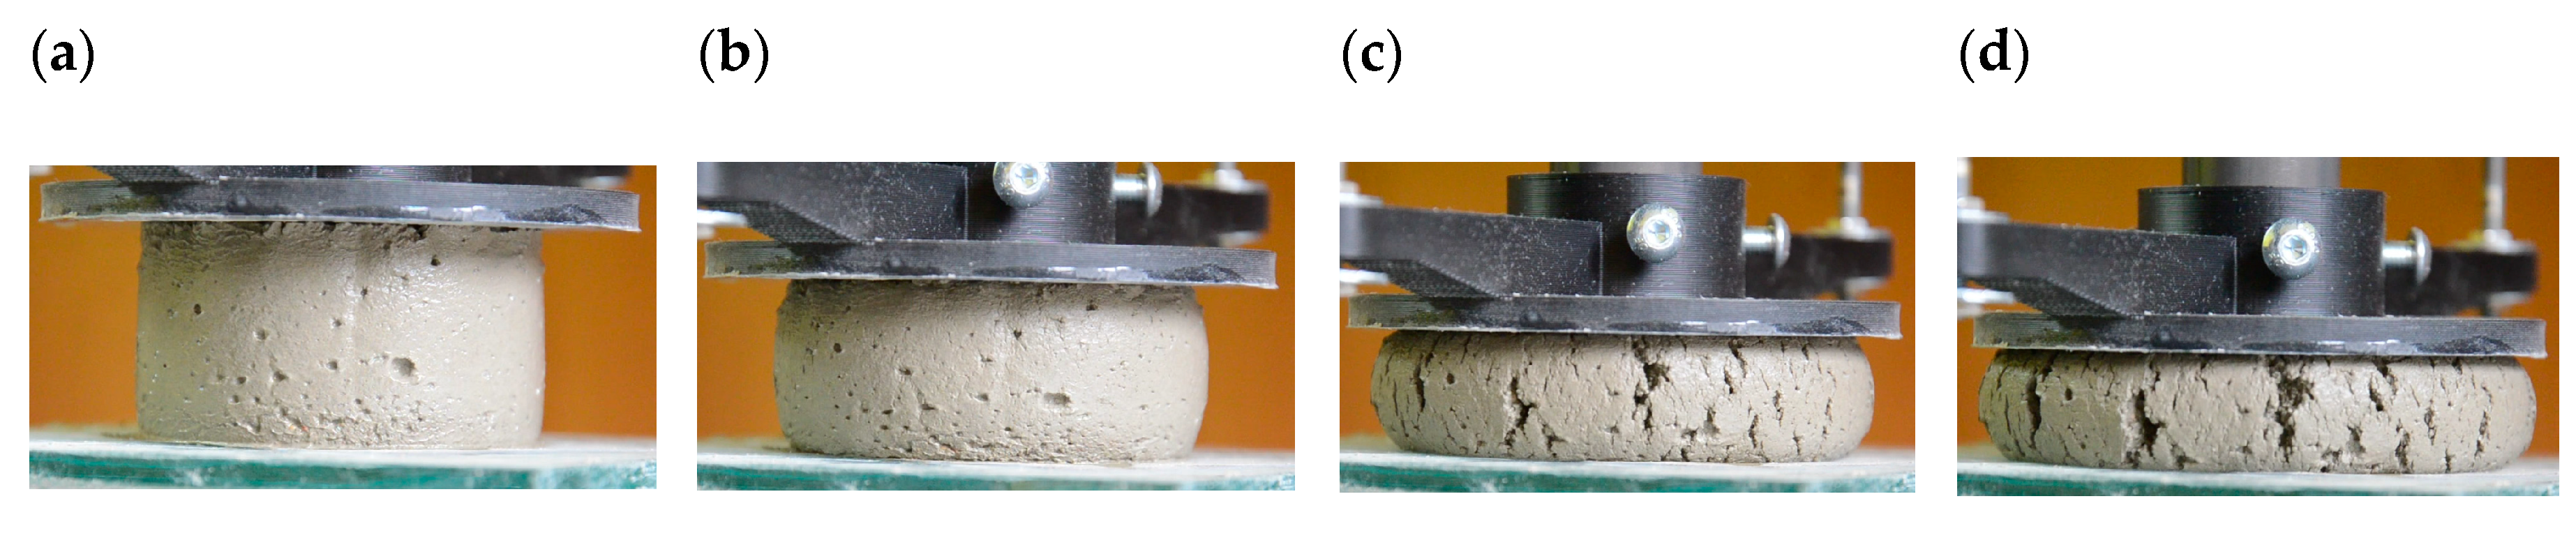
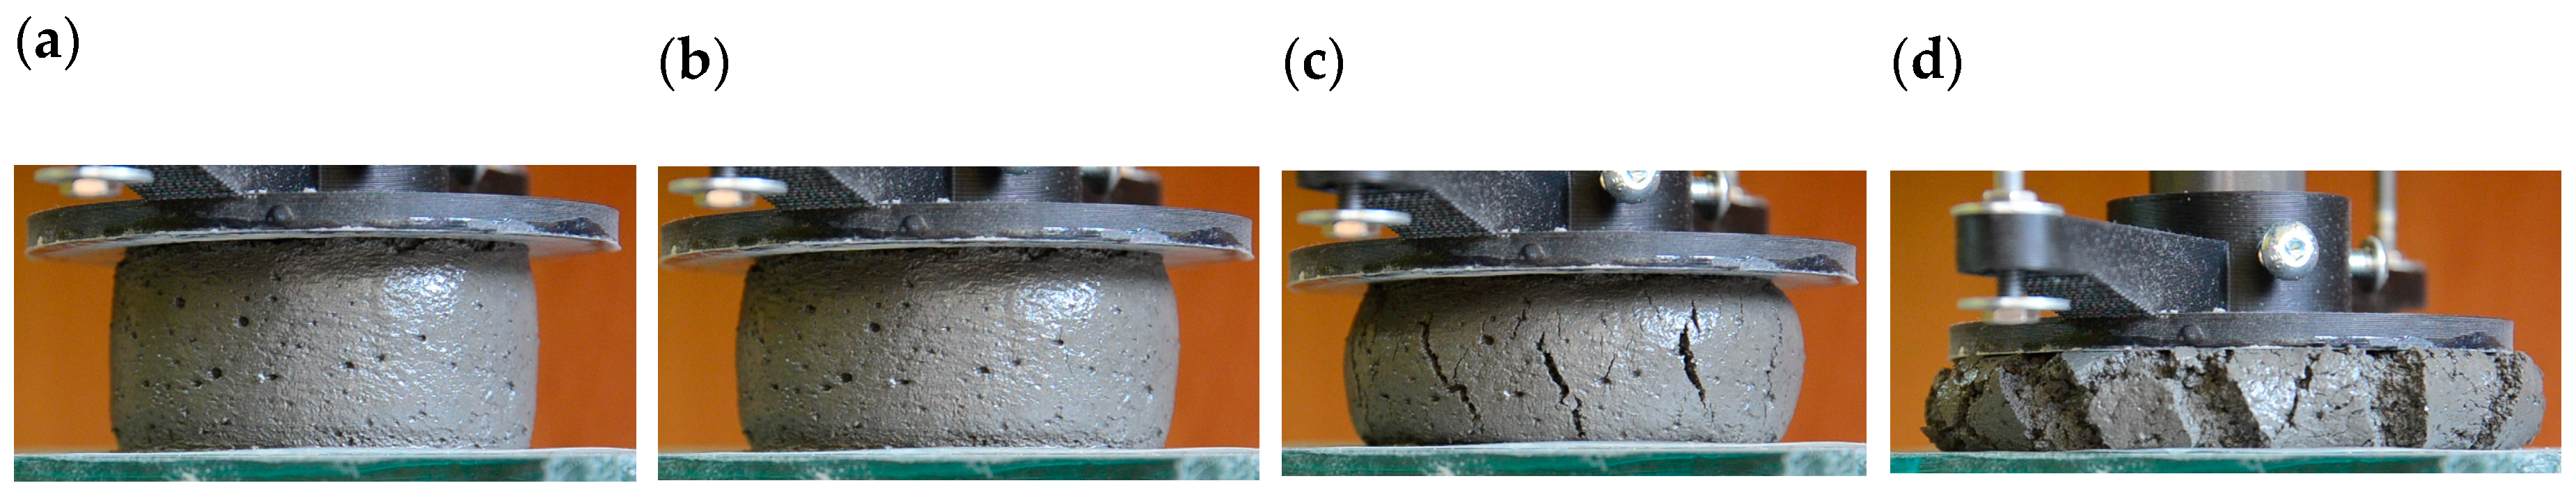
Strain equal to 0.04 was assumed as a limit value at which the safety of the structure is maintained. For higher values, the stiffness of the fresh concrete changes significantly (Figure 7, Figure 8, Figure 9 and Figure 10). A similar value and explanation of the assumptions can be found in [70]. Moreover, extensive deformation of the fresh concrete can exceed the strength of its internal forces causing yield and nullification of its bearing capacity [83]. The results were compared depending on the cycle time () and the test time (). Stress level at strain (ϵ) equal to 0.04 was introduced as the basic value for further comparative analyses. Figure 11 and Figure 12 show the behavior of different samples during the test. In the first stage of load increment, the stresses increase linearly. During the test, the specimen exhibits insignificant deformations, which are presented in Figure 11a and Figure 12a. When a certain stress level is reached, the deformations start to increase faster than the load. At this point, the side surfaces of the specimen may bulge, as shown in Figure 11b and Figure 12b. At a certain point, the specimen exhibit fails as shown in Figure 11c,d and Figure 12c,d.
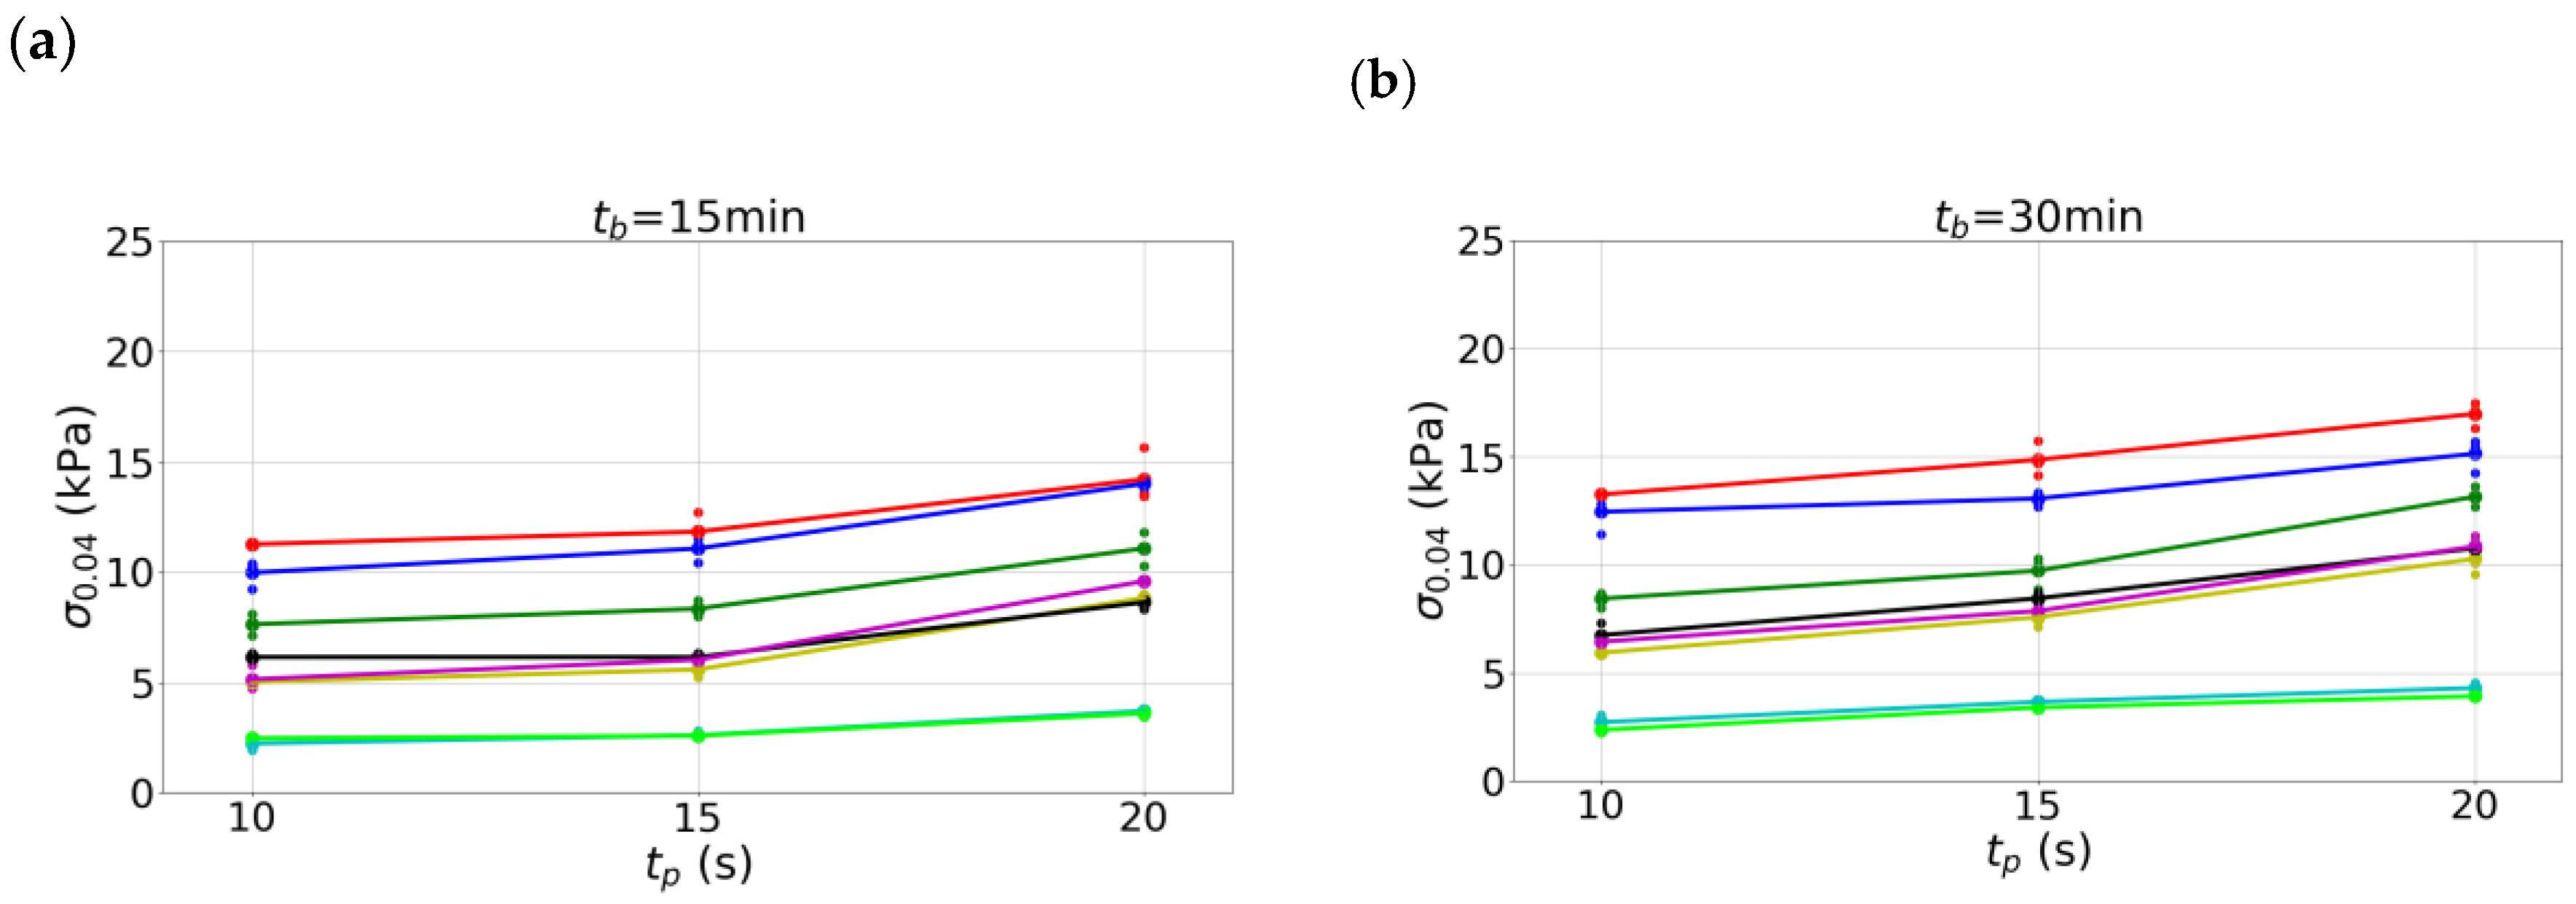
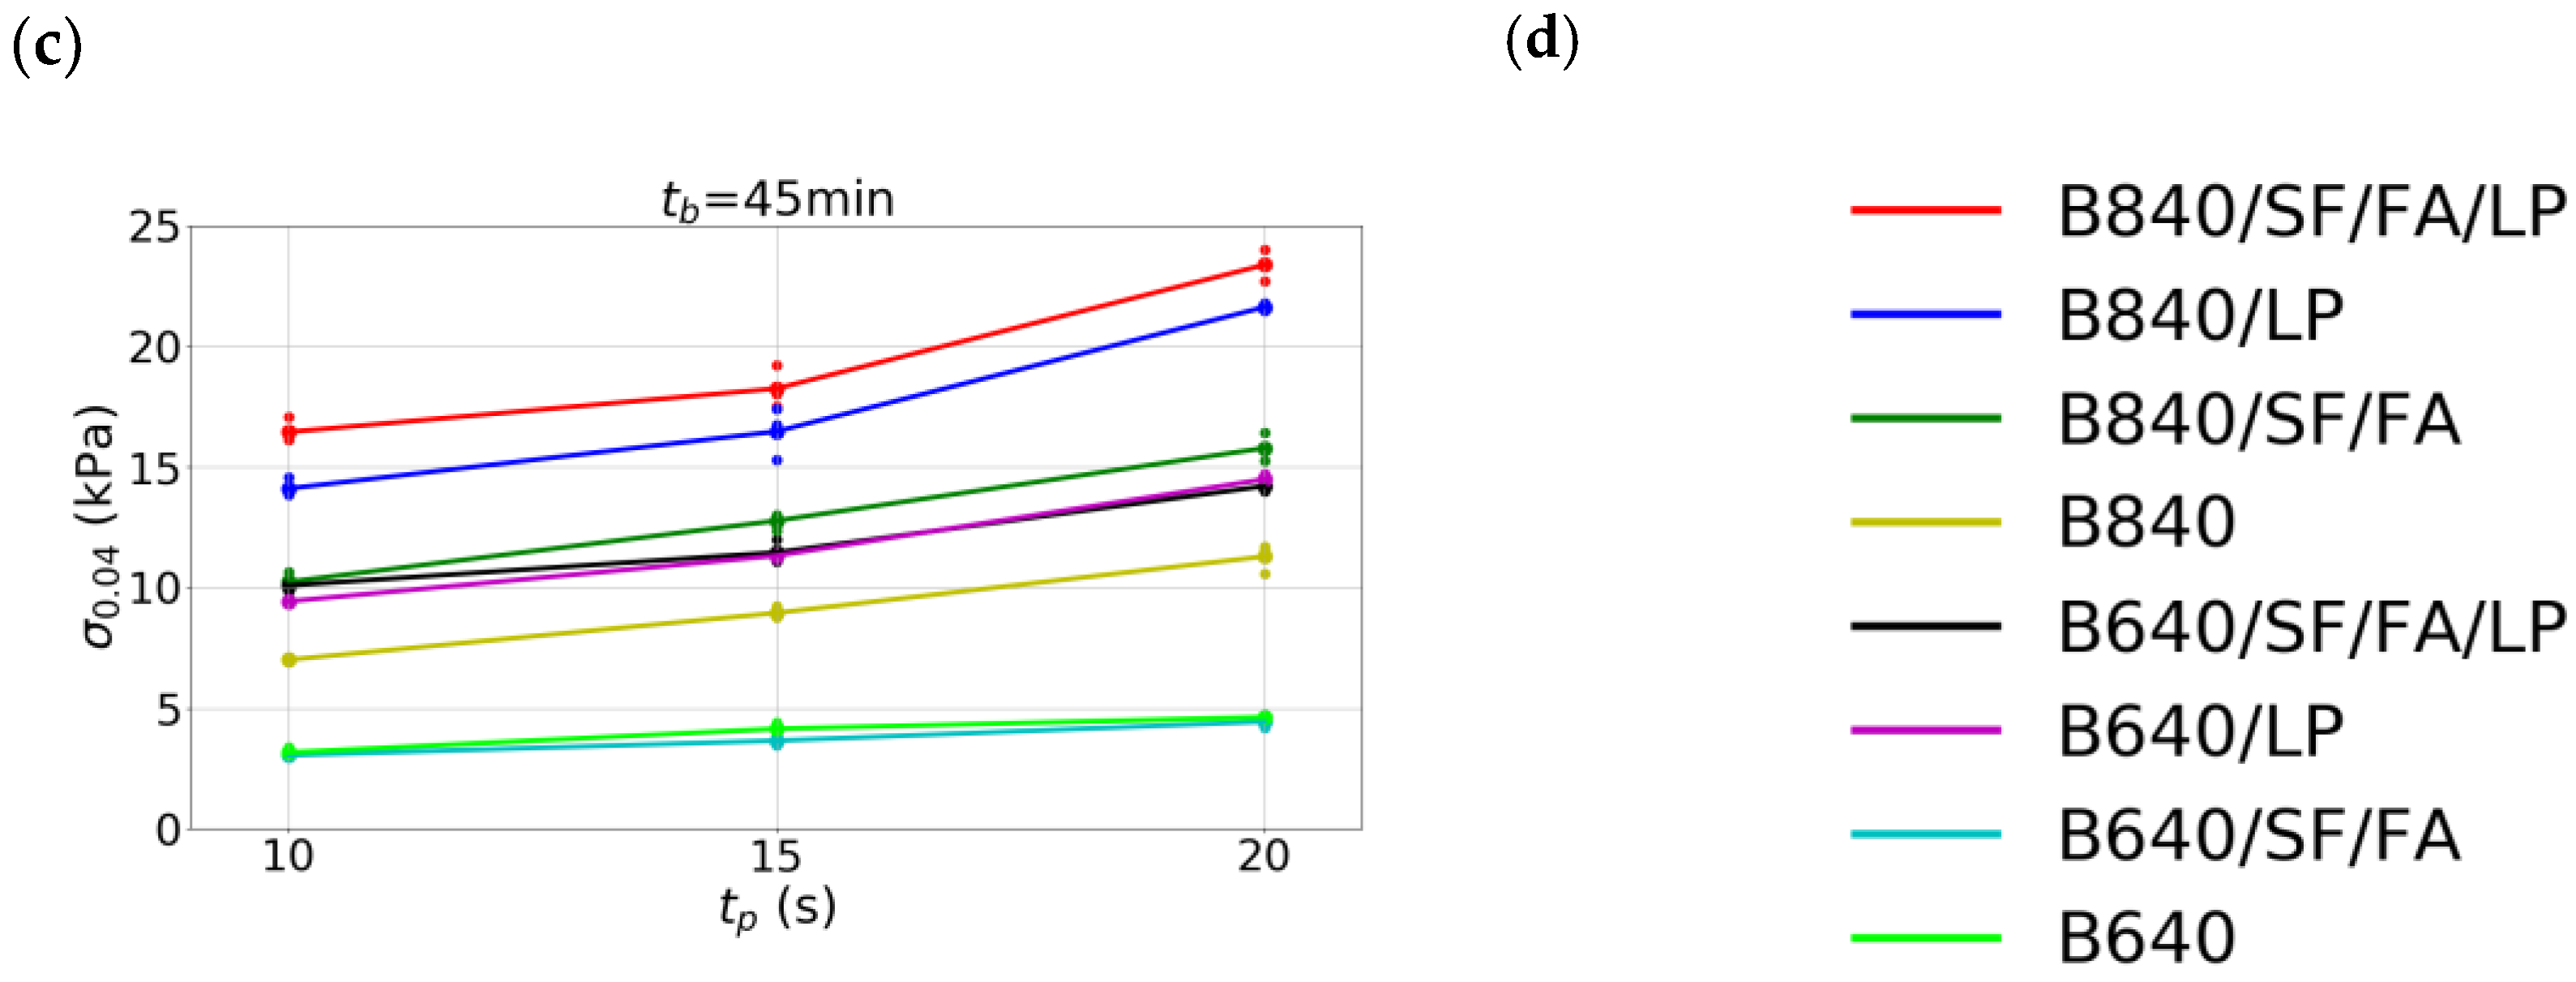
Figure 13 presents the changes in the stress levels at 0.04 strain () in different samples at given test time and cycle time .
The results for mixes with the same amount of binder show that there show that there is no correlation between the amount of cement and mineral additives and compressive strength of the mix (). An exemption was found for mixes with 840 kg/m3 of binder where the compressive strength increases with the increase of the amount of reactive additives. In every case, the addition of limestone powder improved the strength of the mixes. The reason for this lies in a smaller surface grain size of limestone powder, resulting in a better compaction of the matrix. Similar results were found in other studies [17,29,38,84,85,86,87]. In theory, a higher amount of binder should translate to higher rigidity and strength of the mix, which was not observed in most of the studied mixes. For example, the CI/SP840 mix with a higher amount of binder has lower compressive strength than CI/SP640/SF/FA/LP and CI/SP640/LP which have lower amounts of binder.
From all given printing times , for the highest time = 45 min, the increase of compressive strength development between cycle times was the highest. It can thus be stated that, for longer printing time (higher ) and increased cycle time , the load-bearing capacity is increasing.
A similar increase in the load-bearing capacity was observed for low-binder mixes modified with limestone powder (CI/SP640/LP, CI/SP640/SF/FA/LP) and high-binder mixes. For mixes modified with limestone powder, the compressive strength increases exponentially with the increase of cycle time tp. The increase in compressive strength was significantly higher between cycle time = 15 s and = 20 s than between = 10 s and = 15 s.
In the majority of the mixes, the increase of compressive strength between two lowest cycle times is linear regardless of printing time tb. The results seem logical, as lower cycle time (time between subsequent layer) does not allow the mix to achieve certain parameters. Load from additional layers slightly influences the structure of the mix due to vibration, resulting in a delayed increase of load-bearing capacity. Theoretically, it imposes shear stresses into the mix, which impact the bond between the components [83]. In case of = 20 s, it was noticed that, for mixes modified with limestone powder, both with low and high binder content, the increase in compressive strength between the printing times tb is exponential. Results have shown that the addition of the limestone powder improves the compressive strength, especially for longer cycle times .
3.4. Evaluation of Load-Bearing Capacity during the Printing Process
To verify the properties of the mixes, three out of eight mixes were chosen for final printing. Each mix was taken from one of the three strength groups. The chosen ones were B840/SF/FA/LP from the highest strength group, B640/SF/FA/LP from the medium strength group, and B640/SF/FA from the lowest strength group. Each mix was used to print three columns (D = 160 mm) up until the collapse. The time from water contact and cycle time were recorded. Each mix was printed three times at different time points as seen below:
- (1)
- ; ;
- (2)
- ; ;
- (3)
- ;
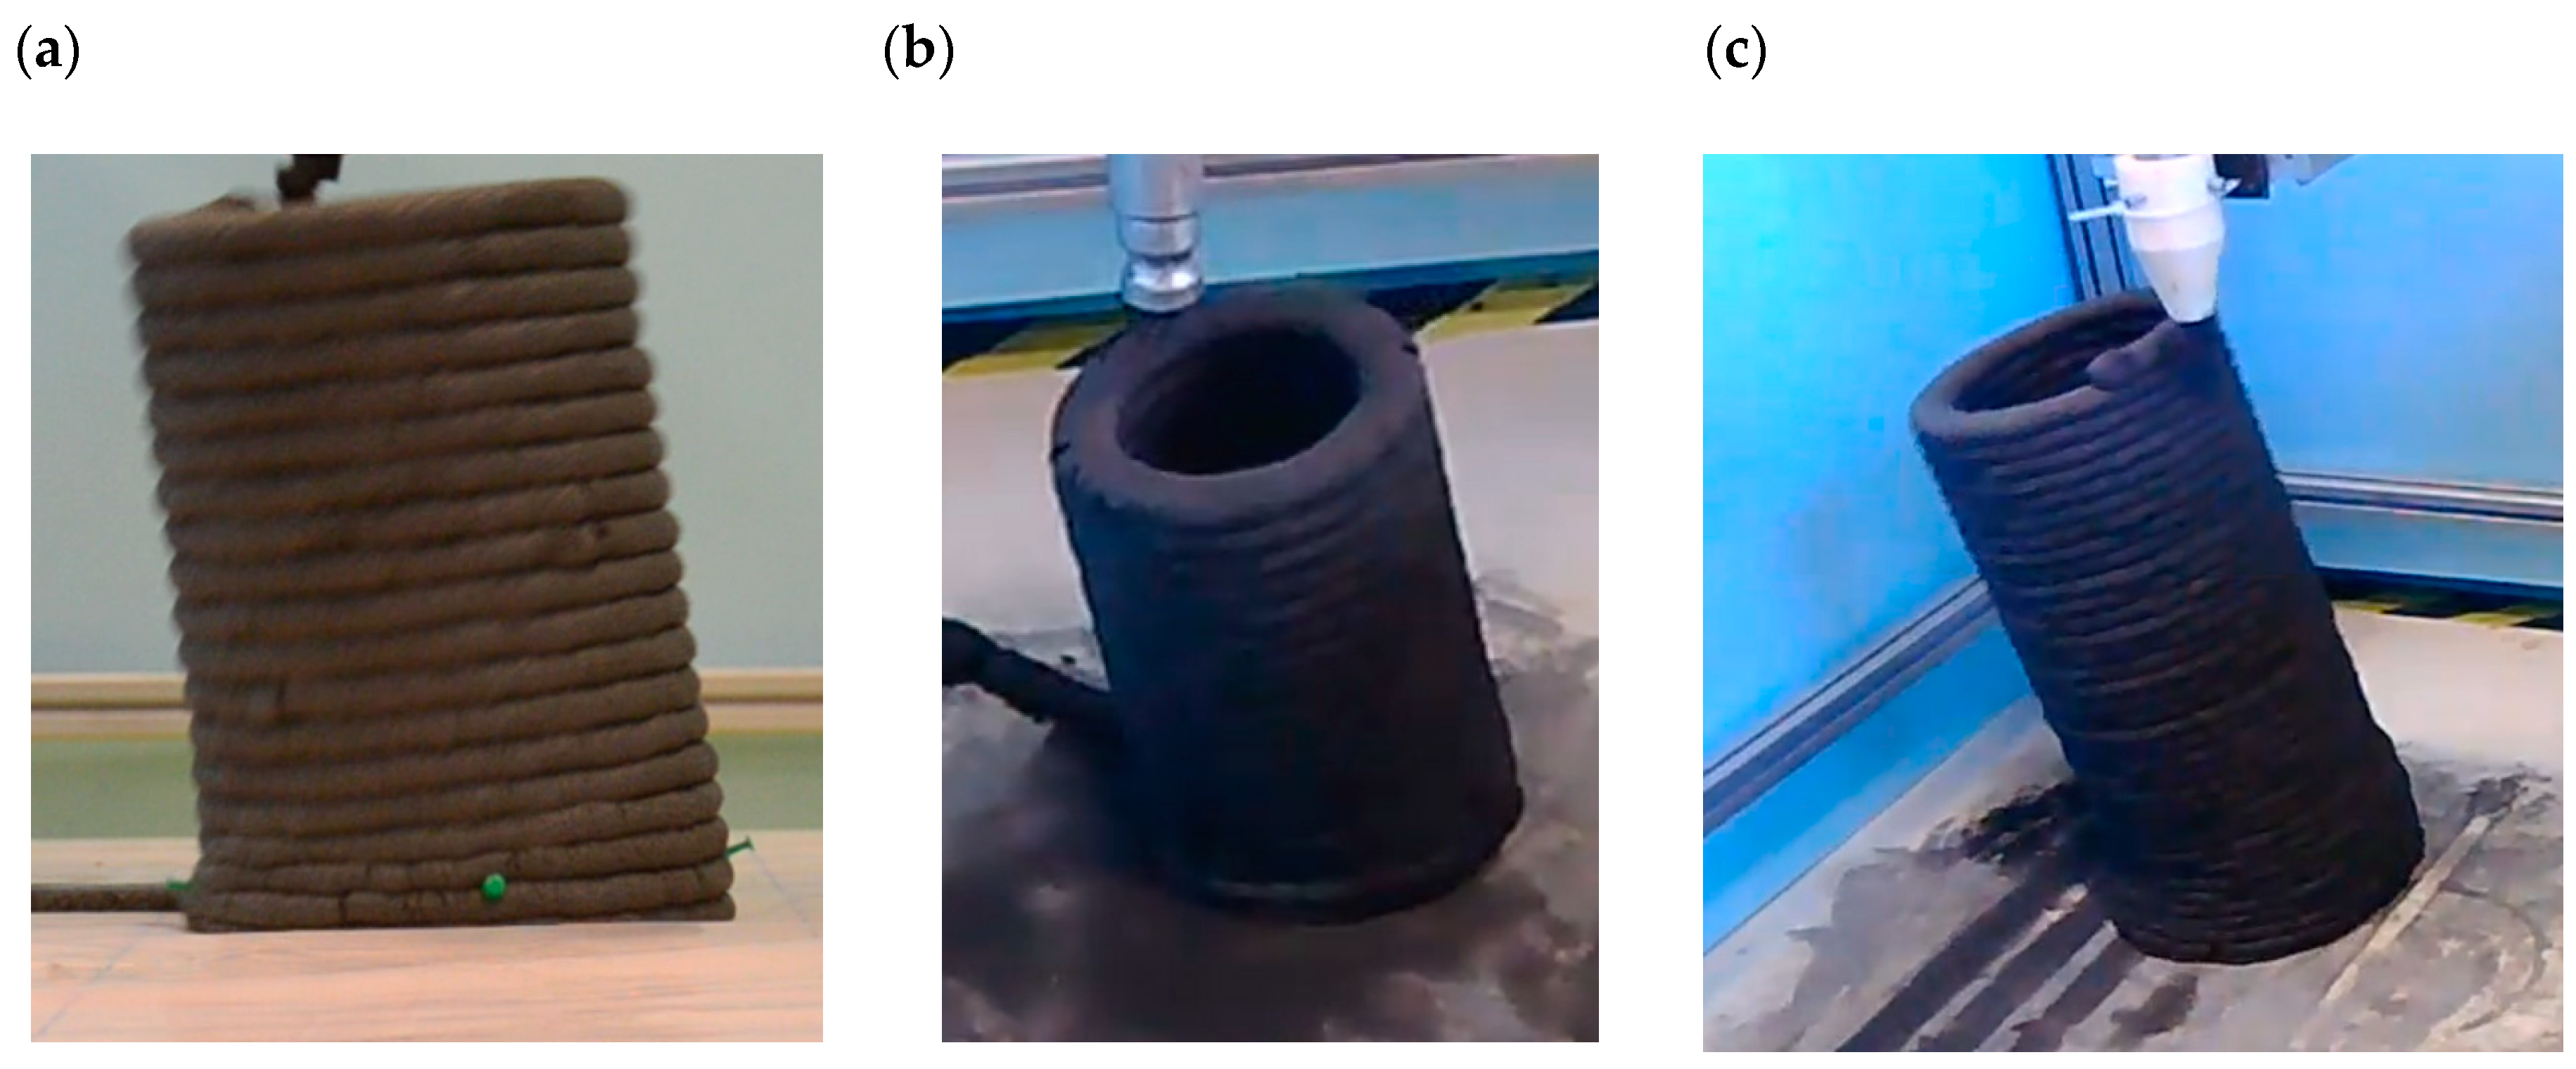
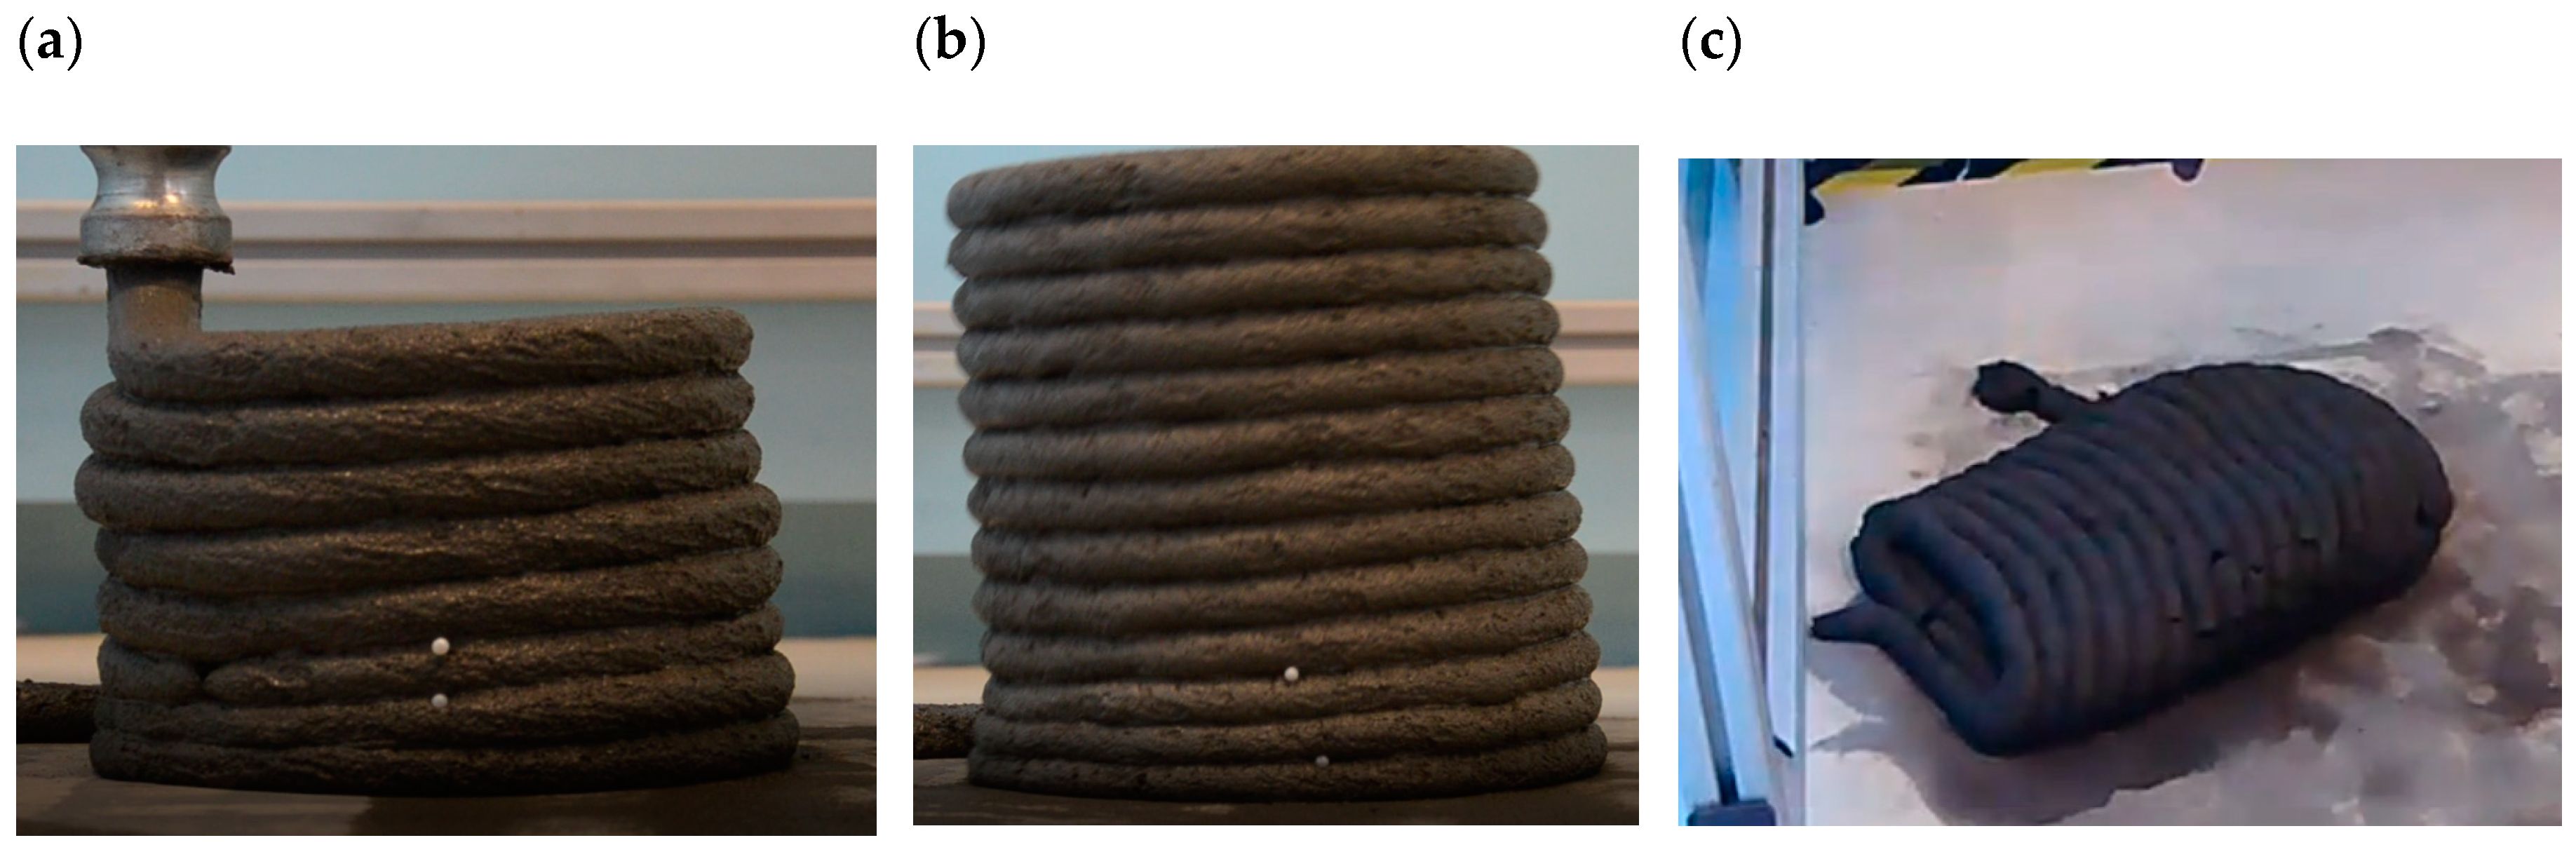
Figure 14, Figure 15 and Figure 16 present the failure mechanism of different columns printed from different mixes.
For B840/SF/FA/LP (Figure 16) and B640/SF/FA/LP (Figure 17) mix, the collapse occurred due to elastic buckling, while for B640/SF/FA due to plastic buckling (Figure 18). The comparison of load-bearing capacity calculated based on the time of collapse of the columns and obtained in the printing simulation test (squeezing test) is presented in Table 6.
The ratio of load-bearing capacity for mixes ranges between 1.48 and 1.97 which constitutes to a mean of 1.77; CoV = 0.0739. Similar results for printed columns and samples in the squeezing test were obtained in [80]. Comparison of the results is presented in Figure 17. The study has shown that proposed mixes are suitable for 3D printing.
3.5. Compressive Strength of Printed Columns
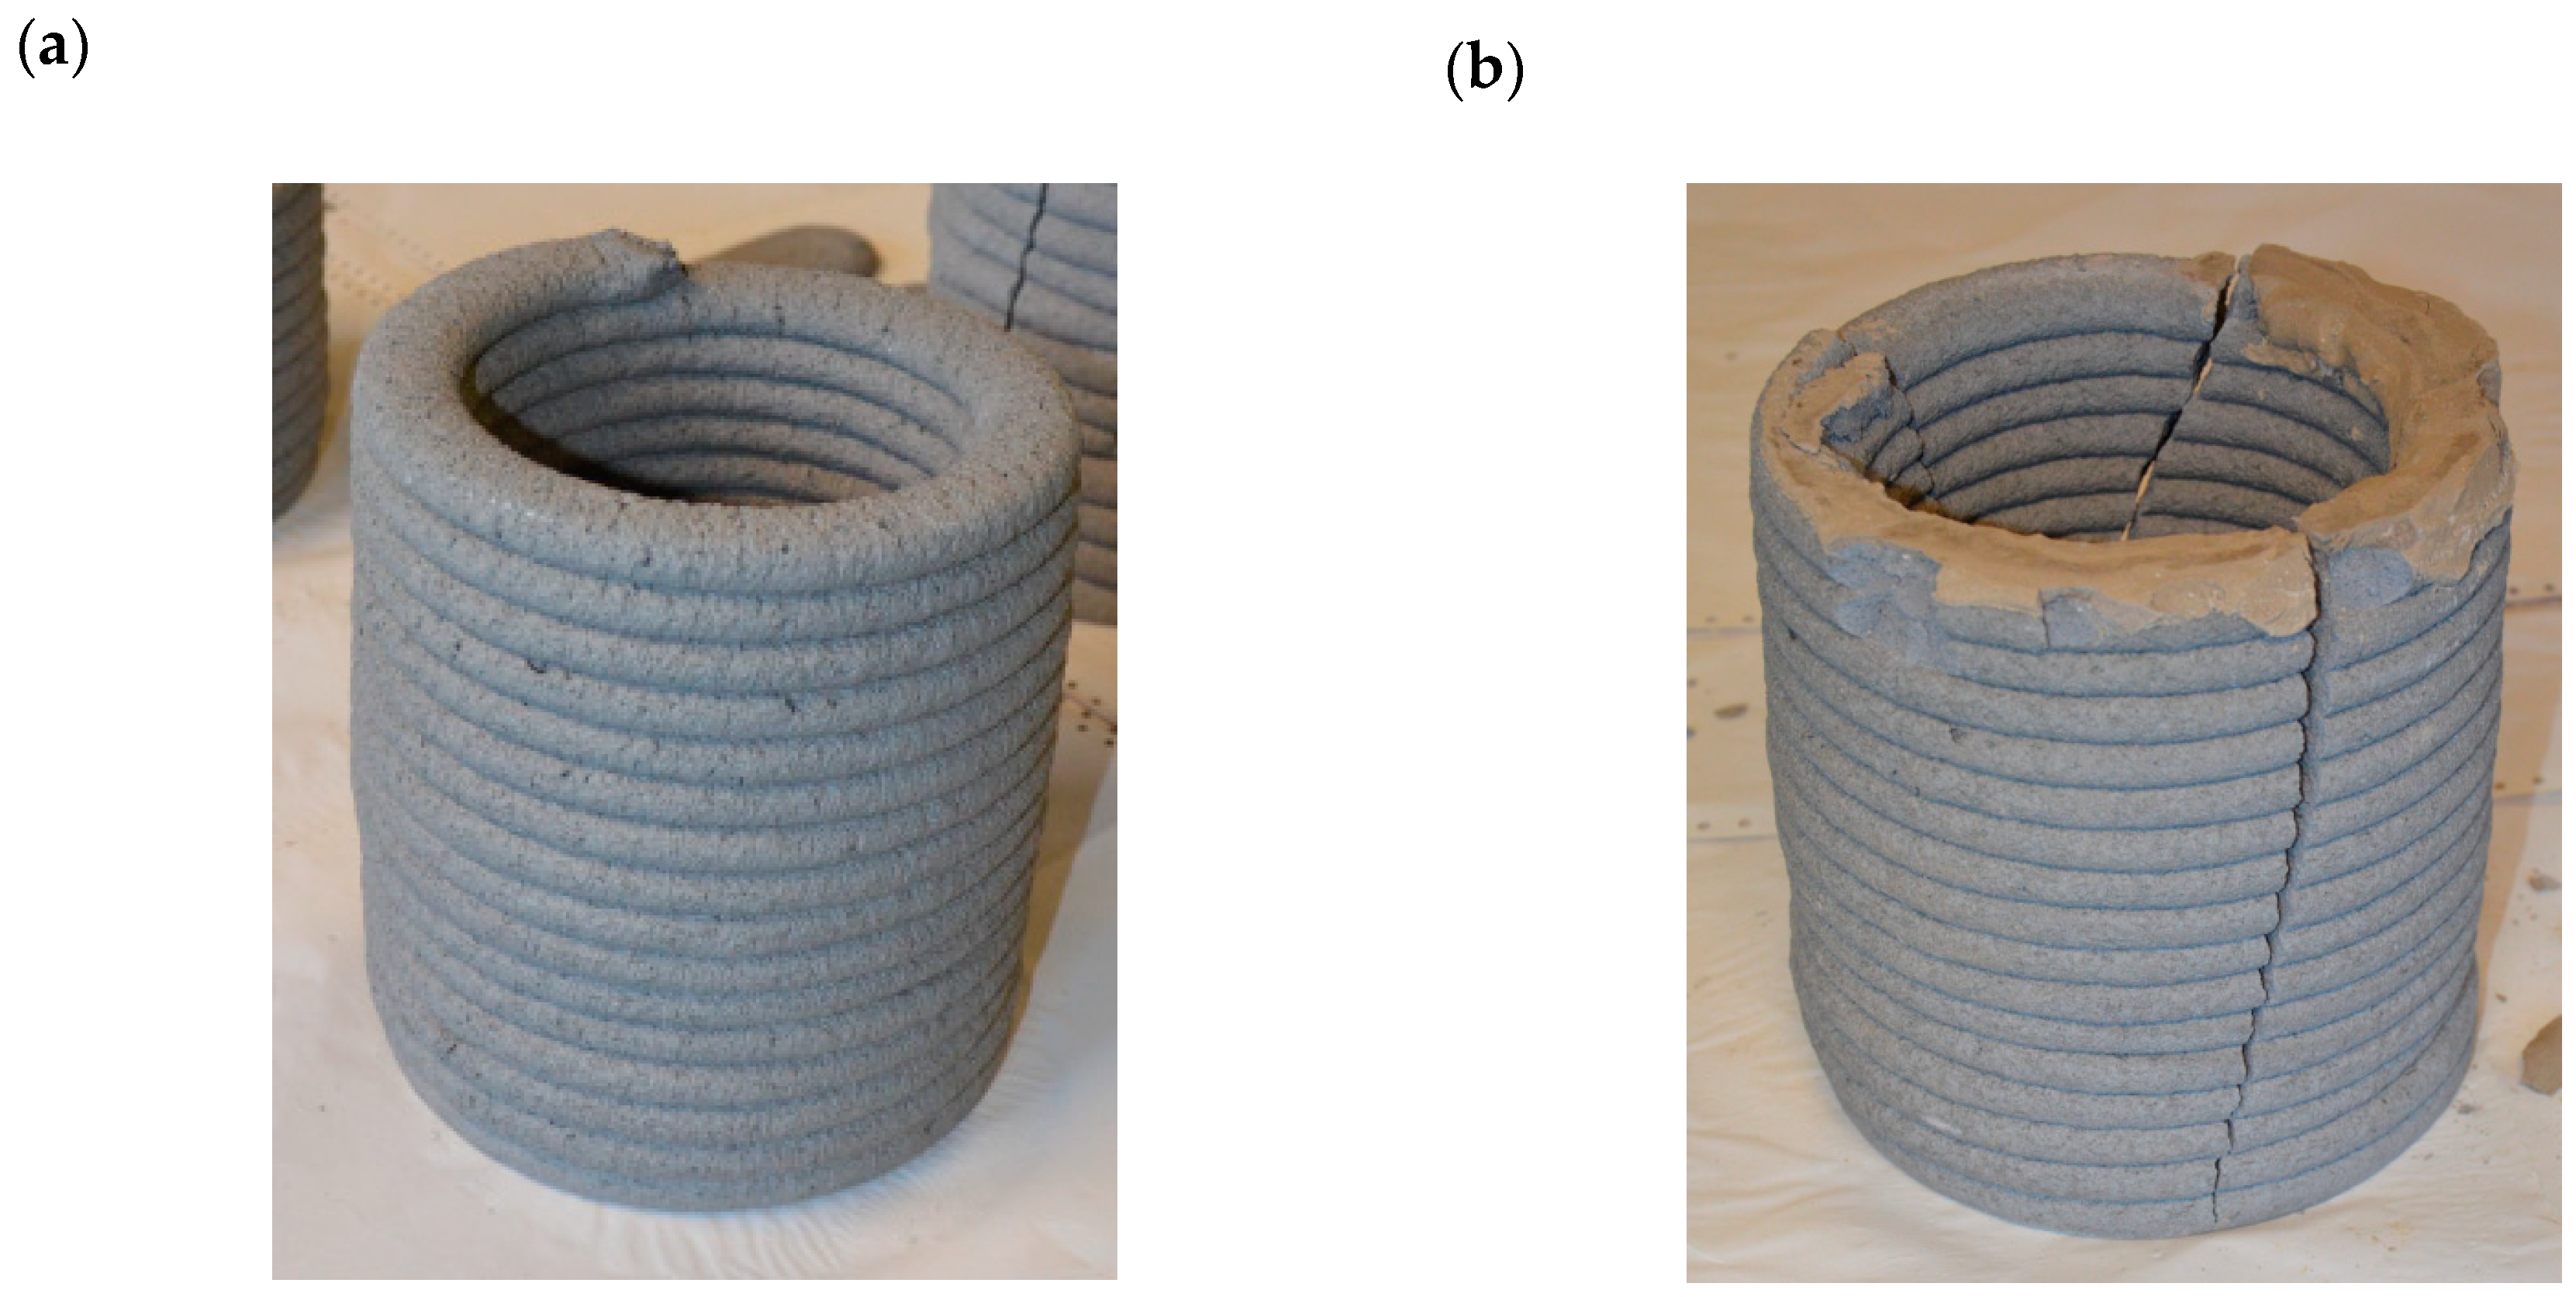
Determination of compressive strength of columns was conducted on a specimen with D = 160 mm and H = 205 ± 10 mm. Due to insufficient load-bearing capacity of the B640/SF/FA fresh concrete, the speed during its printing was reduced. The test was conducted 10 h after the end of printing. Samples before and after the test are presented in Figure 18. For each mix, three samples were prepared.
Figure 19 presents the comparison of a compressive strength of columns. Solid lines represent the mean value from three results, while dotted lines represent particular results direct from tests. The highest strength was obtained by the B840/SF/FA/LP mix with the highest amount of binder and modified with limestone powder. The compressive strength of column printed from B640/SF/FA and B640/SF/FA/LP mixes was significantly lower, which is caused by the lower binder amount. Strain level at failure in the study ranged between 4‰ and 5‰, which concurs with typical concrete structures.
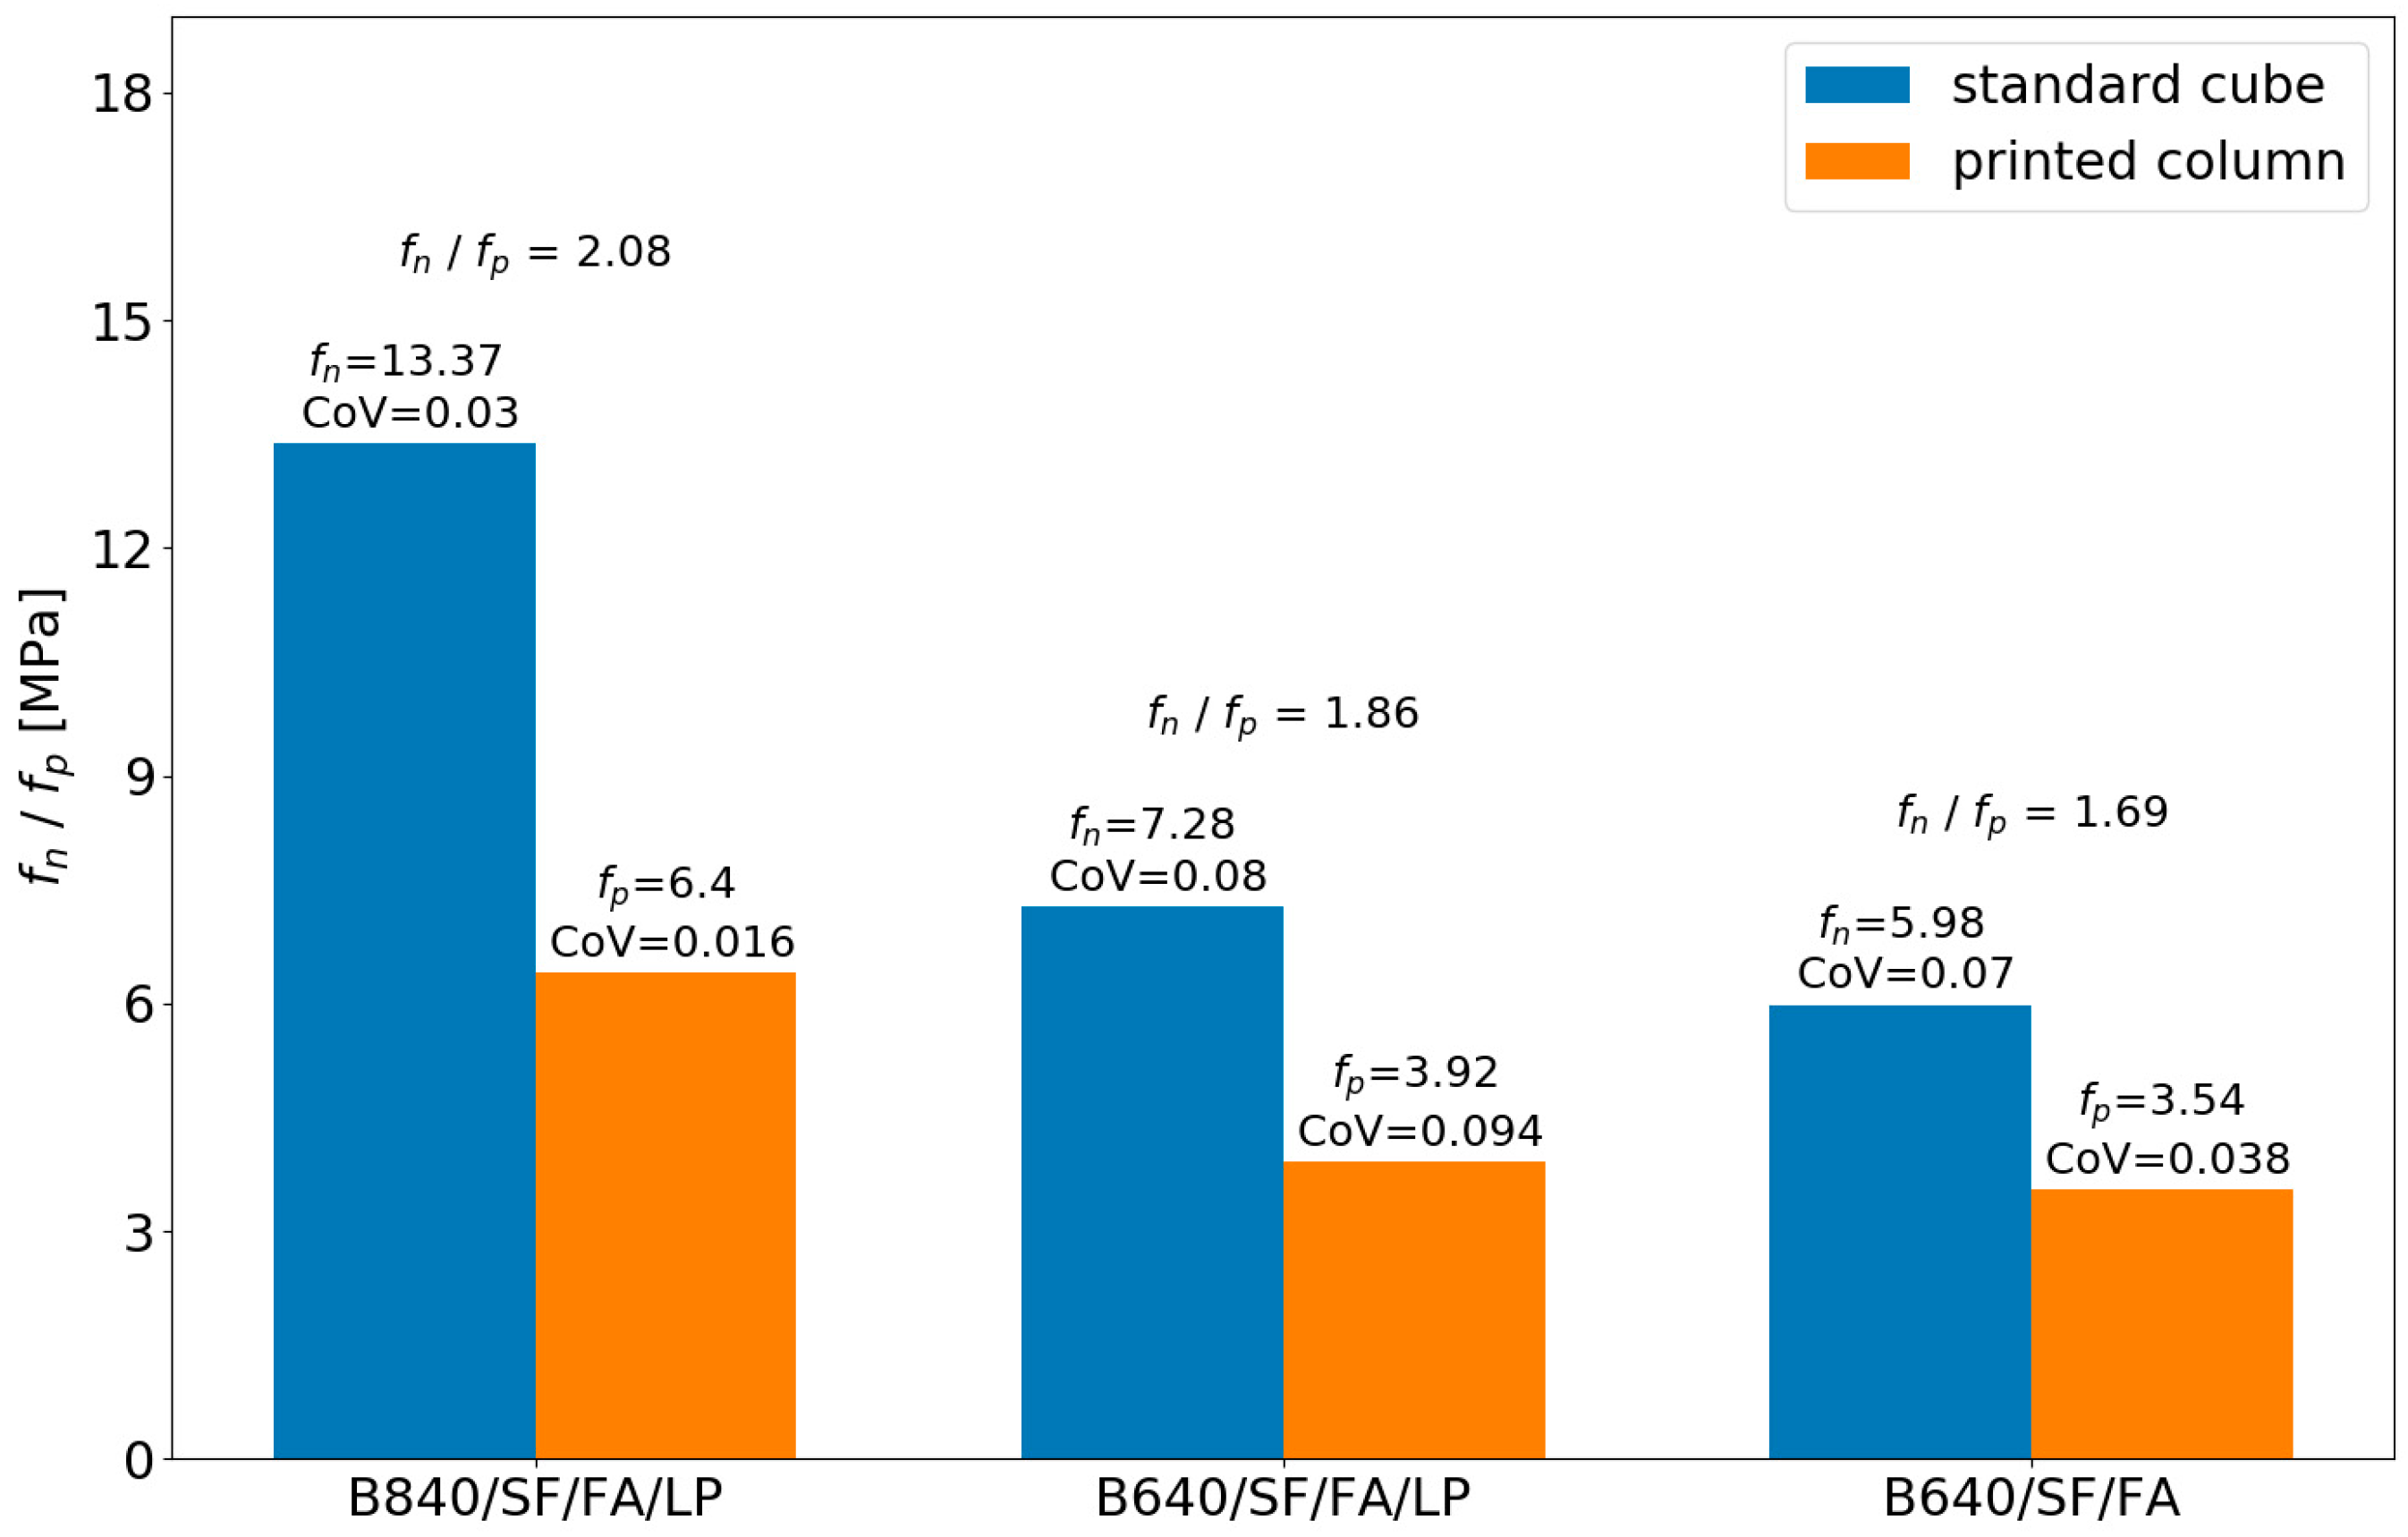
Figure 20 presents the comparison of compressive strength of printed columns with the results of compressive strength of standard prisms after 10 h. The ratio of compressive strength of standard cubes () and printed columns () in the study was between 1.69 and 2.08. The mean ratio from all samples was at CoV of 0.086. The results have shown that, by using a proper correction factor, it is possible to evaluate the strength of printed samples based on the results of standard ones.
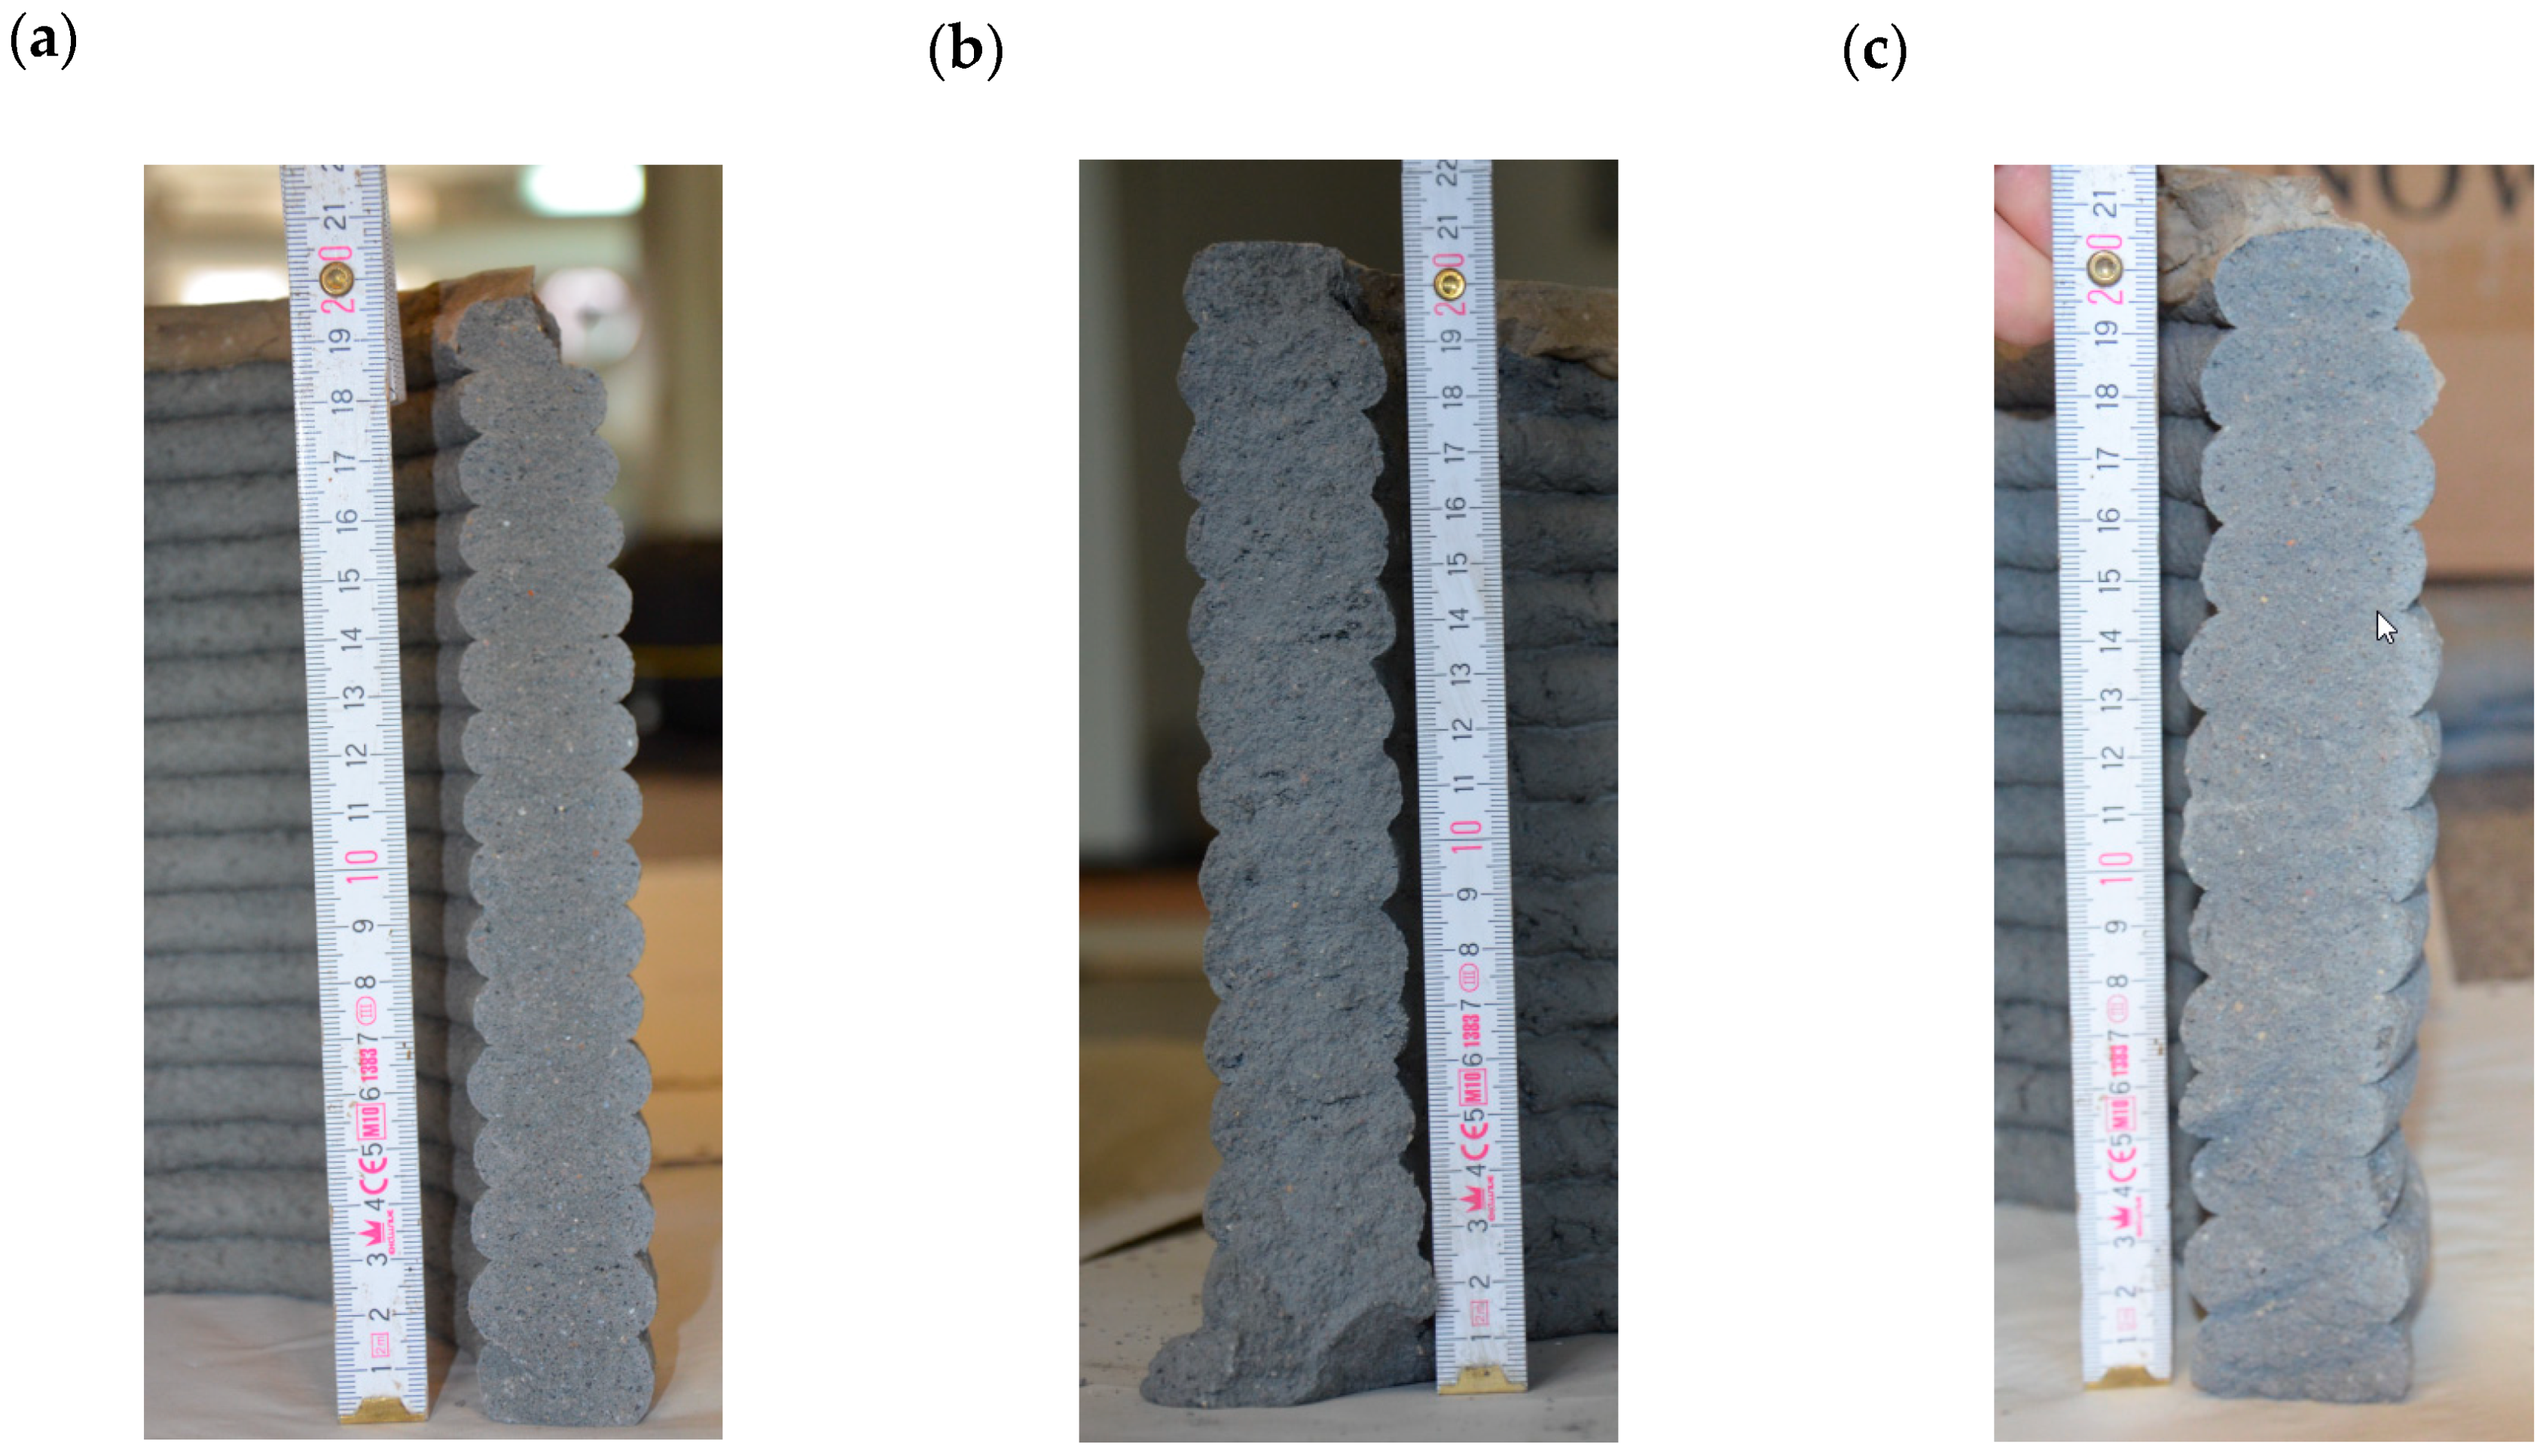
Figure 21 presents the cross sections of printed columns.
4. Environmental and Economic Aspects
4.1. Environmental Impact of Concrete
Based on obtained results presented in Table 7 and Table 8, a quantitative analysis of environmental impact of prepared mix was performed. Criteria chosen for the analysis were: Global Warming [kg CO2eq], Carcinogenic [CTUh], Ozone depletion [kg CFC-11eq], Ecotoxicity [CTUe], and Fossil fuel depletion [MJ]. The analysis was performed based on different studies and databases and regards the potential environmental impact of different materials [88,89,90]. The analysis incorporates only the impact correlated to the production of raw materials, not the impact correlated with the shipment of materials and products. The Environmental Impact Evaluation presented in Table 7 determines the degree to which a mix impacts the environment. The indicator is calculated as (Equation (5)):
—Environmental Impact for given mix () and given evaluation category ();—mean value for each category () of Environmental Impact. The lower the value of , the less harmful the mix is for the environment.
The (mean Environmental Impact Reduction) indicator shown in Table 7 corresponds to the mean reduction of given mix’s () impact on the environment. The lower the value, the less harmful the mix is for the environment.
Based on conducted analysis, the mixes with a high amount of binder (840 kg/m3) are, for the most part, more harmful for the environment than mixes with lower amounts of binder (640 kg/m3). In the case of mixes with a low amount of binder, the indicator for each category is lower than 1, which means that their value is below average for a group of mixes.
In terms of global warming, ozone depletion and fossil fuel depletion that mix with only cement as a binder (B840/LP, B840, B640/LP, B640) have the worst environmental impact. In the case of high-binder mixes, the environmental impact is as much as 22%–27% above the average (). In the case of low-binder mixes (B640/LP, B640), their environmental impact was about 14%–20% more negative than mixes with reactive mineral additives. For the above categories of environmental impact, cement should be replaced by reactive mineral additives. This is recommended especially for mixes with a large amount of binder. However, the addition of mineral additives such as silica fume and fly ash increases the carcinogenicity and ecotoxicity. In these categories, mixes containing fly ash and silica fume in relation to mixtures without those additives are about 19%–29% more harmful in a high binder group of mixes and 13%–22% more harmful when the amount of binder is lower (640 kg/m3).
In the analysis of mean Environmental Impact Evaluation, the mixes with a lower binder amount had the best results, which is an obvious fact. Mixes with reactive mineral additives have lower values by 5% than mixes with a high binder amount (840 kg/m3) and 4% than low-binder (640 kg/m3) mixes. In terms of , despite their carcinogenic impact, ecotoxicity mixes with mineral additives are more ecological. The results were included in the final evaluation of the mixes for 3D printing.
4.2. Economic Analysis
Based on the current price lists [91] and manufacturers’ prices [92], the market cost of printing mixtures in Poland was calculated (Table 9 and Table 10). The calculations were based on the average National Bank of Poland rate of 1 Euro = 4.4631 PLN [93]. Compared to the price of typical C25/30 or C30/37 concretes used popularly on construction sites (cost of about 48–50 Euro/m3), mixes for 3D printing are almost twice as expensive.
Analyzing the cost of tested mixes listed in Table 10, it can be concluded that the most expensive mix is the one containing 840 kg/m3 of cement and limestone powder (B840/LP). The least expensive is the mixture B640/SF/FA with a cement content of 640 kg/m3 and reactive additives (fly ash and silica fume). The index determines the ratio of a given mix price to the average price calculated for all mixes (). The > 1 means that the price of the mixture is above the mean, while < 1 means the price is below (Equation (6)):
—price of a given mix (); —mean price of all mixes.
5. Discussion
When analyzing the possibilities of applying the 3D printing in construction, the environmental impact and economic aspects might convince investors to choose this technology. Based on conducted research, a final analysis of suitability of mixes for 3D printing () was performed. The assessment was conducted in four categories:
- (1)
- Strength evaluation of mixes - ,
- (2)
- Strength evaluation of concretes - ,
- (3)
- Environmental impact - ,
- (4)
- Cost analysis - .
Comparison of individual evaluations was presented in Table 11.
Mixes with high amount of binder have higher values of , which is understandable considering both high performance of fresh mix and hardened concrete. Mixes with high amount of binder and limestone powder achieved the highest index values between 1.11 and 1.17. Mix modified with reactive mineral additives with high amount of binder (B840/SF/FA) achieved the value of 1.05. Due to environmental impact and low strength, mix without any additives achieved a value of only 0.94, below the average.
As the B840/SF/FA mix achieved the same result as B640/SF/FA/LP, it can be said that, even with lower overall amount of binder, the mix still has a good overall score, above the average in the studied group. Lower overall scores were achieved by mixes with a lower amount of binder without the addition of limestone powder. Even though those mixes are considered less harmful for the environment, their strength parameters significantly decrease the overall score in the study.
Mixes with a lower amount of binder and the addition of limestone powder have similar results to mixes with a higher amount of binder and no limestone powder. Considering the costs and environmental impact, the B640/SF/FA/LP and B640/LP mixes are the most suitable for 3D printing. With lower by 8%–13% price and 17% lower than average environmental impact, their strength still allowed them to be classified as the most suitable. Compared to other low-binder mixes (B640/SF/FA and B640), they exhibit lower environmental impact by 4%–5%.
The proposed method of evaluation can also be used only for specific requirements. In the case where a complex structure requires high fresh concrete parameters, the index will have the highest importance. The whole evaluation can be made based only on a single index. For example, the results of this study have shown that the B840, B640/SF/FA, and B640 mixes are significantly worse than B840/LP or B840/SF/FA/LP considering the value. However, their results are significantly better when taking the strength of cured specimen () or price () into consideration. The proposed evaluation system allows for the assessment of the selected parameter related to 3D printable materials.
The conducted study has shown that the strength parameters of the mix (fresh concrete) can be improved by the addition of limestone powder. Many researchers use the limestone powder for the improvement of rheological characteristics of the mix [17,29,38,84], without considering the influence of its amount on the properties of the mix. In a study [85], the authors modified the mix with different amounts of limestone powder and calcinated clay, without changing the amount of cement or w/b ratio. In another study [86], the cement was replaced with 0%, 25%, or 50% (by volume) of limestone powder. At 25% replacement, the loss of strength was insignificant, which was also proven in this study. The study [87] focuses on lightweight concretes, where cement was partially replaced with a limestone powder similarly as in [86]. The authors stated that the amount of approximately 20% of limestone powder does not significantly influence the compressive strength of concrete, while significantly reducing the total amount of cement. However, at 40%, the influence of limestone powder on compressive strength was noticeable. The results obtained in this study concur with the results from [86,87]. It is possible to obtain similar properties of composite for 3D printing by replacing certain amounts of cement with limestone powder.
The article in an original way proposed a parametric evaluation of mixes in terms of suitability for 3D printing. Based on the proposed method, the mixes can be chosen by their different characteristics. The method includes the environmental impact of the mixes.
The study has determined the behavior of mixes depending on the printing time and cycle time, which is an innovative approach. The prepared analysis allows for choosing the proper moment for applying additional layers, which can be helpful in determining recommended printing speed.
6. Conclusions
The study was conducted on eight mixes. The mixes were designed to allow for determining the influence of the binder amount and type of mineral additive on their suitability for 3D printing. In addition, their environmental impact was evaluated. The mixes were divided into two groups, one with high binder content (840 kg/m3) and one with low binder content (640 kg/m3). The binder in designed mixes was either cement (B840, B640, B840/LP, B640/LP) or cement with mineral additives: silica fume (SF), fly ash (FA) as a partial replacement (B840/SF/FA, B840/SF/FA/LP, B640/SF/FA, B640/SF/FA/LP). The influence of limestone powder (LP) was also determined (B840/LP, B640/LP, B840/SF/FA/LP, B640/SF/FA/LP). The following conclusions can be drawn:
- The results of compressive strength determination after 28 days have shown that mixes with a higher binder amount (840 kg/m3) have better results than mixes with a lower binder amount (640 kg/m3). The study has shown that reactive mineral additives (silica fume (SF), fly ash (FA)) improve the compressive strength of designed mixes.
- The proposed coefficient was used to compare the compressive strength of designed mixes. The value of the coefficient allows for quickly determining which mixes have higher than average compressive strength. The same formula can be used to determine different mechanical parameters of concrete.
- The conducted printing simulation test (squeezing test) allows for determining the development of compressive strength of fresh mix. The study has shown a change in mix stiffness at strain level of 0.04. This level of strain was assumed as a limit value, for which the stresses were determined . This assumption allowed for preparing the stress–strain curves for designed mixes. The tests were conducted for two different time factors. The time was the time from a cement–water contact until the test. The time was the time reflecting the time of consecutive layers being printed (cycle time). Based on the proposed test, the printing parameters can be set (nozzle speed, pump performance, and mixer performance) to incorporate the mechanical properties of the mix. It can be also used another way around to determine if the mix is feasible for printing at assumed parameters. The main outcomes from the tests:
- ○
- Replacing the cement with silica fume (SF) and fly ash (FA) increased the compressive strength only in the group of mixes with higher binder content.
- ○
- It was observed that the addition of only limestone powder as an inert microfiller significantly improved mechanical performance of fresh concrete regardless of binder amount.
- ○
- The increase in mix strength is the higher the later the printing starts () and the higher the cycle time .
- ○
- In the majority of the mixes, the increase of compressive strength between the two lowest cycle times is linear regardless of printing time . In the case of , it was noticed that, for mixes modified with limestone powder, both with low and high binder content, the increase in compressive strength between the printing times is exponential.
- ○
- ○
- The lowest strength increase was exhibited by mixes without limestone powder and low binder amount (CI/SP640, CI/SP640/SF/FA).
- ○
- The highest strength increase was observed for low-binder mixes modified with limestone powder (CI/SP640/LP, CI/SP640/SF/FA/LP) and high-binder mixes (CI/SP840, CI/SP840/LP, CI/SP840/SF/FA/LP, CI/SP840/SF/FA).
- Based on the performed test of the compressive strength of the mix during the printing process, the stresses at the moment of failure of the structure during the printing process were calculated. The stresses were then compared with the limit stresses obtained in the squeezing test. The method allows for transferring the squeezing test results for practical use. The main outcomes from the test were:
- ○
- The stresses are lower than . It was determined that the value of was on average 1.77. The result allows for evaluating the stresses at failure and limit stresses.
- ○
- The presented study has proven that the squeezing test, which simulates the printing process, can successfully be used to initially determine the properties of the mix, which later can be verified during printing.
- The main outcomes of the compressive strength test of printed columns after 10 h of water contact were:
- ○
- The strength of the printed structure () was compared to the strength of standard samples (). The proposed coefficient had an average value of 1.87. Standard samples exhibit higher compressive strength. This is due to their compaction while casting, while printed samples cannot be prepared this way and have more air voids [23,24]. The results of the test allow for determining the strength of the printed structure based on the results of standard samples.
- ○
- The test can used as a supplementation of the standard compressive strength test and squeezing test. The results reflect how quickly the printed structure can be loaded with structural elements such as lintels, beams, and slabs. The limitation to the test is that it was conducted only at a single time point. Further studies need to be performed for different times between 10 h and 24 h.
- Conducted quantitative analysis of the environmental impact of mixes allowed for determining the indicator. The lower the value of , the less harmful the mix is for the environment. Mixes with a lower amount of binder achieved better results for the . The difference between low- and high-binder mixes in the study was about 25 percentage points. Mixes with reactive mineral additives have lower by 5% for high-binder mixes (840 kg/m3), and 4% for low-binder mixes (640 kg/m3) than mixes without reactive mineral additives. Even though mixes with reactive mineral additives are more carcinogenic and have higher ecotoxicity, their overall environmental impact is lower.
Currently, there are no precise methods for determination of the strength properties of fresh concrete (mixes) suitable for 3D printing. The conducted review of literature and studies performed by different researchers proves the importance of this issue and highlights the need for standardized methods. This will allow for comparing the results of various studies and implementing their results for industrial purposes. Additionally, the proposed original method evaluation of mixes suitable for 3D printing can help to choose the optimal mix based on material, environmental, and economical factors.
Author Contributions
Conceptualization, M.K. and S.S.; methodology, M.K., S.S.; software, S.S.; validation, S.S; formal analysis, S.S.; investigation, S.S, M.H.; resources, S.S.; writing—original draft preparation, M.K., S.S; writing—review and editing, M.K., S.S., M.H. All authors have read and agreed to the published version of the manuscript.
Funding
This research received no external funding.
Acknowledgments
The authors are grateful to the Faculty of Mechanical Engineering and Mechatronics and Faculty of Civil and Environmental Engineering of the West Pomeranian University of Technology in Szczecin for their substantial organizational and financial support of the interdisciplinary Research Group “3D Concrete Line”.
Conflicts of Interest
The authors declare no conflict of interest.
References
- Khoshnevis, B.; Hwang, D.; Yao, K.-T.; Zhenghao, Y. Mega-scale fabrication by contour crafting. Int. J. Ind. Syst. Eng. 2006, 1. [Google Scholar] [CrossRef] [Green Version]
- Khoshnevis, B. Automated construction by contour crafting—Related robotics and information technologies. Autom. Constr. 2004, 13, 5–19. [Google Scholar] [CrossRef]
- Bos, F.; Wolfs, R.; Ahmed, Z.; Salet, T. Additive manufacturing of concrete in construction: Potentials and challenges of 3D concrete printing. Virtual Phys. Prototyp. 2016, 11, 209–225. [Google Scholar] [CrossRef] [Green Version]
- Wangler, T.; Lloret, E.; Reiter, L.; Hack, N.; Gramazio, F.; Kohler, M.; Bernhard, M.; Dillenburger, B.; Buchli, J.; Roussel, N.; et al. Digital Concrete: Opportunities and Challenges. RILEM Lett. 2016, 1, 67–75. [Google Scholar] [CrossRef]
- Khoshnevis, B.; Hwang, D. Contour Crafting. In Rapid Prototyping: Theory and Practice; Kamrani, A., Nasr, E.A., Eds.; Springer: Boston, MA, USA, 2006; pp. 221–251. ISBN 978-0-387-23291-1. [Google Scholar]
- Khoshnevis, B.; Bukkapatnam, S.; Kwon, H.; Saito, J. Experimental investigation of contour crafting using ceramic materials. Rapid Prototyp. J. 2001, 7, 32–41. [Google Scholar] [CrossRef]
- Le, T.T.; Austin, S.A.; Lim, S.; Buswell, R.A.; Gibb, A.G.F.; Thorpe, T. Mix design and fresh properties for high-performance. Mater. Struct. 2012, 45, 1221–1232. [Google Scholar] [CrossRef] [Green Version]
- Le, T.T.; Austin, S.A.; Lim, S.; Buswell, R.A.; Law, R.; Gibb, A.; Thorpe, T. Hardened properties of high-performance printing concrete. Cem. Concr. Res. 2012, 42, 558–566. [Google Scholar] [CrossRef] [Green Version]
- Lim, S.; Buswell, R.A.; Le, T.T.; Austin, S.A.; Gibb, A.G.F.; Thorpe, T. Developments in construction-scale additive manufacturing processes. Autom. Constr. 2012, 21, 262–268. [Google Scholar] [CrossRef] [Green Version]
- Cesaretti, G.; Dini, E.; Kestelier, X.D.; Colla, V.; Pambaguian, L. Building components for an outpost on the Lunar soil by means of a novel 3D printing technology. Acta Astronaut. 2014, 93, 430–450. [Google Scholar] [CrossRef]
- Kazemian, A.; Yuan, X.; Cochran, E.; Khoshnevis, B. Cementitious materials for construction-scale 3D printing: Laboratory testing of fresh printing mixture. Constr. Build. Mater. 2017, 145, 639–647. [Google Scholar] [CrossRef]
- Secrieru, E.; Fataei, S.; Schröfl, C.; Mechtcherine, V. Study on concrete pumpability combining different laboratory tools and linkage to rheology. Constr. Build. Mater. 2017, 144, 451–461. [Google Scholar] [CrossRef]
- Federowicz, K.; Kaszyńska, M.; Zieliński, A.; Hoffmann, M. Effect of Curing Methods on Shrinkage Development in 3D-Printed Concrete. Materials 2020, 13, 2590. [Google Scholar] [CrossRef]
- Kaszynska, M.; Olczyk, N.; Techman, M.; Skibicki, S.; Zielinski, A.; Filipowicz, K.; Wróblewski, T.; Hoffmann, M. Thermal-humidity parameters of 3D printed wall. IOP Mater. Sci. Eng. 2019, 471, 082018. [Google Scholar]
- Panda, B.; Noor Mohamed, N.A.; Paul, S.C.; Bhagath Singh, G.V.; Tan, M.J.; Šavija, B. The Effect of Material Fresh Properties and Process Parameters on Buildability and Interlayer Adhesion of 3D Printed Concrete. Materials 2019, 12, 2149. [Google Scholar] [CrossRef] [Green Version]
- Jones, S.Z.; Bentz, D.P.; Martys, N.S.; George, W.L.; Thomas, A. Rheological Control of 3D Printable Cement Paste and Mortars. In First RILEM International Conference on Concrete and Digital Fabrication—Digital Concrete 2018; Wangler, T., Flatt, R., Eds.; Springer: Cham, Switzerland, 2019; ISBN 3319995189. [Google Scholar]
- Perrot, A.; Rangeard, D.; Pierre, A. Structural built-up of cement-based materials used for 3D-printing extrusion techniques. Mater. Struct. 2016, 49, 1213–1220. [Google Scholar] [CrossRef]
- Roussel, N.; Cussigh, F. Distinct-layer casting of SCC: The mechanical consequences of thixotropy. Cem. Concr. Res. 2008, 38, 624–632. [Google Scholar] [CrossRef]
- Paul, S.C.; Tay, Y.W.D.; Panda, B.; Tan, M.J. Fresh and hardened properties of 3D printable cementitious materials for building and construction. Arch. Civ. Mech. Eng. 2018, 18, 311–319. [Google Scholar] [CrossRef]
- Roussel, N.; Lanos, C. Plastic Fluid Flow Parameters Identification Using a Simple Squeezing Test. Appl. Rheol. 2003, 13, 132–141. [Google Scholar] [CrossRef]
- Ivanova, I.; Mechtcherine, V. Possibilities and challenges of constant shear rate test for evaluation of structural build-up rate of cementitious materials. Cem. Concr. Res. 2020, 130, 105974. [Google Scholar] [CrossRef]
- Roussel, N. Rheological requirements for printable concretes. Cem. Concr. Res. 2018, 112, 76–85. [Google Scholar] [CrossRef]
- Shakor, P.; Nejadi, S.; Paul, G. A Study into the Effect of Different Nozzles Shapes and Fibre-Reinforcement in 3D Printed Mortar. Materials 2019, 12, 1708. [Google Scholar] [CrossRef] [Green Version]
- Shakor, P.; Nejadi, S.; Sutjipto, S.; Paul, G.; Gowripalan, N. Effects of deposition velocity in the presence/absence of E6-glass fibre on extrusion-based 3D printed mortar. Addit. Manuf. 2020, 32, 101069. [Google Scholar] [CrossRef]
- Shakor, P.; Renneberg, J.; Nejadi, S.; Paul, G. Optimisation of Different Concrete Mix Designs for 3D Printing by Utilizing 6DOF Industrial Robot. In Proceedings of the 34th International Symposium on Automation and Robotics in Construction, Taipei, Taiwan, 28 June–1 July 2017. [Google Scholar]
- Kaszynska, M.; Hoffmann, M.; Skibicki, S.; Zielinski, A.; Techman, M.; Olczyk, N.; Wróblewski, T. Evaluation of suitability for 3D printing of high performance concretes. MATEC Web Conf. 2018, 163, 1002. [Google Scholar] [CrossRef]
- Greenhill, A.G. Determination of the greatest height consistent with stability that a vertical pole or mast can be made, and the greatest height to which a tree of given proportions can grow. Proc. Camb. Philos. Soc. 1881, 4, 65–73. [Google Scholar] [CrossRef]
- Suiker, A. Mechanical performance of wall structures in 3D printing processes: Theory, design tools and experiments. Int. J. Mech. Sci. 2018, 137, 145–170. [Google Scholar] [CrossRef] [Green Version]
- Wolfs, R.J.M.; Suiker, A.S.J. Structural failure during extrusion-based 3D printing processes. Int. J. Adv. Manuf. Technol. 2019, 104, 565–584. [Google Scholar] [CrossRef] [Green Version]
- Wolfs, R.; Bos, F.P.; Salet, T. Early age mechanical behaviour of 3D printed concrete: Numerical modelling and experimental testing. Cem. Concr. Res. 2018, 106, 103–116. [Google Scholar] [CrossRef]
- Hüsken, G.; Brouwers, H. On the early-age behavior of zero-slump concrete. Cem. Concr. Res. 2012, 42, 501–510. [Google Scholar] [CrossRef] [Green Version]
- Alexandridis, A.; Gardner, N.J. Mechanical behaviour of fresh concrete. Cem. Concr. Res. 1981, 11, 323–339. [Google Scholar] [CrossRef]
- Di Carlo, T. Experimental and Numerical Techniques to Characterize Structural Properties of Fresh Concrete Relevant to Contour Crafting. Ph.D. Dissertation, Univeristy of Southern California, Los Angeles, CA, USA, 2012. [Google Scholar]
- Casagrande, L.; Esposito, L.; Menna, C.; Asprone, D.; Auricchio, F. Effect of testing procedures on buildability properties of 3D-printable concrete. Constr. Build. Mater. 2020, 245, 118286. [Google Scholar] [CrossRef]
- Ma, G.; Li, Z.; Wang, L. Printable properties of cementitious material containing copper tailings for extrusion based 3D printing. Constr. Build. Mater. 2018, 162, 613–627. [Google Scholar] [CrossRef]
- Malaeb, Z.; Hachem, H.; Tourbah, A.; Maalouf, T.; El Zarwi, N.; Hamzeh, F. 3d concrete printing: Machine and mix design. Int. J. Civ. Eng. Technol. 2015, 6, 14–22. [Google Scholar]
- Nerella, V.N.; Krause, M.; Näther, M.; Mechtcherine, V. Studying printability of fresh concrete for formwork free Concrete on-site 3D Printing technology (CONPrint3D). In Proceedings of the 25th Conference on Rheology of Building Materials, Regensburg, Germany, 2–3 March 2016. [Google Scholar]
- Skibicki, S.; Kaszyńska, M.; Techman, M. Maturity testing of 3D printing concrete with inert microfiller. MATEC Web. Conf. 2018, 219, 3008. [Google Scholar] [CrossRef]
- Zhang, C.; Hou, Z.; Chen, C.; Zhang, Y.; Mechtcherine, V.; Sun, Z. Design of 3D printable concrete based on the relationship between flowability of cement paste and optimum aggregate content. Cem. Concr. Compos. 2019, 104, 103406. [Google Scholar] [CrossRef]
- Austin, S.A.; Robins, P.J.; Goodier, C.I. The rheological performance of wet-process sprayed mortars. Mag. Concr. Res. 1999, 51, 341–352. [Google Scholar] [CrossRef] [Green Version]
- Buswell, R.A.; Leal de Silva, W.R.; Jones, S.Z.; Dirrenberger, J. 3D printing using concrete extrusion: A roadmap for research. Cem. Concr. Res. 2018, 112, 37–49. [Google Scholar] [CrossRef]
- Duballet, R.; Baverel, O.; Dirrenberger, J. Classification of building systems for concrete 3D printing. Autom. Constr. 2017, 83, 247–258. [Google Scholar] [CrossRef] [Green Version]
- Wangler, T.; Roussel, N.; Bos, F.P.; Salet, T.A.; Flatt, R.J. Digital Concrete: A Review. Cem. Concr. Res. 2019, 123, 105780. [Google Scholar] [CrossRef]
- Lafhaj, Z.; Rabenantoandro, A.Z.; el Moussaoui, S.; Dakhli, Z.; Youssef, N. Experimental Approach for Printability Assessment: Toward a Practical Decision-Making Framework of Printability for Cementitious Materials. Buildings 2019, 9, 245. [Google Scholar] [CrossRef] [Green Version]
- Tay, Y.W.D.; Qian, Y.; Tan, M.J. Printability region for 3D concrete printing using slump and slump flow test. Compos. B Eng. 2019, 174, 106968. [Google Scholar] [CrossRef]
- ASTM. Standard Specification for Flow Table for Use in Tests of Hydraulic Cement; Technical Report No. C230; ASTM International: West Conshohocken, PA, USA, 2014. [Google Scholar]
- Czarnecki, L.; Gemert, D. Innovation in construction materials engineering versus sustainable development. Bull. Pol. Acad. Sci. Tech. Sci. 2017, 65, 765–771. [Google Scholar] [CrossRef] [Green Version]
- Szewczak, E.; Winkler-Skalna, A.; Czarnecki, L. Sustainable Test Methods for Construction Materials and Elements. Materials 2020, 13, 606. [Google Scholar] [CrossRef] [Green Version]
- Ma, G.; Wang, L.; Ju, Y. State-of-the-art of 3D printing technology of cementitious material—An emerging technique for construction. Sci. China Technol. Sci. 2018, 61, 475–495. [Google Scholar] [CrossRef]
- Yossef, M.; Chen, A. Applicability and Limitations of 3D Printing for Civil Structures. In Proceedings of the 2015 Conference on Autonomous and Robotic Construction of Infrastructure, Ames, IA, USA, 2–3 June 2015. [Google Scholar]
- Yang, H.; Chung, J.K.H.; Chen, Y.; Li, Y. The cost calculation method of construction 3D printing aligned with internet of things. J. Wirel. Commun. Netw. 2018, 2018, 65. [Google Scholar] [CrossRef] [Green Version]
- Panda, B.; Paul, S.C.; Mohamed, N.A.N.; Tay, Y.W.D.; Tan, M.J. Measurement of tensile bond strength of 3D printed geopolymer mortar. Measurement 2018, 113, 108–116. [Google Scholar] [CrossRef]
- Lowke, D.; Dini, E.; Perrot, A.; Weger, D.; Gehlen, C.; Dillenburger, B. Particle-bed 3D printing in concrete construction—Possibilities and challenges. Cem. Concr. Res. 2018, 112, 50–65. [Google Scholar] [CrossRef]
- López, D.; Veenendaal, D.; Akbarzadeh, M.; Block, P. Prototype of an ultra-thin, concrete vaulted floor system. In Proceedings of the IASS 2014 Brasilia Symposium: Shells, Membranes and Spatial Structures: Footprints—Structural Morphology 2: Methods for Thin Shells, Brasilia, Brazil, 15–19 August 2014. [Google Scholar]
- Siddika, A.; Mamun, M.A.A.; Ferdous, W.; Saha, A.K.; Alyousef, R. 3D-printed concrete: Applications, performance, and challenges. J. Sustain. Cem.-Based Mater. 2019, 24, 1–38. [Google Scholar] [CrossRef]
- Buswell, R.A.; Soar, R.C.; Gibb, A.; Thorpe, A. Freeform Construction: Mega-scale Rapid Manufacturing for construction. Autom. Constr. 2007, 16, 224–231. [Google Scholar] [CrossRef] [Green Version]
- Zhang, J.; Wang, J.; Dong, S.; Yu, X.; Han, B. A review of the current progress and application of 3D printed concrete. Compos Appl. Sci. Manuf. 2019, 125, 105533. [Google Scholar] [CrossRef]
- Jha, K.N. Formwork for Concrete Structures; Tata McGraw Hill Education Private Limited: New Delhi, IN, USA, 2012; ISBN 978-1-25-900733-0. [Google Scholar]
- Paul, S.C.; van Zijl, G.P.; Tan, M.J.; Gibson, I.; Campbell, R.I. A review of 3D concrete printing systems and materials properties: Current status and future research prospects. Rapid Prototyp. J. 2018, 23. [Google Scholar] [CrossRef] [Green Version]
- Skibicki, S. Optimization of Cost of Building with Concrete Slabs Based on the Maturity Method. IOP Conf. Ser. Mater. Sci. Eng. 2017, 245, 22061. [Google Scholar] [CrossRef] [Green Version]
- Hager, I.; Golonka, A.; Putanowicz, R. 3D Printing of Buildings and Building Components as the Future of Sustainable Construction? Procedia Eng. 2016, 151, 292–299. [Google Scholar] [CrossRef] [Green Version]
- Diggs-McGee, B.N.; Kreiger, E.L.; Kreiger, M.A.; Case, M.P. Print time vs. elapsed time: A temporal analysis of a continuous printing operation for additive constructed concrete. Addit. Manuf. 2019, 28, 205–214. [Google Scholar] [CrossRef]
- Malaeb, Z.; AlSakka, F.; Hamzeh, F. 3D Concrete Printing. In 3D Concrete Printing Technology; Sanjayan, J., Nazari, A., Nematollahi, B., Eds.; Elsevier: Oxford, UK, 2019; pp. 115–136. ISBN 9780128154816. [Google Scholar]
- Sanjayan, J.; Nazari, A.; Nematollahi, B. 3D Concrete Printing Technology; Sanjayan, J., Nazari, A., Nematollahi, B., Eds.; Elsevier: Oxford, UK, 2019; ISBN 9780128154816. [Google Scholar]
- Marchment, T.; Sanjayan, J.G.; Nematollahi, B.; Xia, M. Interlayer Strength of 3D Printed Concrete. In 3D Concrete Printing Technology; Sanjayan, J., Nazari, A., Nematollahi, B., Eds.; Elsevier: Oxford, UK, 2019; pp. 241–264. ISBN 9780128154816. [Google Scholar]
- Wolfs, R. 3D Printind of Concrete Structures. Graduation Thesis, Eindhoven University of Technology, Eindhoven, The Netherlands, 2015. [Google Scholar]
- Labonnote, N.; Rønnquist, A.; Manum, B.; Rüther, P. Additive construction: State-of-the-art, challenges and opportunities. Autom. Constr. 2016, 72, 347–366. [Google Scholar] [CrossRef]
- Agustí-Juan, I.; Müller, F.; Hack, N.; Wangler, T.; Habert, G. Potential benefits of digital fabrication for complex structures: Environmental assessment of a robotically fabricated concrete wall. J. Clean. Prod. 2017, 154, 330–340. [Google Scholar] [CrossRef] [Green Version]
- Agustí-Juan, I.; Habert, G. Environmental design guidelines for digital fabrication. J. Clean. Prod. 2017, 142, 2780–2791. [Google Scholar] [CrossRef] [Green Version]
- Hoffmann, M.; Skibicki, S.; Pankratow, P.; Zieliński, A.; Pajor, M.; Techman, M. Automation in the Construction of a 3D-Printed Concrete Wall with the Use of a Lintel Gripper. Materials 2020, 13, 1800. [Google Scholar] [CrossRef] [Green Version]
- Kaszynska, M.; Skibicki, S. Influence of Eco-Friendly Mineral Additives on Early Age Compressive Strength and Temperature Development of High-Performance Concrete. IOP Conf. Ser. Earth Environ. Sci. 2017, 95, 42060. [Google Scholar] [CrossRef]
- Lu, B.; Weng, Y.; Li, M.; Qian, Y.; Leong, K.F.; Tan, M.J.; Qian, S. A systematical review of 3D printable cementitious materials. Constr. Build. Mater. 2019, 207, 477–490. [Google Scholar] [CrossRef]
- Sikora, P.; Cendrowski, K.; Abd Elrahman, M.; Chung, S.-Y.; Mijowska, E.; Stephan, D. The effects of seawater on the hydration, microstructure and strength development of Portland cement pastes incorporating colloidal silica. Appl. Nanosci. 2019, 3, 339. [Google Scholar] [CrossRef] [Green Version]
- Zdeb, T.; Sliwinski, J. The Influence of Selected Material and Technological Factors on Mechanical Properties and Microstructure of Reactive Powder Concrete (RPC)/Wpływ Wybranych Czynników Materiałowych I Technologicznych Na Własciwosci Mechaniczne I Mikrostrukture Betonów Z Proszków Reaktywnych (BPR). Arch. Civ. Eng. 2011, 57, 227–246. [Google Scholar] [CrossRef]
- Zieliński, A.; Federowicz, K.; Kaszyńska, M.; Urbańska-Galewska, E. Comparison of calculation models’ estimates with actual measured autogenous shrinkage in High-Performance Cement Composites. MATEC Web. Conf. 2018, 219, 3009. [Google Scholar] [CrossRef]
- Bong, S.H.; Nematollahi, B.; Nazari, A.; Ming, X.; Sanjayan, J.G. Fresh and Hardened Properties of 3D Printable Geopolymer Cured in Ambient Temperature. In First RILEM International Conference on Concrete and Digital Fabrication—Digital Concrete 2018; Wangler, T., Flatt, R., Eds.; Springer: Cham, Switzerland, 2019; ISBN 3319995189. [Google Scholar]
- CEN. Methods of Test for Mortar for Masonry—Part 3: Determination of Consistence of Fresh Mortar (by Flow Table); Technical Report No. CEN-EN 1015-3; CEN: Brussels, Belgium, 1999. [Google Scholar]
- CEN. Methods of Test for Mortar for Masonry—Part 11: Determination of Flexural and Compressive Strength of Hardened Mortar; Technical Report No. CEN-EN 1015-11; CEN: Brussels, Belgium, 2019. [Google Scholar]
- Toutou, Z.; Roussel, N.; Lanos, C. The squeezing test: A tool to identify firm cement-based material’s rheological behaviour and evaluate their extrusion ability. Cem. Concr. Res. 2005, 35, 1891–1899. [Google Scholar] [CrossRef]
- Skibicki, S.; Kaszyńska, M.; Wahib, N.; Techman, M.; Federowicz, K.; Zieliński, A.; Wróblewski, T.; Olczyk, N.; Hoffmann, M. Properties of Composite Modified with Limestone Powder for 3D Concrete Printing. In Second RILEM International Conference on Concrete and Digital Fabrication; Bos, F.P., Lucas, S.S., Wolfs, R.J., Salet, T.A., Eds.; Springe: Cham, Switzerland, 2020; pp. 125–134. ISBN 978-3-030-49916-7. [Google Scholar]
- Cho, S.; Kruger, J.; Bester, F.; van den Heever, M.; van Rooyen, A.; van Zijl, G. A Compendious Rheo-Mechanical Test for Printability Assessment of 3D Printable Concrete. In Second RILEM International Conference on Concrete and Digital Fabrication; Bos, F.P., Lucas, S.S., Wolfs, R.J., Salet, T.A., Eds.; Springer: Cham, Switzerland, 2020; pp. 196–205. ISBN 978-3-030-49916-7. [Google Scholar]
- CEN. Testing Fresh Concrete. Slump Test; Technical Report No. CEN-EN 12350-2; CEN: Brussels, Belgium, 2019. [Google Scholar]
- Mechtcherine, V.; Bos, F.P.; Perrot, A.; da Silva, W.L.; Nerella, V.N.; Fataei, S.; Wolfs, R.; Sonebi, M.; Roussel, N. Extrusion-based additive manufacturing with cement-based materials—Production steps, processes, and their underlying physics: A review. Cem. Concr. Res. 2020, 132, 106037. [Google Scholar] [CrossRef]
- Duballet, R.; Gosselin, C.; Roux, P. Additive Manufacturing and Multi-Objective Optimization of Graded Polystyrene Aggregate Concrete Structures. In Modelling Behaviour; Thomsen, M., Tamke, M., Gengnagel, C., Faircloth, B., Scheurer, F., Eds.; Springer: Cham, Switzerland, 2015. [Google Scholar]
- Chen, Y.; Li, Z.; Figueiredo, S.C.; Çopuroğlu, O.; Veer, F.; Schlangen, E. Limestone and Calcined Clay-Based Sustainable Cementitious Materials for 3D Concrete Printing: A Fundamental Study of Extrudability and Early-Age Strength Development. Appl. Sci. 2019, 9, 1809. [Google Scholar] [CrossRef] [Green Version]
- Tao, Y.; Lesage, K.; van Tittelboom, K.; Yuan, Y.; Schutter, G.D. Effect of Limestone Powder Substitution on Fresh and Hardened Properties of 3D Printable Mortar. In Second RILEM International Conference on Concrete and Digital Fabrication; Bos, F.P., Lucas, S.S., Wolfs, R.J., Salet, T.A., Eds.; Springer: Cham, Switzerland, 2020; pp. 135–143. ISBN 978-3-030-49916-7. [Google Scholar]
- Matthäus, C.; Back, D.; Weger, D.; Kränkel, T.; Scheydt, J.; Gehlen, C. Effect of Cement Type and Limestone Powder Content on Extrudability of Lightweight Concrete. In Second RILEM International Conference on Concrete and Digital Fabrication; Bos, F.P., Lucas, S.S., Wolfs, R.J., Salet, T.A., Eds.; Springer: Cham, Switzerland, 2020; pp. 312–322. ISBN 978-3-030-49916-7. [Google Scholar]
- Chen, C.; Habert, G.; Bouzidi, Y.; Jullien, A.; Ventura, A. LCA allocation procedure used as an incitative method for waste recycling: An application to mineral additions in concrete. Resour. Conserv. Recycl. 2010, 54, 1231–1240. [Google Scholar] [CrossRef] [Green Version]
- Van den Heeden, P.; Maes, M.; De Belie, N. Influence of active crack width control on the chloride penetration resistance and global warming potential of slabs made with fly ash + silica fume concrete. Constr. Build. Mater. 2014, 67, 74–80. [Google Scholar] [CrossRef]
- ACI. EcoConcrete Calculation Tool; ACI: Farmington Hills, MI, USA, 2018; Available online: https://www.concrete.org/students/studentcompetitions/ecoconcretecompetition.aspx (accessed on 10 December 2019).
- Bistyp. Informative Price List of Building Materials. In Estimated Labor and Equipment Rental Rates; 1st Quarter of the Year; Wolters Kluwer: Warsaw, Poland, 2020. [Google Scholar]
- eBistyp On-Line. Informative Price List of Building Materials. Estimated Labor and Equipment Rental Rates. Available online: borg.wolterskluwer.pl (accessed on 5 April 2020).
- Narodowy Bank Polski (The Central Bank of the Republic of Poland)—Official Website. Available online: https://www.nbp.pl/homen.aspx?f=/kursy/ratesa.html (accessed on 30 June 2020).
Figure 1.
(a) scheme of analyzed wall fragment; (b) scheme of the specimen which was used in the squeezing test (printing simulation test).
Figure 1.
(a) scheme of analyzed wall fragment; (b) scheme of the specimen which was used in the squeezing test (printing simulation test).

Figure 2.
Sample during the squeezing test: (a) first stage of test (small load); (b) end of test (the specimen failure).
Figure 2.
Sample during the squeezing test: (a) first stage of test (small load); (b) end of test (the specimen failure).

Figure 3.
Plan (a) and side view (b) of printed columns.

Figure 4.
Test stand for compressive strength evaluation of printed structures.

Figure 5.
Slump flow test results.

Figure 6.
Compressive strength results.

Figure 7.
Stress–strain relations for mixes B840/SF/FA/LP.

Figure 8.
Stress–strain relations for mixes B840.

Figure 9.
Stress–strain relations for mixes B640/SF/FA.

Figure 10.
Stress–strain relations for mixes B640.

Figure 11.
Analysis of specimen failure during the squeezing test—example 1.

Figure 12.
Analysis of specimen failure during the squeezing test—example 2.

Figure 13.
Comparison of the results of the squeezing test. (a) = 15 min; (b) = 30 min; (c) = 45 min; (d) legend.
Figure 13.
Comparison of the results of the squeezing test. (a) = 15 min; (b) = 30 min; (c) = 45 min; (d) legend.


Figure 14.
Collapse during printing for specimens of mix B840/SF/FA/LP. (a) ; ; (b); ; (c) ; .

Figure 15.
Collapse during printing for specimens of mix B640/SF/FA/LP. (a) ; ; (b); ; (c) ; .

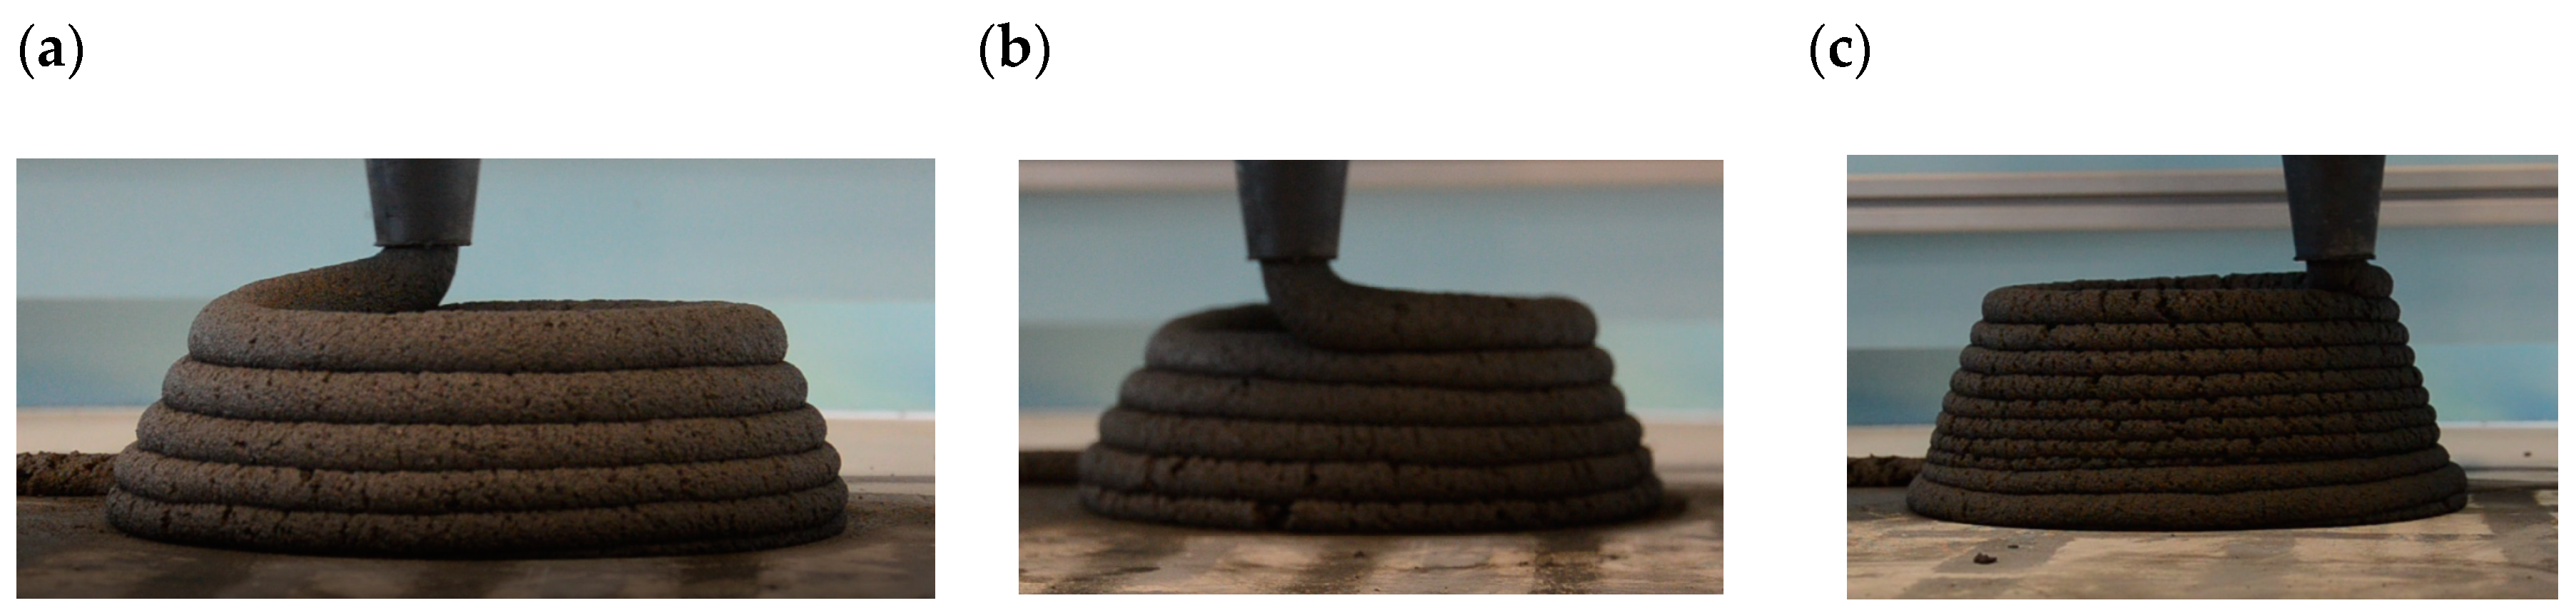
Figure 16.
Collapse during printing for specimens of mix B640/SF/FA. (a) ; ; (b); ; (c) ; .

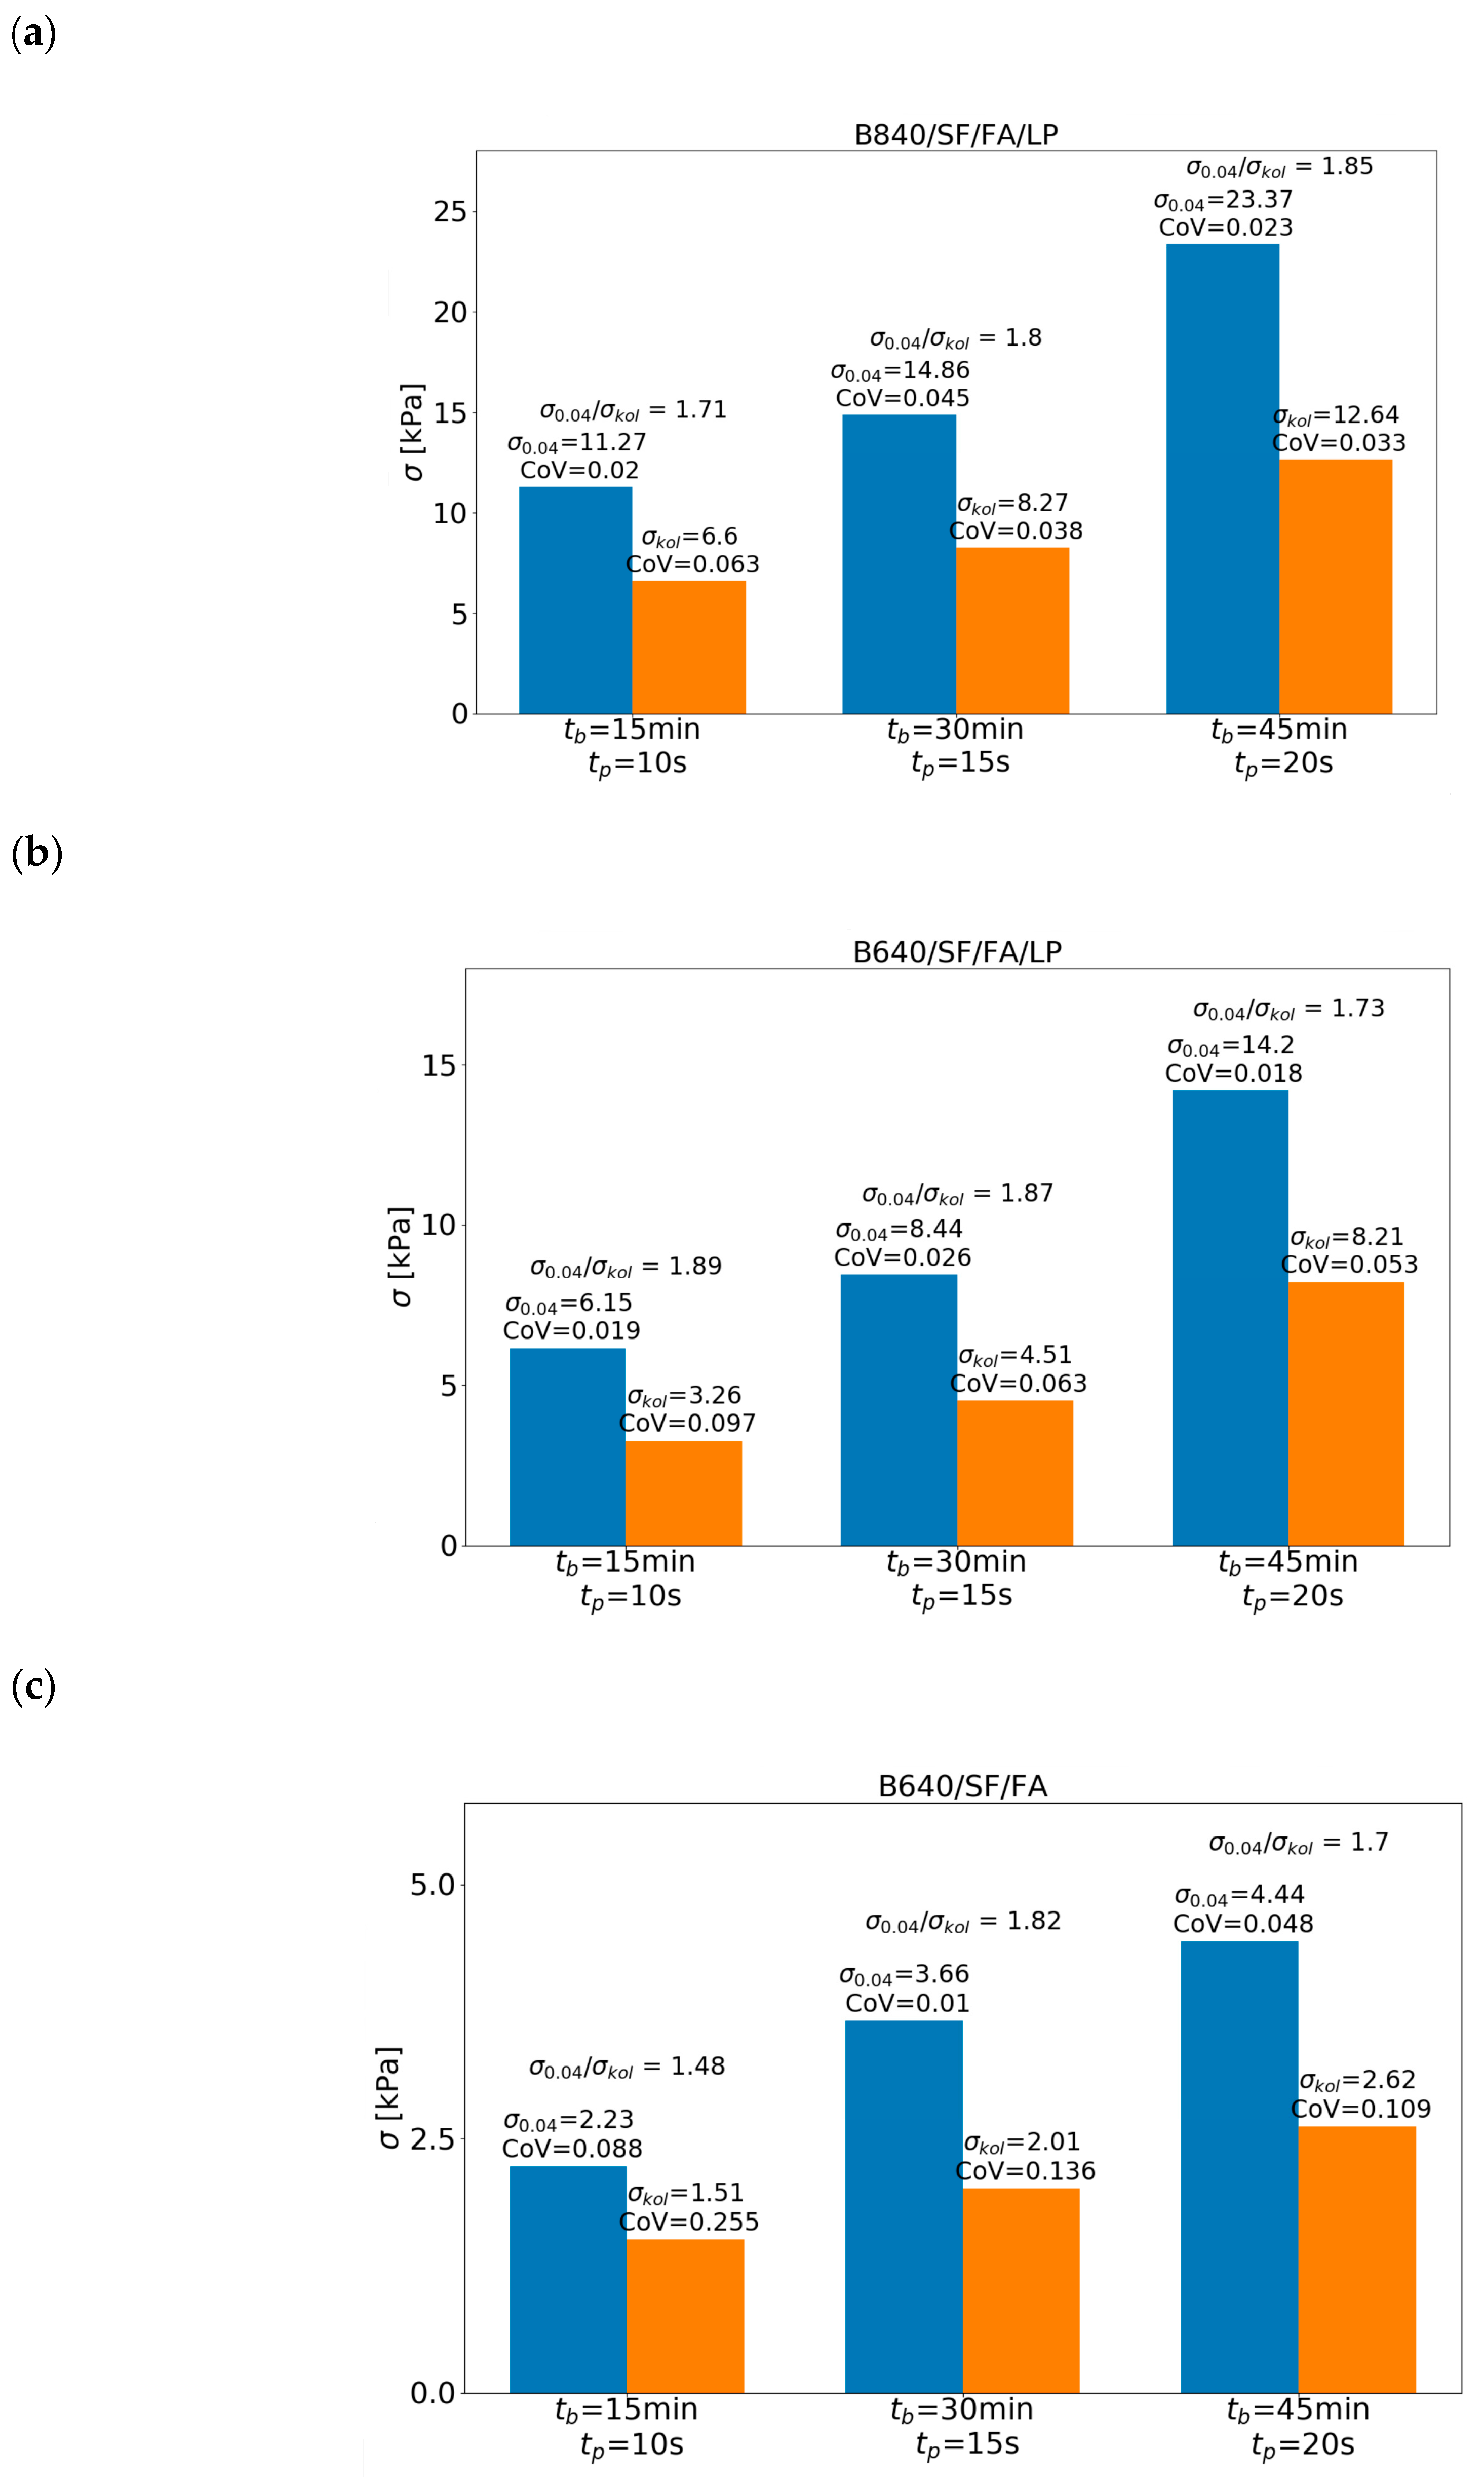
Figure 17.
The comparison of load-bearing capacity calculated based on the time of collapse of the columns and obtained in the printing simulation test. (a) B840/SF/FA/LP; (b) B840/SF/FA/LP; (c) B640/SF/FA.
Figure 17.
The comparison of load-bearing capacity calculated based on the time of collapse of the columns and obtained in the printing simulation test. (a) B840/SF/FA/LP; (b) B840/SF/FA/LP; (c) B640/SF/FA.

Figure 18.
Column printed out of B840/SF/FA/LP: (a) after printing; (b) after compression test.

Figure 19.
Comparison of compressive strength of columns after 10 h.

Figure 20.
Comparison of compressive strength of printed columns with the results of compressive strength of standard cubes after 10 h.
Figure 20.
Comparison of compressive strength of printed columns with the results of compressive strength of standard cubes after 10 h.

Figure 21.
Cross sections of printed column: (a) B840/SF/FA/LP; (b) B640/SF/FA/LP; (c) B640/SF/FA.


Table 1.
Composition and notification of concrete mixes.
| Concrete | CEM I 52.5R (kg/m3) | SCM (kg/m3) | Water (kg/m3) | SP (kg/m3) | LP (kg/m3) | Fine Aggregate (kg/m3) | |
|---|---|---|---|---|---|---|---|
| Fly Ash | Silica Fume | ||||||
| B840/SF/FA/LP | 588 | 168 | 84 | 232 | 2.0 | 247 | 989 |
| B840/SF/FA | 588 | 168 | 84 | 232 | 1.6 | – | 1233 |
| B840/LP | 840 | – | – | 232 | 1.8 | 262 | 1047 |
| B840 | 840 | – | – | 232 | 0.5 | – | 1304 |
| B640/SF/FA/LP | 448 | 128 | 64 | 179.2 | 2.2 | 315 | 1258 |
| B640/SF/FA | 448 | 128 | 64 | 179.2 | 3.0 | – | 1568 |
| B640/LP | 640 | – | – | 179.2 | 2.1 | 325 | 1302 |
| B640 | 640 | – | – | 179.2 | 1.8 | – | 1623 |
Table 2.
Chemical composition of Portland Cement, Fly Ash, Limestone powder and Silica Fume.
| Chemical Composition, % | CEM I 52,5 R | Fly Ash | Limestone Powder | Silica Fume |
|---|---|---|---|---|
| SiO2 | 19.70 | 54.00 | – | 94.00 |
| Al2O3 | 4.93 | 28.40 | – | – |
| Fe2O3 | 2.54 | 7.30 | 0.80 | – |
| CaO | 64.23 | 3.10 | – | 0.30 |
| CaCo3 | – | – | 97.5 | – |
| MgO | 1.32 | 2.40 | 0.90 | – |
| SO3 | 2.91 | 0.40 | – | 1.90 |
| Na2O | 0.12 | 1.10 | – | – |
| K2O | 0.76 | 2.90 | – | – |
| Cl- | 0.07 | 0.01 | – | 0.10 |
| H2O | – | – | – | 0.70 |
| Na20eq | 0.63 | – | – | – |
| LOI | – | – | – | 3.00 |
Table 3.
Detailed results of the compressive strength of concrete.
| Mieszanka | 10 h | 24 h | 72 h | 168 h | 672 h | |||||
|---|---|---|---|---|---|---|---|---|---|---|
| fc,i,j (MPa) | CoV (%) | fc,i,j (MPa) | CoV (%) | fc,i,j (MPa) | CoV (%) | fc,i,j (MPa) | CoV (%) | fc,i,j (MPa) | CoV (%) | |
| B840/SF/FA/LP | 13.37 | 3.0 | 43.72 | 7.8 | 64.26 | 4.6 | 76.10 | 5.6 | 100.85 | 4.5 |
| B840/LP | 10.90 | 6.8 | 37.41 | 5.7 | 52.59 | 2.1 | 70.00 | 2.0 | 95.94 | 6.6 |
| B840/SF/FA | 11.84 | 8.0 | 52.63 | 6.1 | 73.94 | 4.5 | 87.89 | 3.2 | 102.29 | 4.7 |
| B840 | 10.53 | 7.2 | 36.83 | 5.8 | 63.01 | 7.5 | 76.10 | 5.5 | 91.14 | 5.1 |
| B640/SF/FA/LP | 7.28 | 8.5 | 35.45 | 6.1 | 48.45 | 4.6 | 59.44 | 4.5 | 80.50 | 6.7 |
| B640/LP | 7.63 | 7.2 | 28.91 | 7.3 | 43.84 | 7.7 | 57.13 | 5.4 | 63.98 | 3.9 |
| B640/SF/FA | 5.98 | 3.8 | 32.55 | 5.7 | 43.85 | 6.6 | 55.70 | 4.6 | 75.45 | 2.4 |
| B640 | 6.44 | 5.0 | 36.66 | 5.9 | 44.42 | 3.7 | 52.80 | 3.5 | 58.60 | 6.6 |
Table 4.
Evaluation of the compressive strength of concrete.
| Time [h] | Parameter | Mix | |||||||
|---|---|---|---|---|---|---|---|---|---|
| B840/SF/FA/LP | B840/LP | B840/SF/FA | B840 | B640/SF/FA/LP | B640/LP | B640/SF/FA | B640 | ||
| 10 | fc,i,j (MPa) | 13.37 | 6.64 | 9.84 | 6.82 | 10.29 | 7.63 | 5.69 | 6.44 |
| fc,i,j/fc,mean (-) | 0.27 | 0.13 | 0.20 | 0.14 | 0.20 | 0.15 | 0.11 | 0.13 | |
| 24 | fc,i,j [MPa] | 43.72 | 37.41 | 52.63 | 36.83 | 35.45 | 28.91 | 32.55 | 36.66 |
| fc,i,j/fc,mean (-) | 0.87 | 0.74 | 1.04 | 0.73 | 0.70 | 0.57 | 0.65 | 0.73 | |
| 72 | fc,i,j [MPa] | 64.26 | 52.59 | 73.94 | 63.01 | 48.45 | 43.84 | 48.85 | 44.42 |
| fc,i,j/fc,mean (-) | 1.27 | 1.04 | 1.47 | 1.25 | 0.96 | 0.87 | 0.97 | 0.88 | |
| 168 | fc,i,j (MPa) | 76.10 | 70.00 | 87.89 | 76.10 | 59.44 | 57.13 | 55.70 | 52.80 |
| fc,i,j/fc,mean (-) | 1.51 | 1.39 | 1.74 | 1.51 | 1.18 | 1.13 | 1.11 | 1.05 | |
| 672 | fc,i,j (MPa] | 100.85 | 95.94 | 102.29 | 91.14 | 82.50 | 63.98 | 75.45 | 58.60 |
| fc,i,j/fc,mean (-) | 2.00 | 1.90 | 2.03 | 1.81 | 1.64 | 1.27 | 1.50 | 1.16 | |
| CSEi (-) | 1.18 | 1.04 | 1.30 | 1.09 | 0.94 | 0.80 | 0.87 | 0.79 | |
Table 5.
Comparison of fresh concrete compressive strength.
| Time | Parameter | Mix | ||||||||
|---|---|---|---|---|---|---|---|---|---|---|
| B840/SF/FA/LP | B840/LP | B840/SF/FA | B840 | B640/SF/FA/LP | B640/LP | B640/SF/FA | B640 | |||
| = 15 min | = 10 s | 0.04,i,j (kPa) | 11.27 | 9.98 | 7.64 | 5.02 | 6.15 | 5.14 | 2.23 | 2.47 |
| 0.04,i,j/mean (-) | 1.23 | 1.09 | 0.83 | 0.55 | 0.67 | 0.56 | 0.24 | 0.27 | ||
| = 15 s | 0.04,i,j (kPa) | 11.84 | 11.07 | 8.34 | 5.59 | 6.15 | 6.03 | 2.61 | 2.58 | |
| 0.04,i,j/mean (-) | 1.29 | 1.21 | 0.91 | 0.61 | 0.67 | 0.66 | 0.28 | 0.28 | ||
| = 20 s | 0.04,i,j (kPa) | 14.22 | 14.01 | 11.08 | 8.84 | 8.64 | 9.59 | 3.71 | 3.60 | |
| 0.04,i,j/mean (-) | 1.55 | 1.53 | 1.21 | 0.96 | 0.94 | 1.05 | 0.40 | 0.39 | ||
| = 30 min | = 10 s | 0.04,i,j (kPa) | 13.25 | 12.45 | 8.43 | 5.93 | 6.75 | 6.44 | 2.72 | 2.37 |
| 0.04,i,j/mean (-) | 1.44 | 1.36 | 0.92 | 0.65 | 0.74 | 0.70 | 0.30 | 0.26 | ||
| = 15 s | 0.04,i,j (kPa) | 14.86 | 13.06 | 9.73 | 7.58 | 8.45 | 7.87 | 3.66 | 3.40 | |
| 0.04,i,j/mean (-) | 1.62 | 1.42 | 1.06 | 0.83 | 0.92 | 0.86 | 0.40 | 0.37 | ||
| = 20 s | 0.04,i,j (kPa) | 16.98 | 15.14 | 13.14 | 10.28 | 10.76 | 10.85 | 4.31 | 3.93 | |
| 0.04,i,j/mean (-) | 1.85 | 1.65 | 1.43 | 1.12 | 1.17 | 1.18 | 0.47 | 0.43 | ||
| = 45 min | = 10 s | 0.04,i,j (kPa) | 16.44 | 14.10 | 10.24 | 7.01 | 10.08 | 9.43 | 3.05 | 3.17 |
| 0.04,i,j/mean (-) | 1.79 | 1.54 | 1.12 | 0.76 | 1.10 | 1.03 | 0.33 | 0.35 | ||
| = 15 s | 0.04,i,j (kPa) | 18.25 | 16.47 | 12.77 | 8.95 | 11.46 | 11.32 | 3.66 | 4.15 | |
| 0.04,i,j/mean (-) | 1.99 | 1.80 | 1.39 | 0.98 | 1.25 | 1.23 | 0.40 | 0.45 | ||
| = 20 s | 0.04,i,j (kPa) | 23.37 | 21.62 | 15.78 | 11.29 | 14.20 | 14.49 | 4.44 | 4.63 | |
| 0.04,i,j/mean (-) | 2.55 | 2.36 | 1.72 | 1.23 | 1.55 | 1.58 | 0.48 | 0.50 | ||
| MSEi(-) | 1.70 | 1.55 | 1.18 | 0.85 | 1.00 | 0.98 | 0.37 | 0.37 | ||
Table 6.
The comparison of load-bearing capacity calculated based on the time of collapse of the columns and obtained in the printing simulation test (squeezing test).
Table 6.
The comparison of load-bearing capacity calculated based on the time of collapse of the columns and obtained in the printing simulation test (squeezing test).
| Mix | Results of Printed Column | Results of Squeezing Test of Small Specimen (h = 35 mm, d = 60 mm) | σsr,0.04 / σsr,kol | ||||
|---|---|---|---|---|---|---|---|
| σsr,kol (kPa) | CoV (-) | σsr,0.04 (kPa) | CoV (-) | ||||
| B840/SF/FA/LP | 15 | 10 | 6.60 | 0.063 | 11.27 | 0.002 | 1.71 |
| 30 | 15 | 8.27 | 0.038 | 14.86 | 0.045 | 1.80 | |
| 45 | 20 | 12.64 | 0.033 | 23.37 | 0.023 | 1.85 | |
| B640/SF/FA/LP | 15 | 10 | 3.12 | 0.091 | 6.15 | 0.019 | 1.97 |
| 30 | 15 | 4.51 | 0.063 | 8.44 | 0.026 | 1.87 | |
| 45 | 20 | 8.21 | 0.053 | 14.20 | 0.018 | 1.73 | |
| B640/SF/FA | 15 | 10 | 1.51 | 0.255 | 2.23 | 0.088 | 1.48 |
| 30 | 15 | 2.01 | 0.136 | 3.66 | 0.008 | 1.82 | |
| 45 | 20 | 2.62 | 0.109 | 4.44 | 0.048 | 1.70 | |
Table 7.
Comparison of the Environmental Impact of mixes.
| Mix | Global Warming (kg CO2eq) | EIEi,j = 2 (-) | Carcinogenic (CTUh) | EIEi,j = 4 (-) | Ozone Depletion (kg CFC-11eq) | EIEi,j = 6 (-) | Ecotoxicity (CTUe) | EIEi,j = 8 (-) | Fossil Fuel Depletion (MJ) | EIEi,j = 10 (-) | EIEmean,i |
|---|---|---|---|---|---|---|---|---|---|---|---|
| B840/SF/FA/LP | 604.07 | 1.00 | 1.19 × 10⁻⁵ | 1.27 | 2.61 × 10⁻⁵ | 1.03 | 1264.97 | 1.22 | 231.18 | 1.01 | 1.10 |
| B840/SF/FA | 604.04 | 1.00 | 1.19 × 10⁻⁵ | 1.27 | 2.61 × 10⁻⁵ | 1.03 | 1264.74 | 1.22 | 231.07 | 1.01 | 1.10 |
| B840/LP | 761.10 | 1.26 | 9.22 × 10⁻⁶ | 0.98 | 3.10 × 10⁻⁵ | 1.22 | 1068.57 | 1.03 | 286.72 | 1.25 | 1.15 |
| B840 | 761.72 | 1.26 | 9.29 × 10⁻⁶ | 0.99 | 3.12 × 10⁻⁵ | 1.23 | 1075.34 | 1.04 | 287.81 | 1.25 | 1.15 |
| B640/SF/FA/LP | 461.75 | 0.77 | 9.25 × 10⁻⁶ | 0.98 | 2.03 × 10⁻⁵ | 0.80 | 980.55 | 0.95 | 178.81 | 0.78 | 0.85 |
| B640/SF/FA | 461.71 | 0.77 | 9.24 × 10⁻⁶ | 0.98 | 2.03 × 10⁻⁵ | 0.80 | 980.17 | 0.94 | 178.66 | 0.78 | 0.85 |
| B640/LP | 581.09 | 0.96 | 7.16 × 10⁻⁶ | 0.76 | 2.40 × 10⁻⁵ | 0.94 | 827.60 | 0.80 | 220.56 | 0.96 | 0.89 |
| B640 | 581.85 | 0.97 | 7.25 × 10⁻⁶ | 0.77 | 2.42 × 10⁻⁵ | 0.95 | 835.89 | 0.81 | 221.89 | 0.97 | 0.89 |
| EImean,j | 602.17 | - | 9.41 × 10⁻⁶ | - | 2.54 × 10⁻⁵ | - | 1037.23 | - | 229.59 | - | - |
Table 8.
Unit environmental impact for used materials.
| Material | Global Warming (kg CO2eq/kg) | Carcinogenic (CTUh/kg) | Ozone Depletion (kg CFC-11eq/kg) | Ecotoxicity (CTUe/kg) | Fossil Fuel Depletion (MJ/kg) |
|---|---|---|---|---|---|
| CEM I 52.5R | 0.903 | 1.06 × 10⁻⁸ | 3.61 × 10⁻⁸ | 1.19 | 0.336 |
| Water | 0.0002 | 1.35 × 10⁻¹⁰ | 2.04 × 10⁻¹¹ | 0.179 | 0.0002 |
| Fine Aggregate | 0.0024 | 2.73 × 10⁻¹⁰ | 6.63 × 10⁻¹⁰ | 0.026 | 0.0042 |
| Fly ash | 0.15 | 8.87 × 10⁻⁹ | 4.25 × 10⁻⁹ | 0.764 | 0.0291 |
| Silica Fume | 0.534 | 4.54 × 10⁻⁸ | 4.00 × 10⁻⁸ | 4.32 | 0.278 |
| Limestone powder | 0.002448 | 3.00 × 10⁻¹⁰ | 6.9615 × 10⁻¹⁰ | 0.02652 | 0.004578 |
Table 9.
Price of mixes.
| Mix | Cost (€/m3) | CEi (-) |
|---|---|---|
| B840/SF/FA/LP | 99.34 | 1.10 |
| B840/SF/FA | 93.95 | 1.04 |
| B840/LP | 103.52 | 1.15 |
| B840 | 95.54 | 1.06 |
| B640/SF/FA/LP | 83.17 | 0.92 |
| B640/SF/FA | 79.73 | 0.88 |
| B640/LP | 86.33 | 0.96 |
| B640 | 79.97 | 0.89 |
| Cmean | 90.19 | – |
Table 10.
Unit price of materials.
| Material | Cost (€/kg) | Source | Price Date |
|---|---|---|---|
| CEM I 52,5 R | 0.103 | price lists [91] | 04.2020 |
| Superplasticizer | 2.697 | manufacturers’ prices [92] | 04.2020 |
| Silica Fume | 0.207 | manufacturers’ prices [92] | 04.2020 |
| Fly Ash | 0.027 | manufacturers’ prices [92] | 04.2020 |
| Fine aggregate | 0.005 | manufacturers’ prices [92] | 04.2020 |
| Limestone Powder | 0.022 | manufacturers’ prices [92] | 04.2020 |
| Water | 0.001 | price lists [91] | 04.2020 |
Table 11.
Final evaluation of mixes potentially suitable for 3D printing.
| Parameter | Description | Mix | |||||||
|---|---|---|---|---|---|---|---|---|---|
| B840/SF/FA/LP | B840/LP | B840/SF/FA | B840 | B640/SF/FA/LP | B640/LP | B640/SF/FA | B640 | ||
| (EIEmean,i)−1 | environmental impact | 0.90 | 0.91 | 0.87 | 0.87 | 1.17 | 1.17 | 1.13 | 1.12 |
| (CEi)−1 | cost analysis | 0.91 | 0.96 | 0.87 | 0.94 | 1.08 | 1.13 | 1.04 | 1.13 |
| MSEi | strength evaluation of mixes | 1.70 | 1.55 | 1.18 | 0.85 | 1.00 | 0.98 | 0.37 | 0.37 |
| CSEi | strength evaluation of concretes | 1.18 | 1.04 | 1.30 | 1.09 | 0.94 | 0.80 | 0.87 | 0.79 |
| FEi (final evaluation) | 1.17 | 1.11 | 1.05 | 0.94 | 1.05 | 1.02 | 0.85 | 0.85 | |
Publisher’s Note: MDPI stays neutral with regard to jurisdictional claims in published maps and institutional affiliations. |
© 2020 by the authors. Licensee MDPI, Basel, Switzerland. This article is an open access article distributed under the terms and conditions of the Creative Commons Attribution (CC BY) license (http://creativecommons.org/licenses/by/4.0/).
Share and Cite
MDPI and ACS Style
Kaszyńska, M.; Skibicki, S.; Hoffmann, M. 3D Concrete Printing for Sustainable Construction. Energies 2020, 13, 6351. https://doi.org/10.3390/en13236351
AMA Style
Kaszyńska M, Skibicki S, Hoffmann M. 3D Concrete Printing for Sustainable Construction. Energies. 2020; 13(23):6351. https://doi.org/10.3390/en13236351
Chicago/Turabian StyleKaszyńska, Maria, Szymon Skibicki, and Marcin Hoffmann. 2020. "3D Concrete Printing for Sustainable Construction" Energies 13, no. 23: 6351. https://doi.org/10.3390/en13236351
Note that from the first issue of 2016, this journal uses article numbers instead of page numbers. See further details here.