Prospective Environmental Impacts of Passenger Cars under Different Energy and Steel Production Scenarios


1
Electrotechnical Engineering and Energy Technology, MOBI Research Group, Vrije Universiteit Brussel, Pleinlaan 2, 1050 Brussels, Belgium
2
Flanders Make, 3001 Heverlee, Belgium
3
Statistics Sweden, Solna Strandväg 86, SE-171 54 Solna, Sweden
4
Energyville-VITO, Boeretang 200, 2400 Mol, Belgium
*
Author to whom correspondence should be addressed.
Energies 2020, 13(23), 6236; https://doi.org/10.3390/en13236236
Submission received: 10 October 2020
/
Revised: 22 November 2020
/
Accepted: 24 November 2020
/
Published: 26 November 2020
(This article belongs to the Special Issue Environmental Life Cycle Assessment of Electric Vehicles)
Abstract
:The potential environmental impacts of producing and using future electric vehicles (EVs) are important given their expected role in mitigating global climate change and local air pollutants. Recently, studies have begun assessing the effect of potential future changes in EVs supply chains on overall environmental performance. This study contributes by integrating expected changes in future energy, iron, and steel production in the life cycle assessment (LCA) of EVs. In this light, the study examines the impacts of changes in these parameters on producing and charging future EVs. Future battery electric vehicles (BEV) could have a 36–53% lower global warming potential (GWP) compared to current BEV. The change in source of electricity generation accounts for 89% of GWP reductions over the BEV’s life cycle. Thus, it presents the highest GWP reduction potential of 35–48%. The use of hydrogen for direct reduction of iron in steelmaking (HDR-I) is expected to reduce vehicle production GWP by 17% compared to current technology. By accounting for 9% of the life cycle GWP reductions, HDR-I has the second-highest reduction potential (1.3–4.8%). The results also show that the potential for energy efficiency improvement measures for GWP reduction in vehicle and battery manufacture would be more beneficial when applied now than in the distant future (2050), when the CO2 intensity of the EU electricity is expected to be lower. Interestingly, under the same conditions, the high share of renewable energy in vehicle supply chains contributed to a decrease in all air pollution-related impact categories, but an increase in toxicity-related categories, as well as land use and water consumption.
1. Introduction
Passenger car transport is fundamentally changing, with vehicle electrification, connectivity, and automation among the leading technical evolutions [1]. Among these changes, vehicle electrification is mainly driven by the need to decarbonise the transport sector and reduce its contribution to global warming and air pollution [2,3]. The transport sector is responsible for 25% of global energy-related CO2 emissions [4]. In 2012 alone, the sector consumed about 28% of the global final energy demand, of which light-duty passenger vehicles consumed almost half (13%) [5]. Furthermore, fossil fuel remains the main source of primary energy for the transport sector [6]. The use of currently dominant transport technologies in the future will only increase the sector’s contribution to climate change and fossil resource depletion [2,3].
Considering the transport sector’s contribution to global greenhouse gas (GHG) emissions and the necessity to limit global warming to 1.5 °C above pre-industrial levels [3], emerging low-carbon technologies are necessary for the transportation sector, amongst other measures. Several alternative transport solutions have been suggested [7]. Electric vehicles (EVs) have attracted huge interest from governments and policymakers [8,9] as they do not give rise to tailpipe emissions and have shown significant potential to reduce GHG emissions when powered by a low-carbon electricity mix [10,11].
However, before deploying EVs globally, it is important to understand their potential environmental impacts from a life cycle perspective. Despite the significant progress in understanding the environmental impacts of current EVs [10], it is the understanding of the environmental performance of future EVs that is the most crucial for informing policy makers. Results from such studies would help to identify environmental hot spots for potential improvements, plausible scenarios for deploying future EVs, and risks for environmental burden shifting.
One way to further reduce GHG emissions in future vehicles is to reduce the production impact for passenger cars, because as EVs powertrains become more efficient and energy production becomes less CO2 intensive, production and end-of-life impacts would become significant in the future. There is growing evidence that the production and the end-of-life impacts of EVs are significant contributors to climate change, and that as a percentage of their overall life cycle impacts, can contribute up to 38%, when recycling is considered [12]. Messagie et al. [12] further revealed that GHG emissions due to production chains for electricity in vehicle manufacturing and steel production have a significant effect on the overall impacts of EVs production. Several other studies have confirmed the significance of electricity mix used in manufacture on the life cycle impact of EVs (e.g., [11,13,14]).
Life cycle assessment (LCA) is a fact-based analysis of a product’s life cycle impact in terms of environmental consequences. It has been widely used to estimate the environmental impacts of products, and its application to automotive technologies is widely accepted [15]. Several studies have applied LCA to assess the environmental impacts of current EVs, as shown in reviews by Nordelöf et al. [10] and Marmiroli et al. [16]. Characteristically of LCA, the different studies applied differing methodological approaches and assumptions, leading to varying numerical results. For example, GWP for current electric vehicles range between 27.5 to 326 g CO2 eq/km in literature [16]. Nevertheless, Nordelöf et al. [10] noted key learning outcomes for stakeholders: (i) the CO2 intensity of electricity for vehicle operation is the main cause of GWP, and (ii) environmental impacts of producing EVs are greater than for producing internal combustion engine vehicles (ICEV). Hawkins et al. [17] noted emissions of toxic materials from electric powertrain and battery manufacture as a potential drawback of EVs. This is confirmed by Messagie [18], showing large toxicity impacts from BEV powertrain, amounting to about 44% of the total human toxicity potential in the case considered. Mining activities of metals, nuclear power and coal, especially the disposal of tailings and mining spoils, are mainly responsible for toxicity impacts in these studies [17,18]. Other studies identified the lack of transparent data and inconsistent life cycle inventory (LCI) as a pressing problem in vehicle LCA [19]. In general, the scientific literature highlights the narrow focus on assessing GWP and energy impacts (e.g., cumulative energy demand), while ignoring other potentially significant categories, like toxicity, resource depletion, acidification, or land use. In addition to this, most studies agreed it has been found that the lack of clearly defined goal and scope, compounded by different underlying assumptions for electricity mix, and other key technical parameters (like vehicle mass, lifetimes, battery technologies etc.), are the main reasons for variability in the results [16,20].
Furthermore, most LCA studies assessed the state of the EVs at or around the time the study was performed, ignoring possible future developments. Nordelöf et al. [10] pointed to this as a key deficiency considering the expected improvements in EVs before they become a mature technology. Arvidsson et al. [21] also suggested that for emerging technologies, LCA requires the development of background and foreground datasets to reflect the future state of these technologies. Expected changes in the future EVs supply chain could include for instance: (a) a high share of renewable energy sources (RES) in the electricity mix; (b) changes to material production (e.g., fossil-free steel); (c) efficiency improvements in production processes; and (d) technological and efficiency improvements in the vehicles themselves.
Recently studies have started to examine these issues. For instance, Bauer et al. [22] accounted for the following advances in future vehicles: light-weighting, efficiency improvements, and increased energy densities for batteries. Additionally, the authors used future electricity mixes for future vehicle operations. They showed that GWP for future BEV could be reduced by 50% considering expected changes in future EVs supply chains. However, most of the background data for the future remained the same as for current conditions, which could overstate the environmental impacts of future vehicles. Notable exceptions are Cox et al. [11,14] and Beltran et al. [13].
Cox et al. [14] modelled future BEV from a global perspective for two different future scenarios in 2040 and accounted for the following advances in future vehicles: electricity mixes for both vehicle production and operation, light-weighting, efficiency improvements, and improved future vehicle performance. They estimated that future BEV would reduce climate impacts by 45% to 78% compared to current BEV. Recently, Cox et al. [11] confirmed such findings; they found that BEV had the largest potential to reduce GHG emission in future cases, with reductions ranging from −25% to −75% in 2040, depending on the energy scenario. Likewise, Beltran et al. [13], linked scenarios of the integrated assessment model IMAGE [23], with prospective life cycle inventories (LCI) parameters and accounted for future changes in both production and operation electricity mixes. They estimated that future BEV could reduce GHG emission by up to 75% in 2050. Yet, these studies did not consider the extra effect of changes to other economic sectors, e.g., future iron and steel production, on the potential impacts of future EVs.
The iron and steel industry is among the world’s largest energy-consuming industries and accounts for approximately 7% of global CO2 emissions [24]. To reduce GHG emissions, the sector is undergoing changes to significantly reduce impacts along its value chain. The biggest share of GHG emissions along iron and steel value chains comes from virgin steel production. With global demand for virgin steel likely to remain high, alternative production methods for iron and steel with significantly lower GHG emissions have been investigated [25,26,27,28]. Considering this, integrating expected future changes in iron and steel production into vehicle production could influence future vehicle production and life cycle impacts, since steel (including cast iron) makes up about 60% of the total mass of a car [29]. Despite this, according to the authors’ knowledge, such future changes in iron and steel production have not been considered in LCA studies for future vehicles yet.
Considering the identified research gaps in accounting for iron and steel production in LCA of future EVs, this work aims to systematically demonstrate and compare the potential for each of a range of future changes in the production and operation of EVs to contribute to reducing environmental impacts per driven km. To do this, reference EVs are modelled according to performance levels for average production systems in the European Union in 2016. The first future change examined is the electricity and heat production systems in future production and operation for electric vehicles. Secondly, future changes to steel production in vehicle manufacturing are investigated. Thirdly, the authors studied the effect of potential energy efficiency improvement in future vehicle manufacturing. The study offers a unique comparison and analysis of the potential future impact of technological changes related to EV production and use in the EU. By including changes in iron and steel production, the study also goes beyond existing work by improving understanding of potential impacts according to developments coherent with a low carbon future.
2. Materials and Methods
2.1. Scenarios
The life cycle environmental impact of all vehicles was investigated for a reference case and two scenarios: ModRES and HighRES. The reference case was based on the EU reference scenario 2016 for technological advances in vehicles, energy and GHG emissions [30]. It was assumed that GHG and RES targets for 2020 will be achieved and that climate policies agreed in 2014 will be implemented.
The ModRES scenario was built upon the reference case and assumed moderate integration of RES in the energy system, about 50% in 2050. Further, it assumed the continuation of existing policies through 2050, and that no new policy measures were introduced in the energy system besides those already agreed or implemented in the EU such as the Renewable Energy Directive, the Energy Efficiency Directive, and the Directive on the Promotion of Clean and Energy Efficient Road Transport Vehicles [31,32]. Energy demand in vehicle production was assumed to reduce by 10% compared to the reference case due to expected improvement in future production technologies [33].
The HighRES scenario is an ambitious policy future scenario with the specific target to limit global warming to 2 °C, which proposes an aspiring decarbonisation roadmap for the EU until 2050. The scenario includes stringent CO2 regulations and other ambitious climate policies such as switching to low-carbon heat-generating technologies (e.g., oil to gas), high renewable energy integration (at least 85%) in the 2050 electricity mix, and a high concentration of low-carbon vehicles [30,33]. Energy demand in vehicle production was assumed to reduce by 20% compared to the reference case due to expected improvement in future production technologies [33].
2.2. Life Cycle Assessment
An attributional LCA according to the ISO standard [34,35] was performed comparing the life cycle environmental impact of BEV and plug-in hybrid electric vehicles (P-HEV) to that of an internal combustion engine vehicle (ICEV) in Europe. The functional unit is one vehicle kilometre (vkm) driven under average European conditions, averaged over the service lifetime of the vehicle. Figure 1 shows a process flow diagram and system boundary that was used for modelling all vehicle alternatives. The system boundary includes resource extraction, vehicle production, vehicle operation, including material requirements for road production, and vehicle end-of-life. The vehicles’ end-of-life included the material and resources required for dismantling, and for emissions arising from the end-of-life pre-treatment. No further reuse or recycling were considered in the assessment.
Processes inside the box drawn with a dashed line, “processes with foreground data in this study”, in Figure 1, are processes where foreground data unique for this study have been used. These unique data were combined with background data from Ecoinvent 3.4 database [36] to provide complete life-cycle inventory. Processes outside the box drawn with a dashed line, “processes with foreground data in this study”, in Figure 1, were considered background processes and were modelled using data directly from the Ecoinvent 3.4 database [36].
Environmental impacts in this study were quantified using the midpoint hierarchical version of the ReCiPe 2016 impact assessment methodology [37]. It contains in total 18 midpoint indicators, of which GWP and human toxicity potential were considered in detail. The results of other impact categories are presented in the Supporting Materials for this paper.
2.2.1. Production
The total mass of the modelled gasoline ICEV is 1395.7 kg, based on the average mass of a European passenger car [38]. The mass proportion of the different ICEV components—i.e., glider, IC engine, fuel tank, and transmission, were calculated as fractions of the total vehicle mass (Table 1).
The BEV and PHEV gliders were assumed to weigh the same as the ICEV glider, 1091 kg (Table 1). The mass of the electric drivetrain was 82.2 kg [39]. The LCI for these components was based on the Ecoinvent 3.4 database. The Li-ion batteries used were assumed to have an energy density of 114 Wh/kg based on Notter et al. [40] and a capacity of 30 kWh and 15 kWh for the BEV and PHEV respectively. The authors are aware that the assumed energy storage capacity for the BEV is relatively small compared to the market in 2020. However, the study aims to compare small to lower medium range cars that are mostly used in city driving. In addition to this, the 30 kWh storage capacity can provide an approximate range of 120 km for the BEV, exceeding the highest average daily driving distance (80 km) for European car drivers [41,42]. For long distance trips, the problem of “range anxiety” has been reduced due to range-extender and fast charging options for BEV, plus the sustained roll-out of public charging infrastructure [43,44,45,46,47,48]. The rationale behind future BEV is that the expected increase in battery energy storage capacity combined with fast charging and high roll-out of public charging stations can overcome the dilemma of “range anxiety” in future scenarios. The BEV and PHEV were assumed to have the same electric drivetrain components. Likewise, the internal combustion engine of the PHEV was assumed to be the same as that of the ICEV.

Table 1.
Mass of vehicle components used in this study for all scenarios.
| Vehicle Component | Vehicle Type | References | ||
|---|---|---|---|---|
| PHEV | BEV | ICEV | ||
| Glider (kg) | 1091 | 1091 | 1091 | [22,38] |
| Fuel tank (kg) | 14 | - | 14 | [49], own assumption |
| Electric drivetrain (kg) | 82.2 | 82.2 | - | [39] |
| Battery capacity (kWh) | 15 | 30 | - | own assumption |
| Li-ion battery (kg) | 132 | 263 | - | |
| Li-ion battery specific energy (Wh/kg) | 114 | 114 | - | [40] |
| Engine/transmission (kg) | 290.7 | - | 290.7 | [17,22] |
| Total weight (kg) | 1609.9 | 1436.2 | 1395.7 | |
Although improvements in vehicle-specific technologies such as light-weighting and or tank-to-wheel efficiencies may occur in the future, they were not considered in this study. This was done to avoid the extra uncertainties due to these parameters and focus more specifically on others. In particular, future production processes for iron and steel were considered here. This also means that the estimated impact for future vehicles carried out in this study potentially underestimates possible reductions in environmental impacts for future EVs.
2.2.2. Operation
An average vehicle lifetime of 12 years and a lifetime mileage of 150,000 km [50] were assumed. Likewise, the Li-ion batteries were assumed to have the same lifetime as the vehicle. This was justified considering the car manufacturers’ warranties. For example, Nissan and Tesla guaranteed that their electric car batteries will last approximately 160,000 km [51,52]. This also falls within the range of average lifetime mileage of typical batteries found in the scientific literature [20].
The energy or fuel consumption of vehicles vary in real life compared to lab measurement and depend on several factors [53], which are beyond the scope of this paper. Therefore, it was assumed that the gasoline ICEV performs like that of a Mercedes-Benz A-class (Euro 5 standard) and consumes 5.7 L/100 km [54]. The electrical energy consumption was estimated to be 20 kWh/100 km for the BEV and 22 kWh/100 km for the PHEV, using results from the energy consumption model noted in Cox et al. [11] for cars of similar weight. This model considered parameters such as vehicle weight, rolling resistance, powertrain efficiency, and aerodynamic properties. The driving pattern was based on the world harmonized light vehicles test cycle (WLTC).
The PHEV can operate in either charge depleting or charge sustaining mode. A utility factor (UF) of 0.5 was assumed to define the share of driving in each mode, representing the EU average [55]. A UF of 0.5 implies our PHEV will drive on average 50% of its lifetime distance in charge depleting mode and 50% in charge sustaining mode.
The charging electricity mix for current and future electric vehicles was modelled to match the scenarios presented in Section 2.1—reference case EV charged with reference case electricity mix for the European Union, ModRES EV charged with ModRES electricity mix and HighRES EV charged with HighRES electricity mix (refer to Section 2.2.4 for details on these electricity mixes).
2.2.3. End-of-Life
In this study, the cut-off approach was used to model end-of-life (EoL). The cut-off was applied directly after waste collection and treatment; thus, recycling and upgrading were excluded. The cut-off point was chosen to harmonize with the cut-off point in the Ecoinvent 3.4 database for input processes for secondary materials in vehicle and battery production. Thus, the potential for recyclable materials to be used in new production was not considered in the calculations. Instead, only the collection and pre-treatment steps in EoL were included. This simplification will not change the relative GWP of the different vehicles, but it has been shown elsewhere that recycling could improve the performance of EVs, especially their batteries, in categories related to mineral resource depletion, particulate matter formation and toxicity [12,56].
2.2.4. Modification of Scenario-Based Electricity Mixes
The characteristics of the modelled electricity mixes for each of the three scenarios are shown in Figure 2. The reference case was based on the “2016 estimates”, while ModRES and HighRES scenarios were based on extrapolations to 2050 from the “new policies scenario” and the “sustainable development scenario” of the World Energy Outlook projections respectively [57]. Electricity mixes for future scenarios only accounted for changes in the shares of electricity-producing technologies; all other parameters, e.g., emission factors or improvement in plant efficiency, remain the same as in the reference case.
2.2.5. Modification of Scenario-Based Iron and Steel
The starting point to model future changes in iron and steel production is the storyline described in Herbst et al. [33] of expected developments in industry up to 2050. In the reference case, the blast furnace is the main production technology for iron. Production was assumed to occur in Europe, so the electricity mix used in the reference case for iron production is changed to match the reference case mix.
The ModRES scenario entailed an optimization of the blast furnace technology in the reference case. Thermal energy demand was reduced (coke, coal and natural gas) by 20% per kg of sinter iron, according to the “New Energy Externalities Developments for Sustainability (NEEDS) Integrated Project” [58]. In the pig iron production process, coke demand was further reduced by 20% [58]. In HighRES, crude iron was produced from iron ore by direct reduction with hydrogen (hereafter, hydrogen direct reduced iron (HDR-I)). To the authors’ knowledge, there was no complete LCI representing this process. Therefore, new LCI foreground data for this process was developed (Figure 3), based on the results of the Swedish pilot study—Hydrogen Breakthrough Ironmaking Technology (HYBRIT) [59]. It was assumed that hydrogen is produced by electrolysis and that electricity used in this process is based on a mix coherent with the HighRES scenario. Background data for infrastructure used in this process were based on the Ecoinvent 3.4 database.
The modifications made to the Ecoinvent processes for steel alloy production followed the schematic representation shown in Figure 4: (1) the processes for electricity mix used in producing the different steel alloys were replaced based on their counterpart scenario-electricity mix described in Section 2.2.1; (2) the processes for pig iron production were replaced by their counterpart—“reference case pig iron”, “ModRES pig iron”, and “HDR-I” for the different steel alloy processes in the reference case, ModRES and HighRES scenarios respectively. And (3), only in HighRES, we replaced 40% of natural gas with biomass to cover the demand for heat. This assumption was justified because biomass use in the industry sector is judged to increase significantly in ambitious scenarios for reduced carbon dioxide emissions in Herbst et al. [33]. This also follows projections that biomass is an important renewable energy carrier for heat provision in scenarios aiming for deep decarbonization [60].
3. Results and Discussion
The results of the prospective LCA for the three vehicles and the production impact according to changes in iron and steel and energy production based on the reference case and two future scenarios, ModRES and HighRES, are shown here.
3.1. Global Warming Potential
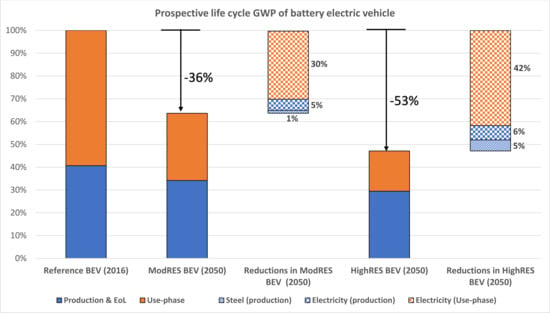
Figure 5 shows the GWP of driving 1 km for all vehicles and all scenarios considered in this study. It was found that in the reference case, the BEV, PHEV and ICEV had a GWP of 170 g CO2 eq/km, 221 g CO2 eq/km, and 257 g CO2 eq/km respectively. For the future BEV, a 36% and 53% reduction in total GWP in ModRES and HighRES scenarios respectively was found. Likewise, total GWP for the future PHEV was reduced by 15% and 23% in the ModRES and HighRES scenarios respectively. In the ICEV, small reductions of 2% and 5% in ModRES and HighRES were noted.
The production and EoL impacts in the future scenarios are less than those in the reference case. Figure 5 also shows that GWP impacts from BEV production and EoL decreased from 69 g CO2 eq/km in the reference case to 57 g CO2 eq/km in ModRES scenario and 49 g CO2 eq/km in HighRES scenario. Similar reductions from 64 g CO2 eq/km to 49 g CO2 eq/km in the future PHEV and from 49 g CO2 eq/km to 37 g CO2 eq/km in the future ICEV were noted. These reductions are due to future changes in steel and electricity production as shown in Figure 6. Overall, EVs (BEV and PHEV) were found to have a higher production impact compared to the ICEV in all scenarios (the orange & blue bars in Figure 5). This is generally driven by the high energy demand for Li-ion battery production. However, production and EoL impacts of future EVs are expected to further decrease due to expected improvements in lightweight materials for vehicles, battery energy density and reduced energy demand for li-ion battery production, which are not considered in future scenarios of this work.
Figure 6 shows that GWP of BEV production reduced from 6.74 kg CO2 eq/kg of BEV in the reference case to 5.69 kg CO2 eq/kg and 4.74 kg CO2 eq/kg in ModRES and HighRES scenarios, respectively. This also shows that GWP of producing the PHEV decreased from 6.89 kg CO2 eq/kg of PHEV in the reference case to 5.95 kg CO2 eq/kg and 5.02 kg CO2 eq/kg in ModRES and HighRES scenarios respectively. Similarly, the GWP of producing ICEV decreased from 6.2 kg CO2 eq/kg of ICEV in the reference case to 5.35 kg CO2 eq/kg and 4.47 kg CO2 eq/kg in ModRES and HighRES, respectively. These results are estimated based on vehicle masses considered in this study (See Table 1).
Figure 6 also shows that much of the reduction in the production GWP of future vehicles is linked to changes in production electricity mix (moving from A to B) and steel production (moving from E to F). In the case of future BEV, changing the source of electricity mix (i.e., moving from A to B in Figure 6) reduced production GWP by 10% in ModRES and 14% in HighRES. Similarly, a reduction of 8% to 11%, and 7% to 10% was noted in future PHEV and ICEV, respectively. The relatively large GWP reduction in future BEV compared to reductions in future PHEV and ICEV is due to reductions in impacts arising from battery production. This is an expected result, since battery production is electricity-intensive. This result has been shown in the literature, for example, Peter et al. [20]. These results confirm earlier findings that the GWP of the production electricity mix can significantly influence the climate impacts of vehicles [11,13,14].
The second-largest relative reduction in production GWP occurred due to changes in steel production (E to F in Figure 6). Reductions in GWP were noted of 4% and 17% in production for all vehicles in ModRES and HighRES scenarios, respectively. The relatively large reduction in HighRES is due to iron being produced by direct reduction with hydrogen. The hydrogen used in this process was assumed to be produced by electrolysis using electricity with very low GWP. This further highlights the importance of the electricity mix in the production impacts of future vehicles.
Changes between B and E in Figure 6 are small (2%) compared to those between A and B, and E and F. The small magnitude in GWP reduction is linked to the fact that the authors first modified the production electricity mixes in future scenarios before applying energy efficiency improvement in vehicle manufacture. This result implies that the potential of energy efficiency improvement measures for GWP reduction in vehicle manufacture would be more beneficial applied now than in the distant future (2050) when the energy system is expected to be less carbon intensive.
The use phase impact was significant for the total GWP for all vehicle technologies in the reference case. However, its impact on the total GWP significantly reduced in future BEV as the use-phase electricity mix becomes less CO2 intensive. A similar reduction is also evident in PHEV, which was expected. As Nordelöf et al. [10] noted already, the GWP intensity of the charging electricity is the main driver of climate impacts for BEV. GWP impacts due to gasoline production and consumption remained unchanged in future ICEV and PHEV since expected advances in the performance of future vehicles were excluded in our LCA. This approach is a modelling choice since the study’s focus is on expected changes in steel and electricity sectors. However, this result could change in the future due to expected advances in lightweight materials for vehicles and efficiency measures to reduce energy consumption in future cars.
3.2. Human Toxicity Potential
Results of human toxicity potential are reported in two categories: human carcinogenic toxicity (HCT) and human non-carcinogenic toxicity (HnCT), as shown in Figure 7. Both HCT and HnCT are driven by impacts from the production of vehicle equipment and batteries. The EVs (BEV and PHEV) performed less well than the ICEV in all scenarios due to the added burden of battery production. The results showed an increase in the toxicity impact categories for all future scenarios compared to the reference case. For BEV, PHEV, and ICEV respectively, HCT increased on average by 2%, 3% and 3.5% in future scenarios. Likewise, an average increase of 1%, 2% and 4% in HnCT for the future BEV, PHEV, and ICEV respectively were noted. These increases for future scenarios arise in the production and EoL stages. The increases are driven in particular by the electricity mix for steel production (especially the high demand for hydrogen production in the HighRES scenario). Therefore, vehicle and battery manufacture contributed a lot to the increase in both HCT and HnCT.
Human toxicity is also linked to waste from the digester sludge in bioenergy production and mining waste for metals such as copper, neodymium, dysprosium, cadmium, and other rare and heavy earth minerals. Most of these metals are used in wind and solar plants for future electricity production. Since the relative share of RES is high in ModRES and HighRES electricity compared to the reference case, it is not surprising that HCT and HnCT increases in both future scenarios. Earlier studies have shown that the production of renewable electricity from solar, biogas and wind could increase toxicity potential [61]. The results in toxicity-related categories call for a better understanding of the toxic footprint of producing renewable electricity. This is especially important for solar and wind technologies to truly capitalize on their potential to decarbonize the energy sector without environmental burden shifting. Additionally, these results support Hawkins et al. [17] findings that toxicity potentials can be higher in EVs (BEV and PHEV) than in ICEV.
However, the calculated toxicity impacts may have been less if recycling and upgrading of metals had been considered in this study. This is because the recycling and upgrading of metals can prevent or reduce demand for mining virgin materials, which will directly benefit indicators related to toxicity categories due to “avoided burden” from mining wastes. Therefore, better regulatory regimes for mining wastes and improved recycling programs for Li-ion batteries can help in reducing EV’s life cycle toxicity impacts.
3.3. Other Life Cycle Environmental Impacts
The performance of BEV and PHEV is worse than ICEV for impacts categories other than climate change, fossil resource scarcity and stratospheric ozone depletion (Figures S1–S3 in the Supplementary Materials), even in future scenarios. For impact categories related to ionizing radiation, ozone formation, fine particulate matter formation, terrestrial acidification, and freshwater eutrophication, a larger improvement in future BEV and PHEV was noted than for ICEV. However, the absolute contributions of future BEV and PHEV are still higher than future ICEV in these categories. The larger improvement in future BEV and PHEV in these categories is linked to the reduction of coal- and lignite-based electricity in future vehicle production and the use phase.
On the other hand, future BEV and PHEV showed no improvement compared to their counterpart in the reference scenario for categories related to ecotoxicity, land use, mineral resource scarcity, and water consumption. They continuously performed worse than ICEV and their reference case counterpart in all future scenarios. The poor performance of future EVs in these categories is again linked to the source of production and charging electricity, especially due to the high share of biomass, solar and wind technologies used in future electricity production and for process energy supply in future steelmaking. This result highlights some of the environmental trade-offs for switching to low-carbon-electricity technologies [62]. Thus, a fuller understanding of the environmental impacts and the right mix for these technologies is required to further improve the overall impacts of future EVs.
Overall, these results show possible environmental impacts along the life cycle of these technologies. However, their actual impacts on humans and the ecosystem, especially for toxicity, acidification, and eutrophication is location-dependent, especially for vehicle manufacture and use sites. Additionally, since most of the impact changes (negative and positive) are driven by the choice of electricity mix in this study, the impacts would vary in different countries depending on the source of electricity generation.
3.4. Limitations and Opportunities
There are notable limitations to the method used in this study that need to be considered when interpreting and drawing conclusions from the results presented. Firstly, expected advances in the performance of future vehicles and their production processes were not considered, although earlier studies have shown they can reduce future environmental impacts. This approach is a modelling choice, since the novelty of the study lies in improving production processes for iron and steel to match future states in vehicle production. Nevertheless, this is as an important aspect to be investigated in future research.
Secondly, the energy storage capacity and the energy density for the BEV battery in this study is less than for many BEV on the market in 2020. However, the 30 kWh battery capacity assumed in this study can provide a range of approximately 120 km assuming a BEV electricity demand of 20 kWh/100 km. With expected progress in future Li-ion battery performance, especially for future battery energy density, the all-electric range of future EVs may increase without affecting the battery mass. Additionally, this limitation opens opportunities for future research on prospective LCA of traction battery systems.
Thirdly, many unchanged current life cycle inventories and production processes were used to model future vehicles and energy systems. The only changes made to the future scenarios are for the share of technologies to produce electricity and the processes for iron and steel production. This could be important for future impacts due to vehicle and battery production as future development is expected more generally in these sectors. Also, the integration of future steel and electricity production for vehicle manufacturing was performed manually and only up to the fourth tier in the production processes of the main vehicle components due to the complexity of the process networks. In future research, this could be investigated further. Improvements could also be achieved through collaborative efforts by vehicle and equipment manufacturers and LCA practitioners to produce more transparent data of higher quality.
Fourthly, the potential mitigation (avoided burden) arising from recycling or second life usage of used EVs batteries as an end-of-life opportunity was not assessed. Similarly, the share of recycled materials in the production processes of future vehicles was not modified. This is especially relevant for toxicity and mineral resource depletion categories, as the use of recycled materials will reduce the consumption of virgin materials and embodied impacts. Additionally, where possible, extending the life of used EVs batteries has been shown to reduce the net environmental impacts of EVs from a life cycle perspective [63,64]. It is proposed that future research further investigate these issues.
4. Conclusions
In this study, it has been shown for the European context that an increase in the share of renewable energy in the European electricity mix would significantly reduce the use phase impacts of current and future passenger cars, especially for GWP. At the same time, a very low-carbon electricity mix with a high share of renewables could further reduce GWP for vehicle production in a European context by up to 14% compared to the reference EU electricity mix. The difference is doubled if the same mix is used throughout the entire supply chain. Furthermore, the use of hydrogen direct reduced iron (HDR-I) for steel in vehicle production could further reduce vehicle production GWP by 17% relative to the reference production method for steel. Renewable heat in final vehicle production was shown to reduce GWP due to vehicle production by a maximum of only 1%. The potential for reducing GWP from energy demand in vehicle manufacturing through energy efficiency measures is relatively small when applied after the introduction of low carbon energy. This implies energy efficiency measures in vehicle production could be more beneficial if applied now when the energy system is CO2 intensive.
This study confirmed that replacing ICEV with EVs is beneficial for impact categories related to climate change, fossil resource depletion and ozone depletion. It also showed that the environmental impacts related to toxicity and ecotoxicity, acidification, ozone pollution, and particulate matter formation can increase in future scenarios. However, human toxicity and ecotoxicity results should be treated with caution because of the high methodological uncertainty in these categories [37]. Also, recycling at EoL was excluded in this study, which can avoid impacts (e.g., toxicity) from mining for virgin materials. Nevertheless, the results confirm that producing and using passenger EVs are an effective way to reduce current and future GHG emissions. It further confirms that the effectiveness is dependent on the CO2 intensity of the electricity mix for charging and vehicle manufacture. Thus, one of the main conclusions from this study is that to lessen the transport sector’s contribution to climate change, vehicle electrification must go hand in hand with electricity decarbonization, as suggested by earlier studies [10,16]. For improved environmental performance for future EVs, strategic policies and international collaborations are required. The objective is to mitigate unwanted impacts along the whole supply chain, and not just the source of electricity to power it. From an environmental perspective, the results show that it is more important for policymakers and stakeholders to prioritize RES integration for electricity production rather than changing the production method for steel. The former has more potential to reduce transport sector emissions, as well as emissions in the steel industry. In addition to this, recycling must be prioritized. Despite the exclusion of recycling in this work, there is consensus in the scientific literature that it can significantly reduce the net environmental impact of electric vehicles due to avoided burdens from the mining of virgin materials [65,66,67].
The study shows that EU and national goals promoting renewable electricity are key to achieving the future GWP mitigation potentials. For improved environmental performance, vehicle and battery production facilities must be established in locations with a higher share of renewable energy production. Further, the EU could incentivize production facilities with in-house capacity to produce renewable electricity. This could significantly lessen the GWP impacts of vehicle and battery production. Additionally, the adoption of EVs in locations with a high share of renewable electricity maximizes the potential of EV to reduce global GHG emissions.
Finally, vehicle manufacturers’ engagement in mitigating environmental impacts in vehicle production should be encouraged by promoting life cycle declarations according to an ISO 14025 certified program for passenger vehicles and in general, for the automotive supply chain. Manufacturers can already take advantage of the mitigation opportunities noted here by implementing them at the core of forward-thinking sustainability management initiatives.
Highlights:
- Potential lifetime GWP reduction for BEV up to −53% in 2050
- Hydrogen-based steel reduces vehicle production GWP by −17%
- Air pollution impacts decrease with higher renewables share in vehicle supply chain
- Toxicity and resource use increase with higher renewables share in vehicle supply chain
- Potential of energy efficiency measures to reduce vehicle production GWP is more beneficial when applied now than in 2050
Supplementary Materials
The following are available online at https://www.mdpi.com/1996-1073/13/23/6236/s1, Figure S1: Prospective life cycle assessment results of impact categories for which BEV performed better than ICEV, Figure S2: Prospective life cycle assessment results of impact categories for which BEV performed worse than ICEV with no improvement in future BEV, Figure S3: Prospective life cycle assessment results of impact categories for which BEV performed worse than ICEV but shows improvement in future scenarios compared to the reference case BEV, Figure S4–Figure S7: Prospective environmental impacts of vehicle production considering advances in future steel and electricity sectors.
Author Contributions
Conceptualization, M.S.K. and N.B.; Data curation, M.S.K.; Funding acquisition, M.M.; Methodology, M.S.K. and N.B.; Supervision, N.B. and G.C.; Writing—original draft, M.S.K.; Writing—review & editing, N.B., G.C., M.S.K., and M.M. All authors have read and agreed to the published version of the manuscript.
Funding
The research was funded by the MOBI Research Group from the Vrije Universiteit Brussel and through the EU Horizon 2020 project REFLEX—Analysis of the European Energy System (grant agreement number 691685). The APC was funded by the MOBI Research Group.
Acknowledgments
We acknowledge Flanders Make for the support of MOBI research group. The authors would like to thank the reviewers for their comments. Thanks to Daniele Costa, Maria Luisa Lode, Julian Jacques Ruddick, and Evgenii Genov for proofreading the manuscript.
Conflicts of Interest
The authors declare no conflict of interest.
References
- Meyer, G. Synergies of Connectivity, Automation and Electrification of Road Vehicles. In Road Vehicle Automation 3: Lecture Notes in Mobility; Meyer, G., Beiker, S., Eds.; Springer: Cham, Switzerland, 2016; pp. 187–191. [Google Scholar] [CrossRef]
- IPCC. Climate Change 2014: Synthesis Report. Contribution of Working Groups I, II and III to the Fifth Assessment Report of the Intergovernmental Panel on Climate Change; Pachauri, R.K., Meyer, L.A., Eds.; United Nations: Geneva, Switzerland, 2014. [Google Scholar]
- IPCC. Global Warming of 1.5 °C—An IPCC Special Report on the Impacts of Global Warming of 1.5 °C above Pre-Industrial Level; IPCC: Geneva, Switzerland, 2018. [Google Scholar]
- EEA. Explaining Road Transport Emissions—A Non-Technical Guide; EEA: Copenhagen, Denmark, 2016. [Google Scholar] [CrossRef]
- DOE/EIA. International Energy Outlook 2016: With Projections to 2040; EIA: Washington, DC, USA, 2016; Volume 0484. Available online: https://doi.org/www.eia.gov/forecasts/ieo/pdf/0484(2016).pdf (accessed on 10 May 2019).
- OECD/IEA. Global Energy & CO2 Status Report 2017; IEA: Paris, France, 2018; pp. 1–14. [Google Scholar]
- EC. Clean Transport-Support to the Member States for the Implementation of the Directive on the Deployment of Alternative Fuels Infrastructure Good Practice Examples; European Union: Brussels, Belgium, 2016. [Google Scholar]
- European Union. Transforming the European Energy System through Innovation. Integrated SET Plan Progress in 2016; European Commission: Brussels, Belgium, 2016; p. 25. [Google Scholar] [CrossRef]
- Van Der Steen, M.; Van Schelven, R.M.; Kotter, R. EV Policy Compared: An International Comparison of Governments’ Policy Strategy Towards E-Mobility. In E-Mobility in Europe, Green Energy and Technology; Springer International Publishing: Geneva, Switzerland, 2015; pp. 27–53. [Google Scholar] [CrossRef]
- Nordelöf, A.; Messagie, M.; Tillman, A.M.; Ljunggren Söderman, M.; Van Mierlo, J. Environmental impacts of hybrid, plug-in hybrid, and battery electric vehicles—What can we learn from life cycle assessment? Int. J. Life Cycle Assess. 2014, 19, 1866–1890. [Google Scholar] [CrossRef] [Green Version]
- Cox, B.; Bauer, C.; Mendoza Beltran, A.; van Vuuren, D.P.; Mutel, C.L. Life cycle environmental and cost comparison of current and future passenger cars under different energy scenarios. Appl. Energy 2020, 269, 115021. [Google Scholar] [CrossRef]
- Messagie, M.; Coosemans, T.; Van Mierlo, J. Hybrid, Plug-in Hybrid and Battery Electric Vehicles—Environmental insights and opportunities—A decision maker ’s perspective. In Transportation Research Procedia; Elsevier: Amsterdam, The Netherlands, 2018. [Google Scholar]
- Beltran, A.M.; Cox, B.; Mutel, C.; van Vuuren, D.P.; Font Vivanco, D.; Deetman, S.; Edelenbosch, O.Y.; Guinée, J.; Tukker, A. When the Background Matters: Using Scenarios from Integrated Assessment Models in Prospective Life Cycle Assessment. J. Ind. Ecol. 2018, 1–16. [Google Scholar] [CrossRef] [Green Version]
- Cox, B.; Mutel, C.L.; Bauer, C.; Mendoza Beltran, A.; Van Vuuren, D.P. Uncertain Environmental Footprint of Current and Future Battery Electric Vehicles. Environ. Sci. Technol. 2018, 52, 4989–4995. [Google Scholar] [CrossRef]
- Del Duce, A.; Egede, P.; Öhlschläger, G.; Dettmer, T.; Althaus, H.-J.; Bütler, T.; Szczechowicz, E. E-Mobility Life Cycle Assessment Recommendations. In Guidelines for the LCA of Electric Vehicles; eLCAr, 2013; Available online: http://www.elcar-project.eu/ (accessed on 10 May 2019).
- Marmiroli, B.; Messagie, M.; Dotelli, G.; Van Mierlo, J. Electricity generation in LCA of electric vehicles: A review. Appl. Sci. 2018, 8, 1384. [Google Scholar] [CrossRef] [Green Version]
- Hawkins, T.R.; Singh, B.; Majeau-Bettez, G.; Strømman, A.H. Comparative Environmental Life Cycle Assessment of Conventional and Electric Vehicles. J. Ind. Ecol. 2013, 17, 53–64. [Google Scholar] [CrossRef]
- Messagie, M. Environmental Performance of Electric Vehicles, a Life Cycle System Approach. Ph.D. Thesis, Vrije Universiteit, Brussels, Belgium, 2013. [Google Scholar]
- Hawkins, T.R.; Gausen, O.M.; Strømman, A.H. Received: Environmental impacts of hybrid and electric vehicles—A review. Int. J. Life Cycle Assess. 2012, 17, 997–1014. [Google Scholar] [CrossRef]
- Peters, J.F.; Baumann, M.; Zimmermann, B.; Braun, J.; Weil, M. The environmental impact of Li-Ion batteries and the role of key parameters—A review. Renew. Sustain. Energy Rev. 2017, 67, 491–506. [Google Scholar] [CrossRef]
- Arvidsson, R.; Tillman, A.M.; Sandén, B.A.; Janssen, M.; Nordelöf, A.; Kushnir, D.; Molander, S. Environmental Assessment of Emerging Technologies: Recommendations for Prospective LCA. J. Ind. Ecol. 2018, 22, 1286–1294. [Google Scholar] [CrossRef] [Green Version]
- Bauer, C.; Hofer, J.; Althaus, H.J.; Del Duce, A.; Simons, A. The environmental performance of current and future passenger vehicles: Life Cycle Assessment based on a novel scenario analysis framework. Appl. Energy 2015, 157, 871–883. [Google Scholar] [CrossRef]
- Stehfest, E.; van Vuuren, D.; Kram, T.; Bouwman, L. Integrated Assessment of Global Environmental Change with IMAGE 3.0—Model Description and Policy Applications; PBL Netherlands Environmental Assessment Agency: The Hague, The Netherlands, 2014. [Google Scholar]
- Shatokha, V. Environmental Sustainability of the Iron and Steel Industry: Towards Reaching the Climate Goals. Eur. J. Sustain. Dev. 2016, 5, 289–300. [Google Scholar] [CrossRef]
- World Steel Association Fact Sheet: Climate Change Mitigation by Technology, Innovation, and Best Practice Transfer; World Steel Association: Brussels, Belgium, 2018.
- Fischedick, M.; Marzinkowski, J.; Winzer, P.; Weigel, M. Techno-Economic Evaluation of Innovative Steel Production Technologies. J. Clean. Prod. 2014, 84, 563–580. [Google Scholar] [CrossRef] [Green Version]
- Karakaya, E.; Nuur, C.; Assbring, L. Potential transitions in the iron and steel industry in Sweden: Towards a hydrogen-based future? J. Clean. Prod. 2018, 195, 651–663. [Google Scholar] [CrossRef]
- Mayer, J.; Bachner, G.; Steininger, K.W. Macroeconomic Implications of Switching to Process-Emission-Free Iron and Steel Production in Europe. J. Clean. Prod. 2018, 220, 1517–1533. [Google Scholar] [CrossRef]
- Dai, Q.; Kelly, J.; Elgowainy, A. Vehicle Materials: Material Composition of Powertrain Systems; Argonne LAB: Lemont, IL, USA, 2016.
- Capros, P.; De Vita, A.; Tasios, N.; Siskos, P.; Kannavou, M.; Petropoulos, A.; Witzke, H.P.; Kesting, M.; Frank, S.; Forsell, N.; et al. Eu Energy, Transport and Ghg Emissions—Trends to 2050; European Comission: Brussels, Belgium, 2016. [Google Scholar] [CrossRef]
- EU. Directive 2009/33/EC of the European Parliament and of the Council of 23 April 2009: On the Promotion of Clean and Energy-Efficient Road Transport Vehicles (Text with EEA Relevance); European Union: Brussels, Belgium, 2009. [Google Scholar]
- EC. The European Green Deal; European Commision: Brussels, Belgium, 2019; Available online: https://ec.europa.eu/info/sites/info/files/european-green-deal-communication_en.pdf (accessed on 19 March 2020).
- Herbst, A.; Michaelis, J.; Brown, N.; Jakob, M.; Martino, A. Deliverable D1.1 Qualitative Description of the Scenario Storylines Update. Project REFLEX–Analysis of the European Energy System. 2016. Available online: http://reflex-project.eu/wp-content/uploads/2017/12/D1.1_Scenario_Description_v2.0.pdf (accessed on 10 January 2019).
- ISO. 14044 Environmental Management—Life Cycle Assessment—Requirements and Guidelines; ISO: Geneva, Switzerland, 2006. [Google Scholar]
- ISO. 14040 Environmental Management—Life Cycle Assessment—Principles and Framework; ISO: Geneva, Switzerland, 2006. [Google Scholar]
- Wernet, G.; Bauer, C.; Steubing, B.; Reinhard, J.; Moreno-Ruiz, E.; Weidema, B. The ecoinvent database version 3 (part I): Overview and methodology. Int. J. Life Cycle Assess. 2016, 21, 1218–1230. [Google Scholar] [CrossRef]
- Huijbregts, M.A.J.; Steinmann, Z.J.N.; Elshout, P.M.F.; Stam, G.; Verones, F.; Vieira, M.; Zijp, M.; Hollander, A.; van Zelm, R. ReCiPe2016: A harmonised life cycle impact assessment method at midpoint and endpoint level. Int. J. Life Cycle Assess. 2017, 22. [Google Scholar] [CrossRef]
- ICCT. European Vehicle Market Statistics, 2017/2018; ICCT: Berlin, Germany, 2018; Available online: https://theicct.org/publications/european-vehicle-market-statistics-20172018 (accessed on 19 March 2019).
- BRUSA Electric Drives, DC Converters and Battery Chargers, Motor Controllers, and Portable Power Electronics Are Just a Few of the Solutions BRUSA Elektronik AG Supplies to Automobile Manufacturers around the World. 2019. Available online: https://www.brusa.biz/en.html (accessed on 19 March 2019).
- Notter, D.A.; Gauch, M.; Widmer, R.; Wager, P.; Stamp, A.; Zah, R.; Althaus, H.J. Contribution of Li-ion batteries to the environmental impact of electric vehicles. Environ. Sci. Technol. 2010, 44, 43. [Google Scholar] [CrossRef]
- Paffumi, E.; De Gennaro, M.; Martini, G. European-wide study on big data for supporting road transport policy. Case Stud. Transp. Policy 2018, 6, 785–802. [Google Scholar] [CrossRef]
- Pasaoglu, G.; Fiorello, D.; Martino, A.; Scarcella, G.; Alemanno, A.; Zubaryeva, A.; Thiel, C. Driving and Parking Patterns of European Car Drivers—A Mobility Survey; European Commission Joint Research Centre: Luxembourg, 2012; ISBN 9789279277382. [Google Scholar] [CrossRef]
- Li, M.; Feng, M.; Luo, D.; Chen, Z. Fast Charging Li-Ion Batteries for a New Era of Electric Vehicles. Cell Rep. Phys. Sci. 2020, 1, 100212. [Google Scholar] [CrossRef]
- Anjos, M.F.; Gendron, B.; Joyce-Moniz, M. Increasing electric vehicle adoption through the optimal deployment of fast-charging stations for local and long-distance travel. Eur. J. Oper. Res. 2020, 285, 263–278. [Google Scholar] [CrossRef]
- Lucien, M. Recharge EU: How Many Charge Points Will EUROPE and Its Member States Need in the 2020s; Transport & Environment: Brussels, Belgium, 2020. [Google Scholar]
- Mathieu, L. Roll-Out of Public EV Charging Infrastructure in the EU: Is the Chicken and Egg Dilemma Resolved; Transport & Environment: Brussels, Belgium, 2018; Available online: https://www.euractiv.com/wp-content/uploads/sites/2/2018/09/Charging-Infrastructure-Report_September-2018_FINAL.pdf (accessed on 20 May 2020).
- Hooftman, N.; Messagie, M.; Joint, F.; Segard, J.B.; Coosemans, T. In-life range modularity for electric vehicles: The environmental impact of a range-extender trailer system. Appl. Sci. 2018, 8, 1016. [Google Scholar] [CrossRef] [Green Version]
- Boretti, A. Electric vehicles with small batteries and high-efficiency on-board electricity production. Energy Storage 2019, 1, 1–14. [Google Scholar] [CrossRef] [Green Version]
- Keoleian, G.A.; Spatari, S.; Beal, R.T.; Stephens, R.D.; Williams, R.L. Fuel Tank System Design LCA Case Studies 18. Int. J. Life Cycle Assess. 1998, 3, 12–28. [Google Scholar]
- ACEA. ACEA Report Vehicles in Use Europe 2018; European Automobile Manufactureres Association: Brussels, Belgium, 2018; Available online: https://www.acea.be/statistics/tag/category/report-vehicles-in-use (accessed on 20 May 2020).
- Tesla. Vehicle Warranty | Tesla UK 2019. Available online: https://www.tesla.com/en_GB/support/vehicle-warranty?redirect=no (accessed on 10 May 2020).
- Nissan. Car Warranties—Nissan Ownership—Owners Area|Nissan 2019. Available online: https://www.nissan.co.uk/ownership/nissan-car-warranties.html (accessed on 10 May 2020).
- Fontaras, G.; Zacharof, N.G.; Ciuffo, B. Fuel consumption and CO2 emissions from passenger cars in Europe—Laboratory versus real-world emissions. Prog. Energy Combust. Sci. 2017, 60, 97–131. [Google Scholar] [CrossRef]
- Daimler, A.G. Environmental Certificate Mercedes-Benz A-Class; Daimler AG: Stuttgart, Germany, 2018; Available online: https://www.daimler.com/documents/sustainability/product/daimler-environmental-certificate-mb-a-class.pdf (accessed on 10 May 2020).
- Eder, A.; Schütze, N.; Rijnders, A.; Riemersma, I.; Steven, H. Development of a European Utility Factor Curve for OVC-HEVs for WLTP. 2014. Available online: https://circabc.europa.eu/sd/a/92324676-bd8c-4075-8301-6caf12283beb/Technical%20Report_UF_final.pdf (accessed on 10 May 2020).
- Koroma, M.S.; Cardellini, G.; Messagie, M. LCA Indicator of NMC Battery, PANDA A# 824256, D2.4 Deliverable, Confidential Report. Available online: https://project-panda.eu/ (accessed on 1 October 2020).
- IEA. World Energy Outlook 2017; OECD Publishing: Paris, France, 2017. [Google Scholar] [CrossRef]
- NEEDS. Deliverable D15.1: LCA of Background Processes; NEEDS: Brussels, Belgium, 2008; Deliverable D15.1. [Google Scholar]
- Hybrit Hybrit, Fossil-Free Steel—Summary of Findings from HYBRIT Pre-Feasibility Study 2016–2017; HYBRIT Development AB; HYBRIT—Fossil Free Steel: Stockholm, Sweden, 2017; pp. 1–20.
- Bataille, C.; Åhman, M.; Neuhoff, K.; Nilsson, L.J.; Fischedick, M.; Lechtenböhmer, S.; Solano-Rodriquez, B.; Denis-Ryan, A.; Stiebert, S.; Waisman, H.; et al. A review of technology and policy deep decarbonization pathway options for making energy-intensive industry production consistent with the Paris Agreement. J. Clean. Prod. 2018, 187, 960–973. [Google Scholar] [CrossRef] [Green Version]
- Quek, A.; Ee, A.; Ng, A.; Wah, T.Y. Challenges in Environmental Sustainability of renewable energy options in Singapore. Energy Policy 2018, 122, 388–394. [Google Scholar] [CrossRef]
- UNEP. Green Energy Choices: The Benefits, Risks and Trade-Offs of Low-Carbon Technologies for Electricity Production; Report of the International Resource Panel; Hertwich, E.G., de Larderel, J.A., Arvesen, A., Bayer, P., Bergesen, J., Bouman, E., Gibon, T., Heath, G., Peña, C., Purohit, P., et al., Eds.; UNEP: Paris, France, 2016. [Google Scholar]
- Cusenza, M.A.; Guarino, F.; Longo, S.; Ferraro, M.; Cellura, M. Energy and environmental benefits of circular economy strategies: The case study of reusing used batteries from electric vehicles. J. Energy Storage 2019, 25. [Google Scholar] [CrossRef]
- Ahmadi, L.; Young, S.B.; Fowler, M.; Fraser, R.A.; Achachlouei, M.A. A cascaded life cycle: Reuse of electric vehicle lithium-ion battery packs in energy storage systems. Int. J. Life Cycle Assess. 2017, 22, 111–124. [Google Scholar] [CrossRef]
- Qiao, Q.; Zhao, F.; Liu, Z.; Hao, H. Electric vehicle recycling in China: Economic and environmental benefits. Resour. Conserv. Recycl. 2019, 140, 45–53. [Google Scholar] [CrossRef]
- Soo, V.K.; Compston, P.; Doolan, M. Interaction between new car design and recycling impact on life cycle assessment. Procedia CIRP 2015, 29, 426–431. [Google Scholar] [CrossRef]
- Unterreiner, L.; Jülch, V.; Reith, S. Recycling of Battery Technologies-Ecological Impact Analysis Using Life Cycle Assessment (LCA). In Proceedings of the Energy Procedia; Elsevier: Amsterdam, The Netherlands, 2016; pp. 1876–6102. [Google Scholar]
Figure 1.
System boundary for all vehicle alternatives considered in this study.

Figure 2.
EU electricity mix and relative average grid carbon intensity in reference case, ModRES and HighRES scenarios.
Figure 2.
EU electricity mix and relative average grid carbon intensity in reference case, ModRES and HighRES scenarios.

Figure 3.
Inventory and process flow diagram for hydrogen direct reduction (H-DR) route for iron and steel production in HighRES scenario.
Figure 3.
Inventory and process flow diagram for hydrogen direct reduction (H-DR) route for iron and steel production in HighRES scenario.

Figure 4.
Schematic representation of processes for producing steel alloys, and process parameters that were modified for consistent scenario evaluation. Solid boxes indicate an original Ecoinvent process, solid arrows indicate original Ecoinvent values. The box with a dashed line indicates a modified or new process for this study, crossed arrows with dashed lines indicate that either one of or both the process and values were modified in line with the scenario, and crossed arrows with solid lines shows that only the processes were modified.

Figure 5.
Potential GWP for driving 1 km in reference, ModRES & HighRES. Each bar is divided into seven categories: gasoline (use-phase) refers to impacts along gasoline production chain; exhaust emissions (use-phase) refer to impacts from burning gasoline; electricity (use-phase) refers to impacts along production chains of charging electricity; road (use-phase) refers to impacts from road production and maintenance; non-exhaust emissions (use-phase) refer to impacts from brake and tire wear; battery (production and EoL) refers to impacts along battery production and EoL treatment; and rest of car (production and EoL) refers to impacts along production, maintenance and EoL treatment of all vehicle components except battery.

Figure 6.
Potential GWP of producing 1 kg of BEV, P-HEV and ICEV considering expected future developments in steel and energy production. For ModRES and HighRES, results are presented cumulatively, where A refers to the reference case, B refers to improvement due to scenario-based electricity mix for vehicle manufacture, C refers to changes in B plus efficiency improvement in electricity demand for vehicle manufacture, D refers to changes in C plus changes in heat mix in vehicle manufacture, E refers to changes in D plus efficiency improvement in heat demand for vehicle manufacture, and F refers to changes in E plus scenario-based steel.

Figure 7.
Prospective life cycle assessment results for human carcinogenic toxicity potential and human non-carcinogenic toxicity potential per vehicle kilometer driven in a BEV, PHEV, and ICEV, considering future changes in steel and energy sectors.
Figure 7.
Prospective life cycle assessment results for human carcinogenic toxicity potential and human non-carcinogenic toxicity potential per vehicle kilometer driven in a BEV, PHEV, and ICEV, considering future changes in steel and energy sectors.

Publisher’s Note: MDPI stays neutral with regard to jurisdictional claims in published maps and institutional affiliations. |
© 2020 by the authors. Licensee MDPI, Basel, Switzerland. This article is an open access article distributed under the terms and conditions of the Creative Commons Attribution (CC BY) license (http://creativecommons.org/licenses/by/4.0/).
Share and Cite
MDPI and ACS Style
Koroma, M.S.; Brown, N.; Cardellini, G.; Messagie, M. Prospective Environmental Impacts of Passenger Cars under Different Energy and Steel Production Scenarios. Energies 2020, 13, 6236. https://doi.org/10.3390/en13236236
AMA Style
Koroma MS, Brown N, Cardellini G, Messagie M. Prospective Environmental Impacts of Passenger Cars under Different Energy and Steel Production Scenarios. Energies. 2020; 13(23):6236. https://doi.org/10.3390/en13236236
Chicago/Turabian StyleKoroma, Michael Samsu, Nils Brown, Giuseppe Cardellini, and Maarten Messagie. 2020. "Prospective Environmental Impacts of Passenger Cars under Different Energy and Steel Production Scenarios" Energies 13, no. 23: 6236. https://doi.org/10.3390/en13236236
Note that from the first issue of 2016, this journal uses article numbers instead of page numbers. See further details here.