Article

Insight into Foam Pore Effect on Phase Change Process in a Plane Channel under Forced Convection Using the Thermal Lattice Boltzmann Method

1
Thermal and Energetic Systems Studies Laboratory (LESTE), National School of Engineers of Monastir, Monastir University, Rue Ibn Jazza, Monastir 5019, Tunisia
2
Univ. Artois, Univ. Lille, IMT Lille-Douai & Yncrea-HEI, Civil Engineering & Geo-Environment Laboratory (ULR 4515), Technoparc Futura, F-62400 Béthune, France
*
Author to whom correspondence should be addressed.
Energies 2020, 13(15), 3979; https://doi.org/10.3390/en13153979
Submission received: 4 June 2020 / Revised: 6 July 2020 / Accepted: 16 July 2020 / Published: 2 August 2020

Abstract

:
In this work, the two-dimensional laminar flow and the heat transfer in an open-ended rectangular porous channel (metal foam) including a phase change material (PCM; paraffin) under forced convection were numerically investigated. To gain further insight into the foam pore effect on charging/discharging processes, the Darcy–Brinkmann–Forchheimer (DBF) unsteady flow model and that with two temperature equations based on the local thermal non-equilibrium (LTNE) were solved at the representative elementary volume (REV) scale. The enthalpy-based thermal lattice Boltzmann method (TLBM) with triple distribution function (TDF) was employed at the REV scale to perform simulations for different porosities ( 0.7 ε 0.9 ) and pore per inch (PPI) density ( 10 P P I 60 ) at Reynolds numbers (Re) of 200 and 400 . It turned out that increasing Re with high porosity and PPI (0.9 and 60) speeds up the melting process, while, at low PPI and porosity (10 and 0.7), the complete melting time increases. In addition, during the charging process, increasing the PPI with a small porosity (0.7) weakens the forced convection in the first two-thirds of the channel. However, the increase in PPI with large porosity and high Re number limits the forced convection while improving the heat transfer. To sum up, the study findings clearly evidence the foam pore effect on the phase change process under unsteady forced convection in a PCM-saturated porous channel under local thermal non-equilibrium (LTNE).

Graphical Abstract

1. Introduction

More attention is being paid to latent heat thermal energy storage systems (LHTESS) due to their large storage capacity in a small volume and low temperature fluctuation [1]. This allows removing temperature peaks due to the intermittent high power demand and storing a large amount of solar energy without significantly increasing the system temperature. Furthermore, LHTESS using phase change materials (PCMs) are widely used in various engineering applications such as building temperature regulation, waste heat recovery, compact heat exchangers, solar energy storage, concentrating solar plants, etc. [2,3]. However, their low thermal conductivity is one of their weaknesses because it restricts thermal transport by giving rise to slow heat dissipation during charging/discharging periods. Therefore, infiltrated metallic foams with PCMs are now increasingly used as porous media to overcome this defect due to their high thermal conductivity, their large specific surface area, and their low cost [4]. Indeed, this infiltration approach recently attracted more attention due to the high thermal conductivity of metallic struts which further spreads heat faster through the PCM matrix.
In terms of research dealing with the effectiveness of these foams, Zhao et al. [5] experimentally demonstrated that the metallic foam addition improves heat transfer via phase change by up to 10 times more than pure paraffin. Chen et al. [6] found that incorporating metallic foam in the heat transfer fluid (water) including the PCM raises the energy storage performance during charging/discharging processes while shortening the time of the 84.9% cycle compared to pure PCM. Cui [7] incorporated copper foam with PCM (paraffin) and found that the heat transfer rate increased (by 36%) more than that without the foam while the charging time decreased. Yang et al. [8] established physical and numerical models for a novel LHTESS using two gradient kinds (positive and negative) to simulate the melting front evolvement and thermal and dynamic fields during the melting process. They indicated that an optimized positive porosity gradient (0.89–0.95–0.98) is better suited to further decrease the melting time than a uniform gradient. Sardari et al. [9] investigated the porosity and pore size effects of metal foams on the PCM melting process. They stated that inserting porous foam with low porosity provides high performance and decreases the melting time by 85% compared to PCM alone. Furthermore, Lafdi et al. [10] experimentally studied the effects of the same parameters and found that a larger pore size and a greater porosity lead to the steady state being reached more rapidly and the heat transfer being intensified. Zhao et al. [11] showed that lower porosity speeds up PCM melting and solidification, and that a low pore density reduces the melting rate with a higher Rayleigh number (Ra). Zhu et al. [12] pointed out the porosity and pore density effects on thermal performance during PCM melting in a metallic fin foam. They stated that increasing the pore per inch (PPI) restricts convective heat transfer while dropping the energy storage rate. Yang et al. [13] deemed the effects of gradient in porosity, pore density, and matrix conductivity of water-saturated cell foams on the solidification process. They found that the foam property related to the gradient significantly affects the solidification rate and the complete solidification time. More explicitly, a positive porosity gradient accelerates solidification compared to cases of negative gradient or uniform porosity. Tao et al. [4] studied the influence of PPI and porosity on the melting process of a composite phase change material (metallic foam/paraffin) in natural convection. They showed that, for greater porosity (=0.98) and when the PPI decreases, natural convection dominates strongly, thereby increasing the PCM melting rate. A year earlier, Tao et al. [14] studied the effects of natural convection on latent heat storage performance. They noted that natural convection improves the PCM heat transfer and gives rise to a non-uniform evolvement of the temperature field and phase change interface during the melting process. Longeon et al. [15] explored the performance of an annular latent storage unit under natural convection. They concluded that, during the melting period, natural convection has a more meaningful effect on the heat transfer rate than that during solidification mode. Wang et al. [16] examined the influence of natural convection on PCM melting in a sleeve tube with internal fins. They argued that natural convection greatly affected melting mode upon considering a small fin ratio and angle between neighboring fins.
From the literature review conducted above, it can be noted that the number of studies (experimental and/or numerical) related to the storage of thermal energy at latent heat is still limited and deserves to be further investigated. Moreover, most of these studies were based on classical numerical approaches while being subject to various factors and time-consuming. However, heat transfer problems caused by forced convection in porous media filled with PCM were hardly addressed. Indeed, modeling and simulating such a problem remain arduous tasks because of the porous metallic medium complexity and the phase change process involved. Initially, research on these problems invoked the local thermal equilibrium (LTE) assumption. However, it turned out that it is rather the local thermal non-equilibrium (LTNE) hypothesis which should be considered, thereby requiring the use of the so-called LTNE models (two-equation energy models), one for each phase (solid and liquid), which can spot LTE zones, if any, in forced convection. Such models are advised in the literature because of their ability to deal with these issues, in particular, at the representative elementary volume (REV) scale.
Generally, lattice Boltzmann (LB) simulations in porous media involve the microscopic (pore scale) and mesoscopic (REV) scales. The first approach requires detailed knowledge of the porous medium structure, while the second settles for a simplified description avoiding the need to deal with large computation domains at the pore scale. Increasingly, the REV–LB model, as a computationally efficient numerical method [17,18], is being successfully used to predict flows with or without phase change in porous media. However, to the best of our knowledge, work on the application of this method (REV–LB) to problems under forced convection in porous media saturated with a phase change material remains scarce. Therefore, the present work leans on such an approach to scrutinize the effects of metallic foam pores on the phase change process in a rectangular channel under forced convection at the REV scale. Here, this method allows handling the porous medium’s existence and the transport phenomena involved using an additional term which translates the effects of drag forces, buoyancy, etc. [19].
In this context, Wu et al. [20] employed a new multiple relaxation time (MRT)–LB method to examine the transient fusion process in porous media at the REV scale. Their findings demonstrated the capability and reliability of the method for handling solid–liquid phase change issues in porous media. Gao and Chen [21] simulated freezing and solidification behavior in porous media under natural convection using an enthalpy-based LBM at REV scale. From the results obtained over an ample range of dimensionless parameters, they stated that the model can handle freezing and solidification processes in porous media. Liu and He [22] succeeded in simulating conduction fusion in a semi-infinite space, solidification in a semi-infinite corner, and convection fusion in a square cavity filled with porous media using a double MRT–LBM. Most recently, Mabrouk et al. [23] analyzed the heat transfer under forced convection through a PCM-saturated porous channel under LTNE during the melting and solidification cycles using an LBM with a single relaxation time (SRT) at the REV scale and relevant parameters such as the Reynolds number, Eckert number, and porosity. They showed that the storage energy is optimal for a critical Reynolds number in the range examined. At the REV scale, Jourabian et al. [24] also numerically studied the fusion cycle in a porous rectangular cavity including two hot cylinders using an enthalpy-based LBM with double distribution functions (DDF). They showed that porosity diminution leads to a complete decrease in melting time and system thermal storage capacity.
Through the brief review performed above, it appears that porosity and PPI are relevant parameters. Thereby, framed in such a general background, the primary intent of this study is to thoroughly assess the effects of PPI and porosity on heat transfer during melting/solidifying processes in a PCM-saturated open-ended rectangular porous channel under forced convection. Furthermore, as far as the numerical method is concerned, the enthalpy–SRT–LB method with triple distribution functions (TDF) is implemented herein.
This paper is laid out as follows: after the literature review (Section 1), the physical problem and the mathematical model, along with boundary conditions, are presented in Section 2. Afterward, a brief description of the numerical method is provided in Section 3. In Section 4, mesh control and code validation are performed. Numerical findings are presented and commented on in Section 5. Finally, major conclusions from this investigation are drawn in Section 6.

2. Model Description and Mathematical Formulation

In this section, firstly, the model geometry, the boundary conditions, and the simplifying hypotheses are outlined. Then, the governing equations with the adopted numerical resolution method are presented.

2.1. Considered Configuration

The physical model with a Cartesian coordinate system considered in this study is depicted in Figure 1. It is an open-ended rectangular channel of dimensions L × H completely filled with a porous medium (metallic foam) and a PCM (paraffin) embedded in its pores. Its lower and upper walls are adiabatic, impermeable, and non-slip. The uniform velocity and the hot temperature of the fluid at the channel entrance (west) were set to U i n and T f , h , respectively, to start the charging (melting) process. At the channel exit (east), the velocity and the temperature were set to U i n and T f , c ( < T f , h ) to initiate the discharging process. The thermal input condition was wisely set such that the PCM could start to melt ( T f , h > T m ) and the output conditions were assumed to be fully developed since the geometry is two-dimensional.

2.2. Computational Assumptions

Some assumptions were set out to simplify and establish the mathematical model to be dealt numerically. Forced convection prevailed in the channel compared to other heat transfer modes regardless of the porous medium interface or surface. Buoyancy and radiation effects were not considered. The flow was deemed to be laminar and unsteady. The working fluid was Newtonian, incompressible, and viscous, while it formed a second phase, i.e., the LTNE, with the porous matrix (first phase). It is worth indicating that the medium’s thermo-physical properties were constant, homogeneous, and isotropic within the deemed temperature and Re values. In addition, at the REV scale, homogenization of the governing equations reflects the porous medium effect. Hence, the Darcy–Brinkmann–Forchheimer (DBF) model was adopted here to model and investigate the convective fluid flow in the porous medium at Reynolds numbers of 200 and 400. Furthermore, the solid matrix was assumed to be in an LTNE state with the fluid. For more details, interested readers may refer to, for example, Nield and Bejan [25].

2.3. Mathematical Model

In light of the above-mentioned assumptions, the two-dimensional macroscopic conservation equations for mass, momentum, and energy at the REV scale are as follows [26,27,28]:
u = 0 ,  
u t + ( u · ) ( ε 1 u ) = ( ε P ) + ν f 2 u ε ( ν f K + F ε K u ) u ,  
ε ρ f C p f ( T f t + u · T f ) = · ( λ e f f , f T f ) + h s f a s f ( T s T f ) ε ρ f L a Γ t + Φ ,  
( 1 ε ) ρ s C p s T s t = · ( λ e f f , s T s ) + h s f a s f ( T f T s ) ·  
where u , P , T f , T s , ε , ρ , ν f , C p , and λ e f f are the velocity vector field, pressure, fluid and porous medium temperatures, copper porosity, density, kinematic viscosity of PCM, specific heat capacity, and effective thermal conductivity, respectively. Subscripts f and s denote the fluid and solid phases, respectively. Moreover, Γ , L a , a s f , and h s f are the liquid fraction in pore space, the PCM latent heat, specific surface area of the porous matrix, and the local interfacial heat transfer coefficient between copper and paraffin, respectively. Note that the mutual establishment of heat transfer between the porous medium and the PCM is reflected via the two energy equations (Equations (3) and (4)). Simply stated, the melting heat transfer was modeled differently in the PCM and the metallic foam.
The liquid fraction Γ appearing in the third term on the right-hand side of Equation (3) could be determined according to the enthalpy method as follows [29]:
Γ = { 0 T < T m Δ T ( T T m + Δ T ) / 2 Δ T if T m Δ T T T m + Δ T 1 T > T m + Δ T .
Since the metal and the PCM were in thermal equilibrium at the channel entrance (west), the matrix temperature was next raised to initiate the PCM melting. Δ T is the PCM’s melting temperature range whose value was chosen to be small to ensure numerical stability. For the computations carried out here, it was set to 0.04.
The last term of Equation (3) points out the PCM viscous dissipation, which can be determined as follows [30]:
Φ = ε ( μ K + F ε K u ) u 2 + μ ( 2 [ ( u x ) 2 + ( v y ) 2 ] + ( u y + v x ) 2 ) ·  

2.4. Metal Foam Parameters

The empirical quantities a s f , h s f , and λ e f f (Equations (1)–(4)) characterizing the thermal properties and the metallic foam geometry can be correlated as follows [31,32,33]:
a s f = 3 π d f G / 0.59 / d p 2 ,   where   G = 1 e ( 1 ε ) / 0.004   ( shape   function ) ,  
with
d f = 1.18 ( ( 1 ε ) / 3 π ) 1 / 2 d p   and   d p = 22.4 × 10 3 / ω ,  
h s f = { 0.76 . Re d 0.4 Pr 0.37 λ f d f 1 Re d 40 0.52 . Re d 0.5 Pr 0.37 λ f d f for 140 Re d 10 3 0.26 . Re d 0.6 Pr 0.37 λ f d f 10 3 Re d 2.10 5 ,
where Re d   ( = d f U i n / ε ν f ) is the pore Reynolds number, and d f , d p , and ω are the ligament diameter, the pore size, and the pore density, respectively.
As the LTNE assumption was invoked in present the study, the effective thermal conductivity could be calculated as follows [9,34,35]:
λ e f f = 1 / 2 ( R A + R B + R C + R D ) ,  
where
R A = 4 σ / ( ( 2 e 2 + π σ ( 1 e ) λ s + ( 4 2 e 2 π σ ( 1 e ) ) λ f ) ,  
R B = ( e 2 σ ) 2 / ( ( e 2 σ ) e 2 λ s + ( 2 e 4 σ ( e 2 σ ) e 2 ) λ f ) ,  
R C = ( 2 2 e ) / ( 2 π σ 2 λ s + ( 2 2 π σ 2 ) λ f ) ,  
R D = 2 e / ( e 2 λ s + ( 4 e 2 ) λ f ) ,  
with
e = 0.16   and   σ = ( 2 ( 2 3 2 4 e 3 2 ε ) π ( 3 2 2 e e ) ) 1 / 2 ·  
Therefore,
λ e f f , f = λ e f f | λ s = 0 ,  
λ e f f , s = λ e f f | λ f = 0 ·  
The permeability ( K ) and the Forchheimer coefficient ( F ε ) (see Equation (2)) were computed with the following correlations [31,32,33]:
K = 7.3 × 10 4 d p 2 ( 1 ε ) 0.224 ( d f / d p ) 1.11 ,  
F ε = 2.12 × 10 3 ( 1 ε ) 0.132 ( d f / d p ) 1.63 ·  

2.5. Boundary and Initial Conditions

The necessary boundary conditions (BCs) and initial condition (IC) for the governing equations were as follows:
  • u = 0 ; v = 0 ; T f = T c = T 0 x and y (IC);
  • u = u i n ; v = 0 ; T f = T h at x = 0 and 0 y H (west boundary);
  • x u = 0 ; v = 0 ; T f = T c at x = L and 0 y H (east boundary);
  • u = 0 ; v = 0 (no-slip condition); y T f = y T s = 0 (perfect-insulated) at 0 x L and y = H (upper boundary);
  • u = 0 ; v = 0 (no-slip condition); y T f = y T s = 0 (perfect-insulated) at 0 x L and y = 0 (lower boundary).
It should be pointed out that the fluid flow was inverted from right to left (see Figure 1) for the discharging cycle.

2.6. Dimensionless Mathematic Model and Key Parameters

Using the dimensionless variables below,
( X , Y ) = ( x , y ) / H ,   U = u / U 0 ,   P = p / ρ U 0 2 ,   t ˜ = t U 0 / H ,   Θ = ( T T c ) / ( T h T c ) ,   Δ T r e f = T h T c ,  
D a = K / H 2 ,   Pr = ν f / α f ,   Re = U 0 H / ν f ,   R c = ( ρ C p ) s / ( ρ C p ) f ,   K r = λ s / λ f , B i = h s f a s f H 2 / λ s ,   S t e = C p f ( T h T m ) / L a ,   E c = U 0 2 / ( C f Δ T r e f ) ,  
the governing Equations (1)–(4) were converted to the following dimensionless forms [25,27,36]:
U = 0 ,  
U t ˜ + ( U · ) ( ε 1 U ) = ( ε P ) + 1 Re 2 U ε ( 1 Re D a + F ε D a U ) U ,  
Θ f t ˜ + U · Θ f = 1 Re · Pr · ( λ e f f , f λ f Θ f ε ) + K r · B i Re · Pr ( Θ s Θ f ε ) 1 S t e Γ t ˜ + Φ ˜ ,  
Θ s t ˜ = K r R c 1 Re · Pr · ( λ e f f , s λ s Θ s 1 ε ) K r R c · B i Re · Pr ( Θ s Θ f 1 ε ) ,  
where
Φ ˜ = ε · E c { 1 D a · Re + F ε D a U } U 2 + E c Re { 2 [ ( U X ) 2 + ( V Y ) 2 ] + ( U Y + V X ) 2 } ·  
The corresponding dimensionless BCs and IC were as follows:
  • U = 0 ; V = 0 ; Θ f = 0 X and Y (IC);
  • U = 1 ; V = 0 ; Θ f , h = 1 at X = 0 and 0 Y 1 (west boundary);
  • X U = 0 ; V = 0 ; Θ f , c = 0 at X = L / H and 0 Y 1 (east boundary);
  • U = 0 ; V = 0 ; Y Θ f , h = Y Θ f , s = 0 at 0 X L / H and Y = 1 (upper boundary);
  • U = 0 ; V = 0 ; Y Θ f , h = Y Θ f , s = 0 at 0 X L / H and Y = 0 (lower boundary).

3. Lattice Boltzmann Methodology

For a long time now, the LBM aroused much interest in CFD-related fields. Unlike traditional CFD approaches (volumes, finite elements, etc.), such a method models a fluid using the kinetics of discrete particles which propagate (streaming step) and collide (relaxation step) on a discrete lattice. Generally, its mechanism consists of handling the streaming of fluid particle clusters via a monitor called the density distribution function (DDF) which controls the particle evolution position x at each time t with a certain discrete distribution velocity e i to move regularly in the lattice toward bordering sights. Explicitly, at each time step, the particle circulation is achieved by continuous diffusion where the particles maintain their velocity direction, and collision occurs when particles change velocity. In addition, it has advantages in terms of geometry flexibility, a simple computation procedure, high parallelism, an ability to deal complex boundary conditions, and an intrinsic transient feature.
Recently, research corroborated the LBM’s success at the pore or REV scales for handling flows with and without phase change in porous media (e.g., References [4,26]). The first approach is often avoided owing to the geometry and the computational domain size, while the second approach REV is frequently adopted because of the averaging method. However, so far, and to the best of our knowledge, none of these approaches were used to deal with phase change, let alone forced convection under LTNE. In these circumstances, we studied the phase change process with forced convection under LTN in the REV-scale SRT–LBM framework [26].

3.1. Lattice Boltzmann Equation (LBE) for Dynamic Field

In this study, the LB model adopted to simulate the flow of the fluid was the SRT–LBM (also called the Bhatnagar–Gross–Krook (BGK) model) which leans on the evolution equation of the distribution function of the particle velocity density f i ( x , t ) [37].
f i ( x + e i δ t , t + e i δ t ) f i ( x , t ) s t r e a min g = δ t ω i [ f i ( x , t ) f i e q ( x , t ) ] c o l l i s i o n + δ t · F e i f o r c e   t e r m ·  
The left-hand term represents advection (streaming), the first right-hand term is the discrete collision term, and the second right-hand term is the external force.
In Equation (27), ω i   ( = 1 / τ v ;   τ v = 3 ν + 0.5 ) , δ t , and f i e q ( x , t ) are the single relaxation collision frequency, the lattice time step, and the equilibrium fluid distribution function (EFDF), respectively. Under the well-known D2Q9 lattice model (Figure 2), the latter term can be expressed as follows (e.g., Reference [17]):
f i e q = ρ w i ( 1 + e i · u c s 2 + u u : ( e i e i c s 2 I ) 2 c s 4 ε ) ·  
Moreover, the model discrete velocity e k can be given by
e k = { 0 i + 0 j , k = 0 c ( cos ( ( k 1 ) π / 2 ) i + sin ( ( k 1 ) π / 2 ) j ) , k = 1 , 2 , 3 , 4 , 2 c [ cos ( ( 2 k 9 ) π / 4 ) i + sin ( ( 2 k 9 ) π / 4 ) j ] ,   k = 5 , 6 , 7 , 8
where c   ( = δ x / δ t = 1 ; δ x = δ t ) , c s   ( = c / 3 ) , and I are the streaming speed, the sound speed, and the unit tensor, respectively. The equilibrium weighting coefficient w i in Equation (28) was set as w 0 = 4 / 9 , w 1 ,   4 = 1 / 9 , and w 5 ,   8 = 1 / 36 .
The force term pointed out in Equation (27) can be expressed as follows [4]:
F e i = w i ρ ( 1 1 2 τ v ) [ e i · F c s 2 + u · F : ( e i e i c s 2 I ) ε c s 4 ]   with   F = ( ν f K + F ε K U ) U ·  
In the current model, the macroscopic density and velocity could be obtained by
ρ = i f i   and   ρ u = i f i e i + δ t F / 2 ·  
Note that the computation is typically split into a collision and streaming step as follows:
f i * ( x , t ) = f i ( x , t ) δ t ω i ( f i ( x , t ) f i e q ( x , t ) ) + δ t F e i ,  
f i ( x + e i δ t , t + e i δ t ) = f i * ( x , t )
where f i * ( x , t ) is the post-collision density distribution function.
It is noteworthy that the execution order of these two steps is arbitrary and may vary from one code to another for implementation reasons.

3.2. Lattice Boltzmann Equation (LBE) for Thermal Field

Here, we follow an approach similar to that which was just adopted for the dynamic field. Simply stated, we still use the LBGK with two thermal density distribution functions, g i , f ;   s , to predict the thermal field for the PCM and porous matrix using the following scheme [4,28]:
g f , i ( x + e i δ t , t + δ t ) g f , i ( x , t ) = ω T , f ( g f , i ( x , t ) g f , i e q ( x , t ) ) + ( 1 + δ t t / 2 ) δ t S r i , f + δ t f i ( x , t ) q i
g s , i ( x + e i δ t , t + δ t ) g s , i ( x , t ) = ω T , s ( g s , i ( x , t ) g s , i e q ( x , t ) ) + ( 1 + δ t t / 2 ) δ t S r i , s ,  
where ω T , f ; s   ( = 1 / τ T , f ;   s ) is the single relaxation collision frequency for the solid and fluid temperature distribution functions which can be estimated through the dimensionless relaxation times τ T , f ;   s as follows [28,38]:
τ T , f = 3 α e , f / ( δ t c 2 ) + 0.5   with   α e , f = k e , f / ( ε ( ρ C p ) f ) ,  
τ T , s = 3 α e , s / ( δ t c 2 ) + 0.5   with   α e , s = k e , s / ( ( 1 ε ) ( ρ C p ) s ) ,  
where α e , f , s is the effective diffusivity.
The equilibrium distribution function g i , f ; s e q (Equations (34) and (35)) can be expressed as
g f , i e q = w i T f ( 1 + e i · u / ( ε c s 2 ) )     and   g s , i e q = w i T s ·  
The penultimate terms (source terms) S r i , f ;   s can be computed as follows [28,38]:
S r i ,   f = w i ( L a C p , f [ γ ( t + δ t ) γ ( t ) δ t ] + h ( T s T f ) ε ( ρ C p ) f ) ,  
S r i ,   s = w i ( h ( T s T f ) ( 1 ε ) ( ρ C p ) s ) ·  
As for the last term (Equation (34)), it can be computed as follows [39]:
q i = ( f i f i e q ) ( e i u ) ( e i u ) : Δ u ·
The macroscopic temperature can be computed from
T f = g f i   and   T s = g s i ·  

4. Mesh Control and Code Validation

For the sake of brevity, validation and grid dependency analyses were limited to two cases that were deemed relevant.

4.1. Mesh Control

To achieve the grid-mesh test, simulations were performed for Reynolds numbers of 200 and 400 using four grids, i.e., 100 × 50 , 200 × 100 , 300 × 150 , and 350 × 175 . The dimensionless U -velocity is depicted in Figure 3 using these grids. As can be seen, the predicted values were very close to each other. As illustrated, the maximum difference between the first two meshes was approximately 0.8%. Then, it was reduced to reach a deviation of 0.2% between the last three grids. This suggests that the solution became independent from the 200 × 100 grid. Therefore, such a grid was selected for the remaining computations.

4.2. Code Validation

It should be stressed that our in-house code was already validated [23]. However, before presenting and commenting on the results in the dedicated section, we ensured to further validate it using other previously published benchmarks.
For this ultimate validation, we compared the results obtained using the present thermal SRT–LBM with those of References [40,41]. Figure 4 shows the comparison of the dimensionless velocity and temperature results generated by forced convection in a rectangular porous channel differentially heated via its two lower and upper walls along the line X = 0.5 for three selected Da numbers of 0.01, 0.05, and 0.1, under the LTE conjecture. As shown in Figure 4a, the permeability increased with the Da number, thereby reducing the velocity profile flatness. As for the thermal field, the viscous effects decreased when the Da number increased (Figure 4b). As noted, our predictions corroborated these selected benchmarks. Furthermore, we supported our findings with maximum errors (%), which are gathered in Table 1.
Figure 5 depicts the comparison of fluid and solid temperature evolution ( Θ f ,   Θ s ) in a square domain including a porous metallic foam filled with PCM under natural convection with results of Reference [41] at Y = 0.5 and D a = 10 2 ,   Pr = 50 ,   R a = 10 6 ,   S t e = 1 ,   N u i = 0 . As can be seen, excellent matching was observed.
To sum up, such comparisons highlight good agreement with previous studies, further confirming the reliability of the built code.

5. Results and Comments

It is worth pointing out that that it is the numerical simulation of unsteady forced convection flow in an open channel filled with porous medium/PCM (see Section 2 and Section 3) via a thermal SRT–LBM which was targeted. In this study, it was the effect of pore density ω ( P P I = 10 ,   30 , and 60 ) for three porosity values ( ε = 0.7 ,   0.8 , and 0.9 ) and two Re numbers (200 and 400) which was mainly investigated, while the other parameters such as the numbers of Prandtl, Stephan, Eckert, and heat capacity ratio were held fixed to Pr = 50 ,   S t e = 1 ,   E c = 0 ,   R c = 1 .

5.1. PPI Effect on Velocity Field

Figure 6a–f illustrate the PPI effect on the streamwise velocity ( U ) during charging and discharging processes. Already and as expected, PPI had an impact on such a velocity whatever the porosity. As shown, during the charging case, a low porosity (0.7) with a high PPI value (60) had a strong effect on such a velocity, which was slowed and undeveloped. It only started to exhibit an almost developed profile in the channel’s last third for the two Reynolds numbers (200 and 400) and at low PPI (=10), demonstrating that the force convection was weak. Likewise, it appeared that forced convection acted in the first third of the channel for the same porosity ( ε = 0.7 ) at PPI = 10 and 30 when Re increased. At PPI = 30 and at low porosity (0.7), forced convection mainly affected the channel middle (red zone). As for PPI = 60 and ε = 0.7 , the U -velocity presented an increasingly twisted profile.
During the discharging process (Figure 6a–c), for the two Re values (Re = 200 and 400) and three porosity values, the increase in PPI slowed down the flow, revealing the convection’s role as being lesser.
Figure 6d–f presents the dynamic U-contours. They show that PPI had a manifest influence on such a velocity during the charging process. It stands to reason that this comment remains in the event of the discharging process even if it is not depicted here for the sake of brevity.

5.2. PPI Effect on the PCM and Metal Foam Temperature

To better determine the effect induced by the PPI and the porosity, the PCM temperature ( Θ f ) during charging and discharging is plotted in Figure 7a–c. As can be seen, the metal foam temperature ( Θ s ) was generally higher than that of the PCM temperature ( Θ f ) in the first two-thirds of the channel regardless of the porosity, the pore density, and Re. In this same region, the PCM temperature decreased with the increase in PPI. This demonstrates that, for a larger PPI, forced convection is limited due to the large specific surface of the metallic structure and its high conductivity compared to the PCM (paraffin). It can be observed that, as time elapsed, the forced convection strengthened, thereby raising the liquid PCM temperature, which went beyond the metal foam temperature in the channel’s last third. In addition, as shown in Figure 7a–c, as the porosity decreased and the PPI increased, the difference | Θ f Θ s | became larger, proving once more that LTNE is indeed involved. On the other hand, during the discharge process, Θ s was always higher than Θ f . However, the difference | Θ f Θ s | decreased as the PPI increased, restricting forced convection and showing that LTNE decreased and approximated (tended toward) LTE. In this case, only one energy equation (instead of two) would suffice.

5.3. PPI Effect on Melting Front and PCM Temperature Field

The melting evolution with the PCM temperature distribution is exhibited in Figure 8a–i at a Reynolds number (Re) of 200 . Note that the melt front mushy zone is highlighted with colors other than red and blue, denoting the liquid and solid PCM regions, respectively. It was found that, as time elapsed, the melting front advanced more quickly when PPI = 30 than with other values, while the melting approached its end after 600 s. However, a higher PPI (60) slowed the heat transfer progress and, therefore, the melting front evolution. For ε = 0.9 (Figure 8g–i), the increase in PPI improved the heat transfer between the PCM and metal foam and sped up the melting time due to the metal foam permeability influence.
The same trend can be seen in Figure 8d–f at ε = 0.8 . Simply put, the melting rate sped up for fairly low PPI values (30), while a larger PPI (60) mitigated and slowed the heat transfer rate and, therefore, the melting front evolution. However, the melting evolution increased with PPI and became stronger for higher porosity (0.9) as presented in Figure 8g–i owing to the increase in metal foam heat transfer. More specifically, a higher PPI and porosity (60 and 0.9) improved the heat transfer between the PCM and the metal foam for Re = 200 while reducing the melting time.
The distribution of streamlines, flow, and temperature fields during the charging process at Re = 400 are depicted in Figure 9a–i, for the same values of PPI and porosity as shown in the previous figures, i.e., 10 P P I 30 and 0.7 ε 0.9 .
For ε = 0.7 , the melting front advanced faster as time elapsed for small PPI (10 or 30) than larger PPI (60). As mentioned above, a larger PPI (60) associated with a small porosity (0.7) continued to slow the melting front evolution and limit forced convection even upon doubling Re. Meanwhile, considering ε = 0.8 and upon raising the PPI, it can be observed that the PCM melting front sped up even more quickly over time suggesting that the metallic foam has the capacity to further improve the transfer heat. As for ε = 0.9 with a PPI of 60 (the largest value deemed here) (Figure 9g–i), the melting front advanced rapidly and melted the whole PCM in a short time just above 600 s (not illustrated here).

6. Conclusions

This paper conducted a numerical study of the effect of pore density and porosity of a metallic foam on the phase change in an open channel under forced convection. Simulations were performed under LTNE conditions using the REV enthalpy–SRT–LB method. Effects of the studied parameters on the flow, thermal field, and melt front evolution were surveyed during the charging (melting) and discharging (solidifying) cycles, and demonstrated that the composite material insert has an undeniable effect on the phase change via its key parameters (PPI and porosity). Based on the investigation results, the following main conclusions are proposed:
  • During the charging process, increasing PPI decelerates the velocity distribution whatever the porosity, while lower values of PPI speed up the velocity field whatever the porosity.
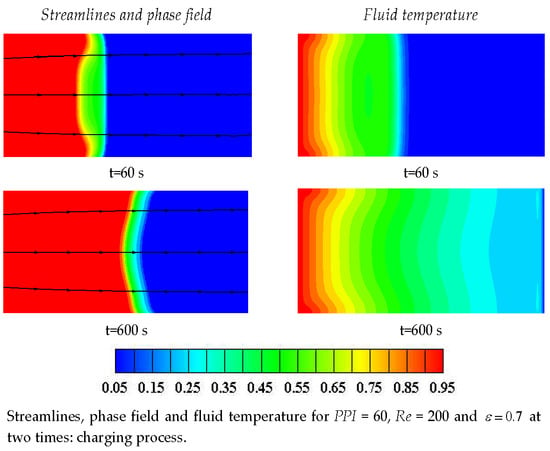
  • During the charging process, it is the thermal conduction which seems to be involved in the first two-thirds of the channel, then it is the forced convection which prevails within the channel’s last third.
  • During the discharging process, the increase in PPI improves thermal conduction and restricts forced convection.
  • At a moderate Reynolds number (200), an increase in PPI (60) slows down the melting front evolution for ε 0.8 while reducing the melting time at high porosity ( ε = 0.9 ).
  • On the other hand, at Re = 400, an increase in PPI (60) slows down the melting front evolution at low porosity ( ε = 0.7 ) while dropping the melting time for ε 0.8 .

Author Contributions

Conceptualization, H.D. and H.N.; methodology, R.M., H.D., H.N., and Z.Y.; software, R.M., H.D., and H.N.; validation, R.M., H.D., H.N., and Z.Y.; formal analysis, H.D., H.N., and Z.Y.; investigation, R.M., H.D., H.N., and Z.Y.; resources, R.M. and H.D.; data curation, R.M. and H.D.; writing—original draft, R.M., H.D., H.N., and Z.Y.; writing—review and editing, H.D. and H.N.; visualization, R.M. and H.D.; supervision, H.D. and H.N.; project administration, H.D.; funding acquisition, H.D. All authors read and approved the present version of the manuscript.

Funding

This study was funded by a scholarship which was granted by the National School of Engineers of Monastir/Monastir University as part of the doctoral thesis of the first author.

Acknowledgments

The authors would like to thank the National School of Engineers of Monastir/Monastir University for supporting this work. Besides, our heartfelt thanks go out to anonymous referees whose insightful comments have helped in improving this paper. All authors read and approved the present version of the manuscript. In addition, the order of authors was approved by mutual agreement among the authors.

Conflicts of Interest

The authors declare no potential conflicts of interest regarding authorship and/or publication of this paper. Financial support (scholarship) had no role in the study design, in the manuscript writing, or in the decision to publish the results.

Nomenclature

a s f Specific interfacial area ( m 1 )
B i Biot number, B i = h s f a s f H 2 / λ s
c Lattice speed ( m · s 1 )
C p Specific heat capacity at constant pressure ( KJ · Kg 1 · K 1 )
C s Sound speed ( m · s 1 )
D a Darcy number, D a = K · H 2
d f Ligament diameter ( m )
d p Pore size ( m )
E c Eckert number, E c = U o 2 / ( C f · Δ T r e f )
e i Discrete velocity in direction i
F ε Forchheimer form coefficient
F Body force per unit mass ( N · Kg 1 )
F e i Discrete body force in direction i ( Kg · m 3 · s 1 )
f i ,   g i Distribution function in direction i
f i e q ,   g i e q Equilibrium distribution function in direction i
H Characteristic length scale ( m )
F ε Forchheimer form coefficient
h s f Interfacial heat transfer coefficient ( W · m 2 · K 1 )
K Porous medium permeability ( m 2 )
K R Thermal conductivity ratio, K R = λ s / λ f
L a Latent heat ( J · Kg 1 )
N u i Interstitial Nusselt number, N u i = h s f a s f H 2 / λ f
P Dimensionless pressure
p Pressure ( Pa )
Pr Prandtl number, P r = ν f / α f
R e Reynolds number, R e = U i n H / ν f
Re d Pore Reynolds number, Re d = Re d p / ε H
R c Heat capacity ratio, R c = ( ρ C p ) s / ( ρ C p ) f
S t e Stefan number, ( S t e = C p ( T h T m ) / L a )
T Temperature ( K )
T m PCM melting temperature ( K )
Θ Dimensionless temperature
t Time (s)
u ,   v Velocity ( m · s 1 )
U ,   V Dimensionless velocity
ω Pore density (PPI)
x ,   y Cartesian coordinates ( m )
X ,   Y Dimensionless coordinates
Greek symbols
Gradient operator
· Divergence operator
2 Laplacian operator
Δ x Lattice step
Δ t Time step
α Thermal diffusivity ( m 2 · s 1 )
ε Media porosity
λ Thermal conductivity ( W · m 1 · K 1 )
μ f Dynamic fluid viscosity ( Kg · m 1 · s 1 )
Γ PCM melting fraction
ν Kinematic viscosity ( m 2 · s 1 )
ρ Density ( Kg · m 3 · s 1 )
t ˜ Dimensionless time
τ Dimensionless relaxation time
w i Weight coefficient in direction i
Superscripts/subscripts
effEffective
fFluid
sSolid
hHot
mMelting
Initial state
inInlet
outOutlet
RefReference

References

  1. Farid, M.M.; Khudhair, A.M.; Razack, S.A.K.; Al-Hallaj, S. A review on phase change energy storage: Materials and applications. Energy Conv. Manag. 2004, 45, 1597–1615. [Google Scholar] [CrossRef]
  2. Giovannelli, A.; Bashir, M.A. Charge and Discharge Analyses of a PCM Storage System Integrated in a High-Temperature Solar Receiver. Energies 2017, 10, 1943. [Google Scholar] [CrossRef] [Green Version]
  3. Li, D.; Ding, Y.; Wang, P.; Wang, S.; Yao, H.; Wang, J.; Huang, Y. Integrating Two-Stage Phase Change Material Thermal Storage for Cascaded Waste Heat Recovery of Diesel-Engine-Powered Distributed Generation Systems: A Case Study. Energies 2019, 12, 2121. [Google Scholar] [CrossRef] [Green Version]
  4. Tao, Y.B.; You, Y.; He, Y.L. Lattice Boltzmann simulation on phase change heat transfer in metal foams/paraffin composite phase change material. Appl. Therm. Eng. 2016, 93, 476–485. [Google Scholar] [CrossRef]
  5. Zhao, C.; Lu, W.; Tian, Y. Heat transfer enhancement for thermal energy storage using metal foams embedded within phase change materials (PCMs). Sol. Energy 2010, 84, 1402–1412. [Google Scholar] [CrossRef] [Green Version]
  6. Chen, X.; Li, X.; Xia, X.; Sun, C.; Liu, R. Thermal performance of a pcm-based thermal energy storage with metal foam enhancement. Energies 2019, 12, 3275. [Google Scholar] [CrossRef] [Green Version]
  7. Cui, H. Experimental investigation on the heat charging process by paraffin filled with high porosity copper foam. Appl. Therm. Eng. 2012, 39, 26–28. [Google Scholar] [CrossRef]
  8. Yang, X.; Wei, P.; Wang, X.; He, Y.L. Gradient design of pore parameters on the melting process in a thermal energy storage unit filled with open-cell metal foam. Appl. Energy 2020, 268, 115019. [Google Scholar] [CrossRef]
  9. Sardari, P.T.; Mohammed, H.I.; Giddings, D.; Gillott, M.; Grant, D. Numerical study of a multiple-segment metal foam-PCM latent heat storage unit: Effect of porosity, pore density and location of heat source. Energy 2019, 189, 116108. [Google Scholar] [CrossRef]
  10. Lafdi, K.; Mesalhy, O.; Shaikh, S. Experimental study on the influence of foam porosity and pore size on the melting of phase change materials. J. Appl. Phys. 2007, 102, 083549. [Google Scholar] [CrossRef] [Green Version]
  11. Zhao, Y.; Zhao, C.Y.; Xu, Z.G.; Xu, H.J. Modeling metal foam enhanced phase change heat transfer in thermal energy storage by using phase field method. Int. J. Heat Mass Transf. 2016, 99, 170–181. [Google Scholar] [CrossRef]
  12. Zhu, F.; Zhang, C.; Gong, X. Numerical analysis on the energy storage efficiency of phase change material embedded in finned metal foam with graded porosity. Appl. Therm. Eng. 2017, 123, 256–265. [Google Scholar] [CrossRef]
  13. Yang, X.; Wang, W.; Yang, C.; Jin, L.; Lu, T.J. Solidification of fluid saturated in open-cell metallic foams with graded morphologies. Int. J. Heat Mass Transf. 2016, 98, 60–69. [Google Scholar] [CrossRef]
  14. Tao, Y.B.; He, Y.L. Effects of natural convection on latent heat storage performance of salt in a horizontal concentric tube. Appl. Energy 2015, 143, 38–46. [Google Scholar] [CrossRef]
  15. Longeon, M.; Soupart, A.; Fourmigué, J.F.; Bruch, A.; Marty, P. Experimental and numerical study of annular PCM storage in the presence of natural convection. Appl. Energy 2013, 112, 175–184. [Google Scholar] [CrossRef]
  16. Wang, P.; Yao, H.; Lan, Z.; Peng, Z.; Huang, Y.; Ding, Y. Numerical investigation of PCM melting process in sleeve tube with internal fins. Energy Convers. Manag. 2016, 110, 428–435. [Google Scholar] [CrossRef]
  17. Guo, Z.; Zhao, T.S. Lattice Boltzmann model for incompressible flows through porous media. Phys. Rev. E 2002, 66, 036304. [Google Scholar] [CrossRef]
  18. Ma, Q.; Chen, Z.; Liu, H. Multiple-relaxation-time lattice Boltzmann simulation for flow, mass transfer, and adsorption in porous media. Phys. Rev. E 2017, 96, 013313. [Google Scholar] [CrossRef] [Green Version]
  19. Rong, F.; Guo, Z.; Chai, Z.; Shi, B. A lattice Boltzmann model for axisymmetric thermal flows through porous media. Int. J. Heat Mass Transf. 2010, 53, 5519–5527. [Google Scholar] [CrossRef]
  20. Wu, W.; Zhang, S.; Wang, S. A novel lattice Boltzmann model for the solid–liquid phase change with the convection heat transfer in the porous media. Int. J. Heat Mass Transf. 2017, 104, 675–687. [Google Scholar] [CrossRef]
  21. Gao, D.; Chen, Z. Lattice Boltzmann simulation of natural convection dominated melting in a rectangular cavity filled with porous media. Int. J. Therm. Sci. 2011, 50, 493–501. [Google Scholar] [CrossRef]
  22. Liu, Q.; He, Y.L. Double multiple-relaxation-time lattice Boltzmann model for solid–liquid phase change with natural convection in porous media. Phys. A 2015, 438, 94–106. [Google Scholar] [CrossRef] [Green Version]
  23. Mabrouk, R.; Dhahri, H.; Naji, H.; Hammouda, S.; Younsi, Z. Lattice Boltzmann simulation of forced convection melting of a composite phase change material with heat dissipation through an open-ended channel. Int. J. Heat Mass Transf. 2020, 153, 119606. [Google Scholar] [CrossRef]
  24. Jourabian, M.; Darzi, A.A.R.; Toghraie, D.; ali Akbari, O. Melting process in porous media around two hot cylinders: Numerical study using the lattice Boltzmann method. Phys. A 2018, 509, 316–335. [Google Scholar] [CrossRef]
  25. Nield, D.A.; Bejan, A. Convection in Porous Media, 4th ed.; Springer: New York, NY, USA, 2013. [Google Scholar]
  26. Gao, D.; Tian, F.B.; Chen, Z.; Zhang, D. An improved lattice Boltzmann method for solid-liquid phase change in porous media under local thermal non-equilibrium conditions. Int. J. Heat Mass Transf. 2017, 110, 58–62. [Google Scholar] [CrossRef] [Green Version]
  27. Al-Sumaily, G.F.; Thompson, M.C. Forced convection from a circular cylinder in pulsating flow with and without the presence of porous media. Int. J. Heat Mass Transf. 2013, 61, 226–244. [Google Scholar] [CrossRef]
  28. Gao, D.; Chen, Z.; Chen, L. A thermal lattice Boltzmann model for natural convection in porous media under local thermal non-equilibrium conditions. Int. J. Heat Mass Transf. 2014, 70, 979–989. [Google Scholar] [CrossRef]
  29. Zhao, W.; France, D.M.; Yu, W.; Kim, T.; Singh, D. Phase change material with graphite foam for applications in high-temperature latent heat storage systems of concentrated solar power plants. Renew. Energy 2014, 69, 134–146. [Google Scholar] [CrossRef]
  30. Rabhi, R.; Amami, B.; Dhahri, H.; Mhimid, A. Entropy generation for an axisymmetric MHD flow under thermal non-equilibrium in porous micro duct using a modified lattice Boltzmann method. J. Magn. Magn. Mater. 2016, 419, 521–532. [Google Scholar] [CrossRef]
  31. Joshi, V.; Rathod, M.K. Constructal enhancement of thermal transport in metal foam-PCM composite-assisted latent heat thermal energy storage system. Numer. Heat Tra-Appl. 2019, 75, 413–433. [Google Scholar] [CrossRef]
  32. Chen, C.C.; Huang, P.C.; Hwang, H.Y. Enhanced forced convective cooling of heat sources by metal-foam porous layers. Int. J. Heat Mass Transf. 2013, 58, 356–373. [Google Scholar] [CrossRef]
  33. Settar, A.; Nebbali, R.; Madani, B.; Abboudi, S. Numerical investigation of convective heat transfer in a plane channel filled with metal foam under local thermal non-equilibrium. Mech. Ind. 2015, 16, 504. [Google Scholar] [CrossRef]
  34. Boomsma, K.; Poulikakos, D. On the effective thermal conductivity of a three-dimensionally structured fluid-saturated metal foam. Int. J. Heat Mass Transf. 2001, 44, 827–836. [Google Scholar] [CrossRef]
  35. Boomsma, K.; Poulikakos, D. Corrigendum. Int. J. Heat Mass Transf. 2011, 1, 746–748. [Google Scholar] [CrossRef]
  36. Al-Sumaily, G.F.; Nakayama, A.; Sheridan, J.; Thompson, M.C. The effect of porous media particle size on forced convection from a circular cylinder without assuming local thermal equilibrium between phases. Int. J. Heat Mass Transf. 2012, 55, 3366–3378. [Google Scholar] [CrossRef]
  37. Yehya, A.; Naji, H.; Zalewski, L. Experimental and numerical characterization of an impure phase change material using a thermal lattice Boltzmann method. Appl. Therm. Eng. 2019, 154, 738–750. [Google Scholar] [CrossRef]
  38. Guo, Z.; Zheng, C.; Shi, B.; Zhao, T.S. Thermal lattice Boltzmann equation for low Mach number flows: Decoupling model. Phys. Rev. E 2007, 75, 036704. [Google Scholar] [CrossRef]
  39. Shi, Y.; Zhao, T.S.; Guo, Z.L. Thermal lattice Bhatnagar-Gross-Krook model for flows with viscous heat dissipation in the incompressible limit. Phys. Rev. E 2004, 70, 066310. [Google Scholar] [CrossRef] [Green Version]
  40. Mahmud, S.; Fraser, R.A. Flow, thermal, and entropy generation characteristics inside a porous channel with viscous dissipation. Int. J. Therm. Sci. 2005, 44, 21–32. [Google Scholar] [CrossRef]
  41. Krishnan, S.; Murthy, J.Y.; Garimella, S.V. A two-temperature model for solid-liquid phase change in metal foams. J. Heat Transf. 2005, 127, 995–1004. [Google Scholar] [CrossRef] [Green Version]
Figure 1. Considered configuration view.
Energies 13 03979 g001
Figure 2. Typical two-dimensional (2D) domain sketch with the D2Q9 lattice.
Energies 13 03979 g002
Figure 3. Grid independent test of U-velocity profiles at X = 0.5 with Pr = 50 ,   K r = 10 + 3 ,   R c = 1 ,   D a = 10 3 ,   E c = 0 ,   ε = 0.7 , and ω = 10   P P I : (a) Re = 200 ; (b) Re = 400 .
Energies 13 03979 g003
Figure 4. U-velocity streamwise profiles (a) and temperature (b) set by three Da numbers. Comparison with Mahmud and Fraser’s results [40].
Energies 13 03979 g004
Figure 5. Dimensionless fluid and solid temperature evolution ( Θ f ,   Θ s ) vs. dimensionless transverse distance X at Y = 0.5 for D a = 10 2 ,   Pr = 50 ,   R a = 10 6 ,   S t e = 1 ,   N u i = 0 .
Energies 13 03979 g005
Figure 6. (a) Pore density effect on U-velocity during charging and discharging processes at ε = 0.7 : (left) Re = 200 ; (right) Re = 400 ; (b) Pore density effect on U-velocity during charging and discharging processes at ε = 0.8 : (left) Re = 200 ; (right) Re = 400 ; (c) Pore density effect on U-velocity during charging and discharging processes at ε = 0.9 : (left) Re = 200 ; (right) Re = 400 ; (d) Pore density effect on U-contours during charging process at ε = 0.7 : (e) Pore density effect on U-contours during charging process at ε = 0.8 ; (f) Pore density effect on U-contours during charging process at ε = 0.9 .
Energies 13 03979 g006aEnergies 13 03979 g006bEnergies 13 03979 g006c
Figure 7. (a) Pore density effect on the PCM temperature ( Θ f ) during charging and discharging processes at ε = 0.7 : (left) Re = 200 ; (right) Re = 400 ; (b) Pore density effect on the PCM temperature ( Θ f ) during charging and discharging processes at ε = 0.8 : (left) Re = 200 ; (right) Re = 400 ; (c) Pore density effect on the PCM temperature ( Θ f ) during charging and discharging processes at ε = 0.9 : (left) Re = 200 ; (right) Re = 400 .
Energies 13 03979 g007aEnergies 13 03979 g007b
Figure 8. (a) Streamlines, phase field, and fluid temperature for PPI = 10, Re = 200, and ε = 0.7 at two times: charging process; (b) Streamlines, phase field, and fluid temperature for PPI = 30, Re = 400, and ε = 0.7 at two times: charging process; (c) Streamlines, phase field, and fluid temperature for PPI = 60, Re = 400, and ε = 0.7 at two times: charging process; (d) Streamlines, phase field, and fluid temperature for PPI = 10, Re = 400, and ε = 0.8 at two times: charging process; (e) Streamlines, phase field, and fluid temperature for PPI = 30, Re = 400, and ε = 0.8 at two times: charging process; (f) Streamlines, phase field, and fluid temperature for PPI = 60, Re = 400, and ε = 0.8 at two times: charging process; (g) Streamlines, phase field, and fluid temperature for PPI = 10, Re = 400, and ε = 0.9 at two times: charging process; (h) Streamlines, phase field, and fluid temperature for PPI = 30, Re = 400, and ε = 0.9 at two times: charging process; (i) Streamlines, phase field, and fluid temperature for PPI = 60, Re = 400, and ε = 0.9 at two times: charging process.
Energies 13 03979 g008aEnergies 13 03979 g008bEnergies 13 03979 g008cEnergies 13 03979 g008dEnergies 13 03979 g008e
Figure 9. (a) Streamlines, phase field, and fluid temperature for PPI = 10, Re = 400, and ε = 0.7 at two times: charging process; (b) Streamlines, phase field, and fluid temperature for PPI = 30, Re = 200, and ε = 0.7 at two times: charging process; (c) Streamlines, phase field, and fluid temperature for PPI = 60, Re = 200, and ε = 0.7 at two times: charging process.; (d) Streamlines, phase field, and fluid temperature for PPI = 10, Re = 200, and ε = 0.8 at two times: charging process.; (e) Streamlines, phase field, and fluid temperature for PPI = 30, Re = 200, and ε = 0.8 at two times: charging process; (f) Streamlines, phase field, and fluid temperature for PPI = 60, Re = 200, and ε = 0.8 at two times: charging process.; (g) Streamlines, phase field, and fluid temperature for PPI = 10, Re = 200, and ε = 0.9 at two times: charging process.; (h) Streamlines, phase field, and fluid temperature for PPI = 30, Re = 400, and ε = 0.9 at two times: charging process.; (i) Streamlines, phase field, and fluid temperature for PPI = 60, Re = 200, and ε = 0.9 at two times: charging process.
Energies 13 03979 g009aEnergies 13 03979 g009bEnergies 13 03979 g009cEnergies 13 03979 g009dEnergies 13 03979 g009e
Table 1. Model validation (error %).
Da Error (%)/ U -VelocityError (%)/ Θ
0.012.010.81
0.051.180.47
0.11.150.42

