Frequency Stability Evaluation in Low Inertia Systems Utilizing Smart Hierarchical Controllers

 ,
,  , ,
, ,
Abstract
:
1. Introduction
1.1. Motivation
1.2. Literature Review
1.3. Contribution and Paper Structure
2. Case Study—Methodology
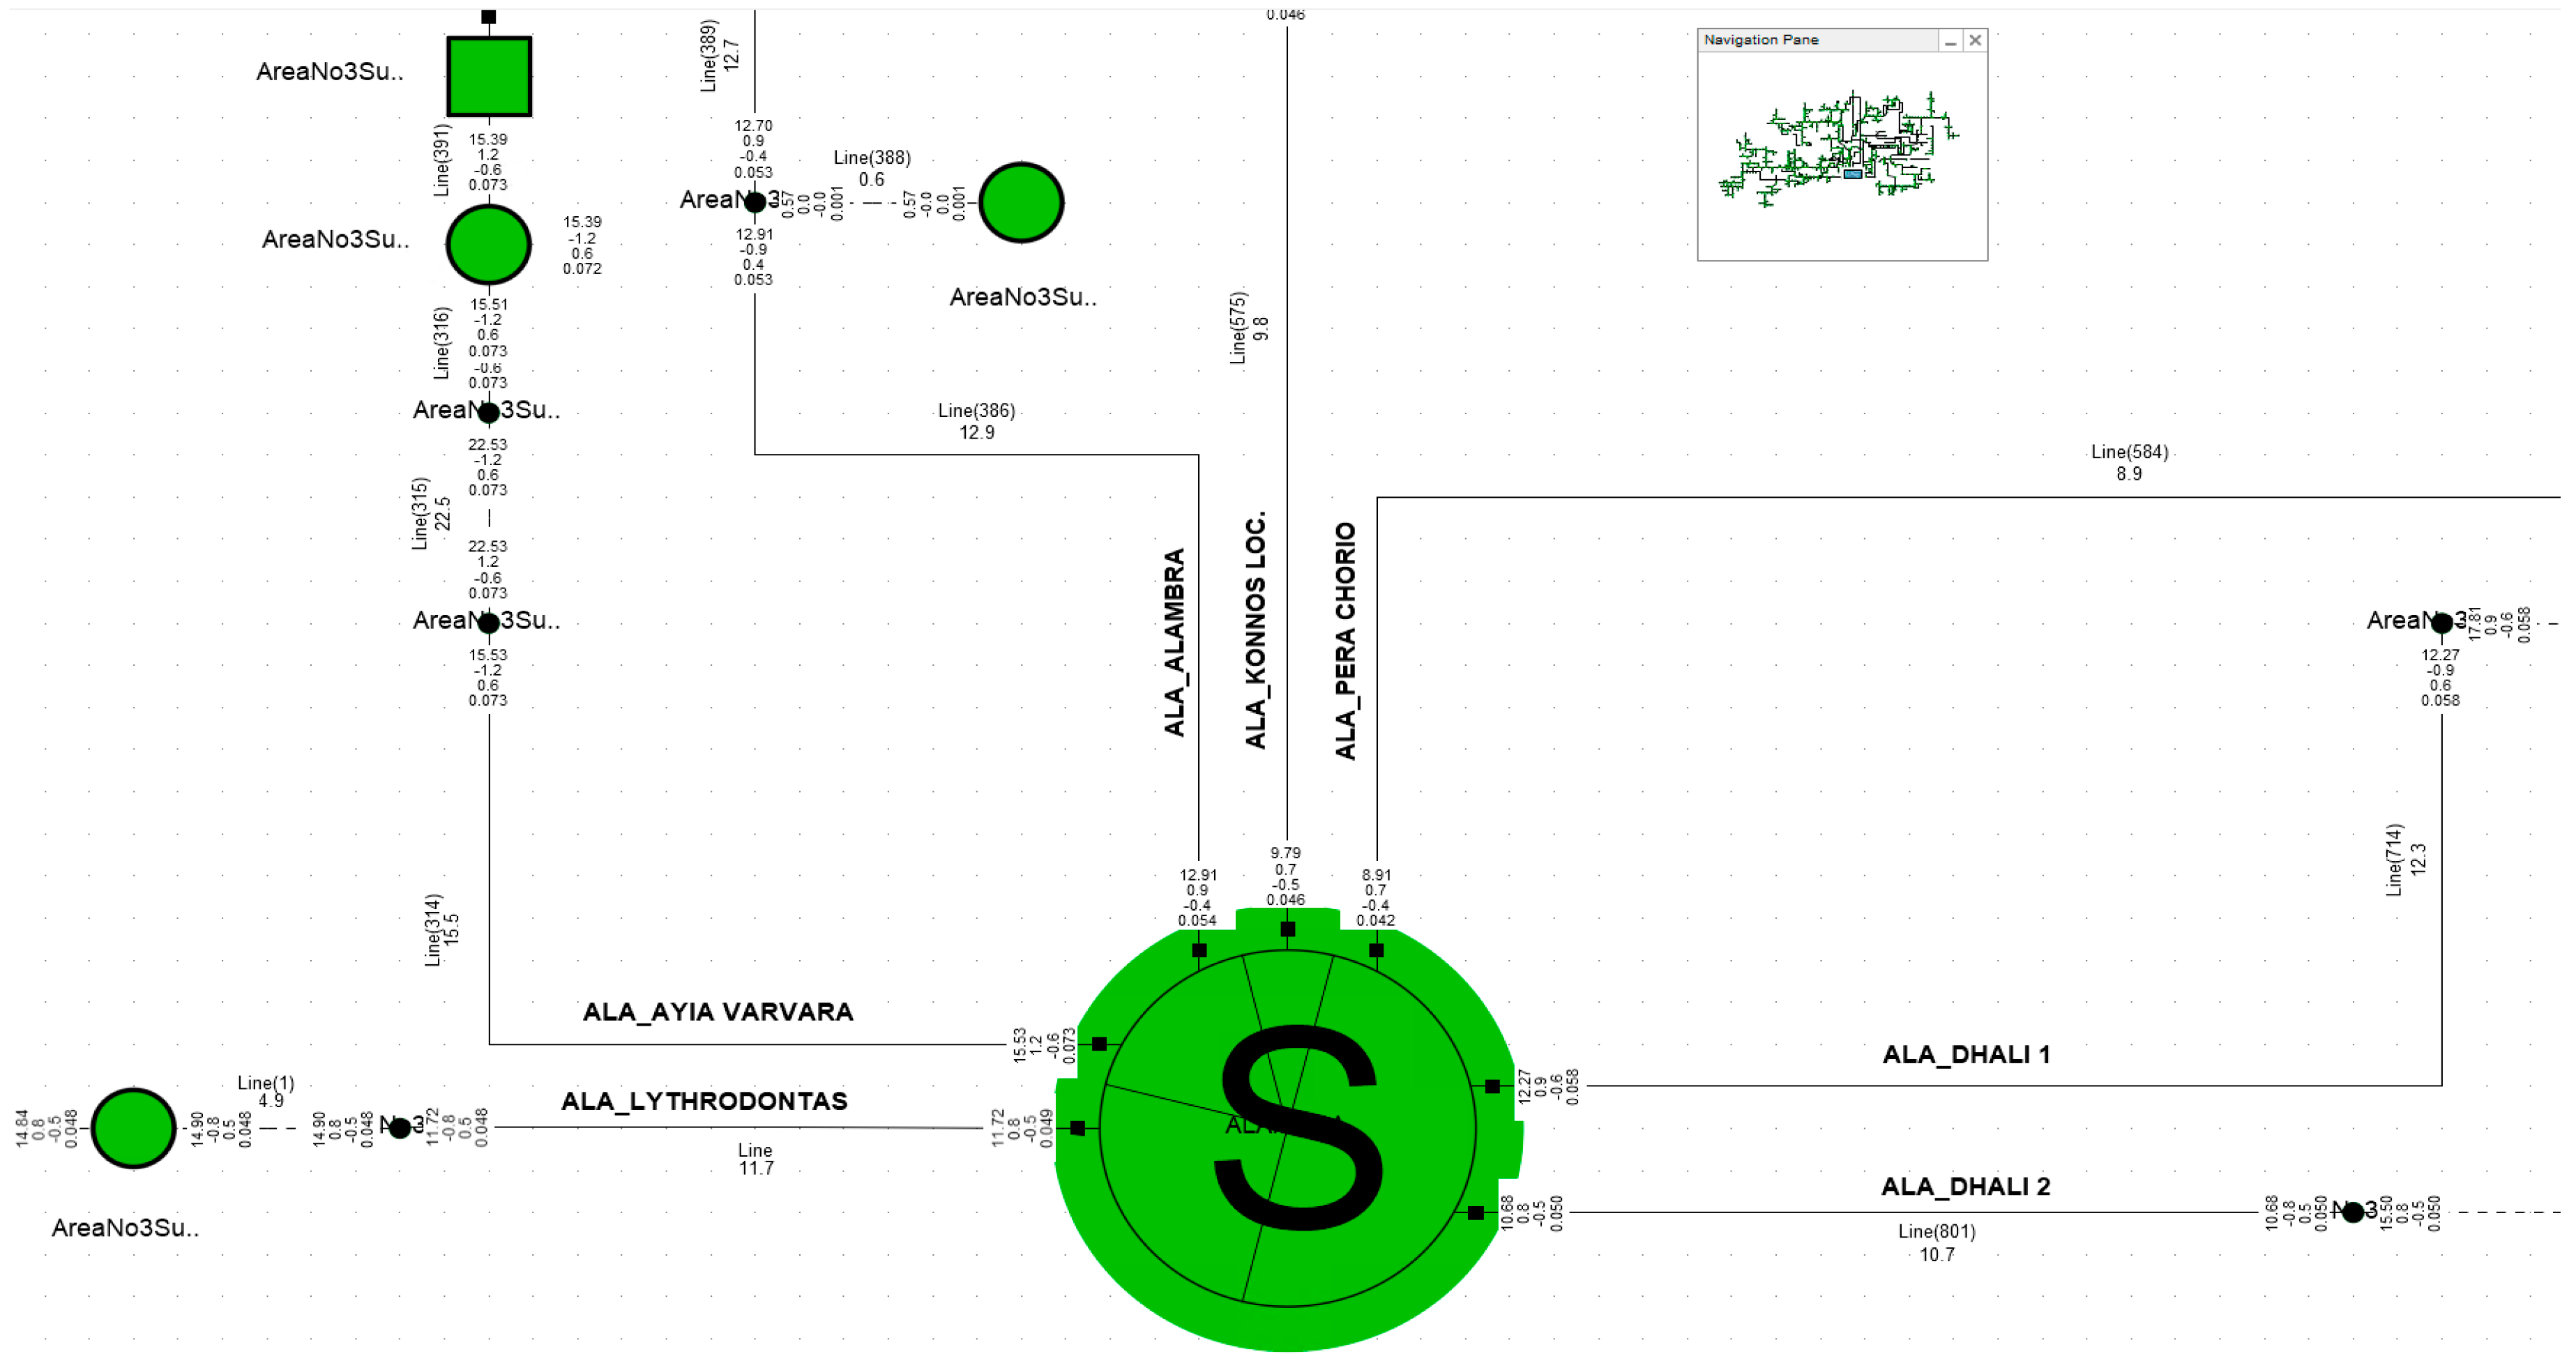
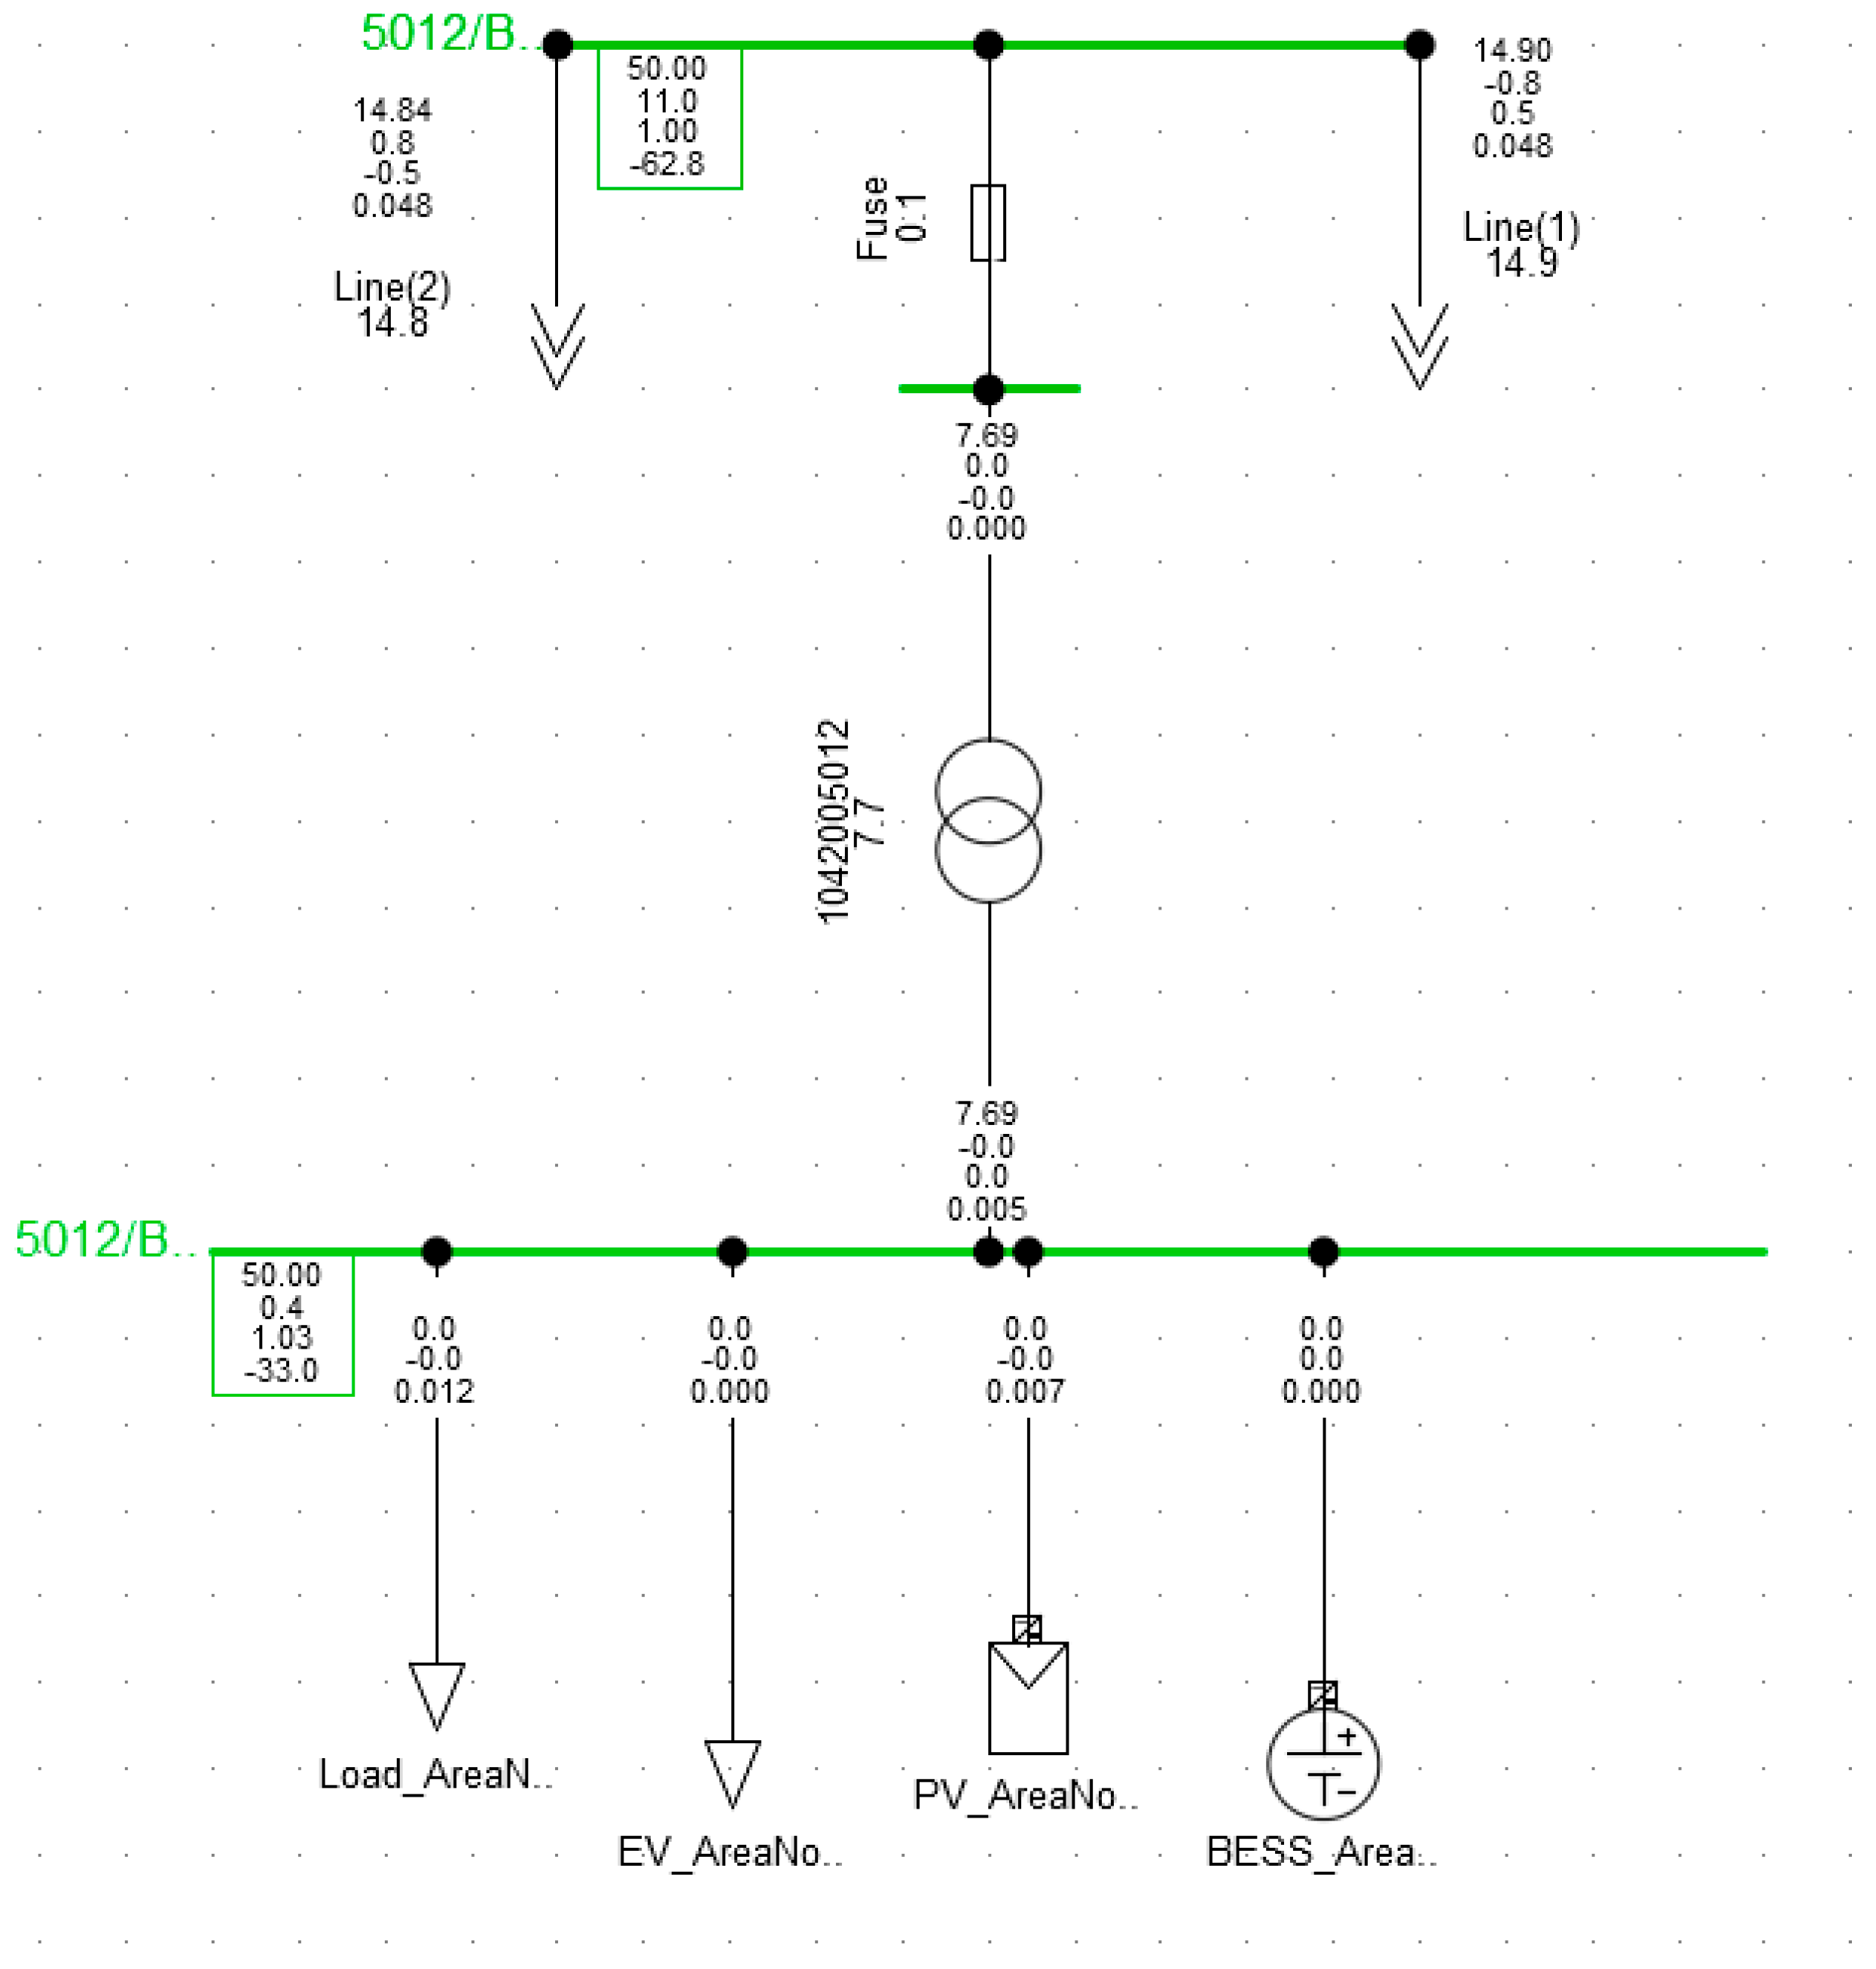
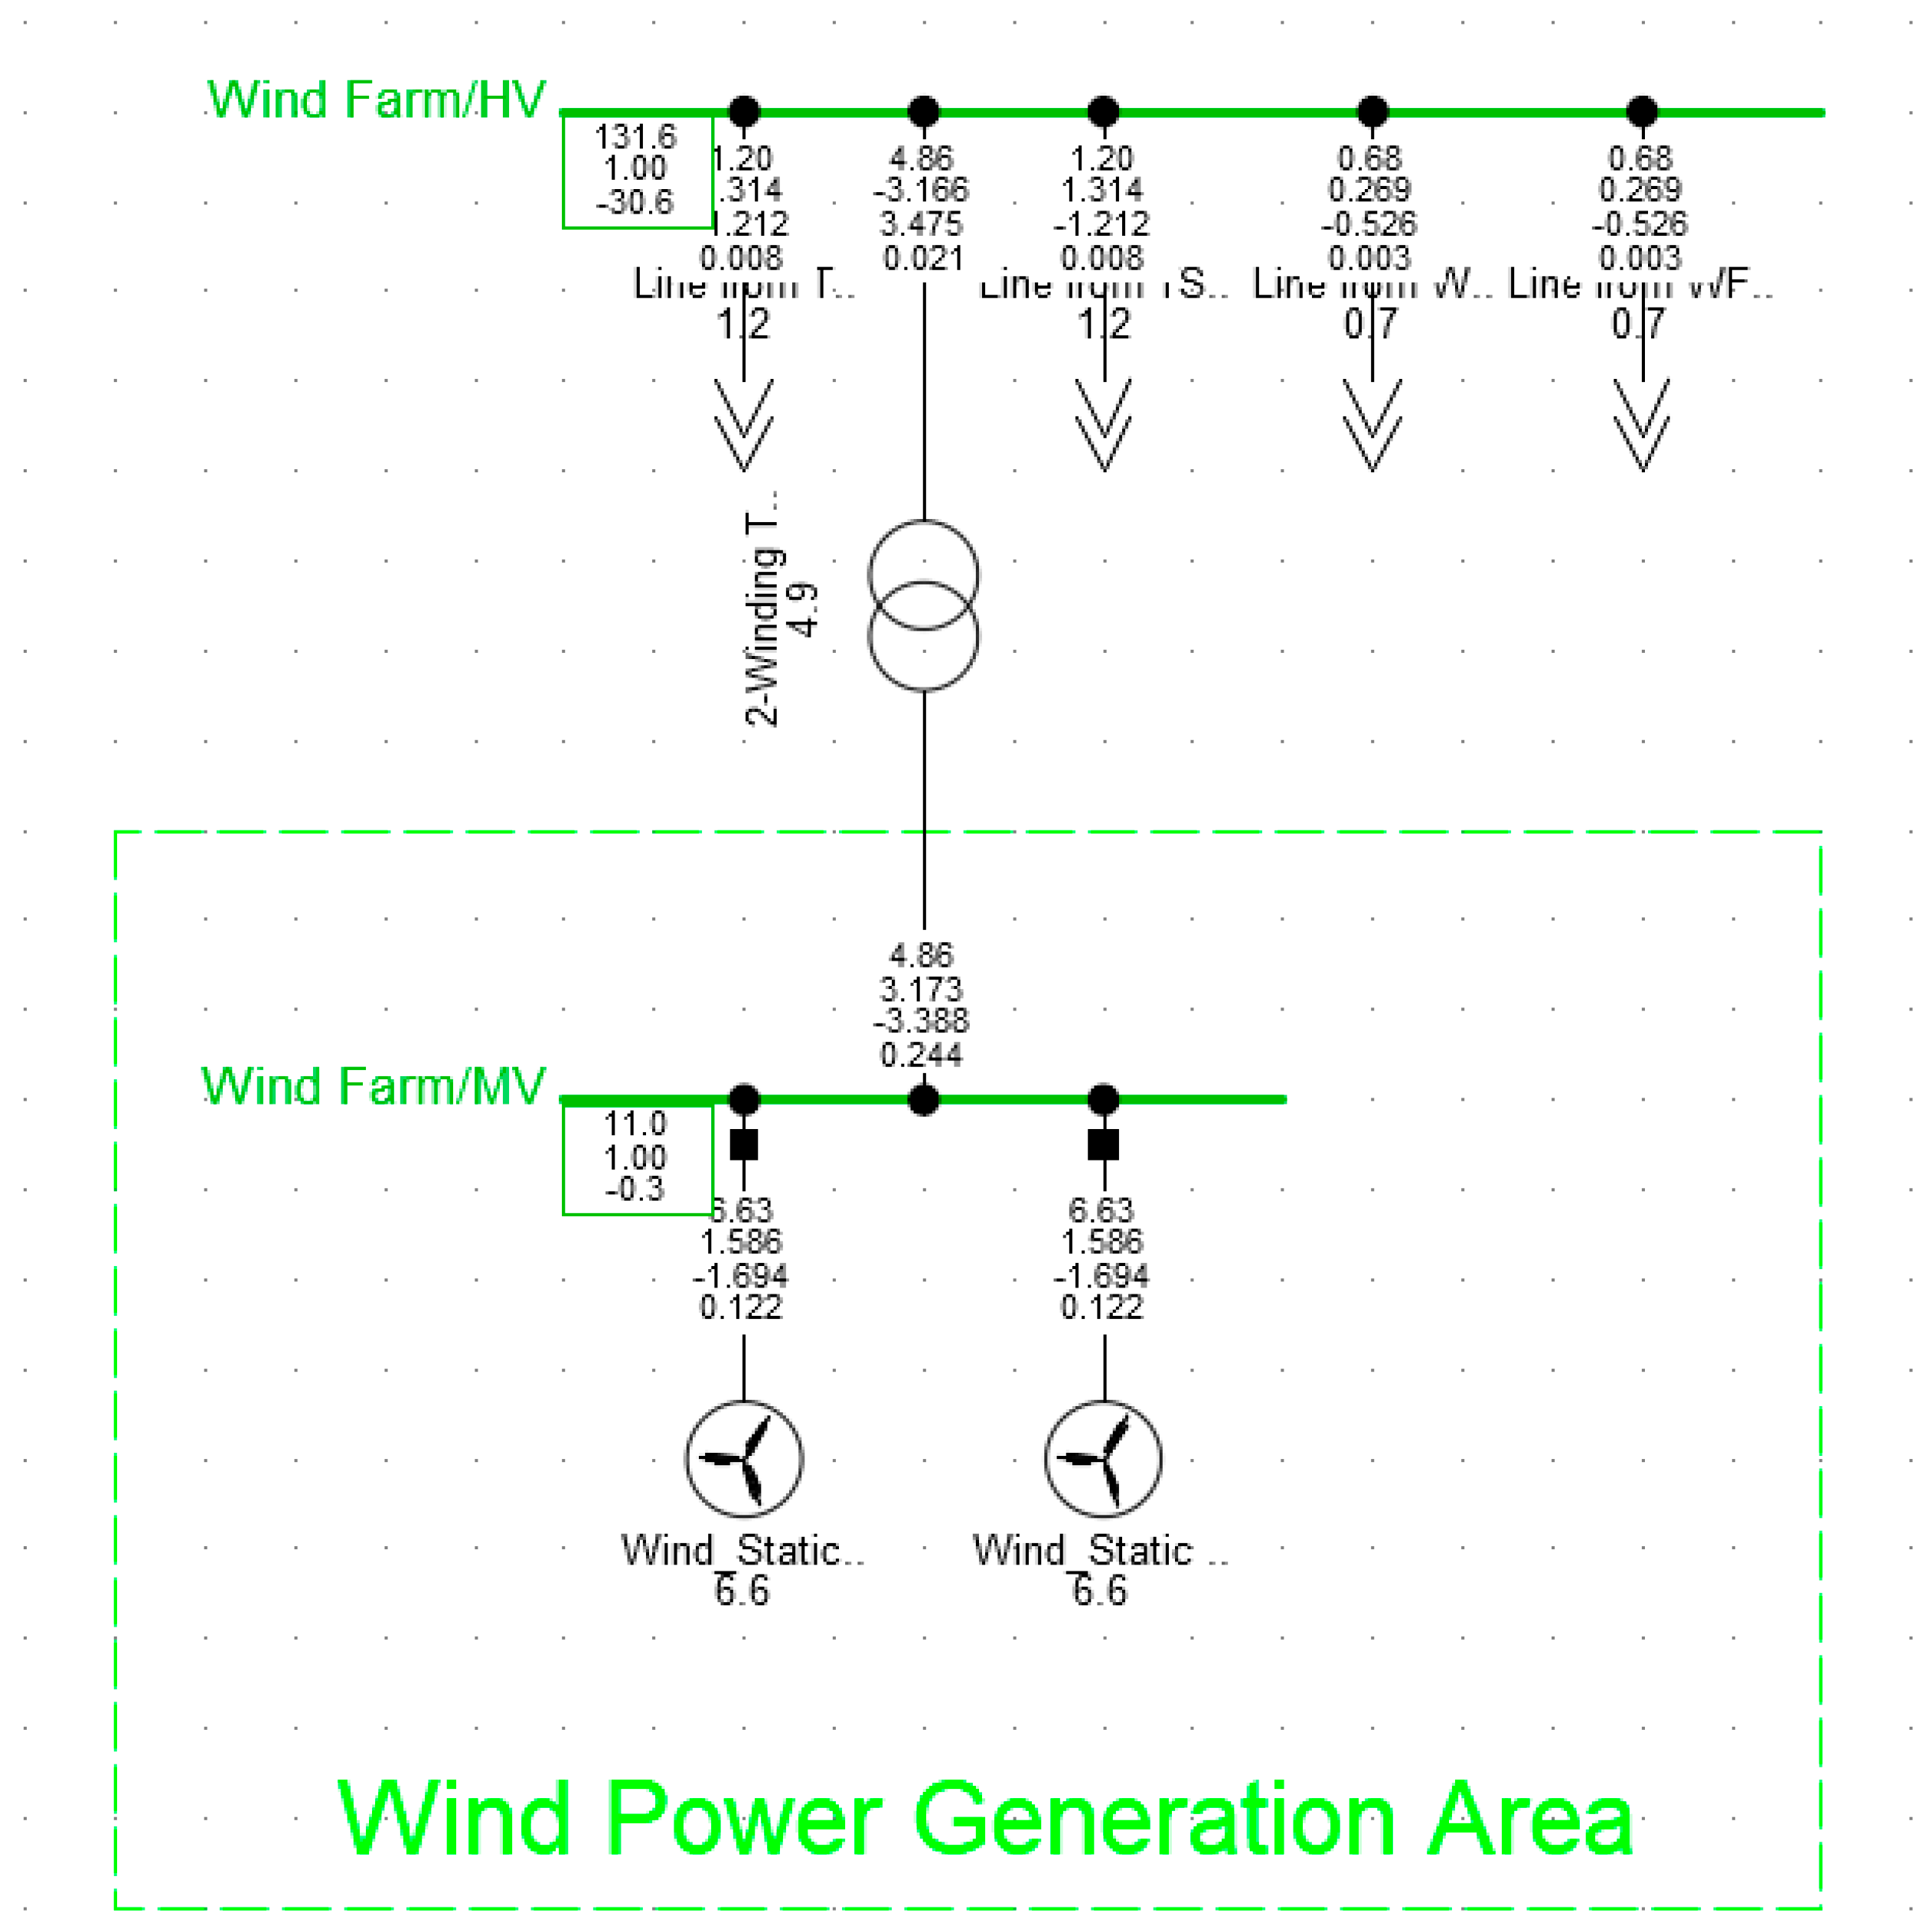
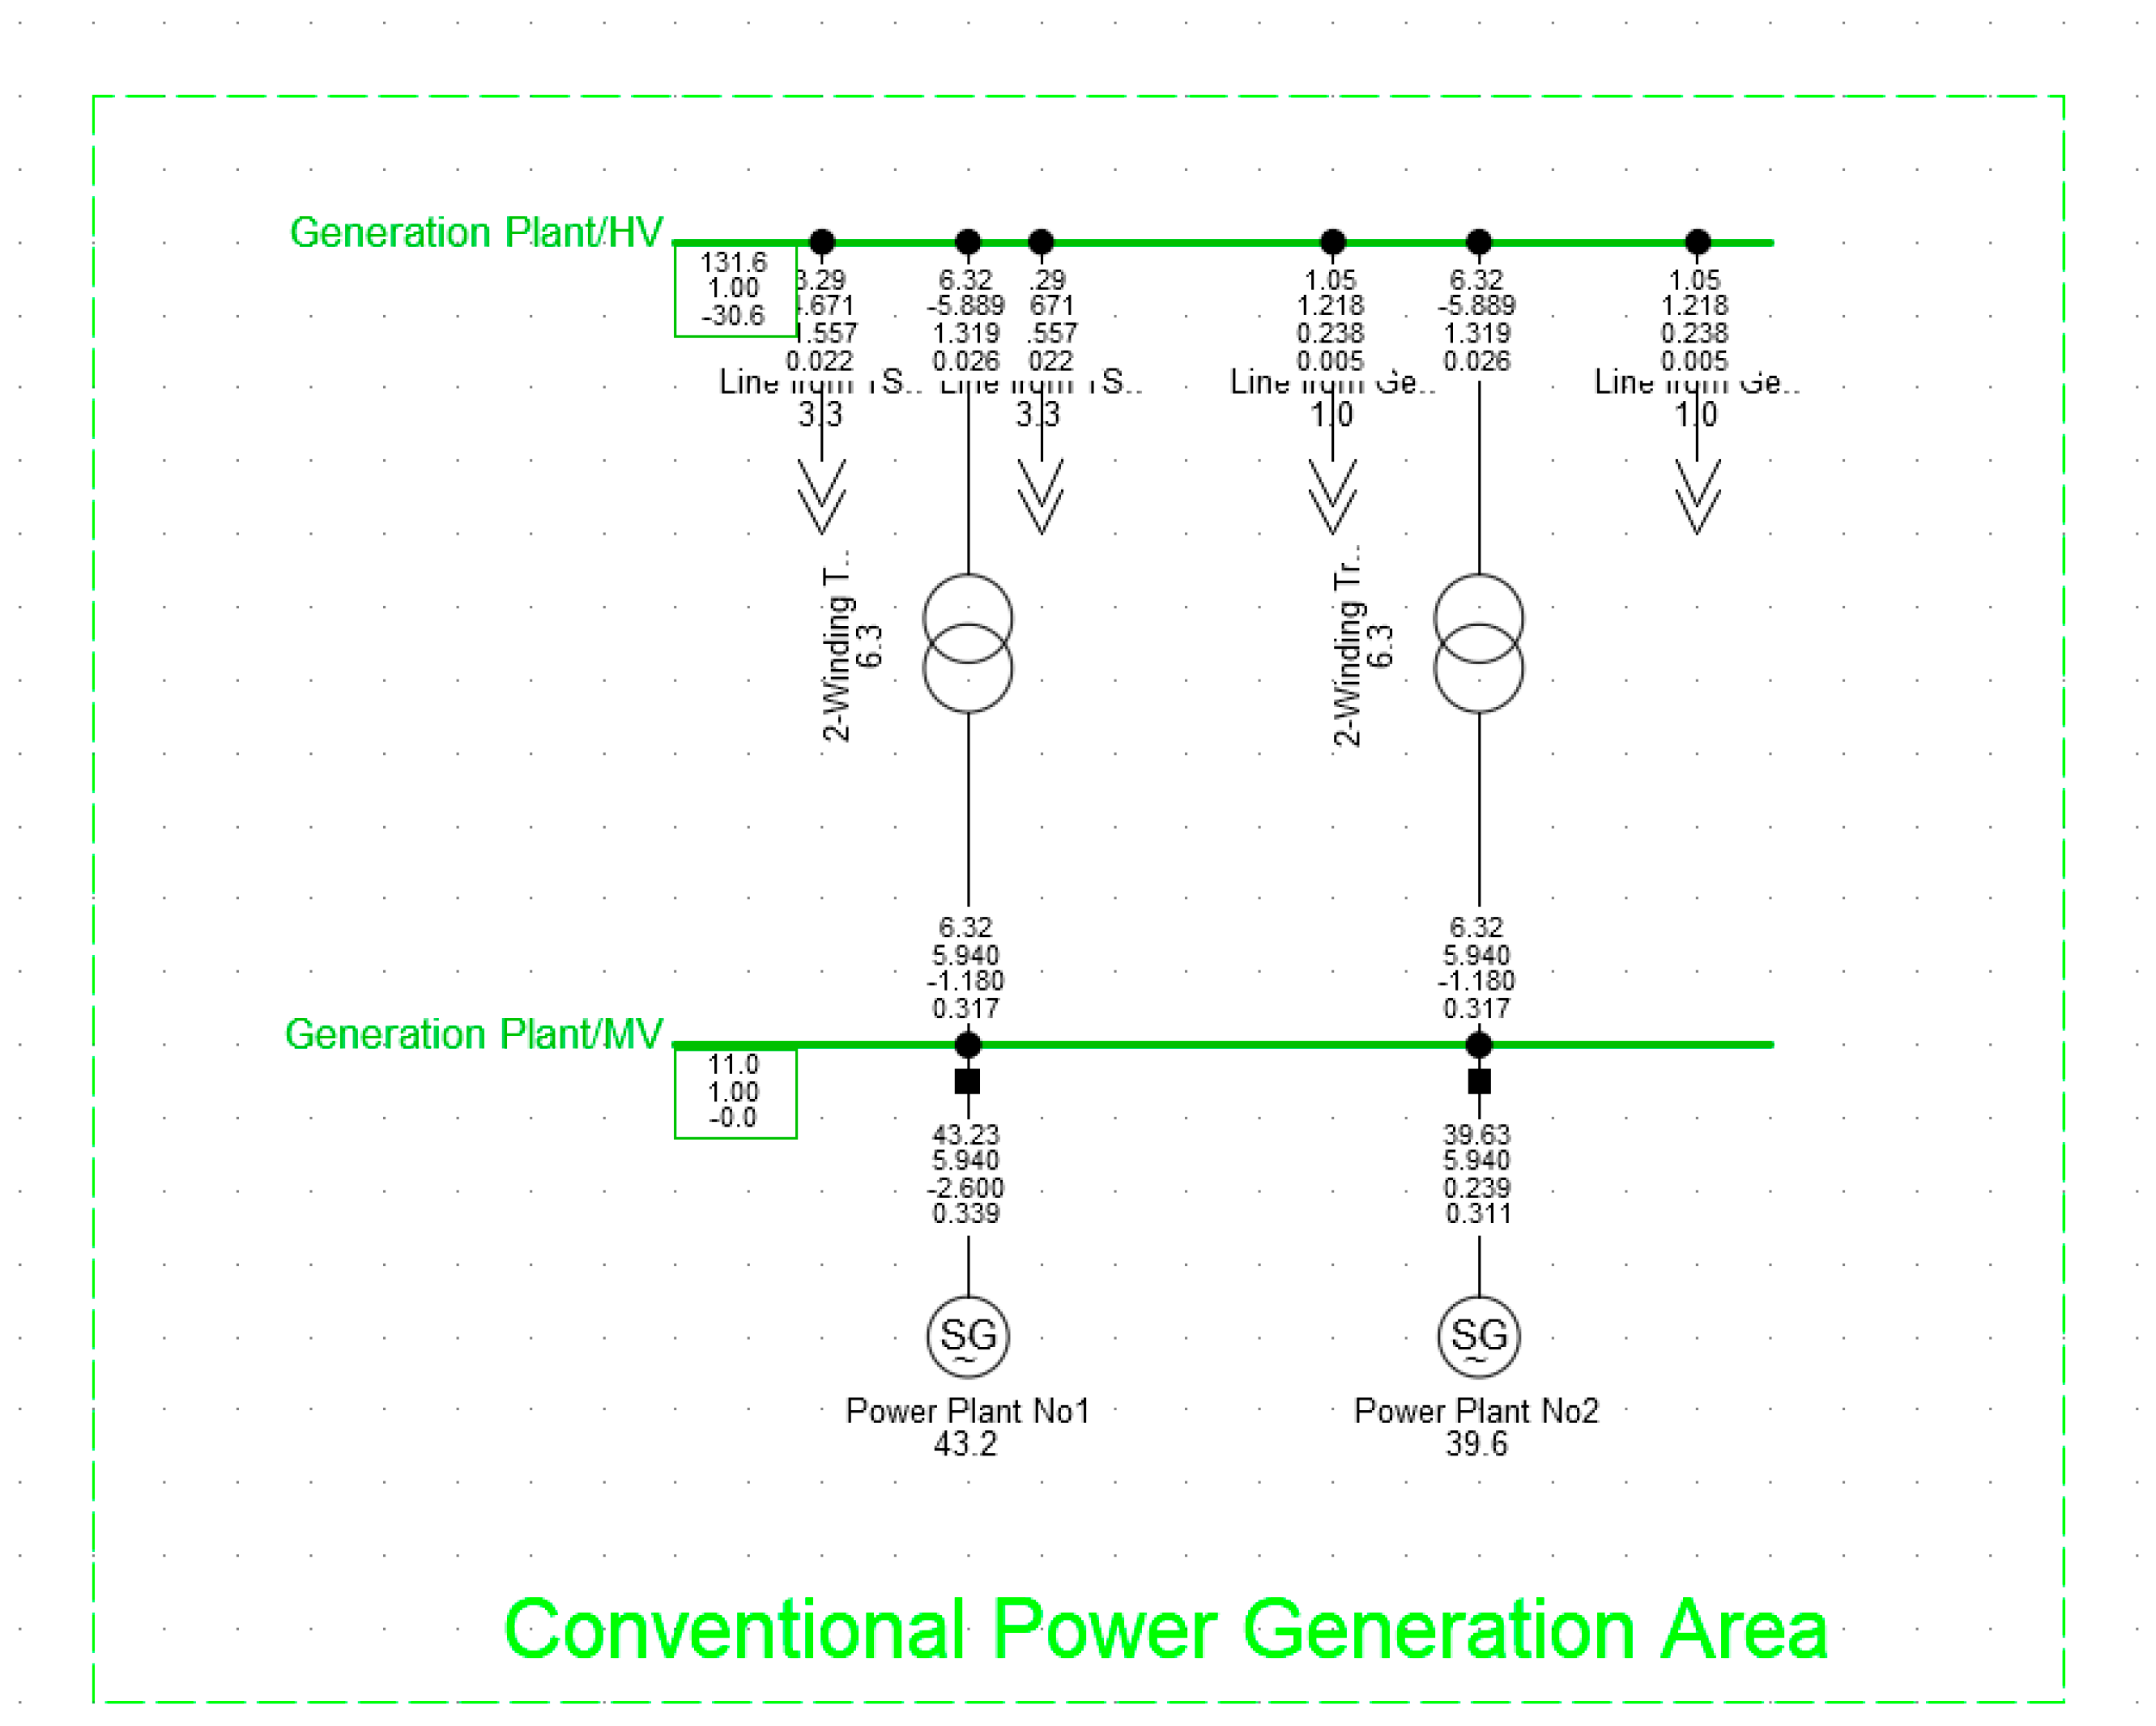
2.1. Grid System Under Investigation
2.2. Scenario
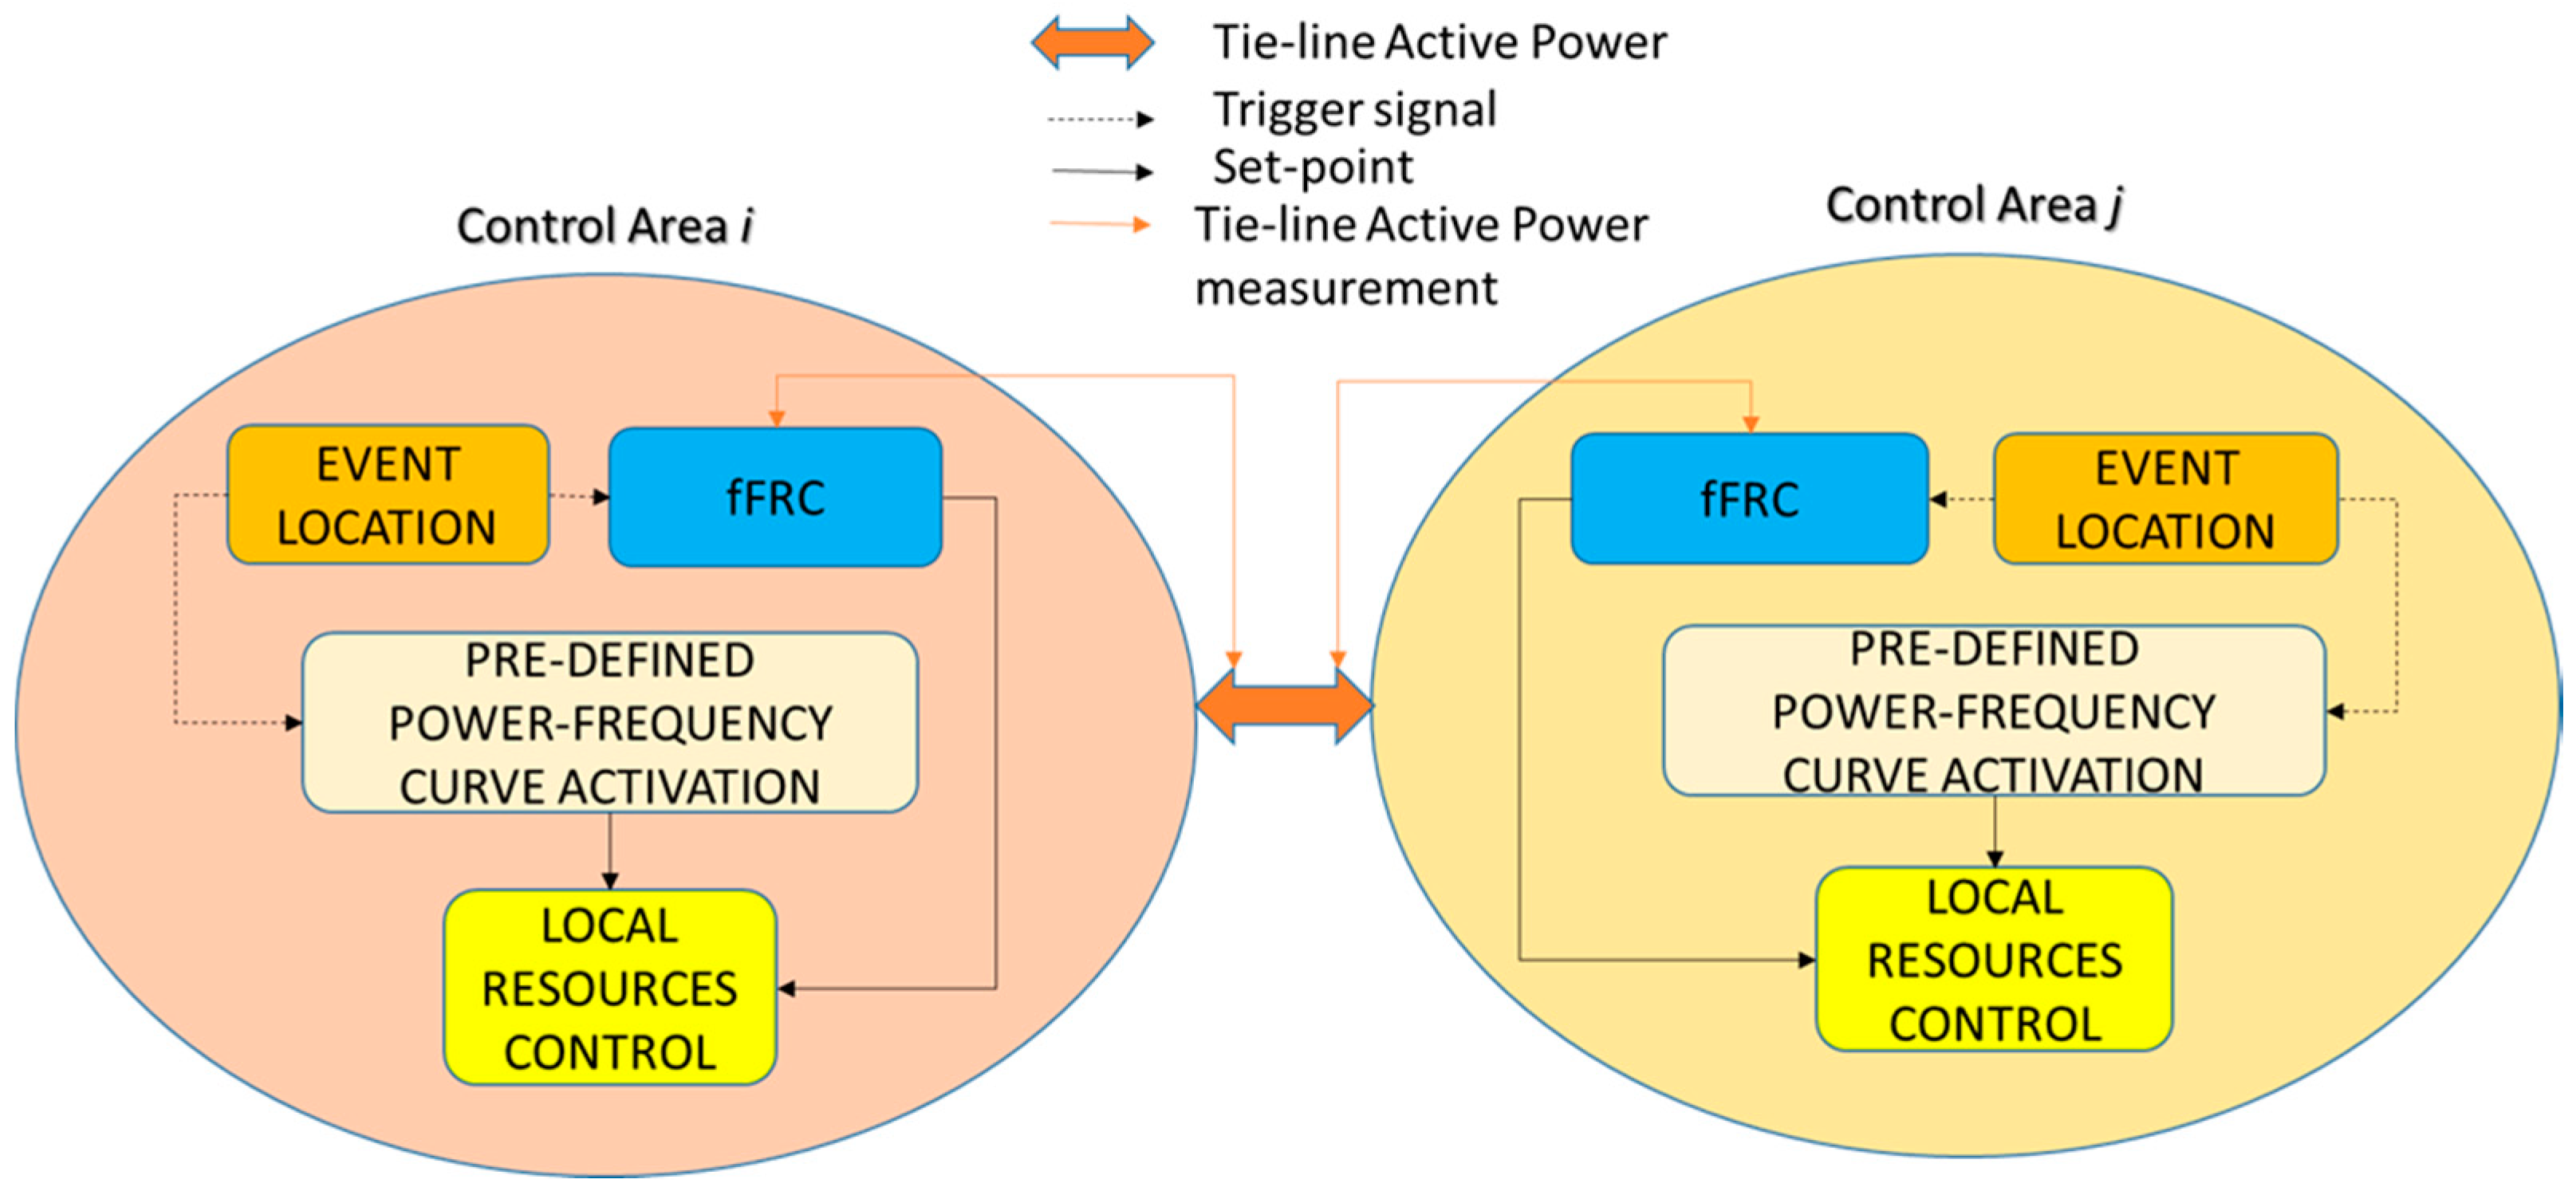
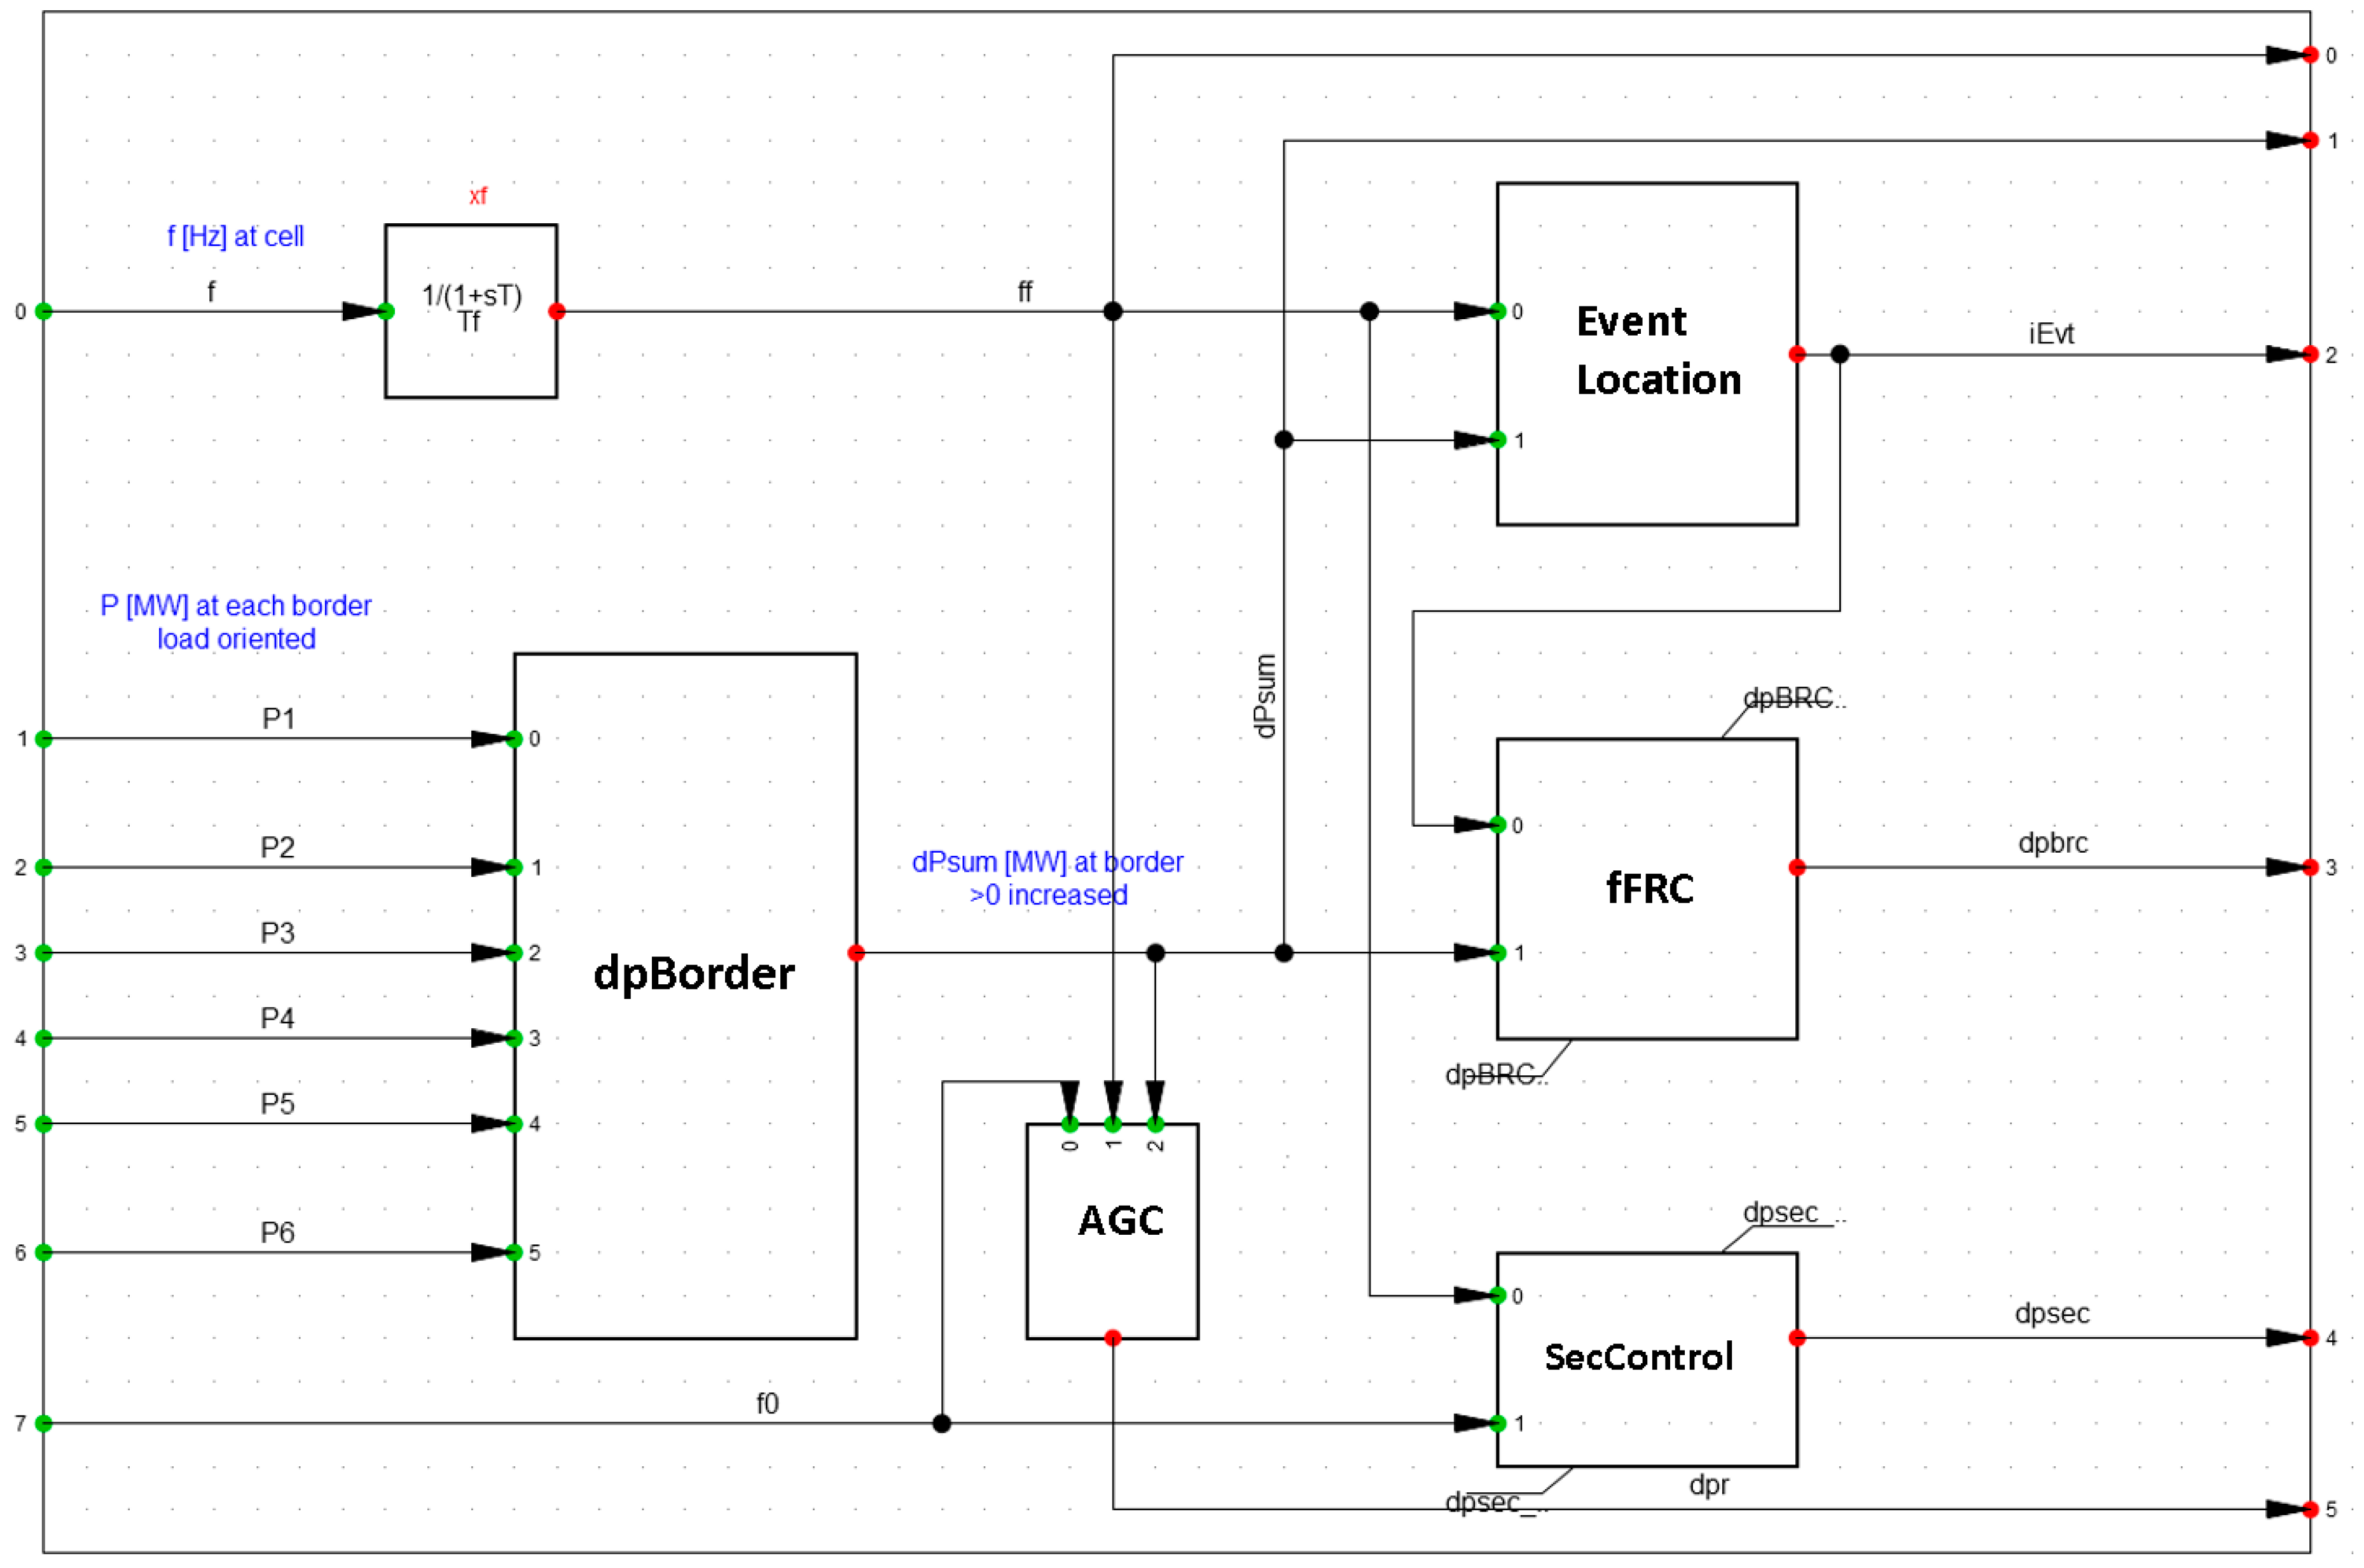
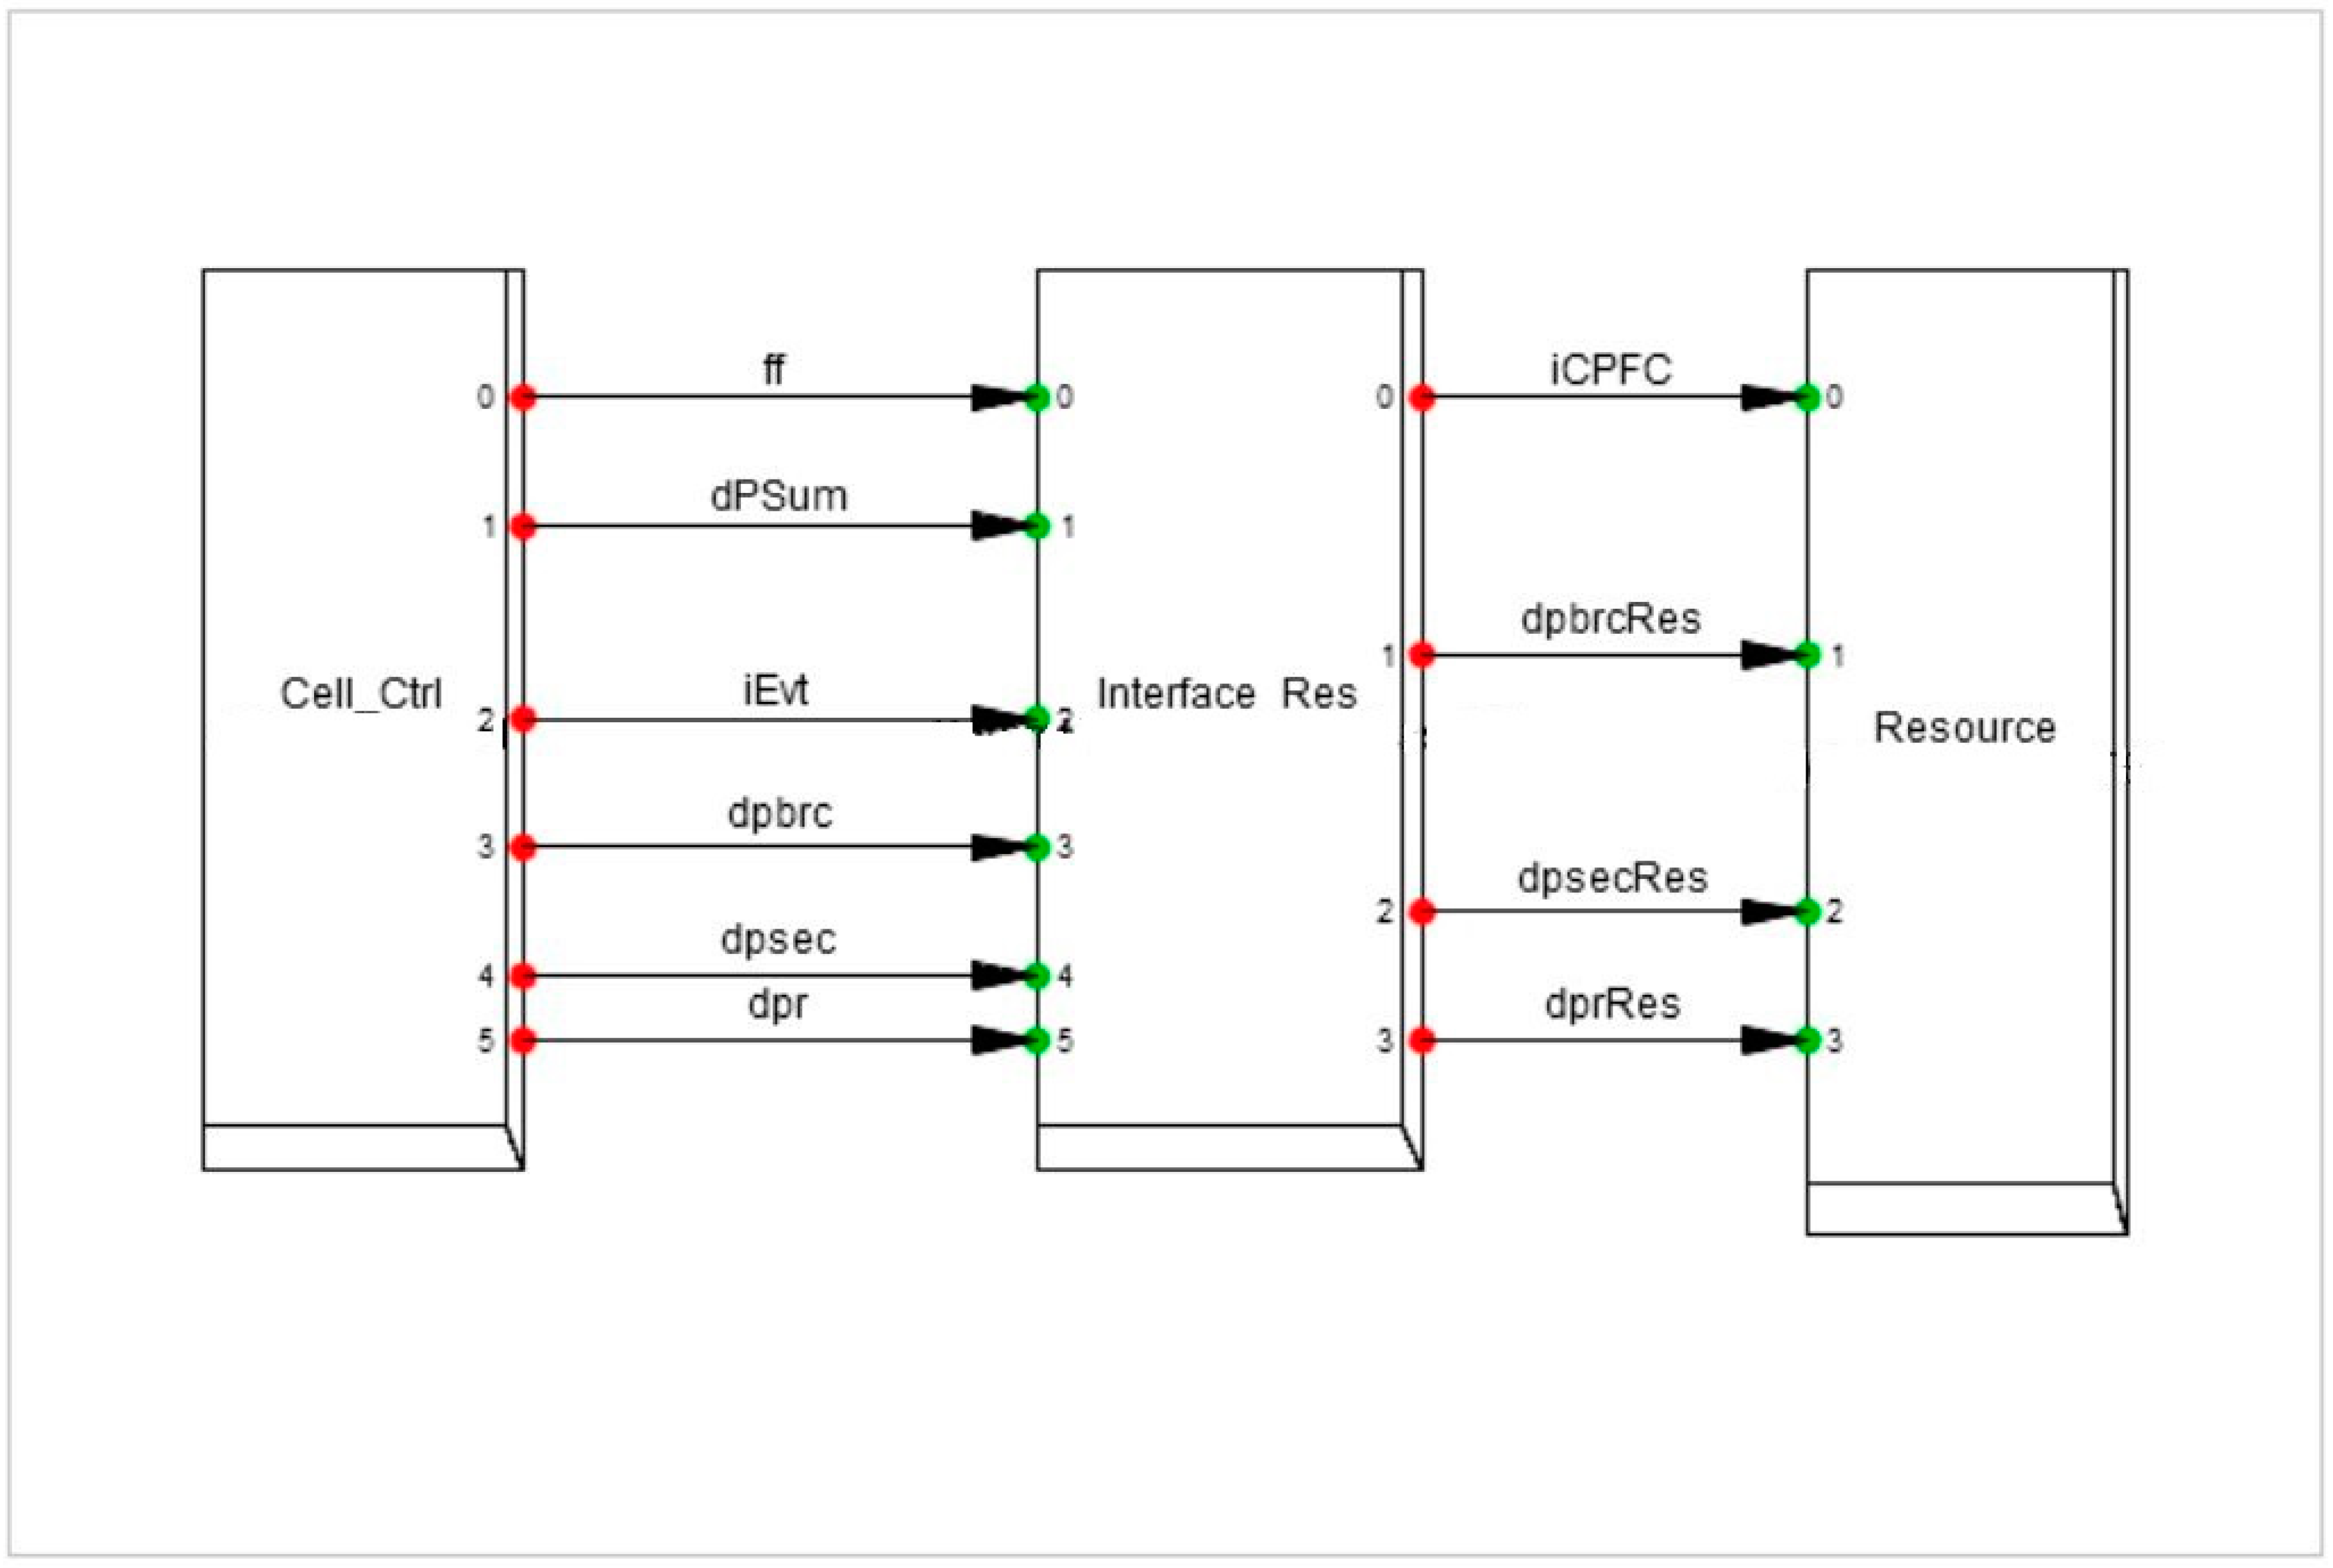
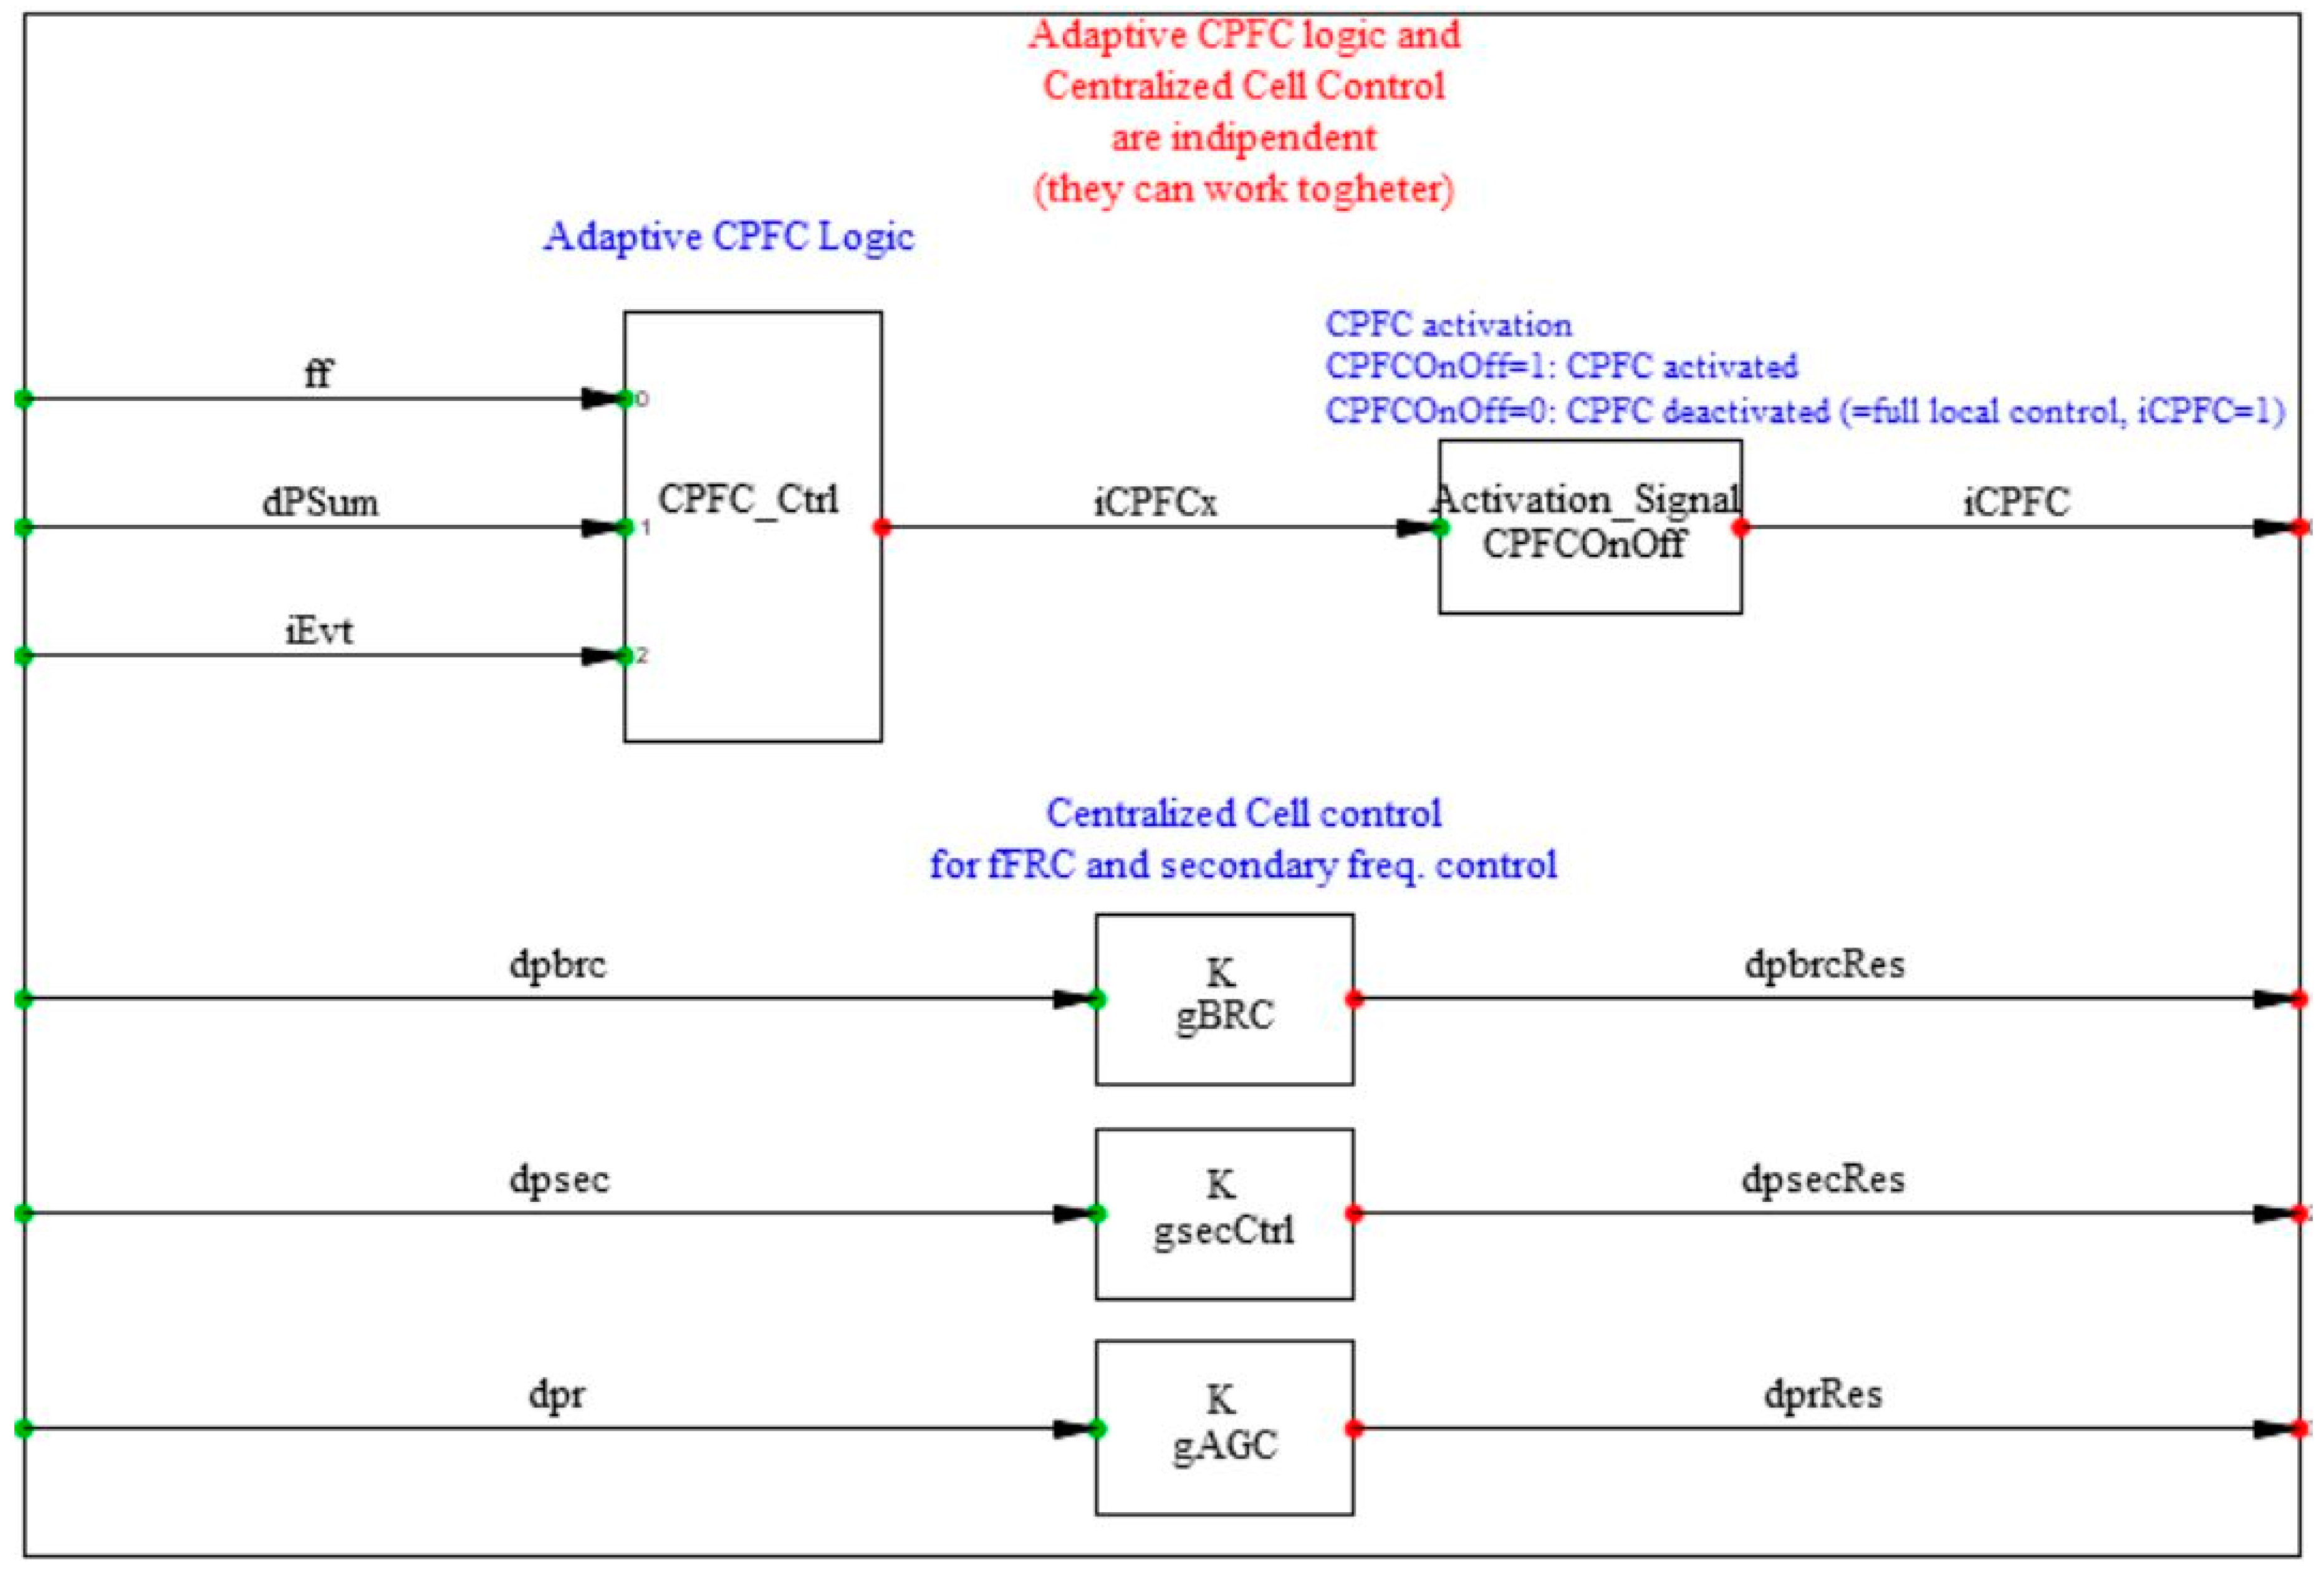
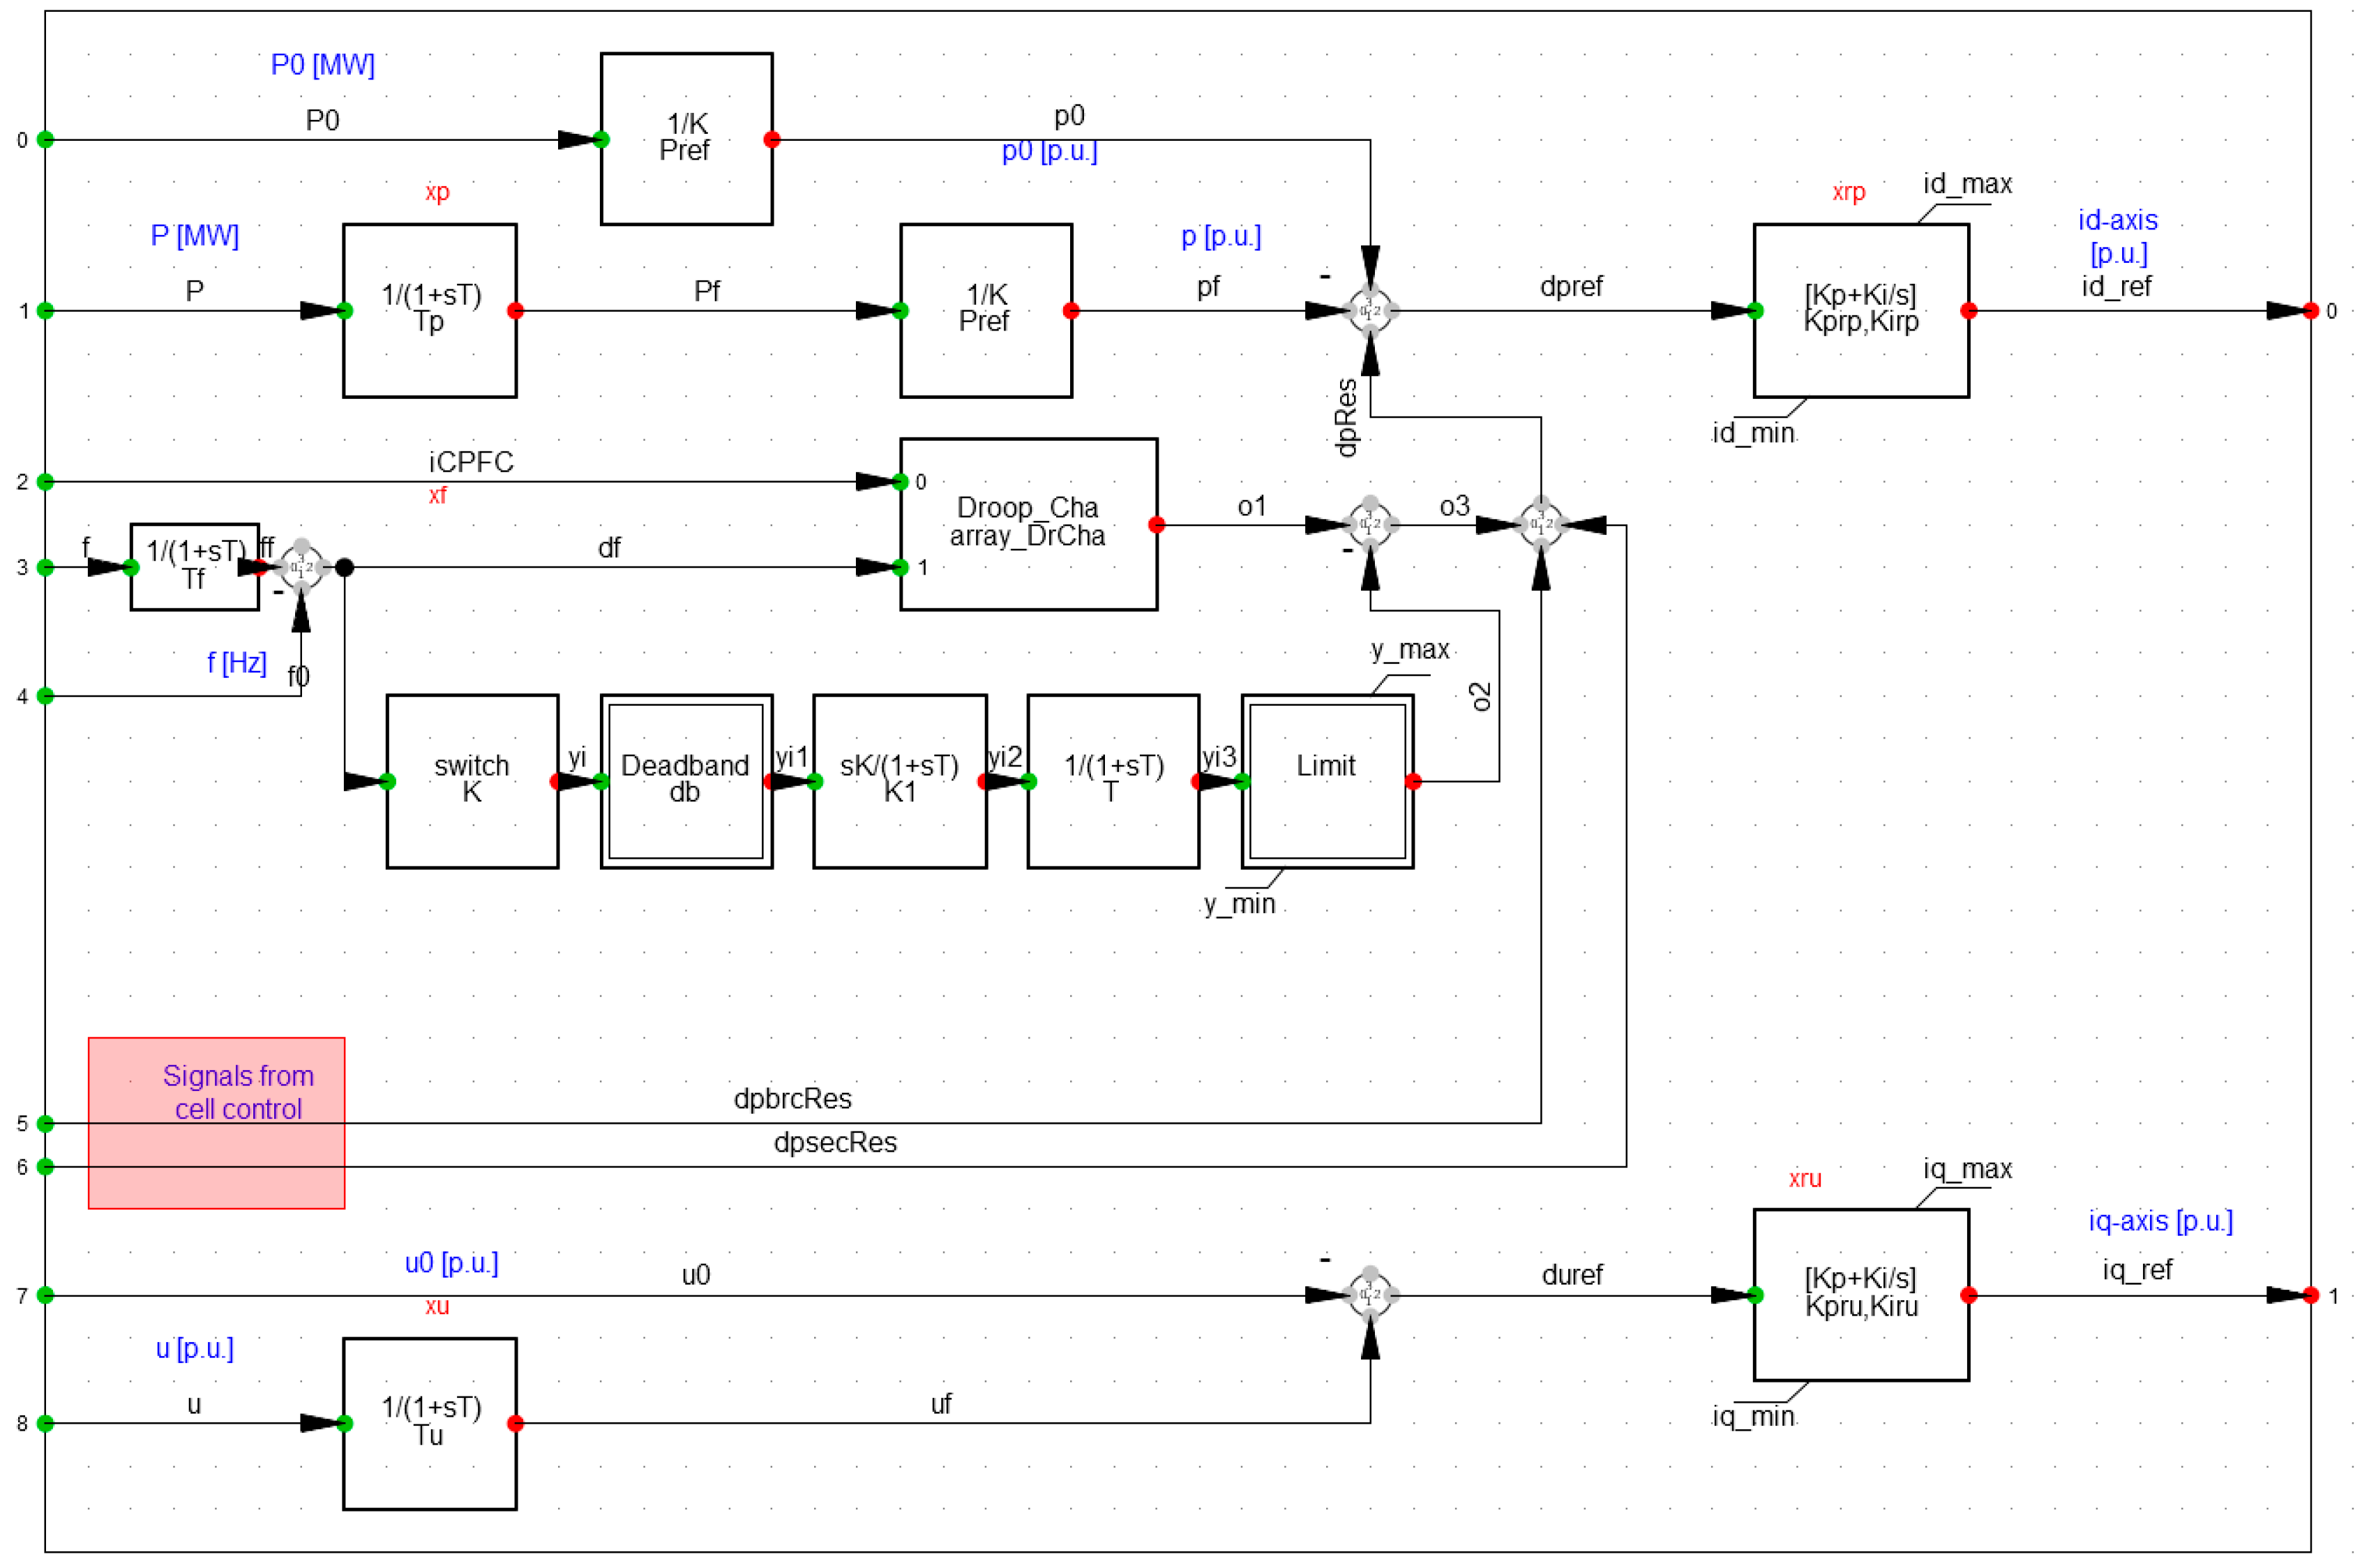
2.3. Control Scheme
- Event Location;
- fFRC—fast Frequency Restoration Control;
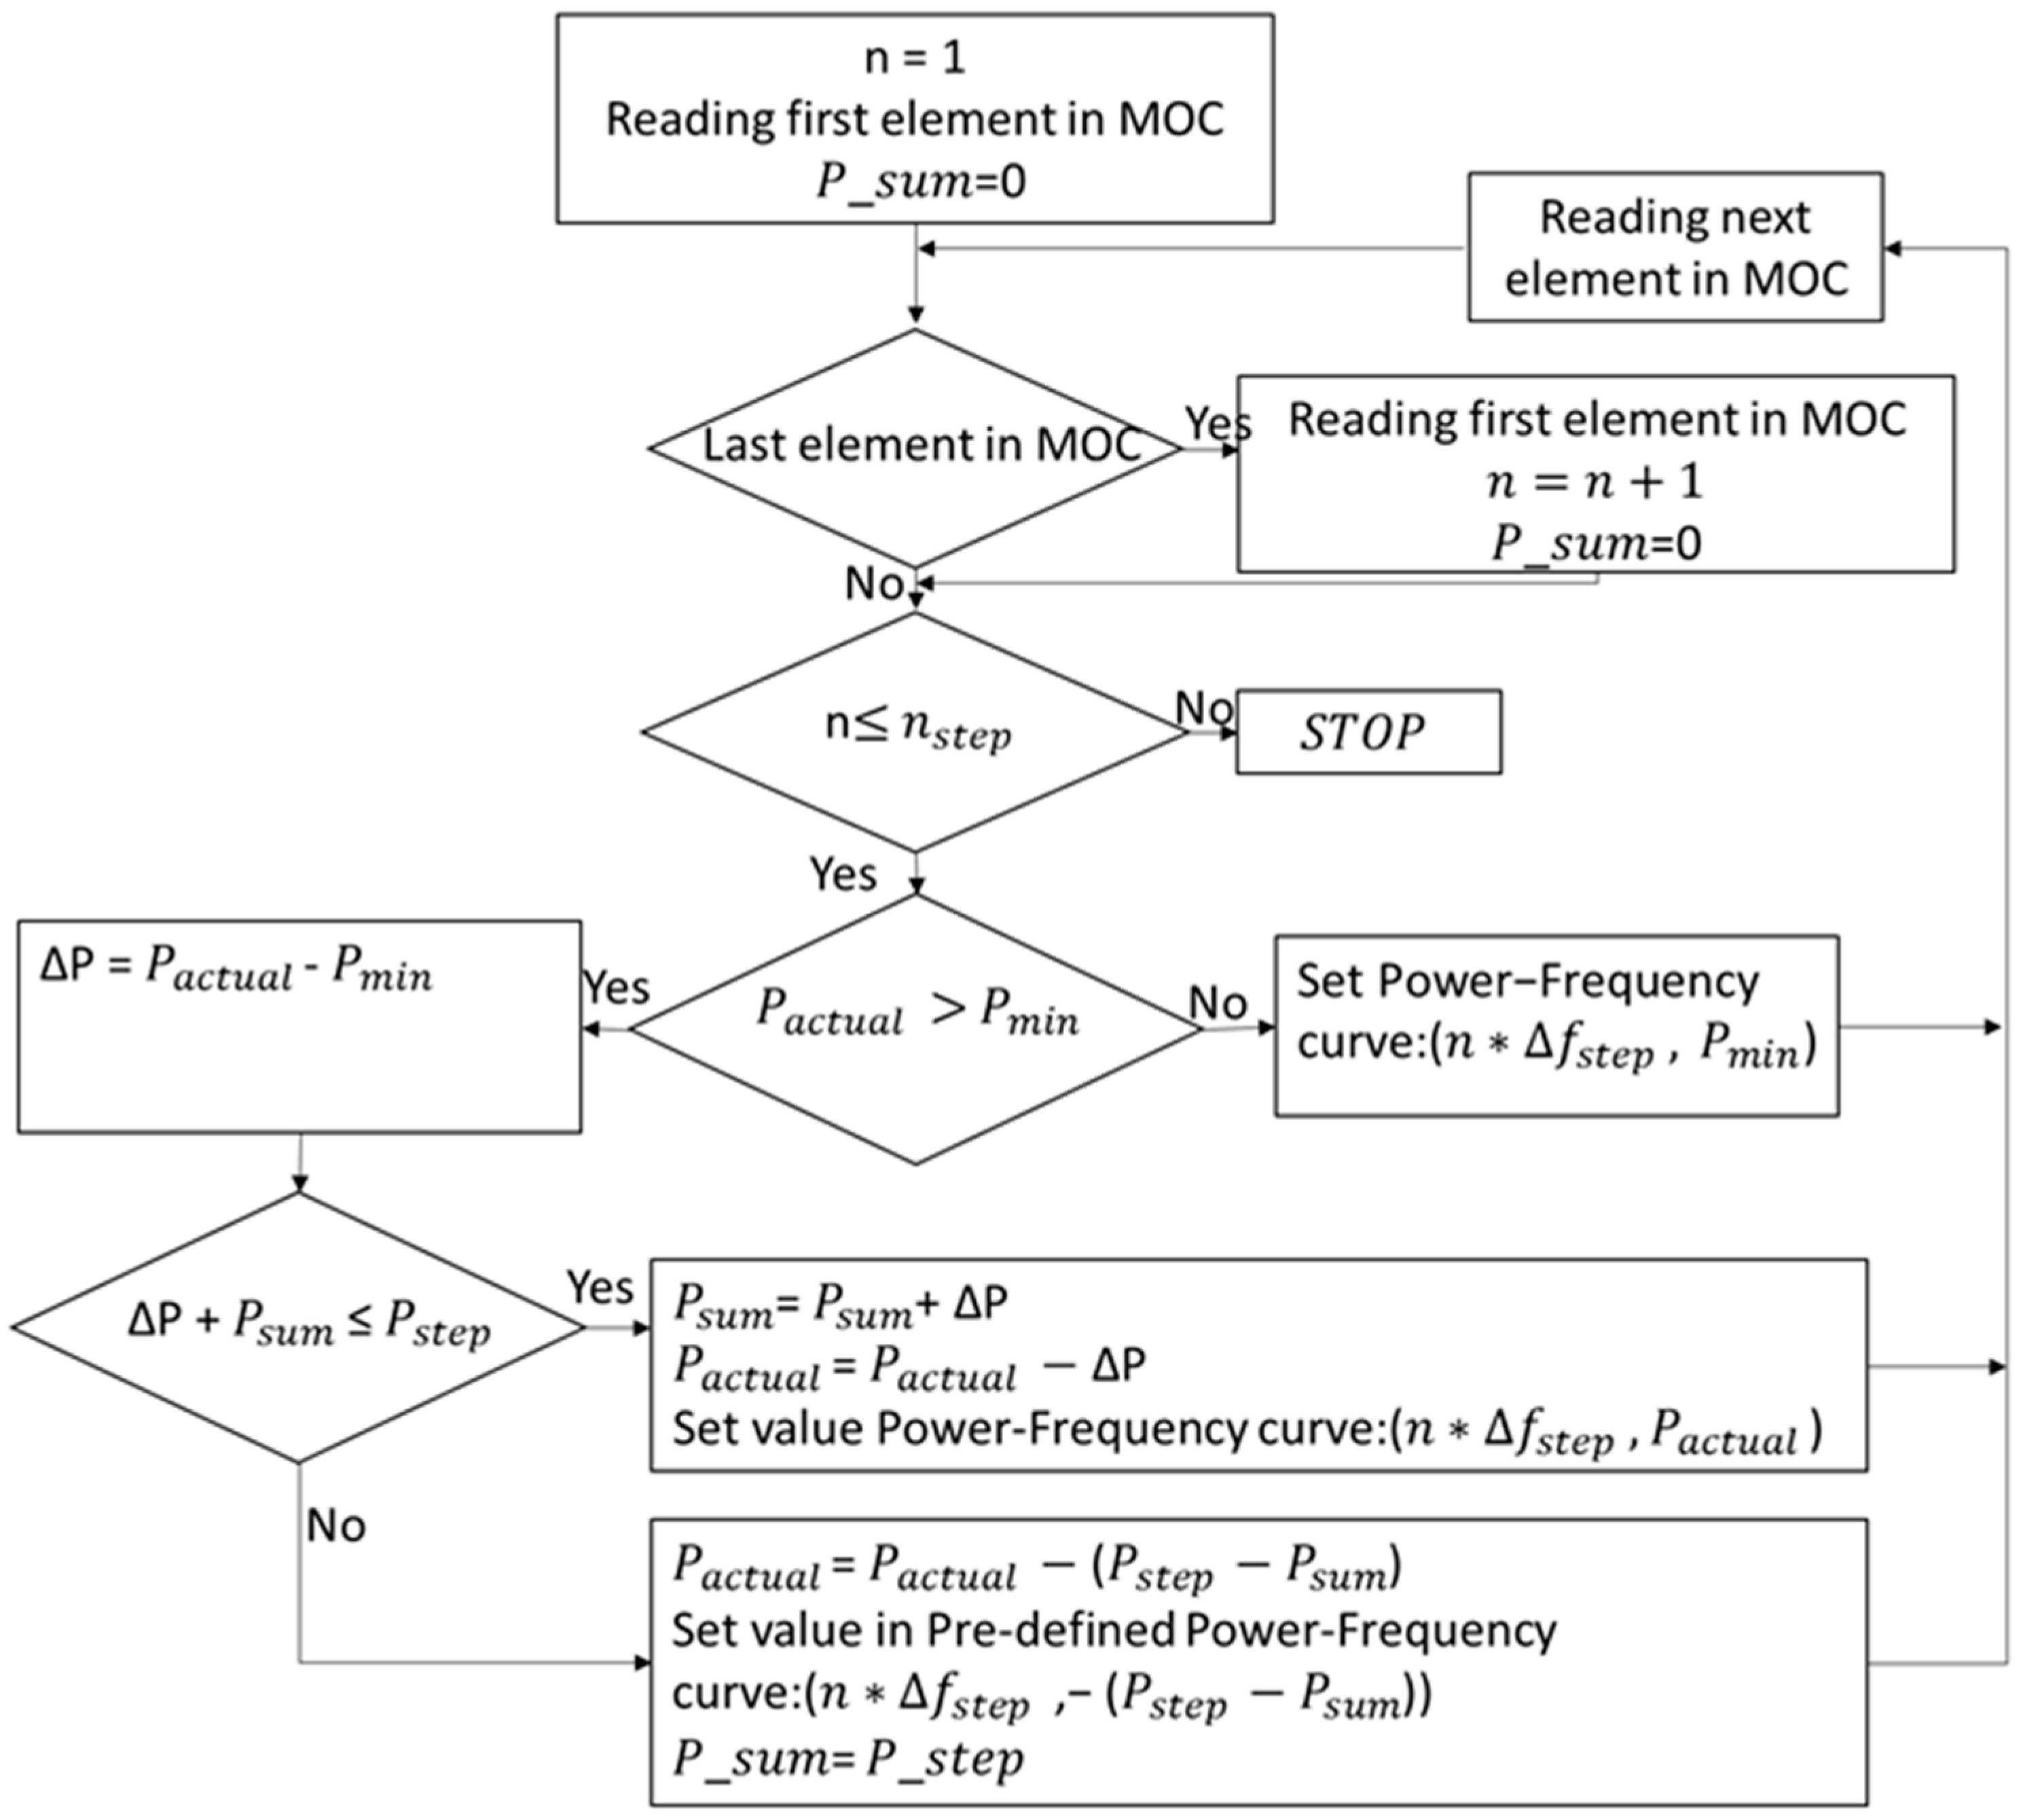
- Pre-defined Power–Frequency curve calculation;
- Local Resources Control;
- Active power flexibility evaluation per each asset in the control area. The information is stored in a merit order collection table (MOC) containing the values about (W), (W), (W), (W) per each asset in the control area. The values in the table represent, respectively, the max and min power limits of the asset, the measured actual power and finally Preserve represent the available flexibility. The information is sorted in descending order based on values;
- Control area’s contribution to Frequency containment CPFC (W/Hz);
- Frequency error threshold definition (Hz);
- Frequency threshold steps definition ;
- Calculation of the = ;
- Calculation of the total active power contribution per each step: = CPFC
- Active power contribution provided by assets for negative and positive frequency slope.
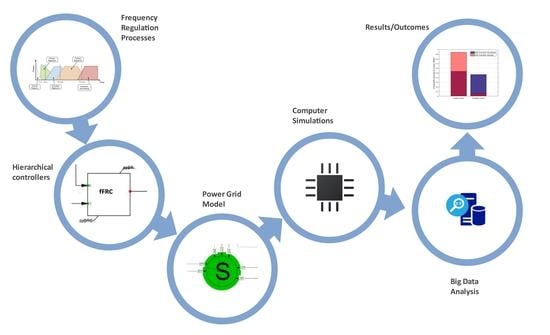
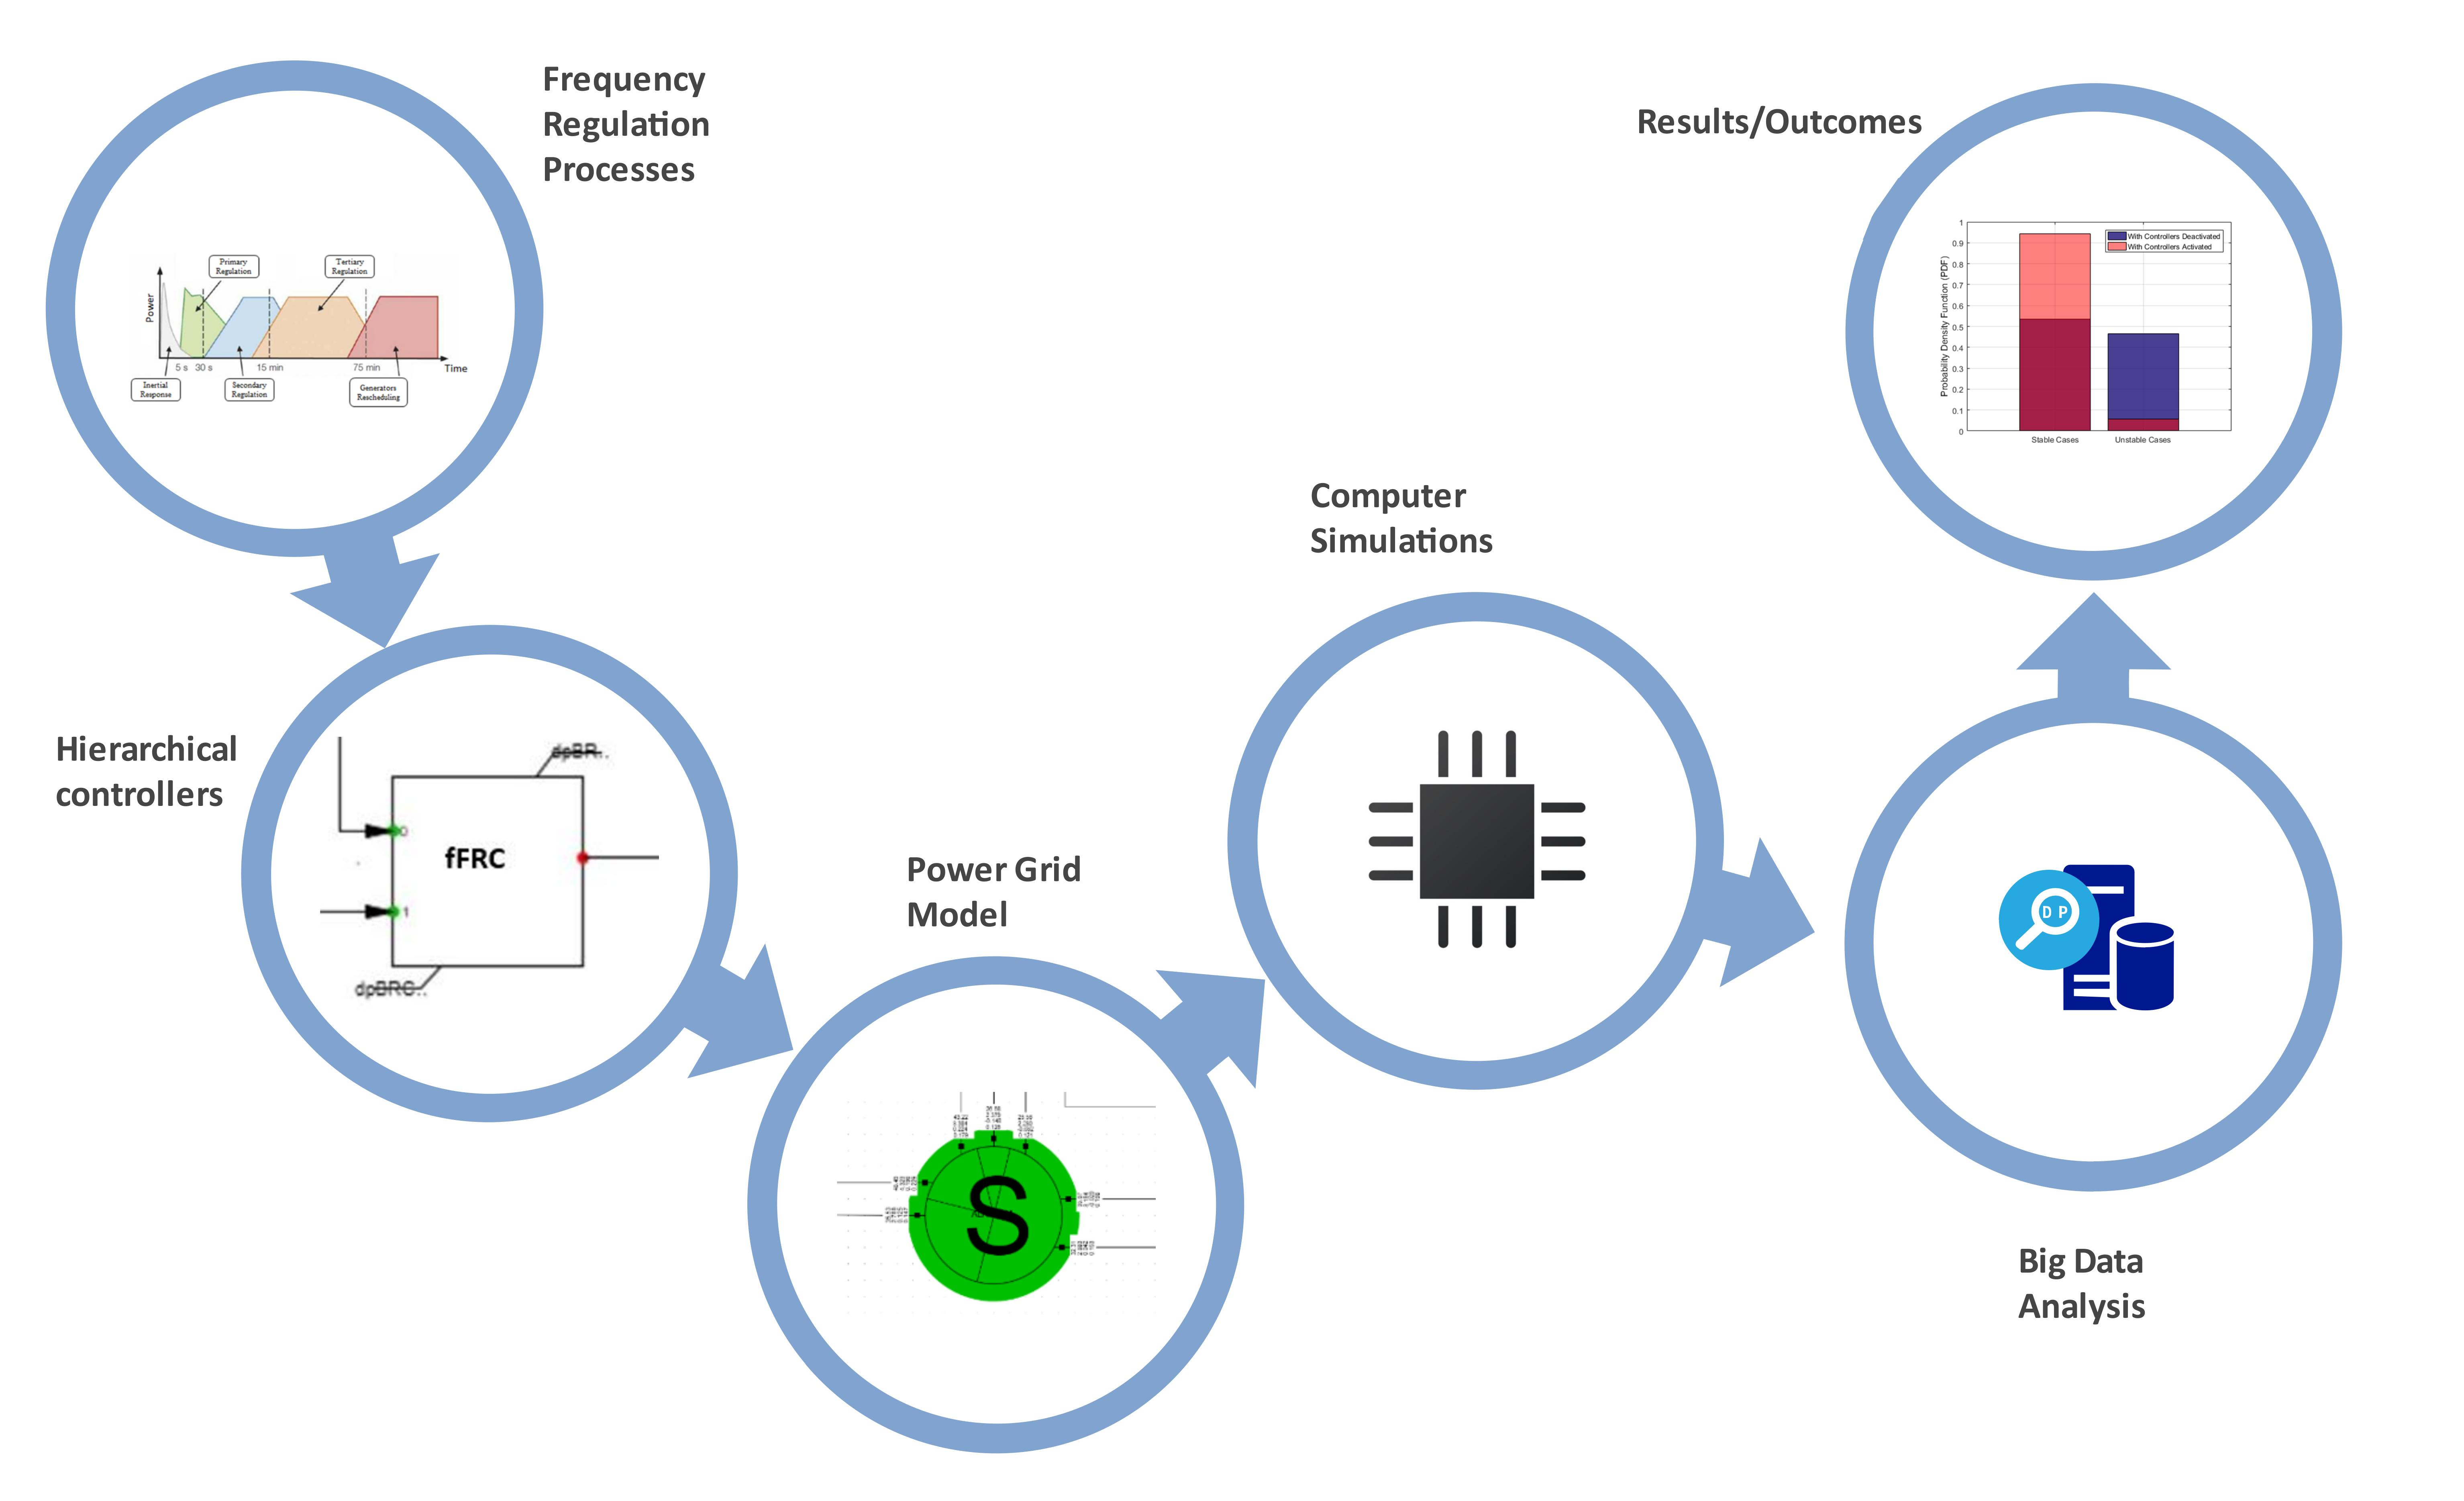
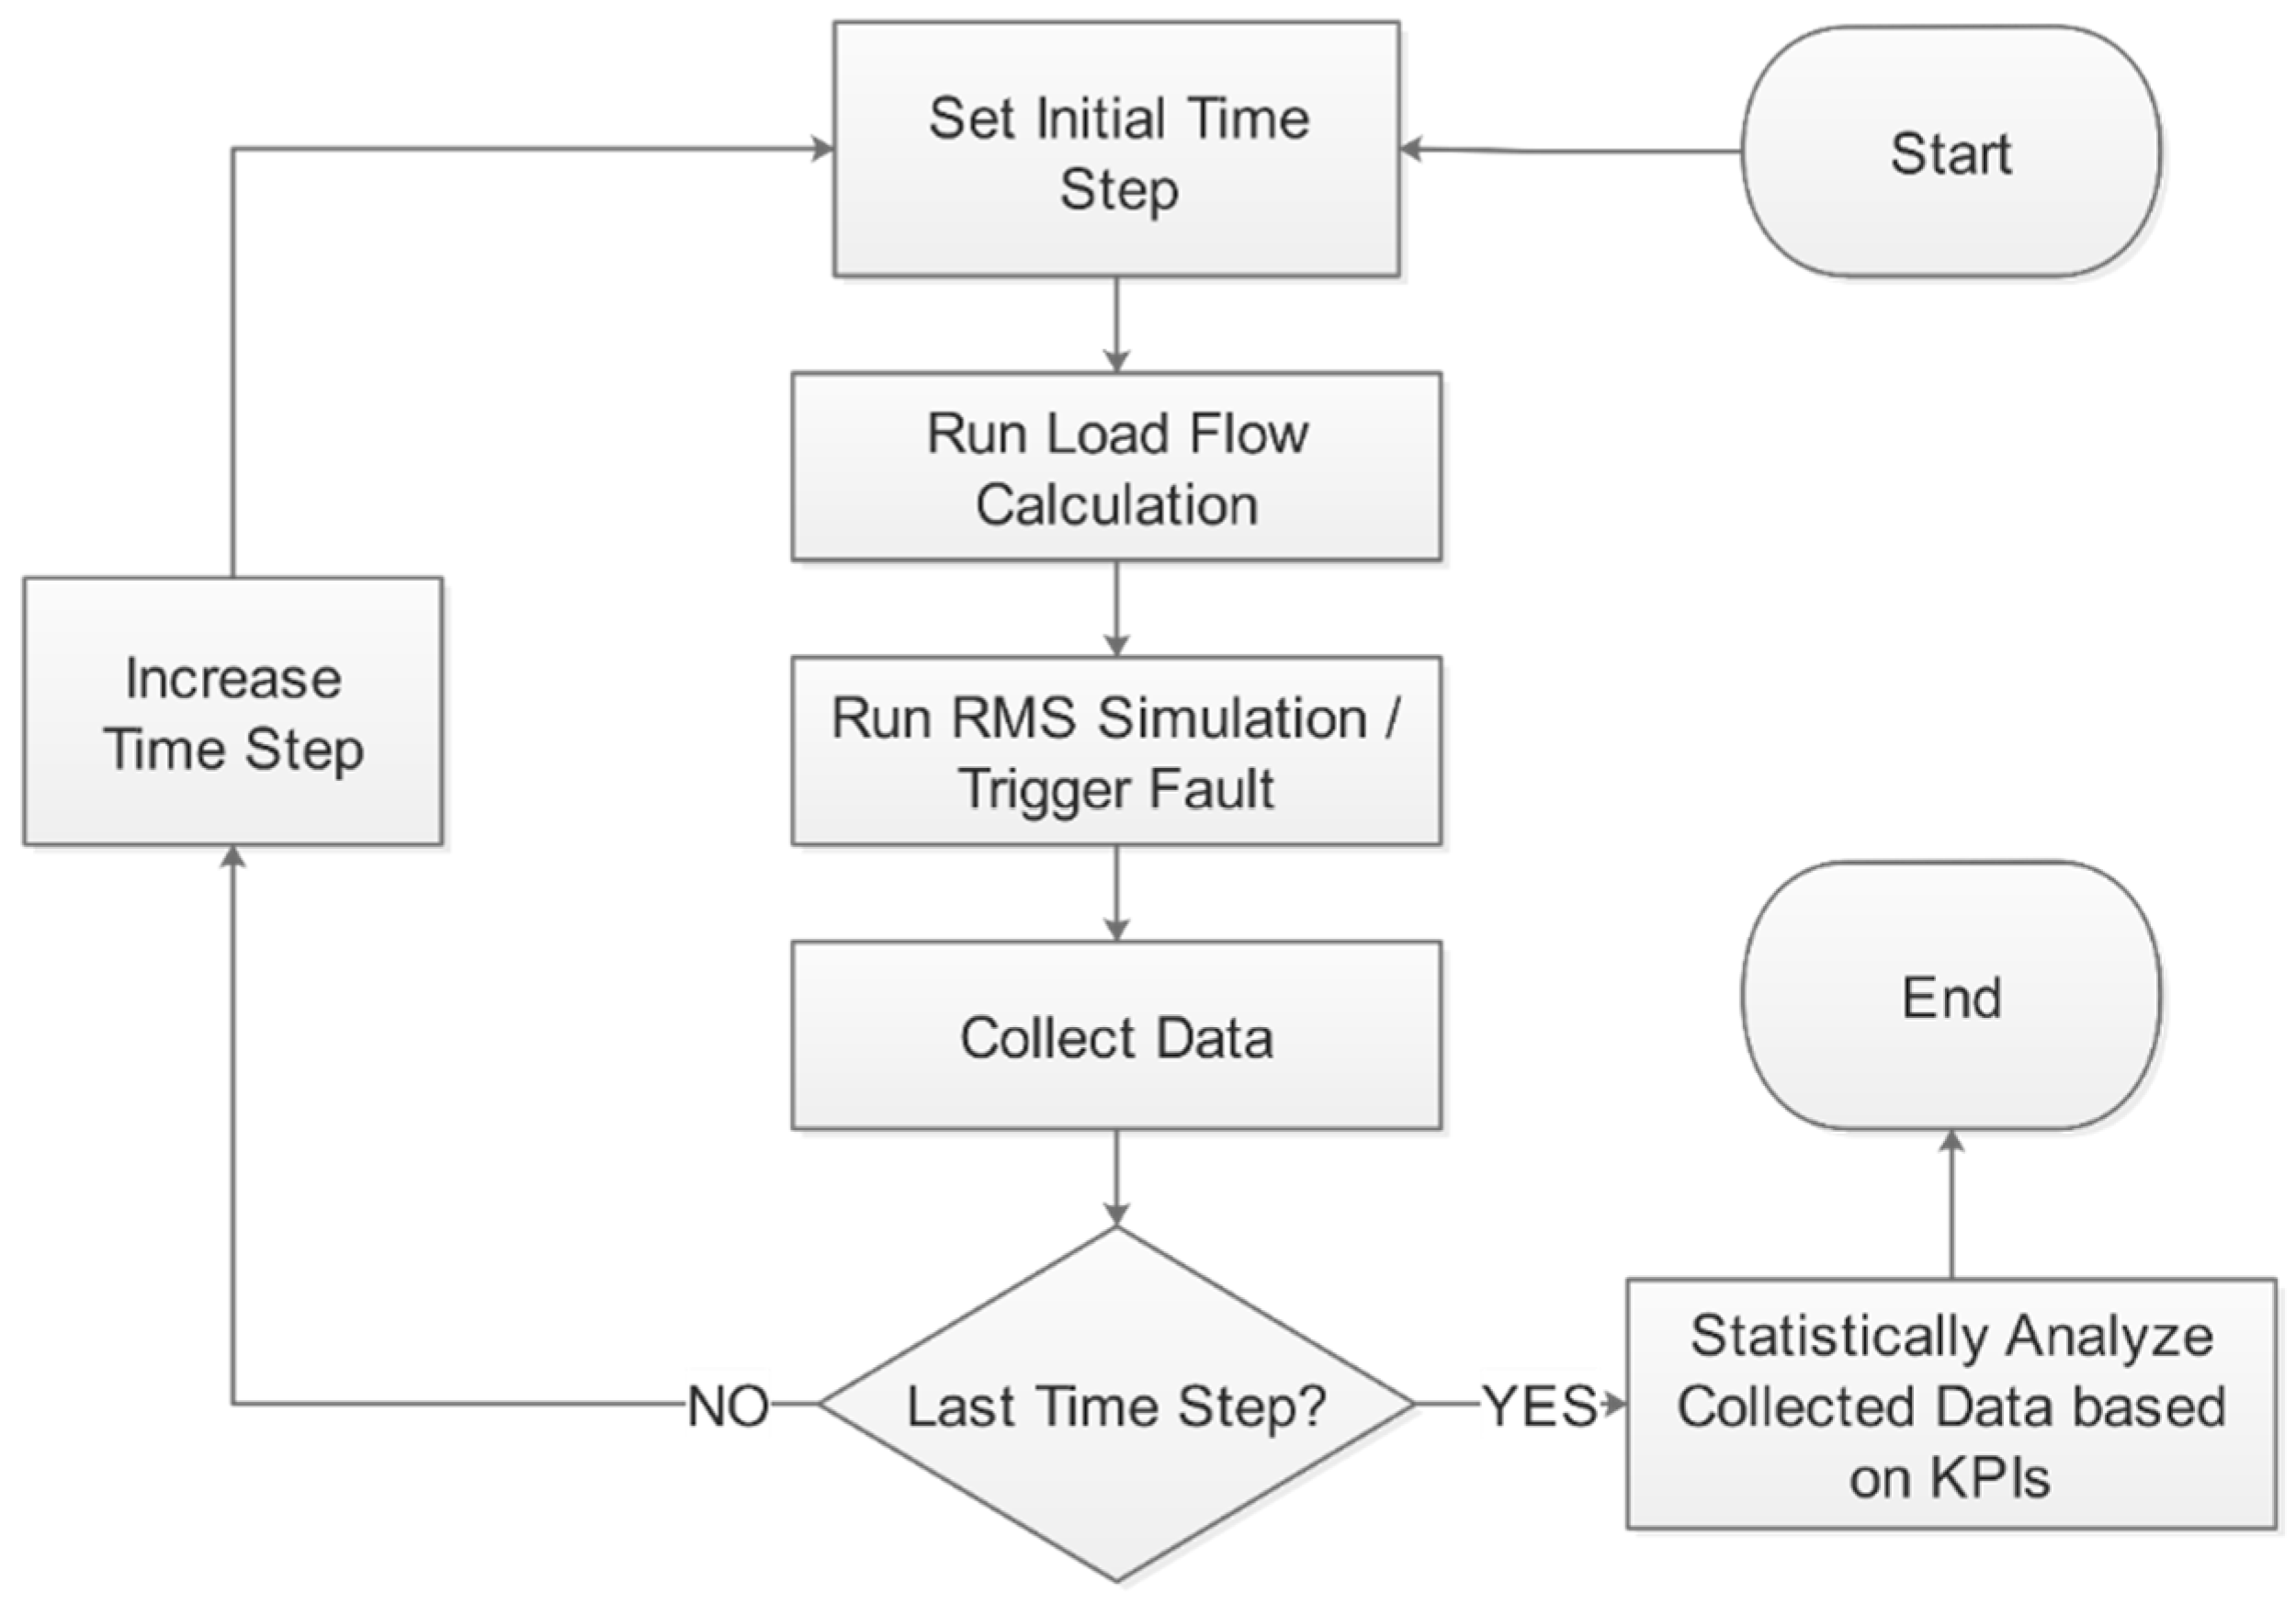
2.4. Methodology
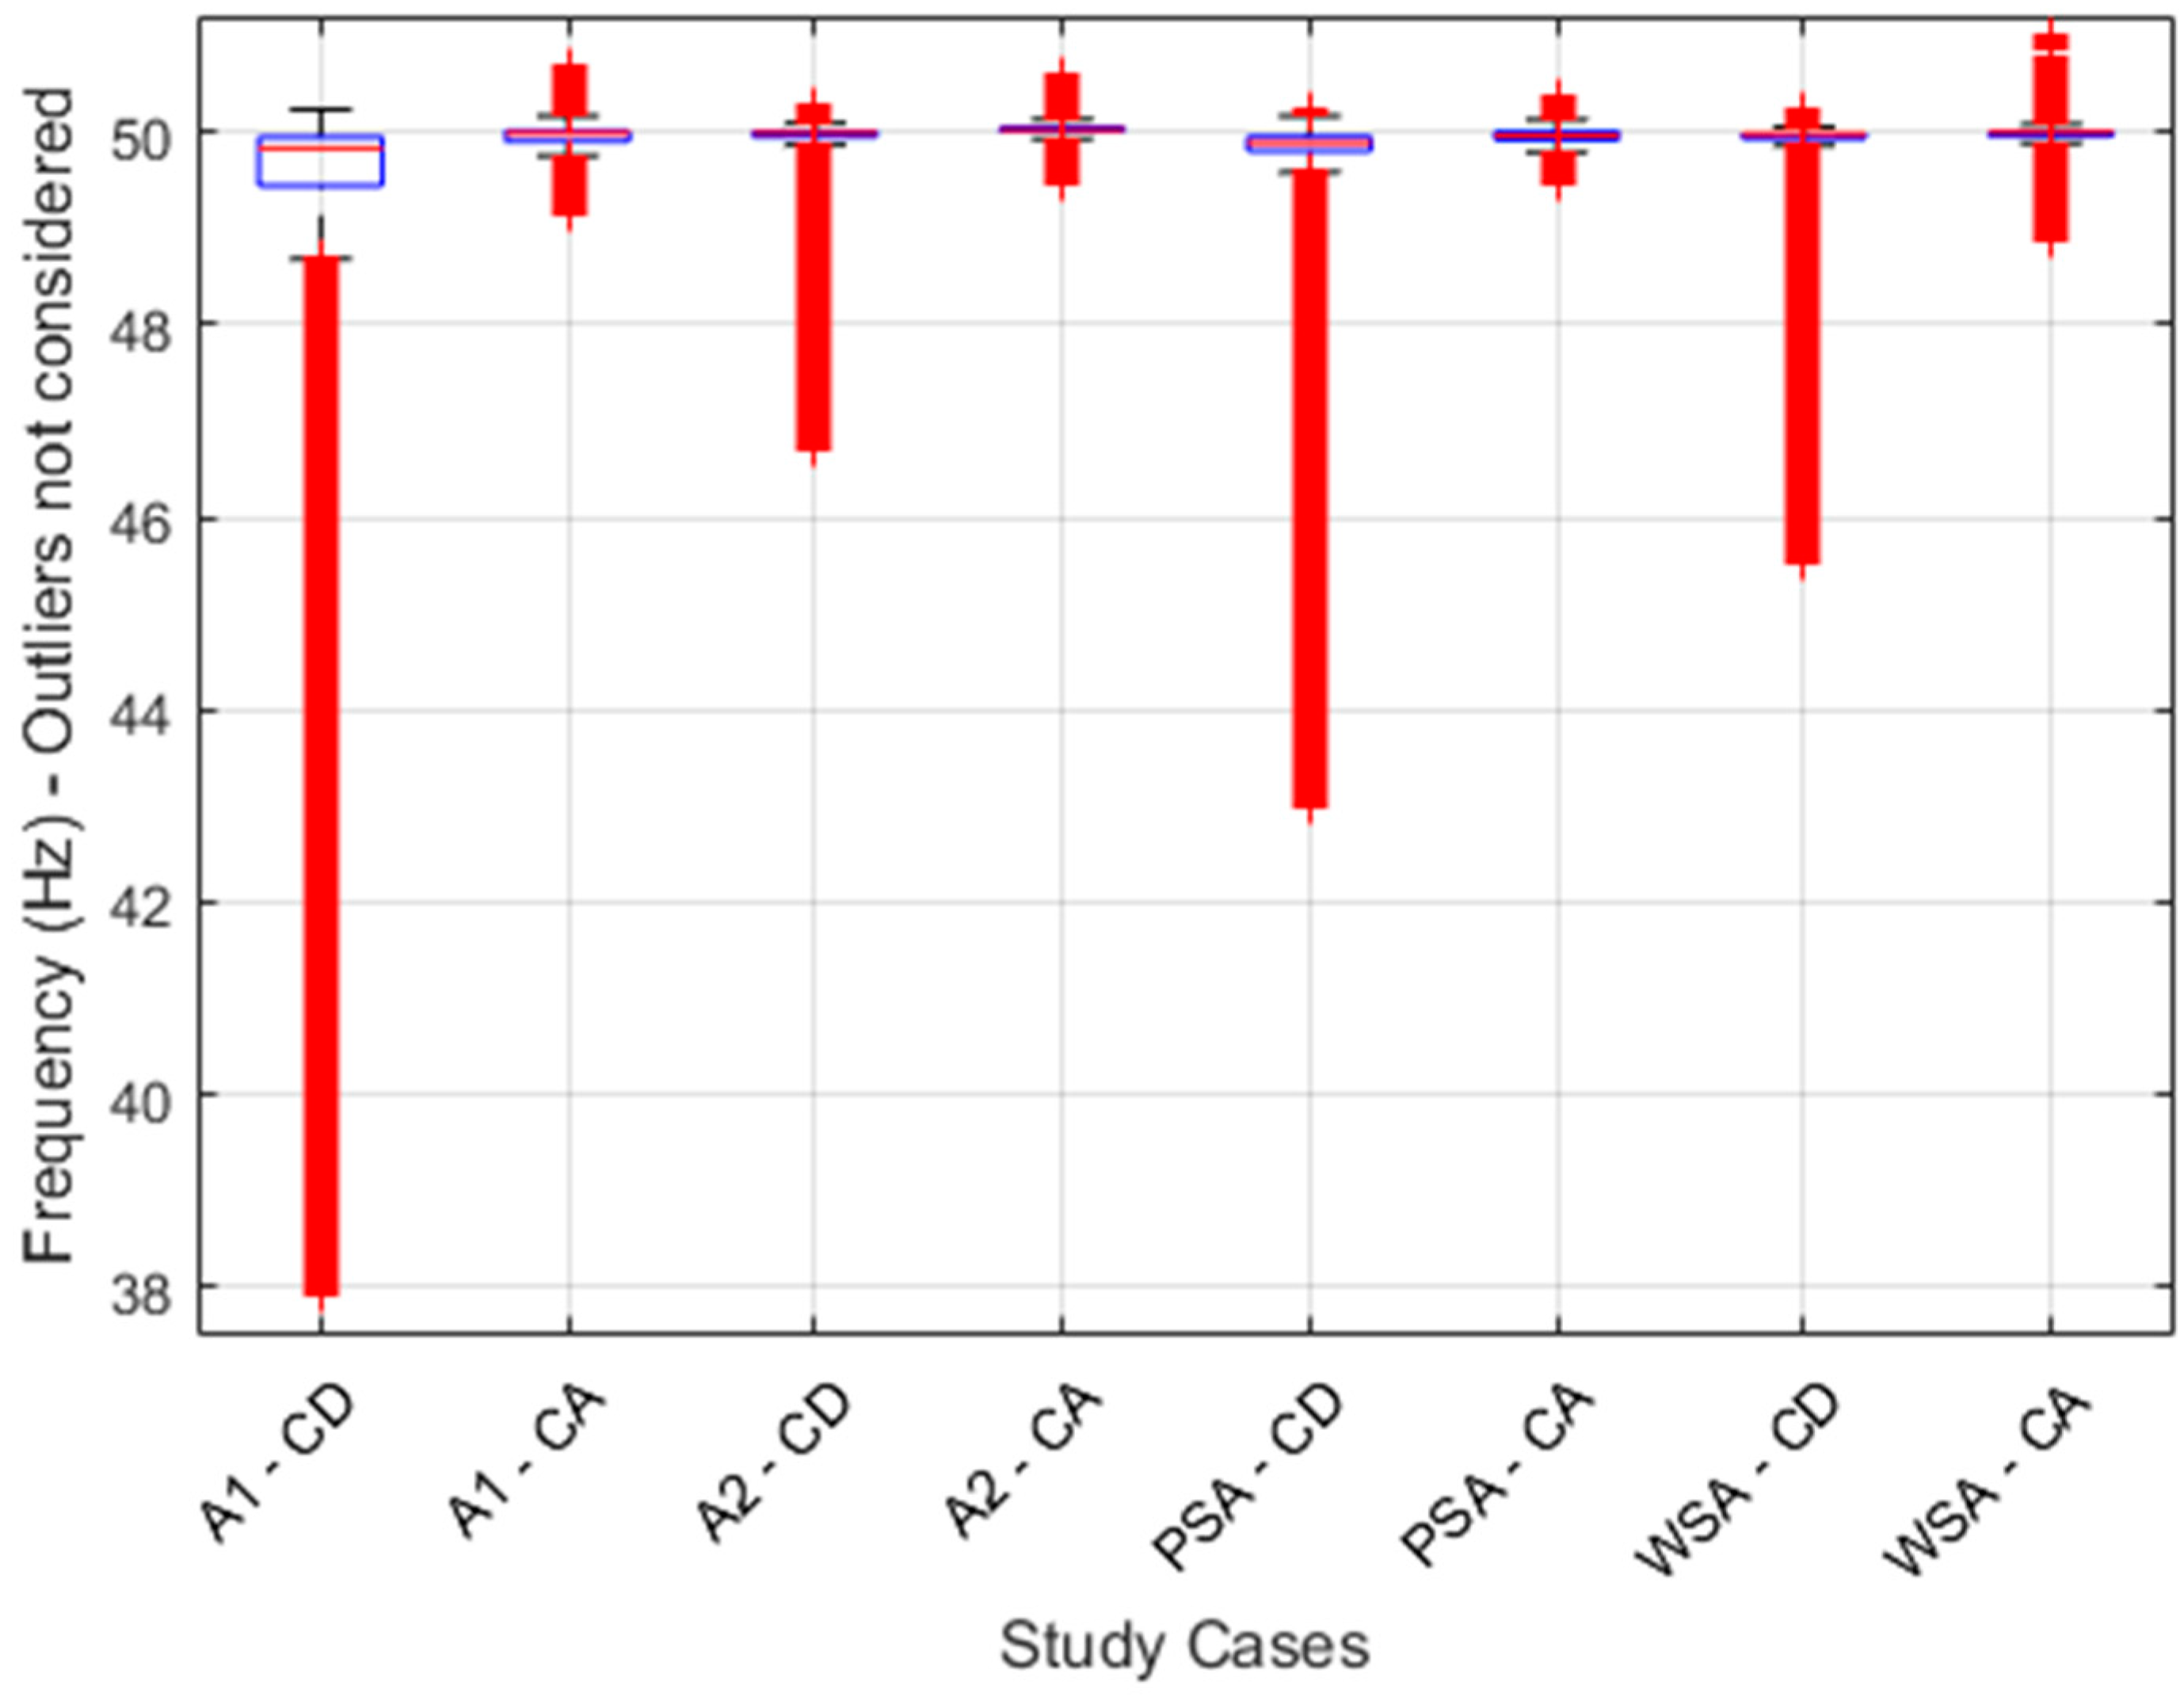
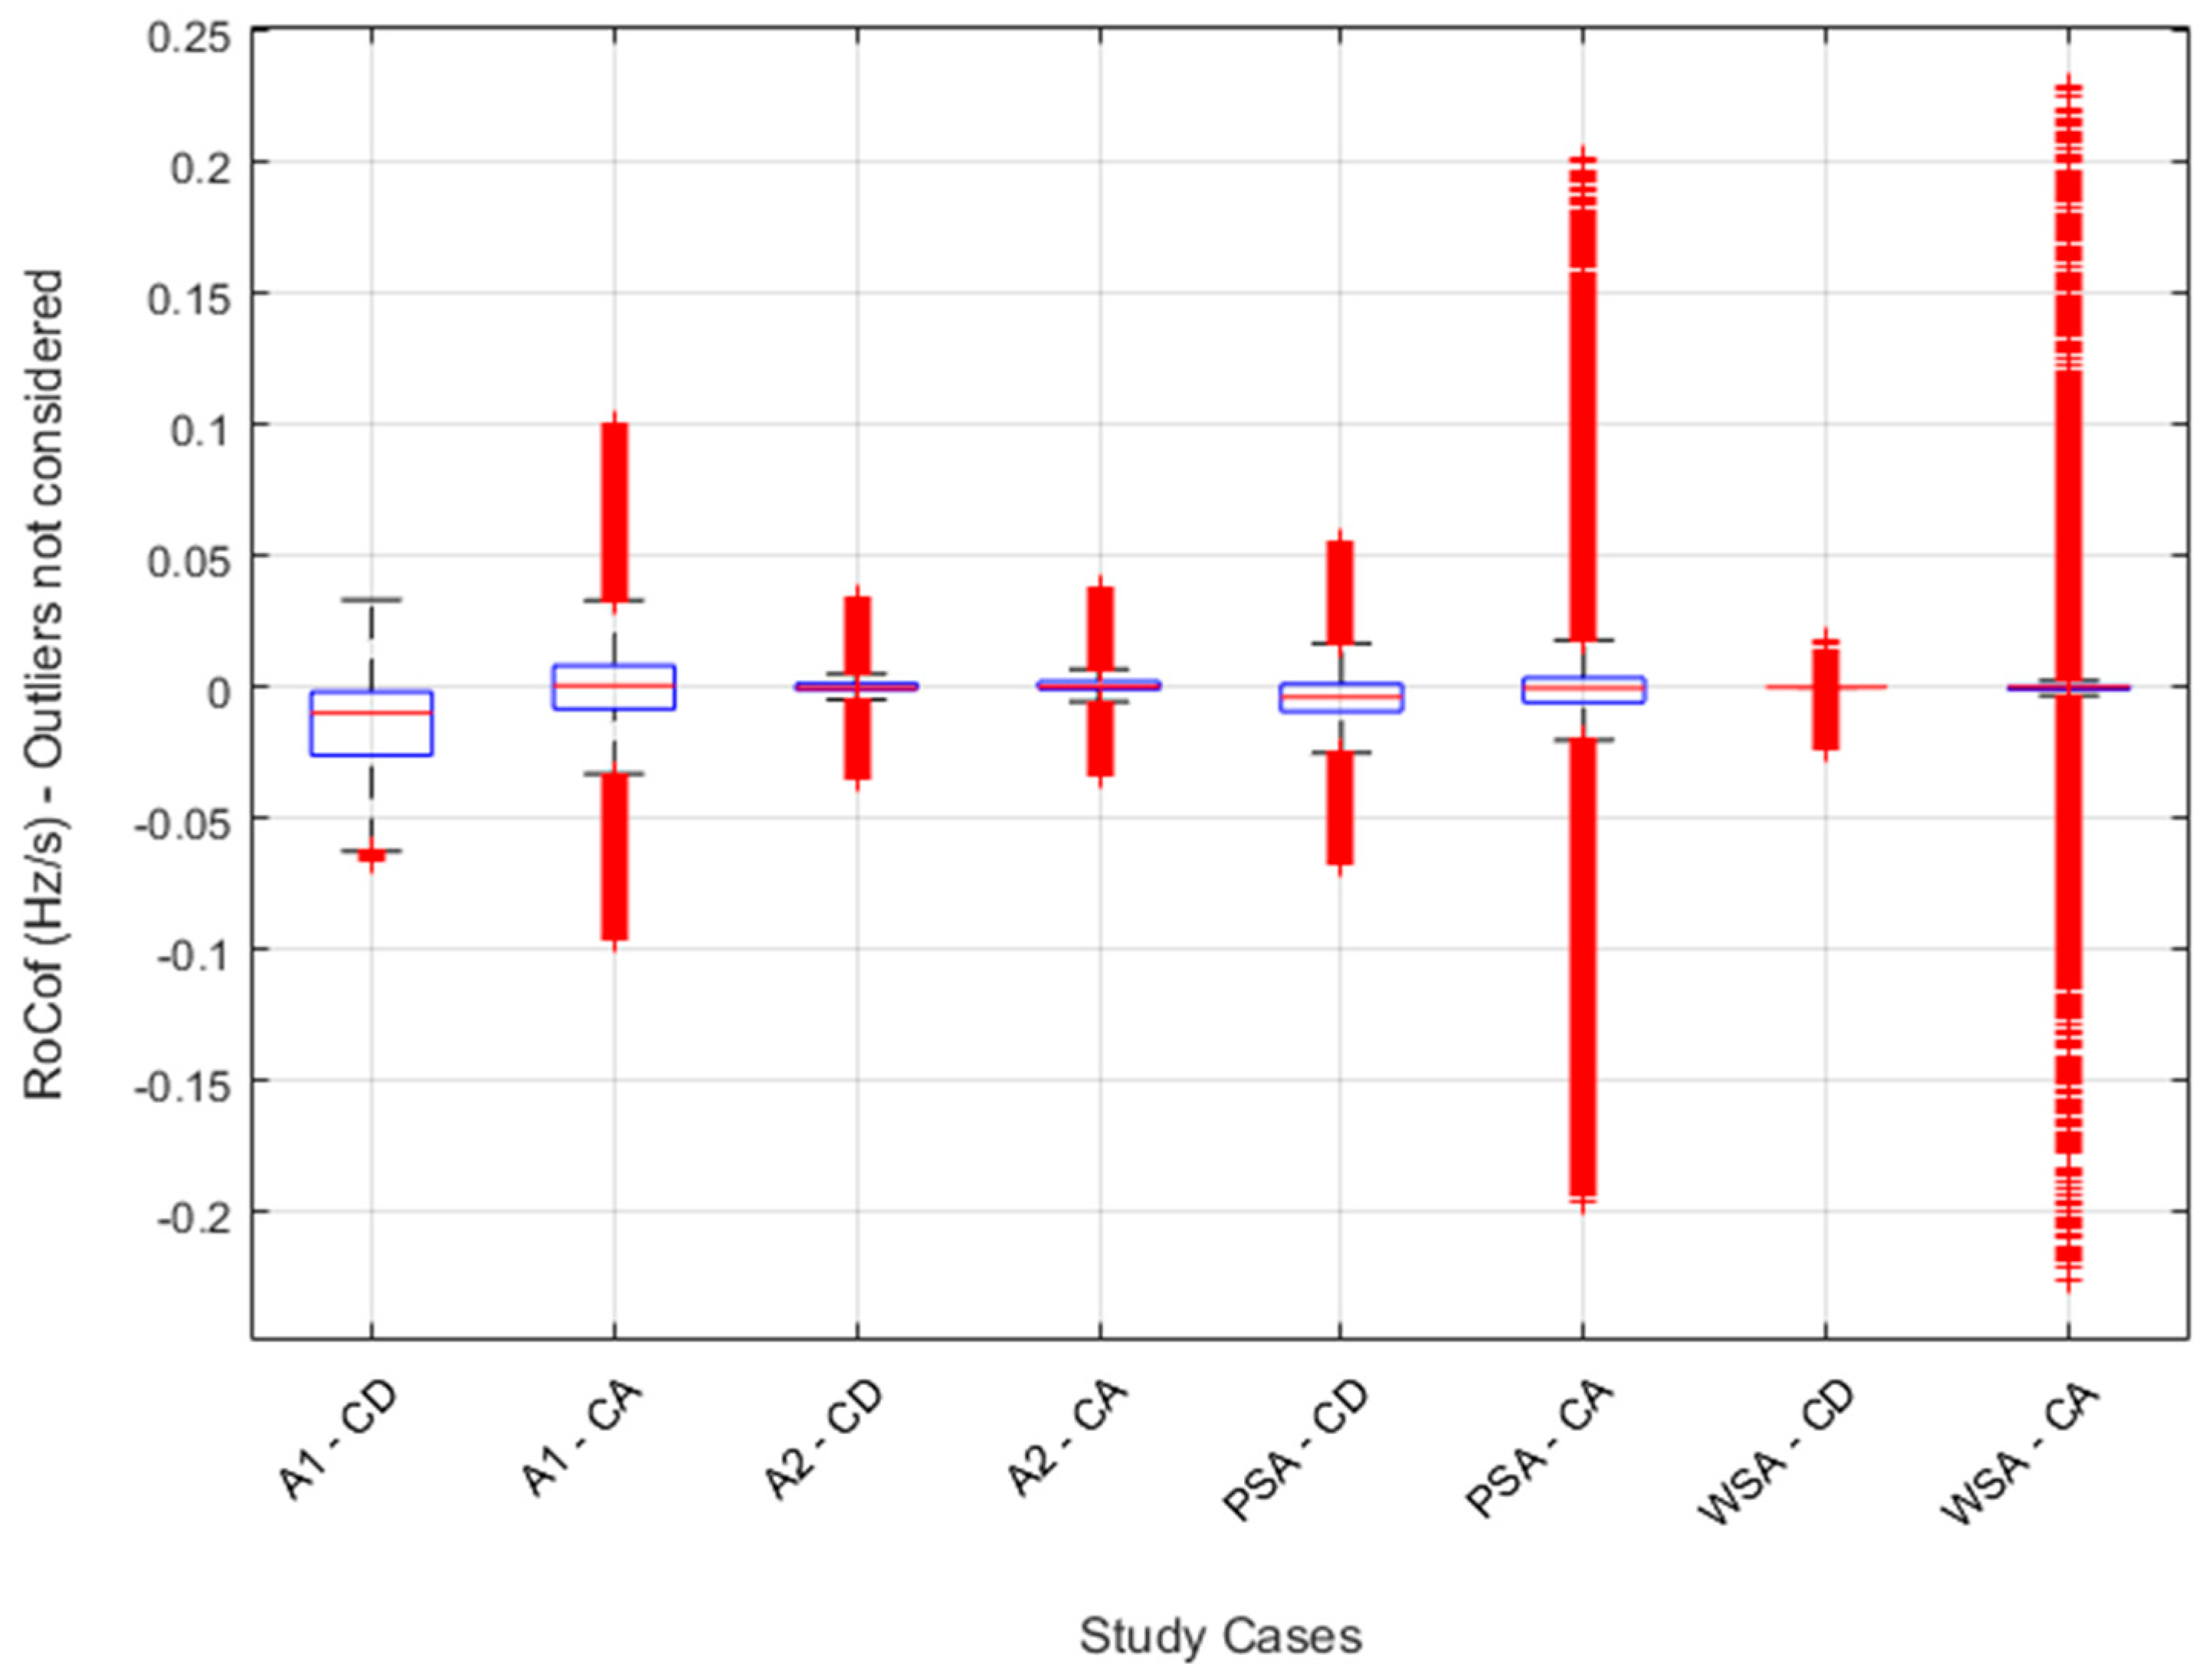
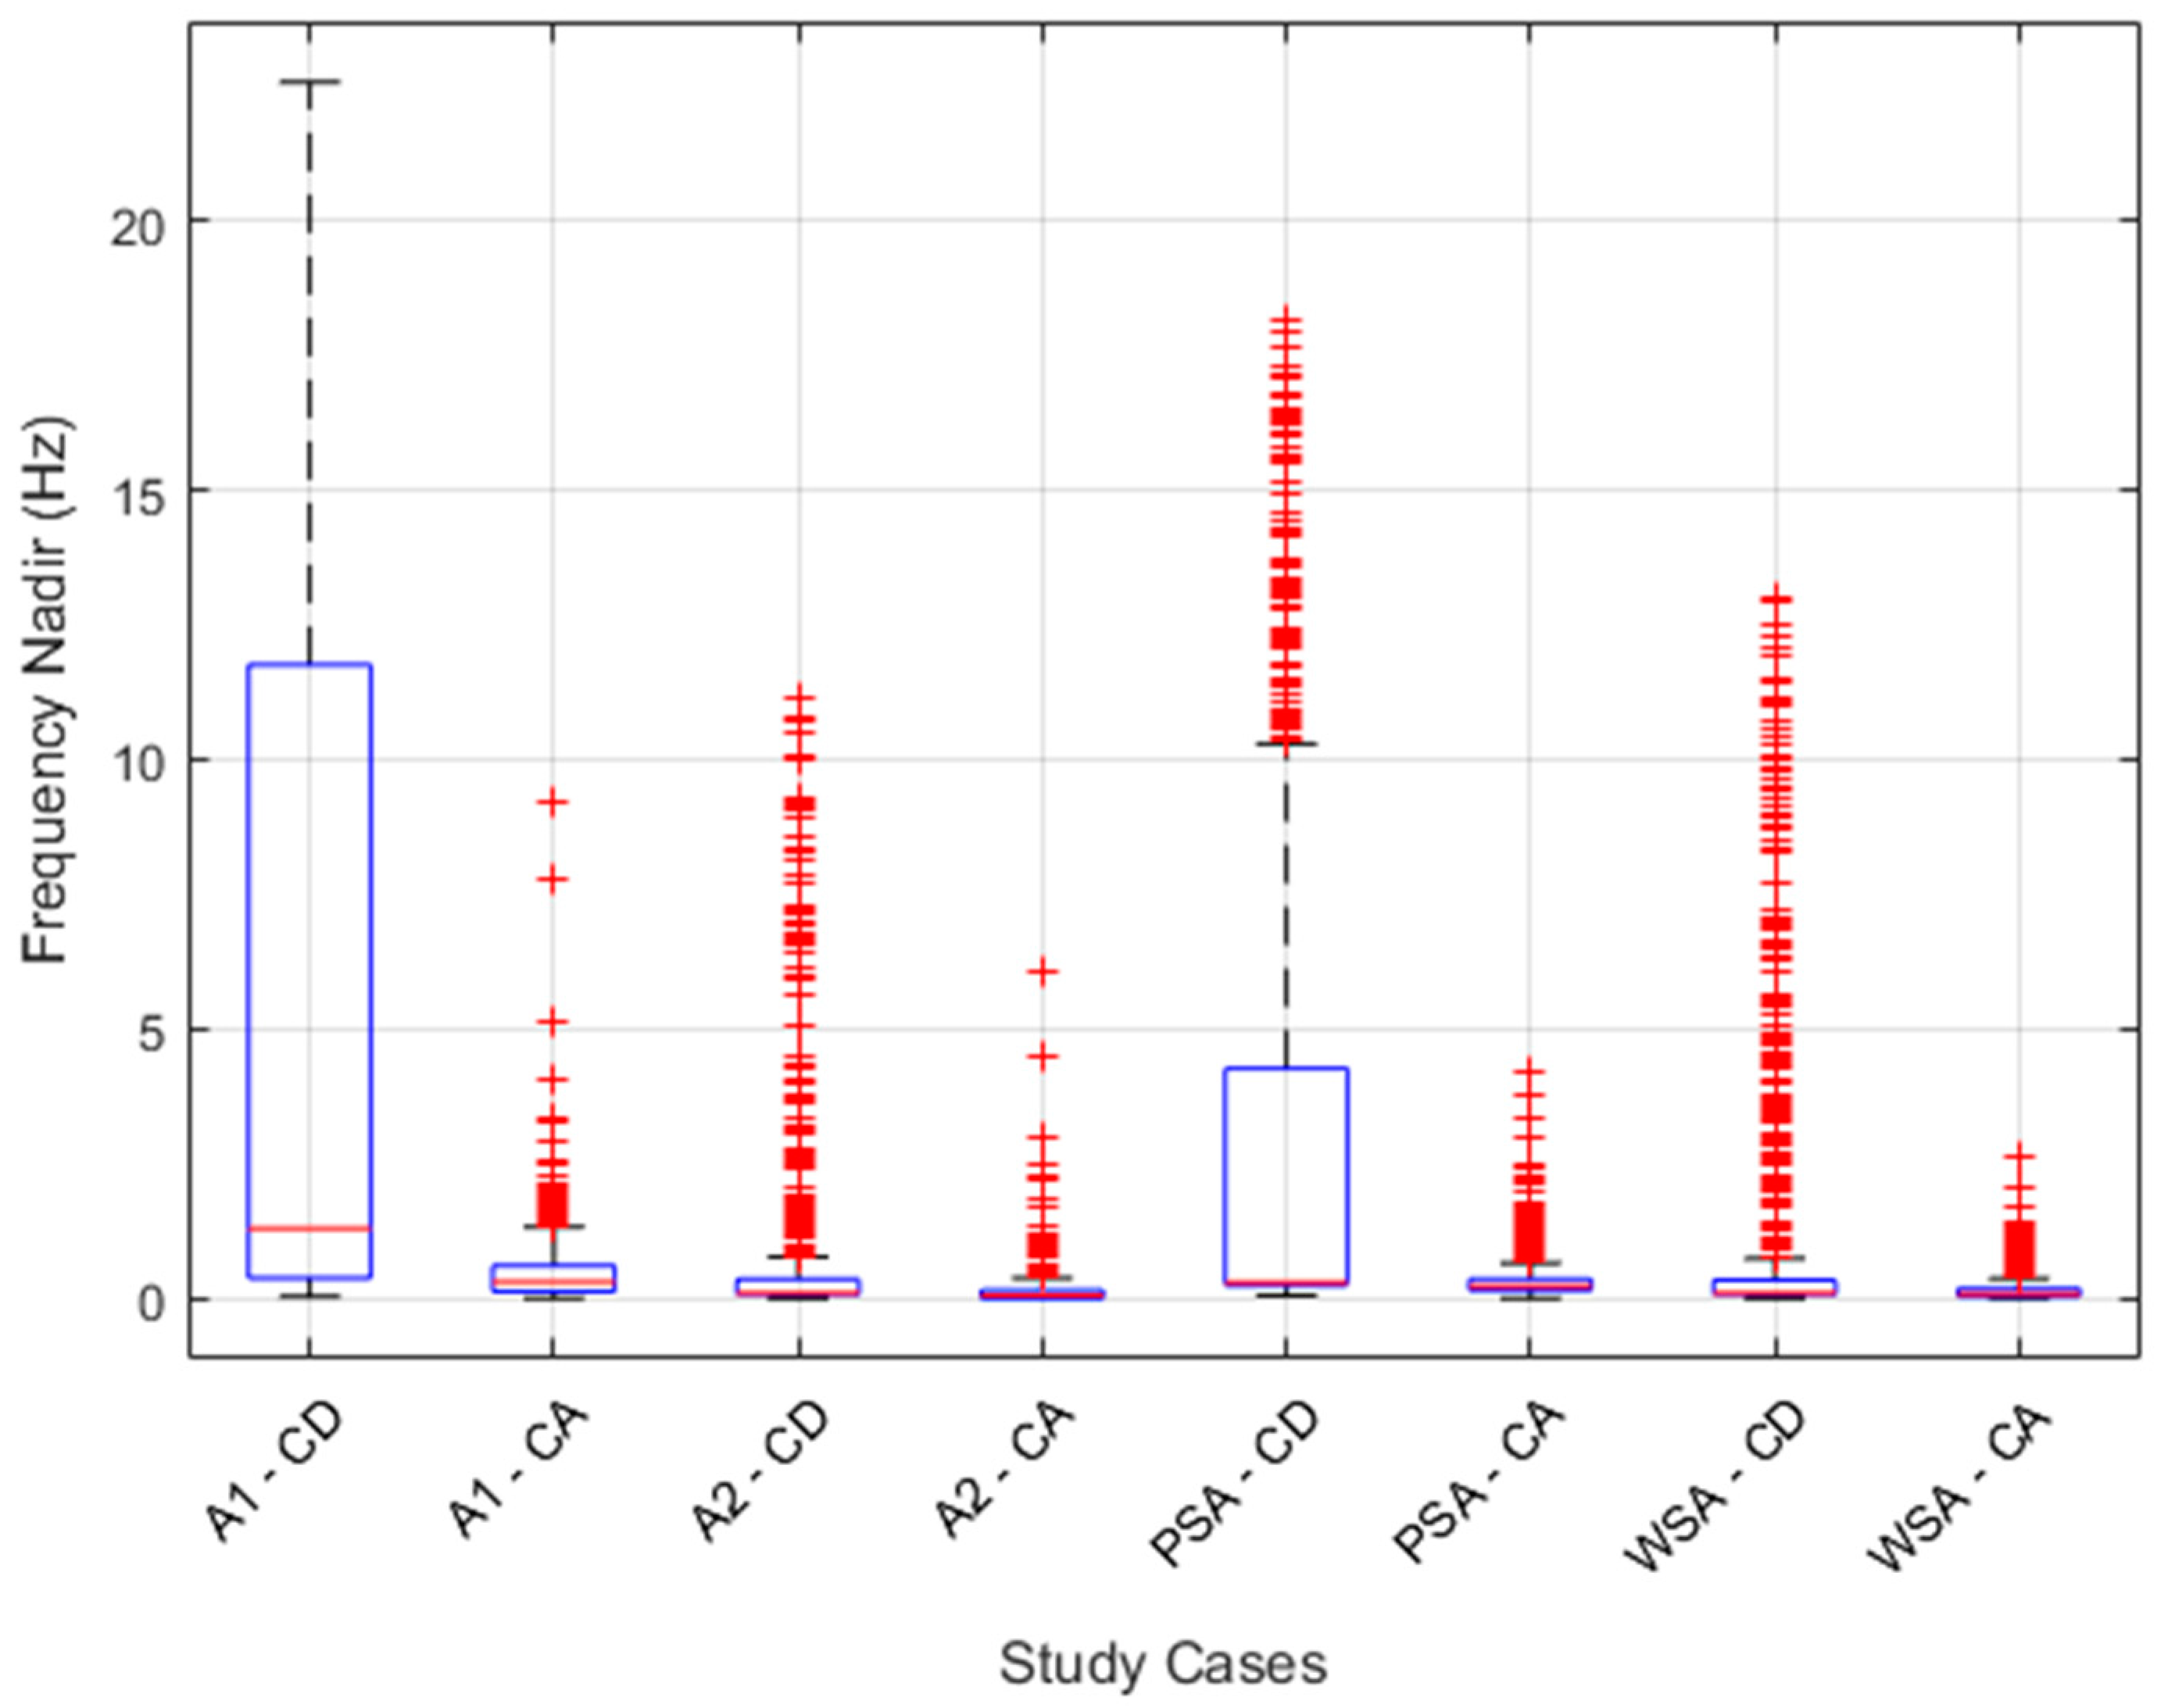
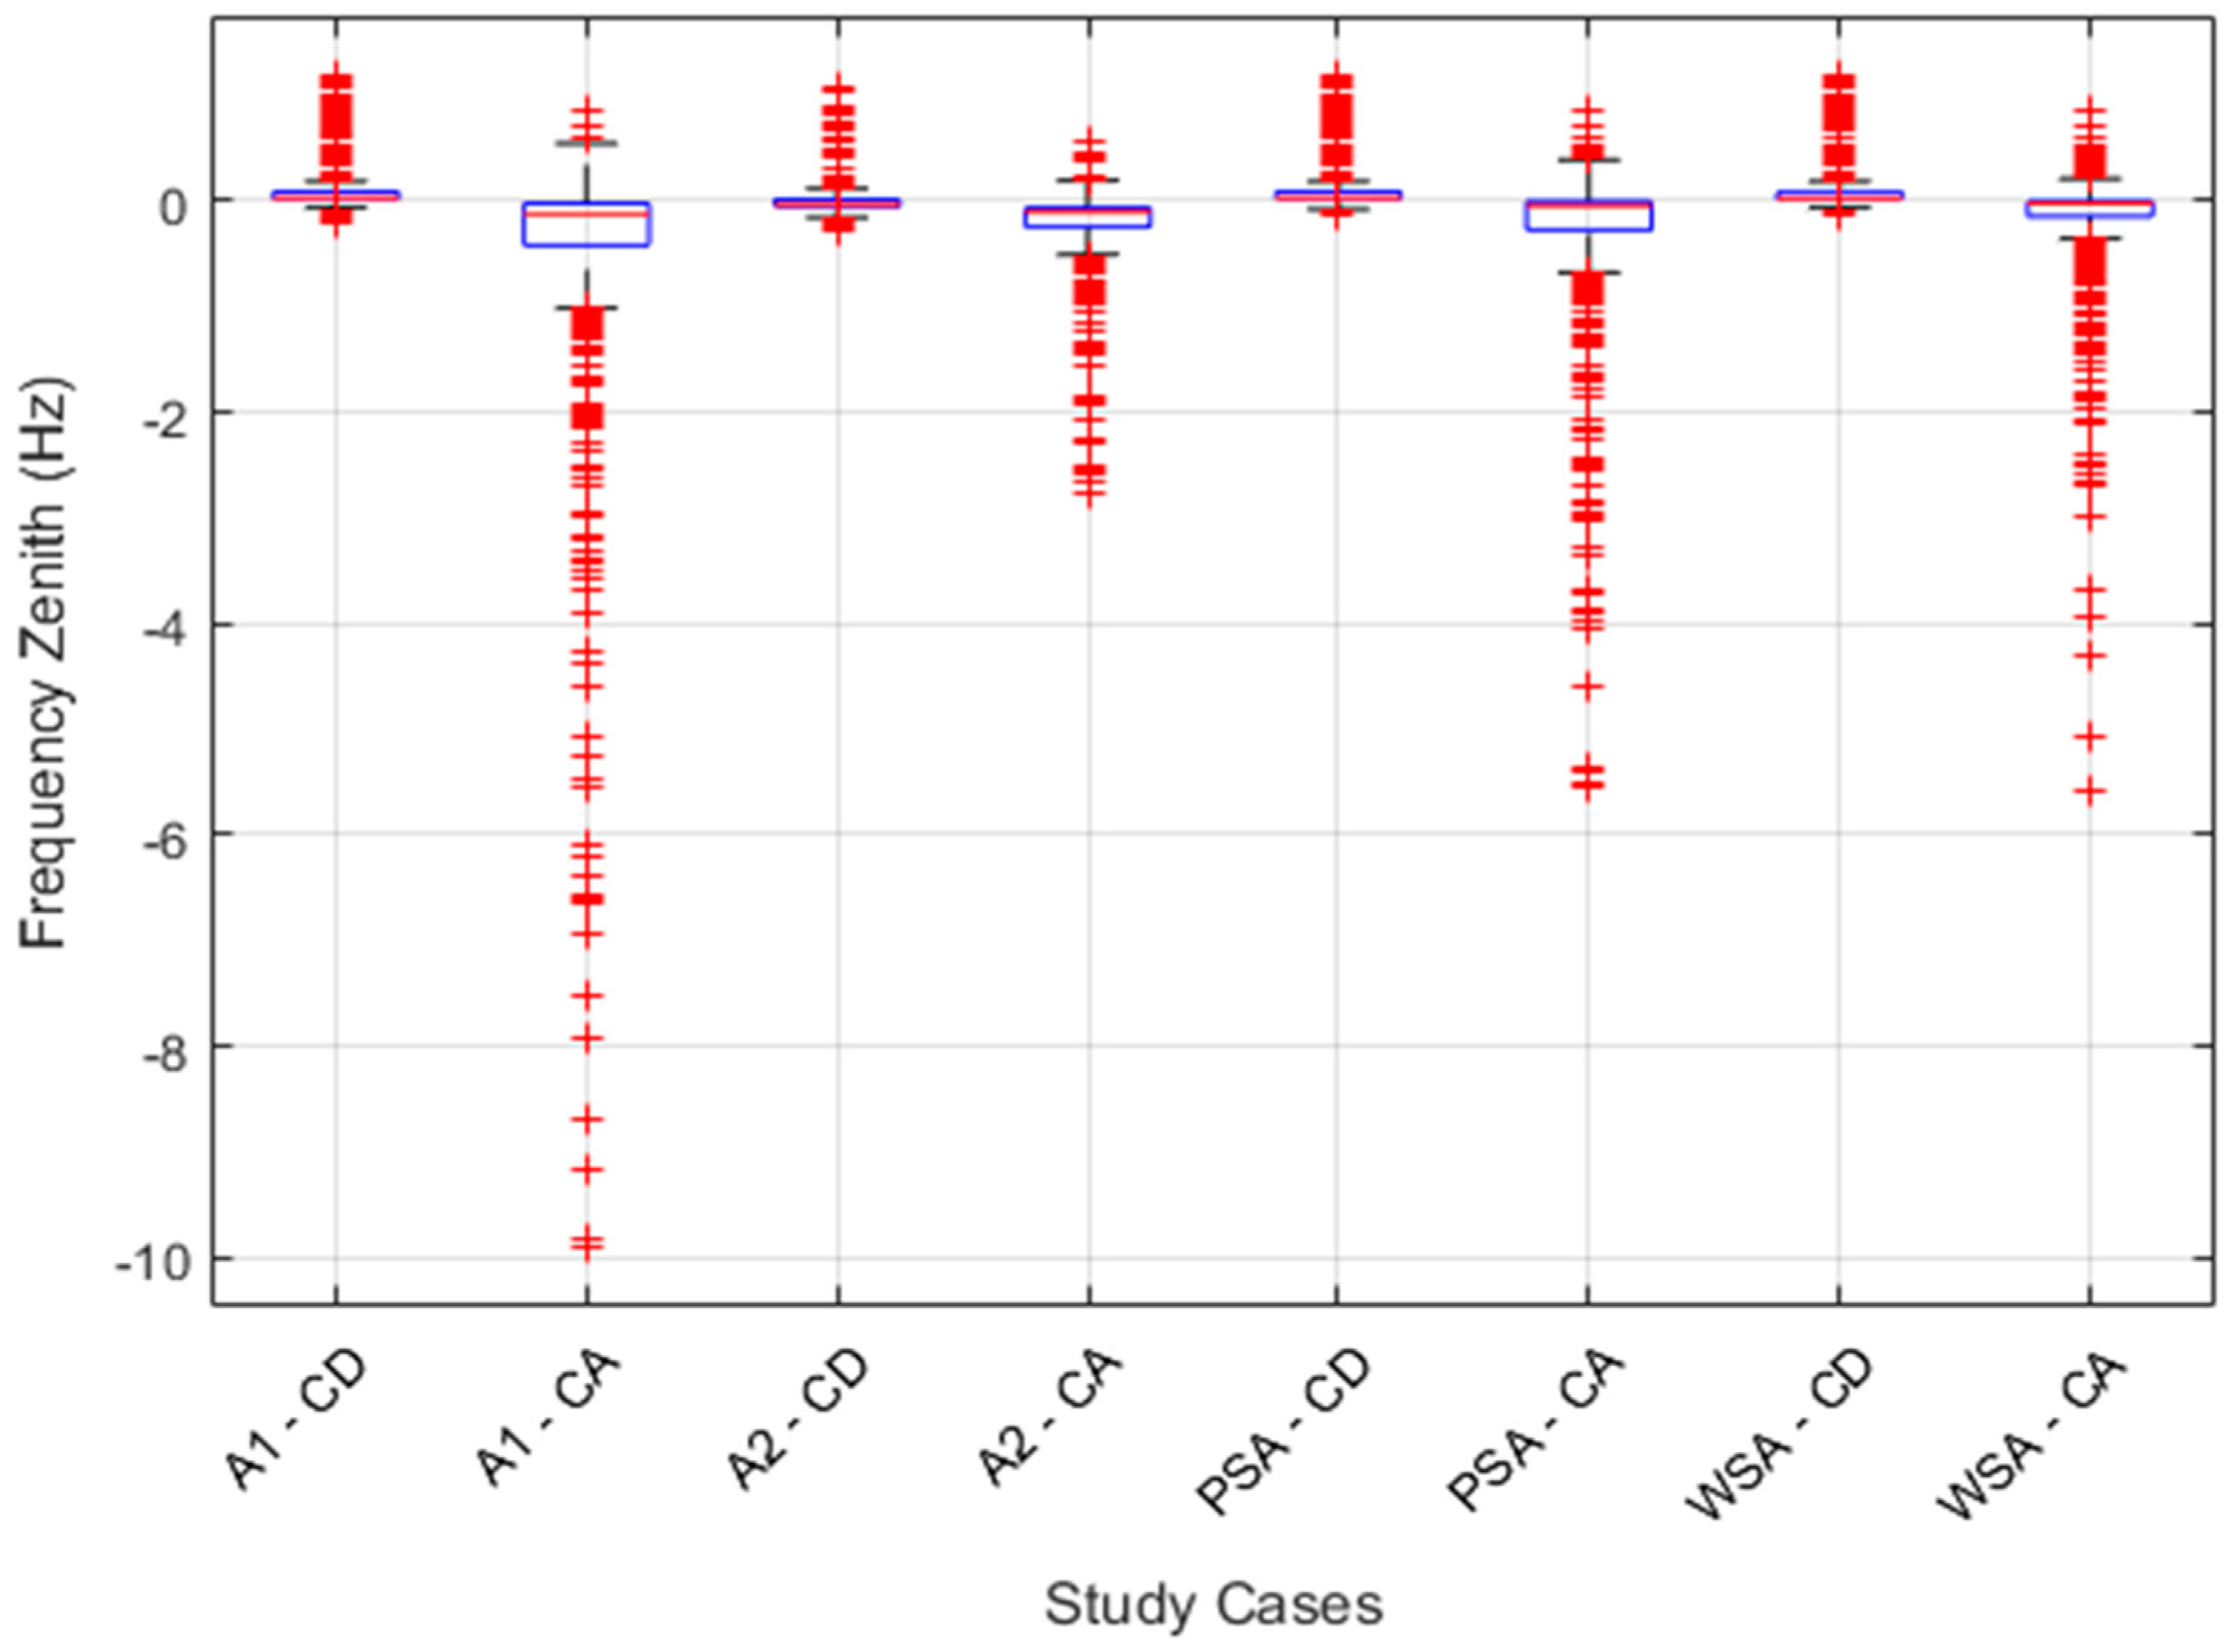
3. Simulation Case Results
- A1—CD: Area No 1—Controllers Deactivated
- A1—CD: Area No 1—Controllers Activated
- A2—CD: Area No 2—Controllers Deactivated
- A2—CD: Area No 2—Controllers Activated
- PSA—CD: Power Station Area—Controllers Deactivated
- PSA—CD: Power Station Area—Controllers Activated
- WSA—CD: Wind Station Area—Controllers Deactivated
- WSA—CD: Wind Station Area—Controllers Activated
4. Discussion
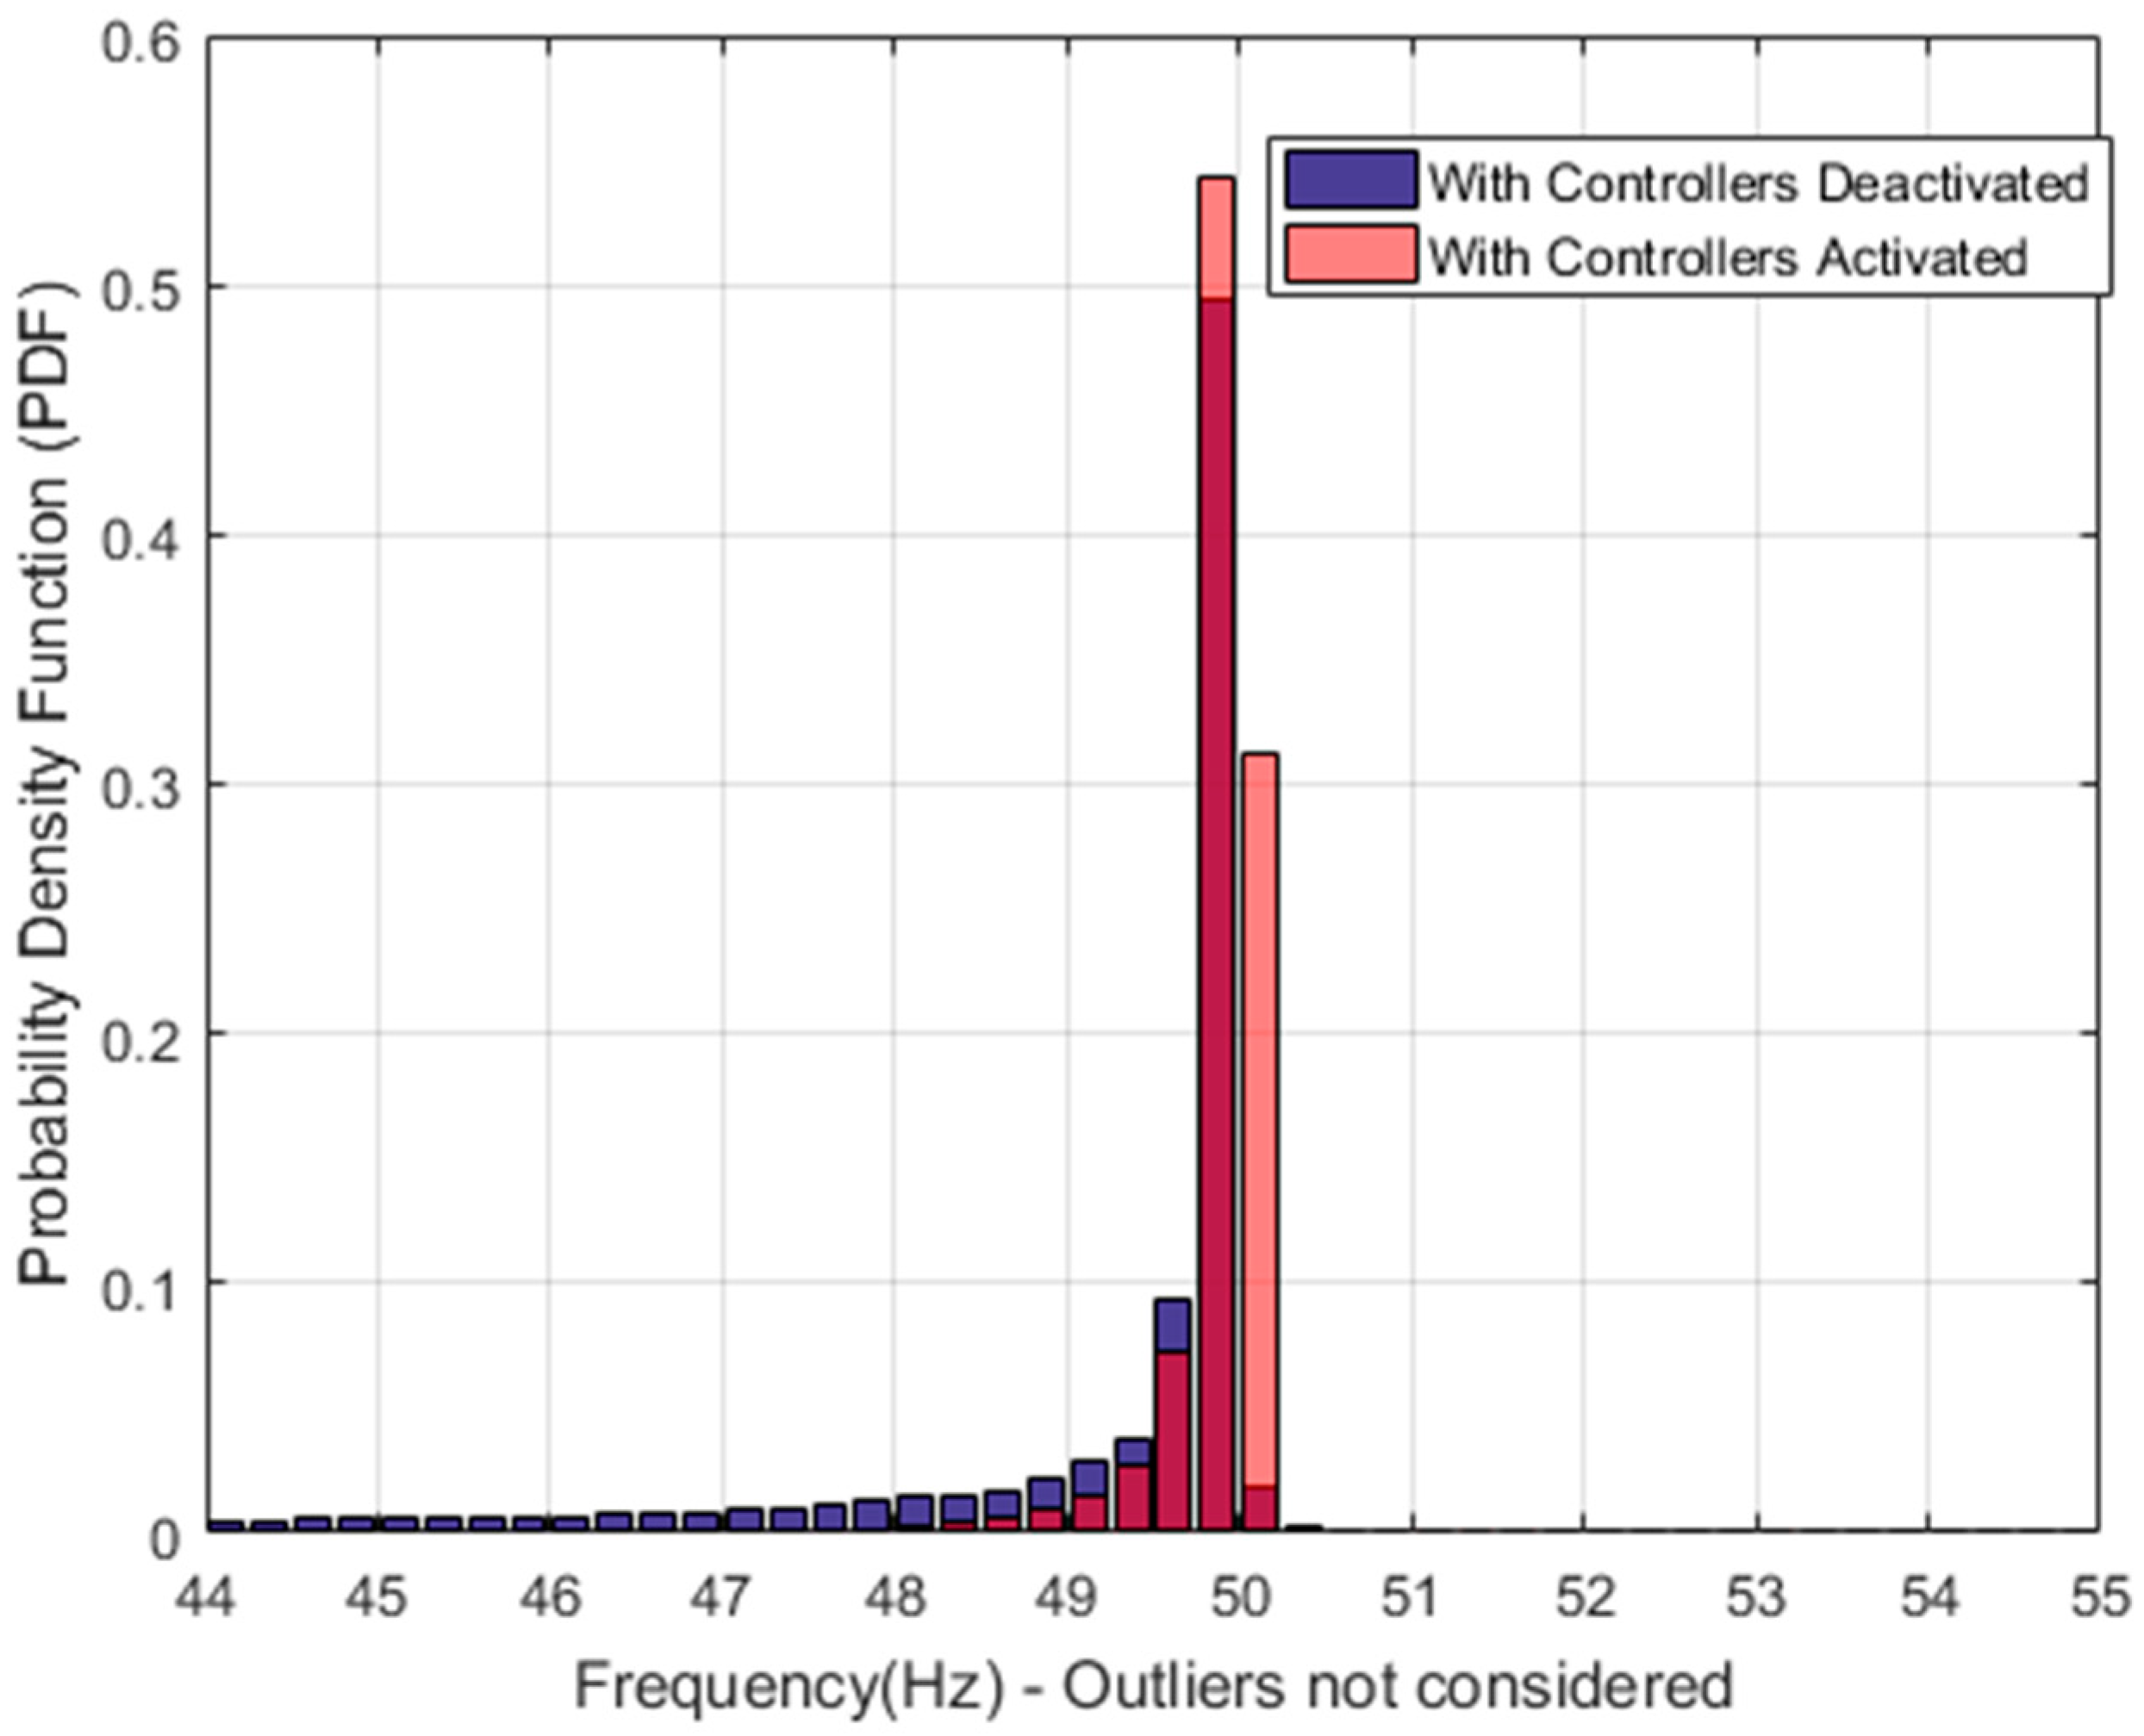
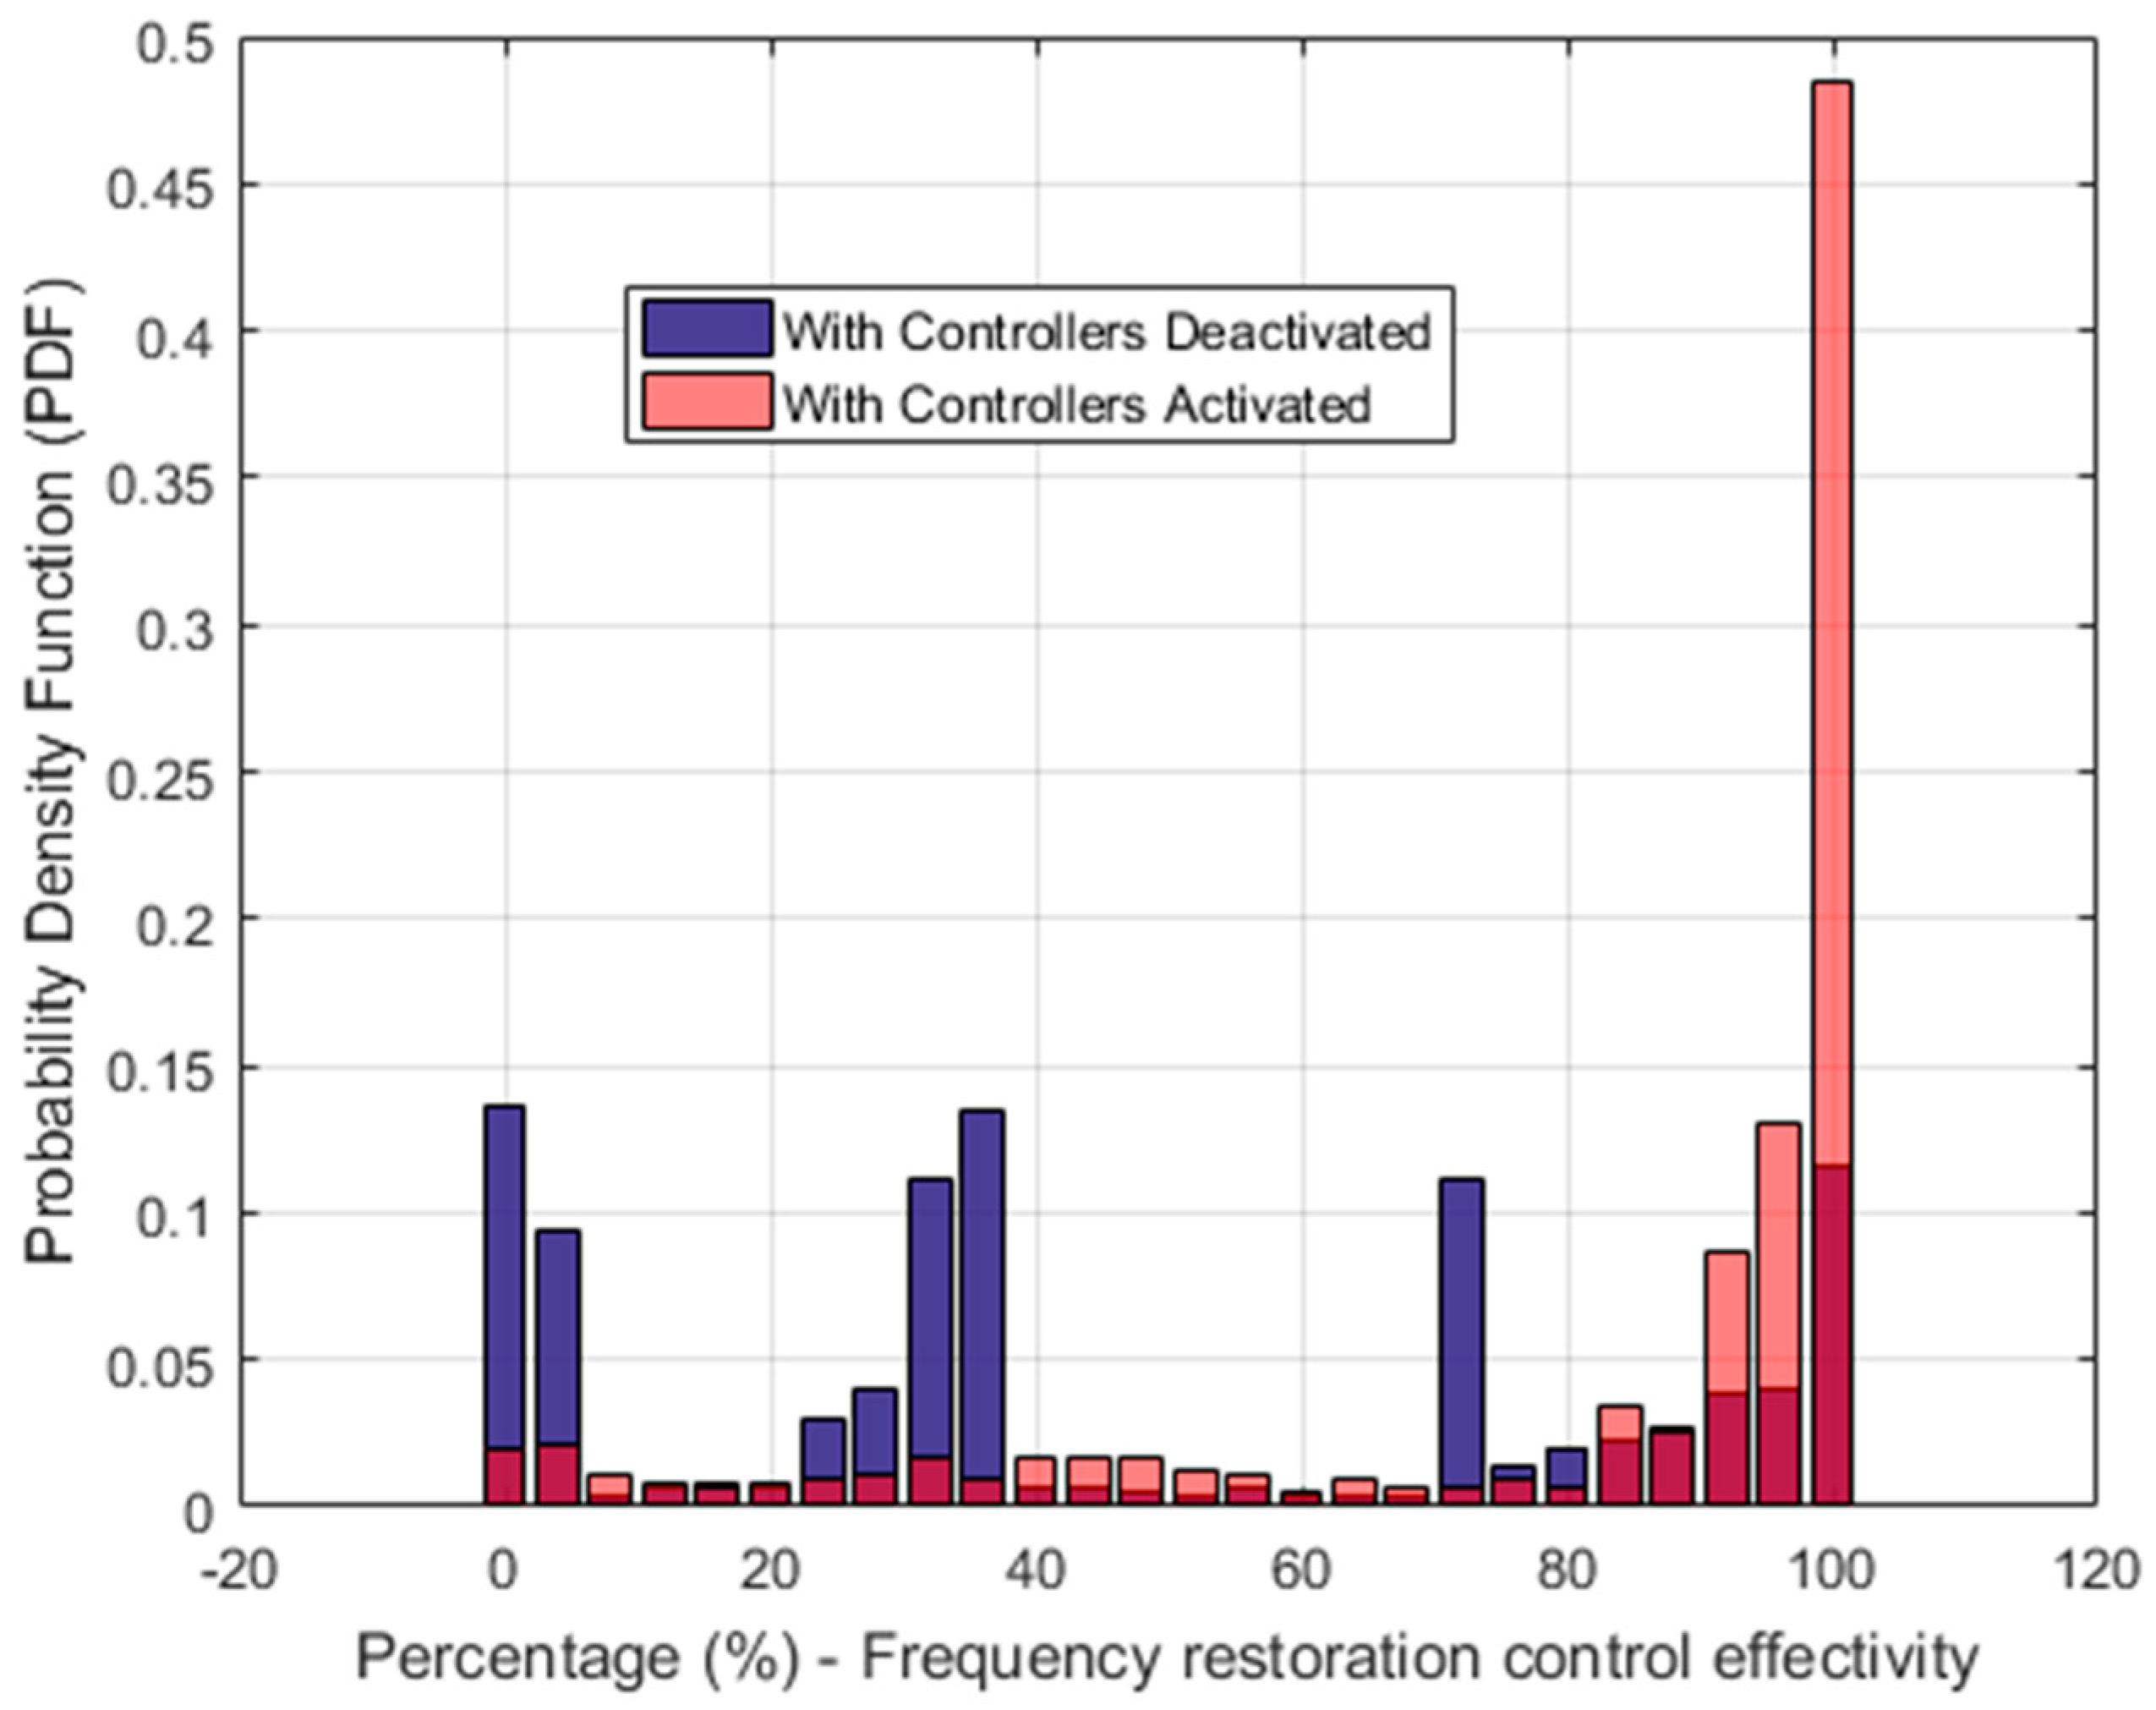
- Results of frequency variation showing that the local control approach manages to minimize the frequency reduction effectively.
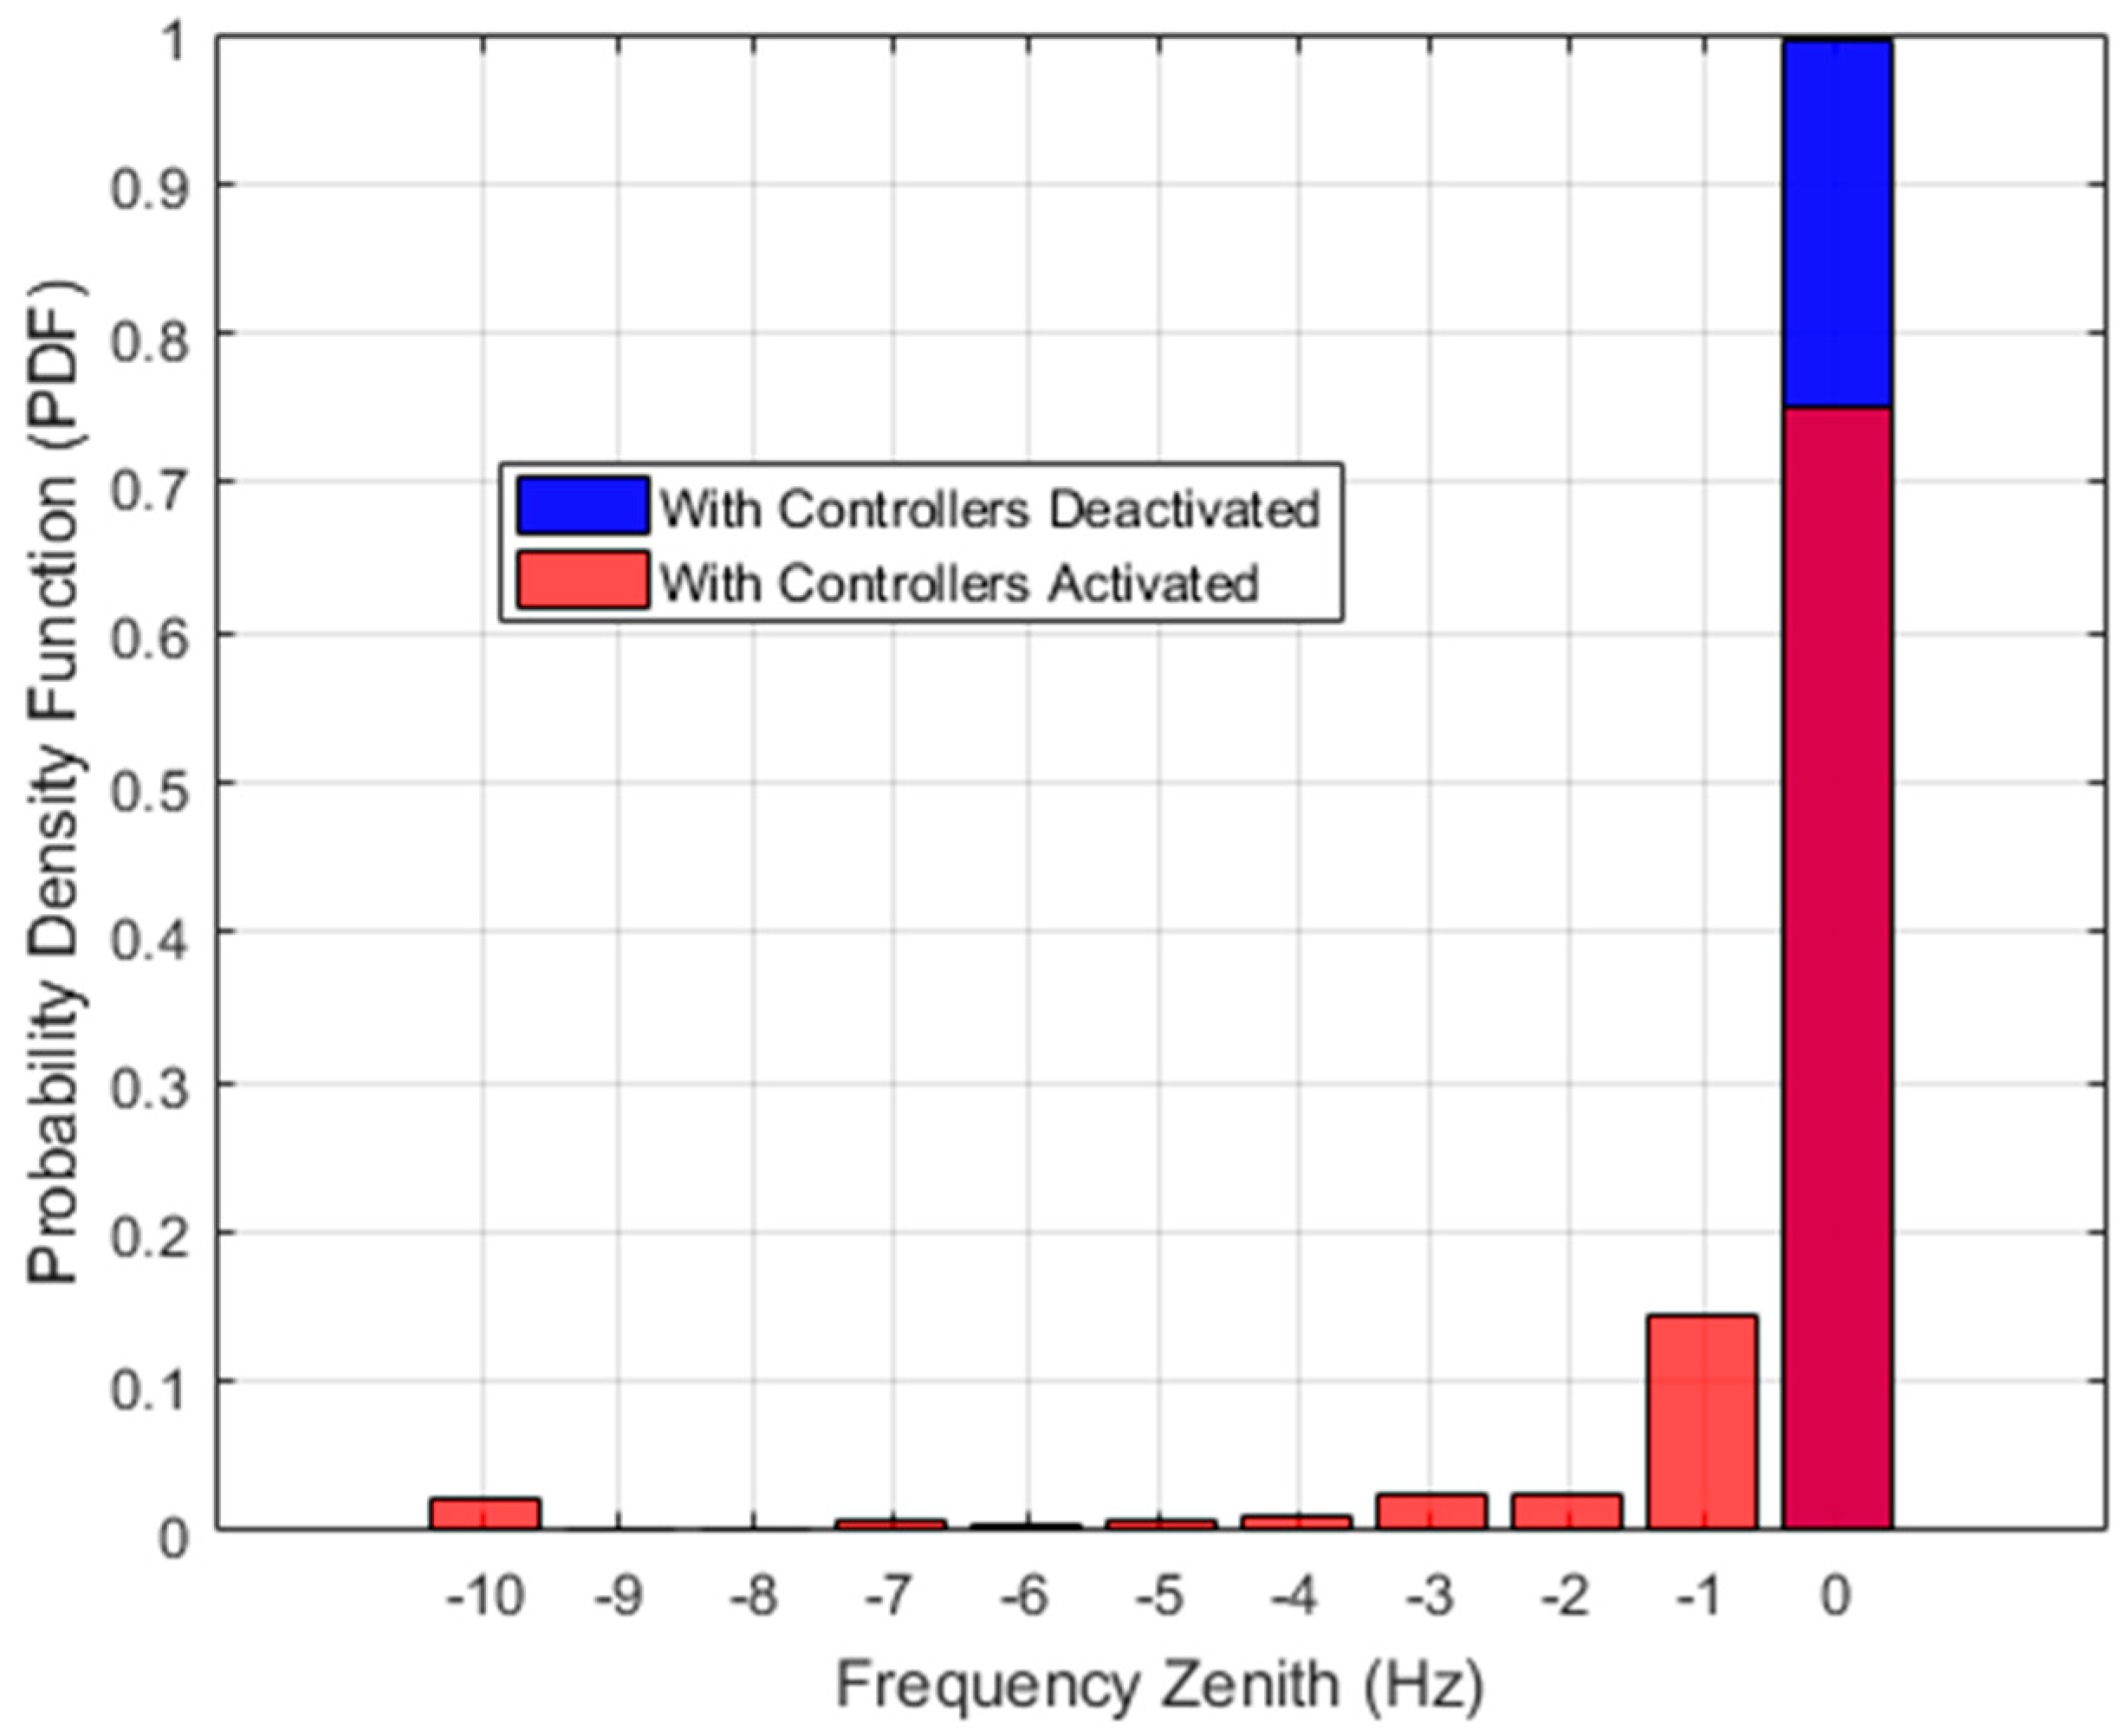
- The steep frequency reduction is being avoided in most cases when the frequency regulation controls are enabled as lower negative values are observed;
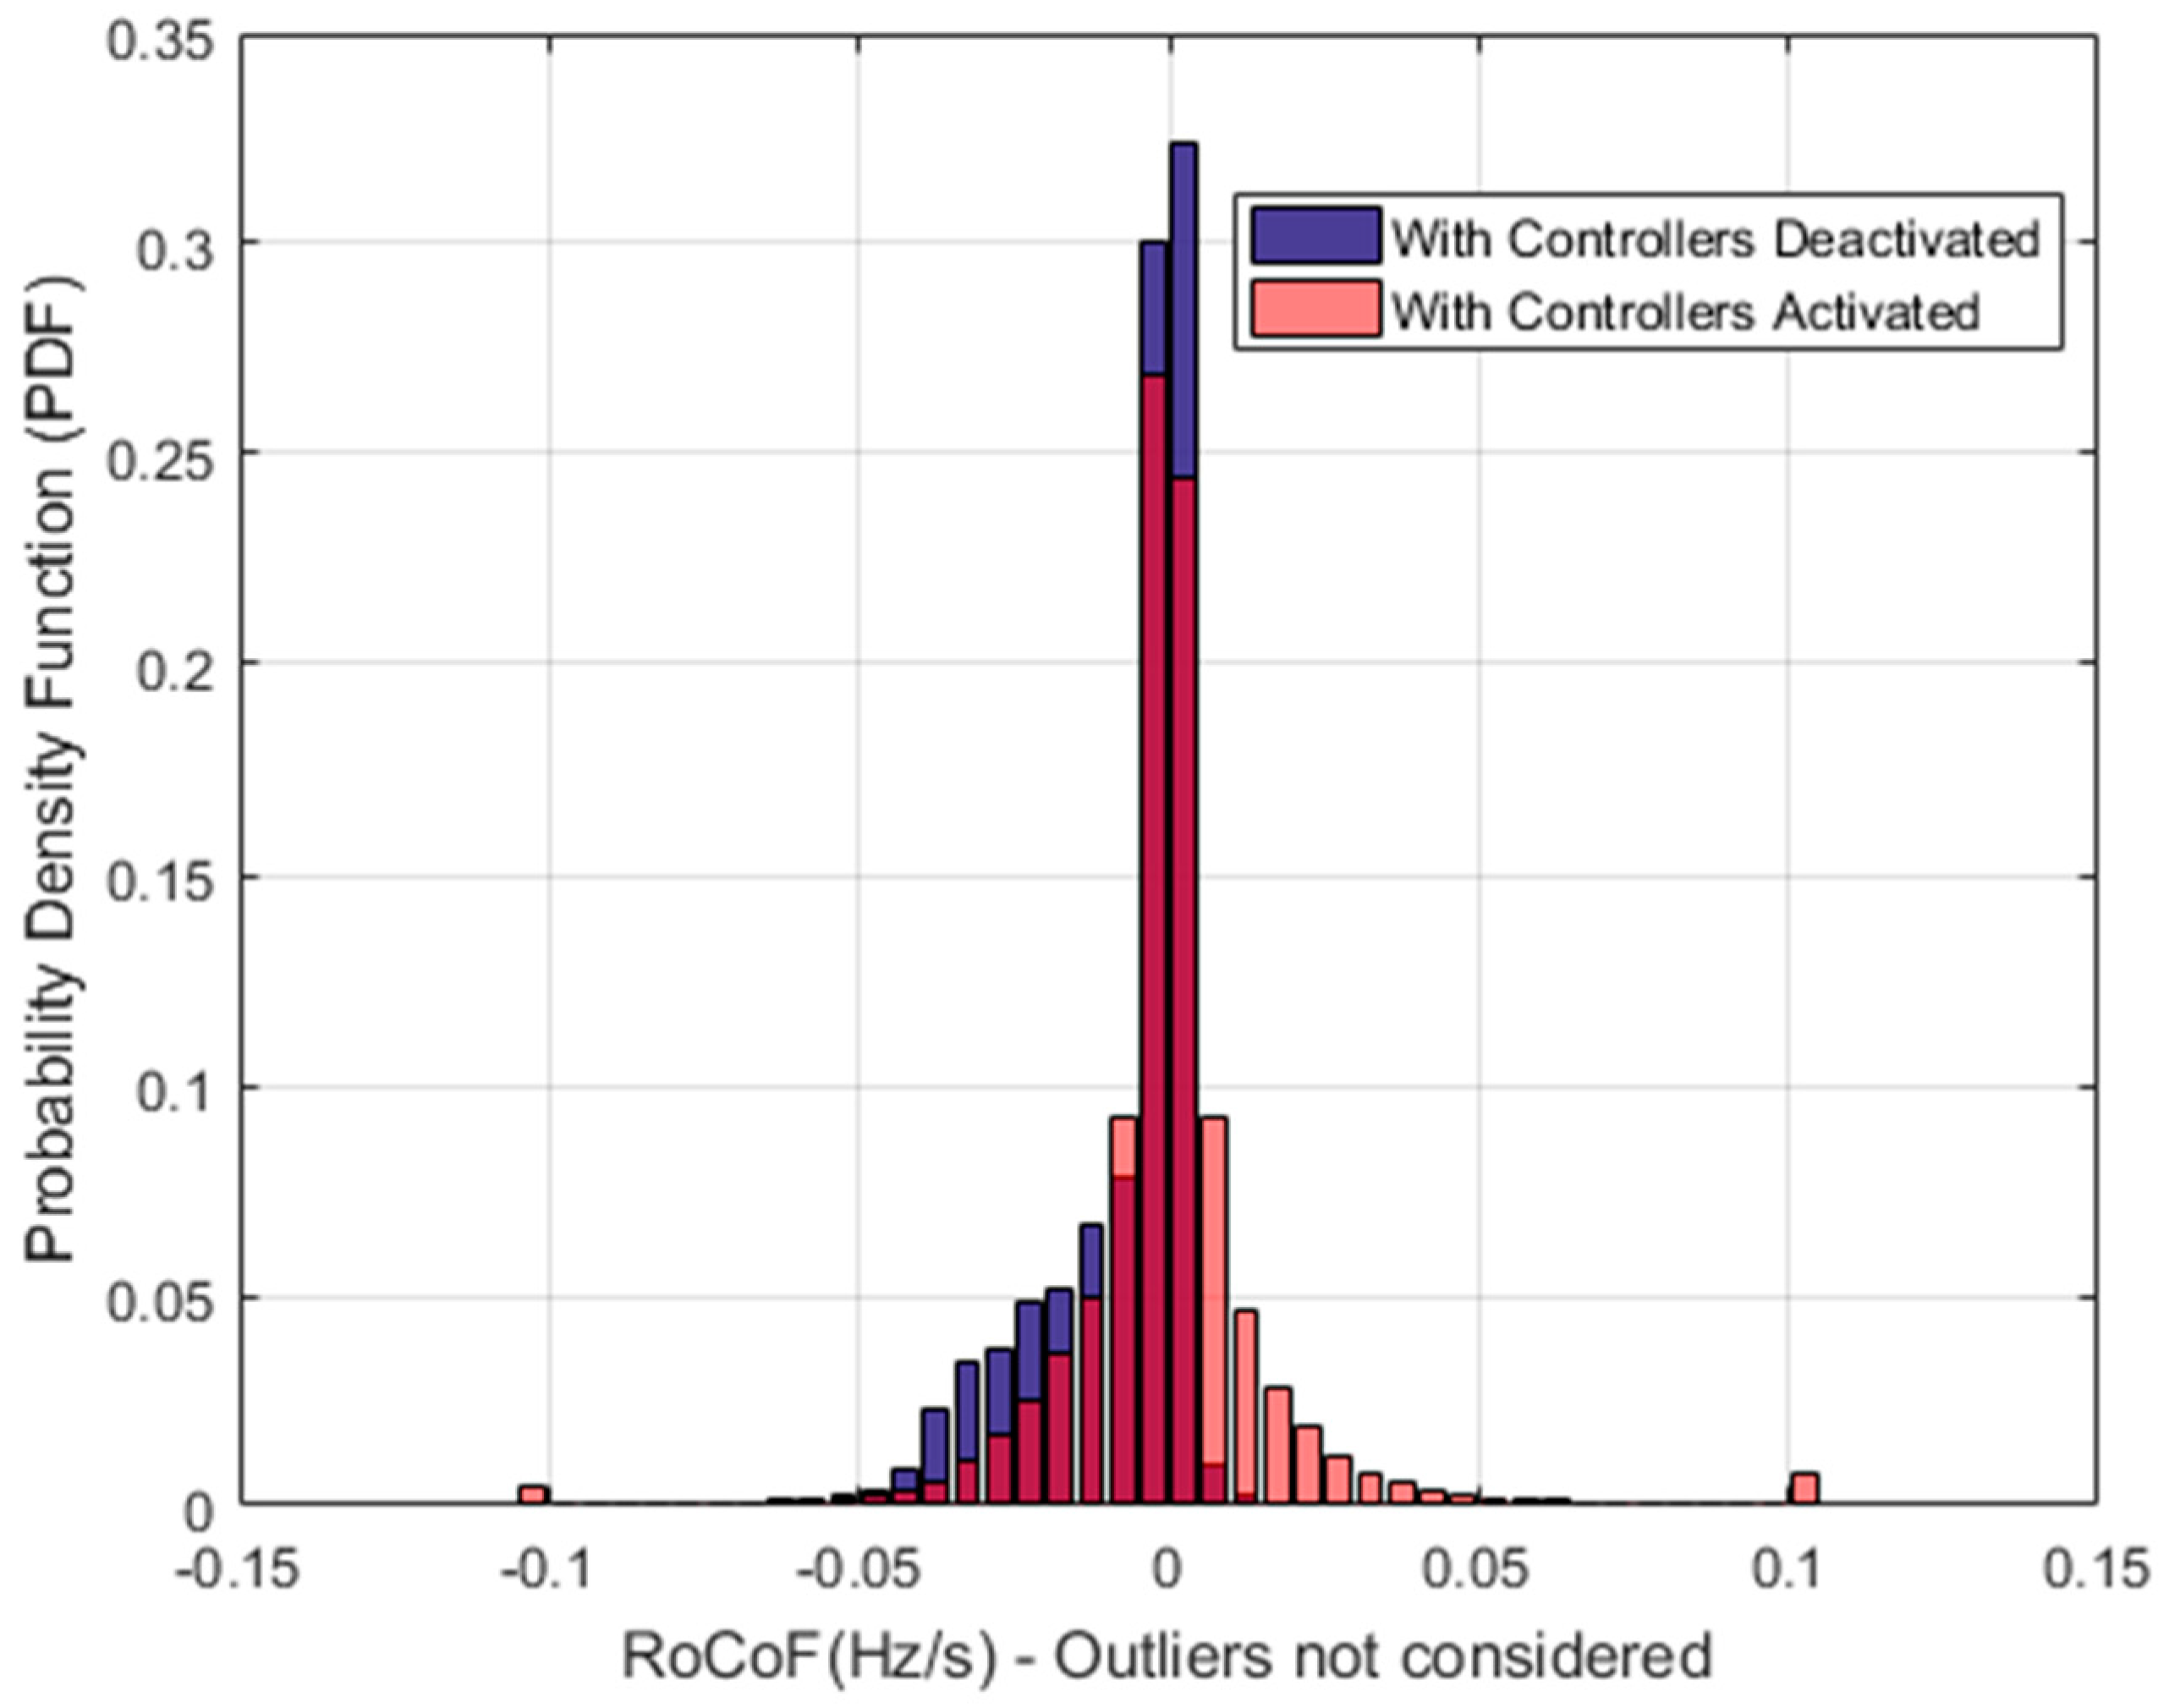
- The controllers force the frequency to get into the acceptable range causing positive RoCoF values;
- Justification/verification that the controllers are quite effective in controlling frequency according to the target range;
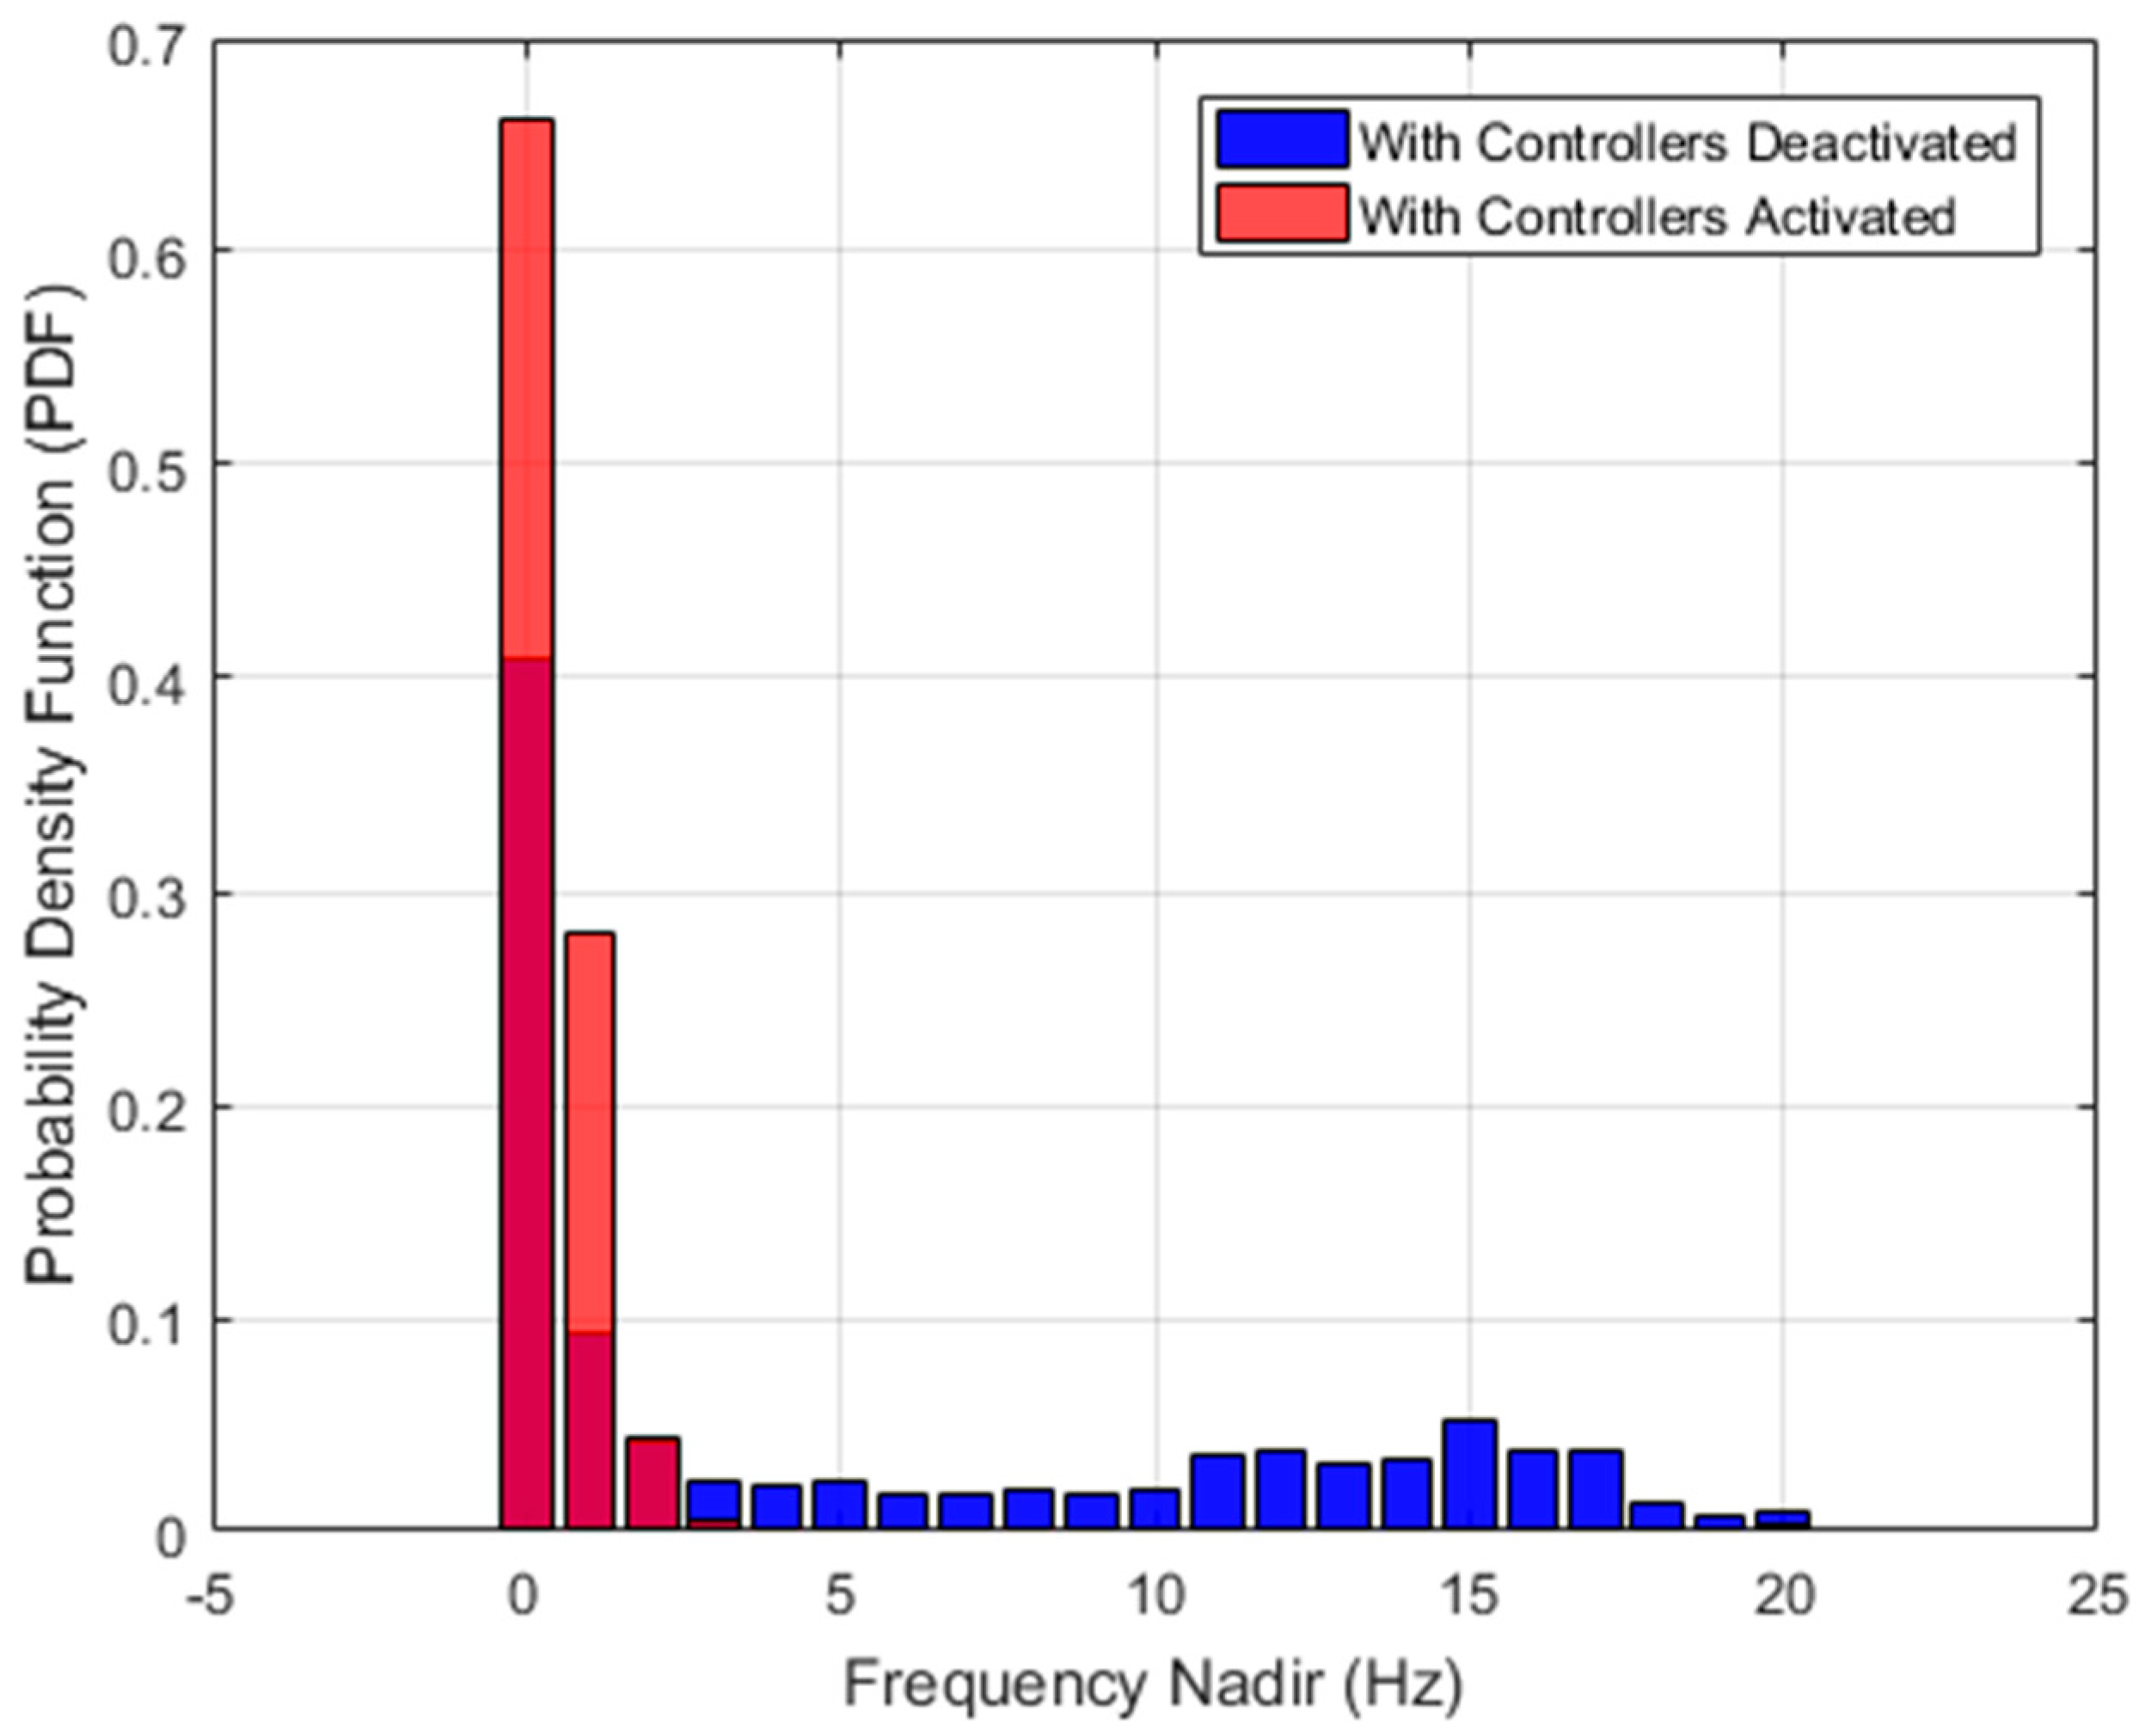
- The frequency nadir is being reduced significantly but still showing that considerable overshoots are still expected in some circumstances if not tuned appropriately;
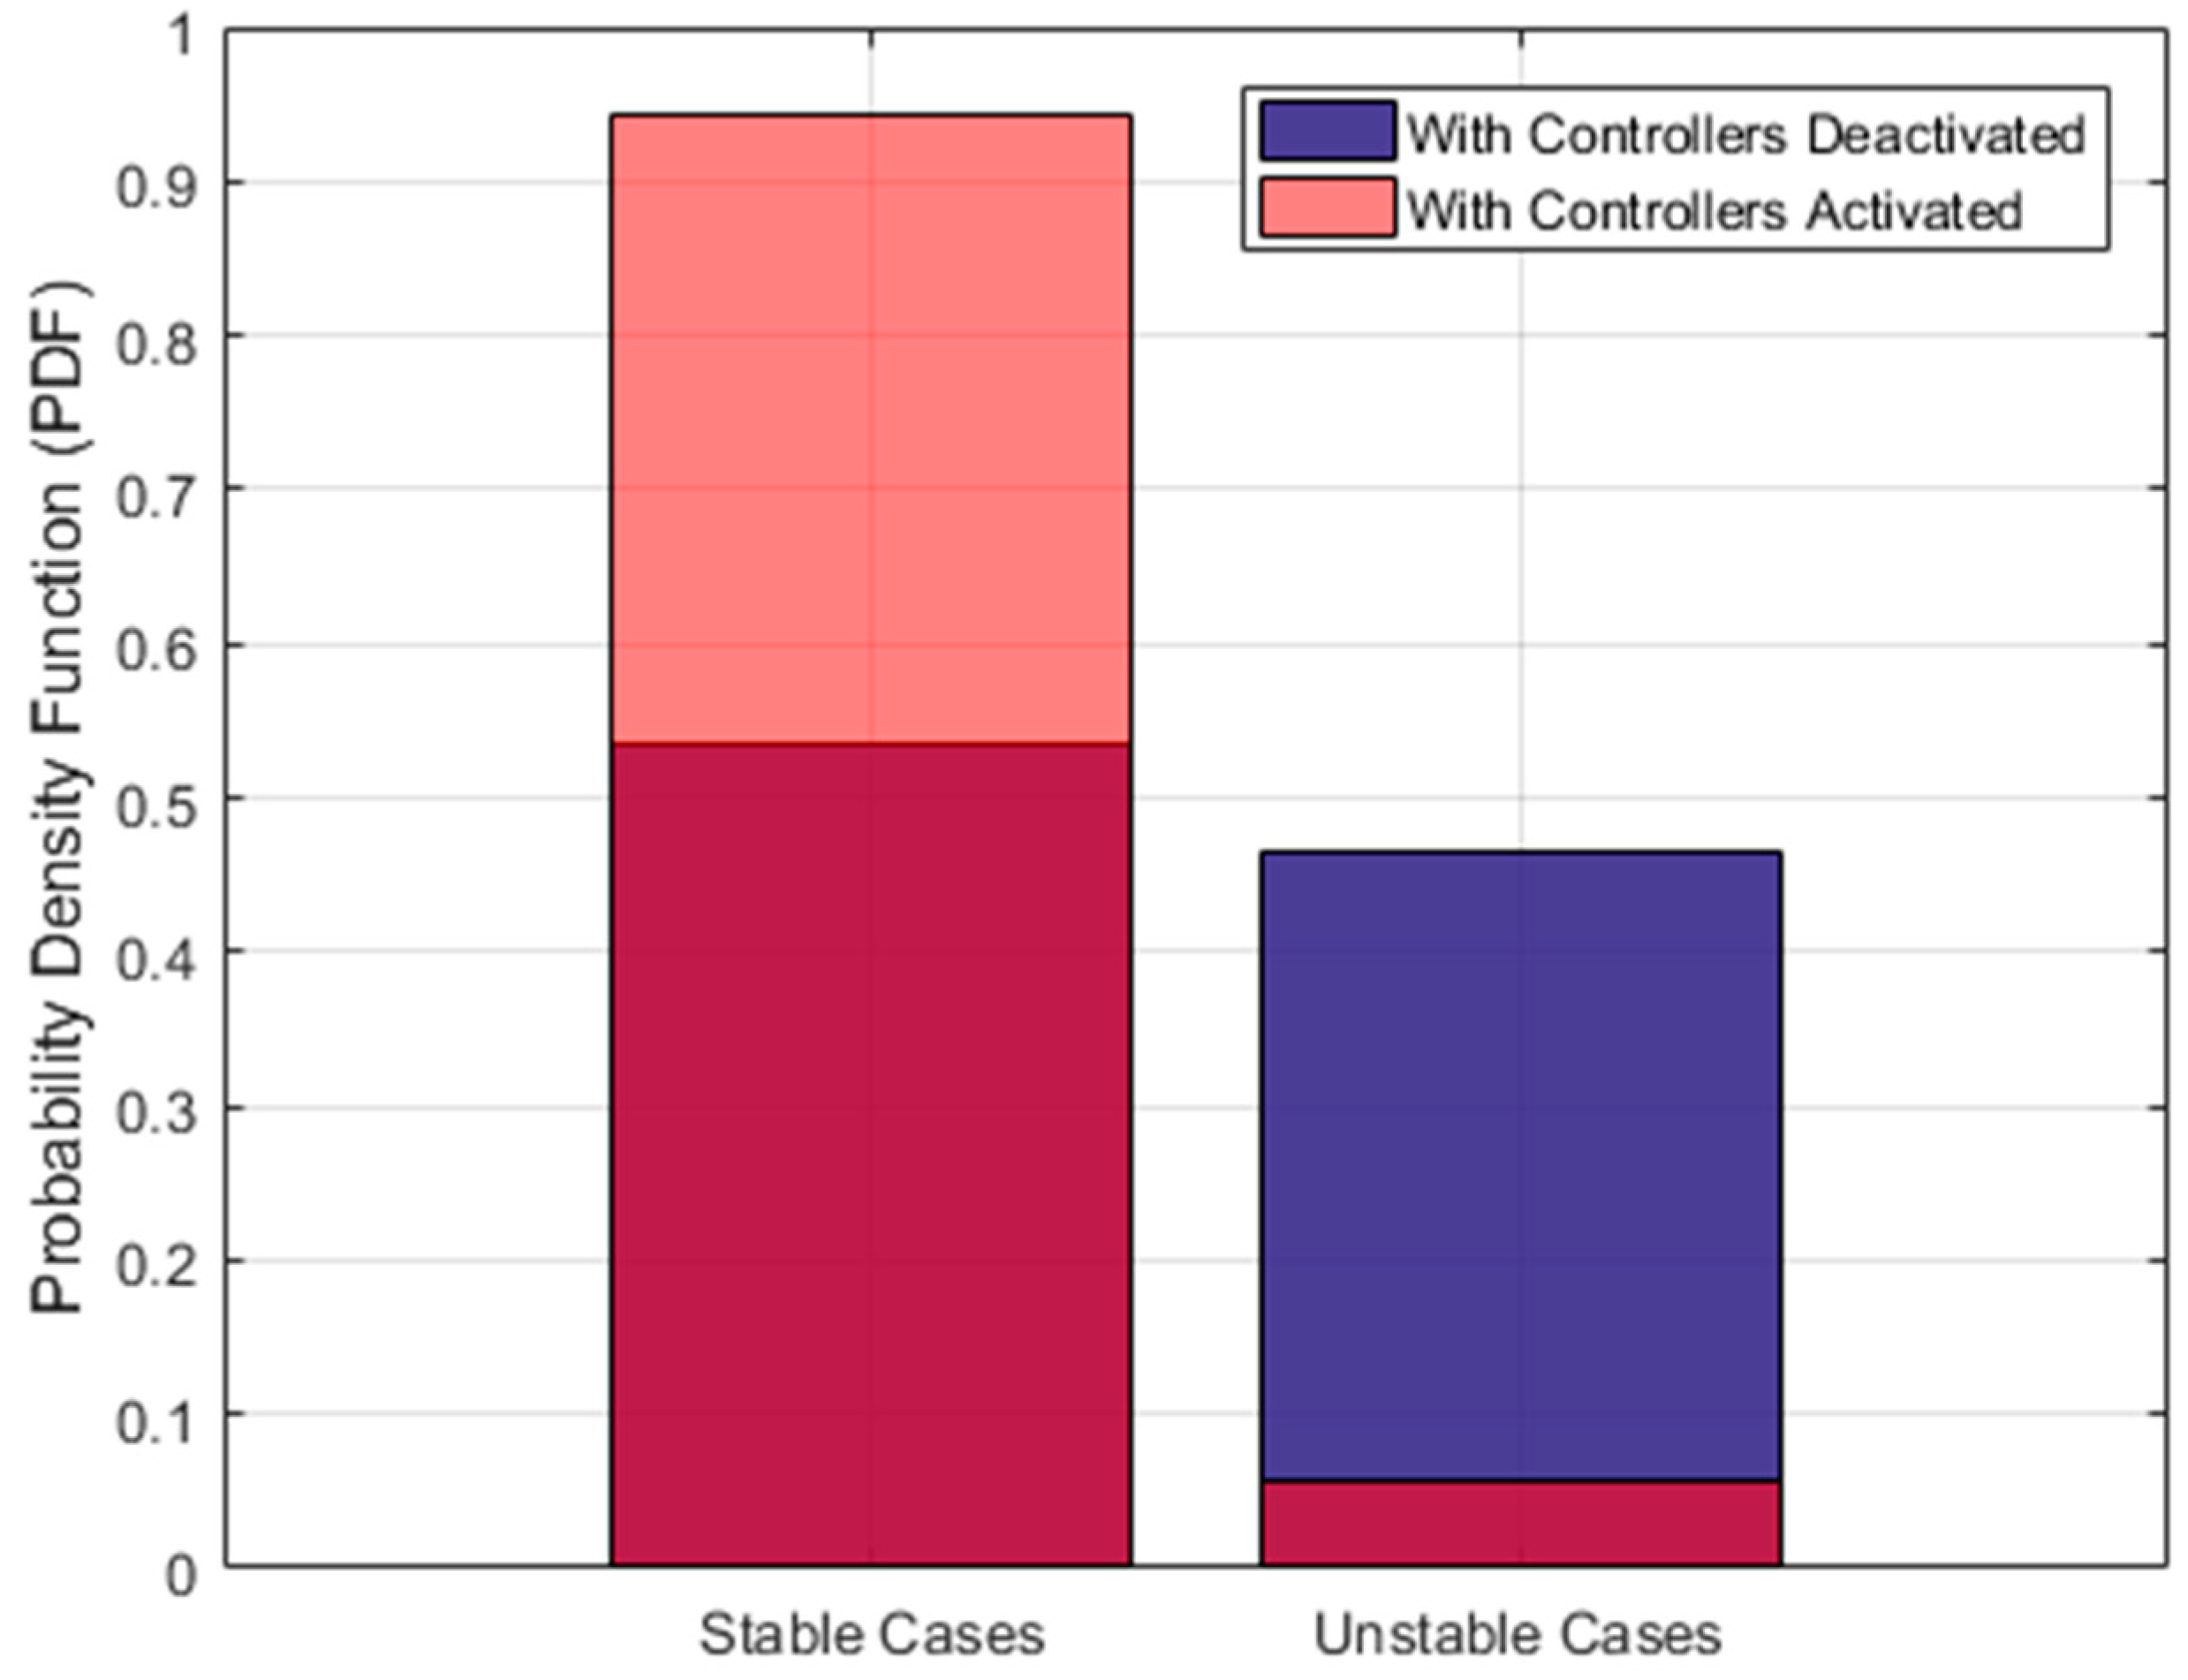
- The overall stability is improved through the adaption of hierarchical controllers for frequency regulation;
- The hierarchical controllers are quite effective during severe events and can ever help in avoiding major or partial shutdown of the power grid;
- The hierarchical controllers must be a product of careful and meticulous design to be able to cope with all categories of events even with ones having low probability of occurrence.
5. Conclusions
- A methodology for frequency stability evaluation of real systems;
- A true simulation of an active grid extending down to the distribution substation level;
- A two-level hierarchical control for effective Fast Frequency Control (FFR) including distributed local control;
- Utilization of the active sources of the grid down to the distribution substation level for frequency control/support, avoiding traditional operation schemes like underfrequency control schemes that are based on load rejection;
- A methodology for the evolution of the Cyprus grid system that is expected to be in operation in 2030 based on selected scenarios for the evolution of technologies and systems.
Author Contributions
Funding
Acknowledgments
Conflicts of Interest
References
- Union for the Coordination of Transmission of Electricity. Operation Handbook Appendix 1—Load-Frequency Control and Performance; ENTSO-E/UCTE: Paris, France, 2004; Available online: www.entsoe.eu (accessed on 8 May 2020).
- ENTSO-E Technical Group on High Penetration of Power Electronic Interfaced Power Sources. High Penetration of Power Electronic Interfaced Power Sources and the Potential Contribution of Grid Forming Converters; Technical Report; ENTSO-E/UCTE: Brussels, Belgium, 2017; Available online: https://euagenda.eu/upload/publications/untitled-292051-ea.pdf (accessed on 8 May 2020).
- Stenclik, D.; Richwine, M.; Miller, N.; Hong, L. The Role of Fast Frequency Response in Low Inertia Power Systems. In Proceedings of the CIGRE Technical Meeting, Paris, France, 26–31 August 2018. [Google Scholar]
- O’connell, B.; Cunniffe, N.; Eager, M.; Cashman, D.; O’sullivan, J. Assessment of Technologies to Limit the Rate of Change of Grid Frequency on an Island System. In Proceedings of the CIGRE Technical Meeting, Paris, France, 26–31 August 2018. [Google Scholar]
- Liu, Y.; You, S.; Liu, Y. Study of Wind and PV Frequency Control in U.S. Power Grids—EI and TI Case Studies. IEEE Power Energy Technol. Syst. J. 2017, 4, 1–9. [Google Scholar]
- Thorbergsson, E.; Knap, V.; Swierczynski, M.; Stroe, D.; Teodorescu, R. Primary Frequency Regulation with Li-Ion Battery Based Energy Storage System—Evaluation and Comparison of Different Control Strategies. Intelec 2013. In Proceedings of the 35th International Telecommunications Energy Conference, Smart Power and Efficiency, Hamburg, Germany, 13–17 October 2013; pp. 1–6. [Google Scholar]
- Sami, S.S.; Cheng, M.; Wu, J. Modelling and control of multi-type grid-scale energy storage for power system frequency response. In Proceedings of the 2016 IEEE 8th International Power Electronics and Motion Control Conference (IPEMC-ECCE Asia), Hefei, China, 22–26 May 2016; pp. 269–273. [Google Scholar]
- Strassheim, A.; de Haan, J.E.S.; Gibescu, M.; Kling, W.L. Provision of frequency restoration reserves by possible energy storage systems in Germany and the Netherlands. In Proceedings of the 11th International Conference on the European Energy Market (EEM14), Krakow, Poland, 28–30 May 2014; pp. 1–5. [Google Scholar]
- Hong, Q.; Nedd, M.; Norris, S.; Abdulhadi, I.; Karimi, M.; Terzija, V.; Marshall, B.; Bell, K.; Booth, C. Fast frequency response for effective frequency control in power systems with low inertia. J. Eng. 2019, 2019, 1696–1702. [Google Scholar] [CrossRef]
- NERC (North American Electric Reliability Corporation). Inverter-Based Resource Performance Task Force (IRPTF) White Paper, March 2020. Available online: https://www.nerc.com/comm/PC/InverterBased%20Resource%20Performance%20Task%20Force%20IRPT/Fast_Frequency_Response_Concepts_and_BPS_Reliability_Needs_White_Paper.pdf (accessed on 8 May 2020).
- Australian Energy Market Operator (AEMO). Fast Frequency Response in The Nem—Working Paper Future Power System Security Program, 2017. Available online: https://www.aemo.com.au/-/media/Files/Electricity/NEM/Security_and_Reliability/Reports/2017/FFR-Working-Paper---Final.pdf (accessed on 8 May 2020).
- Baghaee, H.R.; Mirsalim, M.; Gharehpetian, G.B.; Talebi, H.A. A Decentralized Power Management and Sliding Mode Control Strategy for Hybrid AC/DC Microgrids including Renewable Energy Resources. In IEEE Transactions on Industrial Informatics; IEEE: Piscataway, NJ, USA, 2017. [Google Scholar]
- Baghaee, H.R.; Mirsalim, M.; Gharehpetian, G.B.; Talebi, H.A. Decentralized Sliding Mode Control of WG/PV/FC Microgrids under Unbalanced and Nonlinear Load Conditions for On- and Off-Grid Modes. IEEE Syst. J. 2018, 12, 3108–3119. [Google Scholar] [CrossRef]
- Baghaee, H.R.; Mirsalim, M.; Gharehpetan, G.B.; Talebi, H.A. Nonlinear Load Sharing and Voltage Compensation of Microgrids Based on Harmonic Power-Flow Calculations Using Radial Basis Function Neural Networks. IEEE Syst. J. 2018, 12, 2749–2759. [Google Scholar] [CrossRef]
- Baghaee, H.R.; Mirsalim, M.; Gharehpetian, G.B.; Talebi, H.A. A Decentralized Robust Mixed $H_{{2}}/ H_{{{\infty }}}$ Voltage Control Scheme to Improve Small/Large-Signal Stability and FRT Capability of Islanded Multi-DER Microgrid Considering Load Disturbances. IEEE Syst. J. 2018, 12, 2610–2621. [Google Scholar] [CrossRef]
- Entso-e (The European Network for Transmission System Operators’ Electricity) Ten Year Development Plan (TYNDP) 2018 Public Report. Available online: https://www.entso-g.eu/sites/default/files/files-old-website/publications/TYNDP/2018/entsos_tyndp_2018_Final_Scenario_Report_ANNEX_II_Methodology.pdf (accessed on 8 May 2020).
- Cyprus’ Integrated National Energy and Climate Plan under the Regulation (EU) 2018/1999 of the European Parliament and of the Council of 11 December 2018 on the Governance of the Energy Union and Climate Action. Available online: https://ec.europa.eu/energy/sites/ener/files/documents/cy_final_necp_main_en.pdf (accessed on 8 May 2020).
- Bobinaite, V.; Di Somma, M.; Graditi, G.; Oleinikova, I. The Regulatory Framework for Market Transparency in Future Power Systems under the Web-of-Cells Concept. Energies 2019, 12, 880. [Google Scholar] [CrossRef] [Green Version]
- Ciavarella, R.; Gradit, G.; Valenti, M.; Strasser, T.I. Innovative Frequency Controls for Intelligent Power Systems. In Proceedings of the 2018 International Symposium on Power Electronics, Electrical Drives, Automation and Motion (SPEEDAM), Amalfi, Italy, 20–22 June 2018; pp. 656–660. [Google Scholar]
- ELECTRA IRP Project. Simulations Based Evaluation of the ELECTRA WoC Solutions for Voltage and Balance Control—Stand-Alone Use Case Simulation Results; WP 6, Control Schemes for the Use of Flexibility; ELECTRA Consortium, 2018. [Google Scholar]
- Rakhshani, E.; Gusain, D.; Sewdien, V.; Torres, J.L.R.; Van Der Meijden, M.A. A Key Performance Indicator to Assess the Frequency Stability of Wind Generation Dominated Power System. IEEE Access 2019, 7, 130957–130969. [Google Scholar] [CrossRef]
- Policy 1: Load-frequency control and performance, ENTSO-E, Continental Eur. Oper. Handbook, Tech. Rep., 2018. Available online: https://www.entsoe.eu/_leadmin/user_upload/_library/publications/entsoe/Operation_Handbook/Policy_1__nal.pdf (accessed on 8 May 2020).
- RG-CE System Protection & Dynamics Sub Group (REE, Terna, TransnetBW, 50Hertz Transmission, RTE, Swissgrid and Energinet.dk). Frequency Stability Evaluation Criteria for the Synchronous Zone of Continental Europe; ENTSO-E: Brussels, Belgium, 2016. [Google Scholar]


| Scenario—Nominal Capacity Per Power Source Type (MVA) | ||||||
|---|---|---|---|---|---|---|
| Scenario Cases | Solar | Wind | Hydro | Biomass | Conventional | Pump Storage |
| 2030 | 42.3 | 42.3 | 48.9 | 9.2 | 22.5 | — |
| Stability Analysis Scenarios for 2030—Loss of Power Generation (Affected Source Type Marked with Bold Style) | ||||
|---|---|---|---|---|
| Source Type | Fault in Area 1 | Fault in Area 2 | Fault in Wind Station | Fault in Gen. Station |
| Solar | 42.3 | 42.3 | 42.3 | 42.3 |
| Wind | 42.3 | 42.3 | 42.3 | 42.3 |
| Hydro | 34.2 | 34.2 | 34.2 | 34.2 |
| Biomass | 6.4 | 6.4 | 6.4 | 6.4 |
| Conventional | 15.8 | 15.8 | 15.8 | 15.8 |
| Key Performance Index | ID | Name | Formula |
| 1 | Frequency restoration control effectivity | ||
| 2 | Frequency nadir | ||
| 3 | Frequency zenith | ||
| 4 | Rate of Change of Frequency (RoCoF) | (pu) | |
| 5 | Indication of Stability | Boolean variable (YES/NO) |
© 2020 by the authors. Licensee MDPI, Basel, Switzerland. This article is an open access article distributed under the terms and conditions of the Creative Commons Attribution (CC BY) license (http://creativecommons.org/licenses/by/4.0/).
Share and Cite
Patsalides, M.; Papadimitriou, C.N.; Efthymiou, V.; Ciavarella, R.; Di Somma, M.; Wakszyńska, A.; Kosmecki, M.; Graditi, G.; Valenti, M. Frequency Stability Evaluation in Low Inertia Systems Utilizing Smart Hierarchical Controllers. Energies 2020, 13, 3506. https://doi.org/10.3390/en13133506
Patsalides M, Papadimitriou CN, Efthymiou V, Ciavarella R, Di Somma M, Wakszyńska A, Kosmecki M, Graditi G, Valenti M. Frequency Stability Evaluation in Low Inertia Systems Utilizing Smart Hierarchical Controllers. Energies. 2020; 13(13):3506. https://doi.org/10.3390/en13133506
Chicago/Turabian StylePatsalides, Minas, Christina N. Papadimitriou, Venizelos Efthymiou, Roberto Ciavarella, Marialaura Di Somma, Anna Wakszyńska, Michał Kosmecki, Giorgio Graditi, and Maria Valenti. 2020. "Frequency Stability Evaluation in Low Inertia Systems Utilizing Smart Hierarchical Controllers" Energies 13, no. 13: 3506. https://doi.org/10.3390/en13133506