A Review of the Tools and Methods for Distribution Networks’ Hosting Capacity Calculation


1
Division of Sustainability, College of Science and Engineering, Hamad Bin Khalifa University, Doha 34110, Qatar
2
Iberdrola Innovation Middle East, Qatar Science & Technology Park, Doha 210177, Qatar
3
Division of Engineering Management and Decision Sciences, College of Science and Engineering, Hamad Bin Khalifa University, Doha 34110, Qatar
4
School of Computer Science & Mathematics, Kingston University London, Kingston upon Thames KT1 2EE, UK
*
Author to whom correspondence should be addressed.
Energies 2020, 13(11), 2758; https://doi.org/10.3390/en13112758
Submission received: 12 April 2020
/
Revised: 2 May 2020
/
Accepted: 4 May 2020
/
Published: 1 June 2020
(This article belongs to the Special Issue Integration and Management of Distributed Energy Resources in Power Systems)
Abstract
:Integration of distributed energy resources (DERs) has numerous advantages as well as some disadvantages. To safely integrate DERs into a given distribution network and to maximize their benefits, it is important to thoroughly analyze the impact of DERs on that particular network. The maximum amount of DERs that a given distribution network can accommodate without causing technical problems or without requiring infrastructure modifications is defined as the hosting capacity (HC). In this work, a review of the recent literature regarding the HC is presented. The major limiting factors of HC are found to be voltage deviation, phase unbalance, thermal overload, power losses, power quality, installation location and protection devices’ miscoordination. The studies are found to employ one of four different methods for HC calculation: (i) deterministic, (ii) stochastic, (iii) optimization-based and (iv) streamlined. Commercially available tools for HC calculation are also presented. The review concludes that the choice of tools and methods for HC calculation depends on the data available and the type of study that is to be performed.
1. Introduction
The world electricity demand grew by 4% in 2018, the fastest growth since 2010, which was fulfilled to a large extent by renewable energy sources and nuclear power [1,2]. The growth in global demand of electricity and the negative impacts of fossil fuels on the environment have contributed to an increased deployment of renewable energies [3]. The total world installed capacity of renewable energy by the end of 2018 was about 2351 GW [4]. This capacity is expected to increase by 50% between 2019 and 2024 [5]. Although renewable energy resources have many advantages, there are some challenges with their integration into the distribution networks.
Distributed Energy Resources (DERs) are small or medium sized power sources that are connected directly to the low voltage (LV) distribution network or near the point of power consumption [6,7]. It is expected that the global DER capacity will be 528.4 GW by 2026 [8]. The output power of some of the DERs is highly dependent on natural resources, such as solar irradiance and wind speed [9,10]. This means that the generation patterns of these DERs may not coincide with the consumption patterns of the load. In this case, the surplus energy produced during the time of low energy consumption flows in a reverse direction in the distribution network, which were designed to supply power in a unidirectional manner [11]. Hence, the intermittent nature of DER technologies and the reverse power flow poses challenges towards the integration of DER into the distribution networks [12].
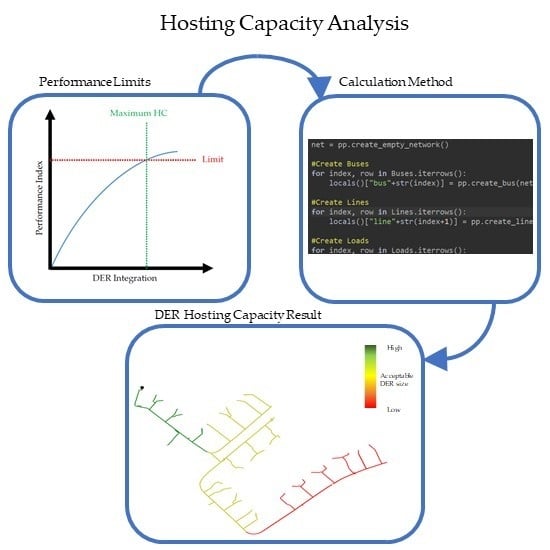
To overcome the challenges of DERs integration, it is important to calculate how much distributed generation (DG) can be integrated into a given distribution network without violating the distribution network’s operational criteria (thermal, voltage/power quality, protection, and reliability). This is called Hosting Capacity (HC), which is defined as the amount of distributed energy resources that can be incorporated into a given distribution network while keeping its performance within an acceptable range and without making any modifications to the existing power system infrastructure [13,14]. The concept of HC was introduced by André Even to identify the effects of high DER integration into the power distribution network [11,15,16]. The concept was later developed by Math Bollen and Fainan Hassan who defined the HC as the maximum penetration level of DER beyond which the performance of the power system becomes intolerable [11,16]. The advantage of the HC concept is that it is “specific, measurable and practical” because it evaluates the acceptable DER penetration level based on well-defined performance limits [11]. The concept of HC is illustrated in Figure 1. There are many factors that limit the HC of a given distribution network. Some of these factors are related to the operational standards while others are related to the physical limits of the various components in distribution networks, such as bus overvoltage, thermal overload, power loss, etc. Several studies are present in the literature that calculate the HC of distribution networks based on various limiting factors and using various techniques [17,18,19,20,21,22,23,24,25,26,27,28,29,30,31,32,33,34,35,36,37,38,39,40,41,42,43,44,45,46,47,48,49,50,51,52,53,54,55,56,57,58,59,60,61,62,63,64,65,66,67,68,69,70,71,72,73,74,75,76,77]. These studies used a wide variety of techniques to calculate the HC.
A detailed literature review of the HC related studies published in the past five years (2016–2020) is conducted in this paper to determine the major impact factors that limit the HC of distribution networks and to examine the various HC evaluation techniques. The literature review is based on two databases, IEEE Xplore and ScienceDirect, as well as other results obtained through Google Scholar. The following keywords were used to obtain journal articles and conference proceedings: hosting capacity techniques, renewable energy, distributed energy resources capacity, hosting capacity calculation and hosting capacity distribution networks. English publications that focused on the calculation of the HC were selected and analyzed in this work. Since the scope of this work was to review the various HC calculation methods and highlighting the divergent factors which limit it, publications whose main focus was on improving the HC with techniques such as active power curtailment, reactive power injection, transformer tap control, network reconfiguration, storage devices utilization, etc., were disregarded.
This paper is organized as follows, Section 2 introduces the performance indices that are considered as limiting factors in different studies, Section 3 describes the various HC calculation techniques used throughout the literature, Section 4 gives a description of the commercial tools available in the market for the HC calculation and Section 5 presents the conclusion of this review. The overview of the work’s structure is presented in Figure 2. The main contribution of this work is the intensive review of the various HC calculation methods (including the optimization-based and streamlined methods) for various DER technologies, not limited to specific technology like [14], including the impact of the majority of the limiting factors discussed in the literature (including protection devices miscoordination). In addition, this paper provides, to the best of our knowledge, for the first time an extensive assessment of the different commercial tools available in the market for HC calculation.
2. Limiting Factors
Impact factors, limiting factors and performance index/indices are the terms used to describe the properties of the distribution network that are affected by the integration of DERs. These terms describe the same properties but in various contexts. Impact factors refer to the properties that are affected by the integration of the DERs. For example, integration of Photovoltaics (PV) systems into a distribution network may affect the bus voltages. In this case, bus voltages are an impact factor. Limiting factors and performance indices refer to the properties that limit the integration of DERs into distribution networks based on a defined criterion. For example, if the integration of a PV system into a distribution network is stopped when the bus voltage increases beyond the grid voltage limit, then the overvoltage is a limiting factor for the integration of PV systems. Several studies use a combination of these limiting factors to calculate the HC of a given distribution network. The major limiting factors are as follows:
2.1. Voltage Deviation
In cases where the active power produced by a DER unit is higher than the active power consumption of a load, the voltage level on that load bus increases beyond the acceptable level. This can lead to a damage of various equipment connected to that bus. On the other hand, undervoltage occurs when the demand at the bus increases beyond the normal load, as in the case of electric vehicle (EV) stations. Overvoltage or undervoltage have been the main limiting factors in most of the HC determination studies.
An impact assessment framework, based on Monte Carlo technique, has been proposed in [17] to evaluate the effects of two types of solar PV systems (customer-based installation and utility-based installation) on a given distribution network. Here, reverse power flow and voltage violation have been considered as the limiting factors to minimize energy loss, voltage deviation and voltage fluctuation in a realistic distribution network. It was found that voltage violation occurs above 30% penetration for customer-based PV installations and the utility-based PV installation scheme can extend the penetration ratio to a higher limit.
In [18], over/undervoltage and voltage imbalance between different phases have been taken as the limiting factor to evaluate the HC of a feeder using Monte Carlo simulation. Here, parallel algorithm was developed using Message Passing Interface (MPI) to decrease the simulation time by splitting the Monte Carlo simulation scenarios into various processing elements handled by high-performance computing (HPC) systems. It was found that in some cases PV penetration was limited to 10% on days when solar irradiance was high. On the other hand, PV penetration could be as high as 50% on days with low energy demand.
The study in [19] investigates the impact of integrating distributed rooftop PV systems on three distribution networks (residential, commercial and industrial) in Cape Town, South Africa. The developed methodology assesses the effect of voltage increase and equipment overload on the PV HC of the three distribution networks. It was found that initially, the integration of PV systems decreases the line and transformer loading. However, after a certain penetration level, the effects of PV system integration start to reverse due to surplus PV generation and reverse power flow.
In [20], the authors used a Monte Carlo simulation-based probabilistic power flow calculation method on three real power networks in Canada to determine their hosting capacities. Overvoltage was found to be the major limiting factor.
The DER HC and the effects of load variability were studied for three different types of distribution networks in North America in [21]. Thermal limit, steady-state voltage and voltage deviation were taken as the limiting factors. It was found that the most significant limiting factor was the voltage deviation.
A probabilistic-based framework based on a two-step algorithm to linearize the HC model has been proposed in [22] to find the HC of DGs in a distribution network. Voltage rise and voltage deviation were considered as the constraints in this analysis. One of the conclusions of the study is that the variable nature of the loads and DGs leads to a variable value for the HC since it varies with the network structure, installation location, output of the DG units and their technologies. In [23], new equations were formed to perform the load flow calculations by linearizing the standard, non-linear load flow equations. These equations were used along with a developed optimization-based calculation method to calculate the HC of the IEEE 33 bus test distribution network. Bus overvoltage and line overload were selected as the performance indicators for this calculation. Six cases were analyzed to assess the performance of the developed technique and to calculate the HC of the distribution network. It was shown that the proposed method significantly decreased the computational time while providing nearly identical HC results.
2.2. Thermal Overload
The excess power generated by DER units during the time of high production and low consumption flows back to power stations through the distribution lines and distribution transformers. Both lines and transformers have a rated current limit that they can accommodate. Exceeding this limit causes overheating of these components leading to various operational failures. Many of the HC studies found thermal overload to be a limiting factor.
In [24], the effects of integrating EVs and fast charging stations into distribution networks have been studied to find the optimal location for the installation of fast charging stations. The study was based on data obtained from real houses in Norway. It was found that 20% EV penetration was possible with respect to the rated power of the lowest cable capacity and 50% EV penetration was possible with respect to the voltage variation. Hence, in this case, overloading was the major limiting factor.
In [25], a new method for calculating the HC of DERs was proposed. The method proposed the modeling of the lines using the π model. In this case, the capacitance of the lines is not ignored, and a better value of HC was obtained. The limiting factors in this study are overvoltage, line overloading and transformer overloading.
Stochastic calculations were performed in [26] to calculate the HC of distribution networks. The proposed method was tested on a large distribution network in South Australia. Overvoltage and overloading were considered as the technical constraints in this study.
In [27], the authors developed a novel method called “Bricks approach” to calculate the HC of distribution networks that have unknown parameters. This method is useful in cases where the complete information of the distribution networks is not available to calculate the HC from the traditional load flow method. The operational constraints considered in this study are the steady-state voltage limit, rapid voltage variations and thermal limits of the transformers and the power lines. The main advantages of this method are the requirement of less information and the high computational speed.
2.3. Power Losses
The power losses of the electrical system are directly related to the magnitude of the current and the length of the power lines. The integration of DERs in the distribution network can lead to reverse power flow, which causes an increase in the network losses and decrease the operational efficiency of the distribution network. Many studies examined the impact of high DER penetration on the distribution network losses.
In [28], an iterative method is employed to find the PV systems HC of a distribution network in Yogyakarta. The chosen limiting factors are voltage violation, current violation and reverse power flow and different loading conditions were analyzed. It was found that voltage violation occurs only when the load is less than 48% of the average value while reverse power flow occurs in most of the cases.
The authors in [29] assesses the effects of higher PV systems penetration on an urban low voltage network in Sri Lanka. The network already had a PV systems penetration of 40% and it was found that further increase in PV systems penetration would lead to over voltage and increased losses.
In [30], the authors developed a novel methodology based on a gradual increase in the PV penetration level to determine the maximum PV penetration of a given distribution network. The algorithm was created in MATLAB to automate the process of load flow calculation. The IEEE LV European test feeder was used as a test case with real load and PV profiles data. Distribution network losses and bus overvoltage were considered as the limiting factors. It was found that the network losses were the major limiting factor in maximizing the PV penetration in the tested distribution network.
2.4. Power Quality
In certain DER integration scenarios, the produced power is in the DC form. This needs to be converted into AC form so that the power can be utilized by the load. Power Electronic Converters (PECs) are used to convert the DC power into AC power. These PECs introduce harmonics into the distribution networks which decrease the power quality. Various studies looked into the problem of power quality for the calculation of the HC.
A Monte Carlo simulation was performed in [31] to find the probabilistic HC of a non-sinusoidal distribution system with a high PV penetration. Several constraints such as bus voltage, line thermal capacity, power factor, and individual and total hormonic distortion (THD) were taken into account. It was found that the HC calculated through this method is higher than the HC calculated through conservative (worst-case) methods, rule of thumbs and deterministic methods.
Similarly to the study in [19], the authors in [32] determined the maximum rooftop PV HC of a residential area in Mauritius. The limiting factor in this study was system harmonics. It was found that the harmonic increased with increasing PV systems’ power output and vice versa.
A sensitivity analysis was performed in [33] to determine the PV systems’ integration harmonic hosting capacity of the IEEE 13 bus network using MATLAB and OpenDSS. It was found that the presence of capacitors in the distribution network contributed to a higher voltage total harmonic distortion (THDv).
In [34], an optimization based technique was used to calculate the PV systems’ HC of a given distribution network. The constraints considered in the study are over and under voltage, current capacity of the power lines and the harmonic distortion of the system. The authors concluded that the HC is lower when the harmonic distortion is higher in distribution networks.
2.5. Protection Devices
The distribution networks are a radial system and the protection devices connected to these networks operate in a directional manner. This means that they are designed to operate and disconnect a section of the network when a certain amount of power flows in the opposite direction. The reverse flow of the power caused by DER integration may lead to unneeded operation or malfunction of these protection devices causing power interruption in the network. Although many studies mention that protection devices may limit the distribution network HC [14,23,31,35,36], only studies related to the streamlined method (c.f. Section 3.4) consider the protection devices’ lack of coordination for the HC calculation.
3. Hosting Capacity Assessment Methods
The calculation of the HC of a distribution network can be thought of in two ways, customer-based and utility based [17]. When considered from the customer-based perspective, the problem of the HC calculation becomes a probabilistic one. In this case, the utility does not have control over the number, locations and sizes of the DERs. Here, stochastic methods can be used to calculate the HC. In the utility-based HC calculation, the problem can be defined as an optimization problem where the objective is to maximize the DER integration without causing technical problems in the distribution networks.
There are four major methods used for calculating the HC of distribution networks in the literature. One similarity between all of the methods is the use of the power flow calculation to find the values of voltages and currents in distribution networks. The four methods are: deterministic method, stochastic method, optimization-based method and streamlined method. Although, the methods are quite different in terms of the implementation, they all follow the same general steps for the HC calculation which are shown in Figure 3 [11].
3.1. Deterministic Method
The deterministic method involves the calculation of the HC with known values of DER generation and load consumption. In the deterministic method, there is no randomness in the calculation and the load consumption, DER production and location information are defined before the start of the HC calculation. The deterministic method is further divided into two methods: the constant generation method and the time series method.
3.1.1. Constant Generation Method
In the constant generation method, the value of the DER output does not vary over the calculation period. This method does not consider the dynamic nature of DERs (the variation of the natural resources). Generally, the output of the DER is assumed to be maximum while calculating the HC in the constant generation method [25,28,33,37,38,39]. Scenarios such as iteratively increasing the DER units’ size/number until one of the performance criteria is violated are used to calculate the HC [21,33,37,38,39,40]. Sometimes, the worst-case scenario is used to find the HC of distribution networks [25,38,39]. In the worst-case scenario, the output of the DER units is assumed to be maximum while the power demand of the load is assumed to be minimum. This leads to an increase in the bus voltages causing a violation of the grid voltage codes. The worst-case scenario can also sometimes lead to a violation of other limiting factors such as overloading of distribution lines or distribution transformers.
The constant generation method is usually used to perform a sensitivity analysis of DERs’ integration into the distribution networks [33,37,40]. Very few studies rely on the constant generation method to calculate the HC. This is because the constant generation method is very simplistic and can only be used to estimate the HC value. Furthermore, it is very easy to underestimate the HC when calculating it based on the worst-case scenario [14,41]. The reason for this is that minimum load consumption and maximum DER generation is unlikely to occur at the same time for most of the cases [42].
In [21], the HC of three low-voltage distribution networks was determined using the incremental constant generation method. First, a location for the DER unit installation was selected, then the size of the DER unit was incrementally increased by 1 kW and finally, the power flow calculation was done to check for performance indices’ violations. These steps were repeated for all required/selected locations to find their HC. Effects of load variability and split-phase transformer unbalance were also studied. It was found that the HC is independent of load variability if the limiting factor is voltage deviation and the HC varies with the load if the limiting factors are overvoltage, line overload or transformer overload. For the split-phase transformer case, it was found that HC is maximum when the load is shared evenly between the two legs of the phase.
In [25], the authors estimated the HC of a 16 bus test feeder. The performance indices selected in this study were bus overvoltage, line overloading and transformer overloading. The HC was estimated for two cases, (1) considering the shunt capacitances of the lines (π model) (2) ignoring the shunt capacitance of the lines. It was found that the HC of the feeder was higher in the case of using the π model. This is an expected result because the shunt capacitors inject reactive power into the distribution network which lowers the bus voltages. Therefore, more DG units can be integrated into the network without causing bus overvoltage.
The effects of PV system integration on medium voltage (MV) networks were studied in [28]. First, the authors determined the PV systems’ HC by assuming the PV system generation to be maximum and the load consumption to be fixed at a normal condition of 74% of the maximum capacity. The PV system size was increased iteratively until a violation occurred and the HC was determined to be 100% of the normal load consumption. Then, the effects of load variability on the hosting were studied by varying the load from 30% to 90% from the normal condition. It was determined that the PV systems’ HC had a linear relationship with the load variation. Effects of PV system’s location on the HC were also studied.
A sensitivity analysis was performed in [33] to study the voltage harmonics as a limiting factor of the PV systems’ HC. The analysis was performed on the IEEE 13 node test feeder. A limit of 5% and 8% was set for the individual voltage harmonic distortion component and the voltage total harmonic distortion, respectively. The effects of two types of PV inverters were studied (one type has a total harmonic distortion (THD) of current <3% and the other type has a total harmonic distortion (THD) of current <6%). Furthermore, the effects of voltage regulating capacitors were also studied. The main findings of the study are that: capacitor banks decrease the harmonic HC of the network, the background distortion can heavily impact the HC depending on the harmonic phase angles, and integration of PV systems near large loads can minimize the distribution losses.
The authors in [37,39] and [40] analyzed the impacts of DER units’ location on the HC of distribution networks. The authors in [37] proposed that the location of DER units is a major limiting factor of the HC. In [40], an analysis of locational HC (LHC) of 216 feeders is presented and feeders are classified according to various performance factors. They concluded that the LHCs are highly dependent on the voltage level of the feeder and highly impacted by the line loading thermal limitations. The authors in [39] presented a method to find the hosting locational HC of a distribution network, where the effects of different DG technologies (inverter-based and rotating machine resources) were considered and they concluded that the HC limiting factors depends on the DG technology. All these studies used the constant generation method as a tool for their analysis. A summary of the studies that utilize the constant source method is presented in Table 1. The performance indices included in the table are overvoltage (OV), undervoltage (UV), line thermal limit (LN limit), transformer loading limit (TX limit), harmonic distortion (HD), reverse power flow (RPF) and fault current level (FCL).
3.1.2. Time Series Method
The time series method is an improvement of the constant generation method and takes into account the dynamic nature of the DERs. The constant values of the DERs in the constant generation method are replaced by the generation profiles of the DERs. Profiles are assigned to all the dynamic components of the network and then load flow calculations are performed for the smallest time step available for the data set [19,42,43,44]. The size, location or number of DERs is varied until one of the performance indices is violated [19,29,32,44]. The time series method is highly dependent on data where more data can reveal more information about the effects of DERs dynamics on the HC [19,44]. However, large amount of data can increase the computational time. Therefore, 24-hours profiles are generated based on average consumption and generation values [19,29], minimum consumption and maximum generation values [19] or some other criteria [32,43,44].
Most time series studies for calculating the HC have focused on PV technology since the output of PV systems varies greatly throughout the day [19,29,32,42,44]. Few studies have also used the time series method for the analysis of HC of wind turbines [43,45]. The time series method provides a much more realistic value of the HC of distribution networks because it takes into account the fluctuations in the consumption and generation profiles [46]. However, the accuracy of this method is limited by the amount of available data.
Various methodologies based on the time series method were presented to find the distribution network HC of PV and wind turbines in [19] and [45], respectively. The authors in [19] considered bus overvoltage and equipment overload as the technical constraints in their methodology for calculating the HC of different types of distribution networks integrated with randomly distributed rooftop PV systems. It was found that the maximum PV penetration level of residential network was between 82% and 150%, the maximum PV penetration level for industrial network was 31%, while the commercial network was limited by the available roof space. The authors in [45], considered voltage drop and reverse power flow, in addition to overvoltage and overload, as the limiting criteria for the integration of wind turbines into a real medium voltage distribution network. It was found that the HC decreased significantly with the consideration of the additional limiting criteria.
The authors conducted time series analyses in [29] and in [44] to study the impact of PV systems’ integration in real distribution networks. In [29], the authors modeled an urban low voltage network in Sri Lanka and studied the effects of high PV penetration, defined as a percentage of distribution transformer capacity, on the active power flow, feeder voltage, transformer’s secondary side power factor, voltage unbalance and network losses. It was found that overvoltage at the end of the feeder limits the HC of the distribution networks. In [44], real consumption and PV systems’ generation profiles were used in the IEEE 69 bus network to analyze the effects of PV systems’ integration on the current and voltage profile as well as the network losses. Load profiles for three types of loads (residential, commercial and industrial) were created based on data obtained from a distribution network in Richmond, Virginia. Various scenarios of PV systems’ locations and sizes were tested. It was observed that a higher reduction in losses was possible with PV system installations at commercial loads because of the coinciding of demand and PV systems’ generation. A one-day time series analysis was performed in [43] on the IEEE 13-node test system. Weather data from Seattle was used to create the wind turbines generation profile. The effects of wind turbines integration on the economics evaluation index, voltage and HC were assessed. It was shown that the node voltages stayed within ±5% of the rated value at the time of maximum generation and the distribution losses decreased with wind turbine integration, improving the economic evaluation index. The wind turbine HC was found to be about 23% of the total feeder capacity.
A sensitivity analysis was performed on the CIGRE medium voltage network in [42]. First, the HC of each bus is determined by assuming the consumption to be minimum (20% of the maximum demand) and PV system’s production to be maximum. Then, a PV system of twice the size of the HC is connected to a bus and a load flow analysis is performed for one year at 10 minutes intervals and this is repeated for each bus. It is suggested that the DGs should be integrated closer to the transformer because exceeding the HC closer to the transformer affects fewer components of the network.
The PV systems’ HC of a residential area in Mauritius was calculated in [32] with voltage harmonics as the limiting factor. Real load profiles and PV system generation data obtained from the area was used to determine the acceptable level of PV systems’ integration. It was found that high PV system generation led to an increase in the system harmonics. For the modeled system, PV penetration of less than 40% was observed to keep the harmonics within the acceptable limits of the IEEE Standard 519. A summary of the studies that utilize the time series method is presented in Table 2. The performance indices included in the table are overvoltage (OV), undervoltage (UV), line thermal limit (LN limit), transformer loading limit (TX limit), harmonic distortion (HD), reverse power flow (RPF), distribution losses (DL), power factor (PF) and voltage unbalance (VU).
3.2. Stochastic Method
The process of integration of DER units into the distribution network has many unknown variables. the number of customers who will utilize DERs and the locations and sizes of the DERs are not known beforehand. Other than these uncertainties, the output of the DERs and the consumption profiles are also intermittent. All these unknown variables have an impact on the HC. The studies present in the literature take the randomicity of some of these variables into account in calculating the HC of distribution networks. To account for these unknown variables, Probabilistic Power Flow (PPF) is used. In PPF, several load flow calculations are performed with various values of unknown variables to produce a wide range of output results. The general steps of the PPF involve the creation of random scenarios (number, location and/or size of DER), the simulation of networks, the inspection of network variables (voltage, current, losses, etc.) against the performance limits and the determination of the HC based on the predefined performance limits [47].
There are various methods for generating random scenarios. The most common is the Monte Carlo simulation [17,18,20,26,41,47,48,49,50,51,52,53,54,55,56,57,58,59,60]. Other methods include random DER deployment [61], sparse grid technique [55] and Quasi Monte Carlo [54]. Since there are many unknown variables involved in DERs integration, it is reasonable to set some of those variables while varying others through stochastic techniques. In some of the studies [18,41,52,53,56], the number of DER units in the distribution network is set by the authors and is increased from the minimum value to 100% (DER is connected to each potential integration location) while Monte Carlo simulations are performed at each increment. The Monte Carlo simulation is used for different purposes such as, to generate the DER location [17,18,20,22,41,47,50,52,53,56,57,60], size [17,18,20,47,53,56,57], connection phase in the three-phase distribution networks [50,57,60], type [22] and DER generation and load profiles scenarios [56].
The stochastic method is the most popular method in the literature for HC calculation. It can be used for forecasting and sensitivity studies. Within the stochastic method, Monte Carlo simulation is the most common technique used for the calculation. Although the stochastic method can be used to represent real-life scenarios, it should be kept in mind that the result of the stochastic method might not be the most optimal solution for the HC. To obtain the most optimal HC, an optimization-based method can be used. A summary of the studies that utilize the stochastic method is presented in Table 3. The performance indices included in the table are overvoltage (OV), undervoltage (UV), line thermal limit (LN limit), transformer loading limit (TX limit), harmonic distortion (HD), reverse power flow (RPF), power factor (PF), voltage unbalance (VU) and distribution losses (DL).
3.3. Optimization-Based Method
In the optimization-based method, DER integration is defined as an optimization problem where the objective is to maximize the active power injection of DER into the distribution network while making sure that the distribution network operational limits are satisfied. Sometimes [17,62,63], a multi-objective function is set up to find the HC that results in maximizing the DER integration while minimizing the distribution losses or costs. Other times, a single objective function is defined to maximize the HC [23,64,65,66,67]. Constraints such as the bus voltages, line currents, node power injection, etc. are also defined. Various techniques are used to solve the optimization problem. The most common techniques are Particle Swarm Optimization (PSO) [62,68] as it is easy to implement, Artificial Bee Colony (ABC) [69] because of its fast convergence, Robust optimization [70,71,72] as it incorporates the uncertainty of DG output/size/location into the calculation and Genetic Algorithm (GA) [73] since it produces fast results but with a probability of finding near-optimal solutions instead of global optimal solutions.
The drawback of these optimization algorithms is that they require several iterations to obtain an optimal solution. Furthermore, they utilize AC power flow calculations, which is in itself an iterative calculation. Higher number of iterations require longer computational times. To overcome this challenge, some studies utilize the linear programming technique [22,23,65,67]. In this technique, AC power flow equations are linearized by assuming that the voltage phase angle between two connected buses is equal and by defining the bus voltages and angles relative to the voltage at the point of interconnection [65,67].
A multi-period, multi-resource assessment technique based on optimal power flow (OPF) is used in [64] to find the maximum possible energy injection in a distribution system through a combination of wind and solar PV distributed resources. OPF is a formulation of the power flow equation in the form of an optimization problem to find the best operational settings while maintaining the distribution networks within the performance limits. The objective of this study was to analyze the benefits of a hybrid renewable energy system, which was compared with a system containing only one technology of DER. It was found that the hosting capacity was higher for the hybrid system. In [66], OPF was used to develop a method to calculate the DG penetration limit of a feeder without an advanced distribution system (ADS). It was shown that the proposed method could find higher HC as compared to the other analytical power distance test tools.
Multi-objective optimization methods were developed in [62] and [63] to maximize the DER HC while minimizing the distribution losses [62] and cost [63]. The multi-objective PSO algorithm along with the Pareto-dominance-based approach is used in [62] to optimally site open unified power quality conditioner (UPQC-O) while maximizing the PV HC and minimizing distribution losses simultaneously. It is noted that increasing PV penetration results in increased losses at higher PV penetration levels. It is also shown that the addition of UPQC-O results in higher PV HC and lower losses but requires extra investment. In [63], a stochastic multi-objective optimization framework is proposed and tested on a 69 bus and 152 bus distribution network to maximize the wind power HC and minimize the cost of operation and maintenance. The wind HC is indirectly maximized by minimizing the energy acquisition cost from the higher-level network.
In [65,67], the authors linearized the AC power flow equations to reduce the computational time of the HC calculation. Linearization of the AC power flow equations produces equations that can be solved in a single step without requiring iterations. Both studies tested this method on the IEEE 33-bus radial network. In [65], the optimal loading capacity of a radial distribution network is determined through optimization, which determines the maximum amount of load that can be integrated into a given distribution network. Since the study determines the loading capacity of the system, it is more representative of the HC of EVs than DGs. In [67], the marginal HC of active distribution networks is determined for the integration of EVs. The marginal HC differs from the optimal HC by the fact that the marginal HC determines the effects of the addition or removal (the next increment) of power on the optimal HC [74].
Techno-economic studies are performed in [68] and [69] to determine the HC of DERs. It is noted in [68] that the HC of wind turbines is comparatively much higher than the load in the installation location. However, several economic aspects, such as wind turbines’ investment or operation cost, limit the HC. The PSO algorithm is used to optimize the cost of wind turbines installation in the 69-bus system. It is found that integration of wind turbines in the middle of the lines is economically beneficial in the test system. In [69], the ABC algorithm is used to minimize the active power losses in the IEEE 34 and IEEE 37- nodes systems through optimal placement and sizing of hybrid DER units. Since, reduction of distribution losses results in cost savings, a reduction of 56.98% of losses is observed for the modified IEEE 37-node system resulting in a saving of 14.85% compared to the base case.
Robust optimization techniques are used in [70], [71] and [72] to determine the EV HC, DG HC in active distribution networks and DG HC in unbalanced distribution networks, respectively. In [70], real vehicle journey data is used to model the uncertainty of EV charging demand for the EV HC analysis. A robust optimization equation with modifiable uncertainty set is formulated and is solved in two stages by the modified column and constraint generation and outer optimization method. The method has been verified on the IEEE 123-node network. From this method, the grid constraints are respected and EV charging requests are fulfilled to the highest degree. In [71], the DG output and load demand are generated stochastically using an ambiguous distribution to model the random nature of DG output and load demand. A robust optimization method based on data-driven DG capacity assessment model, distributionally robust capacity assessment model (DR-CAM), is used to find the maximum DG penetration level. The DR-CAM method is tested on the IEEE 33-bus system and the IEEE 123-bus system and compared to the deterministic DG capacity assessment model (D-CAM), robust optimization and the traditional distributionally robust optimization (T-DRO). It is shown that the DR-CAM method is more robust and produces better optimization results. In [72], the robust comprehensive capacity assessment method (RC-CAM) to optimally size and site DGs in an unbalanced distribution network is proposed. The method consists of two-stage mixed integer linear programming problem. In the first stage, the optimal DG placement and sizing decision are made along with the optimal active network management (ANM) decisions. In the second stage, the worst-case scenario is tested. Apart from the RC-CAM, a three-step optimization algorithm method is also proposed to improve the results of the evaluation. The RC-CAM method was tested on the IEEE 33-bus network and compared with two other approaches based on the Monte Carlo simulation. The RC-CAM method was shown to be more robust and to produce more optimal results as compared to the other state-of-the-art DG capacity assessment methods.
In [73], a new method for optimal siting and sizing of DGs for loss minimization is proposed. This method combines the analytical and GA methods to find the ideal location, size and power factor of the DG. In this method, the number of DGs has to be predetermined. The method is tested on the IEEE 33-bus and the 69-bus network. This method is compared to the improved analytical (IA) method, exhaustive load flow method (ELF) and loss sensitivity factor (LSF) method. It is shown that the proposed method achieves the highest loss reduction. A summary of the studies that utilize the optimization-based method is presented in Table 4. The performance indices included in the table are overvoltage (OV), undervoltage (UV), line thermal limit (LN limit), transformer loading limit (TX limit), harmonic distortion (HD), reverse power flow (RPF), voltage fluctuation (VF) and voltage unbalance (VU).
3.4. Streamlined Method
The streamlined method is a heuristics technique developed by the Electric Power Research Institute (EPRI) to estimate the DER HC of a feeder. The streamlined method was developed by performing detailed stochastic studies on a wide range of distributed feeders and identifying trends that are common to the integration of PV systems into those feeders [75]. Instead of performing load flow and short-circuit analyses on a large number of scenarios of DER integration, the streamlined method performs a series of sensitivity analyses and provides three values of hosting capacities: realistic, optimistic and conservative. These values are based on scenarios such as inclusion/exclusion of diversity of branches in the feeder and extreme/probable DER location. This method can be thought of as an improvement of the stochastic method where instead of simulating a large number of scenarios, a small number of scenarios are simulated to find an estimate of a given feeder HC. This is based on the knowledge of PV systems integration trends from previous studies. However, the improvement of this method is with regards to the computation time and resources only. As for the results, the streamlined method tends to calculate an inaccurate value of the HC in cases where the actual HC is high or where the feeder has high branch diversity [75]. The use of the streamlined method is limited to very few studies [75,76,77], due to the fact that the algorithm is not opensource but is available as a commercial tool by the name of “Distribution Resource Integration and Value Estimation (DRIVE)”. Furthermore, developing the streamlined algorithm from scratch would require a large number of detailed HC studies of feeders with diverse characteristics. A summary of the studies that utilize the streamlined method is presented in Table 5. The performance indices included in the table are overvoltage (OV), undervoltage (UV), line limit (LN limit), transformer limit (TX limit), harmonic distortion (HD), reverse power flow (RPF), protection devices (PD) and fault current (FC).
3.5. Comparison
A general comparison of the different HC calculation techniques is presented in Table 6. However, it should be kept in mind that the exact characteristics of the methods can vary depending on the design of the study. For example, the complexity of the stochastic method can be decreased by making some approximations such as limiting the integration of DERs to a fixed number of buses and the data requirement of the time series method can be decreased by taking seasonal average generation and consumption profiles instead of the complete yearly profile.
4. Tools for Hosting Capacity Calculations
There is a wide range of commercial and non-commercial software programs available for power system simulation and analysis. A list of these software programs is available at [78]. Most of these programs can be used to find the HC using one of the methods mentioned in this paper. However, for the purpose of this work, only those software programs that provide an off the shelf HC calculation tool are mentioned. The information presented here, regarding the tools, is based on the online information provided by the tool providers.
4.1. PSS Sincal Integrated Capacity Analysis Module
PSS Sincal is a power system simulation program owned by Siemens. It can be used to plan, model and analyze various networks such as distribution, transmission, rail, industrial and renewable systems [79]. PSS Sincal offers the ICA (Integrated Capacity Analysis) module for calculating the maximum HC of a given network. The ICA module helps the user in finding the best location and size for the DER. The criteria used for calculating the HC are thermal loading, voltage limits, voltage fluctuations, short-circuit endurance, reverse power flow and protection. These criteria can be adjusted by the user along with the behavior of the DER. The loads and generators have to be modeled accurately and should include their past or predicted profiles. The HC is calculated for each node, independently from the other nodes and the maximum generation or load is determined using the time series iterative method. In the ICA method, the size of the DER is increased iteratively at a specific location and a load flow calculation is performed each time. The disadvantages of this method are the expected long computation times and the limited scenarios testing. A single DER unit is integrated at a single location which leads to an overestimation of the HC at that location because increasing the number of DER units in a system increases the overall HC of the system but decreases the HC of the individual locations [52]. The detailed information about the PSS Sincal ICA module can be found in [80].
4.2. DIgSILENT PowerFactory
PowerFactory is a generation, transmission, distribution and industrial network modelling and simulation software by DIgSILENT. The 2019 onwards versions of PowerFactory offer a tool to calculate the HC of balanced and unbalanced distribution feeders based on thermal, voltage, protection and power quality limits. The users can select single or multiple nodes for the HC calculation. The method use for the determination of the HC is an iterative method based on the standard binomial search algorithm which is a stochastic method. The detailed information of the PowerFactory HC analysis tool can be found in [81].
4.3. NEPLAN
The NEPLAN power system analysis software can be used for network planning, simulation, optimization and analysis. It offers a module which uses the stochastic method for the calculation of the distribution network HC [82]. The stochastic method used is the Monte Carlo simulation with a pre-filter of possible sizes to limit the search space for realistic worst-case values. In addition to modeling DGs, the software can model EVs as well. The limiting factors considered are voltage violation, overloading and other performance indices.
4.4. Synergi Electric
Synergi Electric is a planning and analysis software for the electric grid developed by DNV GL. It provides a tool for calculating the PV HC of distribution networks. There are five different methods available for the calculation: stochastic, feeder rating, feeder maximum demand, incremental, sectional incremental [83]. However, these methods can be classified together based on the HC calculation methods mentioned in Section 3. In the stochastic method, PV systems are placed randomly over the complete network. The limiting criteria for the HC calculations are overvoltage, feeder loading and reverse power flow [83]. In the feeder rating and feeder maximum demand methods, the HC is calculated based on the feeder rating and minimum daytime load and feeder demand and minimum daytime load, respectively. The exact procedure is not mentioned in [83]. In the incremental and sectional incremental methods, the PV output is increased iteratively until voltage or thermal loading limit is reached. The difference between the two is that in the former, the size of the existing PV systems on the feeder is increased, while in the latter, a single new PV system is placed at a location and its size is iteratively increased.
4.5. CYME
CYME power engineering software is a simulation tool by EATON which can be used to analyze distribution, transmission and industrial power systems. It has two modules which can be used to find the HC of a distribution network: Integration Capacity Analysis module and EPRI DRIVE module.
4.5.1. Integration Capacity Analysis
Similar to the PSS Sincal’s ICA module, the Integration Capacity Analysis module in CYME uses the iterative method to calculate the maximum generation or load that can be added independently to a node in a distribution network [84]. However, this iterative method is based on the constant source technique. The user is required to provide the minimum and maximum load values, along with the maximum DER generation or load value. The limiting criteria for the HC calculation are thermal loading, reverse power flow, steady-state voltages, voltage variation, protection and sympathetic tripping. The detailed information about the Integration Capacity Analysis module is available at [85].
4.5.2. EPRI DRIVE
The Distribution Resource Integration and Value Estimation (DRIVE) module developed by the EPRI can be used through the CYME software for calculating the DER HC of a distribution network. The DRIVE module can calculate the HC for various DER technologies, such as, PV systems, wind energy systems, battery storage systems, fuel cells, microturbines and synchronous generators. The performance limits used for the calculation are thermal, power quality, voltage, protection and reliability/safety. The method used for the calculation is the streamlined method which has been developed by EPRI.
4.6. Highlights
A summary of all the HC calculation tools is presented in Figure 4. The orange boxes list software with a HC calculation tool. The yellow boxes present the names of the tools. Most of the software offer a single module that employs one HC calculation method (blue boxes). Synergi Electric offers a single module but offers the ability to use two different methods for the HC calculation. CYME software offers two modules each of which employs one method for HC calculation. The green boxes list the limiting factors that the tools use for HC determination.
5. Conclusions
From the analysis of the literature, it is clear that there is no single value for the HC of a given distribution network. The value of HC depends on the limiting factors that are predefined to calculate it. There are various factors that can limit the HC of a given distribution network and some factors have a greater effect than others. It is also observed that considering all the limiting factors in studying the HC is very difficult and may even be impossible (inclusion of so many limiting factors might make the analysis extremely complicated). Most studies have focused on the bus overvoltage and voltage deviation and line and transformer overload as the limiting factors, some have considered distribution loss and power quality as limiting factors in the HC calculation and no study has considered the effects of the miscoordination of protection devices on the HC as a limiting factor.
Furthermore, various methods were used to calculate the HC such as the deterministic, stochastic, optimization-based and streamlined. Each of these methods have their own advantages and disadvantages. The most basic technique is the deterministic method. This technique seems to be the best technique for sizing a single DER at a specific location. Especially if the generation profile is known or can be forecasted. The stochastic technique can be used for forecasting and sensitivity studies. These can give DNOs a better understanding of the impacts of DER integration into distribution networks. The stochastic method emulates the real-life scenario where the DNO does not have control over the customer’s choice of DER integration. In cases where the utility can determine the size, number, and location of the DERs, the optimization method is the best choice since it can be used to improve the overall performance of the distribution network by cutting losses and/or cost. The choice of the HC calculation method will depend on the objective of the study.
Various commercial tools are available for HC calculation and each tool utilizes one of the above-mentioned HC calculation methods. The choice of the tool can depend on various factors such as, the objective of the network study, the cost of the tool, the available data for the analysis, etc. The objective of this work was to highlight some of the available tools, without going into details regarding the accuracy, functionality, performance, cost, etc. of each tool.
Author Contributions
Conceptualization, M.Z.u.A. and O.E.; methodology, M.Z.u.A. and O.E.; formal analysis, M.Z.u.A., O.E. and L.A.-F.; resources, M.Z.u.A.; writing—original draft preparation, M.Z.u.A.; writing—review and editing, O.E. and L.A.-F.; visualization, M.Z.u.A.; supervision, O.E. and L.A.-F. All authors have read and agreed to the published version of the manuscript.
Funding
This research received no external funding.
Acknowledgments
This publication is supported by Iberdrola S.A. as part of its innovation department research activities. Its contents are solely the responsibility of the authors and do not necessarily represent the official views of Iberdrola Group. The authors acknowledge the support provided by the Hamad Bin Khalifa University, Qatar Foundation. The publication of this article was funded by Qatar National Library.
Conflicts of Interest
The authors declare no conflict of interest.
References
- IEA. Global Energy & CO2 Status Report 2019. 2019. Available online: https://www.iea.org/reports/global-energy-co2-status-report-2019 (accessed on 30 September 2019).
- Ellabban, O.; Abu-Rub, H.; Blaabjerg, F. Renewable energy resources: Current status, future prospects and their enabling technology. Renew. Sustain. Energy Rev. 2014, 39, 748–764. [Google Scholar] [CrossRef]
- Miller, G.; Spoolman, S. Environmental Science: Problems, Connections and Solutions; Cengage Learning: Boston, MA, USA, 2007; ISBN 9780495383376. [Google Scholar]
- IRENA. Renewable Capacity Statistics 2019. 2019. Available online: https://www.irena.org/publications/2019/Mar/Renewable-Capacity-Statistics-2019 (accessed on 17 November 2019).
- IEA. Renewables. 2019. Available online: https://www.iea.org/reports/renewables-2019 (accessed on 17 November 2019).
- European Commission. Study on the Effective Integration of Distributed Energy Resources for Providing Flexibility to the Electricity System. 2015. Available online: https://ec.europa.eu/energy/studies/study-effective-integration-distributed-energy-resources-providing-flexibility-electricity_en?redir=1 (accessed on 23 November 2019).
- Alturki, M.T. Hosting Capacity Calculations in Power Systems; University of Denver: Denver, CO, USA, 2014. [Google Scholar]
- Navigant Research. Global DER Deployment Forecast Database. 2017. Available online: https://guidehouseinsights.com/reports/global-der-deployment-database (accessed on 23 November 2019).
- Eltamaly, A.M.; Mohamed, Y.S.; El-Sayed, A.-H.M.; Elghaffar, A.N.A. Reliability/Security of Distribution System Network under Supporting by Distributed Generation. Insight Energy Sci. 2019, 2, 1–14. [Google Scholar] [CrossRef] [Green Version]
- Agüera-Pérez, A.; Palomares-Salas, J.C.; González de la Rosa, J.J.; Florencias-Oliveros, O. Weather forecasts for microgrid energy management: Review, discussion and recommendations. Appl. Energy 2018, 228, 265–278. [Google Scholar] [CrossRef]
- Ismael, S.M.; Abdel Aleem, S.H.E.; Abdelaziz, A.Y.; Zobaa, A.F. State-of-the-art of hosting capacity in modern power systems with distributed generation. Renew. Energy 2019, 130, 1002–1020. [Google Scholar] [CrossRef]
- Saad, S.N.M.; van der Weijde, A.H. Evaluating the Potential of Hosting Capacity Enhancement Using Integrated Grid Planning modeling Methods. Energies 2019, 12, 3610. [Google Scholar] [CrossRef] [Green Version]
- Bollen, M.H.J.; Hassan, F. Introduction. In Integration of Distributed Generation in the Power System; Wiley-IEEE Press: Hoboken, NJ, USA, 2011; pp. 1–5. [Google Scholar]
- Mulenga, E.; Bollen, M.H.J.; Etherden, N. A review of hosting capacity quantification methods for photovoltaics in low-voltage distribution grids. Int. J. Electr. Power Energy Syst. 2020, 115, 105445. [Google Scholar] [CrossRef]
- Bollen, M.; Hassan, F. Frontmatter. In Integration of Distributed Generation in the Power System; Wiley-IEEE Press: Hoboken, NJ, USA, 2011; pp. i–xiii. ISBN 9781118029039. [Google Scholar]
- Deuse, J.; Benintendi, D.; Agrell, P.J.; Bogetoft, P. Power system and market integration of der, the EU-DEEP approach. In Proceedings of the IEEE Conference Publication, Turin, Italy, 13 May 2005; Volume 6, pp. 175–178. [Google Scholar]
- Sadeghian, H.; Wang, Z. A novel impact-assessment framework for distributed PV installations in low-voltage secondary networks. Renew. Energy 2020, 147, 2179–2194. [Google Scholar] [CrossRef]
- Duwadi, K.; Ingalalli, A.; Hansen, T.M. Monte Carlo Analysis of High Penetration Residential Solar Voltage Impacts using High Performance Computing. In Proceedings of the 2019 IEEE International Conference on Electro Information Technology (EIT), Brookings, SD, USA, 20–22 May 2019; pp. 1–6. [Google Scholar]
- Steyn, A.F.W.; Rix, A.J. Modelling the technical influence of randomly distributed solar PV uptake on electrical distribution networks. In Proceedings of the 2019 International Conference on Clean Electrical Power (ICCEP), Otranto, Italy, 2–4 July 2019; IEEE: Otranto, Italy, 2019; pp. 690–698. [Google Scholar]
- Al-saffar, M.; Zhang, S.; Nassif, A.; Musilek, P. Assessment of Photovoltaic Hosting Capacity of Existing Distribution Circuits. In Proceedings of the 2019 IEEE Canadian Conference of Electrical and Computer Engineering (CCECE), Edmonton, AB, Canada, 5–8 May 2019; pp. 1–4. [Google Scholar]
- Peppanen, J.; Bello, M.; Rylander, M. Service Entrance Hosting Capacity. In Proceedings of the 2018 IEEE 7th World Conference on Photovoltaic Energy Conversion (WCPEC) (A Joint Conference of 45th IEEE PVSC, 28th PVSEC & 34th EU PVSEC), Waikoloa Village, HI, USA, 10–15 June 2018; pp. 1451–1456. [Google Scholar]
- Abad, M.S.S.; Ma, J.; Zhang, D.; Ahmadyar, A.S.; Marzooghi, H. Probabilistic Assessment of Hosting Capacity in Radial Distribution Systems. IEEE Trans. Sustain. Energy 2018, 9, 1935–1947. [Google Scholar] [CrossRef]
- Alturki, M.; Khodaei, A.; Paaso, A.; Bahramirad, S. Optimization-based distribution grid hosting capacity calculations. Appl. Energy 2018, 219, 350–360. [Google Scholar] [CrossRef]
- Lillebo, M.; Zaferanlouei, S.; Zecchino, A.; Farahmand, H. Impact of large-scale EV integration and fast chargers in a Norwegian LV grid. J. Eng. 2019, 2019, 5104–5108. [Google Scholar] [CrossRef]
- Soukaina, N.; Hassane, E.; Hassan, E.M.; Tijani, L. Hosting capacity estimation of underground distribution feeder in Urbain Areas. In Proceedings of the 2019 International Conference on Wireless Technologies, Embedded and Intelligent Systems, WITS 2019, Fez, Morocco, 3–4 April 2019; pp. 1–5. [Google Scholar]
- Al-saadi, H.; Al-sarawi, S.; Zivanovic, R.; Abood, H.G. Hourly-Assessment of Grid Hosting Capacity for Active Distribution Network. In Proceedings of the 2018 IEEE International Conference on Probabilistic Methods Applied to Power Systems (PMAPS), Boise, ID, USA, 24–28 June 2018; pp. 1–7. [Google Scholar]
- Mirbagheri, S.M.; Moncecchi, M.; Falabretti, D.; Merlo, M. Hosting Capacity Evaluation in Networks with Parameter Uncertainties. In Proceedings of the 2018 18th International Conference on Harmonics and Quality of Power (ICHQP), Ljubljana, Slovenia, 13–16 May 2018; pp. 1–6. [Google Scholar]
- Faishal Fuad, R.S.; Adi, K.W.; Sarjiya; Putranto, L.M. Study on Photovoltaic Hosting in Yogyakarta Electric Distribution Network. In Proceedings of the 2018 5th International Conference on Information Technology, Computer, and Electrical Engineering (ICITACEE), Semarang, Indonesia, 27–28 September 2018; pp. 240–244. [Google Scholar]
- Chathurangi, D.; Jayatunga, U.; Rathnayake, M.; Wickramasinghe, A.; Agalgaonkar, A.; Perera, S. Potential Power Quality Impacts on LV Distribution Networks With High Penetration Levels of Solar PV. In Proceedings of the 2018 18th International Conference on Harmonics and Quality of Power (ICHQP), Ljubljana, Slovenia, 13–16 May 2018; pp. 1–6. [Google Scholar]
- ul Abideen, M.Z.; Ellabban, O.; Refaat, S.S.; Abu-Rub, H.; Al-Fagih, L. A Novel Methodology to Determine the Maximum PV Penetration in Distribution Networks. In Proceedings of the 2019 2nd International Conference on Smart Grid and Renewable Energy (SGRE), Doha, Qatar, 19–21 Novermber 2019; pp. 1–6. [Google Scholar]
- Ismael, S.M.; Aleem, S.H.E.A.; Abdelaziz, A.Y.; Zobaa, A.F. Probabilistic Hosting Capacity Enhancement in Non-Sinusoidal Power Distribution Systems Using a Hybrid PSOGSA Optimization Algorithm. Energies 2019, 12, 1018. [Google Scholar] [CrossRef] [Green Version]
- Essackjee, I.A.; King, R.T.F.A. Maximum Rooftop Photovoltaic Hosting Capacity with Harmonics as Limiting Factor – Case Study for Mauritius. In Proceedings of the 2019 International Conference on Advances in Big Data, Computing and Data Communication Systems (icABCD), Winterton, South Africa, 5–6 August 2019; pp. 1–6. [Google Scholar]
- Braga, M.D.; Machado, S.D.; Oliveira, I.C.; De Oliveira, T.E.C.; Ribeiro, P.F.; Lopes, B.I.L. Harmonic Hosting Capacity Approach in a Radial Distribution System due to PV Integration Using OpenDSS. In Proceedings of the 2018 13th IEEE International Conference on Industry Applications (INDUSCON), São Paulo, Brazil, 11–14 November 2018; pp. 222–228. [Google Scholar]
- Sakar, S.; Balci, M.E.; Abdel Aleem, S.H.E.; Zobaa, A.F. Increasing PV hosting capacity in distorted distribution systems using passive harmonic filtering. Electr. Power Syst. Res. 2017, 148, 74–86. [Google Scholar] [CrossRef] [Green Version]
- Li, Z.; Shahidehpour, M.; Alabdulwahab, A.; Al-Turki, Y. Valuation of distributed energy resources in active distribution networks. Electr. J. 2019, 32, 27–36. [Google Scholar] [CrossRef]
- Sakar, S.; Balci, M.E.; Abdel, S.H.E.; Zobaa, A.F. Integration of large- scale PV plants in non-sinusoidal environments: Considerations on hosting capacity and harmonic distortion limits. Renew. Sustain. Energy Rev. 2018, 82, 176–186. [Google Scholar] [CrossRef] [Green Version]
- Quintero-Molina, V.; Romero-L, M.; Pavas, A. Assessment of the hosting capacity in distribution networks with different DG location. In Proceedings of the 2017 IEEE Manchester PowerTech, Manchester, UK, 18–22 June 2017; pp. 1–6. [Google Scholar]
- Navarro, B.B.; Navarro, M.M. A comprehensive solar PV hosting capacity in MV and LV radial distribution networks. In Proceedings of the 2017 IEEE PES Innovative Smart Grid Technologies Conference Europe (ISGT-Europe), Torino, Italy, 26–29 September 2017; pp. 1–6. [Google Scholar]
- Estorque, L.K.L.; Pedrasa, M.A.A. Utility-scale DG planning using location-specific hosting capacity analysis. In Proceedings of the 2016 IEEE Innovative Smart Grid Technologies—Asia (ISGT-Asia), Melbourne, Australia, 28 November–1 December 2016; pp. 984–989. [Google Scholar]
- Reno, M.J.; Broderick, R.J. Statistical analysis of feeder and locational PV hosting capacity for 216 feeders. In Proceedings of the 2016 IEEE Power and Energy Society General Meeting (PESGM), Boston, MA, USA, 17–21 July 2016; pp. 1–5. [Google Scholar]
- Abad, M.S.S.; Ma, J.; Zhang, D.; Ahmadyar, A.S.; Marzooghi, H. Sensitivity of hosting capacity to data resolution and uncertainty modeling. In Proceedings of the 2018 Australasian Universities Power Engineering Conference (AUPEC), Auckland, New Zealand, 27–30 November 2018; pp. 1–6. [Google Scholar]
- Do, M.T.; Bruyere, A.; Francois, B. Sensitivity analysis of the CIGRE distribution network benchmark according to the large scale connection of renewable energy generators. In Proceedings of the 2017 IEEE Manchester PowerTech, Manchester, UK, 18–22 June 2017; pp. 1–6. [Google Scholar]
- Fan, S.; Pu, T.; Li, L.; Yu, T.; Yang, Z.; Gao, B. Evaluation of impact of integrated distributed generation on distribution network based on time-series analysis. In Proceedings of the 2016 China International Conference on Electricity Distribution (CICED), Xi’an, China, 10–13 August 2016; pp. 1–5. [Google Scholar]
- Athari, M.H.; Wang, Z.; Eylas, S.H. Time-series analysis of photovoltaic distributed generation impacts on a local distributed network. In Proceedings of the 2017 IEEE Manchester PowerTech, Manchester, UK, 18–22 June 2017; pp. 1–6. [Google Scholar]
- Gonzaga, R.M.; Massigan, J.A.D.; London, J.B.A.J. Analysis of the Hosting Capacity of a Real Distribution Feeder with Wind Generation. In Proceedings of the 2019 IEEE PES Innovative Smart Grid Technologies Conference—Latin America (ISGT Latin America), Gramado, Brazil, 15–18 September 2019; pp. 1–5. [Google Scholar]
- de Oliveira, T.E.C.; Bollen, M.; Ribeiro, P.F.; de Carvalho, P.M.S.; Zambroni, A.C.; Bonatto, B.D. The concept of dynamic hosting capacity for distributed energy resources: Analytics and practical considerations. Energies 2019, 12, 2576. [Google Scholar] [CrossRef] [Green Version]
- Rossi, M.; Viganò, G.; Moneta, D.; Clerici, D. Stochastic evaluation of distribution network hosting capacity: Evaluation of the benefits introduced by smart grid technology. In Proceedings of the 2017 AEIT International Annual Conference, Cagliari, Italy, 20–22 September 2017; pp. 1–6. [Google Scholar]
- Le Baut, J.; Zehetbauer, P.; Kadam, S.; Bletterie, B.; Hatziargyriou, N.; Smith, J.; Rylander, M. Probabilistic evaluation of the hosting capacity in distribution networks. In Proceedings of the 2016 IEEE PES Innovative Smart Grid Technologies Conference Europe (ISGT-Europe), Ljubljana, Slovenia, 9–12 October 2016; pp. 1–6. [Google Scholar]
- Klonari, V.; Toubeau, J.-F.; Lobry, J.; Vallée, F. Photovoltaic integration in smart city power distribution: A probabilistic photovoltaic hosting capacity assessment based on smart metering data. In Proceedings of the 2016 5th International Conference on Smart Cities and Green ICT Systems (SMARTGREENS), Rome, Italy, 23–25 April 2016; pp. 1–13. [Google Scholar]
- Schwanz, D.; Busatto, T.; Bollen, M.; Larsson, A. A stochastic study of harmonic voltage distortion considering single-phase photovoltaic inverters. In Proceedings of the 2018 18th International Conference on Harmonics and Quality of Power (ICHQP), Ljubljana, Slovenia, 13–16 May 2018; pp. 1–6. [Google Scholar]
- Wang, S.; Li, C.; Pan, Z.; Wang, J. Probabilistic method for distribution network electric vehicle hosting capacity assessment based on combined cumulants and gram-charlier expansion. Energy Procedia 2019, 158, 5067–5072. [Google Scholar] [CrossRef]
- Torquato, R.; Salles, D.; Pereira, C.O.; Meira, P.C.M.; Freitas, W. A Comprehensive Assessment of PV Hosting Capacity on Low-Voltage Distribution Systems. IEEE Trans. Power Deliv. 2018, 33, 1002–1012. [Google Scholar] [CrossRef]
- Ding, F.; Mather, B. On Distributed PV Hosting Capacity Estimation, Sensitivity Study, and Improvement. IEEE Trans. Sustain. Energy 2017, 8, 1010–1020. [Google Scholar] [CrossRef]
- Al-Saadi, H.; Zivanovic, R.; Al-Sarawi, S.F. Probabilistic analysis of maximum allowable PV connections across bidirectional feeders within a distribution network. In Proceedings of the 2017 Asian Conference on Energy, Power and Transportation Electrification (ACEPT), Singapore, 24–26 October 2017; pp. 1–6. [Google Scholar]
- Al-Saadi, H.; Zivanovic, R.; Al-Sarawi, S.F. Probabilistic Hosting Capacity for Active Distribution Networks. IEEE Trans. Ind. Inform. 2017, 13, 2519–2532. [Google Scholar] [CrossRef]
- Navarro-Espinosa, A.; Ochoa, L.F. Probabilistic Impact Assessment of Low Carbon Technologies in LV Distribution Systems. IEEE Trans. Power Syst. 2016, 31, 2192–2203. [Google Scholar] [CrossRef]
- Hung, D.Q.; Mishra, Y. A Multiobjective Voltage Unbalance Factor for PV Hosting Capacity with Probabilistic ZIP Load Models. In Proceedings of the 2018 IEEE Power & Energy Society General Meeting (PESGM), Portland, OR, USA, 5–9 August 2018; pp. 1–5. [Google Scholar]
- Schwanz, D.; Ronnberg, S.K.; Bollen, M. Hosting capacity for photovoltaic inverters considering voltage unbalance. In Proceedings of the 2017 IEEE Manchester PowerTech, Manchester, UK, 18–22 June 2017; pp. 1–6. [Google Scholar]
- Quijano, D.A.; Wang, J.; Sarker, M.R.; Padilha-Feltrin, A. Stochastic assessment of distributed generation hosting capacity and energy efficiency in active distribution networks. IET Gener. Transm. Distrib. 2017, 11, 4617–4625. [Google Scholar] [CrossRef] [Green Version]
- Schwanz, D.; Rönnberg, S.; Bollen, M. Voltage unbalance due to single-phase photovoltaic inverters. CIRED Open Access Proc. J. 2017, 2017, 906–910. [Google Scholar] [CrossRef] [Green Version]
- Liu, Y.J.; Tai, Y.H.; Huang, C.Y.; Su, H.J.; Lan, P.H.; Hsieh, M.K. Assessment of the PV hosting capacity for the medium-voltage 11.4 kV distribution feeder. In Proceedings of the 2018 IEEE International Conference on Applied System Invention (ICASI), Chiba, Japan, 13–17 April 2018; pp. 381–384. [Google Scholar]
- Lakshmi, S.; Ganguly, S. Simultaneous optimisation of photovoltaic hosting capacity and energy loss of radial distribution networks with open unified power quality conditioner allocation. IET Renew. Power Gener. 2018, 12, 1382–1389. [Google Scholar] [CrossRef]
- Rabiee, A.; Mohseni-Bonab, S.M. Maximizing hosting capacity of renewable energy sources in distribution networks: A multi-objective and scenario-based approach. Energy 2017, 120, 417–430. [Google Scholar] [CrossRef]
- Sun, W.; Harrison, G.P. Wind-solar complementarity and effective use of distribution network capacity. Appl. Energy 2019, 247, 89–101. [Google Scholar] [CrossRef] [Green Version]
- Alturki, M.; Khodaei, A. Optimal loading capacity in distribution grids. In Proceedings of the 2017 North American Power Symposium (NAPS), Morgantown, WV, USA, 17–19 September 2017; pp. 1–6. [Google Scholar]
- Wang, Z.; Wang, X.; Tang, L. Practical power distance test tool based on OPF to Assess Feeder DG Hosting Capacity. In Proceedings of the 2017 IEEE Electrical Power and Energy Conference (EPEC), Saskatoon, SK, Canada, 22–25 October 2017; pp. 1–6. [Google Scholar]
- Alturki, M.; Khodaei, A. Marginal Hosting Capacity Calculation for Electric Vehicle Integration in Active Distribution Networks. In Proceedings of the 2018 IEEE/PES Transmission and Distribution Conference and Exposition (T&D), Denver, CO, USA, 16–19 April 2018; pp. 1–9. [Google Scholar]
- Wang, Y.; Yu, Y.; Zhang, J. Analysis for distribution network on hosting capacity of distributed wind turbines considering additional income under procedure conditions. J. Eng. 2017, 2017, 1373–1377. [Google Scholar] [CrossRef]
- Mmary, E.R.; Marungsri, B. Optimal Hybrid Renewable Generator for Techno-Economic Benefits in Smart Distribution Network. In Proceedings of the 2018 International Electrical Engineering Congress (iEECON), Krabi, Thailand, 7–9 March 2018; pp. 1–4. [Google Scholar]
- Zhao, J.; Wang, J.; Xu, Z.; Wang, C.; Wan, C.; Chen, C. Distribution Network Electric Vehicle Hosting Capacity Maximization: A Chargeable Region Optimization Model. IEEE Trans. Power Syst. 2017, 32, 4119–4130. [Google Scholar] [CrossRef]
- Chen, X.; Wu, W.; Zhang, B.; Lin, C. Data-Driven DG Capacity Assessment Method for Active Distribution Networks. IEEE Trans. Power Syst. 2017, 32, 3946–3957. [Google Scholar] [CrossRef]
- Chen, X.; Wu, W.; Zhang, B. Robust Capacity Assessment of Distributed Generation in Unbalanced Distribution Networks Incorporating ANM Techniques. IEEE Trans. Sustain. Energy 2018, 9, 651–663. [Google Scholar] [CrossRef] [Green Version]
- Vatani, M.; Alkaran, D.S.; Sanjari, M.J.; Gharehpetian, G.B. Multiple distributed generation units allocation in distribution network for loss reduction based on a combination of analytical and genetic algorithm methods. IET Gener. Transm. Distrib. 2016, 10, 66–72. [Google Scholar] [CrossRef]
- Alturki, M. Hosting Capacity Optimization in Modern Distribution Grids; University of Denver: Denver, CO, USA, 2018. [Google Scholar]
- Rylander, M.; Smith, J.; Sunderman, W. Streamlined method for determining distribution system hosting capacity. IEEE Trans. Ind. Appl. 2016, 52, 105–111. [Google Scholar] [CrossRef]
- Rylander, M.; Smith, J.; Sunderman, W. Streamlined Method for Determining Distribution System Hosting Capacity. In Proceedings of the 2015 IEEE Rural Electric Power Conference, Asheville, NC, USA, 19–21 April 2015; pp. 3–9. [Google Scholar]
- Rylander, M.; Smith, J.; Sunderman, W.; Smith, D.; Glass, J. Application of new method for distribution-wide assessment of Distributed Energy Resources. In Proceedings of the 2016 IEEE/PES Transmission and Distribution Conference and Exposition (T&D), Dallas, TX, USA, 3–5 May 2016; pp. 1–5. [Google Scholar]
- Open Electrical Power Systems Analysis Software. Available online: https://wiki.openelectrical.org/index.php?title=Power_Systems_Analysis_Software (accessed on 20 January 2020).
- Siemens PSS®Sincal All-in-one Simulation Software for the Analysis and Planning of Power Networks. Available online: https://assets.new.siemens.com/siemens/assets/public.1537970929.31ece3a2-e9cc-4528-b9f9-6bf61b613de2.ref-no-69-ps-c-pss-sincal-brochure-hires-intl-sept2018.pdf (accessed on 20 January 2020).
- Siemens Maximal Hosting Capacity (ICA). Available online: https://assets.new.siemens.com/siemens/assets/public.1516636173.d30d49557176528d935ec035d8499ac26d083822.11-ica-module-datasheet-sincal-ag.pdf (accessed on 20 January 2020).
- DIgSILENT PowerFactory 2019 What’s New. Available online: https://www.digsilent.de/en/downloads.html (accessed on 20 January 2020).
- NEPLAN Target Grid Planning. Available online: https://www.neplan.ch/description/target-grid-planning/ (accessed on 20 January 2020).
- Smarter Grid Solutions (SGS). Enhanced Hosting Capacity Analysis. 2018. Available online: http://mnsolarpathways.org/wp-content/uploads/2018/10/mn-solar-pathways_pv-hosting-capacity-report.pdf (accessed on 29 January 2020).
- Yuan, J.; Weng, Y.; Tan, C. Quantifying Hosting Capacity for Rooftop PV System in LV Distribution Grids. 2019. Available online: https://arxiv.org/abs/1909.00864 (accessed on 29 January 2020).
- CYME Integration Capacity Analysis. Available online: http://www.cyme.com/software/cymeica/ (accessed on 21 January 2020).
Figure 1.
The concept of hosting capacity.

Figure 2.
Overview of the review structure.

Figure 3.
General HC calculation methodology.

Figure 4.
Highlights of the HC calculations tools.


Table 1.
Studies that utilize the constant source method for hosting capacity evaluation.
| Ref. | DER Technology | Performance Index | Study Objective | ||||||
|---|---|---|---|---|---|---|---|---|---|
| OV | UV | LN Limit | TX Limit | HD | RPF | FCL | |||
| [21] | DER | ✔ | ✔ | ✔ | ✔ | Analyze the hosting capacity of the secondary side of a North American split-phase residential network. | |||
| [25] | DG | ✔ | Find the hosting capacity of a distributed feeder using π line model. | ||||||
| [28] | PV | ✔ | ✔ | ✔ | Find the PV hosting capacity of MV and LV distribution networks in Kentungan. | ||||
| [33] | PV | ✔ | Find the harmonic hosting capacity of radial distribution feeders. | ||||||
| [37] | DG | ✔ | ✔ | ✔ | Study the effects of DG location on the hosting capacity. | ||||
| [38] | PV | ✔ | ✔ | Develop a methodology to study the effects of MV-LV interconnection on the PV hosting capacity. | |||||
| [39] | DG | ✔ | ✔ | ✔ | ✔ | Estimate the location-specific utility-scale DG hosting capacity. | |||
| [40] | PV | ✔ | ✔ | ✔ | ✔ | Analyze 216 MV distribution feeders and present the results of the locational hosting capacity calculation | |||
Table 2.
Studies that utilize the time series method for hosting capacity evaluation.
| Ref. | DER Technology | Performance Index | Study Objective | ||||||||
|---|---|---|---|---|---|---|---|---|---|---|---|
| OV | UV | LN Limit | TX Limit | HD | RPF | DL | PF | VU | |||
| [19] | PV | ✔ | ✔ | ✔ | Find the hosting capacity of a sample distribution network with randomly distributed PV systems. | ||||||
| [29] | PV | ✔ | ✔ | ✔ | ✔ | ✔ | Analyze the impact of high PV penetration on the power quality of a LV network. | ||||
| [30] | PV | ✔ | ✔ | Determine the hosting capacity of a distribution network with distribution losses as the limiting criteria. | |||||||
| [32] | PV | ✔ | ✔ | ✔ | ✔ | Study the effects of harmonics on a real LV network using actual consumption and PV system output data. | |||||
| [42] | PV | ✔ | ✔ | ✔ | ✔ | Evaluate the probability of performance index violation in a MV distribution network when the hosting capacity limit is not obeyed. | |||||
| [43] | Wind turbine | ✔ | ✔ | Assess the impact of DG integration on the voltage quality, economics and hosting capacity of a distribution network. | |||||||
| [44] | PV | ✔ | ✔ | Analyze the impact of PV integration into a real distribution network using time-series analysis. | |||||||
| [45] | Wind turbine | ✔ | ✔ | ✔ | ✔ | ✔ | Calculate the hosting capacity of real distribution feeder and determine the factors that limit the integration of wind generation into the distribution network. | ||||
Table 3.
Studies that utilize the stochastic method for hosting capacity evaluation.
| Ref. | DER Technology | Performance Index | Study Objective | Technique | ||||||||
|---|---|---|---|---|---|---|---|---|---|---|---|---|
| OV | UV | LN Limit | TX Limit | HD | RPF | PF | VU | DL | ||||
| [17] | PV | ✔ | ✔ | Present an impact-assessment framework to study two types of PV system deployment scenarios: customer-based (Stochastic) and utility-based (Optimization). | Monte-Carlo based technique for random placement and sizing of PV units. | |||||||
| [18] | PV | ✔ | ✔ | ✔ | ✔ | Present an impact assessment framework based on parallel computing and Monte Carlo simulation for PV systems integration into LV feeders. | Monte-Carlo based technique for random placement and sizing of PV units. | |||||
| [20] | PV | ✔ | Calculate the hosting capacity of three real distribution networks using a methodology based on Monte Carlo simulation. | Monte-Carlo simulation based probabilistic power flow for random placement and sizing of PV units. | ||||||||
| [26] | PV | ✔ | ✔ | Determine the hosting capacity and probabilistic expectation of violations for PV system integration into distribution networks. | Nataf transformation for spatial correlations between PV units and loads. | |||||||
| [41] | PV | ✔ | Investigate the effects of the resolution of historical data and the uncertainty of DG placement on the hosting capacity of distribution networks. | Monte-Carlo based framework for PV unit sizing. | ||||||||
| [47] | DG | ✔ | ✔ | ✔ | Present an innovative procedure based on Monte Carlo simulation with limited iterations for hosting capacity and congestion curve calculation. | Monte-Carlo based probabilistic approach for DG unit placement and sizing. | ||||||
| [48] | DER | ✔ | ✔ | Use a three-step probabilistic methodology to analyze the hosting capacity of distribution network with various operation modes. | Monte-Carlo based probabilistic load flow for random DER sizing and placement along with Secant Method algorithm for scaling up the power of all generators proportionally. | |||||||
| [49] | PV | ✔ | ✔ | ✔ | ✔ | ✔ | Signify the usefulness of smart meter data in finding the maximum PV hosting capacity of LV distribution feeders. | Monte-Carlo based algorithm for sampling from smart meter data. | ||||
| [50] | PV | ✔ | Estimate the hosting capacity of a LV distribution network taking into account the harmonic distortion of single-phase PV inverters. | Monte-Carlo based method for PV unit placement in the busses and phases. | ||||||||
| [51] | EV | ✔ | ✔ | Find the distribution network EV hosting capacity using a probabilistic method based on Combined Cumulants and Gram-Charlier Expansion. | Monte-Carlo simulation used to find the Cumulants of EV charging demand. | |||||||
| [52] | PV | ✔ | ✔ | ✔ | ✔ | ✔ | Provide an understanding of LV systems’ hosting capacity by analyzing the stochastic results of 50,000 real LV systems. | Simplified Monte-Carlo based method taking PV unit location as the random variable. | ||||
| [53] | PV | ✔ | ✔ | ✔ | ✔ | ✔ | Estimate the hosting capacity of 17 utility distribution feeders and analyze the effects of feeder and PV system characteristics on the hosting capacity. | Monte-Carlo simulation-based technique taking PV unit size and location as the random variable. | ||||
| [54] | PV | ✔ | ✔ | ✔ | ✔ | Provide a tool for distribution network operators (DNOs) for determining the maximum permissible PV systems size. | Quasi Monte-Carlo method for handling the uncertainties. | |||||
| [55] | PV and Wind turbine | ✔ | ✔ | Present a risk assessment tool for estimating the hosting capacity of distribution networks. | Sparse grid technique for risk assessment. | |||||||
| [56] | PV, EV, electric heat pumps and combined heat and power units | ✔ | ✔ | ✔ | ✔ | Develop a probabilistic impact assessment methodology to study the impact of low carbon technologies on the LV network. | Monte-Carlo simulation for sizing and placement of PV, EVs, EHPs and µCHP units. | |||||
| [57] | PV | ✔ | Develop a multi-objective voltage unbalance factor to assess the effects of single-phase PV system integration on three-phase residential distribution networks. | Monte-Carlo simulation for sizing and placement of PV on the busses and phases and Gaussian distribution model to characterize the uncertainty of loads. | ||||||||
| [58] | PV | ✔ | Find the hosting capacity of LV rural distribution networks with regards to the negative-sequence voltage unbalance for single phase PV system integration. | Monte-Carlo based method for placement of PV units on the busses and phases. | ||||||||
| [60] | PV | ✔ | Find the single-phase PV hosting capacity of LV networks with regards to negative-sequence voltage balance and uncertainty in location and connection phase. | Monte-Carlo method for PV unit placement on the busses and phases. | ||||||||
| [61] | PV | ✔ | ✔ | Study the impact of high PV penetration on a MV distribution feeder, taking into account the uncertainty of PV systems’ location and size. | Random generation of PV units size and location using MATLAB. | |||||||
Table 4.
Studies that utilize the optimization-based method for hosting capacity evaluation.
| Ref. | DER Technology | Performance Index | Study Objective | Objective Function | |||||||
|---|---|---|---|---|---|---|---|---|---|---|---|
| OV | UV | LN Limit | TX Limit | HD | RPF | VF | VU | ||||
| [17] | PV | ✔ | ✔ | Present an impact-assessment framework to study two types of PV systems deployment scenarios: customer-based (Stochastic) and utility-based (Optimization). | Minimize energy losses, voltage deviation and voltage fluctuation. | ||||||
| [22] | DG | ✔ | ✔ | Propose a framework for radial distribution system hosting capacity estimation that considers loads and DGs uncertainties. | Maximize the active power generation of a DG. | ||||||
| [23] | DG | ✔ | ✔ | ✔ | Propose a linear power flow based robust optimization method to find the DG hosting capacity of distribution networks using linear programming. | Minimize the active power generation of a DG over the uncertain variables while maximizing it over the primal variables. | |||||
| [34] | PV | ✔ | ✔ | ✔ | ✔ | Finding the PV hosting capacity of a distribution system containing harmonic distortions. | Maximize HC where HC is dependent on the main capacitive reactance, the inductive reactance, dampening resistance and the capacity of PV unit. | ||||
| [62] | PV | ✔ | ✔ | ✔ | Site open unified power quality conditioner (UPQC-O) while optimizing PV hosting capacity. | Maximize the PV units active power generation and minimize the total energy loss of the network. | |||||
| [63] | Wind turbine | ✔ | ✔ | ✔ | Introduce a stochastic multi-objective model to maximize the wind turbine hosting capacity and minimize the energy procurement costs. | Minimize the expected cost of power purchased from the upstream network and minimize the operation and maintenance cost of the wind farms. | |||||
| [64] | PV and wind turbine | ✔ | ✔ | ✔ | ✔ | Optimally size and site wind and PV systems to maximize the hosting capacity of distribution networks. | Maximize the energy production of the hybrid system. | ||||
| [65] | DG | ✔ | ✔ | ✔ | Find the optimal loading capacity of a distribution network by linearizing the AC power flow equations. | Maximize the additional load capacity that can be added to the system. | |||||
| [66] | DG | ✔ | ✔ | ✔ | ✔ | ✔ | Present a methodology to increase the DG penetration in a distribution system without advanced distribution system. | Maximize the active power generation of the DG. | |||
| [67] | EV | ✔ | ✔ | ✔ | Present a mathematical model for calculating the marginal EV hosting capacity of nodes in a distribution network. | Maximize the additional generation or load over the additional active power that can be added to the network and minimize it over the available load demand. | |||||
| [68] | Wind turbine | ✔ | ✔ | ✔ | Present a method for calculating the wind turbine hosting capacity of distribution systems while maximizing the economic benefits. | Maximize the additional income of wind turbines by traditional generation reduction, net loss reduction and environment profits. | |||||
| [69] | PV and Wind turbine | ✔ | ✔ | Minimize active power losses by placing hybrid renewable generators and shunt capacitors using ABC algorithm. | Maximize the loss reduction and voltage stability. | ||||||
| [70] | EV | ✔ | ✔ | ✔ | Propose a concept of EV chargeable regions for distribution network EV hosting capacity calculation. | Minimize total distribution network operation cost by minimizing the line losses and the compensation cost of delayed charging. | |||||
| [71] | DG | ✔ | ✔ | ✔ | Propose a robust optimization-based DG hosting capacity calculation method. | Maximize the total DG output. | |||||
| [72] | DG | ✔ | ✔ | ✔ | Optimally size and site DGs in an unbalanced distribution network using the RC-CAM method. | Maximize the total DG output. | |||||
Table 5.
Studies that utilize the streamlined method for hosting capacity evaluation.
| Ref. | DER Technology | Performance Index | Study Objective | ||||||
|---|---|---|---|---|---|---|---|---|---|
| OV | UV | LN Limit | TX Limit | RPF | PD | FC | |||
| [75] | PV | ✔ | ✔ | ✔ | ✔ | ✔ | ✔ | Outline the methodology of streamlined analysis by determining the PV hosting capacity of a distribution feeder. | |
| [76] | PV | ✔ | ✔ | ✔ | ✔ | ✔ | ✔ | ✔ | Outline the methodology of streamlined analysis by determining the PV hosting capacity of a distribution feeder. |
| [77] | DER | ✔ | ✔ | ✔ | ✔ | ✔ | Provide a summary of a new streamlined method to assess the impacts of DER integration on a distribution. | ||
Table 6.
Comparison of the HC calculation methods.
| Characteristic | Constant Source | Time Series | Stochastic | Optimization-Based | Streamlined |
|---|---|---|---|---|---|
| Data requirement | Small | Large | Moderate | Moderate | Moderate |
| Complexity | Simple | Moderate | Complex | Complex | Complex |
| Calculation time | Small | Moderate | Large | Large | Moderate |
| No. of scenarios tested | Few | Few | Many | Several | Several |
| Results | Approximate | Accurate | Accurate | Exact (for given constraints) | Approximate |
© 2020 by the authors. Licensee MDPI, Basel, Switzerland. This article is an open access article distributed under the terms and conditions of the Creative Commons Attribution (CC BY) license (http://creativecommons.org/licenses/by/4.0/).
Share and Cite
MDPI and ACS Style
Zain ul Abideen, M.; Ellabban, O.; Al-Fagih, L. A Review of the Tools and Methods for Distribution Networks’ Hosting Capacity Calculation. Energies 2020, 13, 2758. https://doi.org/10.3390/en13112758
AMA Style
Zain ul Abideen M, Ellabban O, Al-Fagih L. A Review of the Tools and Methods for Distribution Networks’ Hosting Capacity Calculation. Energies. 2020; 13(11):2758. https://doi.org/10.3390/en13112758
Chicago/Turabian StyleZain ul Abideen, Mohammad, Omar Ellabban, and Luluwah Al-Fagih. 2020. "A Review of the Tools and Methods for Distribution Networks’ Hosting Capacity Calculation" Energies 13, no. 11: 2758. https://doi.org/10.3390/en13112758
Note that from the first issue of 2016, this journal uses article numbers instead of page numbers. See further details here.