Article

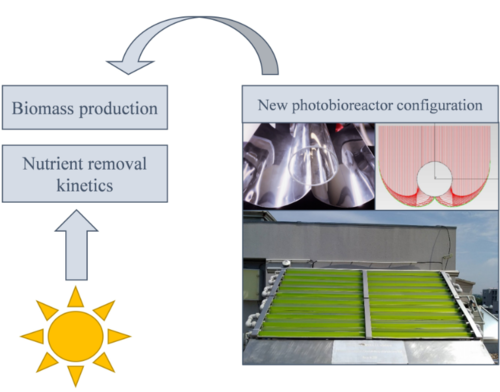
Outdoor Cultivation of the Microalga Chlorella vulgaris in a New Photobioreactor Configuration: The Effect of Ultraviolet and Visible Radiation

by
Alcinda P. Lopes
1,2,
Francisca M. Santos
1,2,
Tânia F. C. V. Silva
2,
Vítor J. P. Vilar
2,* and
José C. M. Pires
1,*
1
LEPABE—Laboratory for Process Engineering, Environment, Biotechnology and Energy, Faculty of Engineering, University of Porto, Rua Dr. Roberto Frias, 4200-465 Porto, Portugal
2
Laboratory of Separation and Reaction Engineering—Laboratory of Catalysis and Materials (LSRE-LCM), Faculty of Engineering, University of Porto, Rua Dr. Roberto Frias, 4200-465 Porto, Portugal
*
Authors to whom correspondence should be addressed.
Energies 2020, 13(8), 1962; https://doi.org/10.3390/en13081962
Submission received: 20 March 2020 / Revised: 9 April 2020 / Accepted: 11 April 2020 / Published: 16 April 2020
(This article belongs to the Section B: Energy and Environment)

Abstract

:
Microalgae can be a future source of biomass with a wide range of applications, including its use to solve current environmental issues. One of the main variables for microalgal cultivation is the light supply: (i) its intensity that often does not present a uniform spatial distribution inside the culture; (ii) photoperiod; and (iii) spectrum. Therefore, this study aims to evaluate the growth of the microalgae Chlorella vulgaris in a tubular photobioreactor with compound parabolic collectors (CPCs) under outdoor conditions. The effect of ultraviolet and visible radiation on biomass productivity and nutrients (nitrogen and phosphorus) uptake was assessed. The maximum biomass productivity was (5 ± 1) × 10−3 g·L−1·h−1, and the specific growth rates ranged from (1.1 ± 0.3) × 10−2 to (2.0 ± 0.6) × 10−2 h−1. Regarding nutrient uptake, initial removal rates of (0.9 ± 0.4) mg N·L−1·h−1 for nitrogen and (0.17 ± 0.04) mg P·L−1·h−1 for phosphorus were reached. These values increased with visible and ultraviolet irradiance until certain values (143 WVIS·m−2 and 9 WUV·m−2 for biomass productivity; 101 WVIS·m−2 and 6 WUV·m−2 for nutrient removal) and then decreased for higher ones due to the photoinhibition phenomenon. Therefore, the application of CPCs to photobioreactors (PBRs) may be beneficial for microalgal culture in countries with higher latitude (with lower solar irradiance levels).

Graphical Abstract

1. Introduction

Microalgal cultures have been recently studied for environmental applications, such as CO2 capture, wastewater treatment, among others [1,2,3]. Their use at the industrial level is still not economically viable due to high operational costs. Microalgae production at commercial scale is now only feasible for high-value products. However, the integration of biomass production and wastewater treatment reduces microalgae production costs significantly and also the associated environmental impact [4,5]. Microalgal culture requires a high amount of freshwater and fertilizers, which costs increased considerably in the last decades due to the intensive agriculture practices [6]. Besides carbon, nitrogen, and phosphorus are essential macronutrients for microalgal growth. These nutrients can be found in wastewaters of different sources [1,7,8,9]. Using these effluents as microalgal cultures, the addition of fertilizers may be significantly reduced, and no freshwater is needed. Simultaneously, microalgae promote wastewater decontamination. This process integration has been extensively studied by several researchers [10,11,12,13,14], showing the potential of microalgae for wastewater treatment in both secondary and tertiary steps, in which Chlorella vulgaris is one of the most studied species. Evans et al. [15] evaluated the performance of C. vulgaris for the treatment of settled municipal wastewater. Adding an external organic carbon source (mixotrophic culture), significant reductions of NH3-N (from 28.9 to 0.1 mg·L−1) and PO4-P (from 3.2 to 0.1 mg·L−1) concentrations were observed after two days of culture. Garcia et al. [16] assessed the consortia between microalgae and bacteria for the treatment of diluted piggery wastewater under indoor and outdoor conditions. High removal efficiencies (greater than 70%) were observed for total organic carbon, nitrogen, phosphorus, and zinc. In this study, C. vulgaris was the dominant species in the consortia. Gonçalves et al. [17] tested three different consortia between C. vulgaris and one of the bacteria isolated from municipal wastewater treatment plant (Enterobacter asburiae, Klebsiella sp., or Raoultella ornithinolytica) for nutrient removal from a synthetic effluent. The consortia achieved higher nutrient removal rates, reaching the European Union legislated limits before the single microalgal cultures, showing that these consortia may be a viable solution for tertiary treatment of municipal wastewaters.
In addition, the design of microalgae cultivation reactors is a complex task, requiring the consideration of many different factors: (i) biotic; (ii) abiotic; and (iii) economic. These reactors can be divided into open (open ponds) and closed ones (photobioreactors—PBRs). With closed systems, the culture variables can be controlled, achieving higher microalgal growth kinetics [2]. Additionally, the negative impacts of microalgal cultures (e.g., water and CO2 losses) are minimised. Besides the many advantages associated with PBRs, microalgae are usually produced in open ponds for large-scale cultivation due to the lower investment and production costs. Thus, research efforts should be performed regarding PBR design, scaling-up and optimization. Filali et al. [18] developed a growth model for C. vulgaris considering the influence of light intensity and the total organic carbon. A bubble column PBR of 9.6 L was used with an illuminated area of 0.31 m2. The developed models presented high fitting performance to experimental data. Therefore, they can be applied to the culture in continuous mode for controlling the CO2 feed, aiming the optimization of their consumption with this biological system. Guo et al. [19] tested C. vulgaris cultivation at outdoor conditions with pilot-scale bubble column PBR of 80 L without temperature and pH control. Different CO2 input conditions (concentration, feed period and frequency) were provided, with aiming at optimizing CO2 capture and biomass conversion efficiencies. Biochemical composition of the achieved biomass was also evaluated. Applying an intermittent feed of 2% CO2 gaseous stream, the effectiveness of CO2 capture and biomass conversion doubled when compared with a continuous supply of this stream. CO2 enriched streams promoted the accumulation of fatty acids methyl esters (FAMEs), and the outdoor conditions modified the FAME composition. Lam and Lee [20] evaluated the C. vulgaris growth in a sequential baffle PBR of 100 L under indoor and outdoor environment. The highest biomass concentrations were 0.52 g·L−1 and 0.28 g·L−1 for indoor and outdoor conditions, respectively. The main cause for the significant reduction of biomass production between tested environments was identified. The heat accumulated in PBR under outdoor conditions reduces the microalgal growth rate significantly. Life cycle energy analysis was also performed, and the authors obtained a negative energy balance for biodiesel production under both indoor and outdoor environment. Considering even other research studies, some critical parameters of PBRs are [4,5,21]: (i) light distribution to avoid saturation kinetics, making use of light/dark cycles; (ii) mass transfer between gaseous and liquid phases—CO2 supply and O2 removal; (iii) shear-stress; (iv) mixing; and (v) the process energy demand. Therefore, it is essential to study new PBR configurations that promote high microalgal biomass productivities and nutrient removal rates.
This work aims to assess the effect of ultraviolet (UV) and visible light on microalgal growth and nutrient uptake from a synthetic effluent under outdoor conditions in a tubular photobioreactor with compound parabolic collectors (CPCs), which enable a more uniform spatial distribution of light inside the culture medium. As far as it is known, it is the first research study using this device in tubular PBRs for microalgal cultivation. The specific objectives are: (i) to evaluate the biomass production under different average solar irradiances and different levels of UV and visible radiation; (ii) to analyze the removal of nitrogen and phosphorus; and (iii) to determine the kinetic parameters associated with both processes.

2. Materials and Methods

2.1. Culture Medium and Microalgae

The microalgae C. vulgaris was selected since literature reports high nutrient removal efficiencies for these species cultivated in wastewaters from different sources [7,17]. The microalga was obtained from the Culture Collection of Algae and Protozoa (CCAP), Cumbria, England. C. vulgaris CCAP 211/11b was inoculated in a modified OECD (Organization for Economic Co-operation and Development) test culture medium (synthetic effluent), with the following composition [22]: 119 mg·L−1 KNO3; 12 mg·L−1 MgCl2·6H2O; 18 mg·L−1 CaCl2·2H2O; 15 mg·L−1 MgSO4·7H2O; 20 mg·L−1 KH2PO4; 0.08 mg·L−1 FeCl3·6H2O; 0.1 mg·L−1 Na2EDTA·2H2O; 0.185 mg·L−1 H3BO3; 0.415 mg·L−1 MnCl2·4H2O; 3 × 10⁻³ mg·L−1 ZnCl2; 15 × 10−4 mg·L−1 CoCl2·6H2O; 10−5 mg·L−1 CuCl2·2H2O; 7 × 10⁻³ mg·L−1 Na2MoO4·2H2O and 100 mg·L−1 NaHCO3. The inoculum was prepared under indoor conditions (in 5 L bottles). Since the inoculum volume is significantly relative to the culture volume in the tubular PBR (40 L), the nutrients’ initial concentrations in the culture show deviations from the planned medium composition. Cultures were inoculated without aseptic techniques for 5 and 10 d of outdoor culturing in 4 different assays. An initial biomass concentration of 0.19–0.33 g·L−1 was used for all assays. Considering that microalgal cultures were only exposed to solar radiation with 7 to 9 h·d−1, a total of 44 to 81 h of natural sunlight period was evaluated. The experiments were performed between April and June.
NaHCO3 was added to the microalgae cultures when necessary (to avoid the limitation of microalgal growth due to the absence of carbon in the medium). The pH was monitored (Figures S2–S9 in the supplementary data file) and controlled to avoid the change of the culture medium (precipitation of metals or phosphorus). When required, a 0.1 M H2SO4 solution was added to the culture medium to control solution pH.

2.2. Experimental Setup

The cultures were inoculated in a pilot plant (see Figure 1), located on the roof of the Department of Chemical Engineering of the Faculty of Engineering of the University of Porto. This pilot unit is constituted by CPCs (with a total area of 4.16 m2) mounted in a fixed structure tilted 41˚ local latitude. CPCs consists of two truncated parabolas with a concentration factor of around one [23,24]. Almost all the solar radiation (direct and diffuse) can be collected and reflected around the back of the tubular PBR, allowing the illumination of the whole tube perimeter, resulting in more uniform lighting inside it. This installation has two storage tanks (55 and 100 L of maximum capacity), two recirculation pumps with regulating flow rate up to 22 L·min−1, and connecting pipes. The solar collectors are composed of four CPCs modules (1.04 m2) with five borosilicate tubes each (Schott-Duran type 3.3, Germany, cut-off at 280 nm, internal diameter 46.4 mm, length 1500 mm and thickness 1.8 mm) connected by plastic joints. Borosilicate glass has high ultraviolet A (UVA)-visible light transmissibility (see Figure S1 in the supplementary data file). Reflectors are made of anodised aluminium with high reflectivity in the UVA-visible light range. This facility can operate in two modes: (i) using the total CPCs area (4.16 m2) or (ii) use half the CPCs area (2.08 m2) individually, thus allowing two independent experiments to be carried out simultaneously, with the same radiation conditions. In this work, C. vulgaris was inoculated applying the second operation mode; photobioreactors were designed as PBR1 and PBR2. The working volume was 40 L for both PBRs; the illuminated proportion was 59%.
Table 1 shows the experimental conditions in which the four assays were carried out. The initial concentrations for nitrogen and phosphorous were in the range between 16.5 and 38.7 mg N·L−1 and, 6.1 and 12.3 mg P·L−1, respectively. After each assay, PBRs were adequately cleaned to avoid the contamination of the microalgal cultures by predators. Preliminary experiments have shown that solar irradiance presents a negative effect on the microalgal culture at low biomass concentrations. To reduce the incidence solar irradiance (mostly UV light) in microalgal cultures, the installation was covered with a shadow net, decreasing about 71% of the incident solar irradiance. In the Assays I and II, the shadow net was removed for one of the PBRs to analyze the effect of higher solar irradiances on microalgal cultures; in the Assays III and IV, the microalgal cultures in PBR1 and PBR2 were performed under the same environmental conditions. Additionally, in the last assay, the medium nutrient concentrations were doubled to evaluate this effect on microalgal culture. The UV solar irradiance was continuously monitored by a global UV radiometer (CUV 4, Kipp and Zonen, Netherlands; Figure 1), with a spectral response between 280 and 400 nm, mounted at the pilot plant at the same inclination (values presented in Figures S2–S9 in the supplementary data file).
To maintain the culture temperature within the range of 15–35 ˚C [2,25], a serpentine connected to a thermostatic bath was used to remove heat from the fluid inside the recirculation tanks, and water spray over the solar collectors was used for cooling the culture inside the tubes. This variable was monitored for all assays (see Figures S2–S9 in the supplementary data file).

2.3. Methods of Analysis

Temperature (more than 4 times per day; the time and the frequency was dependent of the ambient temperature), pH (twice a day in the morning: before and after the addition of NaHCO3), optical density (once a day in the morning), dry weight (once a day in the morning), and UV irradiance (continuous measurements) were monitored daily. Temperature and pH were measured using a portable meter (8424, Hanna Instruments, Italy). The optical density of the culture at 440 nm (OD440) was measured with a UV-6300 PC spectrophotometer (VWR, United States). Biomass dry weight was determined by collecting 100 mL of the culture to a crucible and dried at 105 °C for approximately 24 h. Then, its mass was measured (m1) and placed in a muffle at 550 °C for 2 h. After this period, the crucible was cooled outside and placed in a desiccator (1 h). Its mass was measured again (m2). The biomass concentration in dry weight was calculated by the quotient between m1-m2 and the sample volume. Based on the measurements of OD440 and biomass dry weight concentration, it was possible to obtain a linear relationship between these two variables based on Beer-Lambert law [26]. The biomass concentration in dry weight (g·L−1) as a function of optical density was estimated for C. vulgaris based on the following linear regression (valid for optical densities below 0.5; for higher values, a deviation from the linear Beer-Lambert behaviour occurs):
X = ( 0.32 ± 0.02 ) × OD 440 + ( 0.12 ± 0.02 )   with   R 2 = 0.998 ,
The photosynthetic photon flux (μmol·m−2·s−1) of the visible radiation (VIS) was also measured for two distinct meteorological conditions (clear and cloudy sky), to obtain a linear relationship that correlates UV irradiance (IUV, W·m−2) with VIS irradiance. Firstly, based on the Planck equation [27] and the VIS solar spectrum (ASTM G-173-03 AM1.5G reference spectrum [28]), the photosynthetic photon flux was converted into VIS irradiance (IVIS, W·m−2). After that, the VIS irradiance was correlated with the UV irradiance according to the following linear regressions:
I V I S = ( 16.7 ± 0.3 ) × I U V   with   R 2 = 0.997 ,   for   clear   sky ,
I V I S = ( 9.8 ± 0.4 ) × I U V   with   R 2 = 0.996 ,   for   cloudy   sky ,
Collected samples (once a day in the morning) from the culture were centrifuged for 15 min at a speed of 4000 rpm. After centrifugation, the liquid above the cells (supernatant) was collected and filtered through nylon membrane syringe filters with 0.45 μm porosity (Whatman, UK) and stored. The samples were also evaluated in terms of ionic composition through ion chromatography to know the nutrient concentrations in the culture medium. The determination of inorganic anions (F, Cl, NO2, NO3, SO42−, Br- e PO43−) concentrations was performed in a Dionex ICS-2100 equipped with an IonPac® AS9-HC 4 mm × 250 mm column and an anion self-regenerating suppressor (ASRS®300 4 mm). Inorganic cations (Li+, Na+, NH4+, K+, Mg2+ e Ca2+) concentrations were determined in a Dionex DX-120 equipped with an IonPac®CS12A 4 mm × 250 mm and a cation self-regenerating suppressor (CSRS®300 4 mm). The analysis of anions and cations involves about 12 min of reading using isocratic elution with (30 mM NaOH)/(20 mM CH3SO2OH) at a flow rate of 1.5 and 1.0 mL·min−1, respectively. Nutrient removal was only assessed for macronutrients responsible for the microalgae growth: nitrogen and phosphorus.

2.4. Kinetic Models

Taking into account that microalgal cultivation was carried out in outdoor conditions, the analysis of biomass concentration was performed as a function of the cultivation time and as a function of the accumulated energy due to visible irradiance, since the solar irradiance is not constant throughout the day and between days. Therefore, the specific growth rates (μt—h−1—or μQ—L·kJ−1) and average biomass productivities (Px,av, mg·L−1·h−1) were determined. Specific growth rates were determined for the exponential phase of microalgal growth through Equation (4) [3,29]:
d X d t = μ X     X = X 0 e μ t ,
where X corresponds to the biomass concentration (g·L−1) at time t (h) and X0 corresponds to the biomass concentration at the initial time t0. The same equation was applied to determine the specific growth rate as function of accumulated energy due to visible irradiance QVIS (kJ·L−1). Through the specific growth rate, it was possible to identify which experimental conditions were favourable to microalgal growth.
Average biomass productivity (Px,av, g·L−1·h−1) and average nutrients removal rate (RRav, mg·L−1·h−1) were given by the slopes obtained through the linear regression between the representations of the biomass (X, g·L−1) and nutrients (N-NO3 and P-PO43−, mg·L−1) concentrations, respectively, as a function of time (t, h).
The daily monitoring of nutrients concentration (S, mg·L−1) in the culture medium also enabled the determination of the pseudo-first order kinetic constants (as function of time—kS,t, h−1; or as function of accumulated energy due to visible irradiance—kS,Q, L·kJ−1) by the Equation (5) [3]:
d S d t = k S S = S 0 e k t ,
The initial removal rate (r0, mg·L−1·h−1 or mg·kJ−1) can be calculated using Equation (6). The nutrient removal kinetics were also determined as a function of the accumulated energy due to visible irradiance.
r 0 = k S 0 ,
Using the determined biomass concentration and nutrient concentrations in the culture medium, the specific biomass yields based on nutrient consumption (YX/S, g/gS) can be calculated using Equation (7) [3].
Y X / S = P x , a v RR av ,
Equation (8) allows to obtain the amount of accumulated energy due to visible irradiance (QVIS,i, kJ·L−1) received on any surface at the same position per unit volume of water inside the reactor in the time interval Δti:
Q V I S , i = Q V I S ,     i 1 + Δ t i I V I S ¯ A r V ;   Δ t i = t i t i 1 ,
where ti is the time corresponding to the culture sample i, V is the total volume of the PBR, Ar is the area of the illuminated surface and I V I S ¯ is the average visible irradiance measured during the period Δti.

3. Results and Discussion

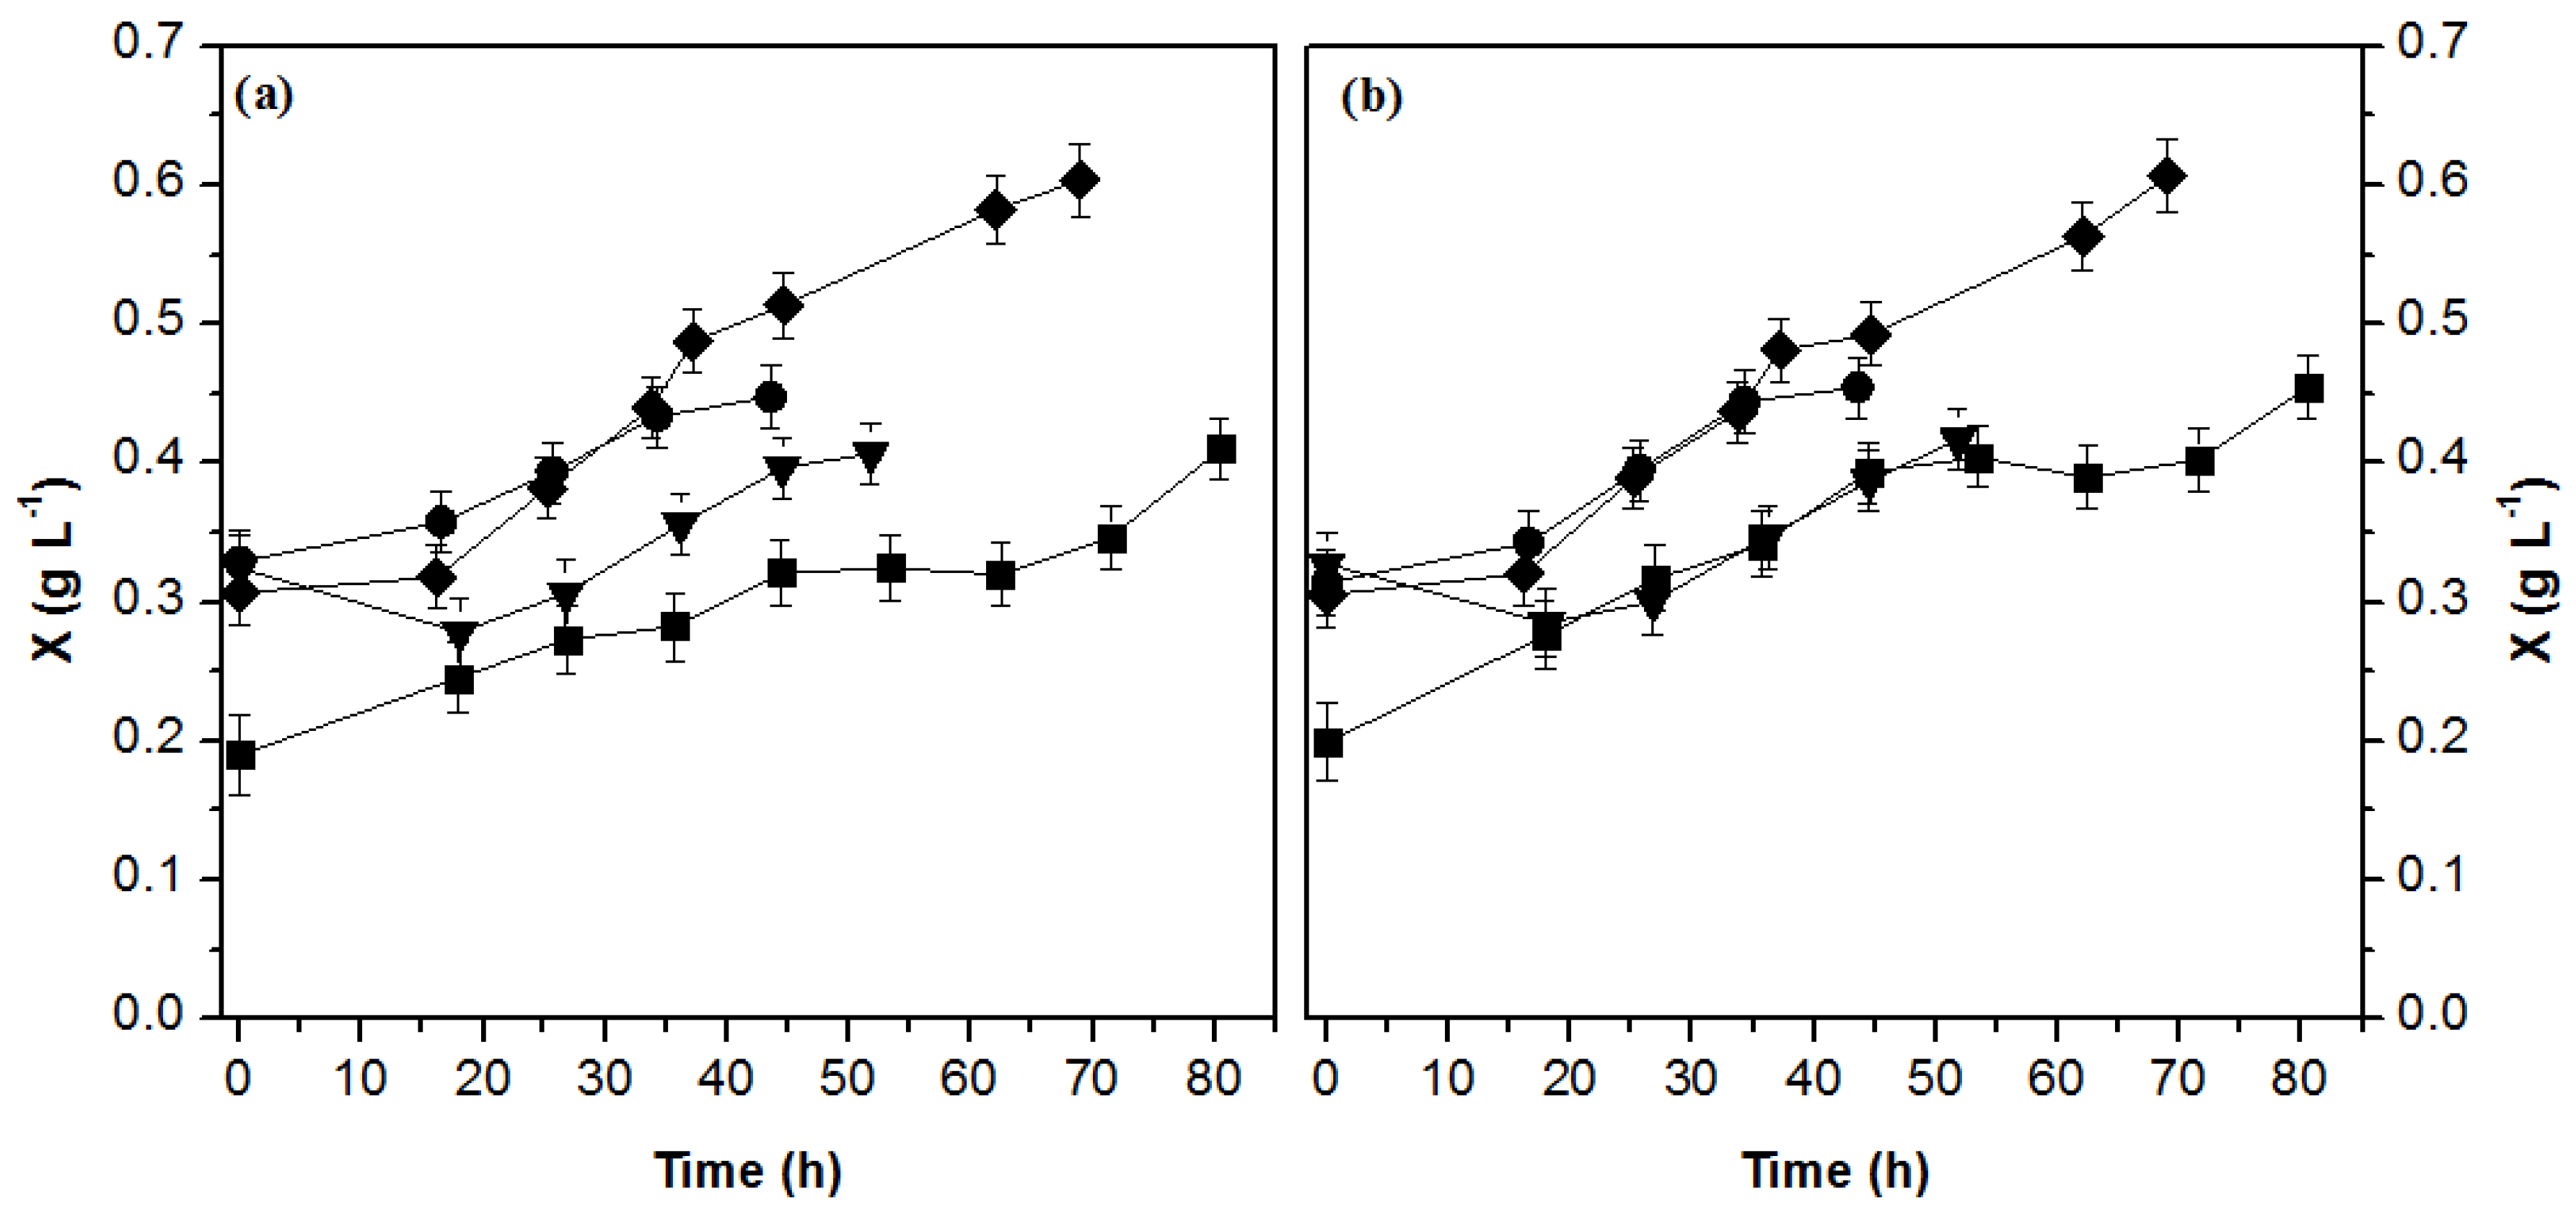
3.1. Biomass Production

Temporal variation of UV and visible radiation, pH, and temperature for all assays are presented in Figures S2–S9 (in the supplementary data file). Figure 2a,b shows the evolution of the biomass dry weight concentration as a function of the cultivation time in the PBR1 and PBR2, respectively. The variability of outdoor environmental conditions led to unusual growth curves. In some assays, a decrease of biomass concentration on the first day was observed due to the adaptation of microalgae (inoculum cultivated in indoor conditions) to outdoor environment (mainly due to higher light intensity and daily temperature variability). Thus, in the Assay IV ( I U V ¯ = 9 W·m−2; I V I S ¯ = 143 W·m−2; IVIS, range =3−267 W·m−2), the cultures achieved the highest biomass concentration, reaching Xmax of 0.60 g·L−1.
Table 2 presents a set of parameters associated with the biomass production that allowed the comparison between assays, as well as the comparison with studies in the literature. The specific growth rates and the respective standard errors (δμ) were determined from the fitting of the exponential model in Equation (4) to experimental points. The average biomass productivities recorded for C. vulgaris ranged from (2.3 ± 0.6) × 10−3 to (5 ± 1) × 10−3 g·L−1·h−1. These results demonstrate that the best and the worst assays in terms of biomass productivities were IV ( I V I S ¯ = 143 W·m−2) and I (PBR1, exposed to a lower irradiance: I V I S ¯ = 98 W·m−2), respectively. During the exponential growth period, the determined specific growth rates ranged from (1.1 ± 0.3) × 10−2 to (2.0 ± 0.6) × 10−2 h−1. Analyzing the environmental conditions experienced by each culture during this growth phase (in Tables S1 and S2), the highest specific growth rates corresponded to an average visible irradiance in the exponential growth phase ( I V I S , e ¯ ) of 127 W·m−2 (IVIS, range = 3–264 W·m−2). The effect of UV radiation was also evaluated by several authors. Jiang and Qiu [30] cultivated Microcystis aeroginosa FACHB 854 with ultraviolet B (UVB) exposure (3.15 W·m−2 during 80 min) and observed that the potential quantum yields of photosystem II (PSII) decreased about 86.2%. Beardall et al. [31] also observed a severe inhibition of maximum quantum yield of PSII of Dunaliella tertiolecta with UVB radiation of 2.8 W·m−2. Suresh Babu et al. [32] studied microalgal growth (four days of culture) with UVB irradiation of 4, 5, and 6 W·m−2, providing to the cultures the same total energy: 2 J d−1. Nostoc growth reductions of 25 to 55% were observed, corresponding the highest decreasing values to the high UVB irradiations. The effect of doubling nutrient concentrations in culture medium was analysed in the Assays III and IV through the achieved specific growth rates. Thus, the growth of microalgae was higher under the conditions of Assay IV: (i) Assay III—(1.4 ± 0.3) × 10−2 h−1 and (1.2 ± 0.2) × 10−2 h−1; and (ii) Assay IV—(2.0 ± 0.6) × 10−2 h−1 and (1.8 ± 0.7) × 10−2 h−1.
Figure 3a,b shows the evolution of the biomass concentration as a function of the accumulated energy due to visible irradiance. The culture in Assay II (PBR2: I V I S ¯ = 82 W·m−2) was the one with the lower amount of accumulated energy due to visible irradiance. Consequently, the cultures of this assay did not show a significant increase in biomass concentration. Microalgal growth was more significant in Assay IV in which the amount of visible radiation energy received by the PBR in the cultivation period per unit volume was 1902 kJ·L−1. Thus, it was possible to conclude that biomass productivity increases with the light intensity until a particular value (143 W·m−2), from which the light radiation becomes harmful to microalgae–photoinhibition phenomenon. Wong et al. [33] studied the effect of UV radiation on the growth of C. vulgaris. In this study, the impact of three types of radiation was evaluated in outdoor (during 54 h) and indoor conditions (during 10 d): (i) photosynthetically active radiation (PAR) + UVA; (ii) PAR + UVA + UVB, and (iii) only PAR. In outdoor conditions, the culture was exposed to mean light irradiances or photonic fluxes of: (i) UVA—3.66 to 27.98 W·m−2; (ii) UVB—1.61 to 16.50 W·m−2; and PAR—282 to 1480 μmol·m−2·s−1. This study verified that the UVA radiation did not affect the microalga growth; however, the UVB radiation negatively affected their growth.
In this study, the specific growth rates ranged from (1.1 ± 0.3) × 10−2 to (2.0 ± 0.6) × 10−2 h−1. Lam and Lee [20] evaluated the biomass production of the C. vulgaris in a column PBR with 100 L of capacity at indoor and outdoor conditions. In indoor conditions, the authors obtained specific growth rates between 1.9 × 10⁻³ and 4.8 × 10⁻³ h−1. On the other hand, in outdoor conditions, the specific growth rates recorded ranged from 2.1 × 10⁻³ to 3.7 × 10⁻³ h−1. The specific growth rates obtained in the present study were higher than those recorded by the aforementioned study. Guo et al. [19] optimised the CO2 supply (CO2 enriched gaseous streams with 2, 4 and 8%) in 80 L (8 L × 10 sets) bubble columns for outdoor cultivation of C. vulgaris. For 2% CO2 enriched air, the biomass concentration on day 7 was 1.5 g·L−1 with biomass productivity of 0.18 g·L−1·d−1 (7.5 × 10⁻³ g·L−1·h−1). The productivity has the same order of magnitude of the values presented in this study, even being fed the culture with enriched CO2 gaseous stream (that contributes to the enhancement of autotrophic microalgal growth).

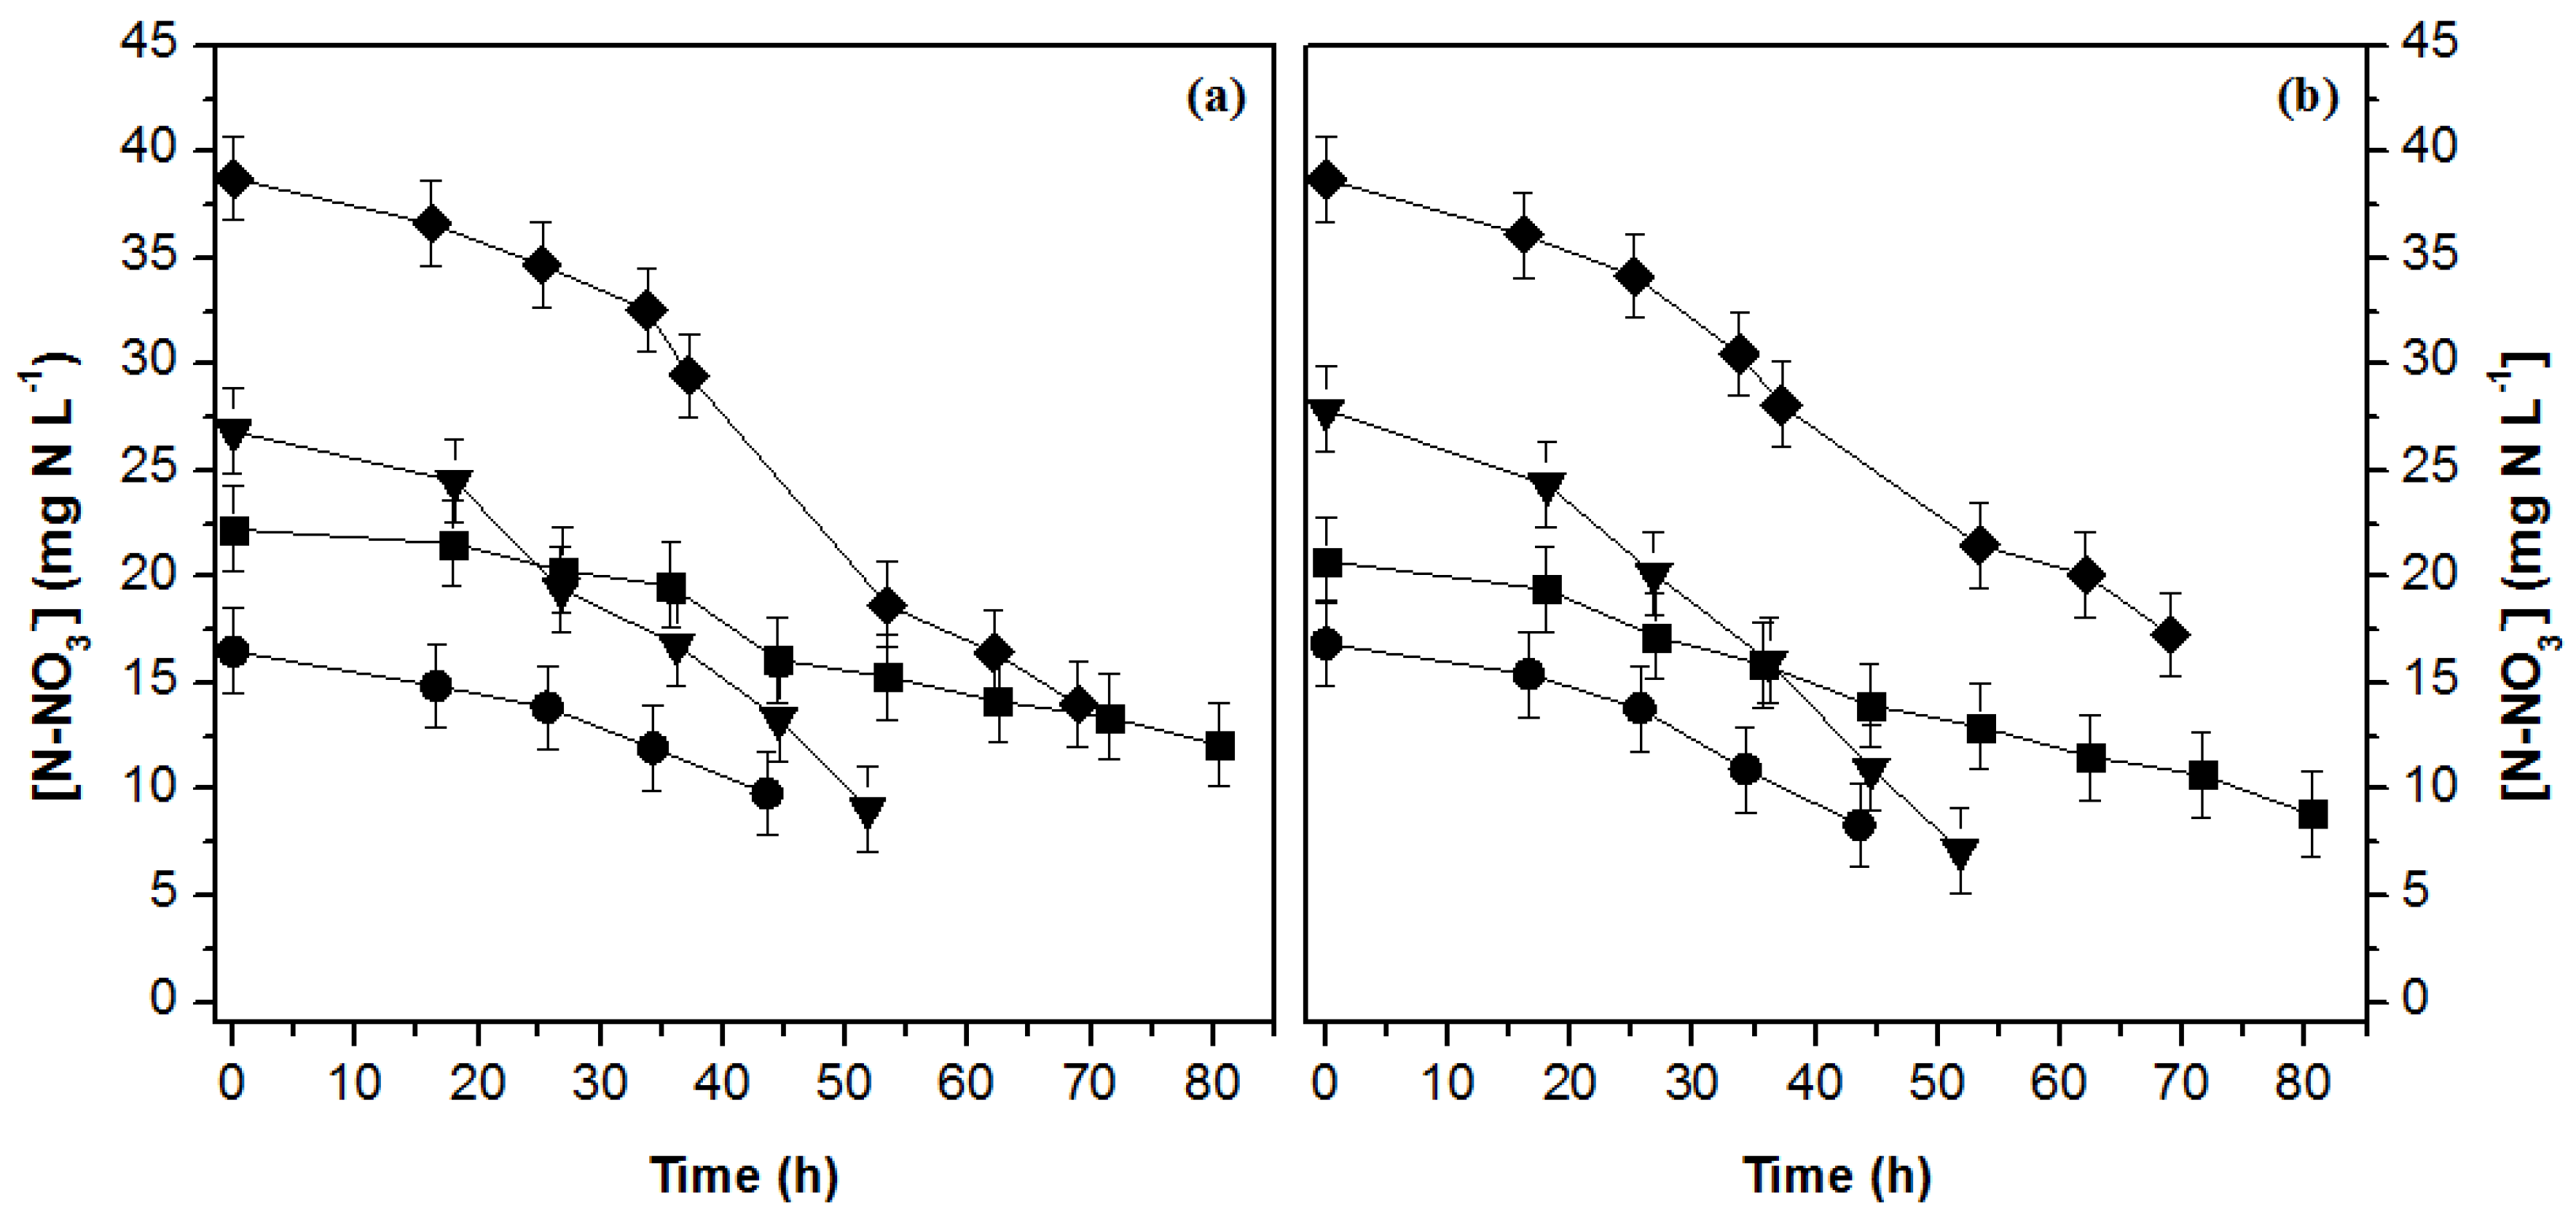
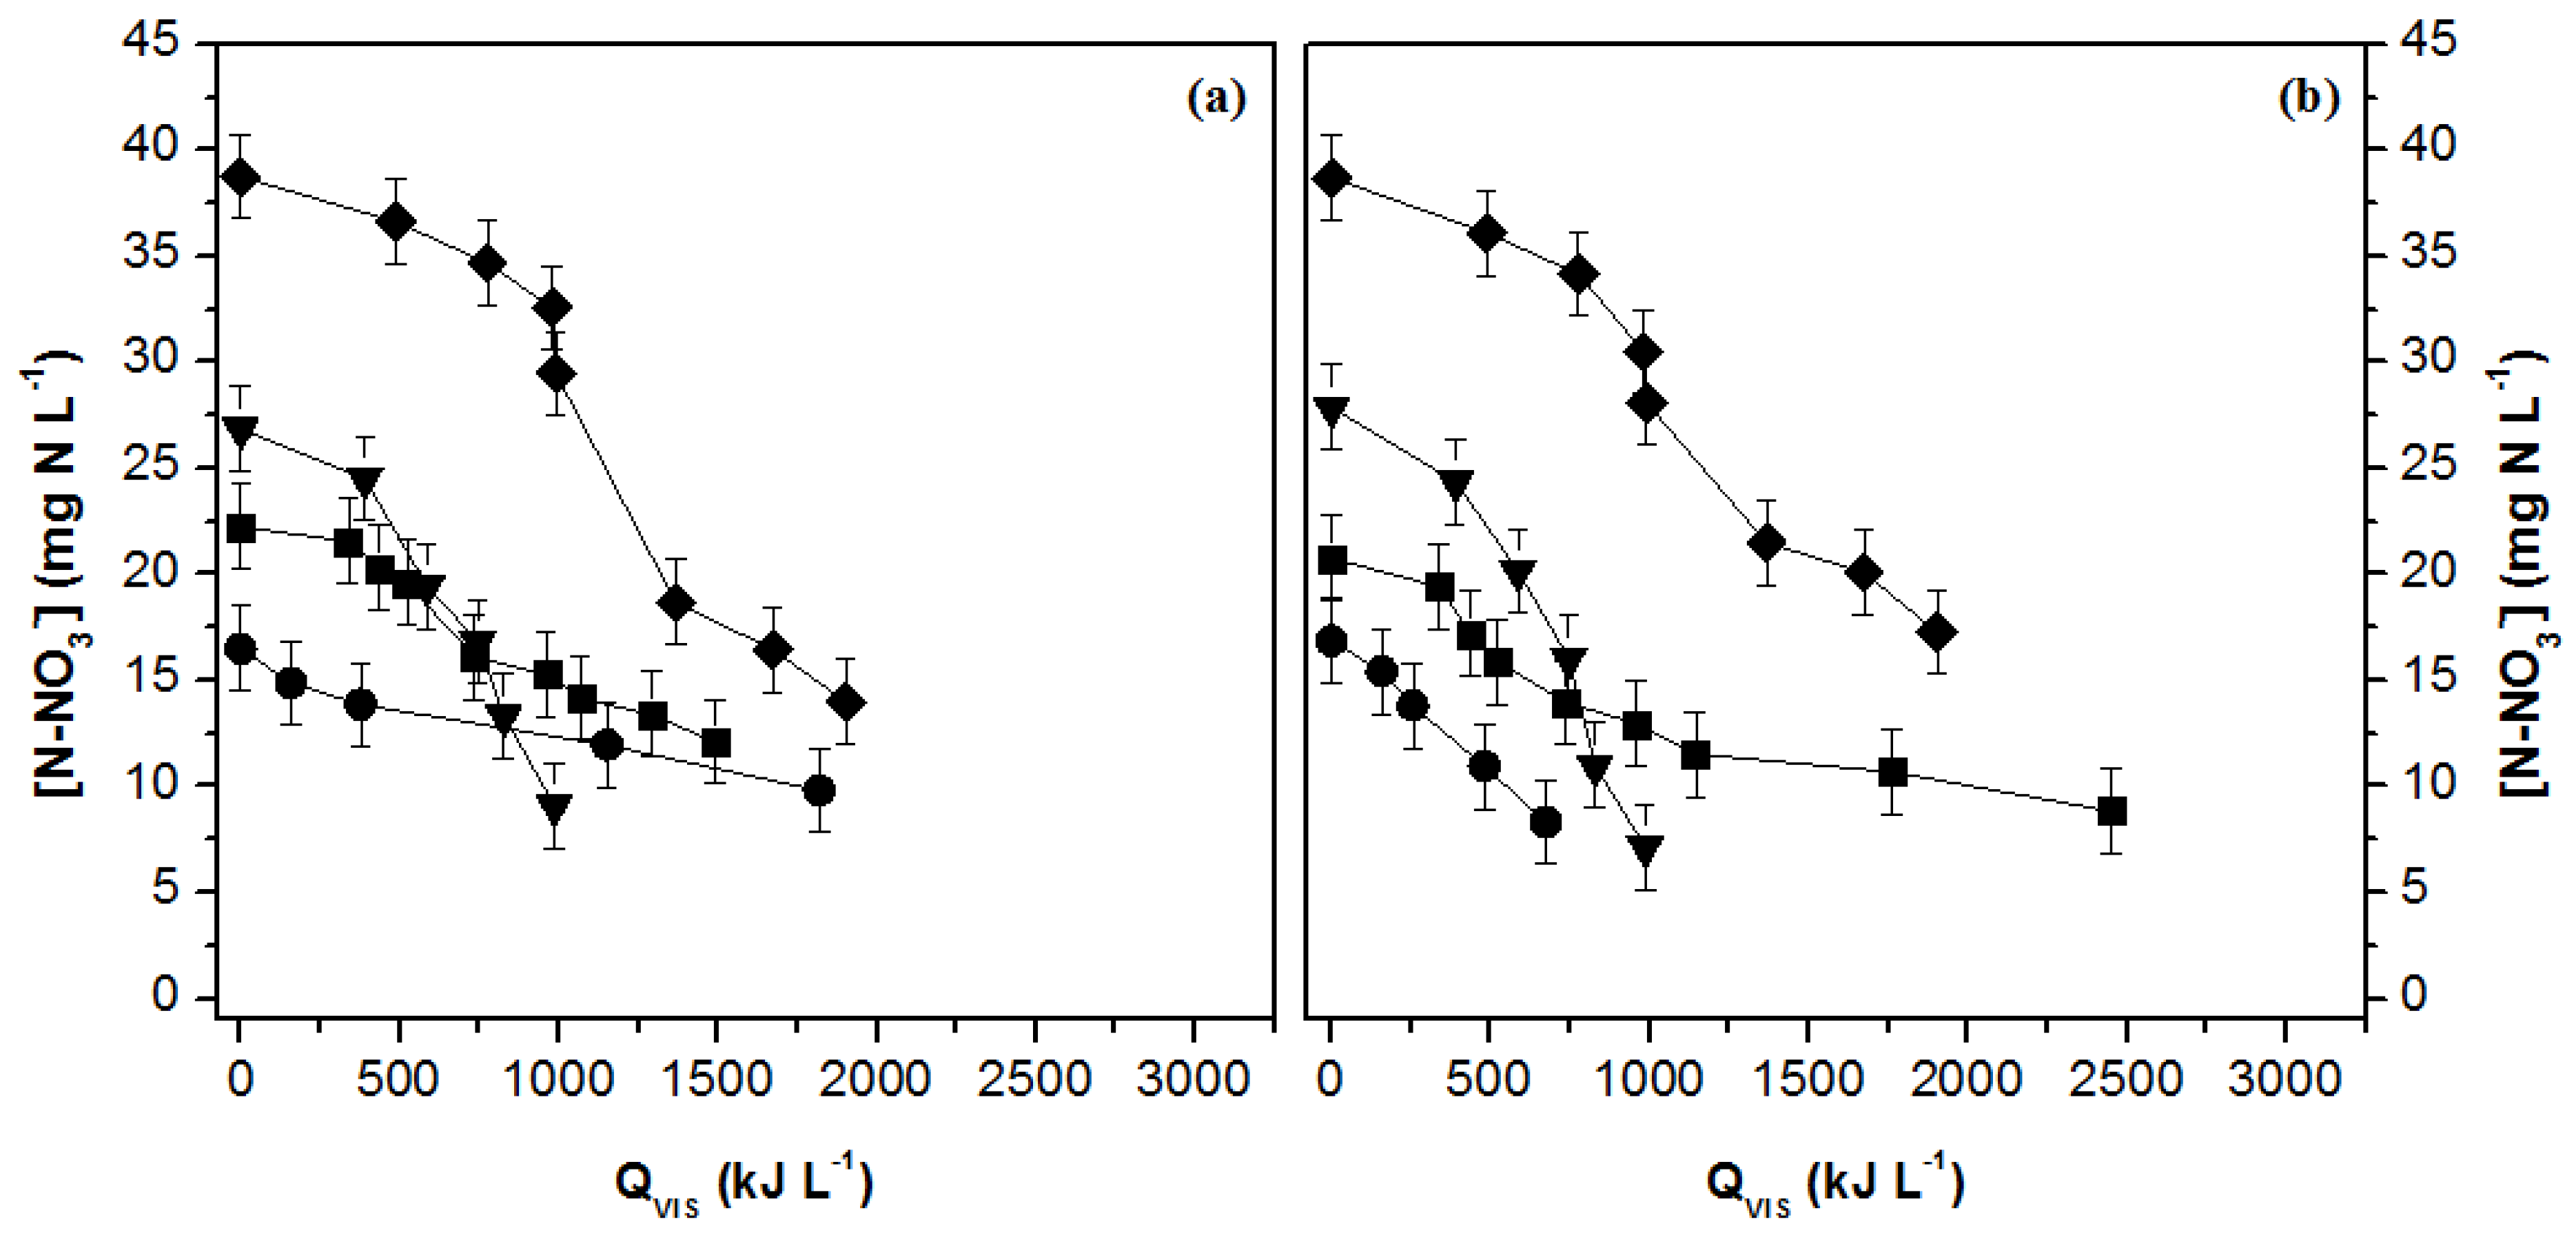
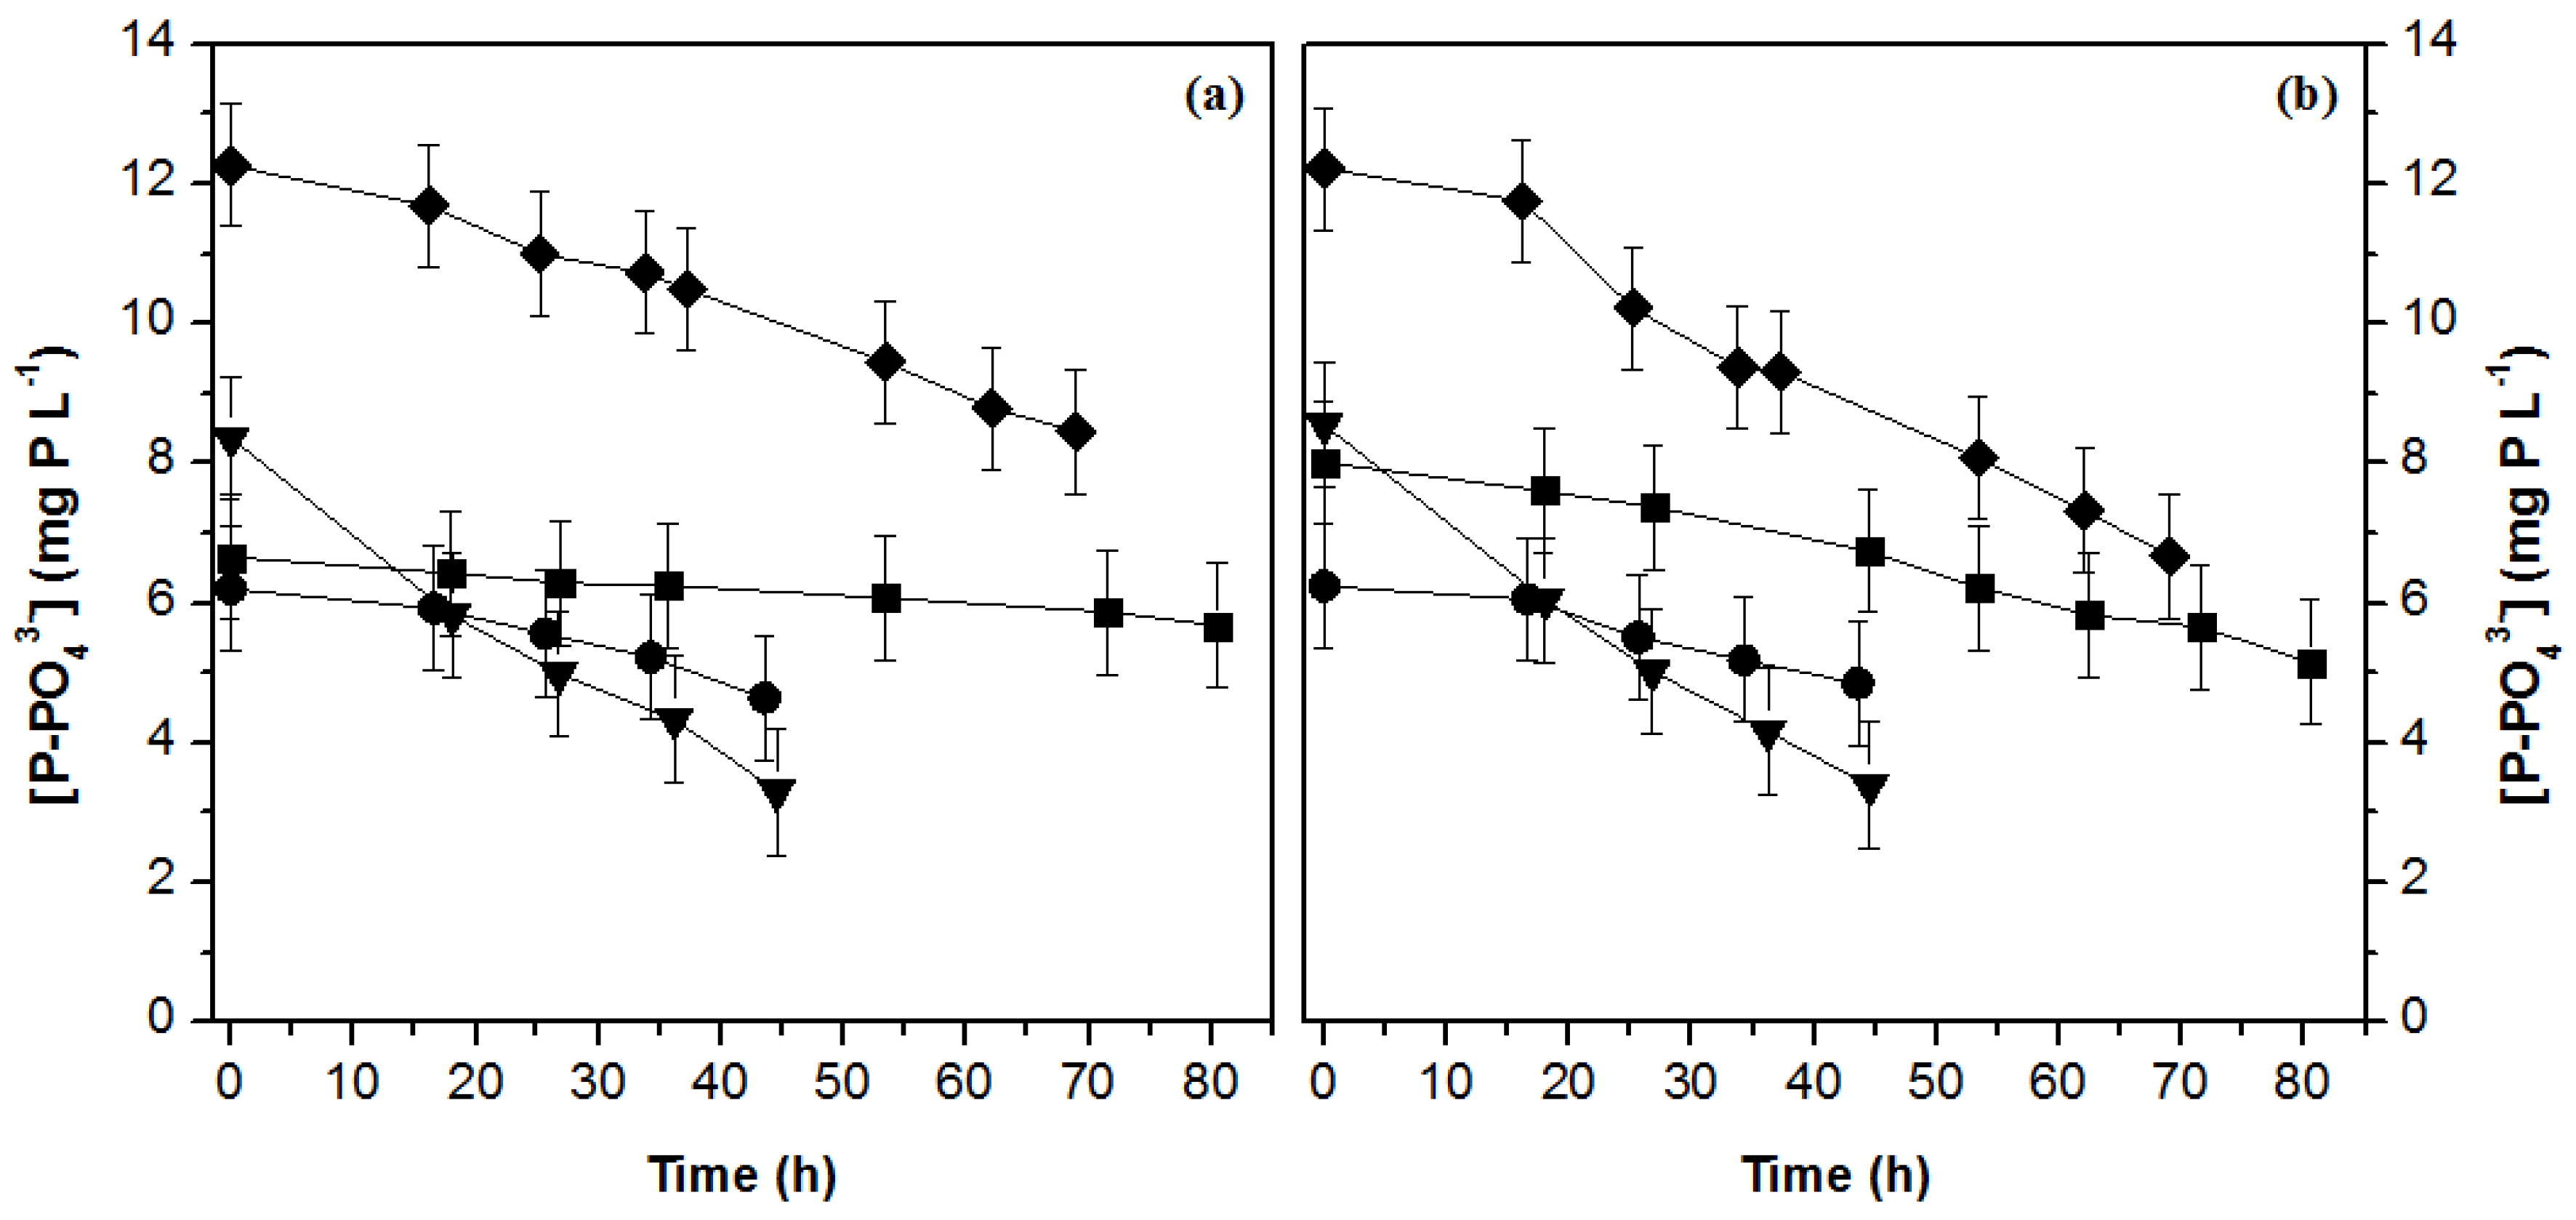
3.2. Nutrient Uptake

This section focuses on the analysis of nitrogen and phosphorus uptake by microalgae. The only source of nitrogen added to the culture medium was KNO3. Temporal variations of the nitrogen concentrations in PBR1 and PBR2 for all assays are shown in Figure 4 (a and b, respectively). In all assays, the N-NO3 concentration decreased with increasing cultivation period, due to its consumption by the microalgae. As the microalgae was not able to uptake all nitrogen added to the culture, microalgal growth was not limited by this nutrient. In the first hours of cultivation, it was possible to verify that nitrogen consumption was relatively low, which was due to the adaptation phase of the microalgae to the new conditions (outdoor conditions). The cultures that showed the best inorganic nitrogen removal efficiencies were the ones of the Assays III and IV, being able to remove, on average, about 19 mg N·L−1 from the medium. This observation was in agreement with the achieved biomass production. Taking into account that there was no significant increase in the concentration of biomass, the nutrient uptake by microalgae should be low. The variation of the nitrogen concentration as a function of the accumulated energy due to visible irradiance in PBR1 and PBR2 is represented in Figure 5a,b, respectively). The Assay III ( I V I S ¯ = 82 W·m−2) achieved better removal efficiencies with less accumulated energy due to visible irradiance (QVIS = 985 kJ·L−1).
Table 3 shows the kinetics and efficiency of nitrogen removal for all assays (environmental conditions experienced by each culture in Tables S3 and S4). Some of the parameters presented are the initial removal rates (r0) and pseudo-first order kinetic constants (k), determined as a function of the cultivation period (kN,t) and the amount of accumulated energy due to visible irradiance (kN,Q). The pseudo-first-order model was able to fit well the nitrates concentration profile over the cultivation period and amount of accumulated energy due to visible irradiance. The kinetic constants (kN,t = (3 ± 1) × 10−2 h−1 and kN,Q = (1.7 ± 0.7) × 10−3 L·kJ−1) confirmed that the Assay III was the one that obtained the best nitrogen removal performance. Additionally, the lowest temporal kinetic constant (kN,t = (1.0 ± 0.2) × 10−2 h−1) corresponds to Assay I. Åkerström et al. [34] evaluated the production of biomass and ammonium and phosphate removal by Chlorella sp. in a sludge liquor, with exposure to solar radiation. The authors obtained nitrogen removal rates ranging from 0.53 to 1.5 mg N·L−1·h−1. Thus, the average removal rates achieved in the present study (0.14 ± 0.02 to 0.51 ± 0.05 mg N·L−1·h−1) were lower than the values obtained by the aforementioned study.
The specific yields of biomass based inorganic nitrogen consumption (YX/N) were determined and are also presented in Table 3, allowing more comparisons with studies in the literature. Juneja [35] evaluated the growth of C. vulgaris in batch reactors under nitrate and carbon dioxide limiting conditions, considering the effect of light and temperature. Under these conditions, the author obtained a specific yield of biomass for the nitrate of 2.86 g/(g N). Compared with the specific yields obtained in the present study (4 ± 2 to (2 ± 1) × 10 g/(g N)), it was possible to verify that these were always higher than the values obtained by the aforementioned author.
Regarding phosphorus, the only source added to the culture medium was inorganic: KH2PO4. The variations of phosphorus concentrations as a function of time in PBR1 and PBR2 are shown in Figure 6 (a and b, respectively). In general, the phosphorus concentration decreased gradually over time. As happened with nitrogen, the microalgal cultures did not uptake all provided phosphorus; there was no limitation regarding this nutrient for all assays. The evolution of phosphorus concentration as a function of the accumulated energy due to visible irradiance in PBR1 and PBR2 is represented in Figure 7a,b, respectively). Table 4 presents the kinetics parameters of phosphorus removal for all assays (environmental conditions experienced by each culture in Tables S5 and S6). The cultures of Assay III had the highest pseudo-first order kinetic constant, achieving the value of kP,t = (2.0 ± 0.1) × 10−2 h−1 and kP,Q = (9.3 ± 0.9) × 10−4 L·kJ−1. By contrast, the lowest pseudo−first order kinetic constant (kP,t = (1.8 ± 0.4) × 10−3 h−1 and kP,Q = (1.0 ± 0.2) × 10−4 L·kJ−1) corresponded to Assay I (PBR1). From the initial removal rates (r0 values), the culture of the Assay III (PBR2) was the one with the highest value (0.17 ± 0.04 mg P·L−1·h−1), even starting with lower nutrient concentrations when compared with Assay IV. On the other hand, the culture of Assay I (PBR1) presented the lower r0 value (0.012 ± 0.004 mg P·L−1·h−1). Åkerström et al. [34] obtained phosphorus removal rates ranging from 0.054 to 0.16 mg P L−1 h−1. Thus, it was concluded that the average removal rates obtained in the present study ((1.1 ± 0.2) × 10−2 to (1.0 ± 0.2) × 10−1 mg P·L−1·h−1) were relatively close to those obtained by the aforementioned authors.
The specific yields of the biomass obtained in terms of inorganic phosphorus (YX/P) are also presented in Table 4. Ruiz et al. [36] evaluated the influence of nitrogen and phosphorus removal in urban wastewater by C. vulgaris, under indoor conditions. The authors added nutrients (NaH2PO4, NH4Cl, and KNO3) to the wastewater to test N/P molar ratios between 1.9 and 318.8. Specific yields of biomass in terms of inorganic phosphorus ranged from 0.04 to 470.57 g/(g P). In the present study, specific biomass yields were obtained between (8 ± 4) and (2.1 ± 0.6) × 102 g/(g P). Thus, it was found that the yields obtained were within the range of values reported by the aforementioned authors, despite the fact that this work was carried out under outdoor conditions.

4. Conclusions

A new configuration of PBR with CPCs that enhances the light distribution in the microalgal culture was successfully applied for outdoor cultivation of the microalga Chlorella vulgaris. In terms of biomass production, the highest specific growth rate was (2.0 ± 0.6) × 10−2 h−1 for average VIS and UV irradiance levels of 143 W·m−2 and 9 W·m−2, respectively. Regarding nutrient removal, higher nitrogen removal kinetics, both as a function of time (initial removal rate of (0.9 ± 0.4) mg N·L−1·h−1) and as a function of the accumulated energy due to visible irradiance ((5 ± 2) × 10−2 mg N·kJ−1), were achieved with an average VIS and UV irradiance of 101 W·m−2 and 6 W·m−2, respectively. Under the same environmental conditions, the initial phosphorus removal rates were 0.17±0.04 mg P·L−1·h−1 and (8 ± 2) × 10−3 mg P·kJ−1. Microalgal growth and nutrient removal showed similar variation as function of VIS and UV radiation; an increase was observed until a certain value (143 WVIS·m−2 and 9 WUV·m−2 for biomass productivity; 101 WVIS·m−2 and 6 WUV·m−2 for nutrient removal) and then photoinhibition may occur, decreasing all kinetic parameters of microalgal culture. Considering the best values of radiation and the spatial distribution of solar irradiance, the application of CPCs may be beneficial for microalgal biomass production in countries with higher latitudes. On the other hand, CPCs can also be applied to induce an environmental stress (high irradiance) to microalgae after achieving a high density culture (in a two-step cultivation), aiming to modify its biochemical composition for the accumulation of metabolites with high commercial value.

Supplementary Materials

The following are available online at https://www.mdpi.com/1996-1073/13/8/1962/s1, Figures S1–S9: Figure S1. Solar spectral irradiance (ASTM G-173-03 AM1.5G reference spectrum) and Duran glass transmittance (Duran technical data). Figure S2. Temporal evolution of UV and Vis irradiance, pH and Temperature in PBR1, throughout Assay I. Figure S3. Temporal evolution of UV and Vis irradiance, pH and Temperature in PBR1, throughout Assay II. Figure S4. Temporal evolution of UV and Vis irradiance, pH and Temperature in PBR1, throughout Assay III. Figure S5. Temporal evolution of UV and Vis irradiance, pH and Temperature in PBR1, throughout Assay IV. Figure S6. Temporal evolution of UV and Vis irradiance, pH and Temperature in PBR2, throughout Assay I. Figure S7. Temporal evolution of UV and Vis irradiance, pH and Temperature in PBR2, throughout Assay II. Figure S8. Temporal evolution of UV and Vis irradiance, pH and Temperature in PBR2, throughout Assay III. Figure S9. Temporal evolution of UV and Vis irradiance, pH and Temperature in PBR2, throughout Assay IV. Tables S1–S5: Table S1. Experimental conditions considered on the determination of the specific growth rates as a function of time (presented in Table 2); Table S2. Experimental conditions considered on the determination of the specific growth rates as a function of accumulated visible energy (presented in Table 2). Table S3. Experimental conditions considered on the determination of the nitrogen kinetic removal parameters as a function of time (presented in Table 3). Table S4. Experimental conditions considered on the determination of the nitrogen kinetic removal parameters as a function of accumulated visible energy (presented in Table 3). Table S5. Experimental conditions considered on the determination of the phosphorus kinetic removal parameters as a function of time (presented in Table 4). Table S6 – Experimental conditions considered on the determination of the phosphorus kinetic removal parameters as a function of accumulated visible energy (presented in Table 4).

Author Contributions

Conceptualization, J.C.M.P. and V.J.P.V.; methodology, J.C.M.P. and V.J.P.V.; formal analysis, A.P.L.; investigation, A.P.L.; resources, V.J.P.V.; writing—original draft preparation, A.P.L.; writing—review and editing, F.M.S., T.F.C.V.S., V.J.P.V., J.C.M.P.; supervision, J.C.M.P. and V.J.P.V.; project administration, J.C.M.P.; funding acquisition, J.C.M.P. and V.J.P.V. All authors have read and agreed to the published version of the manuscript.

Funding

This work was financially supported by: (i) Base Funding - UIDB/00511/2020 of the Laboratory for Process Engineering, Environment, Biotechnology and Energy – LEPABE - funded by national funds through the FCT/MCTES (PIDDAC); (ii) Base Funding - UIDB/50020/2020 of the Associate Laboratory LSRE-LCM - funded by national funds through FCT/MCTES (PIDDAC); and (iii) Project PTDC/BTA-BTA/31736/2017 - POCI-01-0145-FEDER-031736 - funded by FEDER funds through COMPETE2020 - Programa Operacional Competitividade e Internacionalização (POCI) and with the financial support of FCT/MCTES through national funds (PIDDAC). T. Silva and V. Vilar acknowledge the FCT Individual Call to Scientific Employment Stimulus 2017 (CEECIND/01386/2017 and CEECIND/01317/2017, respectively). J.C.M. Pires acknowledges the FCT Investigator 2015 Programme (IF/01341/2015).

Conflicts of Interest

The authors declare no conflict of interest.

Abbreviations

CCAPCulture Collection of Algae and Protozoa
CPCcompound parabolic collector
OD440optical density at 440 nm
OECDOrganization for Economic Co-operation and Development
PBRphotobioreactor
PSIIphotosystem II
UPuncovered period
UVultraviolet
UVAultraviolet A
UVBultraviolet B
VISvisible

Nomenclature

I U V ¯ average ultraviolet irradiance
I V I S , e ¯ average visible solar irradiance in the exponential growth phase
I V I S ¯ average visible solar irradiance
Ararea of the illuminated surface
IUVultraviolet irradiance
IVISvisible irradiance
IVIS, rangerange of visible irradiance
kpseudo-first-order kinetic constant
kS,tpseudo-first-order kinetic constant as function of accumulated energy due to visible irradiance
kS,tpseudo-first-order kinetic constant as function of time
Px,avaverage biomass productivities
QVISaccumulated energy due to visible irradiance
r0initial removal rate
R2coefficient of determination
RRavaverage nutrients removal rate
Snutrients concentration
S2Rresidual variance
ttime
t0initial time
tccultivation period
Vvolume of the photobioreactor
Xbiomass concentration in dry weight
X0biomass concentration at the initial time
YX/Sspecific biomass yields based on nutrient consumption
Δtitime interval
δμstandard error
μQspecific growth rate as function of accumulated energy due to visible irradiance
μtspecific growth rate as function of time

References

  1. Pereira, S.E.L.; Goncalves, A.L.; Moreira, F.C.; Silva, T.F.C.V.; Vilar, V.J.P.; Pires, J.C.M. Nitrogen removal from landfill leachate by microalgae. Int. J. Mol. Sci. 2016, 17, 1629. [Google Scholar] [CrossRef] [PubMed] [Green Version]
  2. Pires, J.C.M.; Alvim-Ferraz, M.C.M.; Martins, F.G.; Simoes, M. Carbon dioxide capture from flue gases using microalgae: Engineering aspects and biorefinery concept. Renew. Sust. Energy Rev. 2012, 16, 3043–3053. [Google Scholar] [CrossRef]
  3. Silva, N.F.P.; Goncalves, A.L.; Moreira, F.C.; Silva, T.F.C.V.; Martins, F.G.; Alvim-Ferraz, M.C.M.; Boaventura, R.A.R.; Vilar, V.J.P.; Pires, J.C.M. Towards sustainable microalgal biomass production by phycoremediation of a synthetic wastewater: A kinetic study. Algal Res. 2015, 11, 350–358. [Google Scholar] [CrossRef] [Green Version]
  4. Posten, C. Design principles of photo-bioreactors for cultivation of microalgae. Eng. Life Sci. 2009, 9, 165–177. [Google Scholar] [CrossRef]
  5. Slegers, P.M.; Wijffels, R.H.; van Straten, G.; van Boxtel, A.J.B. Design scenarios for flat panel photobioreactors. Appl. Energy 2011, 88, 3342–3353. [Google Scholar] [CrossRef]
  6. Brunelle, T.; Dumas, P.; Souty, F.; Dorin, B.; Nadaud, F. Evaluating the impact of rising fertilizer prices on crop yields. Agric. Econ. 2015, 46, 653–666. [Google Scholar] [CrossRef]
  7. Zheng, H.; Liu, M.; Lu, Q.; Wu, X.; Ma, Y.; Cheng, Y.; Addy, M.; Liu, Y.; Ruan, R. Balancing carbon/nitrogen ratio to improve nutrients removal and algal biomass production in piggery and brewery wastewaters. Bioresour. Technol. 2018, 249, 479–486. [Google Scholar] [CrossRef]
  8. Cai, T.; Park, S.Y.; Li, Y.B. Nutrient recovery from wastewater streams by microalgae: Status and prospects. Renew. Sust. Energy Rev. 2013, 19, 360–369. [Google Scholar] [CrossRef]
  9. Posadas, E.; Alcántara, C.; García-Encina, P.A.; Gouveia, L.; Guieysse, B.; Norvill, Z.; Acién, F.G.; Markou, G.; Congestri, R.; Koreiviene, J.; et al. 3—microalgae cultivation in wastewater. In Microalgae-based Biofuels and Bioproducts; Gonzalez-Fernandez, C., Muñoz, R., Eds.; Woodhead Publishing: Lincolnshire, IL, USA, 2017; pp. 67–91. [Google Scholar]
  10. Muñoz, R.; Guieysse, B. Algal–bacterial processes for the treatment of hazardous contaminants: A review. Water Res. 2006, 40, 2799–2815. [Google Scholar] [CrossRef] [PubMed]
  11. Pires, J.; Alvim-Ferraz, M.; Martins, F.; Simoes, M. Wastewater treatment to enhance the economic viability of microalgae culture. Environ. Sci. Pollut. Res. 2013, 20, 5096–5105. [Google Scholar] [CrossRef]
  12. Goncalves, A.L.; Pires, J.C.M.; Simoes, M. A review on the use of microalgal consortia for wastewater treatment. Algal Res. 2017, 24, 403–415. [Google Scholar] [CrossRef]
  13. Lopez-Serna, R.; Garcia, D.; Bolado, S.; Jimenez, J.J.; Lai, F.Y.; Golovko, O.; Gago-Ferrero, P.; Ahrens, L.; Wiberg, K.; Munoz, R. Photobioreactors based on microalgae-bacteria and purple phototrophic bacteria consortia: A promising technology to reduce the load of veterinary drugs from piggery wastewater. Sci. Total Environ. 2019, 692, 259–266. [Google Scholar] [CrossRef] [PubMed]
  14. Rattanapoltee, P.; Kaewkannetra, P. Cultivation of microalga, chlorella vulgaris under different auto–hetero–mixo trophic growths as a raw material during biodiesel production and cost evaluation. Energy 2014, 78, 4–8. [Google Scholar] [CrossRef]
  15. Evans, L.; Hennige, S.J.; Willoughby, N.; Adeloye, A.J.; Skroblin, M.; Gutierrez, T. Effect of organic carbon enrichment on the treatment efficiency of primary settled wastewater by chlorella vulgaris. Algal Res. 2017, 24, 368–377. [Google Scholar] [CrossRef]
  16. Garcia, D.; Posadas, E.; Grajeda, C.; Blanco, S.; Martinez-Paramo, S.; Acien, G.; Garcia-Encina, P.; Bolado, S.; Munoz, R. Comparative evaluation of piggery wastewater treatment in algal-bacterial photobioreactors under indoor and outdoor conditions. Bioresour. Technol. 2017, 245, 483–490. [Google Scholar] [CrossRef] [PubMed]
  17. Gonçalves, A.L.; Pires, J.C.M.; Simoes, M. Wastewater polishing by consortia of chlorella vulgaris and activated sludge native bacteria. J. Clean Prod. 2016, 133, 348–357. [Google Scholar] [CrossRef]
  18. Filali, R.; Tebbani, S.; Dumur, D.; Isambert, A.; Pareau, D.; Lopes, F. Growth modeling of the green microalga chlorella vulgaris in an air-lift photobioreactor. IFAC Proc. Vol. 2011, 44, 10603–10608. [Google Scholar] [CrossRef] [Green Version]
  19. Guo, Z.; Phooi, W.B.A.; Lim, Z.J.; Tong, Y.W. Control of co2 input conditions during outdoor culture of chlorella vulgaris in bubble column photobioreactors. Bioresour. Technol. 2015, 186, 238–245. [Google Scholar] [CrossRef]
  20. Lam, M.K.; Lee, K.T. Cultivation of chlorella vulgaris in a pilot-scale sequential-baffled column photobioreactor for biomass and biodiesel production. Energy Convers. Manag. 2014, 88, 399–410. [Google Scholar] [CrossRef]
  21. Bosma, R.; de Vree, J.H.; Slegers, P.M.; Janssen, M.; Wijffels, R.H.; Barbosa, M.J. Design and construction of the microalgal pilot facility algaeparc. Algal Res. 2014, 6, 160–169. [Google Scholar] [CrossRef]
  22. OCDE. Test no. 201: Freshwater Alga and Cyanobacteria, Growth Inhibition Test, Ocde Guidelines for the Testing of Chemicals; OCDE Publishing: Paris, France, 2011. [Google Scholar]
  23. Blanco, J.; Malato, S.; Fernandez, P.; Vidal, A.; Morales, A.; Trincado, P.; Oliveira, J.C.; Minero, C.; Musci, M.; Casalle, C.; et al. Compound parabolic concentrator technology development to commercial solar detoxification applications. Sol. Energy 1999, 67, 317–330. [Google Scholar] [CrossRef]
  24. Gomes, A.I.; Silva, T.F.C.V.; Duarte, M.A.; Boaventura, R.A.R.; Vilar, V.J.P. Cost-effective solar collector to promote photo-fenton reactions: A case study on the treatment of urban mature leachate. J. Clean Prod. 2018, 199, 369–382. [Google Scholar] [CrossRef]
  25. Gonçalves, A.L.; Pires, J.C.M.; Simoes, M. The effects of light and temperature on microalgal growth and nutrient removal: An experimental and mathematical approach. Rsc Adv. 2016, 6, 22896–22907. [Google Scholar] [CrossRef] [Green Version]
  26. Myers, J.A.; Curtis, B.S.; Curtis, W.R. Improving accuracy of cell and chromophore concentration measurements using optical density. Bmc Biophys. 2013, 6, 4. [Google Scholar] [CrossRef] [Green Version]
  27. Bunker, P.R.; Mills, I.M.; Jensen, P. The planck constant and its units. J. Quant. Spectrosc. Radiat. Transf. 2019, 237, 106594. [Google Scholar] [CrossRef]
  28. ASTM. Standard Tables for Reference Solar Spectral Irradiances: Direct Normal and Hemispherical on 37° Tilted Surface; ASTM: West Conshohocken, PA, USA, 2003. [Google Scholar]
  29. Wang, M.; Kuo-Dahab, W.C.; Dolan, S.; Park, C. Kinetics of nutrient removal and expression of extracellular polymeric substances of the microalgae, chlorella sp. And micractinium sp., in wastewater treatment. Bioresour. Technol. 2014, 154, 131–137. [Google Scholar] [CrossRef]
  30. Jiang, H.B.; Qiu, B.S. Inhibition of photosynthesis by uv-b exposure and its repair in the bloom-forming cyanobacterium microcystis aeruginosa. J. Appl. Phycol. 2011, 23, 691–696. [Google Scholar] [CrossRef]
  31. Beardall, J.; Heraud, P.; Roberts, S.; Shelly, K.; Stojkovic, S. Effects of uv-b radiation on inorganic carbon acquisition by the marine microalga dunaliella tertiolecta (chlorophyceae). Phycologia 2002, 41, 268–272. [Google Scholar] [CrossRef]
  32. Babu, G.S.; Joshi, P.C.; Viswanathan, P.N. Uvb-induced reduction in biomass and overall productivity of cyanobacteria. Biochem. Biophs. Res. Commun. 1998, 244, 138–142. [Google Scholar] [CrossRef]
  33. Wong, C.Y.; Teoh, M.L.; Phang, S.-M.; Chu, W.-L. Effects of ultraviolet radiation (uvr) on the tropical microalgae chlorella vulgaris. Malays. J. Sci. 2011, 30, 3–15. [Google Scholar]
  34. Åkerström, A.M.; Mortensen, L.M.; Rusten, B.; Gislerød, H.R. Biomass production and removal of ammonium and phosphate by chlorella sp. In sludge liquor at natural light and different levels of temperature control. SpringerPlus 2016, 5, 676. [Google Scholar] [CrossRef] [PubMed] [Green Version]
  35. Juneja, A. Model Predictive Control for Optimum Algal Growth; Oregon State University: Corvallis, OR, USA, 2015. [Google Scholar]
  36. Ruiz, J.; Álvarez, P.; Arbib, Z.; Garrido, C.; Barragán, J.; Perales, J.A. Effect of nitrogen and phosphorus concentration on their removal kinetic in treated urban wastewater by chlorella vulgaris. Int. J. Phytoremediation 2011, 13, 884–896. [Google Scholar] [CrossRef] [PubMed]
Figure 1. Tubular photobioreactor with compound parabolic collectors (CPCs): (a) image of the inoculated culture; (b) scheme of the fluid flow configuration (in series, serpentine flow); (c) orientation in relation to the sun; (d) front view of CPCs; (e) ray-trace analysis with CPCs, considering an incident angle of 90˚.
Energies 13 01962 g001
Figure 2. Temporal variation of biomass dry weight concentration (X) in photobioreactors (PBR1) (a) and PBR2 (b) for all assays: I—■; II—●; III—▼; IV—♦. Error bars correspond to the standard deviation of the mean determined for duplicates from two independent experiments.
Energies 13 01962 g002
Figure 3. Variation of biomass dry weight concentration (X) as a function of the accumulated visible energy (QVIS) in PBR1 (a) and PBR2 (b) for all assays: I—■; II—●; III—▼; IV—♦. Error bars correspond to the standard deviation of the mean determined for duplicates from two independent experiments.
Energies 13 01962 g003
Figure 4. Temporal variation of nitrogen concentration (N-NO3) in PBR1 (a) and PBR2 (b) for all assays: I—■; II—●; III—▼; IV—♦. Error bars correspond to the standard deviation of the mean determined for duplicates from two independent experiments.
Energies 13 01962 g004
Figure 5. Variation of nitrogen concentration (N-NO3) as a function of the accumulated visible energy (QVIS) in PBR1 (a) and PBR2 (b) for all assays: I—■; II—●; III—▼; IV—♦. Error bars correspond to the standard deviation of the mean determined for duplicates from two independent experiments.
Energies 13 01962 g005
Figure 6. Temporal variation of phosphorus concentration (P-PO43−) in PBR1 (a) and PBR2 (b) for all assays: I—■; II – ●; III—▼; IV—♦. Error bars correspond to the standard deviation of the mean determined for duplicates from two independent experiments.
Energies 13 01962 g006
Figure 7. Variation of phosphorus concentration (P-PO43−) as a function of the accumulated visible energy (QVIS) in PBR1 (a) and PBR2 (b) for all assays: I—■; II—●; III—▼; IV—♦. Error bars correspond to the standard deviation of the mean determined for duplicates from two independent experiments.
Energies 13 01962 g007
Table 1. Experimental conditions for each assay.
AssayPBRUP (h)Xi
(g·L−1)
[N-NO3-]i
(mg N·L−1)
[P-PO43-]i
(mg P·L−1)
I V I S ¯
(W·m−2)
I U V ¯
(W·m−2)
tc
(h)
I100.1922.26.798781
2150.2020.88.016211
II1220.3316.56.22211544
200.3116.96.1826
III100.3326.98.4101652
200.3327.98.61016
IV100.3138.712.3143969
200.3138.712.21439
PBR—photobioreactor; UP—Uncovered period (culture exposure to 100% of solar radiation intensity); Xi—initial concentration of biomass; [N-NO3]i—initial concentration of nitrate; [P-PO43−]i—initial concentration of phosphate; I V I S ¯ average visible irradiance; I U V ¯   —average ultraviolet (UV) irradiance; tc—cultivation period.
Table 2. Productivities and specific growth rates for each assay.
AssayPBRPX,av
(g·L−1·h−1)
µt
(h−1)
R2tS2R
(g2·L−2)
µQ (L·kJ−1)R2QS2R
(g2·L−2)
I1(2.3 ± 0.6) × 10−3(1.2 ± 0.1) × 10−20.9673.1 × 10−4(7.4 ± 0.4) × 10−40.9834.1 × 10−5
2(2.9 ± 0.8) × 10−3(1.6 ± 0.1) × 10−20.9814.1 × 10−4(9.7 ± 0.6) × 10−40.9791.1 × 10−4
II1(3 ± 1) × 10−3(1.1 ± 0.3) × 10−21.0009.9 × 10−7(4.8 ± 0.4) × 10−40.9964.2 × 10−6
2(4 ± 2) × 10−3(1.5 ± 0.7) × 10−20.9997.5 × 10−6(7 ± 1) × 10−40.9641.2 × 10−4
III1(4 ± 1) × 10−3(1.4 ± 0.3) × 10−20.9963.7 × 10−5(8 ± 4) × 10−40.9621.6 × 10−4
2(4 ± 1) × 10−3(1.2 ± 0.2) × 10−20.9881.5 × 10−4(7 ± 2) × 10−40.9561.8 × 10−4
IV1(5 ± 1) × 10−3(2.0 ± 0.6) × 10−20.9921.3 × 10−4(7 ± 1) × 10−40.9995.9 × 10−6
2(5 ± 1) × 10−3(1.8 ± 0.7) × 10−20.9871.9 × 10−4(6 ± 2) × 10−40.9981.7 × 10−5
PBR—photobioreactor; PX,av—average biomass productivity; µ—specific growth rate as a function of time (t) and accumulated visible radiation (QVIS); R2—coefficient of determination; S2R—residual variance.
Table 3. Nitrogen removal kinetic parameters for all assays.
AssayPBRKinetic Parameters[N-NO3]f
(mg N L−1)
RRav
(mg N L−1 h-1)
YX/N
(g/(g N))
TimeEnergy
kN,t
(h−1)
R2S2R
(mg2 L−2)
r0,N,t
(mg N L−1 h−1)
kN,Q
(L·kJ−1)
R2S2R
(mg2 L−2)
r0,N,Q
(mg N kJ−1)
I1(1.0 ± 0.2) × 10−20.974.0 × 10−10.21 ± 0.04(5.2 ± 0.7) × 10−40.973.6 × 10−1(1.1 ± 0.2) × 10−212.10.14 ± 0.03(1.7 ± 0.5) × 10
2(1.2 ± 0.1) × 10−20.998.8 × 10−20.24 ± 0.02(4 ± 1) × 10−40.901.5(8 ± 2) × 10−38.80.15 ± 0.01(1.9 ± 0.6) × 10
II1(1.5 ± 0.9) × 10−20.963.1 × 10−10.2 ± 0.1(2.4 ± 0.5) × 10−40.996.7 × 10−2(3.9 ± 0.9) × 10−39.80.15 ± 0.06(2 ± 1) × 10
2(2 ± 1) × 10−20.965.4 × 10−10.4 ± 0.2(1.2 ± 0.2) × 10−31.006.6 × 10−2(2.0 ± 0.3) × 10−28.30.2 ± 0.1(2 ± 1) × 10
III1(2.5 ± 0.9) × 10−20.971.40.7 ± 0.2(1.4 ± 0.4) × 10−30.962.0(4 ± 1) × 10−29.10.43 ± 0.099 ± 3
2(3 ± 1) × 10−20.962.40.9 ± 0.4(1.7 ± 0.7) × 10−30.925.0(5 ± 2) × 10−27.20.51 ± 0.058 ± 2
IV1(1.8 ± 0.3) × 10−20.946.80.7 ± 0.2(7 ± 2) × 10−40.919.0(2.7 ± 0.8) × 10−214.00.47 ± 0.09(1.1 ± 0.3) × 10
2(1.4 ± 0.2) × 10−20.981.10.54 ± 0.09(5 ± 1) × 10−40.962.6(2.1 ± 0.4) × 10−217.30.37 ± 0.05(1.4 ± 0.3) × 10
PBR—photobioreactor; k—pseudo-first order kinetic constants for nitrogen removal as function of time (t) and accumulated energy due to visible irradiance (Q); R2—coefficient of determination; S2R—residual variance; r0 – nitrogen (N) initial removal rate as function of time (t) and accumulated energy due to visible irradiance (Q); [N-NO3]f - final concentration of nitrate; RRav—average removal efficiency; YX/N—biomass yield on nitrogen consumption.
Table 4. Phosphorus removal kinetic parameters for all assays.
AssayPBRKinetic Parameters[P-PO43−]f
(mg P L−1)
RRav
(mg P L−1 h−1)
YX/P
(g/(g P))
TimeEnergy
kP,t
(h−1)
R2S2R
(mg2 L−2)
r0,P,t
(mg P L−1 h−1)
kP,Q
(L·kJ−1)
R2S2R
(mg2 L−2)
r0,P,Q
(mg P kJ−1)
I1(1.8 ± 0.4) × 10−30.982.5 × 10−30.012 ± 0.004(1.0 ± 0.2) × 10−40.972.7 × 10−3(6 ± 2) × 10−45.7(1.1 ± 0.2) × 10−2(2.1 ± 0.6) × 102
2(6.1 ± 0.9) × 10−30.981.5 × 10−20.05 ± 0.01(3.3 ± 0.2) × 10−41.001.2 × 10−3(2.6 ± 0.5) × 10−35.2(3.6 ± 0.5) × 10−2(8 ± 2) × 10
II1(9 ± 4) × 10−30.981.1 × 10−20.05 ± 0.03(1.3 ± 0.5) × 10−40.971.5 × 10−2(8 ± 4) × 10−44.6(4 ± 2) × 10−2(8 ± 5) × 10
2(8 ± 3) × 10−30.994.3 × 10−30.05 ± 0.03(4 ± 1) × 10−40.961.9 × 10−2(2.4 ± 0.9) × 10−34.8(3 ± 2) × 10−2(1.1 ± 0.7) × 102
III1(2.0 ± 0.3) × 10−20.992.9 × 10−20.16 ± 0.04(8.9 ± 0.5) × 10−41.003.2 × 10−3(7 ± 2) × 10−33.3(9 ± 3) × 10−2(4 ± 2) × 10
2(2.0 ± 0.1) × 10−21.006.7 × 10−30.17 ± 0.04(9.3 ± 0.9) × 10−41.001.2 × 10−2(8 ± 2) × 10−33.4(1.0 ± 0.2) × 10−1(4 ± 1) × 10
IV1(6.1 ± 0.7) × 10−30.991.9 × 10−20.07 ± 0.01(2.4 ± 0.2) × 10−40.991.9 × 10−2(2.9 ± 0.4) × 10−38.6(6.1 ± 0.5) × 10−2(9 ± 2) × 10
2(1.0 ± 0.1) × 10−20.995.0 × 10−20.12 ± 0.02(4.0 ± 0.3) × 10−40.992.2 × 10−2(4.9 ± 0.6) × 10−35.5(9 ± 2) × 10−2(6 ± 2) × 10
PBR—photobioreactor; k—pseudo-first order kinetic constants for phosphorous removal as function of time (t) and accumulated energy due to visible irradiance (Q); R2—coefficient of determination; S2R—residual variance; r0—phosphorus (P) initial removal rate as function of time (t) and accumulated energy due to visible irradiance (Q); [P-PO43−]f —final concentration of phosphorus; RRav—average removal efficiency; YX/N—biomass yield on phosphorus consumption.

