1. Introduction
Electric power systems are subjected to different overvoltage levels, whether temporary, sustained, or arising from switching and lightning discharges. The overvoltages caused by lightning discharges have high magnitudes (high associated power), but a short duration (low associated energy), and usually cause unscheduled shutdowns in distribution networks due to the low insulation levels these networks possess. According to [
1], direct lightning discharges on distribution feeders generate overvoltages above 2 MV, causing immediate shutdowns due to the insulation failure of equipment sized to withstand voltages of around 150 kV and 300 kV, for example for rated voltages of 13.8 kV and 34.5 kV, respectively [
2].
The methods of protecting electric distribution networks against lightning discharges are essentially based on three criteria [
3], which are: the increased insulation level of the equipment; the use of shielding cables [
4,
5]; and the use of lightning arresters, the last two being the most used in most cases [
6]. In an ideal scenario, the combined solution of the three protection procedures such as the use of effectively grounded shielding conductors throughout the electric network extension, an increased insulation class of insulators, and insertion of lightning arresters at all distribution grid poles theoretically would protect the network from disruptive effects caused by overvoltages of atmospheric origin.
This procedure would make the electric network project unfeasible due to the high costs of purchasing and installing lightning arresters, insulators, and cables in view of the electric grid extension, number of poles, and complexity of these electric networks. However, given the economic infeasibility of this solution and seeking an optimal point of using these measures, several technical papers have addressed the problem associated with lightning discharges in distribution networks, either in the optimization process for determining the best location for the insertion of lightning arresters [
7,
8,
9] in addition to disruptive tests in high voltage laboratories [
10] or computational simulations that consider the statistical nature of the incidence of lightning discharges [
11,
12].
There are several approaches to improving the distribution grid performance under lightning discharges, either through the use of direct and indirect discharges or even using non-standard waveforms. In most of the work already developed for distribution Medium Voltage (MV) electric networks, overvoltages induced by indirect discharges are used due to the voltage class of these feeders being lower compared to the voltage class of transmission networks [
13,
14].
For this type of approach, a parameter called the risk of flashover is defined, which measures the likelihood of disruptive discharge in a given electric distribution network insulator under analysis [
13,
15], and this parameter can be optimized. The risk of flashover depends on random data of induced overvoltages caused by indirect discharges that affect the feeder under study from a certain distance, which are raised through the Monte Carlo procedure as presented in the technical norm [
1].
In this process, there is usually a random variation of the parameters of the lightning discharge used, such as rising time, settling time, peak value, as well as a variation of the discharge incidence point, different values of induced overvoltages being obtained by varying these parameters, as presented in [
16]. The induced overvoltages in the distribution network are obtained through the coupled Agrawal line model, initially proposed in 1980 [
17], and it was also implemented later in several other works such as [
18]. The Monte Carlo procedure is implemented in some already consolidated programming languages and requires electromagnetic transient simulation software for network modeling to generate the results of feeder-induced overvoltages, ATP (Alternative Transient Program) being the most used software for this purpose and recommended by the ONS (Brazilian National Operator of the Interconnected Electrical System) [
19].
Among the studies already developed in the literature, it is observed that the risk of flashover is the main analysis parameter for cases involving indirect discharges, which is the most used parameter for the process of optimizing the location of a minimum quantity of lightning arresters. However, the insulator modeling is not considered in the simulations, taking into account only the induced overvoltage magnitudes, the same way as the Monte Carlo method.
Optimization processes typically consider the CFO (Critical Flashover Overvoltage) parameter associated with the insulators used in distribution networks as a problem restriction, that is if induced overvoltages exceed this value, it is considered that a flashover has occurred. However, modeling the electric arc physical effect caused by flashover is very important to evaluate the real effects of lightning discharges, as presented in [
20,
21] for insulators subjected to pollution.
This paper presents a criticality analysis procedure applied to distribution feeders, based on a methodology called Direct Discharge Crossing (DDC). The DDC methodology performs a sensitivity analysis by exhaustive application of direct lightning discharges and through criticality factors that will be defined. The importance of the proposed methodology is evident when considering distribution networks with a significant number of poles. In this case, the approach by Monte Carlo [
7,
8] or genetic algorithm [
7,
9] can become computationally unfeasible due to the large amount of necessary simulations. The criticality analyses proposed in this article take into account technical factors and flashover occurrence through the modeling of the electric network components, as well as lightning discharges’ incidence at all poles. Transient simulations are performed through the ATP software, and an IEEE test distribution network is used for the methodology’s presentation and validation.
2. Proposed Methodology
The proposed methodology was based on the application of direct lightning discharges of equal magnitudes, one at a time, at all poles of a distribution feeder modeled through ATP software and was named as Direct Discharge Crossing (DDC). The methodology aimed to determine the sensitivity of the distribution network due to direct lightning discharges based on the analysis of two criticalities: the first one based on the average of maximum overvoltage; and the second one based on the number of flashover occurrences. The proposed methodology aimed to minimize problems related to the protection of equipment connected to the electrical network against lightning discharges. As a consequence, there was an improvement in the insulation coordination and a reduction of interruptions in energy supply to customers. For the analysis, the feeder may have single-phase, two-phase, and three-phase sections, as is typical in low voltage distribution feeders.
The general flowchart of the methodology’s application is presented in
Figure 1.
The methodology started from the definition of a base topology for the distribution network, which should be modeled through the ATP software (version 5.9p4 for Windows) to create the input file required to run the transient simulation. The input data were defined as the electrical system data such as poles, branches, transformers, capacitor banks, and surge arresters. The ATP input file could be prepared using the ATPdraw graphical interface or using an automatic ATP card generator, as the one proposed in [
22]. For an operator, the base case could be understood as a newly designed distribution network in accordance with the utility’s standards, in which it was desired to evaluate its protection through computational simulations to improve its performance before its implantation. In addition, the base case may be a distribution feeder already in operation, for which it was desired to check its operational performance.
With the base case defined, the process started by applying the DDC methodology with the application of direct lightning discharges in all electric nodes, generating a history of overvoltages and flashover occurrences for each lightning application. This phase is indicated in the diagram as the simulation module.
The lightning discharge parameters used in this article were the mean values based on measurements, recommended by [
1,
23], according to the characteristics presented in
Table 1. However, other values may be used according to the analysis objective.
After applying the discharges, two criticality parameters were defined: Criticality based on the average of maximum Overvoltages (
); and Criticality based on the number of Flashovers (
), as will be detailed in the following sections. With the two parameters defined, a function called the “feeder lightning performance function” (
D) was then defined to relate the two criteria in order to provide a parameter for the analysis of distribution network protection. After calculating the
D function for each pole of the feeder, a graph of (
D × pole) was plotted, and then, the areas of greater criticality of the network were presented as the maximum values of D for each pole. With the identification of poles having greater criticality, a mitigating strategy was then applied, being the use of a specific number of lightning arresters depending on the quantity the utility has available to install in the feeder. The lightning arresters would then be allocated at poles that presented the highest vulnerability indicated by the
D function as described in
Section 2.4. After surge arresters’ allocation, the case was then called the “corrected base case”, and the DDC methodology for calculating the
D function was applied again, so as to identify the network degree of improvement after the mitigation strategy. The concepts associated with this methodology are presented in the following.
2.1. Development of Equipment Models for Transient Studies
The electric distribution network considered in this study would have three different pole models, which is typical in distribution utility networks in Brazil. The models adopted were called P1, P2, and P3 and are shown in
Figure 2,
Figure 3, and
Figure 4, respectively.
It is noted that all poles were grounded, either through the transformers’ and capacitor banks’ grounding meshes with surge arresters or through the tower’s surge impedance. For the results presented by the DDC to be reliable and compatible with reality, it was necessary that the ground resistivity conditions of the feeder location were known.
For studying transient phenomena related to lightning discharges, it was necessary that the equipment in the different pole types be correctly modeled so that the results would offer good representativeness of a real network. In the case of lightning discharges, the modeling should be compatible with the propagating wave format, that is it should have good accuracy for higher frequency ranges of the order of some hundreds of kHz to some units of MHz [
24].
Usually, the main equipment that made up the distribution network poles presented in the pole types P1, P2, and P3 were: distribution transformer, surge arresters, insulators, grounding mesh, loads, cables, and others, all of which could be represented through their electrical models for computational simulations of electromagnetic transients involving lightning discharges.
The distribution line was modeled by the distributed parameter, frequency-dependent J.Martí model [
25]. The insulators’ disruptive effect was modeled using the integration method proposed by [
26] according to Equation (
1).
being the disruptive effect,
the applied voltage as a function of time,
the minimum rupture voltage,
the time at which the rupture process begins for
>
, and
k an empirical constant. The integration method was based on the existence of a critical disruptive effect (
) for each set of insulators. If the calculated value of
exceeded the
value, flashover occurred. In this work, the constants
,
, and
k were determined using the lowest variance method proposed by [
27] and raised for an insulator with voltage class 25 kV and CFO equal to 180 kV. The model was implemented through ATP’s MODELS programming module, similar to the model used in [
28].
The tower surge impedance was defined through the cylindrical model proposed by [
29], offering good representativeness for distribution networks poles.
Surge arresters were modeled as proposed by [
30], in which the equipment’s physical characteristics were used to calculate their parameters. The grounding mesh was modeled by the one ground rod model, represented by the association of the resistor, capacitor, and inductor, which represented well the characteristics of the ground rod for electromagnetic transient analysis [
31]. The distribution transformer was modeled according to [
24] and was suitable for transient simulation by adopting a capacitive element between the transformer’s windings, thus characterizing the transfer of surges between primary and secondary windings. Loads represented the low-voltage network connected to the transformer secondary side and were modeled through a series resistor and inductor [
32].
The lightning discharge was represented by a Heidler current source [
33] according to Equation (
2).
where
is the current peak value;
is a time constant related to the rising time;
is a time constant related to the settling time;
n is a factor varying from 2 to 10;
is a magnitude correction factor given by Equation (
3).
Heidler’s waveform according to the parameters presented in
Table 1 is shown in
Figure 5.
2.2. Criticality Analysis Based on the Average of the Maximum Overvoltage and
The parameter was defined as the average of the maximum overvoltages that occurred at each point after the application of n standardized lightning discharges, n being the number of network points at which lightning discharges were applied. If a pole was single-phase, two-phase, or three-phase, then the number of applied lightning discharges would be equal to one, two, or three, respectively. The parameter was defined as the average of all maximum overvoltages values obtained by applying a lightning discharge at a specific point.
The table of maximum overvoltages
is shown in
Figure 6 and was used to define the parameters
and
. The table was the result of applying the
n mentioned lightning discharges, created for each network topology under analysis. Table rows represent maximum overvoltages at all points after applying a discharge at a specific point
i. The columns present the overvoltage maximum values developed for each point
after the
lightning discharges’ application. The maximum overvoltages table is an
dimensional array.
The
parameter was then defined for each j point as the arithmetic mean, in the vertical direction, of all maximum overvoltage values obtained with the application of discharges as presented in Equation (
4).
As a complementary result, the maximum overvoltages table also allowed identifying, by calculating the arithmetic mean in the horizontal direction, at which point of the distribution network lightning discharges would provoke the largest overvoltages. This location estimate could be used, for example, as a starting point for several algorithms of optimal surge arresters’ allocation, which require a good precision initial kick, as applying genetic algorithms [
9], and may also be used as a test for algorithms such as PSO [
34] and the imperialist algorithm [
8], among others. The parameter
was defined as the arithmetic mean in the horizontal direction as presented in Equation (
5).
Therefore, the largest values of indicated the most critical positions the feeder had for the incidence of lightning discharges. For the analysis to be representative of a real situation, some important requirements should be taken into consideration since some equipment such as transformers, capacitor banks, and others need to be effectively protected in relation to overvoltage; therefore, installing lightning arresters first at these points should be a priority, independently of the maximum value calculated for .
Having the maximum overvoltages mean values and classifying them from the largest to the smallest constituted an efficient planning and design tool for analyzing the feeder sensitivity with respect to lightning discharges aiming at the protection of the most sensitive points. The largest values found were the most critical and could be used to determine in which network locations the installation of surge arresters was more effective in reducing overvoltage levels.
2.3. Criticality Analysis Based on the Number of Flashovers
Direct lightning discharges will inevitably cause flashovers in insulators of distribution networks due to the low insulation level these networks possess. Typical insulation levels for equipment in voltage classes up to 72.5 kV are shown in
Table 2.
It was noted that for voltage classes 15 kV and 36 kV, the maximum normalized values for the NBI (Basic Insulation Level) were 100 kV and 200 kV, respectively, and these were values that insulators should withstand under tests, with a 1.2/50
s waveform without flashover [
35].
In addition to the NBI, the parameter named CFO (Critical Flashover Overvoltage) was defined as the voltage in which there was a 50% chance of flashover occurring in the insulator [
1], i.e., it was the threshold voltage for flashover occurrence. The CFO was obtained from tests in high-voltage laboratories. However, the standard [
1] says that for fast forward transients, the insulator supportability could reach values of approximately 50% more than the nominal CFO, i.e., maximum insulator supportability ≅ 1.5 × CFO.
Therefore, for insulator classes 15 kV and 36 kV, the maximum withstand voltage was approximately 150 kV and 300 kV, respectively. As presented previously, direct lightning discharges with magnitudes of 10 kA would cause overvoltages close to 4 MV, inevitably provoking flashover in insulators that have the maximum CFO equal to 300 kV for 36 kV feeders.
The flashover table
used to define the parameter
is shown in
Figure 7. Each element
in the table represents the occurrence or not of flashover on a given node
for each lightning incidence at node
i. Values of 1 and 0 represent, respectively, the occurrence or non-occurrence of flashover.
Parameter
was then defined for each point
as the sum of the
values, in the horizontal direction, obtained with the application of lightning discharges at points
in the feeder, as shown in Equation (
6).
In addition, the sum of the
values of
would provide the overall number of flashovers that occurred after the application of
discharges to a given network topology, as presented in Equation (
7). The
table will be created for each topology analyzed by the methodology.
Therefore, the lower the value, the lower the flashover occurrence in the feeder after the lightning discharge incidences. Ideally, if surge arresters were installed at all points of the feeder, the parameter would tend to zero, and the electric network would be protected from the disruptive effects caused by the lightning discharges; however, it is known that this strategy is not economically feasible.
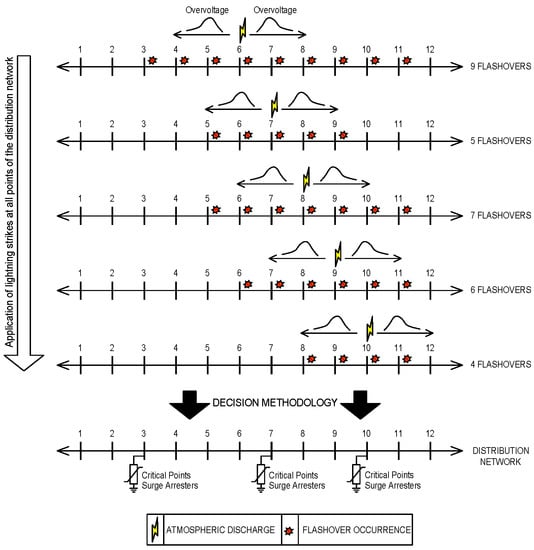
An illustrative example for the occurrence of flashover according to the position of discharge incidence is shown in
Figure 8.
It is noted that the number of flashover occurrences shown in
Figure 8 was related to the lightning discharge incidence point in the feeder. It is possible to observe that the lightning discharge at Pole 6 was more harmful than the others, since it caused the occurrence of 9 flashovers in adjacent insulators, that is
. However, the lightning discharges used in the other cases had the same magnitude and waveform, showing that in fact, for the same applied lightning discharge, there was a differentiation in the number of disruptions that occurred, characterizing the feeder weakness as a function of lightning discharge incidence point. This feature will be used in this analysis as a criticality criterion for identifying the points where the installation of lightning arrester was more advantageous for the electric network, contributing to the reduction of flashovers in the feeder.
It is worth mentioning that the overvoltage levels found in this feeder were a function exclusively of the incident lightning discharge current magnitude, the distribution lines’ characteristics, as well as the modeling adopted for the equipment in the poles as presented in previous sections.
2.4. Setting the Feeder Lightning Performance Function D
To measure the feeder criticality, the following function (
8) was defined and called the feeder lightning performance function.
where
is the feeder lightning performance function,
is the average of pole
i’s maximum overvoltage values as presented in
Section 2.2,
is the
maximum value found for the topology under analysis and shall be nonzero,
is the number of flashovers that occurred after the application of a lightning discharge at node
as presented in
Section 2.3, and
is the maximum value of
found for the topology under analysis and shall be nonzero.
Parameters
m and
n are weighting factors applied to the terms of Equation (
8) in such a way that:
That is, the
D function can benefit the results obtained in a criticality analysis over the others according to the various possibilities of choosing
m and
n. Case
n = 0 means the
D function will be analyzing only the criticality criterion related to the average of the maximum overvoltages, and the
D function will be reduced to Equation (
9) below.
If
= 0, the function will analyze only the results referring to the number of flashovers that occurred in the feeder, neglecting the criticality related to the average of the maximum overvoltages, according to Equation (
10) below:
Thus, a combined solution involving the two criticality criteria was possible with the use of the D function. If a solution was chosen in which both overvoltage maximum values and flashover occurrence had the same priority, then = = 0.5. The choice of adequate values of m and n should be made according to the application focus. When = 0, the criticality was focused on the number of flashover occurrences, when evaluating the lightning incidence in each pole.
When = 0, the severity related to the number of flashovers was disregarded; however, the maximum overvoltages caused by all lightning discharges were presented by the D function, indicating the most critical positions. The points with the most critical overvoltages indicated by the D function for this criterion may be mitigated with the use of lightning arresters.
2.5. ATP Simulation Module
The transient simulations were carried out through the ATP and the construction of tables
and
, as well as the necessary modifications of the input cards of each simulation were performed according to the flowchart shown in
Figure 9, the code being developed using the Python programming language.
According to the flowchart of
Figure 9, the ATP execution file was initially formed having the electrical system data and the simulation parameters that parameterized the lightning discharges that would be applied to each of the n electrical nodes of the grid. Next, ATP was run in a loop for the simulation of n lightning discharges applied at each electric node, one at a time. Once this phase of computational execution was completed, ATP output files were read, and then, the maximum overvoltage and flashover occurrence tables were formed.
3. Results and Discussions
To test the proposed methodology, the IEEE 34 bus test feeder [
36] was used, the single-line diagram of which is presented in
Figure 10. Its rated voltage was 24.9 kV for the Medium Voltage (MV) grid, and loads were represented as equivalents connected at load buses along the feeder.
With respect to this feeder, some simplifications were used. Poles referring to Nodes 888 and 890 were grouped, representing the utility’s low voltage network as a concentrated load. In addition, voltage regulators between Points 814–850 and 852–832 were not considered in the study, and Nodes 850 and 832 were suppressed. Then, after these modifications, the IEEE 34 bus test feeder was modeled in ATPdraw software, using the proposed models P1, P2, and P3 for the different types of poles, as shown in
Figure 11.
To evaluate the IEEE 34 bus feeder criticality, different combinations of coefficients related to maximum overvoltages and the number of flashover occurrences would be tested. Therefore, the allocation of lightning arresters would be performed based on the performance function values for: (a) considering only the number of flashover occurrences, (b) considering only the maximum overvoltages, and (c) considering both flashover occurrences and maximum overvoltages for three different combinations of m and n coefficients.
3.1. Case 1: Analysis Considering Only the Number of Flashover Occurrences
For this case study, the performance lightning function
D was given by Equation (
10) and would analyze the lightning discharge criticality exclusively by the number of flashover occurrences. Applying the proposed methodology, the
D function is plotted in
Figure 12 for the base case chosen, which corresponded to the situation without lightning arresters installed.
It is observed in
Figure 12 that for Pole Number 834, the
D function had the maximum value, that is
= 1 or 100%. Therefore, Pole 834 was the most critical with respect to the number of flashover occurrences.
According to the proposed methodology, lightning arresters should be allocated firstly at poles where the
D function had the largest values; that is, in locations where lightning discharges may cause greater damage. For this situation, the six most critical poles were: 834, 858, 860, 848, 840, and 844 with decreasing
D function values as shown in
Figure 12. This number was chosen because the D function mean value reached a considerable reduction when allocating the fifth lightning arrester set. Furthermore, according to distribution utilities’ practices [
37], equipment such as transformers and capacitor banks should primarily have lightning arresters installed.
A comparison between
D functions for three situations is shown in
Figure 13. The curve D0 represents the performance function for the base case. Curve D1 shows the performance function after the installation of surge arresters on Pole 852 where the transformer was installed. Curve D2 represents the situation D1 including lightning arresters at the most critical Pole 834 indicated by function
D.
According to
Figure 13, there was a considerable reduction in the
D function for allocating lightning arresters at the most critical Pole 834. Additional reductions could be reached by installing more lightning arresters at other critical poles. In
Figure 14, a comparison of
D functions for the base case (curve D0) is presented; installing lightning arresters only at the transformer electrics nodes (curve D1); and installing lightning arresters simultaneously at the transformer pole and at the most critical Poles 834, 858, 860, 848, 840, and 844 (curve D7).
With respect to the reduction of flashover occurrences, the cases D0, D1, and D7 were compared as presented in
Figure 15.
For better visualization of the
D function with respect to flashover occurrences, the
D function is represented graphically in
Figure 16. This representation could be used as a visual and strategic criterion for deciding the best positions for the allocation of lightning arresters by distribution network designers.
It is possible to notice a considerable reduction in the number of flashover occurrences in the feeder protected by lightning arresters allocated at the most critical positions, with the consequent reduction of the
D function for each pole. It is also noted that there was no significant difference in reducing the number of global flashover occurrences in the feeder between the cases without lightning arresters and only with lightning arresters at the transformer. When allocating lightning arresters only at the transformer pole, however, a local reduction of flashover occurrences was observed, as can be seen by the
D function in
Figure 14 and
Figure 15.
3.2. Case 2: Analysis Considering Only Maximum Overvoltages
The
D function for this case is given by Equation (
9) and would analyze exclusively the average maximum overvoltages after lightning discharges were applied. Again, applying the proposed methodology for the base case, the resulting
D function is plotted as presented in
Figure 17.
In this case, it was observed that at Pole Number 840, the
D function had the maximum value; therefore,
= 100%, being classified as the most critical point for the incidence of lightning discharges. The poles’ averages for maximum overvoltages occurrences for lightning discharges at each pole at a time are shown in
Figure 18.
For this situation, the six most critical poles were: 840, 864, 862, 838, 826, and 860, with decreasing
D function values, as shown in
Figure 19. Comparing this critical pole set with that obtained for Case 1, only Poles 860 and 840 belonged to both sets. Again, after installing lightning arresters at Transformer Pole Number 852, the corrected
D function is presented in
Figure 20 (curve D1), compared to the
D function without lightning arresters (curve D0).
According to
Figure 20, a moderate reduction was graphically noted in the
D function for the allocation of lightning arresters only at the transformer’s pole. However, considering the simultaneous allocation of lightning arresters at the transformer’s pole, and at the most critical Poles 840, 864, 862, 838, 826, and 860, there was a considerable reduction in the
D function, improving network protection globally.
The reduction in the average maximum overvoltages associated with the
D function is shown in
Figure 21. It is observed that the average values of overvoltages could reach up to 550 kV for the base case (without lightning arresters, curve D0), up to 500 kV for the case of installing lightning arresters only at the transformer’s pole (curve D1), and not higher than 300 kV when installing lightning arresters at the six most critical poles and at the transformer’s pole (curve D7). The 34 bus IEEE test feeder had a Basic Insulation Level (BIL) of 126 kV. Therefore, on average, in Case D7, the vast majority of poles were satisfactorily protected.
3.3. Case 3: Analysis Considering Both Flashover Occurrences and Maximum Overvoltages
In this case, there would be a combined solution between the coefficients
m and
n, for three different situations, so that the effects of maximum overvoltages and the number of flashover occurrences were considered for the allocation of lightning arresters. Cases in which
m = 0.5 and
n = 0.5,
m = 0.25 and
n = 0.75, and
m = 0.75 and
n = 0.25 were evaluated. The graphical representation of the feeder performance function for
m = 0.5 and
n= 0.5, corresponding to the base case, is shown in
Figure 22.
It was observed that the D function was maximum at Pole 840, the calculated value of which was = 0.8349, or 83.49%. This way, similar to Case 2 with m = 1 and n = 0, Pole 840 was classified again as the most critical by the D function for Case 3 for m = 0.5 and n = 0.5.
For
m = 0.5 and
n = 0.5, the six most critical poles in decreasing order of the performance function values were: 840, 834, 858, 860, 864, and 848. The six most critical poles for Cases 1, 2, and 3 are summarized in
Table 3. These poles were ordered according to the calculated values of the
D functions for each case.
It can be seen by inspection of
Table 3 that all poles composing Case 3 classification for
m = 0.5 and
n = 0.5 occurred in Case 1 or Case 2. Therefore, as expected, Case 3 for
m = 0.5 and
n = 0.5 was the solution that was comprised of both aspects of overvoltage severity and flashover occurrence, due to direct lightning discharge. Case 3 for
m = 0.25 and
n = 0.75 was identical to Case 1, except for ordering the poles’ criticality. Case 3 for
m = 0.75 and
n = 0.25 presented four of the six most critical poles obtained for Case 2 and two of the most critical posts obtained for Case 1.
The
D functions for Case 3 without lightning arresters (curve D0), for lightning arresters installed at only the transformer’s pole (curve D1), and finally, for lightning arresters’ installation at the transformer’s pole and at the six most critical poles for
m = 0.5 and
n = 0.5 and
m = 0.25 and
n = 0.75 are shown in
Figure 23 and
Figure 24.
The values of maximum overvoltages and the number of flashover occurrences for
m = 0.5 and
n = 0.5 and
m = 0.25 and
n = 0.75 are shown in
Figure 25,
Figure 26,
Figure 27 and
Figure 28, respectively, considering: (a) the base case, without lightning arresters’ installation (curve D0); (b) installing lightning arresters only at the transformer’s pole (curve D1); and (c) installing lightning arresters at the transformer’s pole and at the six most critical poles simultaneously (curve D7).
A summary of the results obtained for Cases 1, 2, and 3 with allocation of lightning arresters at the transformer’s pole and at the six most critical poles classified by the
D functions is shown in
Table 4. These results were compared with those obtained for the base case, which considered the distribution network without lightning arresters. Two main aspects were analyzed, namely: (a) the average value of maximum overvoltages that occurred for all lightning discharge simulations; (b) the maximum number of flashovers that occurred by pole (electric node) and also globally for the system, for all lightning discharge simulations performed.
Observing
Table 4, it is noted that the five used combinations of parameters
m and
n resulted in being satisfactory concerning the average maximum overvoltages, reducing around 40% with respect to the base case. Comparing, the resulting number of flashovers in Case 1 and Case 3 for
m = 0.75 and
n = 0.25 were more effective.
The IEEE 34 bus test feeder had different distances between the poles. The distances between the poles on the right side were smaller compared to those on the left side. This fact led to greater severity concerning overvoltages and flashover occurrences for the poles located on the right side of
Figure 16,
Figure 19, and
Figure 22. In addition, the feeder’s right side had a greater number of electric branches, which increased the chance of flashover occurrences due to the division of the discharge current among these branches. It was also noted that the analysis of Case 2 pointed out the poles located at the end of the distribution line due to the effect of voltage waveform reflection, which increased the value of the maximum overvoltages at these points. The results obtained with the DDC methodology were consistent with other results from other methods such as [
7,
9].
4. Conclusions
The DDC methodology for analyzing the electric grid criticality in relation to the incidence of direct lightning discharges in electric distribution feeders was presented. The DDC methodology presented a great potential as an analysis tool for the definition of the feeder’s most critical points, aiming at efficient allocation of surge arresters.
For the case studies presented, three different combinations were used for the coefficients of maximum overvoltage and the number of flashovers in the feeder lightning performance function D, which guided the allocation of lightning arresters at the most critical nodes. Satisfactory results were obtained in all of them. For the incidence of lightning discharges at the grid electric nodes, a reduction of overvoltage magnitudes and the number of flashover occurrence was observed. The results were compared with the base case condition, that is without surge arresters allocated.
The proposed methodology may help the criticality analysis in large distribution feeders, because with sensitivity analysis, the most critical points can be identified, thus creating a feeder overview in terms of its criticality.
The proposed D function was very effective in objectively presenting the feeder’s most critical points, so that experts can strategically choose the best points at which lightning arresters can be allocated, according to the distribution utility’s interests.
The technique was focused on electric distribution network applications, essentially as a tool for rapid criticality analysis of these networks, with respect to direct lightning discharges. Using this tool, the planning engineer will be able to identify the most critical points of this network in relation to lightning discharge incidence and evaluate the different design and installation alternatives for surge arresters to obtain an effective and economic protection. The technique does not depend on weather conditions and has been tested in radial distribution networks.

 ,
, 


