Automated Negotiation for Peer-to-Peer Electricity Trading in Local Energy Markets
by
 , , and
Christie Etukudor
1,* ,
,
Benoit Couraud
1,
Valentin Robu
1,
Wolf-Gerrit Früh
1,
David Flynn
1 and
and
Chinonso Okereke
2 1
Department of Electrical, Electronic and Computer Engineering, Heriot-Watt University, Edinburgh EH14 4AS, Scotland, UK
2
Department of Electrical and Information Engineering, Covenant University, Ota 112233, Ogun State, Nigeria
*
Author to whom correspondence should be addressed.
Energies 2020, 13(4), 920; https://doi.org/10.3390/en13040920
Submission received: 28 December 2019
/
Revised: 12 February 2020
/
Accepted: 14 February 2020
/
Published: 19 February 2020
(This article belongs to the Section A1: Smart Grids and Microgrids)
Abstract
:Reliable access to electricity is still a challenge in many developing countries. Indeed, rural areas in sub-Saharan Africa and developing countries such as India still encounter frequent power outages. Local energy markets (LEMs) have emerged as a low-cost solution enabling prosumers with power supply systems such as solar PV to sell their surplus of energy to other members of the local community. This paper proposes a one-to-one automated negotiation framework for peer-to-peer (P2P) local trading of electricity. Our framework uses an autonomous agent model to capture the preferences of both an electricity seller (consumer) and buyer (small local generator or prosumer), in terms of price and electricity quantities to be traded in different periods throughout a day. We develop a bilateral negotiation framework based on the well-known Rubinstein alternating offers protocol, in which the quantity of electricity and the price for different periods are aggregated into daily packages and negotiated between the buyer and seller agent. The framework is then implemented experimentally, with buyers and sellers adopting different negotiation strategies based on negotiation concession algorithms, such as linear heuristic or Boulware. Results show that this framework and agents modelling allow prosumers to increase their revenue while providing electricity access to the community at low cost.
1. Introduction
Universal access to affordable, reliable, and sustainable energy is one of the sustainable development goals (SDG) of the United Nations [1]. Indeed, access to electricity is still a major challenge in developing countries. Eleven percent of the world population (840 million people) lack access to electricity especially in rural areas, which represent 87% of this population. With 573 million people out of those 840 million, the sub-Saharan African (SSA) region includes twenty of the least-electrified countries of the world [2]. In most of these countries, insufficient generation capacity often due to total dependence on fossil-fuel generators and weak grid infrastructure [3] are the cause of this lack of electricity access. The size of the countries along with the cost of new generation development and grid reinforcement make it economically unfeasible to extend the high voltage grid to supply the whole population, both in the short and medium term [4]. Hence, such developing countries face important shortage, polluting electricity production, and low quality electricity with large voltage fluctuations that can be harmful to power electronics-based devices [5,6]. Consequently, small scale fossil fuel-based generators are widely used by electricity consumers for off-grid electricity generation. However, the high electricity cost resulting from these generators hinders the economic development in these regions [7,8]. In addition, the environmental pollution caused by the widespread use of (often inefficient) carbon fuel generators [9,10] is a growing health and safety concern due to toxic generator emissions; as well as the recorded deaths from these emissions, especially in developing countries [11,12].
Several innovative and cost-efficient solutions incorporating available local renewable energy sources (RES) such as solar, wind, and hydro have also been proposed and widely utilized. These include solar lighting [13], solar home systems (SHSs) integrating battery storage [14,15], hydropower [16], as well as community microgrids with battery storage systems [17,18]. These solutions provide several advantages such as reduced cost of electricity, ease of deployment, and environmental sustainability. This is especially valuable in developing country settings, where installing large-scale generation, centralized transmission/distribution, and storage assets are often expensive, due to limited power system infrastructure and access to finance [4]. Off-grid SHSs and community microgrids have also been observed as being the most effective solution in enabling millions of rural dwellers gain access to electricity [19]. Given the variable characteristic of RES in general, these off-grid SHS and community microgrids are usually designed and sized to generate and store adequate electricity for daily consumption, during periods of low-resource availability such as severe weather conditions [20]. Conversely, they also generate excess, unutilized/wasted energy during periods of high resource availability, which could be used by neighbours or peers via peer-to-peer (P2P) energy sharing/trading within the community, as demonstrated in the Swarm Electrification project of Bangladesh [21] where local consumers and prosumers (consumers who own solar home systems) are connected and morphed into village microgrids for energy sharing purposes, using a DC distribution system.
P2P trading has been defined as a decentralized structure where all peers in the structure cooperate to trade a good or service—in this case, electricity [22]. Indeed, P2P electricity sharing/trading has emerged as a new paradigm, solving local network issues such as voltage fluctuation, congestion, or electricity deficit [22,23,24,25]. This novel concept of electricity trading is driven by the development of distributed energy resources (DER) and smart metering technologies along with communications systems [26,27,28]. It provides prosumers with the unique opportunity of selling any excess electricity generated to other households in need of electricity [29] especially in the case of islanded microgrids or during electricity cut events, while empowering communities to take charge of their own energy supply and usage. A typical case study is the Brooklyn Microgrid Project (BMG)—a network of local neighbourhood prosumers and consumers who trade locally-available, cheaper and greener electricity via a private blockchain system [30]. Other commercial P2P electricity trading projects include xGrid and µGrid by Powerledger (www.powerledger.io/our-technology/); PicloFlex by Open Utility (www.picloflex.com/); Vanderbron (www.vandebron.nl/) and Sonnenbatterie community where members share their self-produced surplus energy stored in their Sonnenbatteries with other members of the Sonnembatterie community (www.sonnenbatterie.co.uk/sonnencommunity/). Other European research projects focused on the design and implementation of P2P electricity marketplace include ElecBay—a P2P electricity trading platform for grid-connected microgrids [31]; EnerChain—a blockchain-based energy trading platform “for wholesale products, flexibility options and kWhs within energy communities” (www.enerchain.ponton.de/) [32]; NOBEL—a P2P energy market for trading electricity in smart grid neighbourhoods (www.nobelgrid.eu/) [33] and P2P-SmartTest project (www.p2psmartest-h2020.eu/) [34]. Hence, local peer-to-peer (P2P) trading would provide a great opportunity for populations with limited access to electricity to access any unused/excess local energy within the community.
While most P2P electricity markets use market clearing algorithms such as the double-auction that match the prices and quantities proposed by prosumers and consumers in the market [35,36]; others use distributed optimization methods [37] based on dual prices such as alternating direction method of multipliers (ADMM) [38] and consensus-based optimization [39]. However, automated negotiations have emerged as a key technology for P2P electricity markets. In an automated negotiation, software agents negotiate and trade energy on behalf of their human owners in order to maximize the utility defined by their owner. Hence, automated negotiations are defined as a form of interaction in which a group of software agents (buyers and sellers), with conflicting interests but desirous of cooperating with one another, choose to work together with the aim of reaching an agreement that is acceptable by all parties in the process [40]. Fast, efficient, and reliable automated negotiation is seen as a key coordination mechanism for the interaction of producers, suppliers, and consumers in electronic markets such as P2P electricity markets [41]. Hence, the development of market frameworks has been the focus of recent research in P2P electricity market sector. Optimization of electricity production and consumption schedule in a wholesale market where buyer and seller agents cooperate to determine the best energy contract, is one of such developmental research frameworks [42,43]. Current research also focuses on bilateral contract networks between suppliers and centralized producers [44]; computational properties of negotiation algorithms [45]; prosumers’ behavioural pattern based on their bidding strategy [46]; optimized scheduling of energy storage for a P2P microgrid model using automated negotiations [47]; as well as enabling communication technologies [48]. Furthermore, agent-coordinated electricity trading between homes in a cooperative residential setting has been shown to lead to an overall battery capacity reduction and reduced energy losses [49,50]. However, electricity pricing was not considered for negotiations in these studies.
In this paper, we present bilateral agents’ negotiation heuristics that enable community P2P energy market in order to reduce the bill of electricity traders and promote access to electricity in the case of developing countries. The aim of the paper is to provide a new formal model of buyers and sellers agents that can be used to carry out automated negotiations. This formal model is then integrated within a novel automated negotiation framework where electricity quantities and prices are electronically negotiated by players in the market. The paper shows how consumers can access more local electricity at lower cost, while allowing local prosumers to increase their benefits and reduce their generation system’s payback period. The paper also proposes novel heuristic negotiation strategies (applicable in such localized P2P markets) where agents representing residential prosumers and consumers bargain with each other towards reaching a mutually satisfactory trade.
In Section 2 of the paper, we describe this novel automated negotiation framework, including the formal model of buyers and sellers and the negotiation protocol. In Section 3, we present different negotiation strategies that can be used in a local energy market. Then, in Section 4, the proposed framework and negotiation strategies are applied to a case study focused on developing countries (specifically India), where the considered community represents a rural area with poor access to electricity. Experimental analysis shows that the proposed framework increases access to electricity, while increasing the revenues for SHS owners. Finally, in Section 5 and Section 6, we discuss and conclude on the potentials of the proposed automated negotiation framework for P2P energy markets and highlight how it allows for reduction in the electricity deficit of some communities while promoting the use of community-based renewable energy sources.
2. Automated Negotiation Framework
We develop a negotiation framework in which two types of agents (buyer and seller) bilaterally negotiate to trade electricity. The framework is constituted by a negotiation protocol and models of agents, as explained below.
2.1. Negotiation Protocol
The negotiation protocol is defined by the operator or facilitator of the local market in which the two agents interact. It defines the rules of this interaction, including the type of energy contract that can be exchanged, and the different steps that each agent has to follow in the negotiation. The automated negotiation framework consists of a Rubinstein alternating offers protocol [51] and the issues (the quantity of electricity and the price for each considered period) that are negotiated are discrete and daily packaged. Agents have imperfect information, which means they do not know the preferences or utility function of the opponent. This subsection presents the protocol that must be followed by the agents during their negotiation.
First, the operator or facilitator of the local market determines the number of consumption periods for the following day. In this paper, four (4) periods of electricity consumption are used in the negotiation model: Morning, afternoon, evening, and night. For each of these periods, the operator defines two issues: The quantity of electricity to be traded, noted where Ni is one of the four periods determined previously, and the price at which the quantity is traded during this period. The price per unit is taken as a constant throughout the whole day in this paper (), but the negotiation model also applies in the case of variable price per periods. This is because the emphasis in our negotiation model is on equitable and mutually beneficial exchange of electricity between peers, not on the pricing mechanism. For each of these issues, the model includes some bounds on the quantities that the energy exchanges in each period can take, based on the physical constraints of the application setting. For example, in the first period ( = Morning), minimum and maximum quantity of energy that can be traded are defined. The minimum quantity of electricity to be traded ( is usually 0, while the maximum quantity depends on the local constraints of the distribution network and the duration of the period. As an example, in a very small market with small consumption, the maximum quantity of electricity that could be traded in a period could be defined as 3.5 kWh, which means that the agents cannot trade more than 3.5 kWh within the period Ni. The same applies to the issue of price where a minimum and a maximum price is also determined; for example, ($/kWh).
Hence, our automated negotiation framework is defined by the following set of five issues (in the case of four periods and one price for the whole day):
In the case where price is variable over one day, the set of issues is defined as . For simplicity, each of the five issues (, ) consists of discrete values (quantities) that are predefined by the contract types. This means that negotiation can only result in traded quantities that are already within the set of feasible quantities that are possible to be physically traded in the local distribution network. Given the description above, the proposed negotiation protocol consists of a bundled multi-discrete issue. Thus, for each round within a negotiation, an agent A will determine one quantity for each issue (within the limits previously defined) in order to constitute an offer, noted (or in the case of variable prices), proposed to agent B. The set of all possible offers , is the negotiation domain determined by Equation (2):
Hence, a negotiation consists of the following steps:
- (Pre-negotiation): First, the parties (agents) define the issues to be negotiated and the associated possible (allowed) quantities for each of them.
- An agent A determines the offer he will propose during the first round to agent B. The offer consists in the quantities of electricity for each period () and the price ().
- Agent B receives the offer; accepts it or discards it. In the first scenario, the negotiation is over. In the second, he proposes a counteroffer by determining its preferred quantities for each issue.
- Agent A can either accept it, propose a new offer (in which case we go back two steps above), or close the negotiation (no deal).
- Once the negotiation is done, the trade is validated against the physical constraints of the power exchange network, verifying that the network can support the agreed energy transfer.
- The next day, the agents commit to their energy trade.
In terms of the physics, the proposed model can be used in a number of physical settings. In the case of communities in many developing countries, there is no central distribution network and the exchange occurs over a privately-owned wire. In cases where prosumers have access to a local distribution network, a distribution system operator could be used to verify and enforce physical network constraints, but the contracts are agreed through P2P negotiation. Thus, given the negotiation protocol description above, the next section will focus on the modelling of the agents in order to allow automated negotiations by software agents.
2.2. Agent Models
Having described the negotiation process in Section 2.1 above, this section presents the modelling of the software agents representing the different market traders. The agent modelling consists mainly in determining an agent’s utility function. The utility function is defined for each offer and represents the agent’s preference or value for an offer. Thus, a buyer will have a high utility for an offer that consists of its desired quantities of electricity at a low price, whereas a seller will have the highest utility for offers with high prices. Hence, it is necessary to distinguish seller and buyer agents, as explained below.
2.2.1. Buyer Agent Model
The utility that an agent A will give to an offer noted , is defined as a function of the total cost and quantity of electricity supply for the day. Thus, the utility function of an agent A for an offer is defined as proposed in Equation (3):
where and are weight-coefficients such that . represents the importance of the electricity cost for the agent, while represents the importance the agent gives to the quantity of electricity he will obtain in an offer. represents the total cost of the offer through the whole period (day) and is given by Equation (4), which includes the case where the prices can be different for every period:
where and are the quantity of electricity and price at period Ni that constitute the current offer, and is the quantity of electricity required by the agent for period Ni. While is defined for every period Ni, as the minimum between the price of electricity on the grid and the cost of the generation of one unit of energy from a generator that would be owned by the buyer and used in case there is no deal. This is relevant especially for remote places or countries in India and sub-Sahara Africa where households use small fossil fuel-based generators to generate electricity when there is a long outage on the grid. Where there is no grid and no generator, is equal to —the highest possible price for period Ni. Additionally, and are the minimum quantities of electricity and price that can be traded in period Ni, respectively. This expression of the cost ensures the utility of an offer with a low cost will be higher than the utility of an offer trading the same quantity of electricity at a higher cost. It will also prevent the agent from negotiating electricity at a higher cost than the grid’s price or the cost of a self-owned generator.
Finally, in Equation (3) is defined as the agent’s utility for the quantities of electricity that constitutes the offer. Indeed, an agent has a need for specific quantities of electricity at specific times. If an offer meets its needs, the offer will have a high utility. However, if the offer surpasses its needs, the utility is 0 for an agent who is not flexible (unable to increase its consumption). Thus, is defined as shown in Equation (5):
where represents the matching between the electricity quantity corresponding to the offer for period Ni and the required electricity quantity for the same period. is given by Equation (6):
where is the flexibility the consumer has (in kWh) for overconsumption in period , and is a number such that allows to be defined even for a period where . It can be seen that is equal to 1 only when the agent receives an offer that exactly meets its needs.
are the period’s weight coefficients (), directly representing the importance of a period Ni to the buyer in comparison with other periods. It is given by Equation (7):
where is the maximum quantity of electricity per period the agent requires, and is a coefficient given by the agent to state if the period is important or not. For example, an agent might not need a large quantity of electricity for period Ni but might be in dire need of this quantity for a different period. In this case, the agent can specify it by allocating a large value to ( for example).
2.2.2. Seller Agent Model
The seller agent represents a prosumer with a microgeneration asset. This asset consists of either a fossil fuel engine, a solar panel with or without a battery, etc. The seller agent’s utility for an offer is determined by the revenue the seller will get from it. Thus, is given as shown in Equation (8):
where an offer is said to be feasible if the agent has enough energy in each period to supply its own needs and the electricity quantities proposed in the offer. Algorithm 1 presents the steps followed in order to remove unfeasible offers from the negotiation domain. is the seller’s expected revenue from an offer , and is given by Equation (9) where there are variable prices per period:
where is the maximum revenue a seller could expect from the space of possible offers and is the maximum quantity of energy the prosumer could sell in time period Ni. The seller’s marginal cost of production for one unit of electricity in period Ni—private to the seller only—is denoted as .
| Algorithm 1: Remove impossible offers from |
| Inputs: |
| Set of offers to be considered. Maximum battery capacity if no battery). Initial battery capacity at the start of the day (0 if no battery). Set of forecasted renewable energy production at each time period Ni. The maximum power of the conventional fossil fuel powered asset (0 if no conventional supply). Set of four electricity quantities that need to be self-supplied by the seller at each period Ni. |
| Initialize: |
| the space of outcomes (utility) for the considered set of offers . |
| For do. |
| . |
| For i = 1 to 4 do. |
| . |
| if then. |
| . |
| Return |
Now that the utility function of the seller has also been defined, the next subsection presents the different steps followed by the agents during a negotiation.
3. Agents’ Electricity Negotiation
Having defined the buyer and seller agents’ respective utilities, this section presents the different steps followed by the agents during the negotiation.
- The agent first determines its required self-consumption () for each of the four periods, as well as the different marginal costs for electricity supply (, ).
- The seller agent also determines the forecast for its distributed energy resource (DER) production, while the buyer agent determines the values, as well as the weights and .
- The agents compute the utility function for each of the possible offers from the sets of discrete quantities and determined by the market facilitator. Thus, each agent generates the set of possible outcomes .
- The agents sort the set of possible outcomes and each determine the threshold below which it will not accept any offer. is the utility of the reserved or least package an agent can concede. Thus, any package with a utility below will be discarded.
- Negotiations begin with an agent (say agent A) initiating and sending the first offer/bid to the opponent (agent B).
- Upon receiving the offer, agent B evaluates the utility of the offer and determines if the offer is first suitable or not; that’s above or not. Depending on its strategy, agent B will either accept the offer; or refuse the offer by proposing a new offer/bid etc. within the specified deadline, until a bargain is either reached or the negotiation is closed without a deal.
Finally, for each agent, the threshold defined above corresponds to the package which contains no electricity quantities as each agent is in the market to negotiate electricity quantities. is defined by Equation (10):
With the maximum/minimum price acceptable for the buyer/seller respectively, and corresponding to one of the two packages ( or ) that gives the lowest utility. Now that the negotiation protocol and the agents modelling have been defined, the next section describes the different negotiation strategies that have been considered in this study.
3.1. Negotiation Strategies
A negotiation strategy determines how an agent generates a bid, as well as accepts an offer. Several negotiation concession strategies have been proposed in negotiation literature. For this paper, we have selected and adapted on three strategies that show the best performance, which will be used in the next section in order to validate the negotiation protocol and model defined above.
3.1.1. “Zero Intelligence” (ZI) Strategy
The first agent’s strategy to be considered is the zero intelligence (ZI) strategy. This strategy consists of generating a random bid from the agent’s set of feasible packages determined previously (). In conceding to a received offer, the agent will accept it if the utility of the received offer is greater than that of its previous randomly generated bid. This strategy serves as a baseline strategy to determine the feasibility of automated negotiations as a trading mechanism in P2P electricity markets.
3.1.2. Linear Heuristic Strategy
The linear heuristic (LH) agent strategy consists in choosing an offer among a reduced set of feasible packages. During the first round of a negotiation, the LH agent (called agent A) starts by defining the minimal utility (called reservation value) such that the set of feasible packages for this round is given by with . For the first round, is chosen close to the maximum utility computed, as explained in Section 2. If an offer from the opponent is within the set computed for the considered round, the offer is accepted. Otherwise, the agent proposes a second round for which he determines a new minimal utility and a corresponding set such that . The specificity of the LH agent is that the minimum utility used to determine the set of possible packages for round k is determined as a linear function of the round number, as shown in Equation (11):
where M is a coefficient that corresponds to the speed at which the agent concedes in a negotiation. As explained above, once the LH agent receives an offer for round k, it will either accept it if the utility of this offer is above , or propose a new bid. The new bid corresponds to the package from the set of that is closest to the received offer from the opponent, where the dimensions for the distance computation are the issues considered .
3.1.3. Expert Agent Strategy
The expert agent strategy uses a heuristic strategy similar to the LH strategy, as well as the Boulware strategy [52]. Similar to the LH agent, the expert agent also defines a new set of feasible packages for each round k, determined as the set of all packages such that where the minimal utility is defined by Equation (12):
It is against this feasible package set , the expert agent evaluates a received offer with a view to accepting it; or it proposes a counteroffer from this set choosing the bid closest to the received offer in terms of quantities. Now that the different agents’ strategies have been presented, the following section will present a case study in which these strategies will be evaluated.
3.2. Case Study
The case study used to test and validate our model focuses on developing countries where rural or semi-urban areas often have unreliable or no connectivity to a central power grid (i.e., “weak grid” environments), such as those present in several parts of sub-Saharan Africa, southern Asia, or in India. Until the development of solar PV technology, consumers faced either the choice to have no electricity during the whole period of the outage (sometimes up to several days), or to use small fossil fuel-based generators. Recently, some households have invested in solar home systems (SHSs) integrating battery storage. However, due to lack of incentive or possibility to share the excess energy inherent in such systems, large amounts of electricity that could serve others in the community are often unutilized/wasted. The case study proposed in this paper addresses this issue by implementing the negotiation protocol described in previous sections to a rural community consisting of a prosumer with a solar home system and a battery; and different consumers with different preferences for energy and prices. For comparison purposes, the consumers are defined as having the same consumption needs. The prosumer acts as the seller, and the consumers are the buyers. In our model, peer-to-peer (P2P) bilateral (one-to-one) negotiations are considered; hence, negotiations are between the seller and one buyer at a time.
In more detail, the settings used in our model (such as the two solar generation availability scenarios described below, and the values used to model our utility functions for exporting/consuming electricity) are inspired from a large UK-India research project the authors are involved in: Community-scale Energy Demand Reduction in India (CEDRI–www.cedri.hw.ac.uk/). CEDRI uses a combination of data-driven analytics, user surveys, and computational modelling to study the energy demand/consumption behaviour in a number of local communities in India, such as the Auroville community and surrounding villages in Tamil Nadu.
3.2.1. Buyers’ Profiles
Three buyers reflecting three different energy consumption behaviours but similar electricity consumption needs, typical of a rural community setting are modelled. The World Bank has proposed to categorize consumers based on their electricity need [53]. As shown in Table 1, a “Tier 1” consumer corresponds to a consumer with a daily need of 12 Wh of electricity for lighting, whereas “Tier 5” consumers typify households that have an electricity consumption above 8.2 kWh. In our scenario, we focus on rural India and SSA communities, so we consider that buyers belong to the “Tier 2–3” category, with a daily consumption only for lighting, air circulation (fans), television, and phone charging. Thus, the buyers’ daily electricity consumption is estimated as . This means that in this scenario, the buyers require 0.25 kWh of electricity at night, 0.25 kWh in the morning, and 1 kWh during the evening. The buyers’ different energy consumption patterns are also represented in their different preferences in terms of price or need for electricity .
- Buyer 1 is a consumer with equal preference for the cost of electricity, as well as the quantity of electricity he receives, provided it is close to its electricity need . Hence, .
- Buyer 2 is a consumer who prefers having the amounts of electricity given by , irrespective of price. Hence, and .
- Buyer 3 is a consumer who is most concerned with price and will adjust consumption based on the price as this buyer does not want to pay much money for its electricity consumption. Hence, .
We also consider a “Tier 1” consumer household with maximal electricity consumption of less than 0.2 kWh daily (often as a result of low household income); to determine if such a consumer can participate and benefit from the LEM using automated negotiating agents. We modelled this consumer as a type of buyer 3 as this consumer is mostly concerned about its cost of electricity.
3.2.2. Seller Profile
The seller owns a small solar PV system of 1.5 kW with a battery of 2.8 kWh of available capacity. The seller also has a need for electricity that will self-supply in the first place, and then sell any extra energy to others. Its daily consumption (also known demand) is assumed to be . His battery is assumed to be completely full (2.8 kWh) at the start of the day and two cases of solar microgeneration are considered with a derating factor of 65% pre-applied to the forecasted solar PV generation to generate DERPV:
- Cloudy day case where the solar PV installation produces a power given by kWh, respectively.
- Sunny day case with a PV production given by: .
This derating factor caters for system losses, as well as variability in solar irradiation. It also aids to ensure that a seller agent can only negotiate energy quantities it can generate and deliver. The next section will focus on the obtained results from the negotiations between all these buyers and the seller in the two solar production cases, implementing the different negotiation strategies described in Section 3.1.
4. Experimental Results
The proposed agents modelling utilizing the proposed strategies and negotiations protocol were applied to the case study described in Section 3.2 and for the two solar availability scenarios to demonstrate the benefits of automated negotiations in local energy markets. The results are presented in this section in two parts. In the first part, the agreed negotiation bargains/outcomes are presented in order to evaluate the negotiation protocol proposed, while the second part compares the outcomes of the different strategies proposed. All simulations were run on the MATLAB software with an i5 processor at 1.7 GHz, and the different Central Processing Unit (CPU) requirements are displayed in Table 2.
4.1. Negotiation Framework Implementation
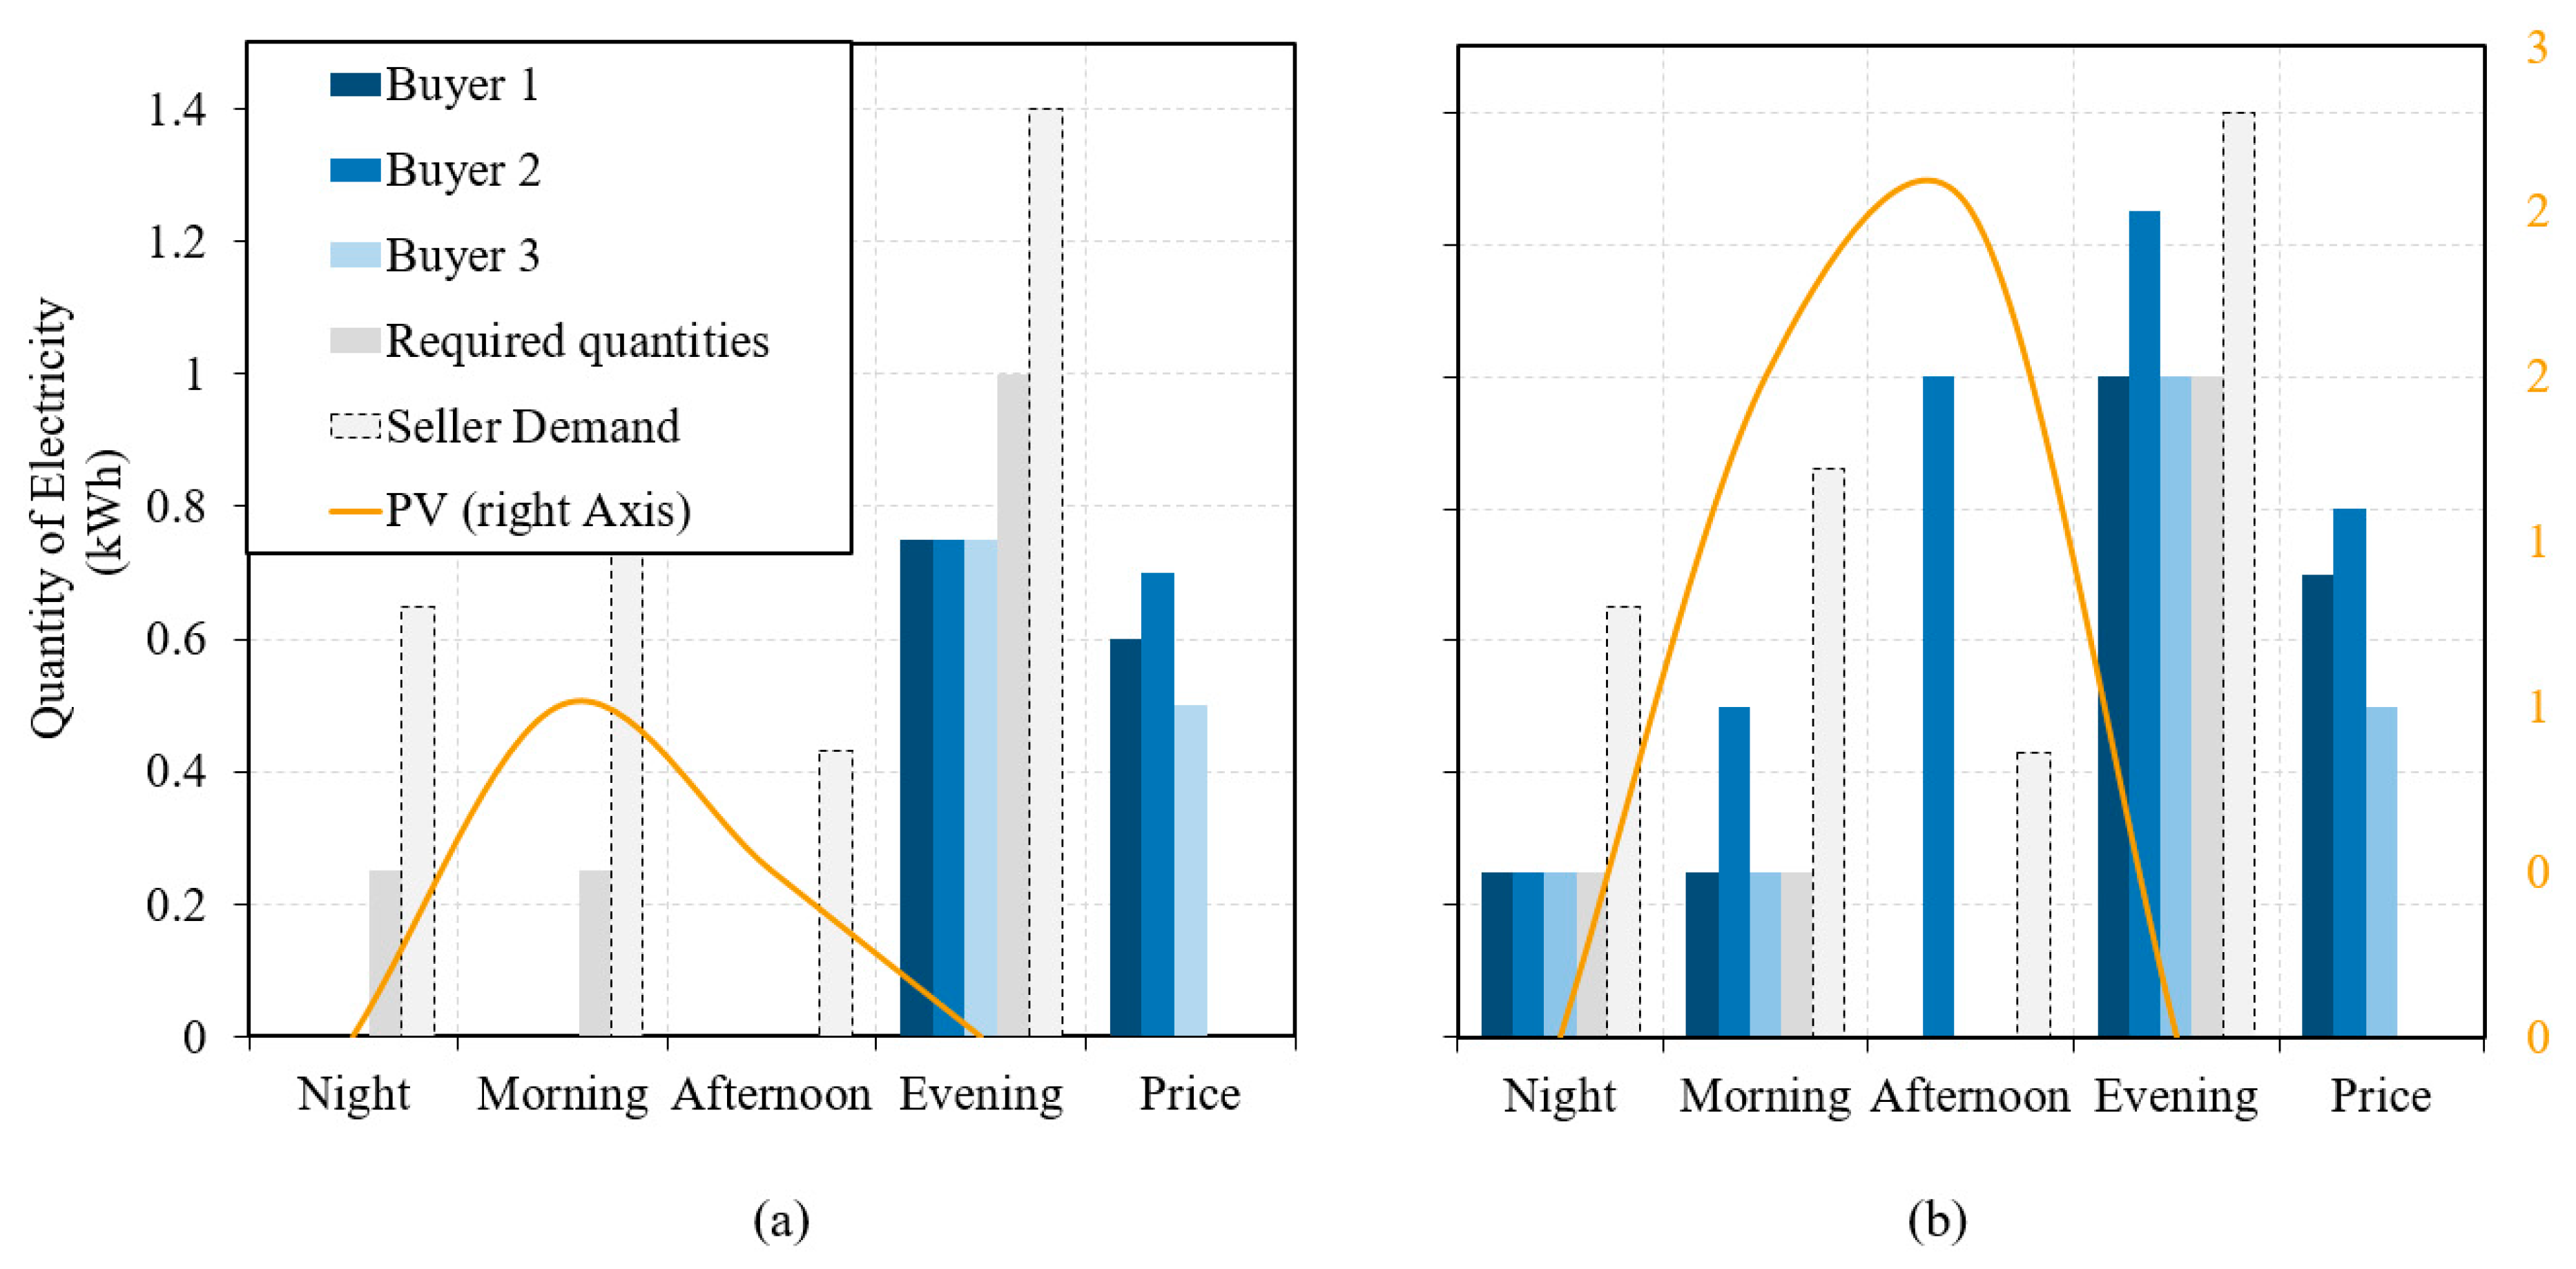
The two cases proposed to evaluate the negotiation framework allows us to explore two scenarios. In the first scenario, the seller (prosumer) does not have a lot of energy to sell, as the day is a cloudy day. While each buyer will try to find the maximum amount of energy it can obtain, at the lowest price, and at its most preferred period. Implementing in (7) for all periods and for all the buyers, each buyer will try to maximize its quantity of energy at the period where it has the greatest demand—in our case, the evening period as the required demand is kWh. The left graph of Figure 1 presents the results from negotiation between the three buyers and the seller when the day is cloudy. Since there is not enough energy to supply the needs from the seller and the buyer, the buyer focuses on the evening period. Figure 1 shows that the only package feasible is 0.75 kWh electricity exchange in the evening. As shown, buyer 3, who has a clear preference for having a low cost for its energy consumption negotiates the lowest price. From the seller’s perspective, provided the offered price is above its marginal cost of energy production, the deal is still profitable.
The right graph of Figure 1 presents the results of negotiations when the day is sunny. In this case, the seller has enough energy to supply his demand and the demand of the buyer. Buyer 1 (no preference) and buyer 3 (preference for a low cost) negotiate the same quantities of energy to meet their need. Buyer 3 obtains the best price but stands the risk of not reaching a deal. If its utility weight for low cost had been higher, he might not have proposed any offer suitable to the seller at prices above the seller’s marginal cost of its PV and battery installation. Finally, buyer 2 is a buyer who aims to obtain at least the required quantity of energy or more, by attaching very low importance to the cost of its electricity supply. In a real-life scenario, if the obtained contract/deal does not suit the buyer, it can adjust its weight for cost in future negotiations in order to either reduce the obtained price or increase its energy access.
Hence, an important outcome from these simulations is that the agreed bargain meets the buyers’ needs, while providing additional revenue to the seller. It specifically allows buyers with preference such as the buyer 2 profile, to increase their energy access, which is an important feature in developing countries, as economic development requires increasing energy access. For low revenue community members, it also allows them to negotiate better prices for their energy supply, while still giving satisfaction to the prosumers/sellers. As discussed, P2P negotiations are mostly specific to settings with poor access to a central power grid, where there is no direct interaction or competition with a central power supplier or utility company.
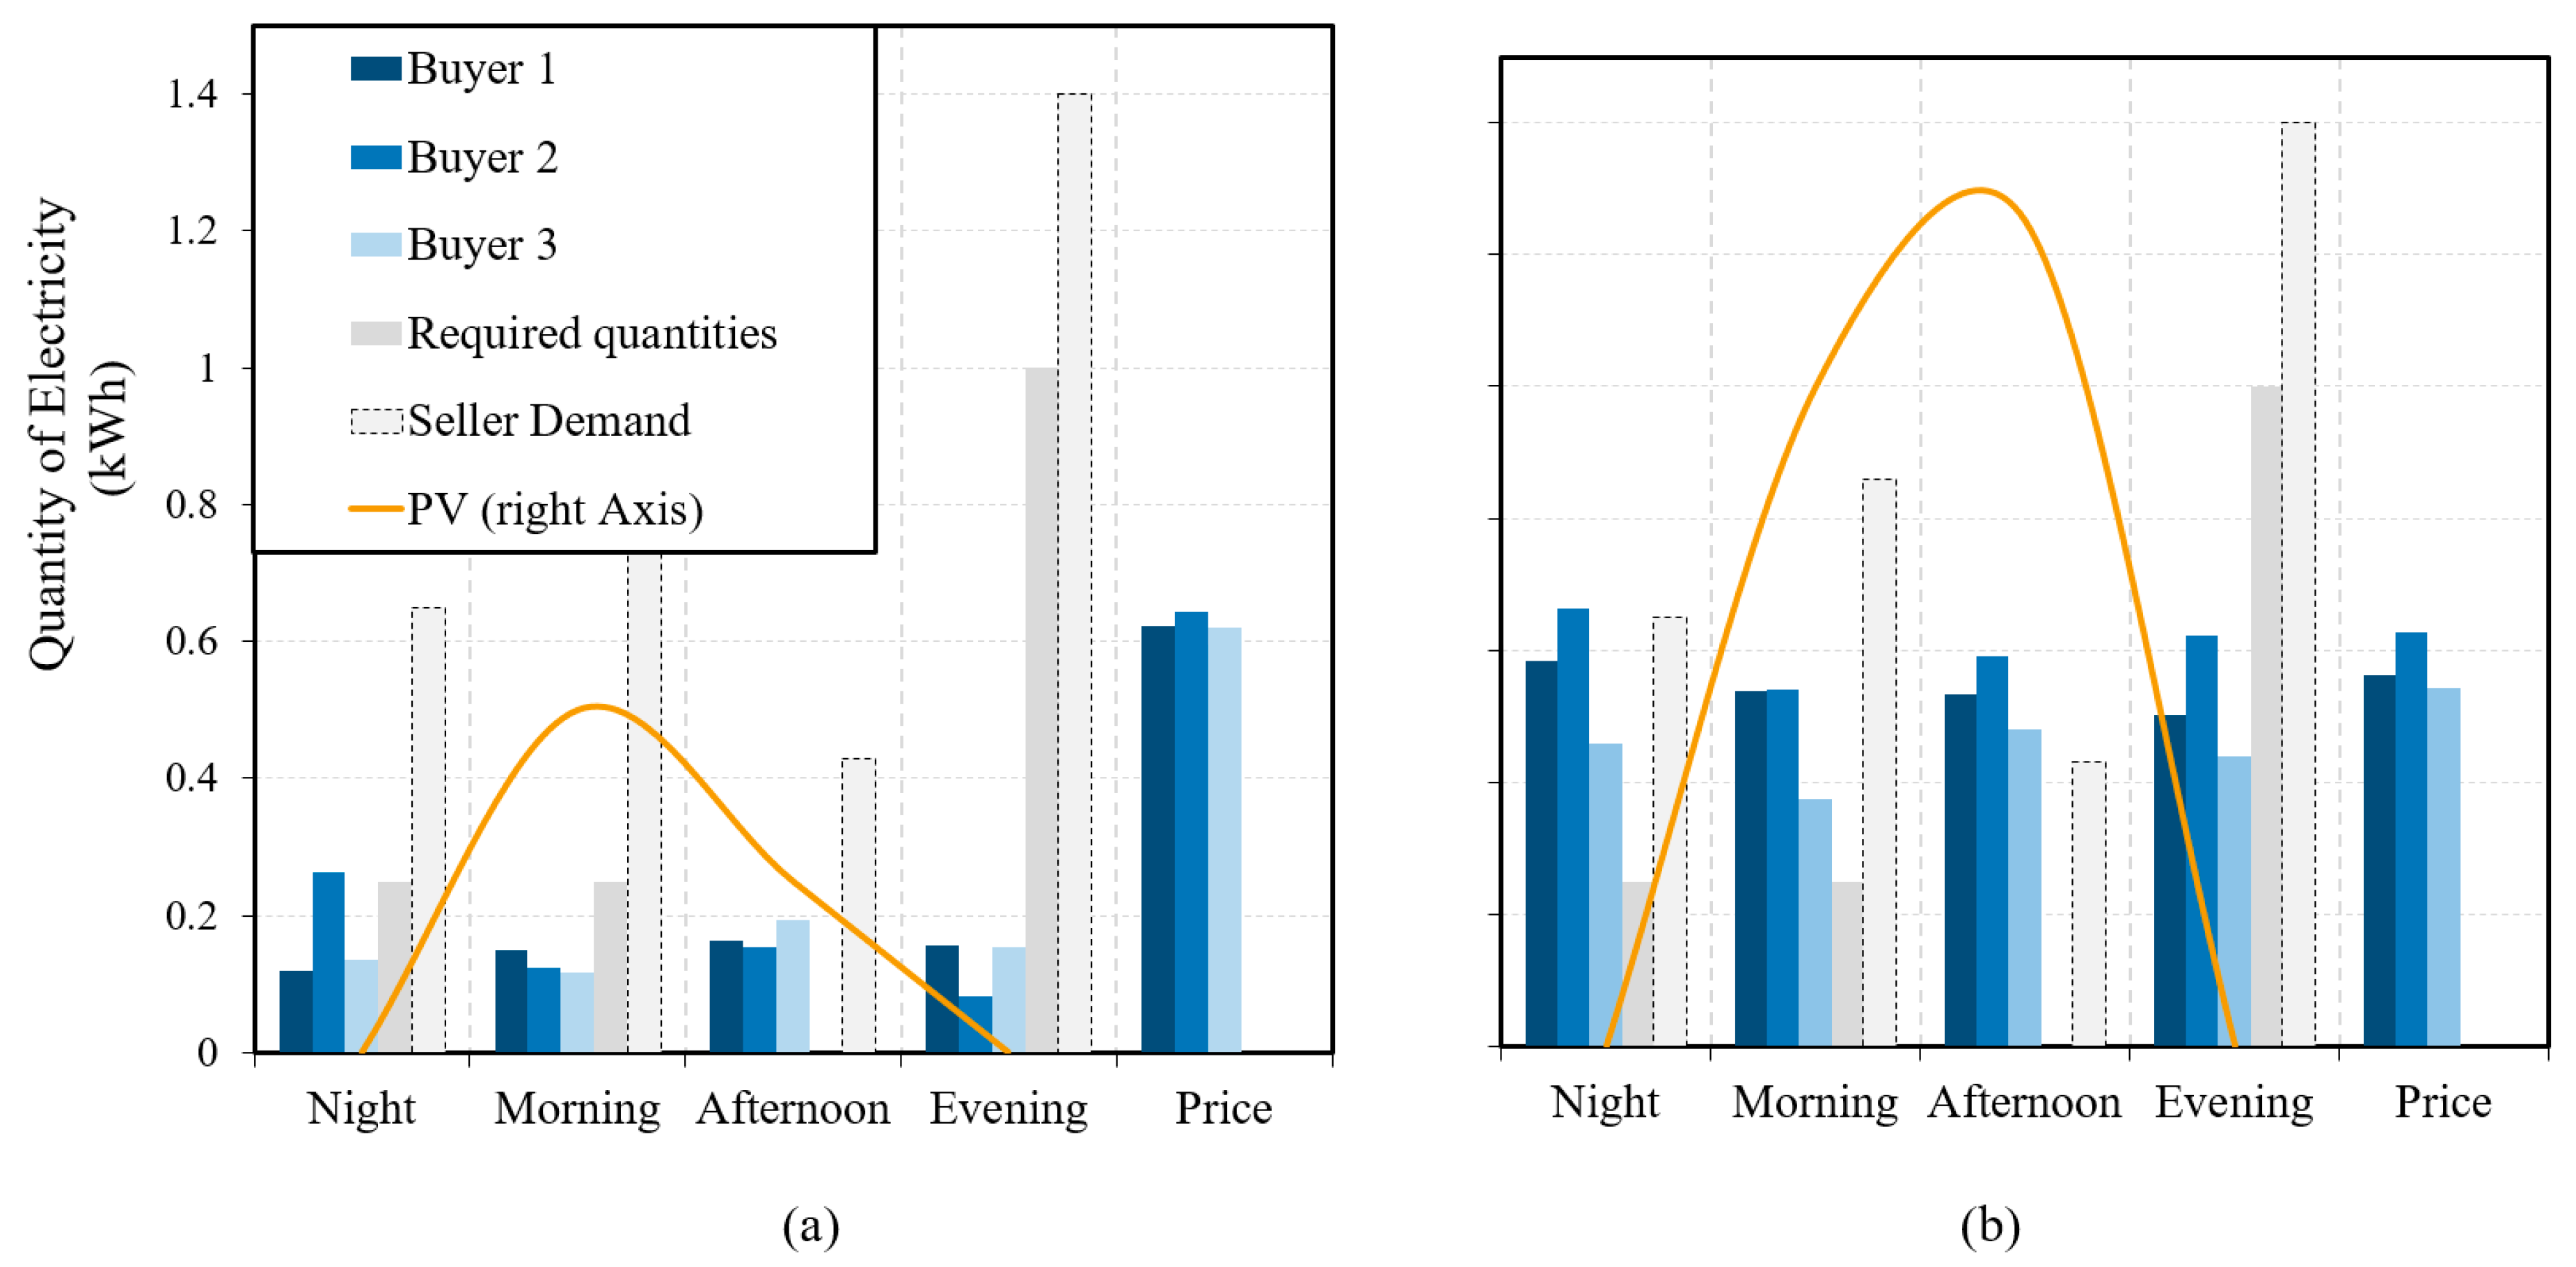
Similarly, Figure 2 displays the averaged outcomes over 100 negotiations in the case of zero intelligence agents (buyers and seller). Hence, the agents do not have any intelligence in their strategy, such that they end the negotiation anytime a negotiation round’s outcome gives a better utility than the previous round. Still, each outcome follows the buyer’s characteristics (preference for the energy cost or for the quantity of energy), which tends to validate the model proposed in this paper.
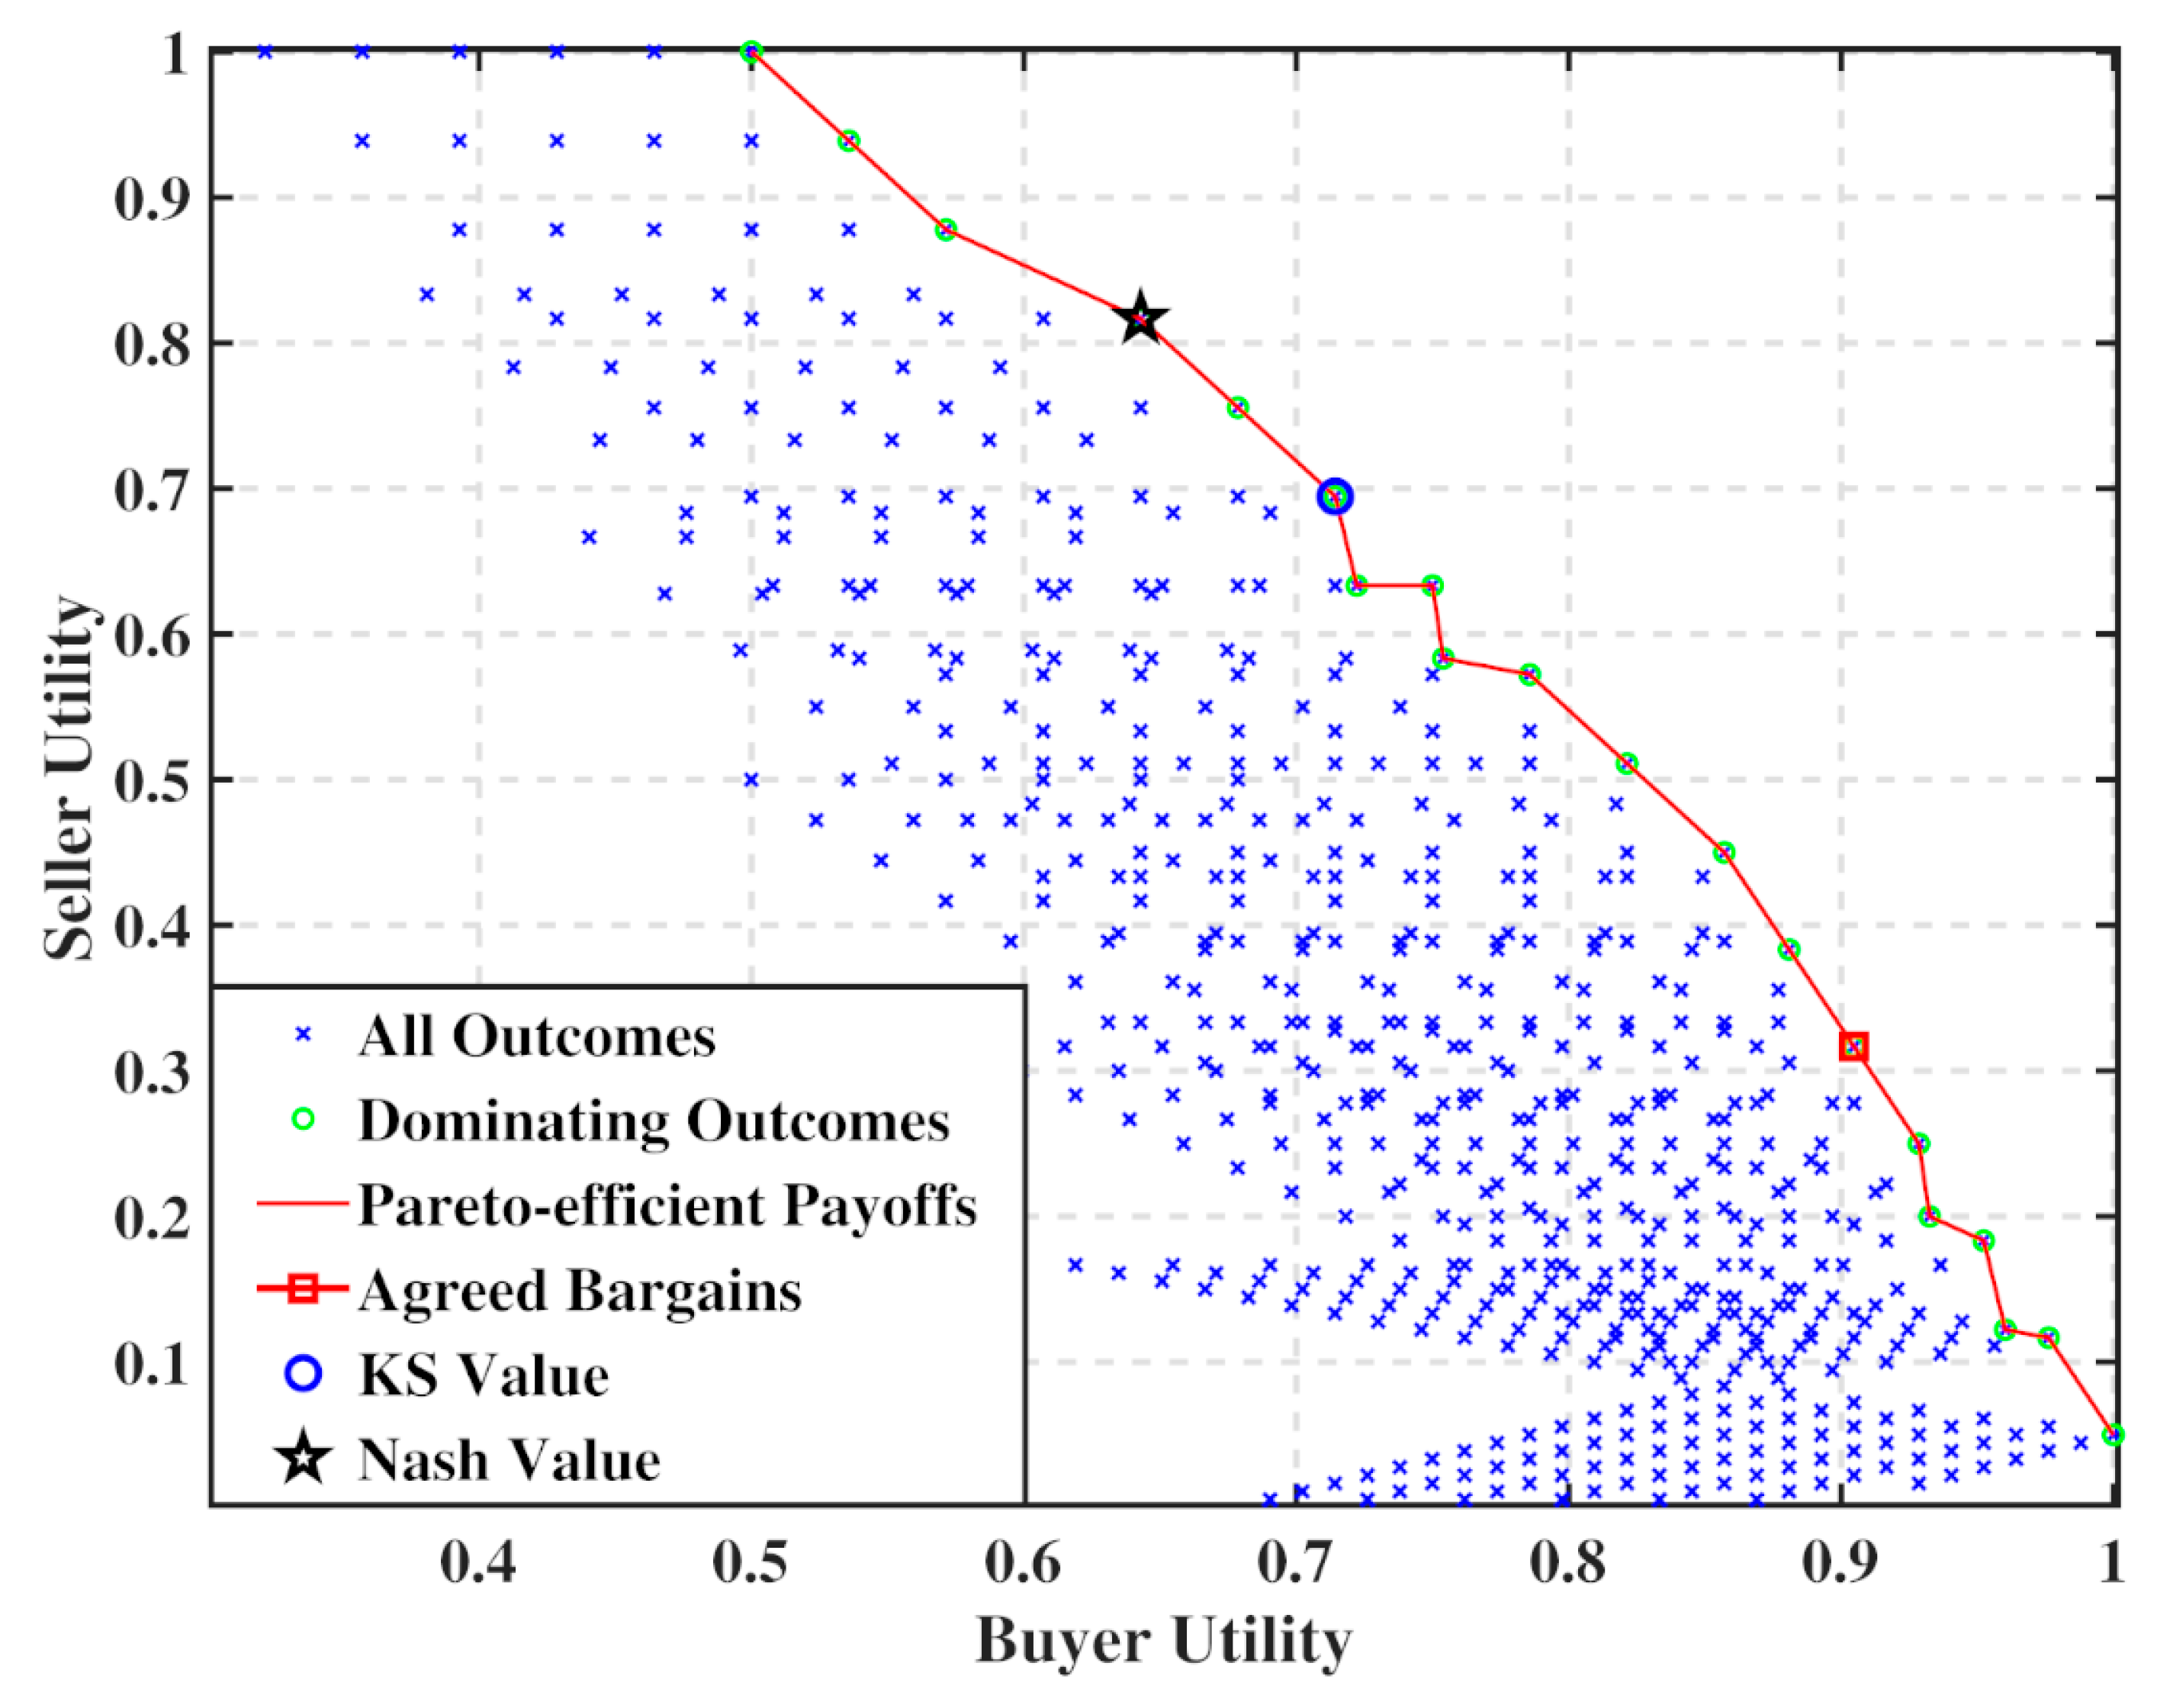
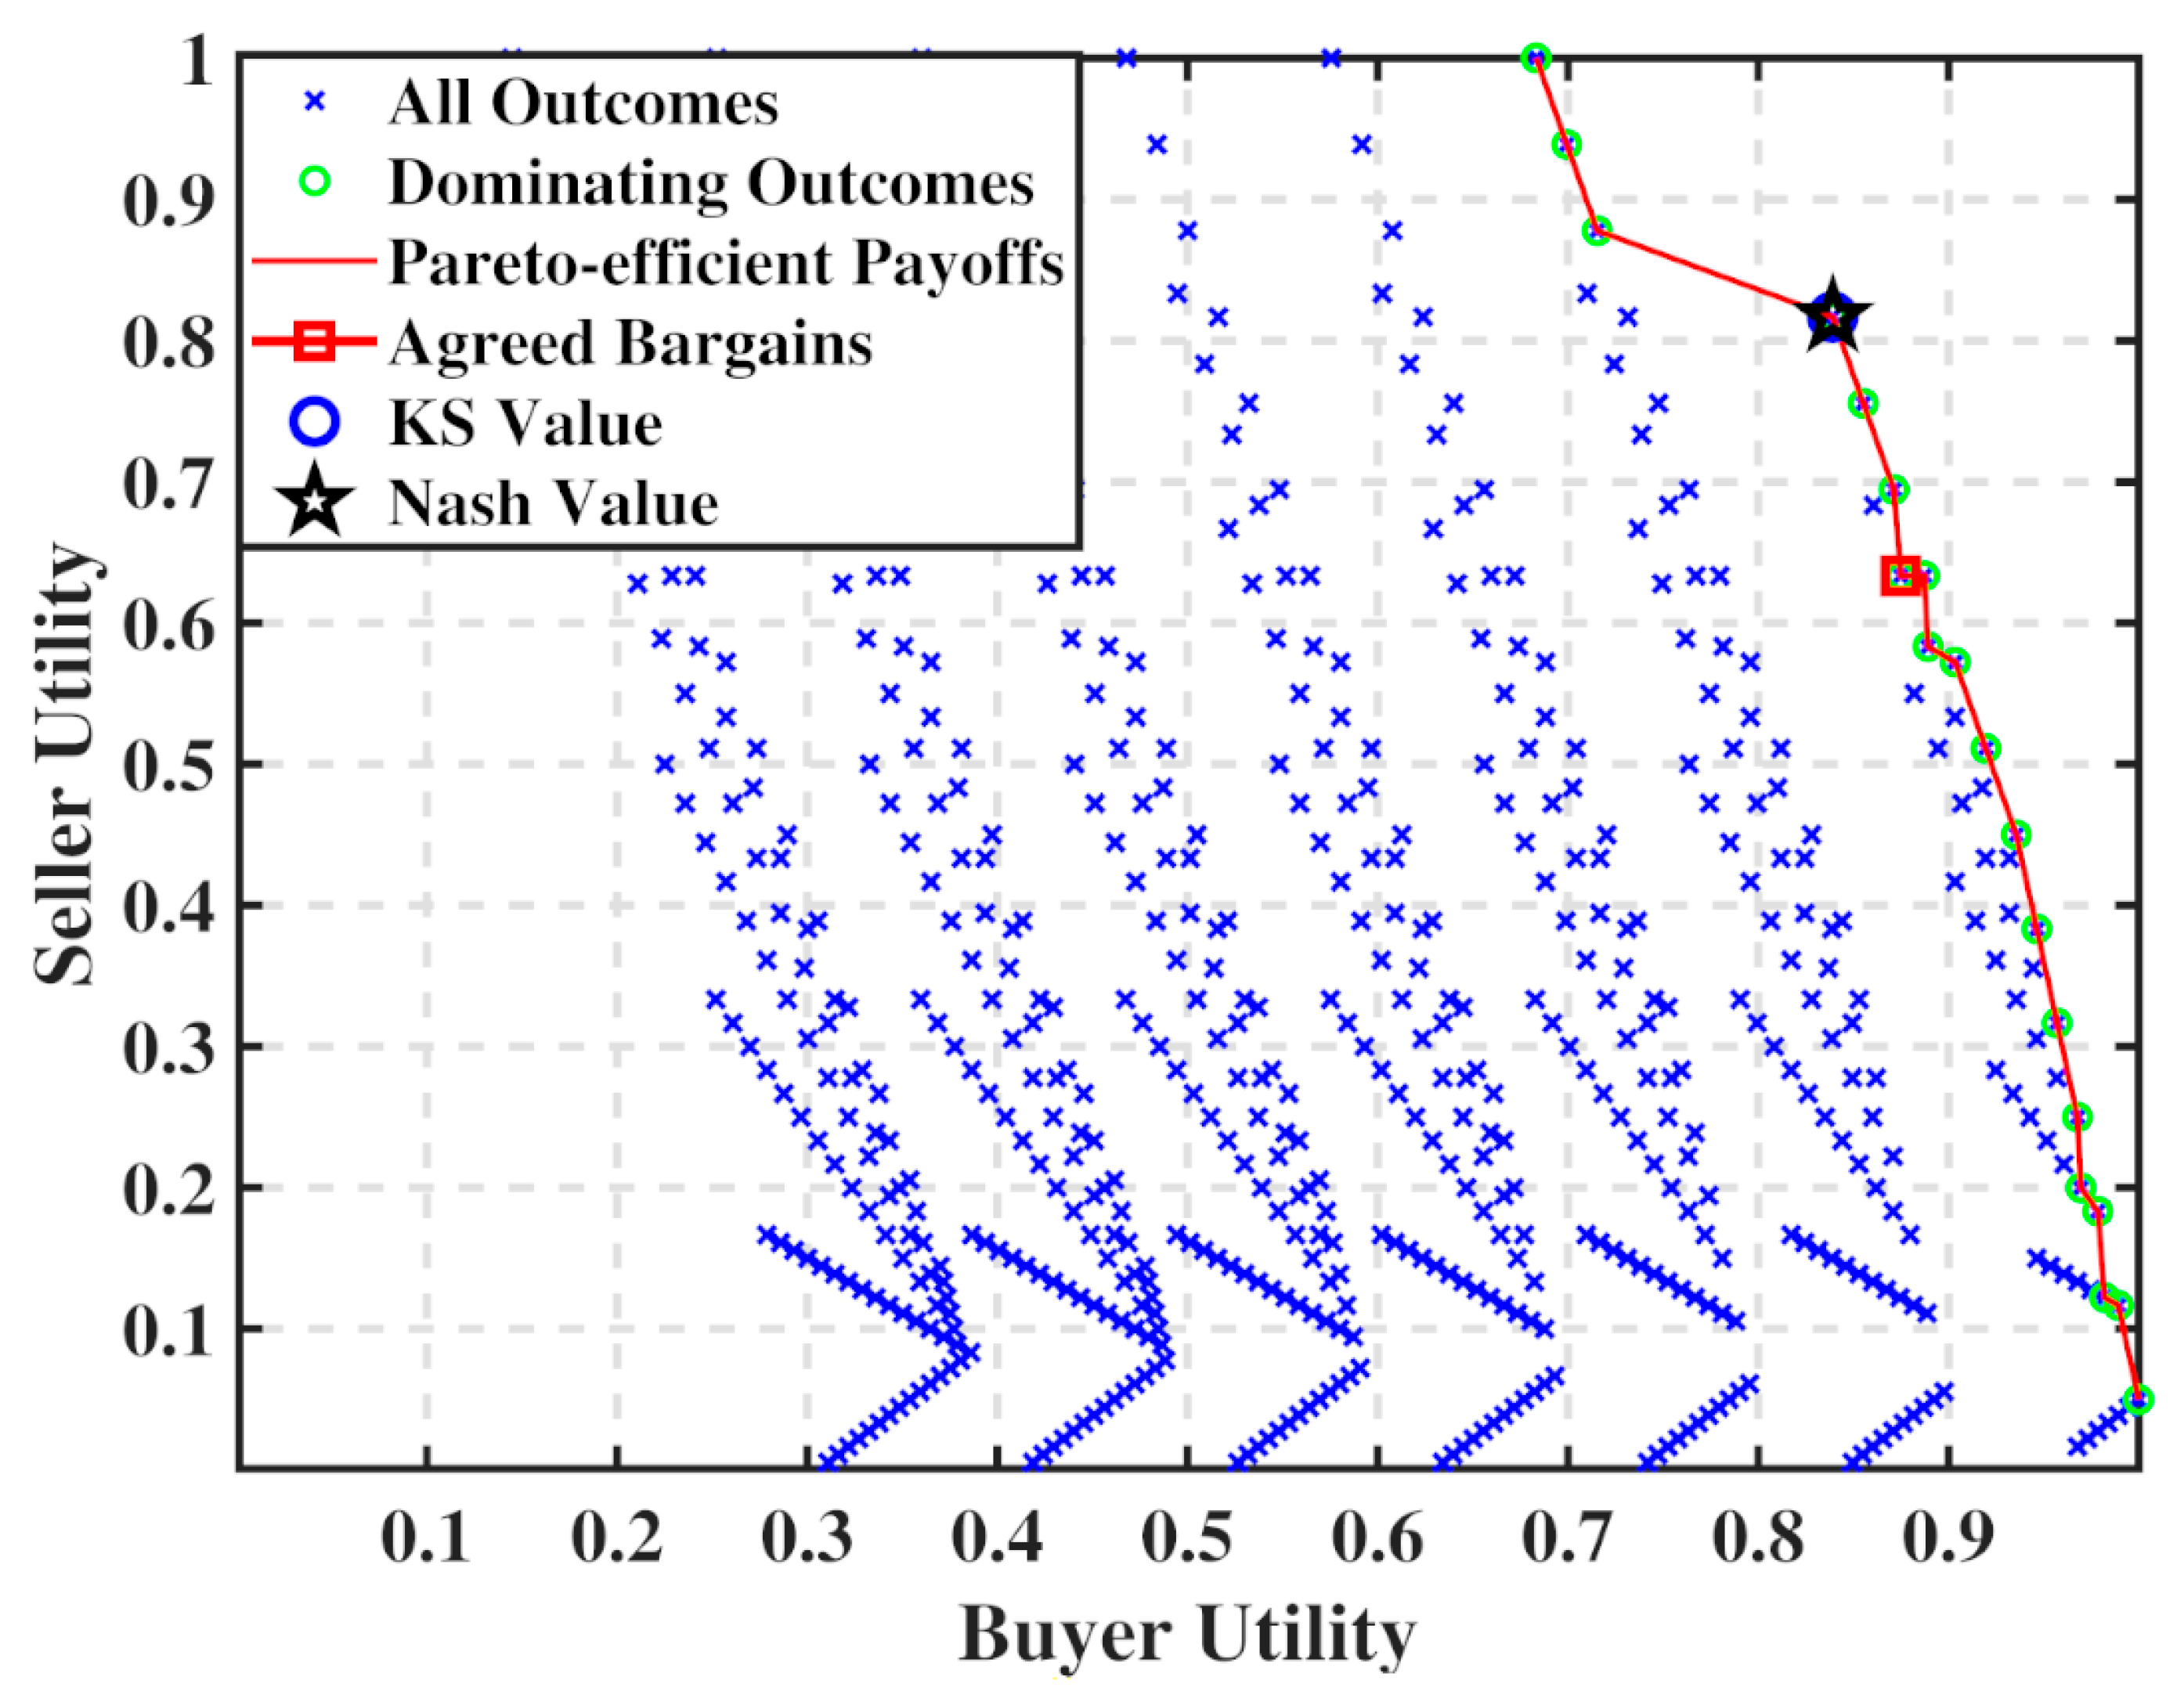
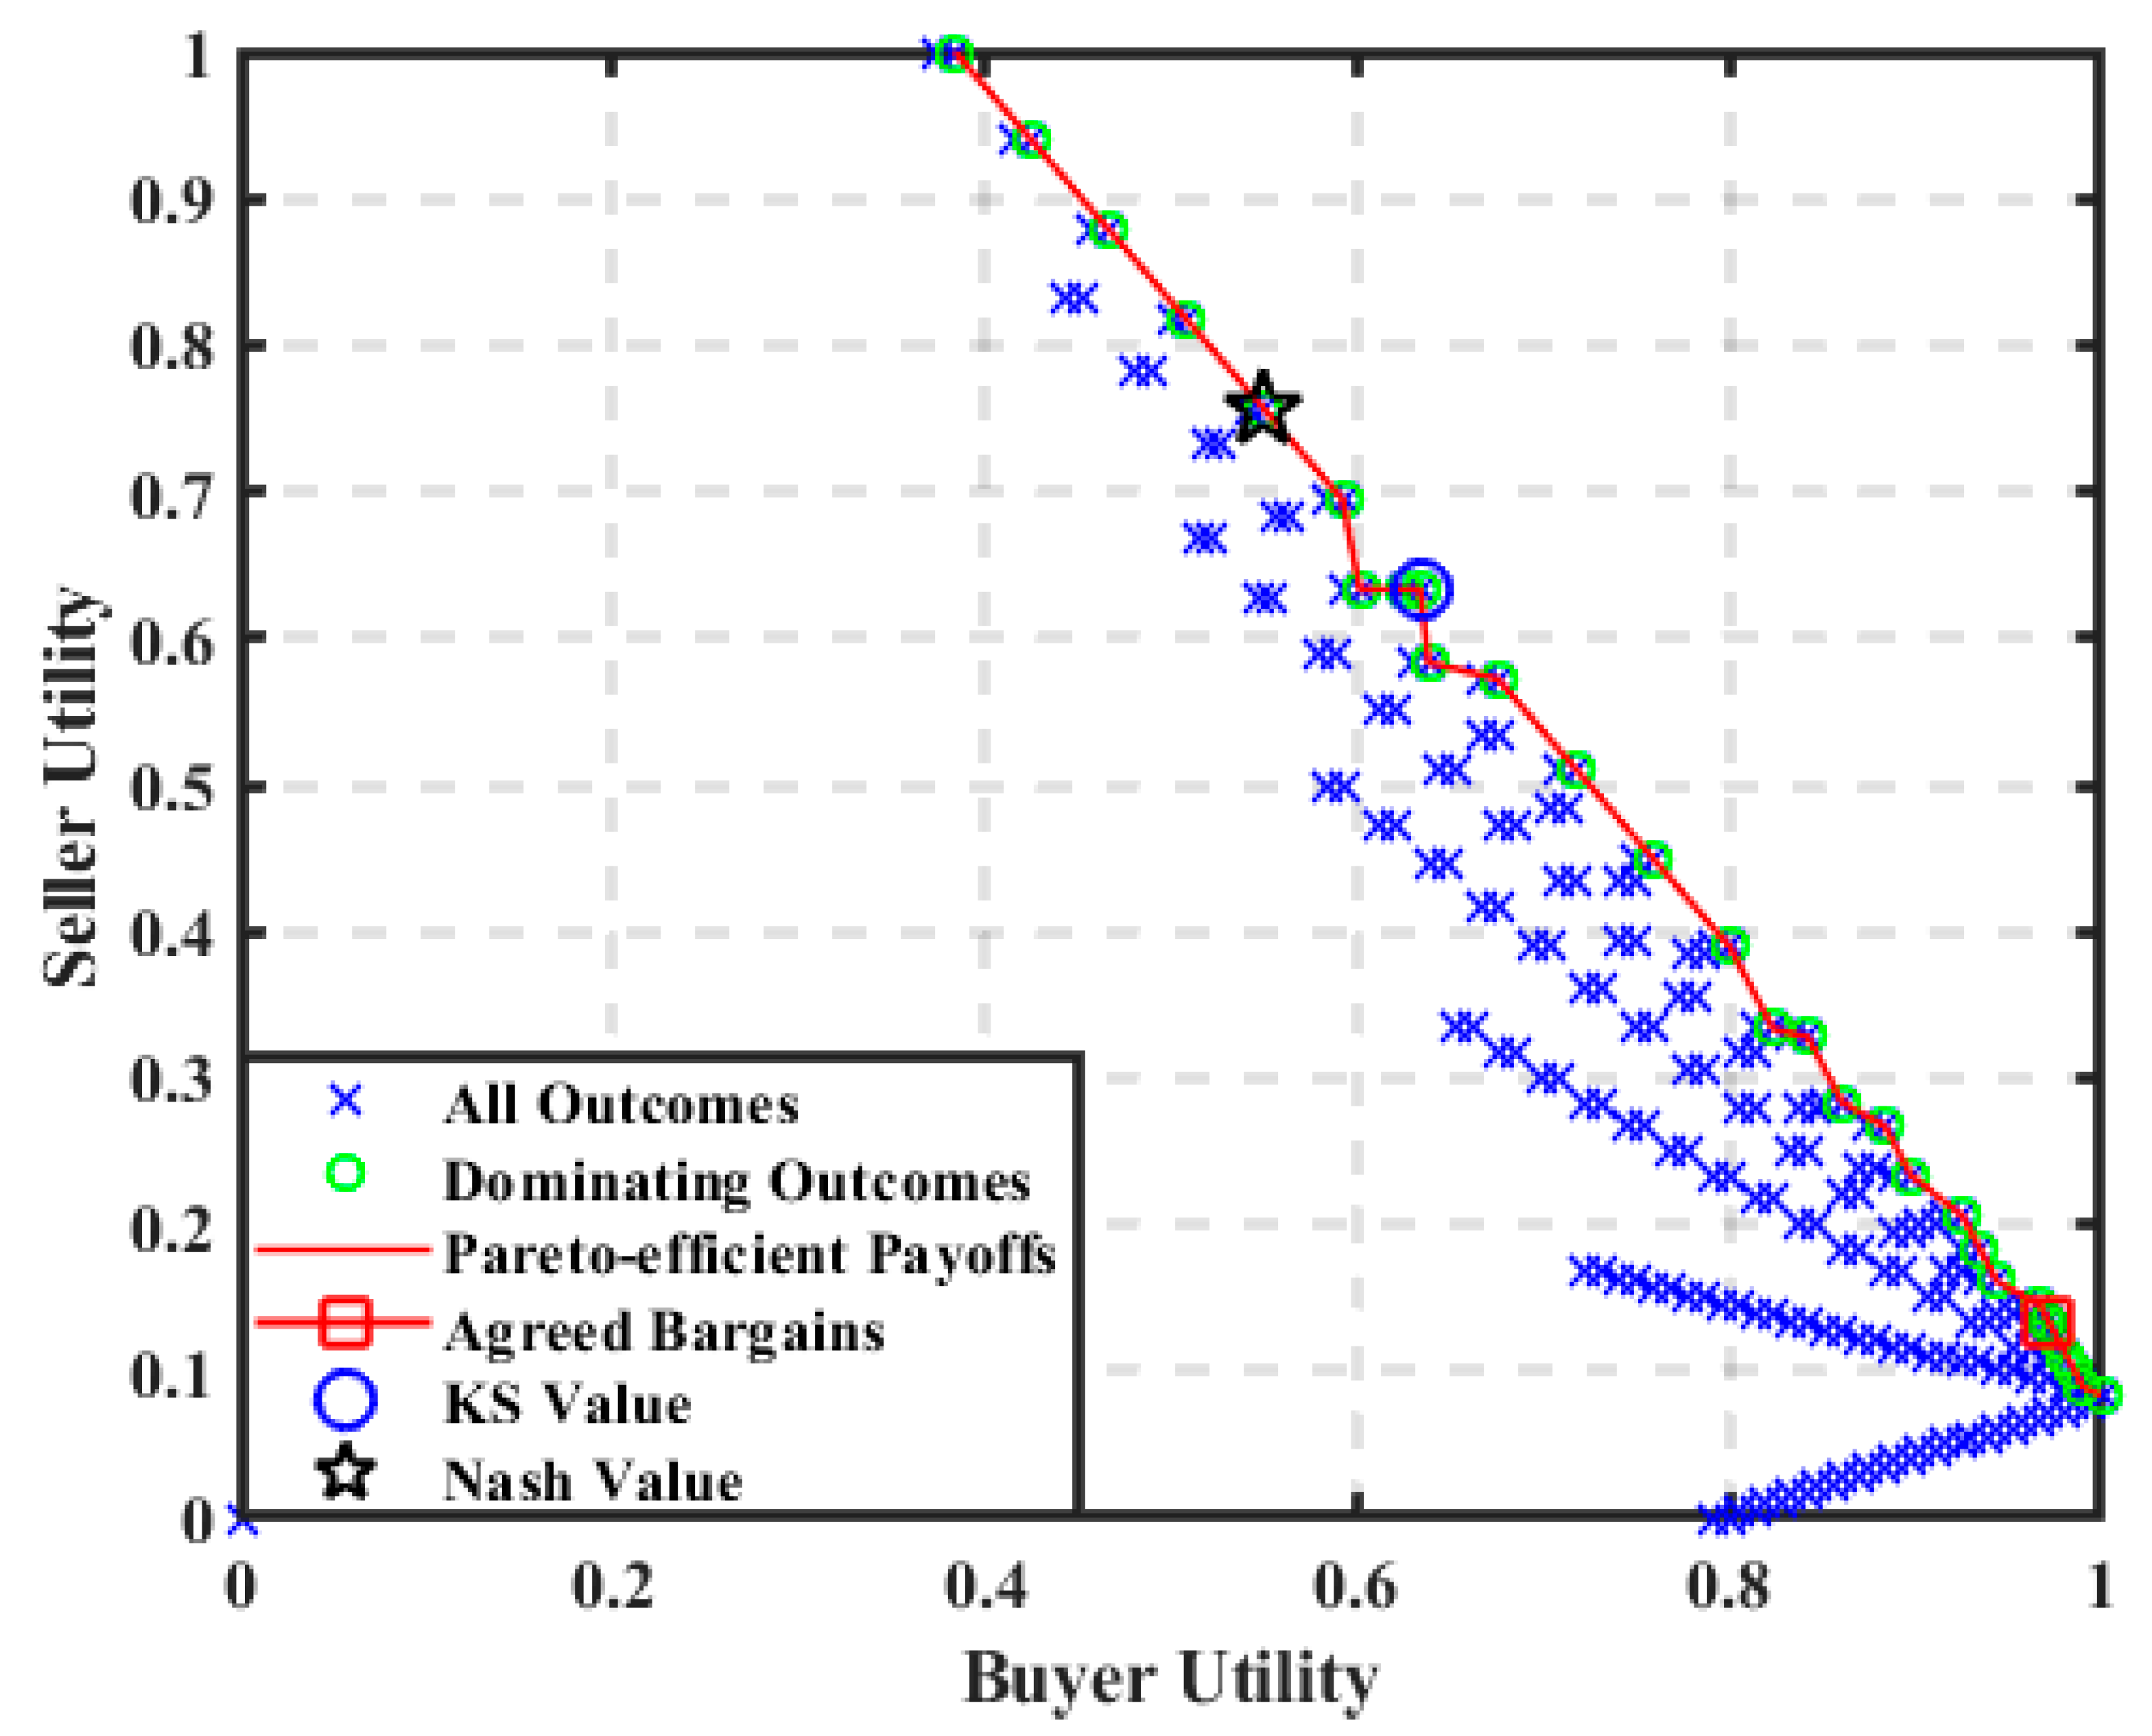
During a negotiation, different packages are proposed between the buyer and the seller. Figure 3 and Figure 4 show the space of all possible Sunny-Day negotiaton outcomes between seller expert agent and buyers 1 and 2 expert agents, respectively; while Figure 5 shows the negotiation domain-space for a buyer 3 (Tier 1 household) expert agent negotiating with a seller expert agent on a sunny day. Figure 3 shows that the obtained bargain for this particular scenario is efficient and provides a good utility to the buyer but quite low utility to the seller. This is due to the fact that the seller’s utility is proportional to the price, whereas the buyer’s utility is the sum between a term proportional to the price, and a term independent of the price (relative to the quantity of energy). This also explains the distance between the obtained bargain and the Nash (which maximizes the product of the two negotiating agents’ utilities) or Kalai–Smorodinsky (KS) (which maximizes the minimum) bargaining solutions [54]. The distance to these points (computed for each negotiation domain) is used in the negotiation literature as a measure of fairness of the agreed negotiation outcome. As explained above, given the difference in the way utilities are computed for the buyer and the seller, the Nash bargain corresponds to packages with the highest price. Such packages provide large utility for the seller, and not too small utility for the buyer as the quantities of energy are still fulfilling its needs. For buyer 2, its utility function is impacted more by the quantities of energy, and less by the price. Thus, the negotiation outcome in Figure 4 is mutually satisfying to both agents and also efficient with a shorter proximity to the Nash and KS bargaining solutions. More so, the concave outline of Figure 4 negotiation domain showcases the agents asymmetric preferences with buyer 2 having a higher preference for energy over price and the seller agent having a higher preference for price. Figure 5 also shows that a Tier 1 household with low energy demand and mainly concerned with the cost of electricity can benefit from such a local energy market. Unlike Figure 3 and Figure 4, the Pareto frontier in Figure 5 closely resembles a zero-sum game. Likewise, the sparsity of the space of possible outcomes shows the very limited agreeable outcomes available to both agents. This is because both negotiating agents are mainly concerned about the same issue—price; with the seller expert agent focused on maximizing its revenue and the buyer 3 expert agent interested in minimizing cost. Both agents reached an outcome more satisfactory to the buyer and less so to the seller; because of the small quantity of electricity agreed upon, relative to the total electricity available for sale by the seller. In all the negotiations, the obtained bargains are pareto efficient (as seen on the Pareto-Front), provided the flexibility for overconsumption (given by ) is close to 0.
4.2. Negotiation Strategies Comparison
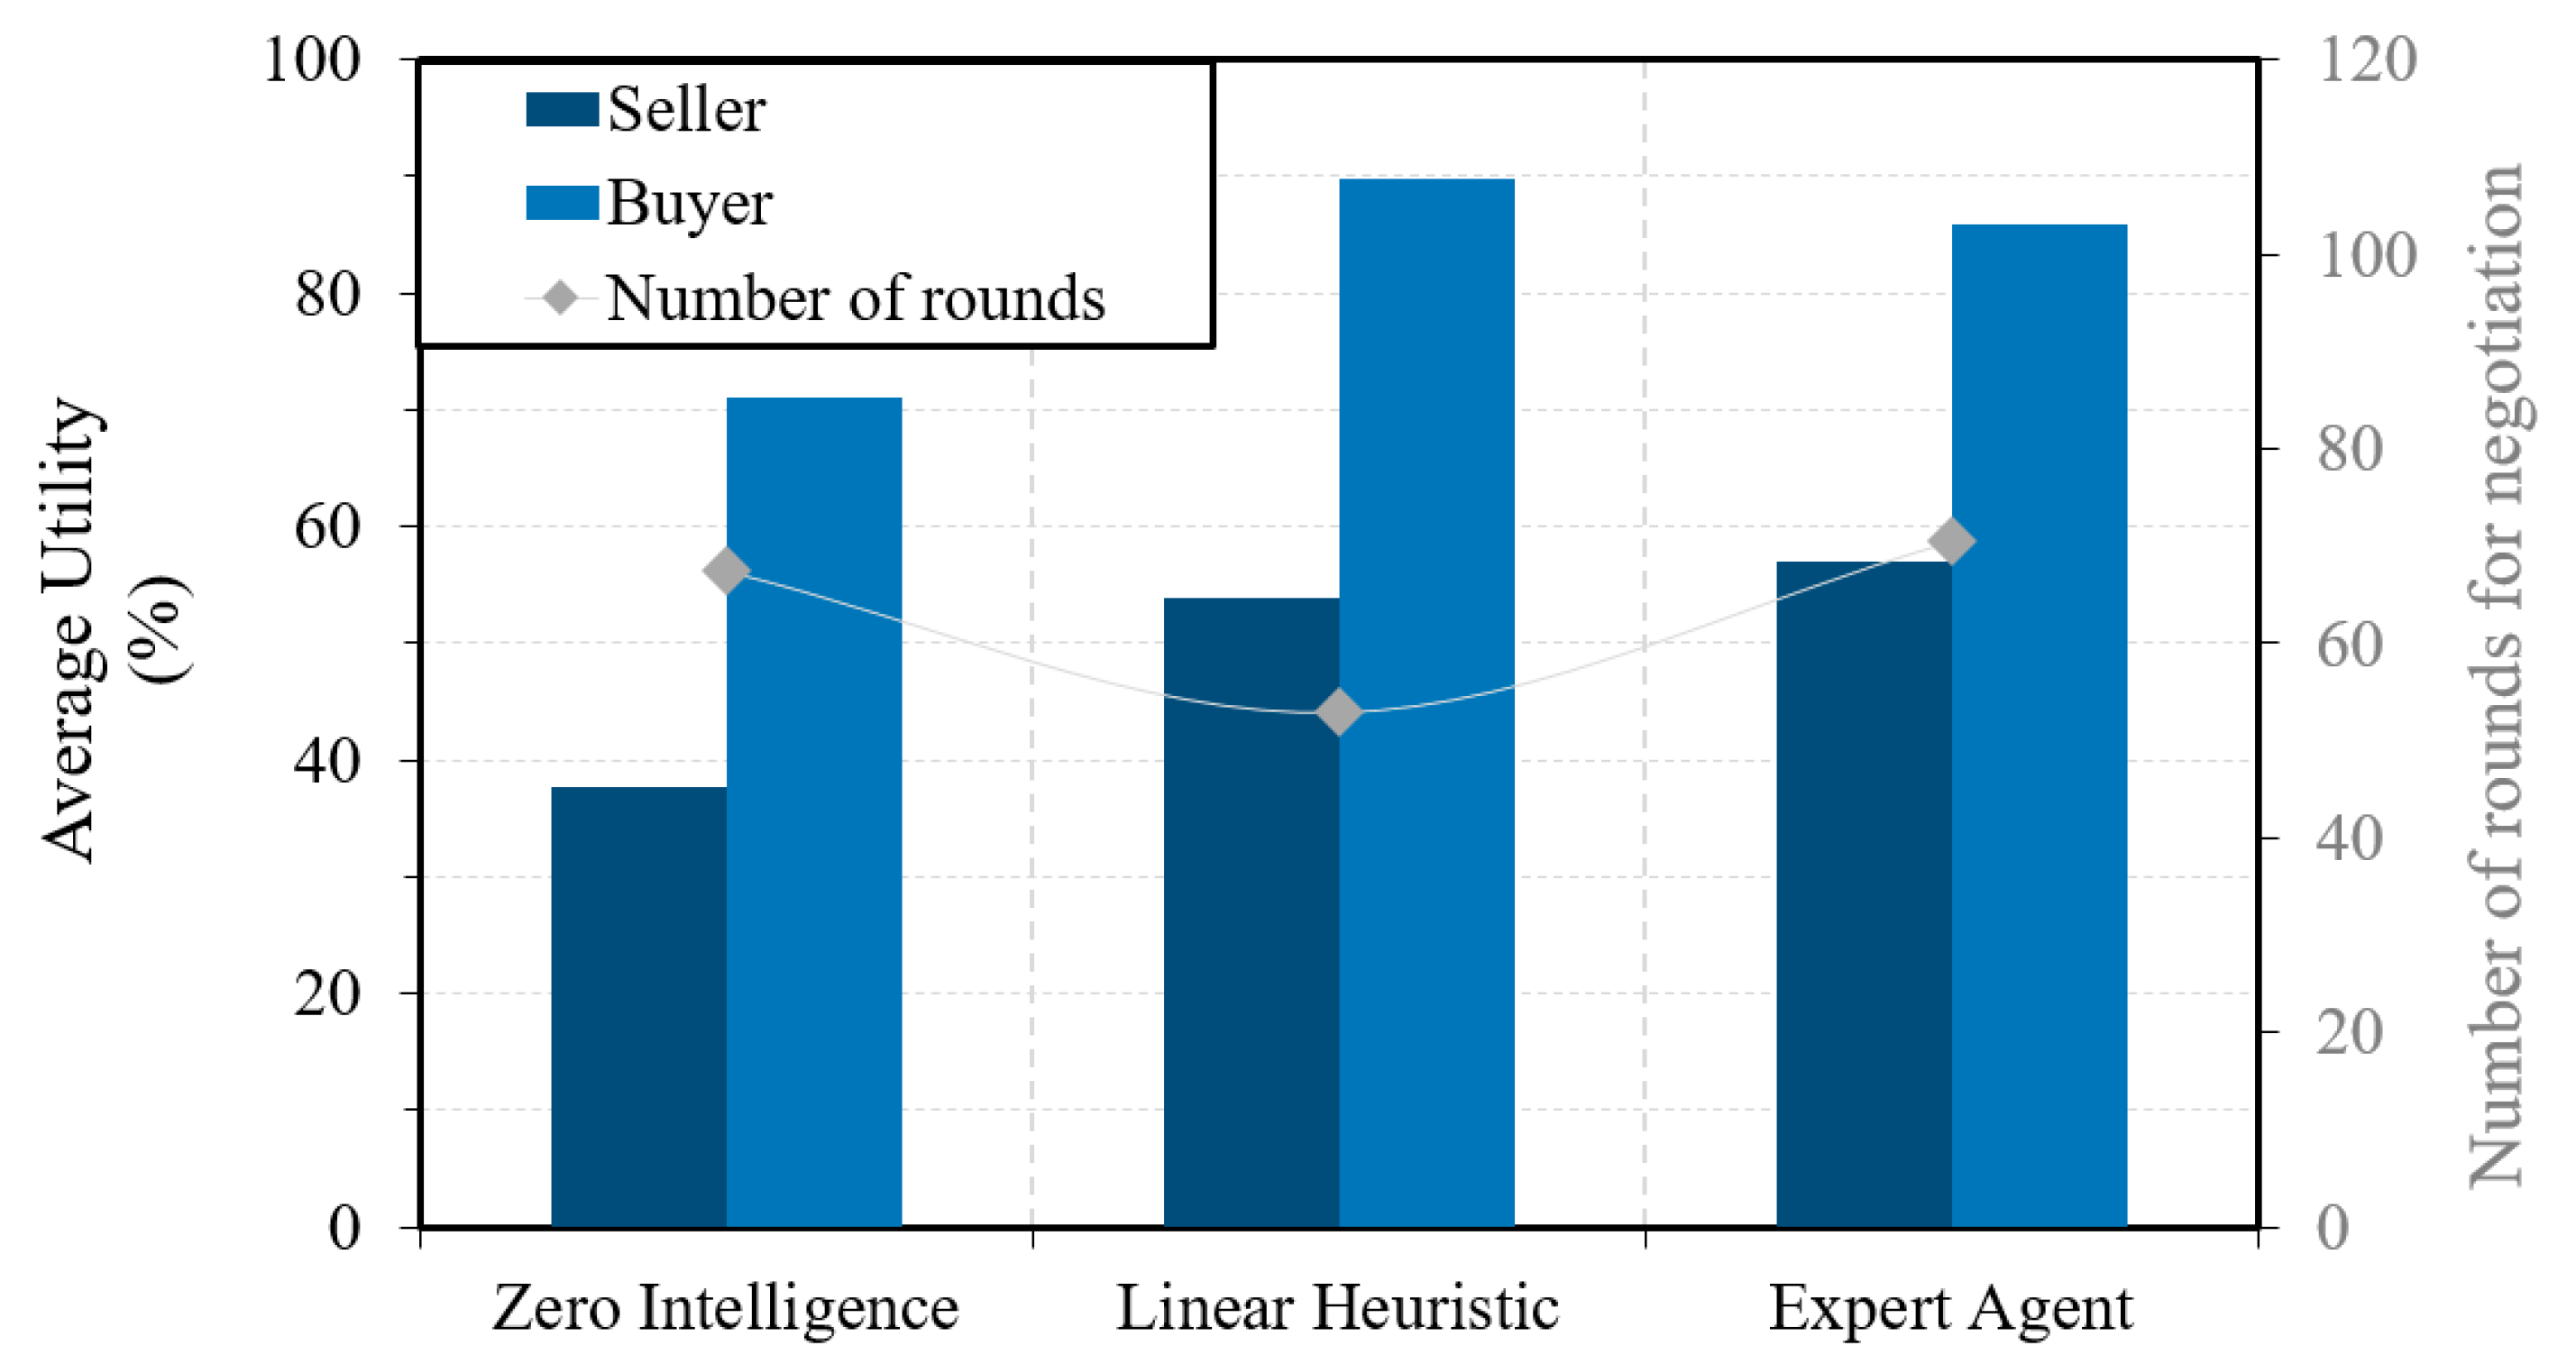
Now that the negotiation protocol and agents modelling have been successfully implemented, the different negotiation strategies for the buyers and the sellers are hereby compared. To carry out this study, only the case with enough energy to meet the seller and buyer’s demands was considered. Each negotiation strategy was implemented for the seller. For each implementation (strategy), the seller bilaterally negotiated with each of the three buyers (that is, one at a time), where all three buyers also implemented the three strategies alternatively. Outcomes from all the negotiations were averaged in order to compare the different strategies. For negotiations with a zero intelligence agent (based on random selection of packages), 100 negotiations were simulated, and the utility averaged over the 100 outcomes in order to obtain statistically reliable results. Figure 6 shows the average value of all obtained outcomes for the seller as a function of its strategy. When utilizing the expert agent strategy by the seller, the average outcome from its negotiations with the three buyers implementing each one of the three proposed strategies was 57%, while utilizing the linear heuristic strategy by the seller yielded 54%. The average outcomes a buyer can expect when negotiating with a seller are also shown. It was computed by averaging the outcomes from the three buyers implementing each one of the proposed strategies while negotiating with the seller who also implemented each one of the strategies. LH agents were observed to be more suitable for buyers, but this trend is mostly due to the negotiation outcomes from negotiations with zero intelligence (ZI) agents. When excluding the negotiations with ZI agents, LH and expert agents strategies give similar results.
Thus, linear heuristics and expert agents provide similar results in terms of utility outcomes, even if LH seem more efficient for sellers than buyers in the proposed context. Moreover, the number of iterations (rounds) to reach a deal is of high interest, in order to reduce the computational cost of the automated negotiation. As seen in Figure 6, the computational cost to reach an agreement is higher for an expert agent in general than for a linear heuristic strategy. This is due to the lower speed at which the expert agent increases the size of between two consecutive negotiation rounds, where is the set of feasible outcomes for round k.
5. Discussion
The implementation of the proposed agent modelling and framework to a rural area case of India demonstrated the benefits it could provide to a community, by allowing community members to access cheaper electricity and increase their energy consumption while providing extra-revenues to local prosumers. Indeed, consumers with price constraints were able to negotiate low prices for their electricity supply, whereas consumers attaching more importance to their electricity consumption than the cost of their energy supply were able to increase their energy access. Within a community, it is most likely that several profiles of consumers will be represented. Thus, utilizing automated one-to-one negotiations, prosumers will be able to make their energy surplus available to the community; where some consumers will mostly negotiate the price in order to meet their required consumption need; while others will be able to take advantage of the negotiations to increase their energy consumption until all the energy available has been used. Three negotiation strategies were also proposed and assessed within this study. The Boulware and linear heuristic based negotiation strategies obtained similar outcomes, although the linear heuristic strategy seems to be more suitable to buyer agents, in our analysis. Furthermore, linear heuristic strategies provide similar outcomes in a shorter time, which makes it an interesting strategy to be implemented in real life applications.
Hence, automated negotiations using such framework would also allow end users to take an active role in the electricity of retail markets in developed countries, as it is recommended by European policies. Indeed, [55] specifies the evolution of future European electricity markets, which should give citizens ownership of their electricity supply by providing them the possibility to trade their flexibility. It also specifies the principles of citizen energy communities that would be strongly enabled by automated negotiations, as it would allow community members to automatically access local electricity supply/demand at better costs. Indeed, automated negotiations at the peer-to-peer level is mostly applicable either in developing countries, especially where the grid is unreliable, or within a community in countries with a strong grid, as peers do not currently have the required power to enter the wholesale market [56]. At a community level, collective self-consumption and the emergence of the sharing economy for smart grids [57,58,59] provides a way for citizens to promote investment in DER while reducing their electricity bill [60], especially in Europe where P2P trading is likely to be supported by European policies [59]. Hence, automated negotiations as presented in this paper would provide a replicable framework that would allow citizen communities to maximize the quantity of self-consumed renewable energy at a low cost. Similarly, in other regions of the world, as the United States of America or the United Kingdom, Electricity Markets Authorities as OFGEM are drawing the principles of future supply markets [61] and discussing the possibility of a supplier hub [62] which could allow automated negotiations between producers and consumers. Hence, regulations are currently breaking down the barriers to flexibility, allowing flexible loads owners to contribute to the electricity markets [63]. In this context, automated negotiations would allow actors unfamiliar with the market context to easily agree on prices and quantities of electricity. However, several obstacles still exist to local energy markets, as the recent network charging evolution in the UK with the Targeted Charging Review [64] or with the trend towards half-hourly (or quarter-hourly in Belgium for example) settlement that would require negotiations to be done at the aggregator level instead of the end user level, as such short settlement time would require a very accurate forecast which is only achievable with aggregated loads.
6. Conclusions
This paper proposed a new automated negotiation framework for energy, including agents modelling, which demonstrated interesting benefits for rural areas in developing countries. The novelty of this framework mainly lies in the modelling of the negotiating agents and their strategies (buyers and sellers) in the energy domain. It allows these agents to configure their own preferences for energy or price and agree on a price and quantities of electricity for every considered period. This paper also presented the use of different negotiation strategies in the context of P2P energy markets. Using a case study specific to rural areas of India as an example, the experimental analysis demonstrated the benefits that the agents modelling and the negotiation protocol could provide to a community by increasing the access to low-cost electricity, while increasing local producers’ benefits. Hence, our work shows that P2P local energy markets using automated negotiations can be an important vector to support the economic development of these rural areas by improving access to electricity to consumers who would be cut off otherwise when the central power grid experiences power cuts. Future research will include many-to-many negotiations, where multiple buyers negotiate with multiple sellers in order to converge towards an equilibrium for the whole community, which will be representative of real-life scenario. Future research will also focus on the impacts of automated negotiations on voltage fluctuation and frequency regulation by implementing the proposed model into a community with an islanded constrained grid.
Author Contributions
Conceptualization, C.E. and V.R.; formal analysis, C.E. and B.C.; investigation, C.E. and C.O.; methodology, C.E. and V.R.; software, C.E., B.C., and C.O.; supervision, V.R. and W.-G.F.; validation, V.R., W.-G.F., and D.F.; visualization, B.C.; writing—original draft, C.E. and B.C.; writing—review and editing, V.R. All authors have read and agreed to the published version of the manuscript.
Funding
This research received no external funding
Acknowledgments
Christie Etukudor gratefully acknowledges the Nigerian Petroleum Technology Development Fund (PTDF) for sponsoring this work. Benoit Couraud, Valentin Robu, and David Flynn were supported by the UK EPSRC project Community-scale Energy Demand Reduction in India (CEDRI) [EP/R008655/1] and the InnovateUK Responsive Flexibility (ReFlex) project [ref:104780].
Conflicts of Interest
The authors declare no conflict of interest.
References
- UN Sustainable Development Goal 7. Ensure Access to Affordable, Reliable, Sustainable and Modern Energy. Available online: https://www.un.org/sustainabledevelopment/energy/ (accessed on 30 September 2019).
- International Energy Agency; International Renewable Energy Agency; United Nations; World Bank Group; World Health Organization. Tracking SDG 7: The Energy Progress Report 2019; Washington, DC, USA, 2019; Available online: https://trackingsdg7.esmap.org/downloads (accessed on 20 June 2019).
- Etukudor, C.; Abdulkareem, A.; Ayo, O. The Daunting Challenges of the Nigerian Electricity Supply Industry. J. Energy Technol. Policy 2015, 5, 25–32. [Google Scholar]
- Mahapatra, S.; Dasappa, S. Rural electrification: Optimising the choice between decentralised renewable energy sources and grid extension. Energy Sustain. Dev. 2012, 16, 146–154. [Google Scholar] [CrossRef]
- Berizzi, A.; Delfanti, M.; Falabretti, D.; Mandelli, S.; Merlo, M. Electrification Processes in Developing Countries: Grid Expansion, Microgrids, and Regulatory Framework. Proc. IEEE 2019, 107, 1–14. [Google Scholar] [CrossRef]
- Kothari, D.P. Energy problems facing the third world. In Proceedings of the 2009 Australasian Universities Power Engineering Conference, Adelaide, Australia, 27–30 September 2009; pp. 1–12. [Google Scholar]
- Nigerian Bulletin. Nigeria is Second Largest Market for Generator-Driven Economy in Africa. Available online: https://www.nigerianbulletin.com/threads/nigeria-is-second-largest-market-for-generator-driven-economy-in-africa.216809/ (accessed on 31 July 2018).
- Nwafor, P. Nigeria spends $5bn on generators annually. Available online: https://www.vanguardngr.com/2017/07/nigeria-spends-5bn-generators-annually/ (accessed on 31 July 2018).
- Ibhadode, O.; Tenebe, I.T.; Emenike, P.C.; Adesina, O.S.; Okougha, A.F.; Aitanke, F.O. Assessment of noise-levels of generator-sets in seven cities of South-Southern Nigeria. Afr. J. Sci. Technol. Innov. Dev. 2018, 10, 125–135. [Google Scholar] [CrossRef]
- Oguntoke, O.; Adeyemi, A. Degradation of urban environment and human health by emissions from fossil-fuel combusting electricity generators in Abeokuta metropolis, Nigeria. Indoor Built Environ. 2017, 26, 538–550. [Google Scholar] [CrossRef]
- ThisDay Editorial. Death from generator fumes. Available online: https://www.thisdaylive.com/index.php/2019/07/26/death-from-generator-fumes-2/ (accessed on 10 December 2019).
- Anyagafu, V.S. Nigeria records over 10,000 deaths through ‘generator’ fumes. Available online: https://www.vanguardngr.com/2014/08/nigeria-records-10000-deaths-generator-fumes/ (accessed on 10 December 2019).
- Lysen, E.H. Pico Solar PV Systems for Remote Homes; International Energy Agency: Paris, France, 2013; IEA-PVPS T9-12: 2012. [Google Scholar]
- Maher, P.; Smith, N.P.A.; Williams, A.A. Assessment of pico hydro as an option for off-grid electrification in Kenya. Renew. Energy 2003, 28, 1357–1369. [Google Scholar] [CrossRef]
- Kamalapur, G.D.; Udaykumar, R.Y. Rural electrification in India and feasibility of Photovoltaic Solar Home Systems. Int. J. Electr. Power Energy Syst. 2011, 33, 594–599. [Google Scholar] [CrossRef]
- Lemaire, X. Off-grid electrification with solar home systems: The experience of a fee-for-service concession in South Africa. Energy Sustain. Dev. 2011, 15, 277–283. [Google Scholar] [CrossRef]
- Chaurey, A.; Kandpal, T.C. A techno-economic comparison of rural electrification based on solar home systems and PV microgrids. Energy Policy 2010, 38, 3118–3129. [Google Scholar] [CrossRef]
- Raman, P.; Murali, J.; Sakthivadivel, D.; Vigneswaran, V.S. Opportunities and challenges in setting up solar photo voltaic based micro grids for electrification in rural areas of India. Renew. Sustain. Energy Rev. 2012, 16, 3320–3325. [Google Scholar] [CrossRef]
- International Energy Agency; International Renewable Energy Agency; United Nations; World Bank Group; World Health Organization. Tracking SDG7: The Energy Progress Report 2018; World Bank: Washington, DC, USA, 2018. [Google Scholar]
- GSES. Oversized PV Arrays and battery days of autonomy in stand-alone power systems. In Design, Technical Articles, Technology; Global Sustainable Energy Solutions: BOTANY NSW, Australia, 2019. [Google Scholar]
- Fairley, P. Swarm Electrification Powers Villages in Bangladesh. IEEE Spectr. 2018, 55. [Google Scholar] [CrossRef]
- Sousa, T.; Soares, T.; Pinson, P.; Moret, F.; Baroche, T.; Sorin, E. Peer-to-peer and community-based markets: A comprehensive review. Renew. Sustain. Energy Rev. 2019, 104, 367–378. [Google Scholar] [CrossRef] [Green Version]
- Park, C.; Yong, T. Comparative review and discussion on P2P electricity trading. Energy Procedia 2017, 128, 3–9. [Google Scholar] [CrossRef]
- Jogunola, O.; Ikpehai, A.; Anoh, K.; Adebisi, B.; Hammoudeh, M.; Son, S.-Y.; Harris, G. State-of-the-art and prospects for peer-to-peer transaction-based energy system. Energies 2017, 10, 2106. [Google Scholar] [CrossRef] [Green Version]
- Long, C.; Wu, J.; Zhang, C.; Thomas, L.; Cheng, M.; Jenkins, N. Peer-to-peer energy trading in a community microgrid. In Proceedings of the 2017 IEEE Power & Energy Society General Meeting, Chicago, IL, USA, 16–20 July 2017; pp. 1–5. [Google Scholar]
- Andoni, M.; Robu, V.; Flynn, D.; Abram, S.; Geach, D.; Jenkins, D.; McCallum, P.; Peacock, A. Blockchain technology in the energy sector: A systematic review of challenges and opportunities. Renew. Sustain. Energy Rev. 2019, 100, 143–174. [Google Scholar] [CrossRef]
- Andoni, M.; Robu, V.; Flynn, D. Blockchains: Crypto-control your own energy supply. Nature 2017, 548, 158. [Google Scholar] [CrossRef] [Green Version]
- Jogunola, O.; Adebisi, B.; Anoh, K.; Ikpehai, A.; Hammoudeh, M.; Harris, G.; Gacanin, H. Distributed adaptive primal algorithm for P2P-ETS over unreliable communication links. Energies 2018, 11, 2331. [Google Scholar] [CrossRef] [Green Version]
- Kahrobaee, S.; Rajabzadeh, R.A.; Soh, L.-K.; Asgarpoor, S. Multiagent study of smart grid customers with neighborhood electricity trading. Electr. Power Syst. Res. 2014, 111, 123–132. [Google Scholar] [CrossRef]
- Mengelkamp, E.; Gärttner, J.; Rock, K.; Kessler, S.; Orsini, L.; Weinhardt, C. Designing microgrid energy markets: A case study: The Brooklyn Microgrid. Appl. Energy 2018, 210, 870–880. [Google Scholar] [CrossRef]
- Zhang, C.; Wu, J.; Zhou, Y.; Cheng, M.; Long, C. Peer-to-Peer energy trading in a Microgrid. Appl. Energy 2018, 220, 1–12. [Google Scholar] [CrossRef]
- Enerchain P2P Trading Project. European Energy Trading Firms Test Peer-to-Peer Trading Over Blockchain; Enerchain P2P Trading Project: Hamburg, Germany, 2017. [Google Scholar]
- Ilic, D.; Da Silva, P.G.; Karnouskos, S.; Griesemer, M. An energy market for trading electricity in smart grid neighbourhoods. In Proceedings of the 2012 6th IEEE International Conference on Digital Ecosystems and Technologies (DEST), Campione d’Italia, Italy, 18–20 June 2012; pp. 1–6. [Google Scholar]
- Pouttu, A.; Haapola, J.; Ahokangas, P.; Xu, Y.; Kopsakangas-Savolainen, M.; Porras, E.; Matamoros, J.; Kalalas, C.; Alonso-Zarate, J.; Gallego, F.D.; et al. P2P model for distributed energy trading, grid control and ICT for local smart grids. In Proceedings of the 2017 European Conference on Networks and Communications (EuCNC), Oulu, Finland, 12–15 June 2017; pp. 1–6. [Google Scholar]
- Mengelkamp, E.; Staudt, P.; Garttner, J.; Weinhardt, C. Trading on local energy markets: A comparison of market designs and bidding strategies. In Proceedings of the 14th International Conference on the European Energy Market, EEM, Dresden, Germany, 6–9 June 2017. [Google Scholar]
- Narayanan, A.; Haapaniemi, J.; Kaipia, T.; Partanen, J. Economic impacts of power-based tariffs on peer-to-peer electricity exchange in community microgrids. In Proceedings of the International Conference on the European Energy Market, EEM, Lodz, Poland, 27–29 June 2018. [Google Scholar]
- Alam, M.R.; St-Hilaire, M.; Kunz, T. An optimal P2P energy trading model for smart homes in the smart grid. Energy Effic. 2017. [Google Scholar] [CrossRef]
- Moret, F.; Pinson, P. Energy Collectives: A Community and Fairness Based Approach to Future Electricity Markets. IEEE Trans. Power Syst. 2019, 34, 3994–4004. [Google Scholar] [CrossRef] [Green Version]
- Sorin, E.; Bobo, L.; Pinson, P. Consensus-based approach to peer-to-peer electricity markets with product differentiation. IEEE Trans. Power Syst. 2018, 34, 994–1004. [Google Scholar] [CrossRef] [Green Version]
- Costantini, S.; Tocchio, A.; Tsintza, P. A heuristic approach to P2P negotiation. In Computational Logic in Multi-Agent Systems: 8th International Workshop, CLIMA VIII, Porto, Portugal, 10–11 September 2007: Revised Selected and Invited Papers; Sadri, F., Ed.; Springer: Berlin/Heidelberg, Germany, 2008; Volume 5056, pp. 177–192. [Google Scholar]
- Jonker, C.; Robu, V.; Treur, J. An agent architecture for multi-attribute negotiation using incomplete preference information. Auton. Agents Multi-Agent Syst. 2007, 15, 221–252. [Google Scholar] [CrossRef] [Green Version]
- Weinhardt, C.; Block, C.; Collins, J.; Ketter, W. A Multi-Agent Energy Trading Competition. In ERIM Report Series: Report in management; ERIM is the Joint Research Institute of the Rotterdam School of Management, Erasmus University and the Erasmus School of Economics (ESE) at Erasmus University Rotterdam; Erasmus Research Institute of Management (ERIM): Rotterdam, The Netherlands, 2009; Volume ERS-2009-054-LIS, p. 25. [Google Scholar]
- Capodieci, N.; Cabri, G.; Pagani, G.A.; Aiello, M. Adaptive game-based agent negotiation in deregulated energy markets. In Proceedings of the 2012 International Conference on Collaboration Technologies and Systems (CTS), Denver, CO, USA, 21–25 May 2012; pp. 300–307. [Google Scholar]
- Morstyn, T.; Teytelboym, A.; Mcculloch, M.D. Bilateral Contract Networks for Peer-to-Peer Energy Trading. IEEE Trans. Smart Grid 2019, 10, 2026–2035. [Google Scholar] [CrossRef]
- Moret, F.; Baroche, T.; Pinson, P.; Sorin, E. Negotiation algorithms for peer-to-peer electricity markets: Computational properties. In Proceedings of the 2018 Power Systems Computation Conference (PSCC), Dublin, Ireland, 11–15 June 2018. [Google Scholar]
- Spasova, B.; Kawamoto, D.; Takefuji, Y. Evaluation of the Effects of Bidding Strategy with Customized Pricing on the Individual Prosumer in a Local Energy Market. Adv. Sci. Technol. Eng. Syst. J. 2019, 44, 366–379. [Google Scholar] [CrossRef]
- Amato, A.; Aversa, R.; Di Martino, B.; Scialdone, M.; Venticinque, S.; Hallsteinsen, S.; Horn, G. Software Agents for Collaborating Smart Solar-Powered Micro-Grids. In Lecture Notes in Information Systems and Organisation; Caporarello, L., Di Martino, B., Martinez, M., Eds.; Springer: Cham, Switzerland, 2014; Volume 7. [Google Scholar]
- Abdella, J.; Shuaib, K. Peer to peer distributed energy trading in smart grids: A survey. Energies 2018, 11, 1560. [Google Scholar] [CrossRef] [Green Version]
- Alam, M.; Gerding, E.H.; Rogers, A.; Ramchurn, S.D. A scalable, decentralized multi-issue negotiation protocol for energy exchange. In Proceedings of the International Joint Conference on Artificial Intelligence (IJCAI), Buenos Aires, Argentina, 25 July–1 August 2015. [Google Scholar]
- Chakraborty, S.; Baarslag, T.; Kaisers, M. Energy Contract Settlements through Automated Negotiation in Residential Cooperatives. arXiv 2018, arXiv:1807.10978. [Google Scholar]
- Rubinstein, A. Perfect Equilibrium in a Bargaining Model. Econom. J. Econom. Soc. 1982, 50, 97–109. [Google Scholar] [CrossRef] [Green Version]
- Faratin, P.; Sierra, C.; Jennings, N.R. Negotiation decision functions for autonomous agents. Robot. Auton. Syst. 1998, 24, 159–182. [Google Scholar] [CrossRef] [Green Version]
- Bhatia, M.; Angelou, N. Beyond Connections: Energy Access Redefined; World Bank: Washington, DC, USA, 2015; Available online: https://openknowledge.worldbank.org/handle/10986/24368 (accessed on 20 July 2018).
- Raiffa, H. The Art and Science of Negotiation; Harvard University: Cambridge, MA, USA, 1982. [Google Scholar]
- European Parliament; Council of the European Union. Directive (EU) 2019/994 of the European Parliament and of the Council on Common Rules for the Internal Market for Electricity and Amending Directive 2012/27/EU; 2019. Available online: https://eur-lex.europa.eu/eli/dir/2019/944/oj?eliuri=eli:dir:2019:944:oj (accessed on 21 January 2020).
- Ivanova, V.; Griffa, A.; Elks, S. The Policy and Regulatory Context for New Local Energy Markets; Energy Systems Catapult: BHX, UK, 2019. [Google Scholar]
- Kalathil, D.; Wu, C.; Poolla, K.; Varaiya, P. The Sharing Economy for the Electricity Storage. IEEE Trans. Smart Grid 2019, 10, 556–567. [Google Scholar] [CrossRef]
- Henriquez-Auba, R.; Pauli, P.; Kalathil, D.; Callaway, D.S.; Poolla, K. The Sharing Economy for Residential Solar Generation. In Proceedings of the 2018 IEEE Conference on Decision and Control (CDC), Miami Beach, FL, USA, 17–19 December 2018; pp. 7322–7329. [Google Scholar]
- van Soest, H. Peer-to-peer electricity trading: A review of the legal context. Compet. Regul. Netw. Ind. 2018, 19, 180–199. [Google Scholar] [CrossRef]
- Smarter Together. Report on Collective Self-Consumption of Photovoltaic. 2016. Available online: https://ec.europa.eu/research/participants/documents/downloadPublic?documentIds=080166e5adb475db&appId=PPGMS (accessed on 21 January 2020).
- Polymeneas, E.; Tai, H.; Wagne, A. Less carbon means more flexibility: Recognizing the rise of new resources in the electricity mix. In Electric Pwer and Natural Gas; Mckinsey & Company: Hoboken, NJ, USA, 2018. [Google Scholar]
- OFGEM. Future Supply Market Arrangements-Response to Our Call for Evidence; Markets, Office of Gas and Electricity Markets: London, UK, 2018.
- FERC. FERC Approves First Compliance Filings on Landmark Storage Rule; Federal Energy Regulatory Commission (FERC): Washington, DC, USA, 2019.
- OFGEM. Targeted Charging Review: Decision and Impact Assessment; Office of Gas Electricity Markets, Ed.; Office of Gas Electricity Markets: London, UK, 2019.
Figure 1.
Outcomes of negotiations for the three different types of buyer agents implementing expert strategy against the seller, also implementing expert strategy; for the case of a cloudy day (a) and of a sunny day (b).
Figure 1.
Outcomes of negotiations for the three different types of buyer agents implementing expert strategy against the seller, also implementing expert strategy; for the case of a cloudy day (a) and of a sunny day (b).

Figure 2.
Outcomes of negotiations for the three different types of buyer agents implementing a ZI strategy against the seller, also implementing a ZI strategy, for the case of a cloudy day (a) and of a sunny day (b).
Figure 2.
Outcomes of negotiations for the three different types of buyer agents implementing a ZI strategy against the seller, also implementing a ZI strategy, for the case of a cloudy day (a) and of a sunny day (b).

Figure 3.
Automated negotiation possible outcomes space for seller and buyer 1 expert agents.

Figure 4.
Automated negotiation possible outcomes space for seller and buyer 2 expert agents.

Figure 5.
Automated negotiation possible outcomes space for seller and buyer 3 (Tier 1) expert agents.
Figure 5.
Automated negotiation possible outcomes space for seller and buyer 3 (Tier 1) expert agents.

Figure 6.
Comparison of different negotiation strategies for the seller and buyer.


Table 1.
The World Bank electricity end-user classification.
| Multi-Tier Matrix for Measuring Access to Household Electricity Supply | ||||||
|---|---|---|---|---|---|---|
| Consumption Description | Tier 1 | Tier 2 | Tier 3 | Tier 4 | Tier 5 | |
| Peak Capacity | Power capacity ratings (W) | Min 3 W | Min 50 W | Min 200 W | Min 800 W | Min 2 kW |
| Daily Energy consumption (Wh) | Min 12 Wh | Min 200 Wh | Min 1 kWh | Min 3.43 kWh | Min 8.2 kWh | |
| Or Services | Lighting of 1000 lumen-h/day | Electric lights, air circulation, TV, and phone charging are possible | ||||
| Duration | Hours per day | Min 4 h | Min 4 h | Min 8 h | Min 16 h | Min 23 h |
| Hours per evening | Min 1 h | Min 2 h | Min 3 h | Min 4 h | Min 4 h | |
Adapted from [53] (pp. 6).
Table 2.
CPU processing time and memory requirements for the simulations (in average).
| Computation of Utility Matrix | Negotiation | |
|---|---|---|
| CPU Time (s) | 4.1 | 0.7 |
| Memory (MB) | 18 | 12 |
© 2020 by the authors. Licensee MDPI, Basel, Switzerland. This article is an open access article distributed under the terms and conditions of the Creative Commons Attribution (CC BY) license (http://creativecommons.org/licenses/by/4.0/).
Share and Cite
MDPI and ACS Style
Etukudor, C.; Couraud, B.; Robu, V.; Früh, W.-G.; Flynn, D.; Okereke, C. Automated Negotiation for Peer-to-Peer Electricity Trading in Local Energy Markets. Energies 2020, 13, 920. https://doi.org/10.3390/en13040920
AMA Style
Etukudor C, Couraud B, Robu V, Früh W-G, Flynn D, Okereke C. Automated Negotiation for Peer-to-Peer Electricity Trading in Local Energy Markets. Energies. 2020; 13(4):920. https://doi.org/10.3390/en13040920
Chicago/Turabian StyleEtukudor, Christie, Benoit Couraud, Valentin Robu, Wolf-Gerrit Früh, David Flynn, and Chinonso Okereke. 2020. "Automated Negotiation for Peer-to-Peer Electricity Trading in Local Energy Markets" Energies 13, no. 4: 920. https://doi.org/10.3390/en13040920
Note that from the first issue of 2016, this journal uses article numbers instead of page numbers. See further details here.