Investigation of Dilution Effect on CH4/Air Premixed Turbulent Flame Using OH and CH2O Planar Laser-Induced Fluorescence


1
Key Laboratory for Technology in Rural Water Management of Zhejiang Province, Zhejiang University of Water Resources and Electric Power, Hangzhou 310018, China
2
The College of Electrical Engineering, Zhejiang University of Water Resources and Electric Power, Hangzhou 310018, China
3
Division of Combustion Physics, Lund University, P.O. Box 118, S-22100 Lund, Sweden
4
State Key Laboratory of Clean Energy Utilization, Zhejiang University, Hangzhou 310012, China
*
Author to whom correspondence should be addressed.
Energies 2020, 13(2), 325; https://doi.org/10.3390/en13020325
Submission received: 22 November 2019
/
Revised: 26 December 2019
/
Accepted: 7 January 2020
/
Published: 9 January 2020
(This article belongs to the Special Issue Engineering Fluid Dynamics 2019-2020)
Abstract
:Diluting the combustion mixtures is one of the advanced approaches to reduce the NOx emission of methane/air premixed turbulent flame, especially with high diluents to create a distributed reaction zone and mild combustion, which can lower the temperature of reaction zone and reduce the formation of NOx. The effect of N2/CO2 dilution on the combustion characteristics of methane/air premixed turbulent flame with different dilution ratio and different exit Reynolds number was conducted by OH-PLIF and CH2O-PLIF. Results show that the increase of dilution ratio can sharply reduce the concentration of OH and CH2O, and postpone the burning of fuel. Compared with the ultra-lean combustion, the dilution weakens the combustion more obviously. For different dilution gases, the concentration of OH in the combustion zone varies greatly, while the concentration of CH2O in the unburned zone is less affected by different dilution gas. The CO2 dilution has a more significant effect on OH concentration than N2 with the given dilution ratio, but a similar effect on the concentration of CH2O in the preheat zone of flame. However, dilution does not have much influence on the flame structure with the given turbulent intensity.
1. Introduction
Energy and environmental issues have become significant topics in recent decades. Many efforts have been done to reduce the emission of pollutions caused by the utilization of fossil fuel, such as NOx, SOx, and soot. In NOx reduction, one of those advanced approaches is diluting the combustion mixtures [1,2,3,4] especially with high temperature diluents to create a distributed reaction zone and mild combustion [2,5,6] which can lower the temperature of the reaction zone and reduce the formation of NOx. The dilution can be achieved with exhaust gas recirculation (EGR), steam, or low calorific value (LCV) fuels utilization, which normally contain a massive amount of incombustible gas, such as N2, CO2, and H2O. These gases make the chemical reaction rate drop significantly and combustion process out of the normal flame-let regime more easily [4,5,6,7,8,9,10,11]. Recently, many studies about the effect of dilution on the characteristics of combustion have been performed, such as turbulent burning velocity, flame stability, flame structure, and pollution emission [2,12,13,14,15,16].
Among these researches, laser diagnostic techniques were adopted widely, and much essential information of flames has been obtained, e.g., the structure of turbulent flames [1,2,3,17,18], OH radical laser measurement [19,20,21,22], and the intermediate product CH2O [20,23,24,25,26,27,28,29,30,31,32,33]. Dally et al. [34] and Medwell et al. [2] used planar laser induced fluorescence (PLIF) and Rayleigh scattering (RS) measured the flame structure of turbulent non-premixed jet flames. Kobayshi et al. [3] did some research on the methane/air flames with the dilution of 10% CO2 with OH-PLIF. Wang et al. [35] calculated the local radius of curvature, fractal inner cutoff scale, and local flame angle using OH-PLIF images of methane/air flames with 10% CO2/H2O dilution. In addition, Han et al. [11] did some work of the dilution effect of N2 and CO2 on the flames in a swirl-stabilized combustor.
The dilution ratio of the above-mentioned studies was all less than 20%, and the concentration of OH was studied without the important intermediate product CH2O. Therefore, in the current work, in order to get some knowledge of the effect of high dilution ratio on the premixed turbulent flames, dilution ratio was raised up to 50% to gain a high Kariovitaz number (Ka) with high Reynolds number. Ka number is the ratio of the rotational time of the turbulent minimum vortex (Komogorov vortex) to the chemical reaction time of the flame. The greater the Ka, the faster the turbulent mixing rate compared to the chemical reaction rate of the flame. The flame with a high rate of dilution was also compared with the flame with extreme low equivalence ratio (φ = 0.4), which can obtain some fundamental understanding about the interaction between turbulent transfer and chemical reaction in distributed reaction regimes including mild combustion [1,5,6]. In addition, the spatial distribution of OH and CH2O of several jet flames were imaged by PLIF to have a look at the detail structure of the reaction zone from the downstream position 5d (d: Diameter of jet tube) to 37d. OH results were mainly used for the flame front structure obtaining and thought as the temperature indicator, and CH2O results were employed as the marker of the low temperature zone of flames [2].
2. Experiment Setup
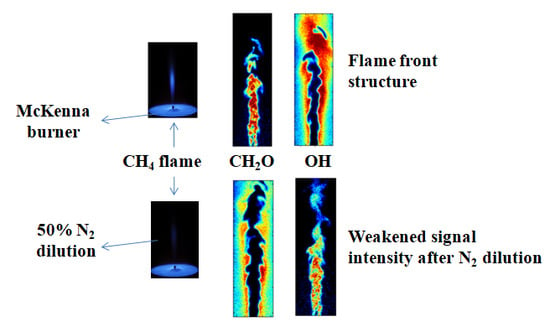
The experiment setup employed in the present work is mainly comprised of a burner and a laser diagnostic system, as shown in Figure 1. A water cooled McKenna burner with a centre jet tube was utilized. The jet tube was 1 mm in diameter and its exit were 4 mm above the surface of the McKenna burner. With this tube, the jet flame of the mixture presented in Table 1 was generated. It was surrounded by a co-flow comprised of hot flue gas which was generated from a laminar premixed flame of methane/air (φ = 0.9) locating about 2 mm below the jet tube exit. The gas supply was controlled by several mass flow controllers (Alicat) to obtain designed mixtures with the given Reynolds number. Air was emulated with 21% O2 and 79% N2 and Ddiluent(dilution ratio) was given by,
where is the volume of diluent (N2 or CO2) and is the total volume of the gas mixture.
The PLIF system was adopted for OH and CH2O measurement. A frequency-double Quanta-Ray Nd:YAG laser (PRO-250-10H, Spectra physics, Santa Clara, CA, USA) was used to pump a dye laser (ND6000, Continuum, Boston, MA, USA) to generate 283.049 nm UV laser(with pulse energy of 15 mJ) with a frequency doubler. This UV laser was made to a vertical laser sheet with a length of 32 mm passing through the center of flame vertically to excite Q1 (8) line of OH with the transition of . The corresponding fluorescence was captured by an intensified charge coupled device (ICCD) camera (PI MAX 3, Princeton Instruments, Trenton, NJ, USA) with a 1024 × 1024 pixel array. A UV lens (105 mm focal length, Nikon, Tokyo, Japan) and two combined Schott filters (WG305 and UG11) were used to obtain the signal around 308 nm. For the measurement of CH2O in the flame, the frequency-triple Quanta-Ray Nd:YAG laser was used to generate a 355 nm laser with pulse energy around 150 mJ, which was also formed to a 32 mm high vertical laser sheet passing through the flame. Its fluorescence was collected by an ICCD camera and a Nikon objective (f/4.5, 50 mm) through a Schott long-pass filter (GG395).
3. Results and Discussions
3.1. Emission Spectra Analysis
The photographs and emission spectra of the flames under different conditions were shown in Figure 2. Compared with Flame 2 (φ = 0.9, Ddiluent = 0), there is almost no visible light in Flame 1 (φ = 0.4, Ddiluent = 0) due to the property of flameless combustion [1]. The flames with large amount of dilution, such as Flame 4 (φ = 0.9, N2Ddiluent = 50%) and Flame 5 (φ = 0.9, CO2Ddiluent = 0), also had much less visible light, showing very close to the characteristic of Flame 1.
The emission spectra of these flames from 260 to 540 nm were captured by a spectrometer (Ocean optics 2000) focusing on the downstream position 10d with a spherical lens. As shown in Figure 2, it mainly contains the radiation from OH radical (310 nm) and CH radical (431 nm). Flame 1 and Flame 5 only have some light emission of OH radical, which is consistent with the observation by Duwig [1]. Comparing the flames with different dilution ratios, significant difference in the strength of emission spectra was observed. With a large amount of dilution, both the signals from OH and CH were dropped significantly. The OH signal of Flames 4 and 5 have the similar strength to Flame 1, but their CH signal still exists. From Table 1, it can be seen that their content of CH4 is very close to that of Flame 1, but theirO2 fraction is much lower, which affects the chemical path in the reaction and makes diluted combustion different from ultra lean combustion.
3.2. Image Process
Figure 3a presented a typical OH-PLIF (Planar Laser Induced Fluorescence) instantaneous image of Flame 4. Those instantaneous images show the structures of turbulent flames. The color bar represents the signal intensity of radical, the bigger the color number, the stronger the signal intensity. According to the intensity of OH fluorescence signal, the wrinkled flame interface can be well recognized, which were processed with the adaptive threshold method: First, background signal was subtracted and the effect of uneven distribution of laser energy was removed from the original image using MATLAB. Second, the spot was assigned to 1 when the intensity of the OH fluorescence signal was more than 0, or the spot was assigned to 0. Therefore, a black and white picture can be obtained and the burned region was white while the unburned region was black. Consequently, the flame front contours were obtained by extracting the boundary of black and white, as shown in Figure 3b. In the present experiment, 500 transient images were collected for each case. The overlaying value of 500 single shots was presented in Figure 3c which can be used in statistical analysis with averaging and root mean square (RMS) values to analyze the flame front distribution.
Additionally, the wrinkle ratio (W) of these flames was also calculated out with those flame front boundaries. Wrinkle ratio is a significant parameter to demonstrate the scale of turbulent flame front fractality. The bigger the wrinkle ratio, the stronger the turbulent intensity, the more flame front fractality. The calculated method was given by,
in the formula, h is the given flame height at vertical distance, which is determined as 1 mm in the current experiment. L is the flame front length within a given flame height of h at a given downstream position. The distance between two neighbouring pixels with corner connection was counted as times of that of the pixels with side connection, as shown in Figure 3b.
3.3. Analysis of PLIF Images
Figure 4 presents the typical instantaneous PLIF images of CH2O (a) and OH (b) in Flame 1–4, Flame 2–4 were used as a dilution effect analysis and Flame 1 was adopted as a comparison case. Reynolds number (Re) was kept around 6000 based on exit velocity, tube diameter, and the viscosity of corresponding gas mixture.
From these figures, it is clear that the CH2O layers are surrounded by OH layers. CH2O was generated in the middle of the flame during the preheating stage which was earlier than OH. In the flame front zone, OH was generated and the distribution of OH shows the conjunction between burnt and unburned regions, thought as an indicator of flame region [36]. In all cases, OH signal shows relatively stronger as close to the flame front, especially in wrinkle pockets and flame tip zone. The unburned region and the thickness of OH layer expanded from the flame bottom to the tip. The parts of flames below ~10dareshown to be smooth and above ~10dthey are wrinkled to form many eddies due to turbulent effect. When the flame was diluted, the strength of OH signal dropped and unburned zone expanded significantly. The similar effect was observed in ultra lean flame, Flame 1. In addition, CH2O layers became more thickened from the tube exit and started to merge together at the downstream position around 10d. At the tip of the flames, CH2O started to be consumed out. The strength of CH2O signal was also weakened notably by dilution.
The averaging and RMS results of these flames were obtained with 500 single shots of instantaneous OH ad CH2O images to the statistical analysis, which can be used to analyze the flame front distribution. Root mean square (RMS) values can be used to indicate the degree of dispersion of the measurement sample, in this case it refers to the OH and CH2O radical signal, which was real-time and online measured. Therefore, the root mean square (RMS) values indicated the position of the flame front with maximum possibility. The radial distribution at the downstream position of 18d is presented in Figure 5. At this axial position, CH2O already merged together making the peak of the mean value appear in the central position and the peak of RMS value show at the side of flames corresponding to the CH2O consuming zone, since at this region, the distribution of CH2O concentration changes a lot with time due to strong fluctuation by turbulence. The peak of mean value of OH locates around the radial distance of 2d, where there is almost no CH2O left. The peak of RMS value of OH is around 1d, close to that of CH2O, where OH was mainly generated.
The mean and RMS value of CH2O and OH decline with dilution and the peak of OH shifts about 0.5d to the burnt region side, which indicates the expanding of the unburned region. The distribution curve of CH2O of Flame 1 almost overlaps that of Flame 3, even though their composition is notably different as shown in Table 1. For these two flames, the OH distribution curve also overlaps each other in the flame center. However, Flame 3 has a bigger peak value of OH than Flame 1 caused by its higher methane fraction and larger calorific value inducing higher flame temperature. With the same reason, the peak value of OH of Flames 1 and 4 are very close to each other. However, comparing to Flame 1, the combustion of Flame 4 delayed significantly according to the distribution of OH. The main difference is oxygen fraction in premix. It is found that, even though all the flames are under-lean condition and the oxygen in the premixed mixture are abundant for fixed methane fraction, oxygen fraction still has some influence on the combustion. The main effect happened in the preheat reaction zone, making the reaction stronger and more CH2O to be generated with the same fraction of methane. Since that, the combustion occurs earlier as observed above. However, it has almost no effect on the burnt region, because the content of methane dominants the calorific value of the mixture and affects the heat release and the temperature of flames. It is worth paying attention to the averaged and RMS value of OH that may be affected by the OH signal of co-flow comprised of hot flue gas, which was generated from a laminar premixed flame of methane/air (φ = 0.9) located about 2 mm below the jet tube exit.
Figure 6 shows the statistics characteristic of the flame front of Flame 1 to 4. The results were obtained from those OH-PLIF instantaneous images with the process shown in Figure 3. In Figure 6a, the plotted flame front distribution value was obtained at downstream position 18d. The front distribution value represents the OH radical signal intensity of the flame front statistics images, and the unit “a.u.” is the unit of signal intensity. Figure 6(b1) shows the maximum value of the front distribution at different given vertical position. It indicated the position of flame front with the maximum possibility. As the premix was diluted, the flame expanded and the combustion delayed obviously. Hence, the mean volume of the flame region increased and the mean fuel consumption rate decreased with less methane fraction in mixtures as concluded by [3]. The flame front of Flame 1 was much closer to the jet center than that of Flames 3 and 4, even though Flame 1 has same CH2O signal as Flame 3 and the same peak of OH signal as Flame 4. In Figure 6(b2) the wrinkle ratio was obtained along the axial direction, which was used to characterize the front fractality structure of turbulent flame. The change in the wrinkle ratio is small until the tip of the flame. The big drop around the tip was caused by the flame merging and reaction intensity decline. With dilution, the wrinkle ratio has a slight drop in the part lower than 22d.
Typical instantaneous images of (a) CH2O-PLIFand (b) OH-PLIF of the flames with 50% N2 or 50% CO2 dilution are shown in Figure 7. Figure 7(a1,a3,b1,b3) show the flames (Flames 6 and 4) diluted by N2 and the other figures show the flames (Flames 7 and 5) diluted by CO2. Additionally, different Reynolds number (3000 and 6000) was adopted for the turbulent effect study.
Comparing with the flames diluted by N2, the ones diluted by CO2 have an OH signal with much less strength. As turbulent intensity enhanced at higher Reynolds number, the flame front was more folded. At the Reynolds number of 6000, the structure is very similar for N2 and CO2 cases. When the Reynolds number was changed to 3000, there is no big change in CO2 dilution flames. However, the folded structure in the N2 dilution flames almost disappeared. This phenomenon can also be observed based on the structure of CH2O distributions. The reason was thought to be the drop of the chemical reaction rate and fuel consumption rate caused by CO2 addition, similar to the CO2 effect on the laminar burning velocity [37,38].
Figure 8 presents the distribution of the mean and RMS values of OH and CH2O along the radial direction at the downstream position of 18d of the flames with different dilution and Reynolds number. The structure of Flame 6 (DN2 = 50%, Re = 3000) is significantly different from other flames, as described above with instantaneous images, which was kept in laminar flame style and its distribution of OH and CH2O is much close to those as one dimension laminar flames [37,38]. For the flames with different Reynolds number, the mean value of their signal can be increased due to turbulent intensity enhancement, and can also be weakened due to their reaction zone expanding. The RMS value was enhanced significantly with Reynolds number indicating stronger fluctuation of flames. The strength and the thickness of CH2O increased at higher Reynolds number due to the enhancement of mixing between burnt and unburned gas which benefited the reaction in the preheat zone. Comparing the flames with different dilution content at Reynolds number of 3000, the RMS value of CH2O and OH of Flame 7 (DCO2 = 50%, Re = 3000) is much larger than Flame 6 due to the folded flame front of Flame 7 as observed above. The mean value of CH2O in Flame 7 is larger than that of Flame 6, but that of OH is smaller. The wrinkled front enhanced the preheat reaction, but the larger heat capacity of CO2 makes the flame temperature lower and the reaction rate slower, which is consistent with the result of Roy [39]. At the Reynolds number of 6000, there is no difference in the mean value of CH2O between Flames 4 and 5, but the OH value was weakened and the combustion was delayed in Flame 5, indicating less heat release and weakened reaction in flame zone.
In Figure 9a, the distribution of the flame front of Flames 4, 5, and 7 overlapped except Flame 6 having a peak at the position of 1d. Combined with Figure 9b, Flame 6 had less front fluctuation as mentioned before. It indicated that the dilution difference has almost no influence on the front fluctuation under turbulent condition. When the downstream position was above 20d, the flame expanded significantly with CO2 dilution as shown in Figure 9(b1) and the wrinkle ratio dropped in the entire flame shown in Figure 9(b2), which indicates that the combustion was delayed and flame front structure was smoothed as dilution changed from N2 to CO2.
4. Conclusions
In current work, the effect of N2/CO2 dilution on the combustion characteristics of methane/air premixed turbulent jet flame with different dilution ratio and different exit Reynolds number were conducted using a water cooled McKenna burner with a centre jet tube. In order to obtain the knowledge about the effect of high dilution on the premixed turbulent flame, 50% dilution gas was used in the experiment. The distribution of free radical OH and combustion intermediate product CH2O in several turbulent jet flames were measured by OH-PLIF and CH2O-PLIF. The OH results were mainly used to obtain the structure of flame front and the distribution of CH2O was mainly used to study the low temperature zone of flames. Results show that the increasing of dilution ratio can sharply reduce the concentration of OH and CH2O, and postpone the burning of fuel. Compared with the ultra-lean combustion, the dilution weakens the combustion more obviously. For different dilution gases, the concentration of OH in the combustion zone varies greatly, while the concentration of CH2O in the unburned zone is less affected by different dilution gas. The CO2 dilution has a more significant effect on OH concentration than N2 with the given dilution ratio, but a similar effect on the concentration of CH2O in the preheat zone of the flame. However, dilution does not have much influence on the flame structure with the given turbulent intensity.
Author Contributions
Data curation, W.W.; Funding acquisition, Y.Z.; Methodology, Y.H.; Project administration, Y.Z.; Supervision, Z.W. and Z.L.; Writing-original draft, W.W.; Writing-review and editing, L.Y. and Y.H. All authors have read and agreed to the published version of the manuscript.
Funding
This research was funded by the National Natural Science Foundation of China [51621005] and the Program of Introducing Talents of Discipline to Universities [B08026], and the APC was funded by Key Laboratory for Technology in Rural Water Management of Zhejiang Province, Zhejiang University of Water Resources and Electric Power.
Acknowledgments
The authors would like to thank editor and the reviewers who provided many valuable comments to improve the paper. Li Yang would also like to thank the help of Wubin Weng and the supervisor of Zhihua Wang.
Conflicts of Interest
The authors declare no conflict of interest.
References
- Duwig, C.; Li, B.; Li, Z.S.; Aldén, M. High resolution imaging of flameless and distributed turbulent combustion. Combust. Flame 2012, 159, 306–316. [Google Scholar] [CrossRef]
- Medwell, P.R.; Kalt, P.A.; Dally, B.B. Simultaneous imaging of OH, formaldehyde, and temperature of turbulent nonpremixed jet flames in a heated and diluted coflow. Combust. Flame 2007, 148, 48–61. [Google Scholar] [CrossRef]
- Kobayashi, H.; Hagiwara, H.; Kaneko, H.; Ogami, Y. Effects of CO2 dilution on turbulent premixed flames at high pressure and high temperature. Proc. Combust. Inst. 2007, 31, 1451–1458. [Google Scholar] [CrossRef]
- Yoo, H.; Park, B.Y.; Cho, H.; Park, J. Performance Optimization of a Diesel Engine with a Two-Stage Turbocharging System and Dual-Loop EGR Using Multi-Objective Pareto Optimization Based on Diesel Cycle Simulation. Energies 2019, 12, 4223. [Google Scholar] [CrossRef] [Green Version]
- Pramanik, S.; Ravikrishna, R.V. Effect of N2 dilution and preheat temperature on combustion dynamics of syngas in a reverse-flow combustor. Exp. Therm. Fluid Sci. 2020, 110, 109926. [Google Scholar] [CrossRef]
- Karimi, H.; Mardani, A. Investigation of fuel dilution in ethanol spray MILD combustion. Appl. Therm. Eng. 2019, 159, 113898. [Google Scholar]
- Yang, Z.; Yu, X.; Peng, J.; Wang, L.; Dong, Z.; Li, X.; Sun, S.; Meng, S.; Xu, H. Effects of N2, CO2 and H2O dilutions on temperature and concentration fields of OH in methane Bunsen flames by using PLIF thermometry and bi-directional PLIF. Exp. Therm. Fluid Sci. 2017, 81, 209–222. [Google Scholar] [CrossRef]
- Abbasi-Atibeh, E.; Bergthorson, J.M. The effects of differential diffusion in counter-flow premixed flames with dilution and hydrogen enrichment. Combust. Flame 2019, 209, 337–352. [Google Scholar] [CrossRef]
- Wang, D.; Ji, C.; Wang, S.; Meng, H.; Yang, J. Chemical effects of CO2 dilution on CH4 and H2spherical flame. Energy 2019, 185, 316–326. [Google Scholar] [CrossRef]
- Song, Z.; Zhang, X.; Hou, X.; Hu, S. Relationship of the combustion characteristics of natural gas-hydrogen/carbon dioxide mixtures with the ion current and pressure parameters. J. Energy Inst. 2019, 92, 1014–1022. [Google Scholar] [CrossRef]
- Han, Y.; Cai, G.; Wang, H.; Bruno, R.; Abdelkrim, B. Flow characterization and dilution effects of N2 and CO2 on premixed CH4/air flames in a swirl-stabilized combustor. Chin. Phys. B 2014, 3, 386–399. [Google Scholar]
- Lee, M.C.; Seo, S.B.; Yoon, J.; Kim, M.; Yoon, Y. Experimental study on the effect of N2, CO2, and steam dilution on the combustion performance of H2 and CO synthetic gas in an industrial gas turbine. Fuel 2012, 102, 431–438. [Google Scholar] [CrossRef]
- Jourdaine, P.; Mirat, C.; Caudal, J.; Lo, A.; Schuller, T. A comparison between the stabilization of premixed swirling CO2-diluted methane oxy-flames and methane/air flames. Fuel 2016, 201, 431–438. [Google Scholar]
- Xie, Y.; Wang, X.; Wang, J.; Huang, Z. Explosion behavior predictions of syngas/air mixtures with dilutions at elevated pressures: Explosion and intrinsic flame instability parameters. Fuel 2019, 255, 115724. [Google Scholar] [CrossRef]
- Sahu, A.; Wang, C.; Jiang, C.; Xu, H.; Ma, X.; Xu, C.; Bao, X. Effect of CO2 and N2 dilution on laminar premixed MTHF/air flames: Experiments and kinetic studies. Fuel 2019, 255, 115659. [Google Scholar] [CrossRef]
- Zheng, J.; Zhang, Z.; Huang, Z.; Hu, E.; Tang, C.; Wang, J. Numerical study on combustion of diluted methanol-air premixed mixtures. Chin. Sci. Bull. 2010, 55, 882–889. [Google Scholar] [CrossRef]
- Wang, Z.H.; Li, B.; Ehn, A.; Sun, Z.W.; Li, Z.S.; Bood, J.; Aldén, M.; Cen, K.F. Investigation of flue-gas treatment with O3 injection using NO and NO2 planar laser-induced fluorescence. Fuel 2010, 89, 2346–2352. [Google Scholar] [CrossRef]
- Luque, J.; Jeffries, J.B.; Smith, G.P.; Crosley, D.R. Quasi-simultaneous detection of CH2O and CH by cavity ring-down absorption and laser-induced fluorescence in a methane/air low-pressure flame. Appl. Phys. B 2001, 73, 731–738. [Google Scholar] [CrossRef]
- Elbaz, A.M.; Roberts, W.L. Experimental study of the inverse diffusion flame using high repetition rate OH/acetone PLIF and PIV. Fuel 2016, 165, 447–461. [Google Scholar] [CrossRef] [Green Version]
- Johchi, A.; Naka, Y.; Shimura, M.; Tanahashi, M.; Miyauchi, T. Investigation on rapid consumption of fine scale unburned mixture islands in turbulent flame via 10 kHz simultaneous CH-OH PLIF and SPIV. Proc. Combust. Inst. 2015, 3, 3663–3671. [Google Scholar] [CrossRef]
- Coriton, B.; Steinberg, A.M.; Frank, J.H. High-speed tomographic PIV and OH PLIF measurements in turbulent reactive flows. Exp. Fluids 2014, 55, 1743. [Google Scholar] [CrossRef]
- Wellander, R.; Richter, M.; Aldén, M. Time-resolved (kHz) 3D imaging of OH PLIF in a flame. Exp. Fluids 2014, 55, 1764. [Google Scholar] [CrossRef]
- Li, H.; Li, B.; Gao, Q.; Zhang, D.; Li, X.; Li, Z. Plane laser-Induced fluorescence for flame surface density calculation of OH/CH2O:A comparative study. J. Combust. Sci. Technol. 2018, 24, 523–527. [Google Scholar]
- Zhu, J.; Zhao, G.; Long, T.; Sun, M.; Li, Q.; Liang, J. Simutaneous OH and CH2O PLIF imaging of flame structures. J. Exp. Fluid Mech. 2016, 30, 55–60. [Google Scholar]
- Yan, H.; Zhang, S.; Xu, X.; Li, F.; Lin, X. Flame structure and dynamics characters investigation by OH and CH2O planar laser-induced fluorescence in the swirl combustor. J. Aerosp. Power 2019, 34, 894–907. [Google Scholar]
- Li, X.; Li, H.; He, K.; Lin, H.; Cheng, L. Analysis of characteristic spectrum of CN/CH/CHO/CH2O/NCN in induction period of methane explosion. J. Chin. Coal Soc. 2014, 39, 2042–2046. [Google Scholar]
- Wang, Z.; Stamatoglou, P.; Zhou, B.; Aldén, M.; Bai, X.S.; Richter, M. Mattias Richtera Investigation of OH and CH2O distributions at ultra-high repetition rates by planar laser induced fluorescence imaging in highly turbulent jet flames. Fuel 2018, 234, 1528–1540. [Google Scholar] [CrossRef]
- Alzueta, M.U.; Glarborg, P. Formation and destruction of CH2O in the exhaust system of a gas engine. Environ. Sci. Technol. 2003, 37, 4512–4516. [Google Scholar] [CrossRef] [PubMed]
- Wang, S.; Davidson, D.F.; Hanson, R.K. High-temperature laser absorption diagnostics for CH2O and CH3CHO and their application to shock tube kinetic studies. Combust. Flame 2013, 160, 1930–1938. [Google Scholar] [CrossRef]
- Schroeder, J.R.; Crawford, J.H.; Fried, A.; Walega, J.; Weinheimer, A.; Wisthaler, A.; Müller, M.; Mikoviny, T.; Chen, G.; Shook, M.; et al. New insights into the column CH2O/NO2 ratio as an indicator of near-surface ozone sensitivity. J. Geophys. Res. Atmos. 2017, 122, 8885–8907. [Google Scholar] [CrossRef] [Green Version]
- Osborne, J.R.; Ramji, S.A.; Carter, C.D.; Peltier, S.; Hammack, S.; Lee, T.; Steinberg, A.M. Simultaneous 10 kHz TPIV, OH PLIF, and CH2O PLIF measurements of turbulent flame structure and dynamics. Exp. Fluids 2016, 57, 65. [Google Scholar] [CrossRef]
- Hammack, S.D.; Carter, C.D.; Skiba, A.W.; Fugger, C.A.; Felver, J.J.; Miller, J.D.; Gord, J.R.; Lee, T. 20kHz CH2O and OH PLIF with stereo PIV. Opt. Lett. 2018, 5, 1115–1118. [Google Scholar] [CrossRef] [PubMed]
- Ma, X.; Wang, Z.; Jiang, C.; Jiang, Y.; Xu, H.; Wang, J. An optical study of in-cylinder CH2O and OH chemiluminescence in flame-induced reaction front propagation using high speed imaging. Fuel 2014, 134, 603–610. [Google Scholar] [CrossRef]
- Dally, B.B.; Karpetis, A.N.; Barlow, R.S. Structure of turbulent non-premixed jet flames in a diluted hot coflow. Proc. Combust. Inst. 2002, 29, 1147–1154. [Google Scholar] [CrossRef]
- Wang, J.; Matsuno, F.; Okuyama, M.; Ogami, Y.; Kobayashi, H.; Huang, Z. Flame front characteristics of turbulent premixed flames diluted with CO2 and H2O at high pressure and high temperature. Proc. Combust. Inst. 2013, 34, 1429–1436. [Google Scholar] [CrossRef]
- Yang, L.; Wang, Z.; Zhu, Y.; Li, Z.; Zhou, J.; Huang, Z.; Cen, K. Premixed jet flame characteristics of syngas using OH planar laser induced fluorescence. Chin. Sci. Bull. 2011, 56, 2862–2868. [Google Scholar] [CrossRef] [Green Version]
- Weng, W.B.; Wang, Z.H.; He, Y.; Whiddon, R.; Zhou, Y.J.; Li, Z.S.; Cen, K.F. Effect of N2/CO2 dilution on laminar burning velocity of H2-CO-O2 oxy-fuel premixed flame. Int. J. Hydrog. Energy 2015, 40, 1203–1211. [Google Scholar] [CrossRef]
- Wang, Z.H.; Weng, W.B.; He, Y.; Li, Z.S.; Cen, K.F. Effect of H2/CO ratio and N2/CO2 dilution rate on laminar burning velocity of syngas investigated by direct measurement and simulation. Fuel 2015, 141, 285–292. [Google Scholar] [CrossRef]
- Roy, R.; Gupta, A.K. Flame structure and emission signature in distributed combustion. Fuel 2020, 262, 116460. [Google Scholar] [CrossRef]
Figure 1.
Schematic of experiment setup.

Figure 2.
Photos and emission spectra of flames.

Figure 3.
(a) Instantaneous image of OH-PLIF; (b) flame front of the instantaneous image; (c) overlaying of 500 flame front boundaries.
Figure 3.
(a) Instantaneous image of OH-PLIF; (b) flame front of the instantaneous image; (c) overlaying of 500 flame front boundaries.

Figure 4.
(a) CH2O-PLIF instantaneous images and (b) OH-PLIF instantaneous images of (1) Flame 1; (2) Flame 2; (3) Flame 3; (4) Flame 4.
Figure 4.
(a) CH2O-PLIF instantaneous images and (b) OH-PLIF instantaneous images of (1) Flame 1; (2) Flame 2; (3) Flame 3; (4) Flame 4.

Figure 5.
The averaged and root mean square (RMS) value of (a) CH2O and (b) OH at the downstream position of 18d.
Figure 5.
The averaged and root mean square (RMS) value of (a) CH2O and (b) OH at the downstream position of 18d.

Figure 6.
(a) Flame front distribution, (b1) flame front position and (b2) wrinkle ratio of Flame 1, Flame 2, Flame 3, and Flame 4.
Figure 6.
(a) Flame front distribution, (b1) flame front position and (b2) wrinkle ratio of Flame 1, Flame 2, Flame 3, and Flame 4.

Figure 7.
(a) CH2O-PLIF instantaneous images and (b) OH-PLIF instantaneous images of (1) Flame 6; (2) Flame 7; (3) Flame 4; (4) Flame 5.
Figure 7.
(a) CH2O-PLIF instantaneous images and (b) OH-PLIF instantaneous images of (1) Flame 6; (2) Flame 7; (3) Flame 4; (4) Flame 5.

Figure 8.
(a) Mean and RMS value of CH2O and (b) Mean and RMS value of OH at downstream position of 18d.
Figure 8.
(a) Mean and RMS value of CH2O and (b) Mean and RMS value of OH at downstream position of 18d.

Figure 9.
(a) Flame front distribution, (b1) flame front position (b2) wrinkle ratio of Flame 4, Flame 5, Flame 6, and Flame 7.
Figure 9.
(a) Flame front distribution, (b1) flame front position (b2) wrinkle ratio of Flame 4, Flame 5, Flame 6, and Flame 7.


Table 1.
Flame operation conditions.
| Experiment Cases | Premixed Mixture Composition | Reynolds Number (Re) | |||
|---|---|---|---|---|---|
| CH4% | Air% | N2% | CO2% | ||
| Flame 1 (φ = 0.4/DN2 = 0%) | 4.0 | 96.0 | 0 | 0 | 6000 |
| Flame 2 (φ = 0.9/DN2 = 0%) | 8.6 | 91.4 | 0 | 0 | 6000 |
| Flame 3 (φ = 0.9/DN2 = 30%) | 6.0 | 64.0 | 30.0 | 0 | 6000 |
| Flame 4 (φ = 0.9/DN2 = 50%) | 4.3 | 45.7 | 50.0 | 0 | 6000 |
| Flame 5 (φ = 0.9/DCO2 = 50%) | 4.3 | 45.7 | 0 | 50 | 6000 |
| Flame 6 (φ = 0.9/DN2 = 50%) | 4.3 | 45.7 | 50.0 | 0 | 3000 |
| Flame 7 (φ = 0.9/DCO2 = 50%) | 4.3 | 45.7 | 0 | 50 | 3000 |
© 2020 by the authors. Licensee MDPI, Basel, Switzerland. This article is an open access article distributed under the terms and conditions of the Creative Commons Attribution (CC BY) license (http://creativecommons.org/licenses/by/4.0/).
Share and Cite
MDPI and ACS Style
Yang, L.; Weng, W.; Zhu, Y.; He, Y.; Wang, Z.; Li, Z. Investigation of Dilution Effect on CH4/Air Premixed Turbulent Flame Using OH and CH2O Planar Laser-Induced Fluorescence. Energies 2020, 13, 325. https://doi.org/10.3390/en13020325
AMA Style
Yang L, Weng W, Zhu Y, He Y, Wang Z, Li Z. Investigation of Dilution Effect on CH4/Air Premixed Turbulent Flame Using OH and CH2O Planar Laser-Induced Fluorescence. Energies. 2020; 13(2):325. https://doi.org/10.3390/en13020325
Chicago/Turabian StyleYang, Li, Wubin Weng, Yanqun Zhu, Yong He, Zhihua Wang, and Zhongshan Li. 2020. "Investigation of Dilution Effect on CH4/Air Premixed Turbulent Flame Using OH and CH2O Planar Laser-Induced Fluorescence" Energies 13, no. 2: 325. https://doi.org/10.3390/en13020325
Note that from the first issue of 2016, this journal uses article numbers instead of page numbers. See further details here.